
GRB 181110A: Constraining the Jet Structure, Circumburst Medium and the Initial Lorentz Factor
by
 , ,
, ,
Song Han
1,2 ,
,
Xinyu Li
1,2, 
Luyao Jiang
1,2,
Zhiping Jin
1,2,
Haoning He
1,2,
Yuanzhu Wang
1,2 and
Daming Wei
1,2,* 1
Key Laboratory of Dark Matter and Space Astronomy, Purple Mountain Observatory, Chinese Academy of Sciences, Nanjing 210033, China
2
School of Astronomy and Space Science, University of Science and Technology of China, Hefei 230026, China
*
Author to whom correspondence should be addressed.
Universe 2022, 8(4), 248; https://0-doi-org.brum.beds.ac.uk/10.3390/universe8040248
Submission received: 8 April 2022
/
Revised: 15 April 2022
/
Accepted: 15 April 2022
/
Published: 18 April 2022
(This article belongs to the Special Issue Advances in Astrophysics and Cosmology – in Memory of Prof. Tan Lu)
Abstract
:The afterglow data of gamma ray bursts (GRBs) can be used to constrain the physical properties of the fireball (e.g., the jet structure and opening angle) and the circumburst medium. With the peak time of the early afterglow light curve being taken as the deceleration time, one can estimate the initial Lorentz factor of the fireball. In this work, we perform a comprehensive analysis on the prompt emission and the afterglow data of GRB 181110A, where a clear peak is detected by Swift UVOT and XRT in optical to X-ray bands. Prompt emission spectral analysis shows that the spectrum of GRB 181110A is soft, and both hard-to-soft and intensity-tracking spectral evolution are found. By fitting the afterglow light curve and building spectral energy distribution, we find that the standard external forward shock model with a constant circumburst medium is favored, and the jet structure of GRB 181110A tends to be uniform rather than structured. With the peak time of early afterglow emission, we estimate the initial fireball Lorentz factor of GRB 181110A to be . We also compare GRB 181110A with other typical long GRBs in a statistical context.
1. Introduction
The fireball model [1,2,3,4,5] has long been accepted to interpret the GRB physical process. The fireball is required to move with a relativistic speed towards us to avoid the “compactness problem” [6]. The dynamical evolution of a fireball includes three phases: acceleration, coasting, and deceleration. During the acceleration phase, the Lorentz factor increases linearly with the radius r and becomes a constant after most thermal energy has been converted to kinetic [7]. After the fireball reaches the maximum Lorentz factor, it enters the “coasting” phase and moves with a constant Lorentz factor until it collects a considerable mass of ambient medium at the deceleration radius , after which the Lorentz factor decays significantly. The maximum Lorentz factor during the “coasting” phase is also the initial Lorentz factor () of the ejecta during the deceleration phase. Panaitescu and Kumar [8] and Molinari et al. [9] have shown that , where is the Lorentz factor at .
is a crucial parameter to constrain burst models [10]; however, this parameter is difficult to measure directly, unlike some other parameters, such as the isotropic energy and the isotropic luminosity . Several methods are proposed to infer , among which the most commonly invoked one is the afterglow onset method. The idea is that the peak time of the early afterglow light curve is taken as the time when the deceleration phase begins (). Given that for a constant density (ISM) medium is most sensitive to but only weakly depends on other parameters, is possible to estimate by measuring and [9,10,11,12].
Before the Swift era, afterglow observations mostly started several hours after the burst trigger and the early optical afterglows were rarely detected. The launch of Swift has changed the situation. With the prompt slewing capability of the X-ray telescope (XRT [13]) and a UV-optical telescope (UVOT [14]), it enabled direct observations of the very early afterglow phase of GRBs and gained abundant early afterglow data.
In this paper, we analyze the prompt and afterglow emission of GRB 181110A, a long burst whose afterglow light curve shows a multi-band early peak.
We perform the spectral fitting for the prompt emission and calculate the peak energy and . We present the optical to X-ray light curves observed by Swift and our fitting results. We use the temporal and spectral properties of the afterglow to infer the jet structure, the circumburst medium profile, and the initial Lorentz factor of GRB 181110A.
We will follow the convention to describe the temporal and spectral evolution of the afterglow. The concordance cosmology adopted has parameters of , and [15]. Uncertainties are given at 68% () confidence level for one parameter unless stated otherwise.
2. Observations and Data
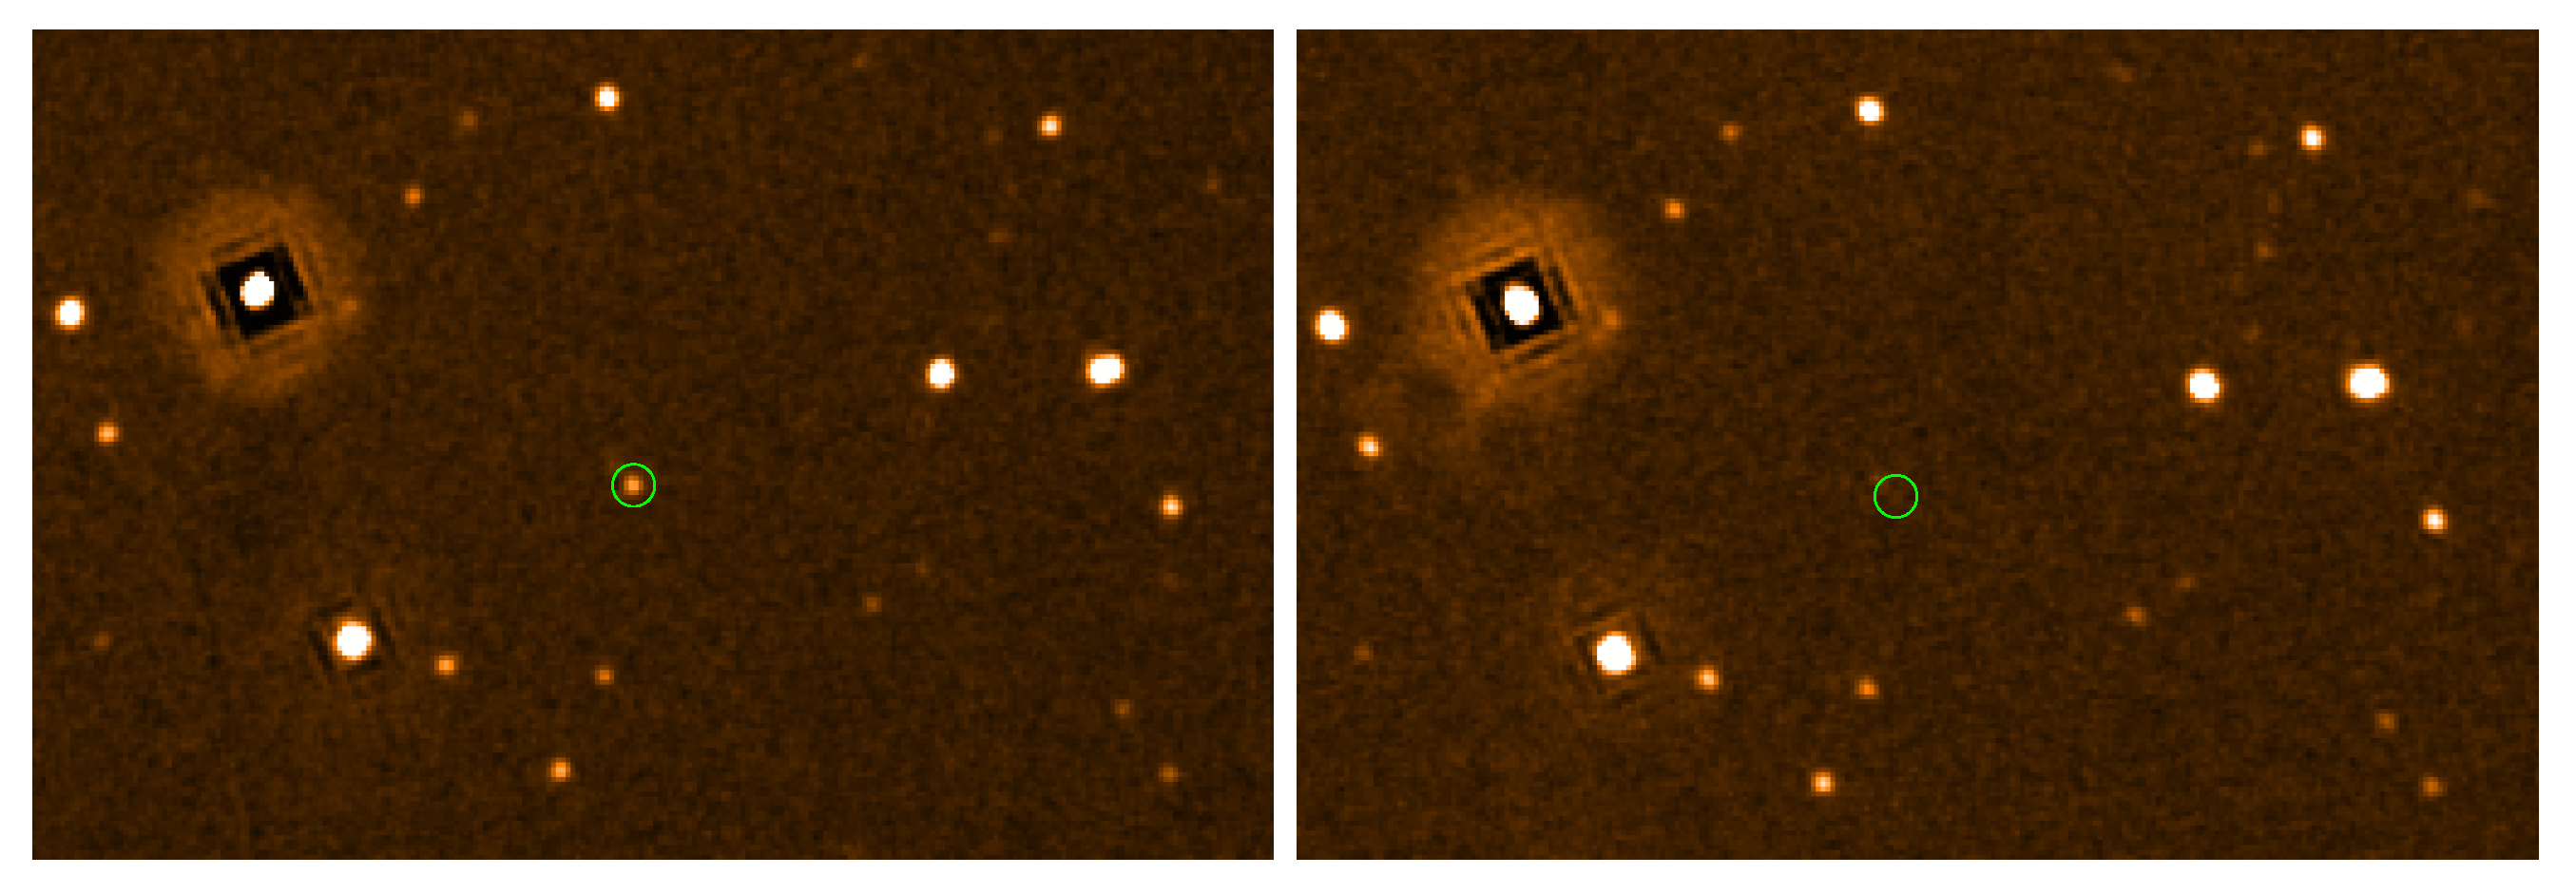
GRB 181110A was detected by Swift at 08:43:31 UT on 10 November 2018 [16]. The BAT light curve showed a multi-peaked structure with a duration of s [17]. The Swift XRT began observing the field 64 s after the BAT trigger. A bright, uncatalogued X-ray source was located with an enhanced position of RA (J2000): 20 h 09 m 16.32 s and Dec (J2000): -36d 53 47.9 with an uncertainty of 1.4 arcsec (at confidence level) [18]. The Swift UVOT began settled observations of the field of GRB 181110A 72 s after the BAT trigger [19]. In the initial exposures, UVOT detected an optical counterpart consistent with the XRT position (Figure 1). The redshift of GRB 181110A is z = 1.505 [20].
3. Analysis
3.1. Afterglow Light Curve Modeling
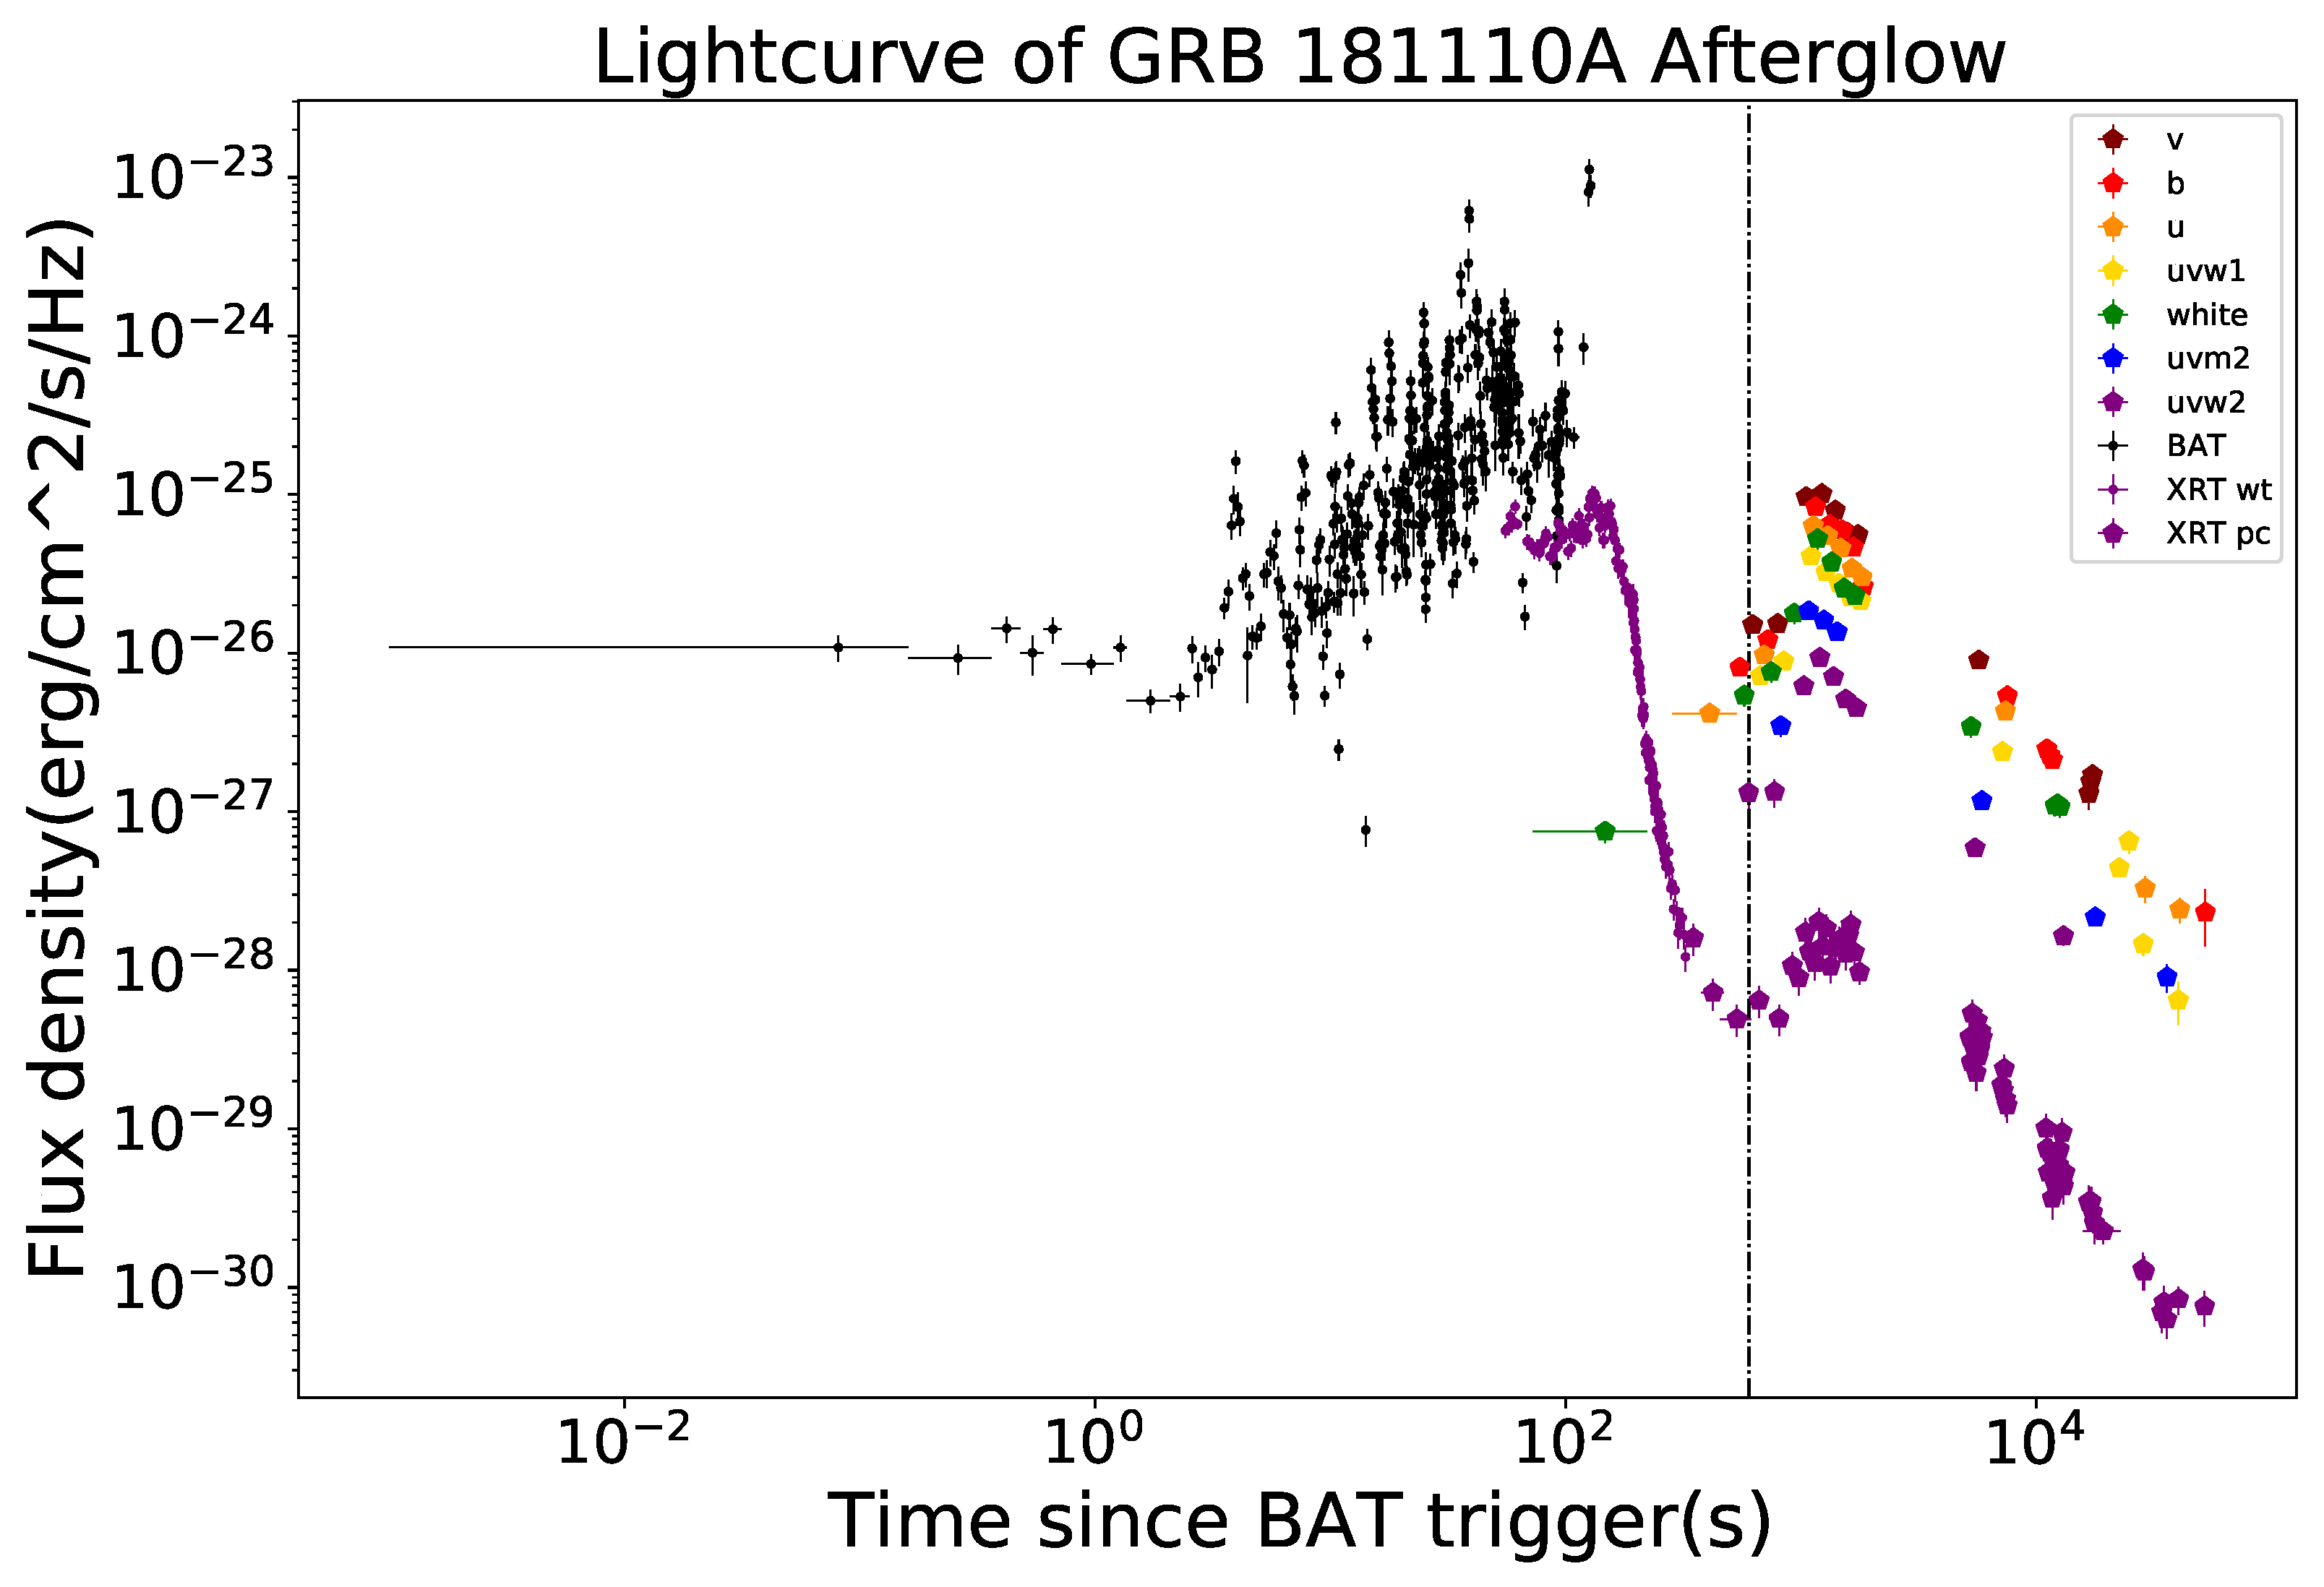
Figure 2 shows the optical, ultraviolet, and X-ray light curves of the afterglow of GRB 181110A. The data were taken with Swift XRT and UVOT. The light curves of different energy bands evolve nearly synchronously and show a peak around 1200 s.
To derive the peak time and slopes of rise and decay phase, we use a smoothly broken power-law function to fit the light curves [21]:
where t is the time after the trigger, is the normalization constant, is the smoothness parameter, and is the slope of rise or decay phase (). Following [9,22], the light curve reaches the maximum at
We choose the data from 600 s after the trigger to fit since as shown in Figure 2, the earlier part may be affected by the prompt emission.
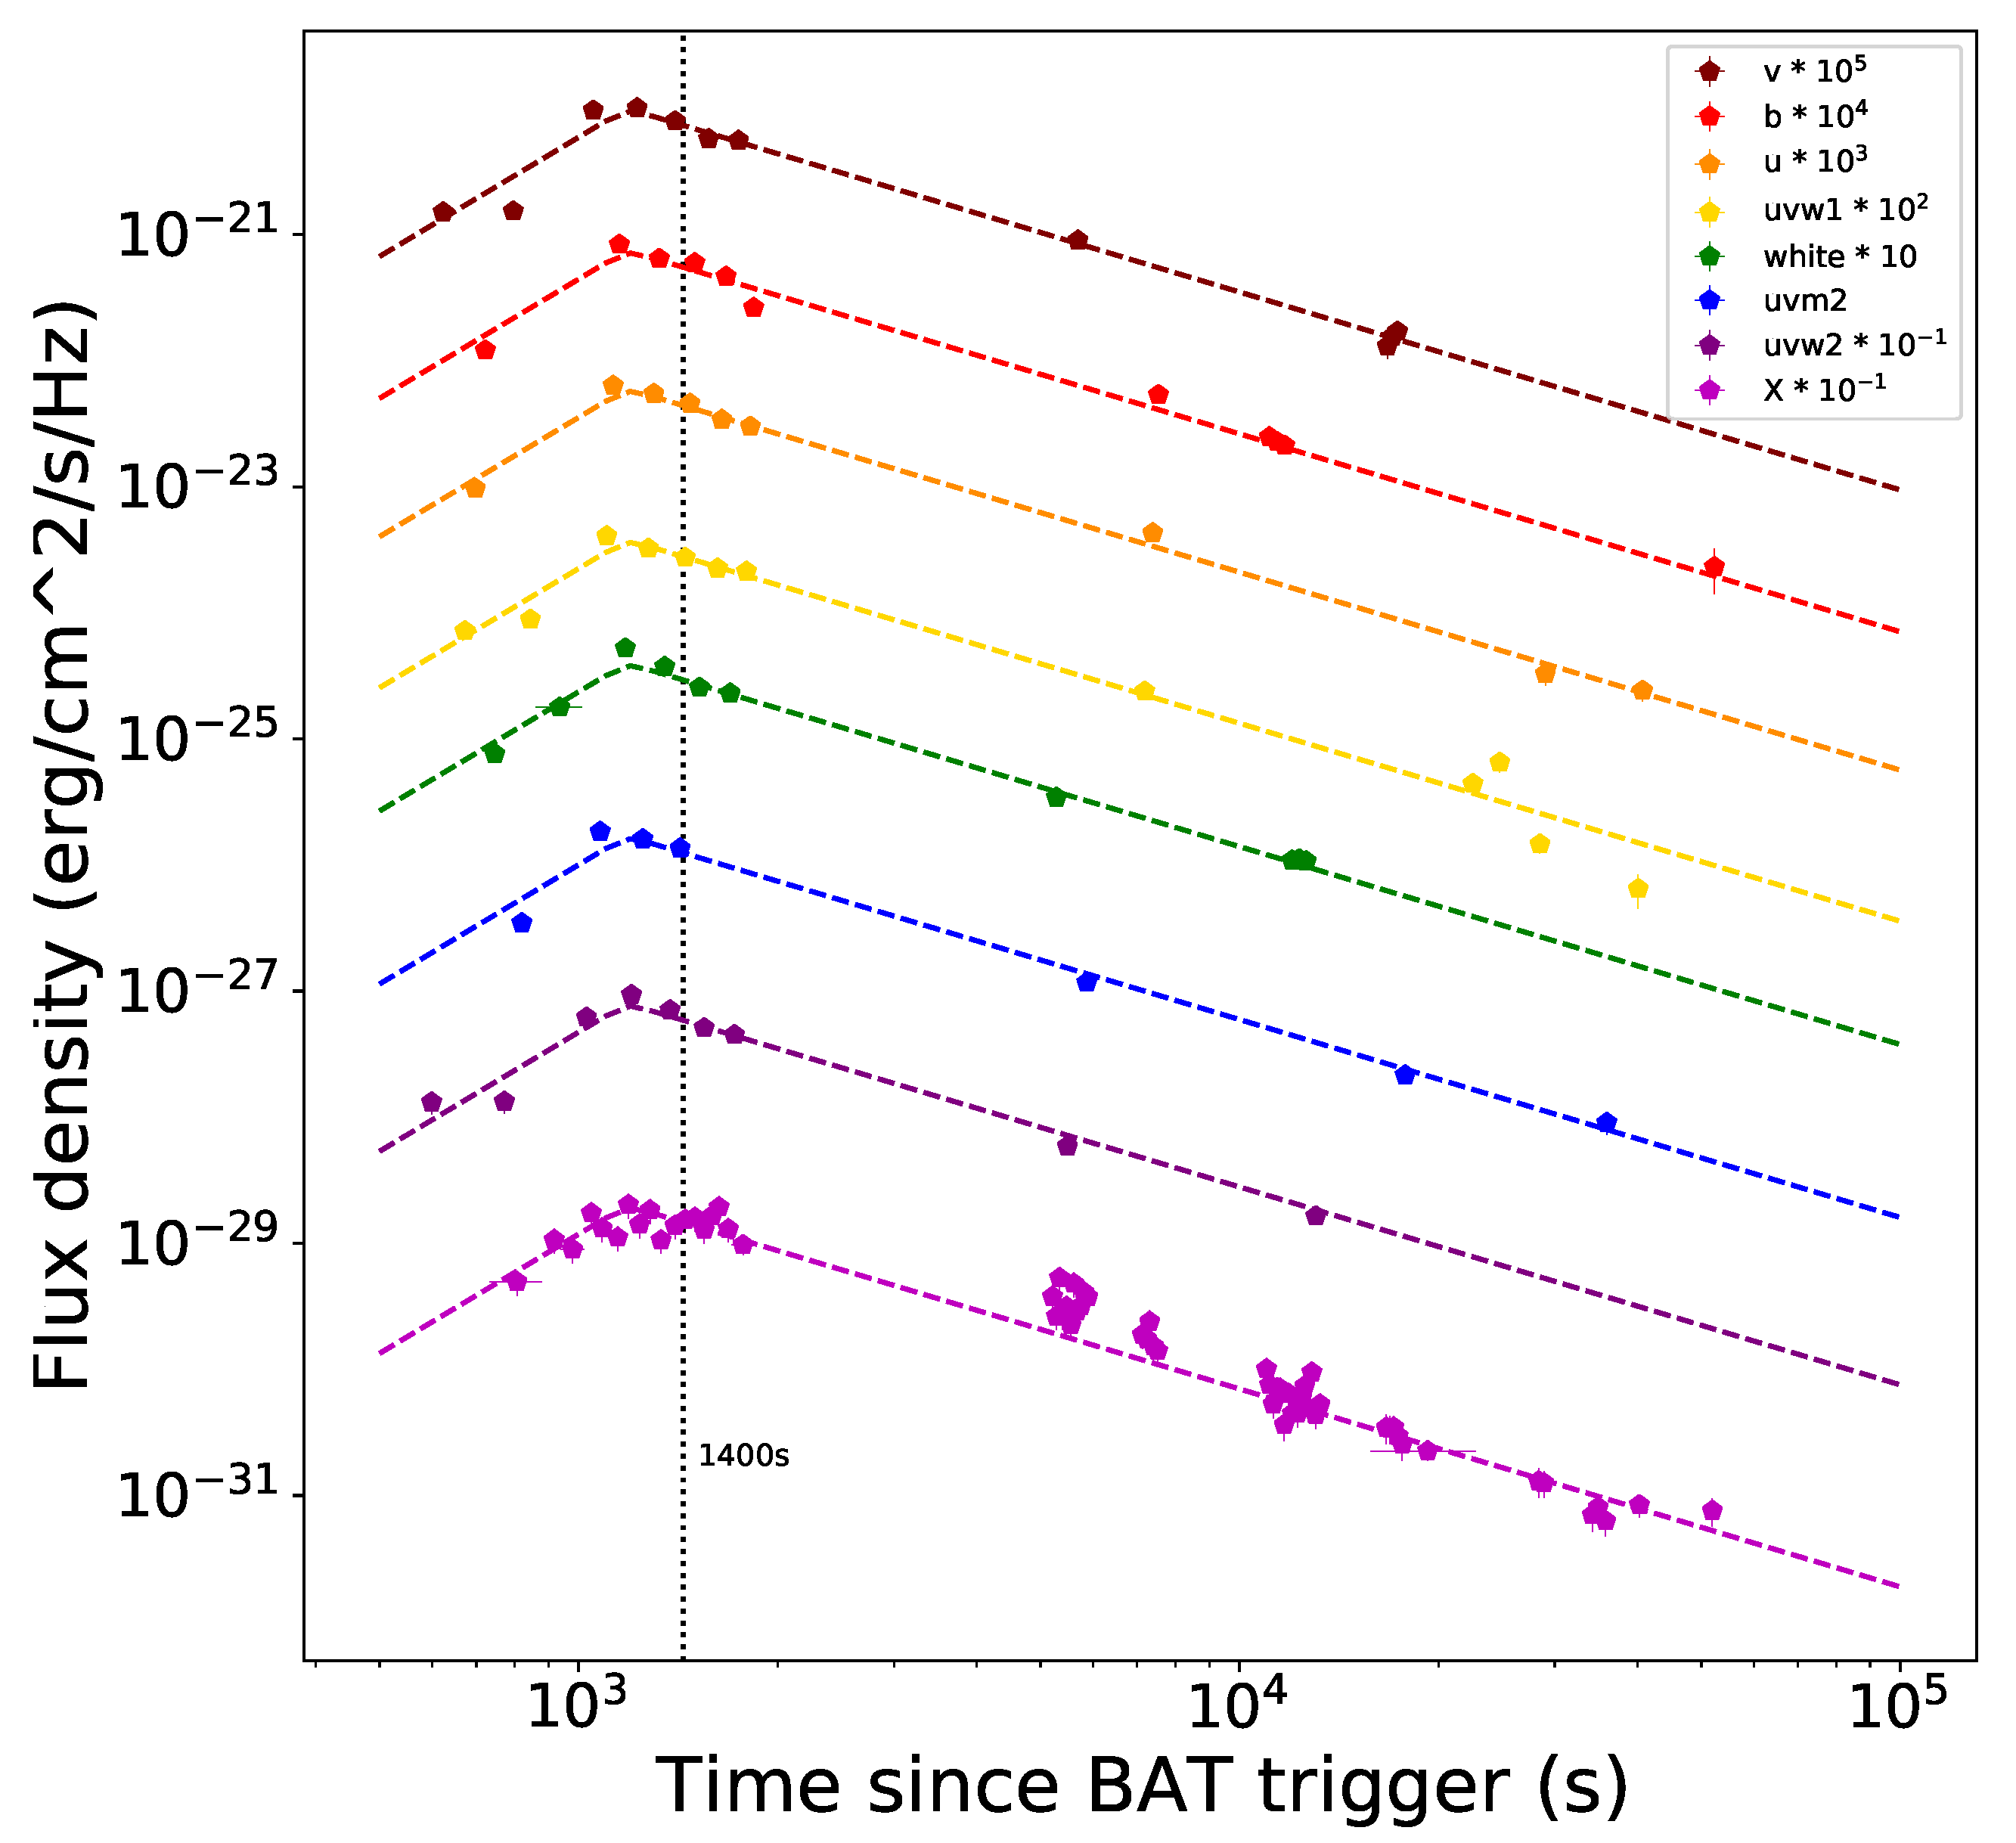
We set as free parameters and use emcee [23], the Python ensemble sampling toolkit for affine-invariant MCMC to fit the observed data with Equation (1). We first fit the data of different bands separately and the results are quite similar; thus, we fit them with a unified model. The peak time () of optical and UV light curves is about 1200 s. The best-fitting results are listed in Table 1 and the corresponding curves are shown in Figure 3.
3.2. Spectral Analysis
3.2.1. Prompt Emission Spectral Analysis
We perform both time-integrated and time-resolved spectral analyses within the time interval from − 39.21 s to + 99.16 s. The time-resolved spectral analysis is performed by slicing the interval into time bins with the Bayesian block [24]. The cutoff power-law function (CPL) and the single power-law (PL) function are adopted to fit the data. The CPL function is described as
where A is the normalization coefficient, is the low-energy photon spectral index, and is the break energy of the photon spectrum, and it is related to the peak energy () of the spectrum by . The single power-law (PL) function is
where A is the normalization coefficient and is the single power-law photon index.
The time-integrated BAT spectrum ( s to s) is well fitted by CPL function (), with a photon index and keV. We calculate the isotropic energy erg.
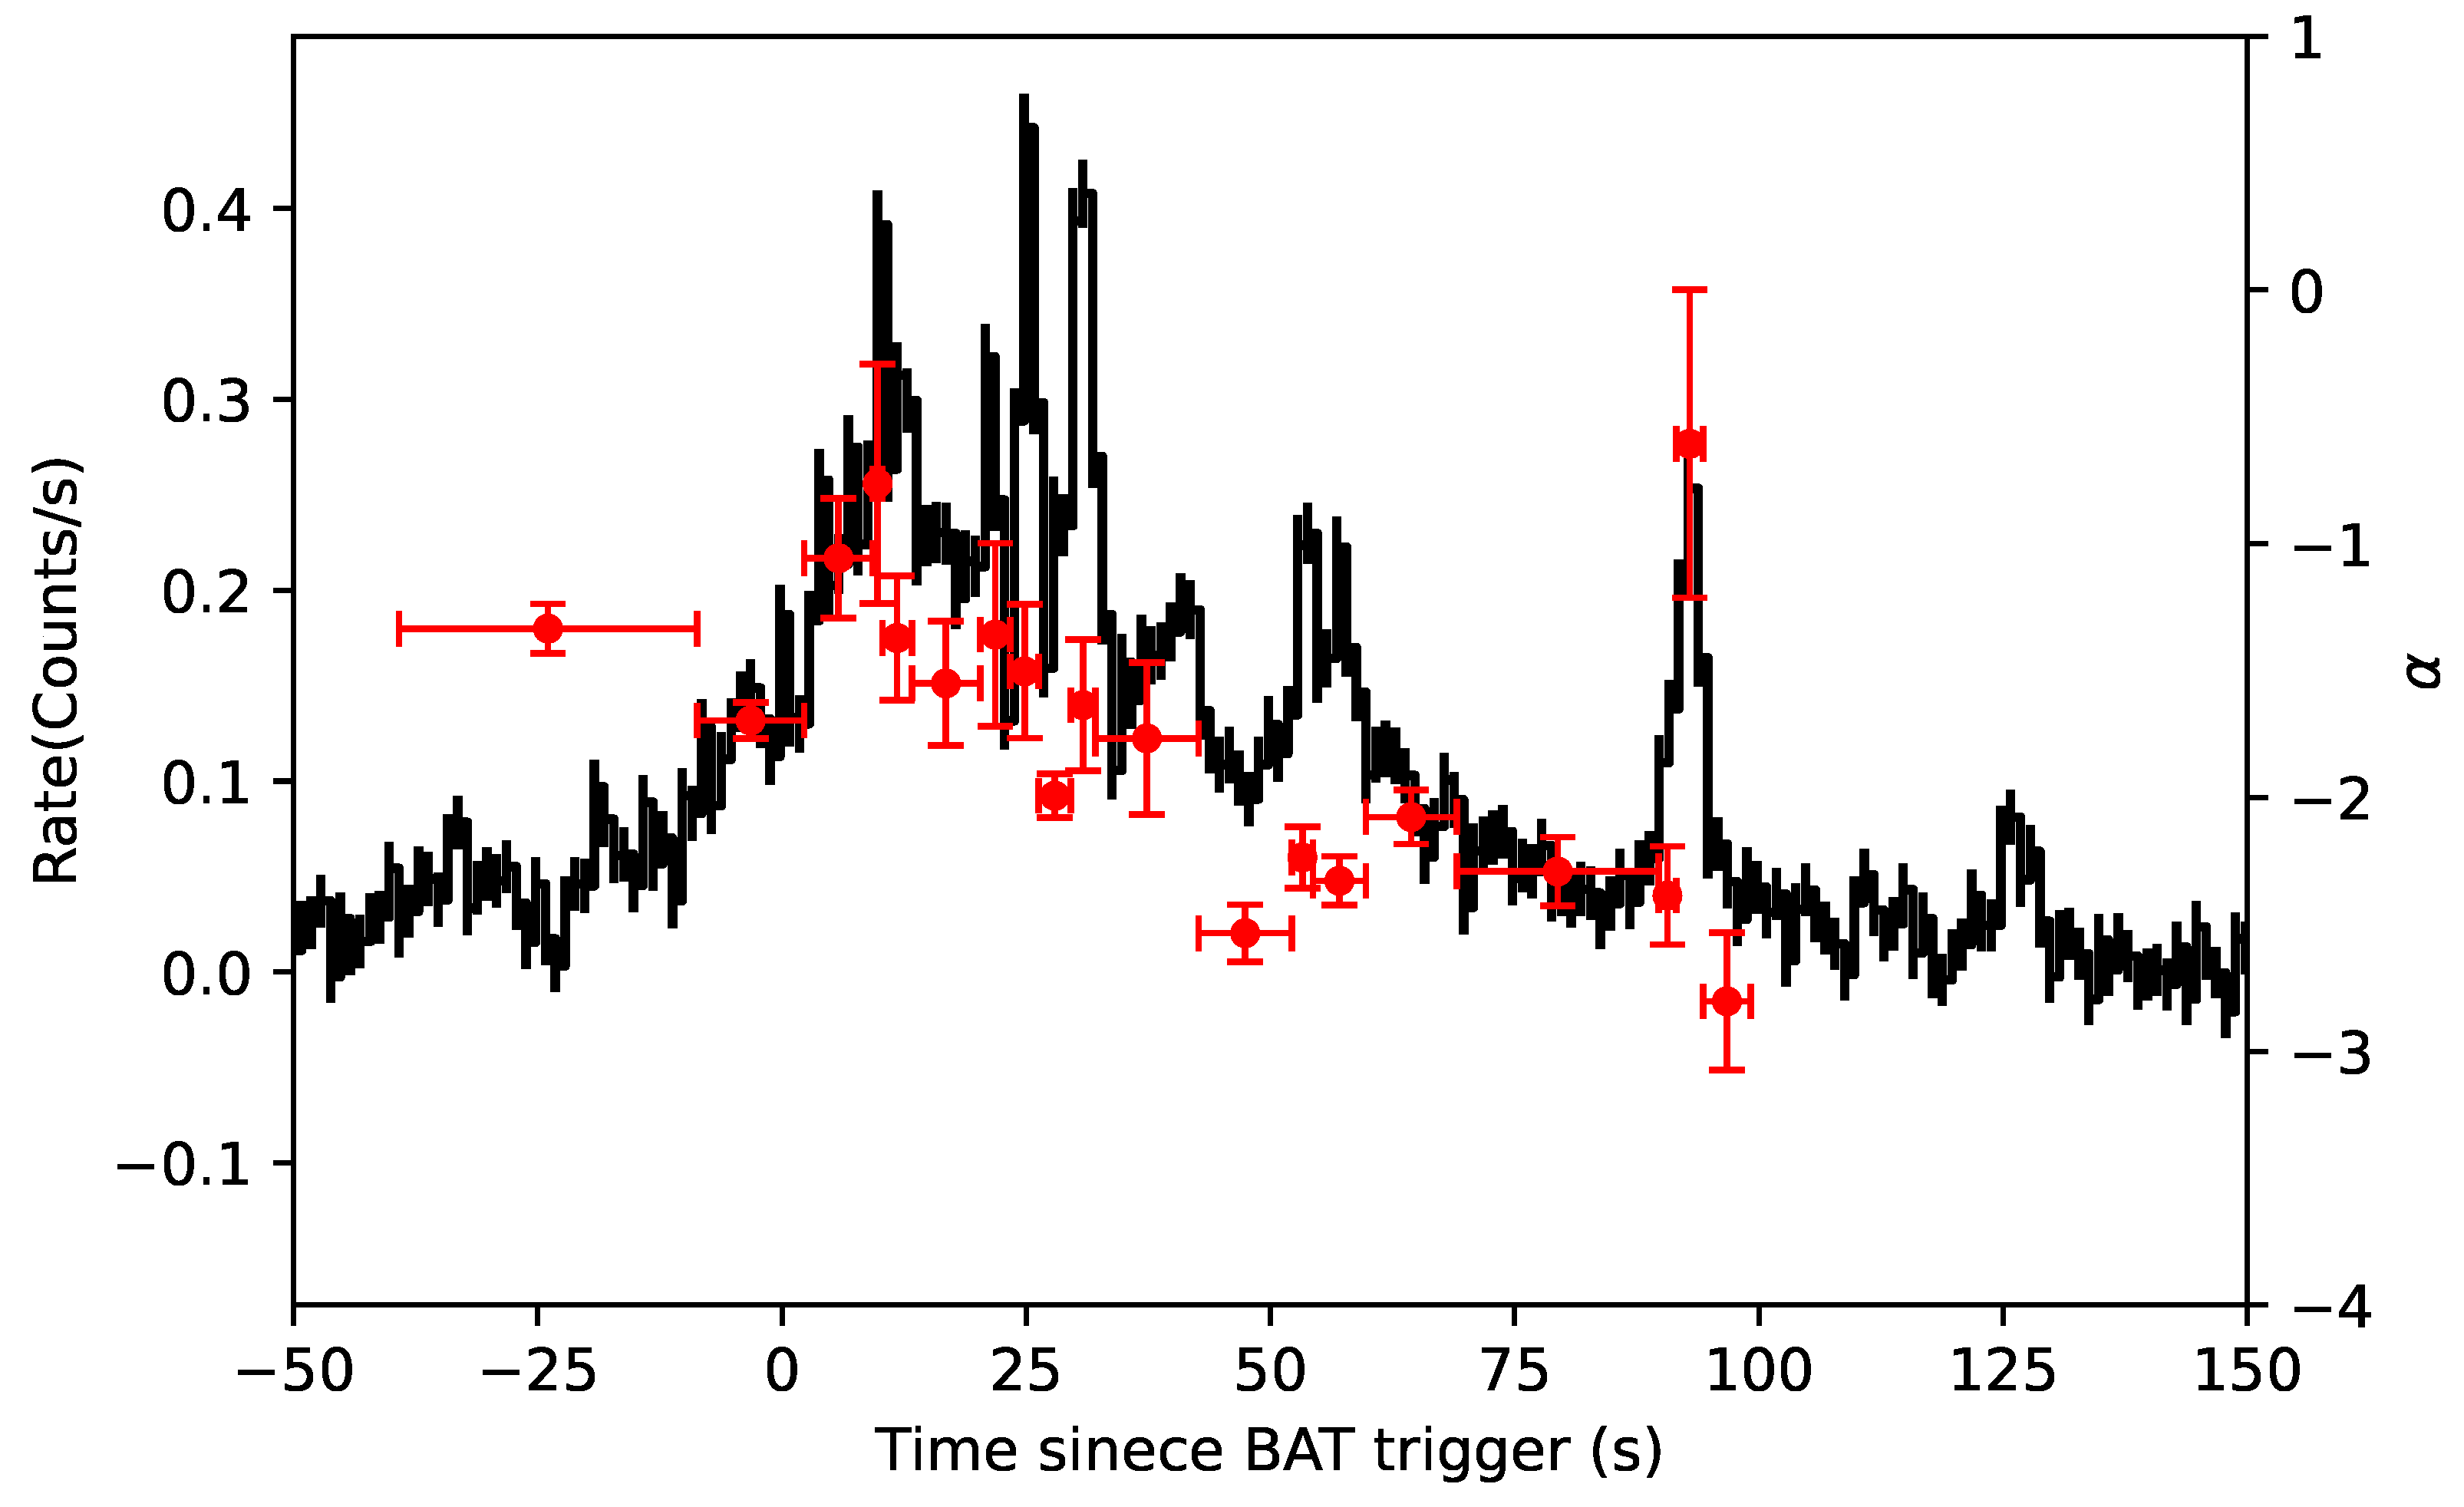
For the time-resolved spectrum, we first fit the spectrum using the CPL function. Given the narrow energy band of BAT, we use the PL function to fit for the time bins in which cannot be reliably constrained. Our result indicates the temporal evolution of the spectra, which is shown in Table 2. The energy spectrum index of GRB 181110A is found to be soft on the whole, and the spectral evolution is observed, as shown in Figure 4; shows a hard-to-soft pattern at first and then shows an intensity-tracking pattern.
3.2.2. Afterglow SED Fitting
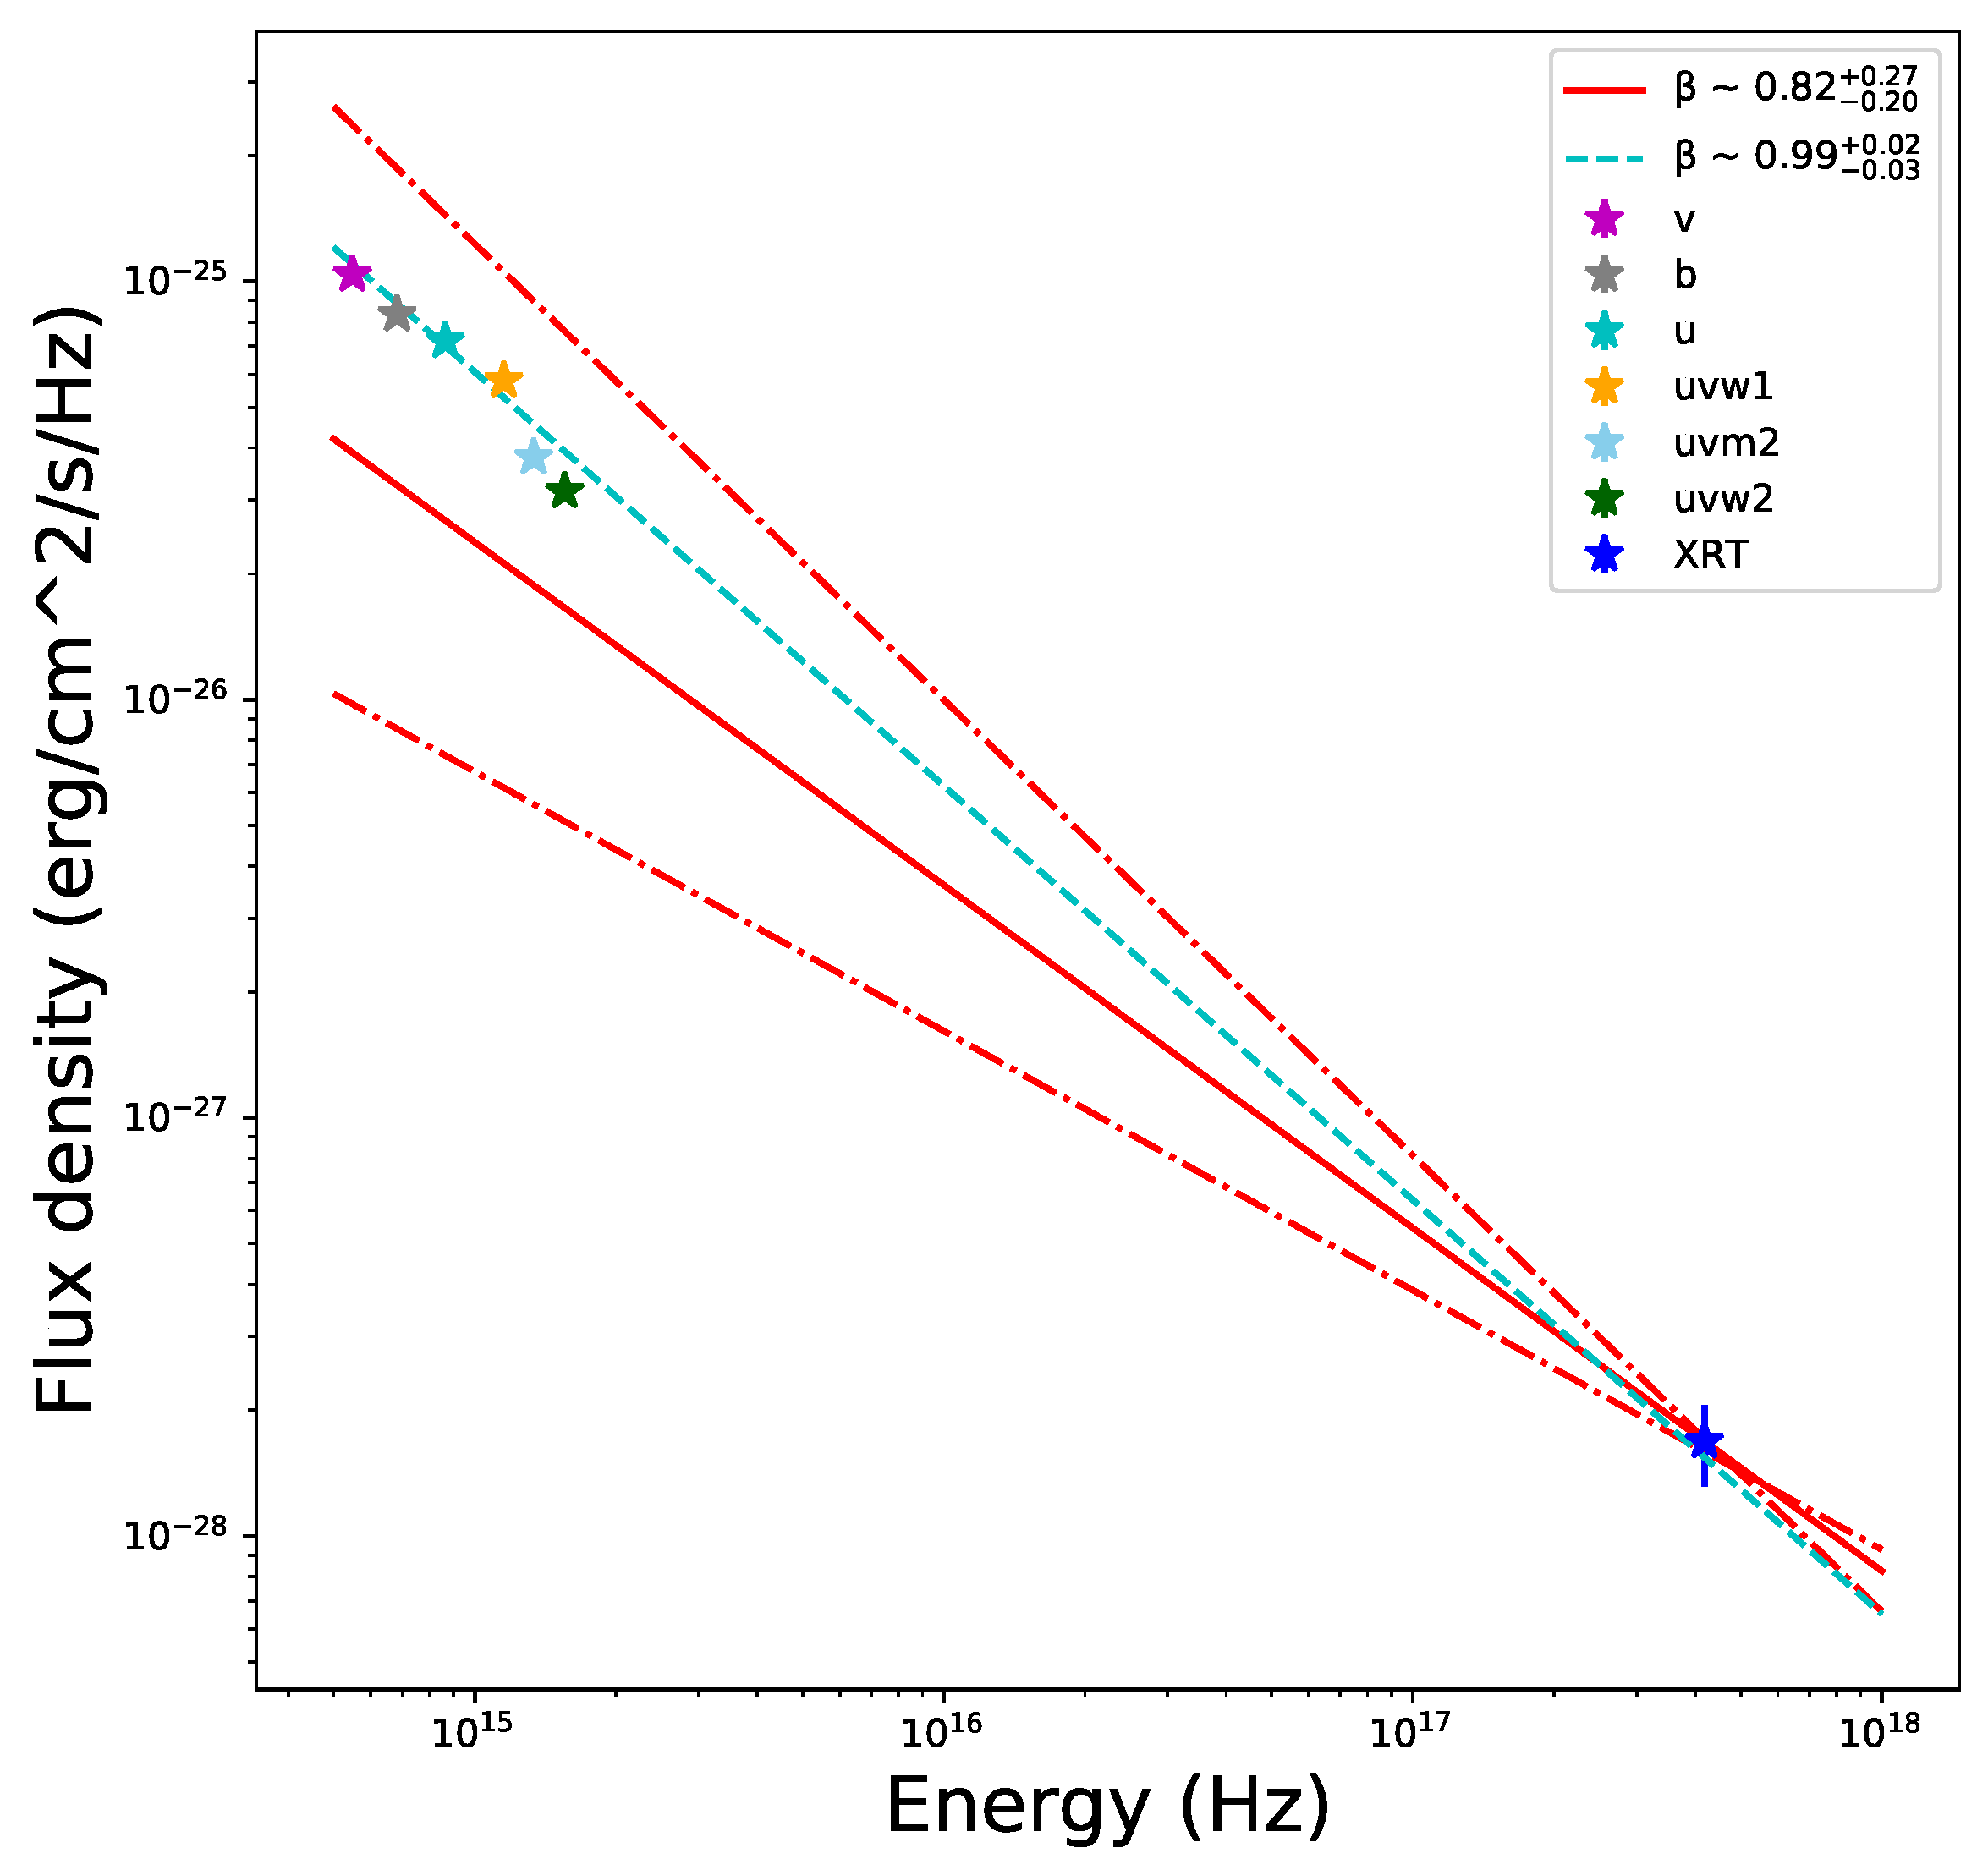
In Figure 5, we build the spectral energy distribution (SED) at 1400 s after the trigger. This epoch is chosen because multiband data are available. The SED has been corrected for extinction in the Milky Way [25]) and X-ray absorption ( [26]). In addition, to account for host galaxy dust extinction, we fit the afterglow SED with the Small Magellan Cloud (SMC) template extinction law [27,28,29] and derive a small visual extinction (), taking the Lyman alpha absorption at into account. Overall, the SED is consistent with a simple power-law extending from optical to X-ray band and the spectral slope is , which is in line with the average spectral index for XRT PC mode data () retrieved from the online repository4.
3.3. Afterglowpy Modeling
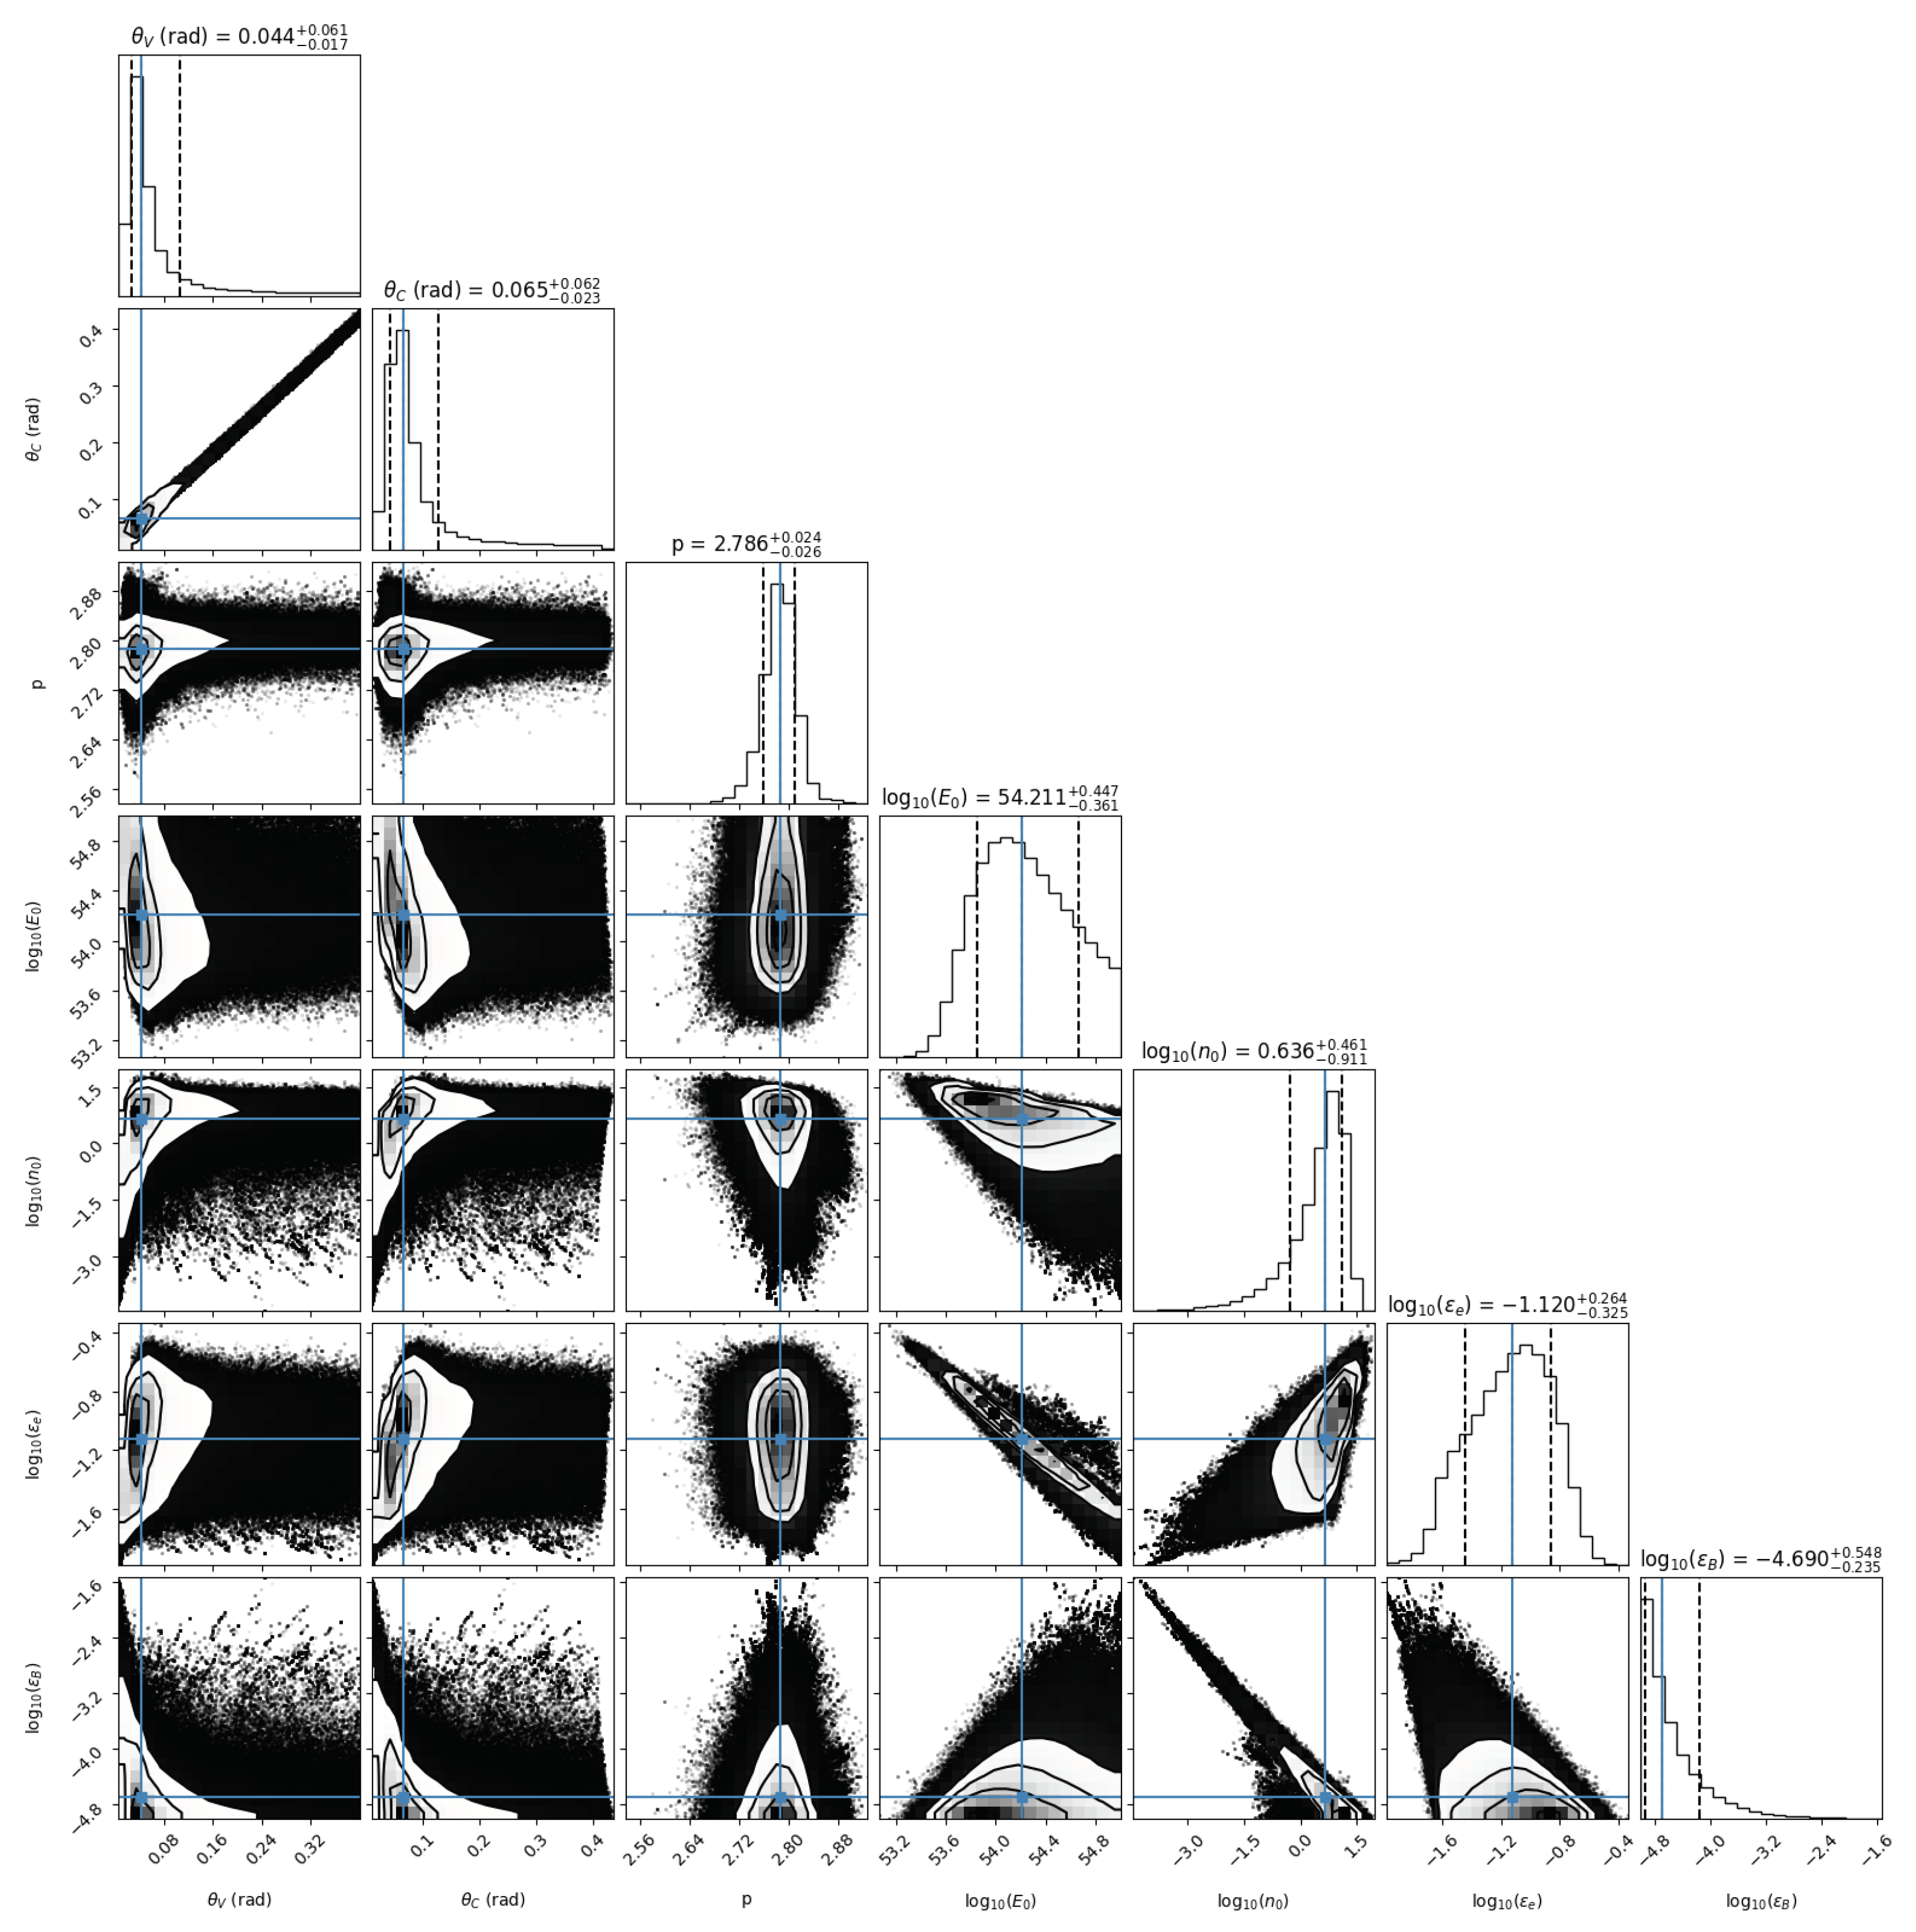
To further investigate the properties of the relativistic jet, we numerically model the afterglow light curves (from 5000 s after the trigger) using afterglowpy [31]. Three structures for the jet’s energy profile are considered: the top-hat, the Gaussian, and the power-law jets [32,33,34,35,36]. The physical parameters for the top-hat model are the viewing angle (), the jet core opening angle (), the isotropic energy (), the circumburst medium density (), and the fraction of shock energy that is transferred to electron and the magnetic field, respectively ( and ). The Gaussian and power-law models have the truncation angle () as an additional free parameter, and the power-law model has the power-law index (b) as another additional parameter. Then, with emcee, we show the results of physical parameters in Table 3. The posterior distribution of physical parameters of top-hat jet for GRB 181110A is presented in Figure 6.
4. Discussion
4.1. Constraint on the Medium Profile and Jet Structure
In the standard afterglow model, the interaction between the relativistic fireball and the circumburst medium leads to external shocks and produces the multiband afterglow emission. The temporal and spectral behavior of multiband afterglow can be used to diagnose the profile of the circumburst medium. For GRB 181110A, we firstly consider the ISM case. When , the fireball has not been decelerated significantly, and the flux of the forward shock emission can be described by the scaling law [37]:
for , where and are the typical synchrotron frequency and the cooling frequency of electrons, respectively. The best-fitting parameters listed in Table 1 are therefore consistent with the temporal behavior above. When , the temporal decay index () in Table 1 and the spectral index () derived from our analysis are consistent with the closure relation in case [37]. The electron energy spectral index is estimated to be with the relation , while in the wind scenario, the rise of the forward shock emission for cannot be steeper than [38]. Hence, a homogeneous medium model is favored for GRB 181110A.
Note that the electron energy spectral index is closer to the results of top-hat and Gaussian jet in Table 3. In addition, for the Gaussian model, the constrained jet profile is similar to that of the top-hat model due to [31]. The similar results between these two models in Table 3 also favor a uniform jet over a structured one.
Using the parameters in Table 3, we further estimate the typical frequencies of electrons and find Hz and Hz, which is consistent with our analysis above ().
4.2. Determination of
According to the fits, the early afterglow peaks at about 1193 s after the trigger, thus , which agrees with the ISM “thin shell” case [39]. In the thin shell case, the fireball decelerates at , where is the timescale over which the ISM mass collected by fireball is of the ejecta mass, i.e.,
where is the ratio between the isotropic gamma-ray energy and the isotropic blast wave kinetic energy, is the particle number density, is the proton mass, and is the fireball Lorentz factor at , which is approximately half of [40]. Therefore, we can estimate by
The notation denotes in cgs for and , . With the parameters obtained in the previous section, we can obtain , , and then we derive .
The value of confirms the highly relativistic nature of GRB fireballs and is within the typical range (see Figure 11 in [41]). With , we can also derive the deceleration radius .
4.3. GRB 181110A in a Statistical Context
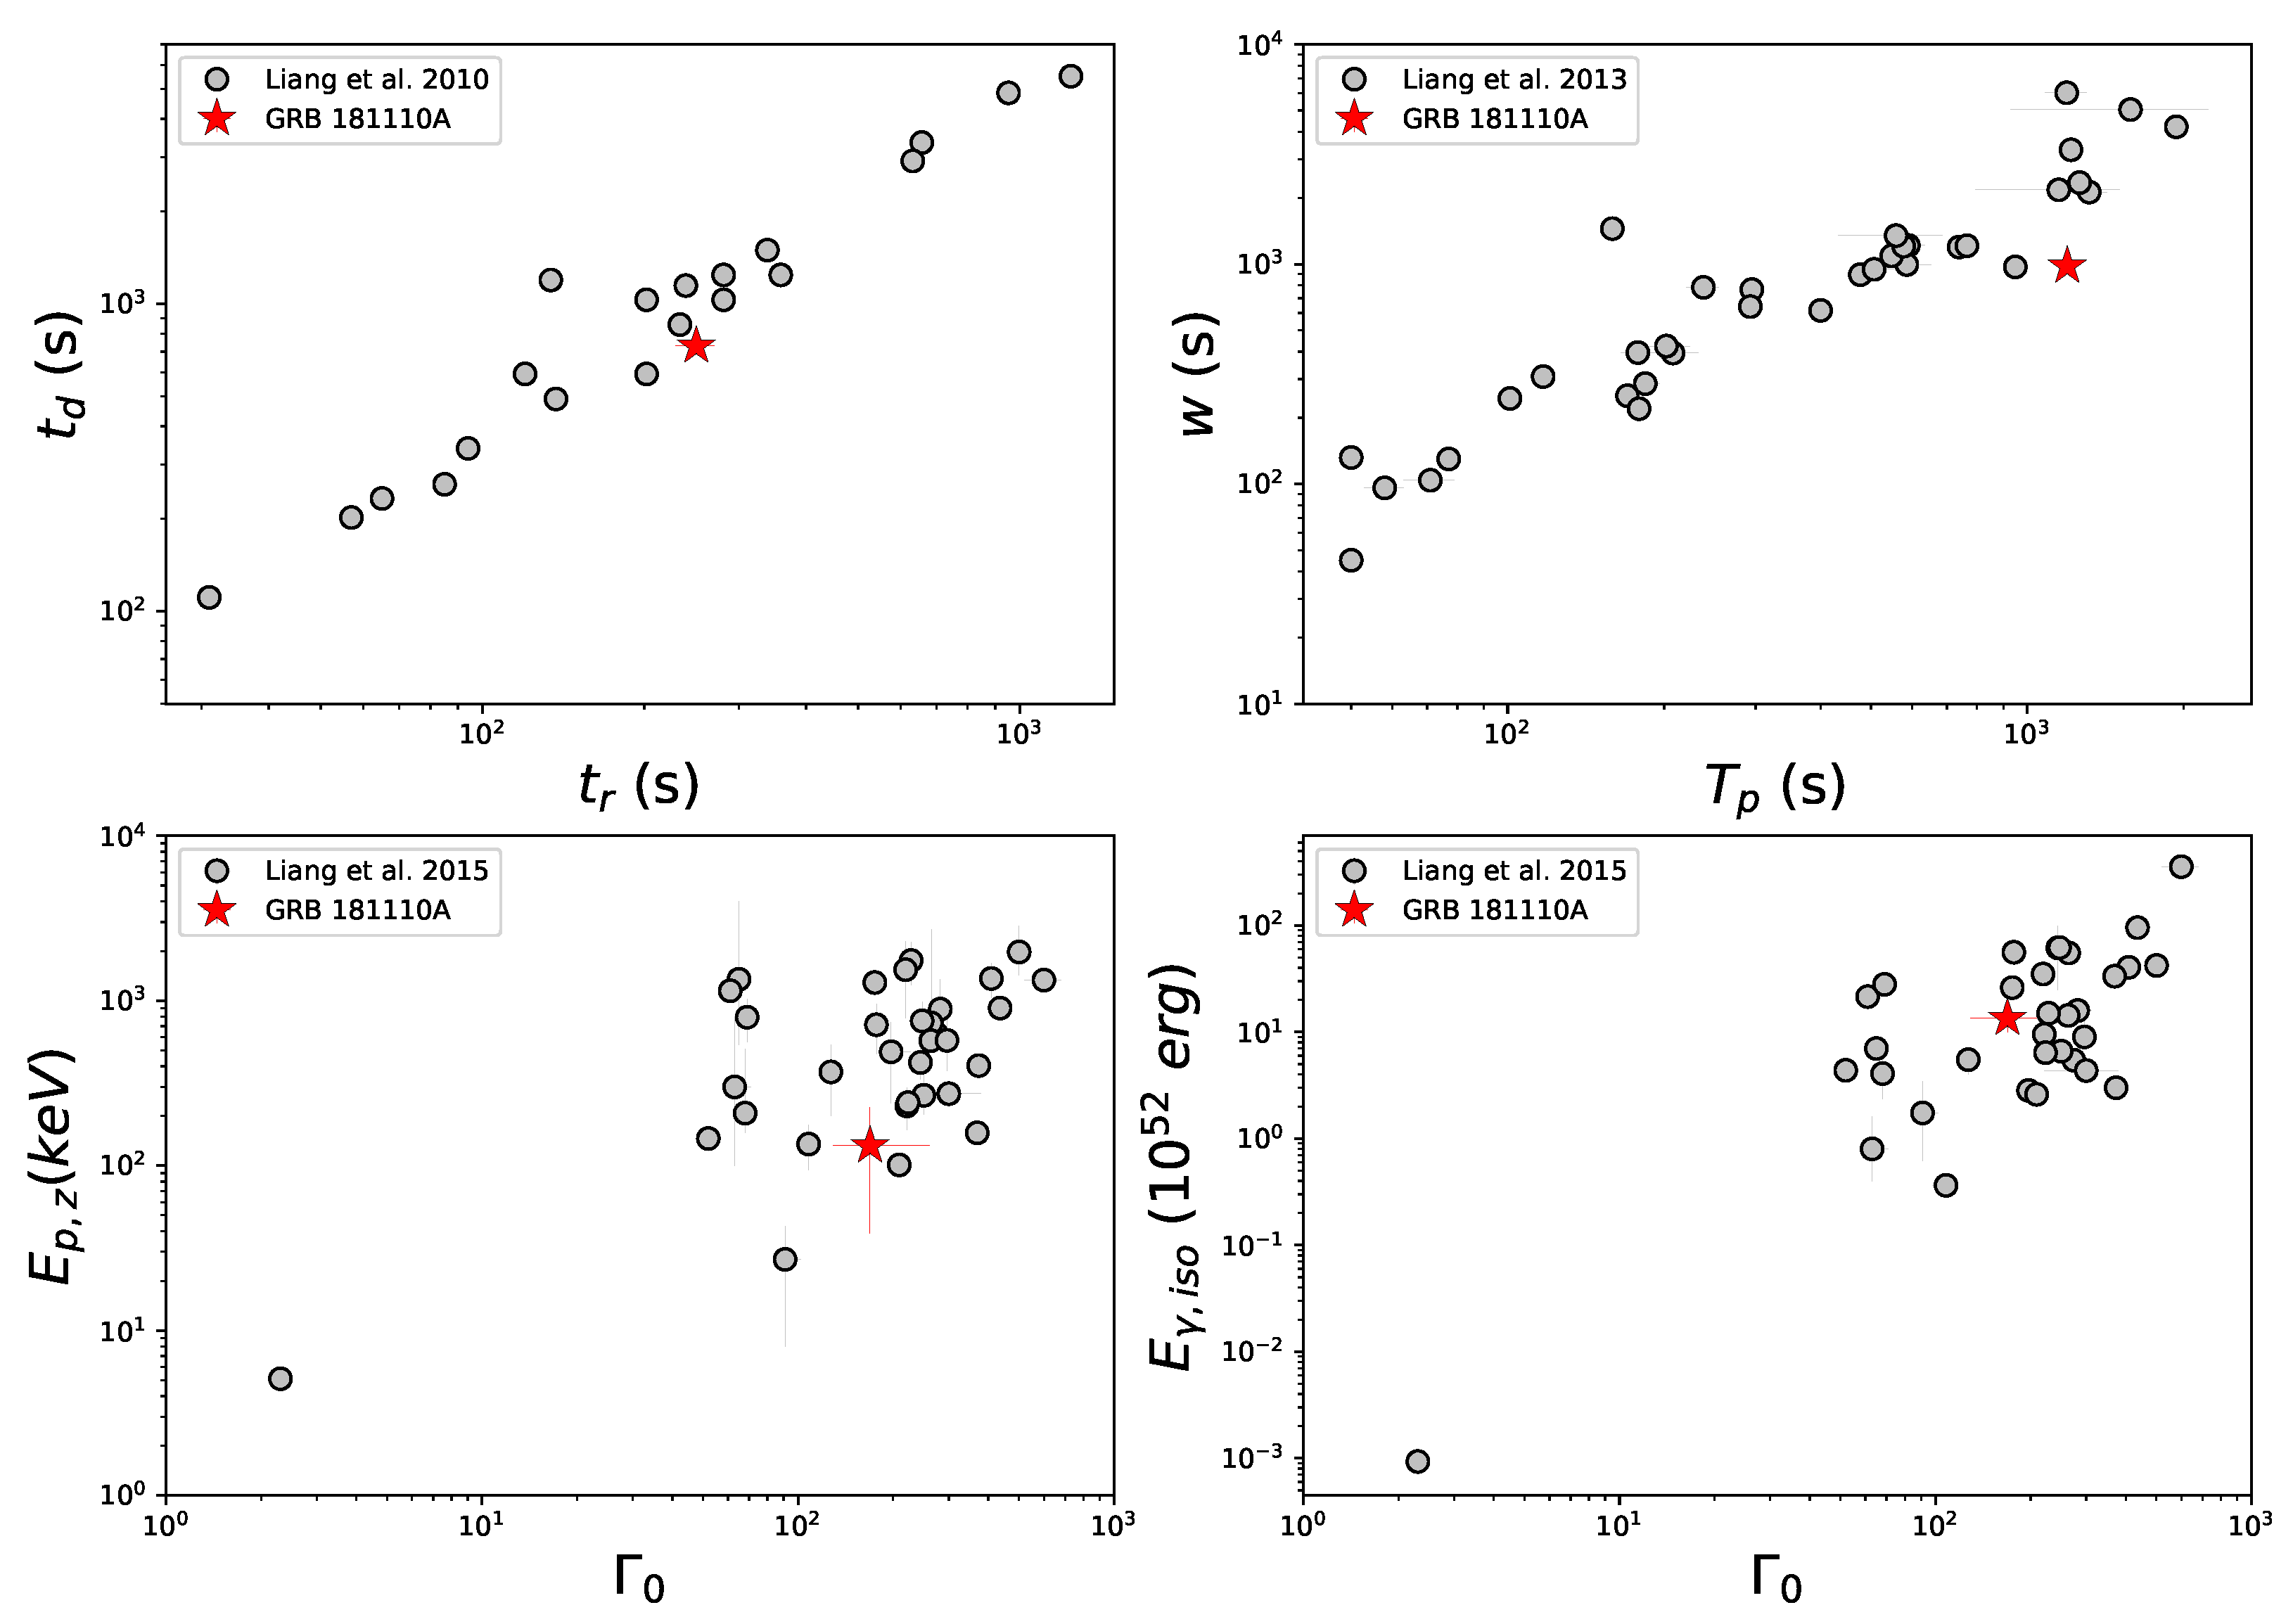
By analyzing a sample of GRBs with afterglow onset feature, Liang et al. [12,42,43] found strong correlations among the timescales of the onset “bump” and correlations among , and , where is the peak energy in the cosmological rest frame. Following [12], we take the full width at half-maximum (FWHM) of our fitting light curve as the characteristic width (w) of the peak. The rising and decaying timescales ( and ) are measured at FWHM. Their correlations are as follows [12,42]:
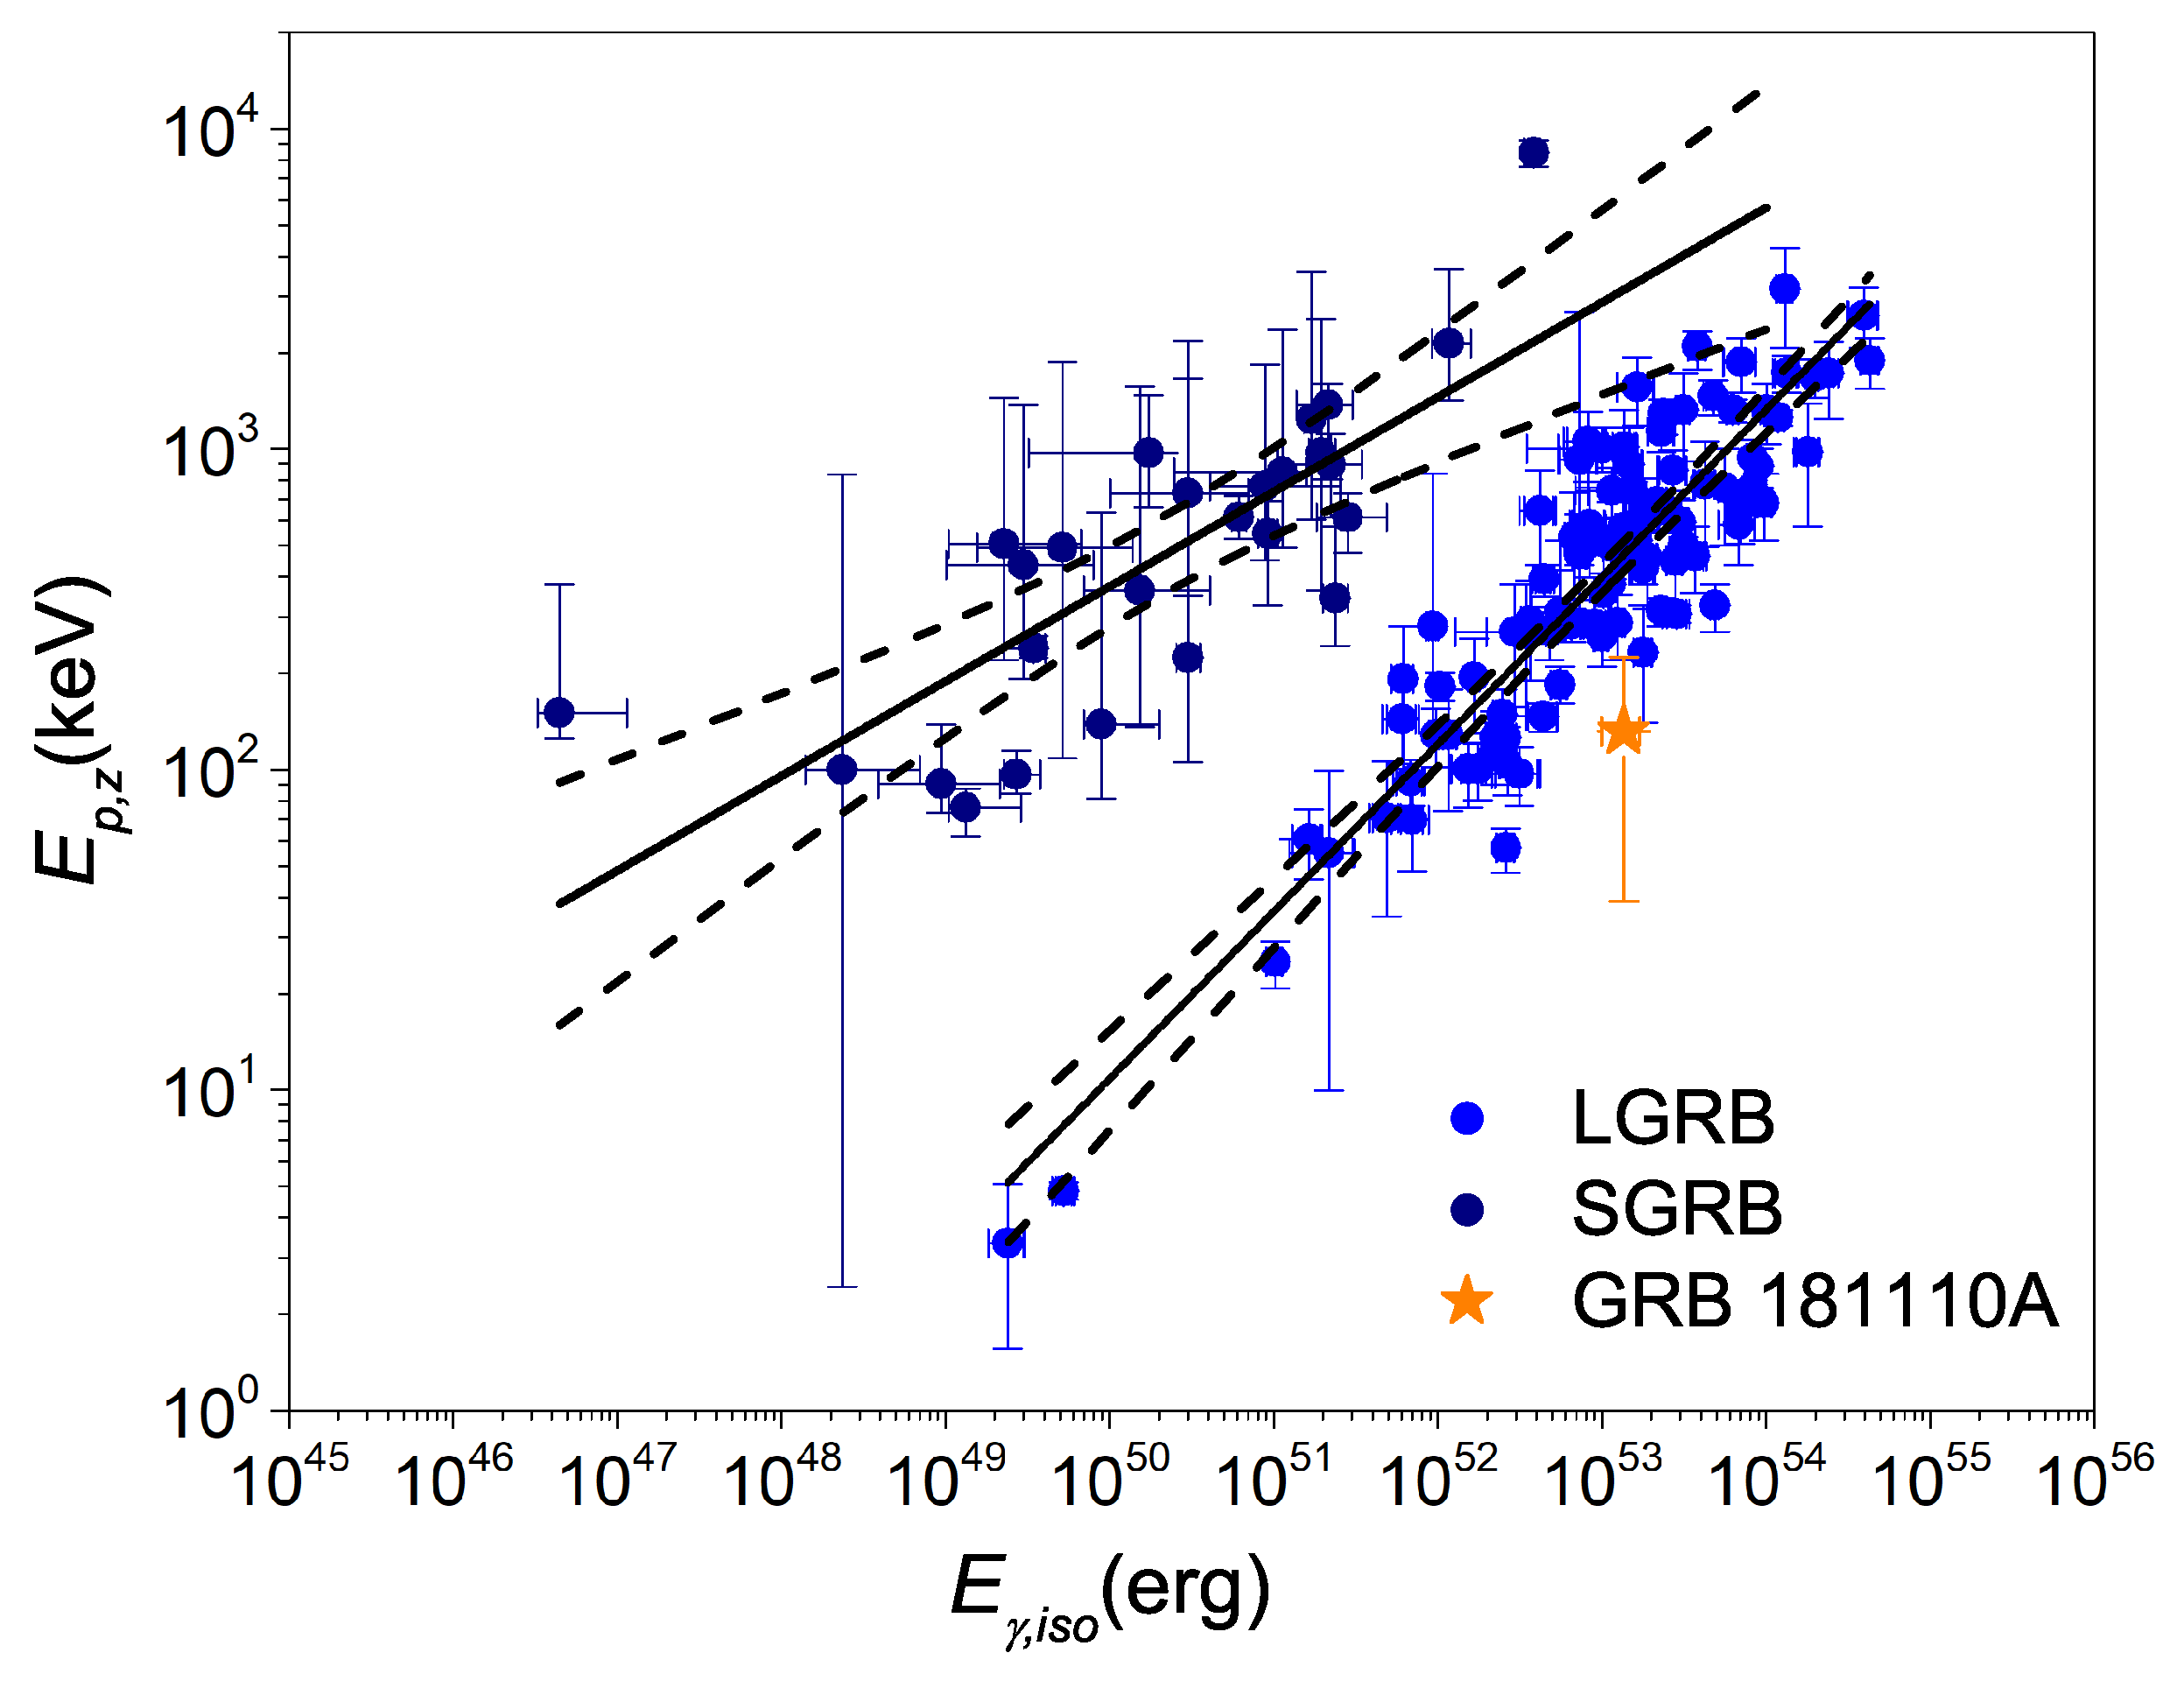
We examine whether GRB 181110A satisfies these empirical relations and then we compare GRB 181110A with other bursts in the Amati relation [44,45,46]:
and
As shown in Figure 7 and Figure 8, the and of this burst lie within the LGRB distribution of Amati relation. The correlations among the timescales of the onset “bump” suggest that a wider onset “bump” tends to peak at a later time, which is consistent with and w we derived for GRB 181110A. GRB 181110A also shares the same and empirical relations with other typical GRBs, which read [43]:
These consistencies suggest that GRB 181110A belongs to typical long GRBs with an afterglow onset feature which can be interpreted by a standard external forward shock model.
5. Summary
The early afterglow light curve of GRB 181110A shows a peak at about 1200 s, thus it is possible to estimate the fireball initial Lorentz factor by taking the peak time as deceleration time .
Firstly we perform spectral analyses for the prompt emission of GRB 181110A and the time-integrated BAT spectrum ( s to s) is well fitted by the CPL function with and keV, while we fit the time-resolved spectrum with both CPL and PL function. We derive erg. We also find that GRB 181110A has a soft spectrum and a spectral evolution feature; the evolution shows a hard-to-soft pattern at first and then an intensity-tracking pattern.
We fit the afterglow light curves with a smoothly broken power-law model and find that the light curves of all bands show the same temporal behavior. For GRB 181110A, the sharp rise of the very early afterglow light curve has ruled out a wind-like circumburst medium. Our joint analysis of multiband afterglow indicates that the standard external forward shock model with the ISM scenario is favored, and the cooling frequency is likely above X-ray band.
We also use afterglowpy to model the afterglow light curves numerically and find that the jet of GRB 181110A tends to be uniform rather than structured.
We investigate GRB 181110A in a statistical context and find that it locates within the sample of LGRBs with good afterglow onset features. The and we derived agree with the Amati relation for LGRBs. With the peak time of light curve and parameters given by afterglowpy modeling, the initial Lorentz factor is measured to be , which is consistent with the typical values of GRBs . Overall, for those GRBs with multiband data observed, it is possible to infer the structures of their jets. GRB 181110A is a typical long GRB that shows a clear afterglow onset feature; with more GRBs such as this being detected, our knowledge of the GRB fireball and circumburst environment may be extended.
Author Contributions
Conceptualization, D.W. and Z.J.; methodology, S.H., X.L. and L.J.; software, S.H., X.L. and L.J.; formal analysis, S.H.; investigation, S.H.; data curation, S.H. and L.J.; writing—original draft preparation, S.H.; writing—review and editing, S.H., Y.W. and D.W.; visualization, S.H., X.L. and L.J.; supervision, D.W.; project administration, D.W., Z.J. and H.H.; funding acquisition, D.W. All authors have read and agreed to the published version of the manuscript.
Funding
This work was supported by NSFC (No. 12073080, 11933010, 11921003) and by the Chinese Academy of Sciences via the Key Research Program of Frontier Sciences (No. QYZDJ-SSW-SYS024).
Data Availability Statement
This work made use of data supplied by the UK Swift Science Data Centre at the University of Leicester (https://www.swift.ac.uk/burst_analyser/00871316/ (accessed on 9 November 2021)). The BAT data are analysed with the HEASOFT package and Xspec (https://heasarc.gsfc.nasa.gov/xanadu/xspec (accessed on 8 April 2022)).
Conflicts of Interest
The authors declare no conflict of interest.
| 1 | https://heasarc.gsfc.nasa.gov/cgi-bin/W3Browse/swift.pl (accessed on 8 April 2022) |
| 2 | https://www.swift.ac.uk/burst_analyser/00871316/ (accessed on 8 April 2022) |
| 3 | https://heasarc.gsfc.nasa.gov/xanadu/xspec (accessed on 8 April 2022) |
| 4 | https://www.swift.ac.uk/burst_analyser/00871316/(accessed on 8 April 2022) |
References
- Rees, M.J.; Mészáros, P. Relativistic fireballs—Energy conversion and time-scales. Mon. Not. R. Astron. Soc. 2007, 258, 41–43. [Google Scholar] [CrossRef] [Green Version]
- Mészáros, P.; Rees, M.J. Relativistic Fireballs and Their Impact on External Matter: Models for Cosmological Gamma-Ray Bursts. Astrophys. J. 1993, 405, 278–284. [Google Scholar] [CrossRef]
- Piran, T. Gamma-ray bursts and the fireball model. Phys. Rep. 1999, 314, 575–667. [Google Scholar] [CrossRef] [Green Version]
- Mészáros, P. Theories of Gamma-Ray Bursts. Annu. Rev. Astron. Astrophys. 2002, 314, 137–169. [Google Scholar] [CrossRef] [Green Version]
- Zhang, B.; Mészáros, P. Gamma-Ray Bursts: Progress, problems & prospects. Int. J. Mod. Phys. 2004, 19, 2385–2472. [Google Scholar]
- Ruderman, M. Theories of gamma-ray bursts. In Proceedings of the Seventh Texas Symposium on Relativistic Astrophysics, Dallas, TX, USA, 16–20 December 1974. [Google Scholar]
- Piran, T.; Shemi, A.; Narayan, R. Hydrodynamics of Relativistic Fireballs. Mon. Not. R. Astron. Soc. 1993, 263, 861–867. [Google Scholar] [CrossRef] [Green Version]
- Panaitescu, A.; Kumar, P. Analytic Light Curves of Gamma-Ray Burst Afterglows: Homogeneous versus Wind External Media. Astrophys. J. 2000, 543, 66–76. [Google Scholar] [CrossRef] [Green Version]
- Molinari, E.; Vergani, S.D.; Malesani, D.; Covino, S.; d’Avanzo, P.; Chincarini, G.; Zerbi, F.M.; Antonelli, L.A.; Conconi, P.; Testa, V.; et al. REM observations of GRB 060418 and GRB 060607A: The onset of the afterglow and the initial fireball Lorentz factor determination. Astron. Astrophys. 2007, 469, L13–L16. [Google Scholar] [CrossRef] [Green Version]
- Sari, R.; Piran, T. Predictions for the Very Early Afterglow and the Optical Flash. Astrophys. J. 1999, 520, 641–649. [Google Scholar] [CrossRef] [Green Version]
- Xue, R.R.; Fan, Y.Z.; Wei, D.M. The initial Lorentz factors of fireballs inferred from the early X-ray data of SWIFT GRBs. Astron. Astrophys. 2009, 498, 671–676. [Google Scholar] [CrossRef]
- Liang, E.W.; Yi, S.X.; Zhang, J. Constraining Gamma-ray Burst Initial Lorentz Factor with the Afterglow Onset Feature and Discovery of a Tight Γ0-E γ,iso Correlation. Astrophys. J. 2010, 725, 2209–2224. [Google Scholar] [CrossRef] [Green Version]
- Burrows, D.N.; Hill, J.E.; Nousek, J.A.; Kennea, J.; Wells, A.; Osborne, J.P.; Abbey, A.F.; Beardmore, A.; Mukerjee, K.; Short, A.D.T.; et al. The Swift X-Ray Telescope. Space Sci. Rev. 2005, 120, 165–195. [Google Scholar] [CrossRef]
- Roming, P.W.A.; Kennedy, T.E.; Mason, K.O.; Nousek, J.A.; Ahr, L.; Bingham, R.E.; Broos, P.S.; Carter, M.J.; Hancock, B.K.; Huckle, H.E.; et al. The Swift Ultra-Violet/Optical Telescope. Space Sci. Rev. 2005, 120, 95–142. [Google Scholar] [CrossRef] [Green Version]
- Bennett, C.L.; Larson, D.R.; Weiland, J.L.; Hinshaw, G. The 1% Concordance Hubble Constant. Astrophys. J. 2014, 794, 135. [Google Scholar] [CrossRef]
- Evans, P.A.; Page, K.L.; Sakamoto, T. GRB 181110A: Swift Detection of a Burst with an Optical Counterpart; GRB Coordinates Network, Circular Service, No. 23413, #1; NASA: Washington, DC, USA, 2018. [Google Scholar]
- Lien, A.Y.; Barthelmy, S.D.; Cummings, J.R.; Evans, P.A.; Krimm, H.A.; Markwardt, C.B.; Palmer, D.M.; Sakamoto, T.; Stamatikos, M.; Ukwatta, T.N. GRB 181110A, Swift-BAT Refined Analysis; GRB Coordinates Network, Circular Service, No. 23420, #1; NASA: Washington, DC, USA, 2018. [Google Scholar]
- Goad, M.R.; Osborne, J.P.; Beardmore, A.P.; Evans, P.A. GRB 181110A: Enhanced Swift-XRT Position; GRB Coordinates Network, Circular Service, No. 23417, #1; NASA: Washington, DC, USA, 2018. [Google Scholar]
- Kuin, N.P.M.; Evans, P.A. GRB 181110A: Swift/UVOT Detection; GRB Coordinates Network, Circular Service, No. 23419, #1; NASA: Washington, DC, USA, 2018. [Google Scholar]
- Perley, D.A.; Malesani, D.B.; Fynbo, J.P.U.; Heintz, K.E.; Kann, D.A.; D’Elia, V.; Izzo, L.; Tanvir, N.R. GRB 181110A: VLT/X-Shooter Redshift; GRB Coordinates Network, Circular Service, No. 23421, #1; NASA: Washington, DC, USA, 2018. [Google Scholar]
- Beuermann, K.; Hessman, F.V.; Reinsch, K.; Nicklas, H.; Vreeswijk, P.M.; Galama, T.J.; Rol, E.; Van Paradijs, J.; Kouveliotou, C.; Frontera, F.; et al. VLT observations of GRB 990510 and its environment. Astron. Astrophys. 1999, 352, L26–L30. [Google Scholar]
- Kann, D.A.; Schady, P.; Olivares, E.F.; Klose, S.; Rossi, A.; Perley, D.A.; Zhang, B.; Kruhler, T.; Greiner, J.; Guelbenzu, A.N.; et al. The optical/NIR afterglow of GRB 111209A: Complex yet not unprecedented. Astron. Astrophys. 2018, 617, A122. [Google Scholar] [CrossRef]
- Foreman-Mackey, D.; Hogg, D.W.; Lang, D.; Goodman, J. emcee: The MCMC Hammer. Publ. Astron. Soc. Pac. 2013, 125, 306. [Google Scholar] [CrossRef] [Green Version]
- Scargle, J.D.; Norris, J.P.; Jackson, B.; Chiang, J. Studies in Astronomical Time Series Analysis. VI. Bayesian Block Representations. Astrophys. J. 2013, 764, 167. [Google Scholar] [CrossRef] [Green Version]
- Schlafly, E.F.; Finkbeiner, D.P. Measuring Reddening with Sloan Digital Sky Survey Stellar Spectra and Recalibrating SFD. Astrophys. J. 2011, 737, 103. [Google Scholar] [CrossRef]
- Evans, P.A.; Beardmore, A.P.; Page, K.L.; Osborne, J.P.; O’Brien, P.T.; Willingale, R.; Starling, R.L.C.; Burrows, D.N.; Godet, O.; Vetere, L.; et al. Methods and results of an automatic analysis of a complete sample of Swift-XRT observations of GRBs. Mon. Not. R. Astron. Soc. 2009, 397, 1177–1201. [Google Scholar] [CrossRef] [Green Version]
- Fitzpatrick, E.L.; Massa, D. An Analysis of the Shapes of Ultraviolet Extinction Curves. III. an Atlas of Ultraviolet Extinction Curves. Astrophys. J. Suppl. Ser. 1990, 72, 163. [Google Scholar] [CrossRef]
- Gordon, K.D.; Clayton, G.C.; Misselt, K.A.; Landolt, A.U. A Quantitative Comparison of the Small Magellanic Cloud, Large Magellanic Cloud, and Milky Way Ultraviolet to Near-Infrared Extinction Curves. Astrophys. J. 2003, 594, 279–293. [Google Scholar] [CrossRef]
- Li, A.; Liang, S.L.; Kann, D.A.; Wei, D.M.; Klose, S.; Wang, Y.J. On Dust Extinction of Gamma-Ray Burst Host Galaxies. Astrophys. J. 2008, 685, 1046–1051. [Google Scholar] [CrossRef] [Green Version]
- Evans, P.A.; Page, K.L.; Sakamoto, T. The Swift Burst Analyser. I. BAT and XRT spectral and flux evolution of gamma ray bursts. Astron. Astrophys. 2010, 519, A102. [Google Scholar] [CrossRef] [Green Version]
- Ryan, G.; Van Eerten, H.; Piro, L.; Troja, E. Gamma-ray burst afterglows in the multimessenger era: Numerical models and closure relations. Astrophys. J. 2020, 896, 166. [Google Scholar] [CrossRef]
- Mészáros, P.; Rees, M.J.; Wijers, R.A.M.J. Viewing Angle and Environment Effects in Gamma-Ray Bursts: Sources of Afterglow Diversity. Astrophys. J. 1998, 499, 301. [Google Scholar] [CrossRef]
- Dai, Z.G.; Gou, L.J. Gamma-Ray Burst Afterglows from Anisotropic Jets. Astrophys. J. 2001, 552, 72–80. [Google Scholar] [CrossRef]
- Rossi, E.; Lazzati, D.; Rees, M.J. Afterglow light curves, viewing angle and the jet structure of γ-ray bursts. Mon. Not. R. Astron. Soc. 2002, 332, 945–950. [Google Scholar] [CrossRef] [Green Version]
- Zhang, B.; Mészáros, P. Gamma-Ray Burst Beaming: A Universal Configuration with a Standard Energy Reservoir? Astrophys. J. 2002, 571, 876–879. [Google Scholar] [CrossRef] [Green Version]
- Kumar, P.; Granot, J. The Evolution of a Structured Relativistic Jet and Gamma-Ray Burst Afterglow Light Curves. Astrophys. J. 2003, 591, 1075–1085. [Google Scholar] [CrossRef]
- Gao, H.; Lei, W.H.; Zou, Y.C.; Wu, X.F.; Zhang, B. A complete reference of the analytical synchrotron external shock models of gamma-ray bursts. New Astron. Rev. 2013, 57, 141–190. [Google Scholar] [CrossRef] [Green Version]
- Jin, Z.P.; Fan, Y.Z. GRB 060418 and 060607A: The medium surrounding the progenitor and the weak reverse shock emission. Mon. Not. R. Astron. Soc. 2007, 378, 1043–1048. [Google Scholar] [CrossRef] [Green Version]
- Sari, R. Hydrodynamics of Gamma-Ray Burst Afterglow. Astrophys. J. 1997, 489, L37–L40. [Google Scholar] [CrossRef] [Green Version]
- Mészáros, P. Gamma-ray bursts. Rep. Prog. Phys. 2006, 69, 2259–2321. [Google Scholar] [CrossRef]
- Racusin, J.L.; Oates, S.R.; Schady, P.; Burrows, D.N.; De Pasquale, M.; Donato, D.; Gehrels, N.; Koch, S.; McEnery, J.; Piran, T.; et al. Fermi and Swift Gamma-ray Burst Afterglow Population Studies. Astrophys. J. 2011, 738, 138. [Google Scholar] [CrossRef] [Green Version]
- Liang, E.W.; Li, L.; Gao, H.; Zhang, B.; Liang, Y.F.; Wu, X.F.; Yi, S.X.; Dai, Z.G.; Tang, Q.W.; Chen, J.M.; et al. Comprehensive Study of Gamma-Ray Burst Optical Emission. II. Afterglow Onset and Late Re-brightening Components. Astrophys. J. 2013, 774, 13. [Google Scholar] [CrossRef]
- Liang, E.W.; Lin, T.T.; Lü, J.; Lu, R.J.; Zhang, J.; Zhang, B. A Tight Liso-Ep,z-Gamma0 Correlation of Gamma-Ray Bursts. Astrophys. J. 2015, 813, 116. [Google Scholar] [CrossRef] [Green Version]
- Amati, L.; Frontera, F.; Tavani, M.; Antonelli, A.; Costa, E.; Feroci, M.; Guidorzi, C.; Heise, J.; Masetti, N.; Montanari, E.; et al. Intrinsic spectra and energetics of BeppoSAX Gamma-Ray Bursts with known redshifts. Astron. Astrophys. 2002, 390, 81–89. [Google Scholar] [CrossRef]
- Zhang, B.; Zhang, B.B.; Virgili, F.J.; Liang, E.W.; Kann, D.A.; Wu, X.F.; Proga, D.; Lv, H.J.; Toma, K.; Meszaros, P.; et al. Discerning the Physical Origins of Cosmological Gamma-ray Bursts Based on Multiple Observational Criteria: The Cases of z = 6.7 GRB 080913, z = 8.2 GRB 090423, and Some Short/Hard GRBs. Astrophys. J. 2009, 703, 1696–1724. [Google Scholar] [CrossRef] [Green Version]
- Zhang, B.B.; Zhang, B.; Sun, H.; Lei, W.H.; Gao, H.; Li, Y.; Shao, L.; Zhao, Y.; Hu, Y.D.; Lü, H.J.; et al. A peculiar low-luminosity short gamma-ray burst from a double neutron star merger progenitor. Nat. Commun. 2018, 9, 447. [Google Scholar] [CrossRef] [Green Version]
Figure 1.
Swift UVOT B-band images of the field of GRB 181110A about 2 (left) and 14 (right) hours after the trigger; the optical afterglow is circled out.
Figure 1.
Swift UVOT B-band images of the field of GRB 181110A about 2 (left) and 14 (right) hours after the trigger; the optical afterglow is circled out.

Figure 2.
The optical, ultraviolet, and X-ray light curves of GRB 181110A. The UVOT data have been corrected for Galactic extinction. The dashed line marks the time s.
Figure 2.
The optical, ultraviolet, and X-ray light curves of GRB 181110A. The UVOT data have been corrected for Galactic extinction. The dashed line marks the time s.

Figure 3.
The light curves of GRB 181110A. The best-fitting results using the smoothly broken power-law model are shown as dashed lines. The black vertical line marks the time (1400 s) where we build spectral energy distribution.
Figure 3.
The light curves of GRB 181110A. The best-fitting results using the smoothly broken power-law model are shown as dashed lines. The black vertical line marks the time (1400 s) where we build spectral energy distribution.

Figure 4.
The spectral evolution feature of GRB 181110A. Red markers refer to the spectral index . A hard-to-soft spectral index evolution is present in the initial part of the burst, followed by an intensity-tracking pattern.The red points indicate the spectral index and shows a hard-to-soft pattern at first and then an intensity-tracking pattern.

Figure 5.
Optical to X-ray SED of GRB 181110A at 1400 s after BAT trigger. The data have been corrected for galactic and host extinction and X-ray absorption. Note that the flux drops at the uvm2 and uvw2 bands because of the Lyman alpha absorption. The SED is well fitted with a single power-law (cyan line). The red lines indicate the spectrum and its uncertainties derived from the time-averaged PC mode data [30].

Figure 6.
The posterior distribution of physical parameters of top-hat jet for GRB 181110A. Dashed lines mark the 1 region.
Figure 6.
The posterior distribution of physical parameters of top-hat jet for GRB 181110A. Dashed lines mark the 1 region.

Figure 7.
GRB 181110A (orange) in Amati relation. The solid lines are the best fits: for SGRBs, and for LGRBs and SGRBs, respectively (data from [46]). The dashed lines mark the region of the correlation.
Figure 7.
GRB 181110A (orange) in Amati relation. The solid lines are the best fits: for SGRBs, and for LGRBs and SGRBs, respectively (data from [46]). The dashed lines mark the region of the correlation.

Figure 8.
Correlations among timescales of GRB afterglow onset “bump” and the , correlation (8), (12). GRB 181110A (marked with a red star) locates within the sample of GRBs with the onset feature (marked with silver circles; data from [12,42,43]).


Table 1.
Best-fit values of multiband afterglow of GRB 181110A.
| (s) | (s) | |||
|---|---|---|---|---|
Table 2.
Results for the time-resolved spectral analysis (15 keV∼150 keV).
| Time Interval | CPL | PL | |||
|---|---|---|---|---|---|
| (s) | (keV) | Red. | |||
| −39.21∼−8.71 | ... | ... | −1.33 ± 0.10 | 3.02 ± 0.45 | 1.08 |
| −8.71∼2.28 | ... | ... | −1.70 ± 0.07 | 7.32 ± 0.63 | 0.87 |
| 2.28∼9.28 | −1.06 ± 0.24 | 80.02 ± 38.25 | ... | 12.17 ± 7.29 | 0.83 |
| 9.28∼10.28 | −0.76 ± 0.47 | 74.39 ± 51.74 | ... | 15.85 ± 12.62 | 1.07 |
| 10.28∼13.28 | −1.37 ± 0.25 | 111.61 ± 102.43 | ... | 18.42 ± 17.30 | 1.09 |
| 13.28∼20.28 | −1.55 ± 0.24 | 58.70 ± 48.94 | ... | 11.43 ± 7.61 | 1.07 |
| 20.28∼23.38 | −1.36 ± 0.36 | 42.03 ± 32.97 | ... | 11.95 ± 10.62 | 0.83 |
| 23.38∼26.28 | −1.50 ± 0.26 | 73.83 ±67.34 | ... | 16.80 ± 16.28 | 0.75 |
| 26.28∼29.58 | ... | ... | −1.99 ± 0.09 | 11.05 ± 1.21 | 0.73 |
| 29.58∼32.06 | −1.64 ± 0.26 | 58.26 ± 61.75 | ... | 18.81 ± 16.95 | 0.58 |
| 32.06∼42.64 | −1.77 ± 0.30 | 20.71 ± 29.25 | ... | 7.67 ± 5.92 | 1.04 |
| 42.64∼52.19 | ... | ... | −2.53 ± 0.11 | 4.90 ± 0.77 | 0.79 |
| 52.19∼54.36 | ... | ... | −2.24 ± 0.12 | 9.35 ± 1.95 | 0.96 |
| 54.36∼59.76 | ... | ... | −2.33 ± 0.10 | 7.91 ± 1.00 | 1.05 |
| 59.76∼69.06 | ... | ... | −2.08 ± 0.11 | 4.75 ± 0.72 | 1.09 |
| 69.06∼89.76 | ... | ... | −2.29 ± 0.14 | 2.39 ± 0.54 | 1.04 |
| 89.76∼91.53 | ... | ... | −2.39 ± 0.19 | 5.27 ± 2.61 | 0.86 |
| 91.53∼94.31 | −0.61 ± 0.61 | 26.30 ± 14.56 | ... | 8.45 ± 7.43 | 0.95 |
| 94.31∼99.16 | ... | ... | −2.80 ± 0.27 | 2.55 ± 1.74 | 1.28 |
Table 3.
Physical parameters for GRB 181110 A.
| Top-Hat | Gaussian | Power-Law | |
|---|---|---|---|
| b | |||
| p | |||
Publisher’s Note: MDPI stays neutral with regard to jurisdictional claims in published maps and institutional affiliations. |
© 2022 by the authors. Licensee MDPI, Basel, Switzerland. This article is an open access article distributed under the terms and conditions of the Creative Commons Attribution (CC BY) license (https://creativecommons.org/licenses/by/4.0/).
Share and Cite
MDPI and ACS Style
Han, S.; Li, X.; Jiang, L.; Jin, Z.; He, H.; Wang, Y.; Wei, D. GRB 181110A: Constraining the Jet Structure, Circumburst Medium and the Initial Lorentz Factor. Universe 2022, 8, 248. https://0-doi-org.brum.beds.ac.uk/10.3390/universe8040248
AMA Style
Han S, Li X, Jiang L, Jin Z, He H, Wang Y, Wei D. GRB 181110A: Constraining the Jet Structure, Circumburst Medium and the Initial Lorentz Factor. Universe. 2022; 8(4):248. https://0-doi-org.brum.beds.ac.uk/10.3390/universe8040248
Chicago/Turabian StyleHan, Song, Xinyu Li, Luyao Jiang, Zhiping Jin, Haoning He, Yuanzhu Wang, and Daming Wei. 2022. "GRB 181110A: Constraining the Jet Structure, Circumburst Medium and the Initial Lorentz Factor" Universe 8, no. 4: 248. https://0-doi-org.brum.beds.ac.uk/10.3390/universe8040248
Note that from the first issue of 2016, this journal uses article numbers instead of page numbers. See further details here.