Dependence of Freeze-Out Parameters on Collision Energies and Cross-Sections

 ,
,  ,
,  ,
,  ,
,
Abstract
:1. Introduction
2. Methods and Models
3. Results and Discussion
4. Summary and Conclusions
- The transverse momentum spectra of pions produced in inelastic proton–proton and most central Be–Be, Ar–Sc, and Pb–Pb collisions at different energies were studied by the Blast-wave model with Boltzmann–Gibbs statistics. The results are in agreement with the experimental data measured by the NA61/SHINE and NA49 experiments at SPS energies. In addition, we extracted the kinetic freeze-out temperature , the initial temperature , the transverse flow velocity , and the kinetic freeze-out volume V.
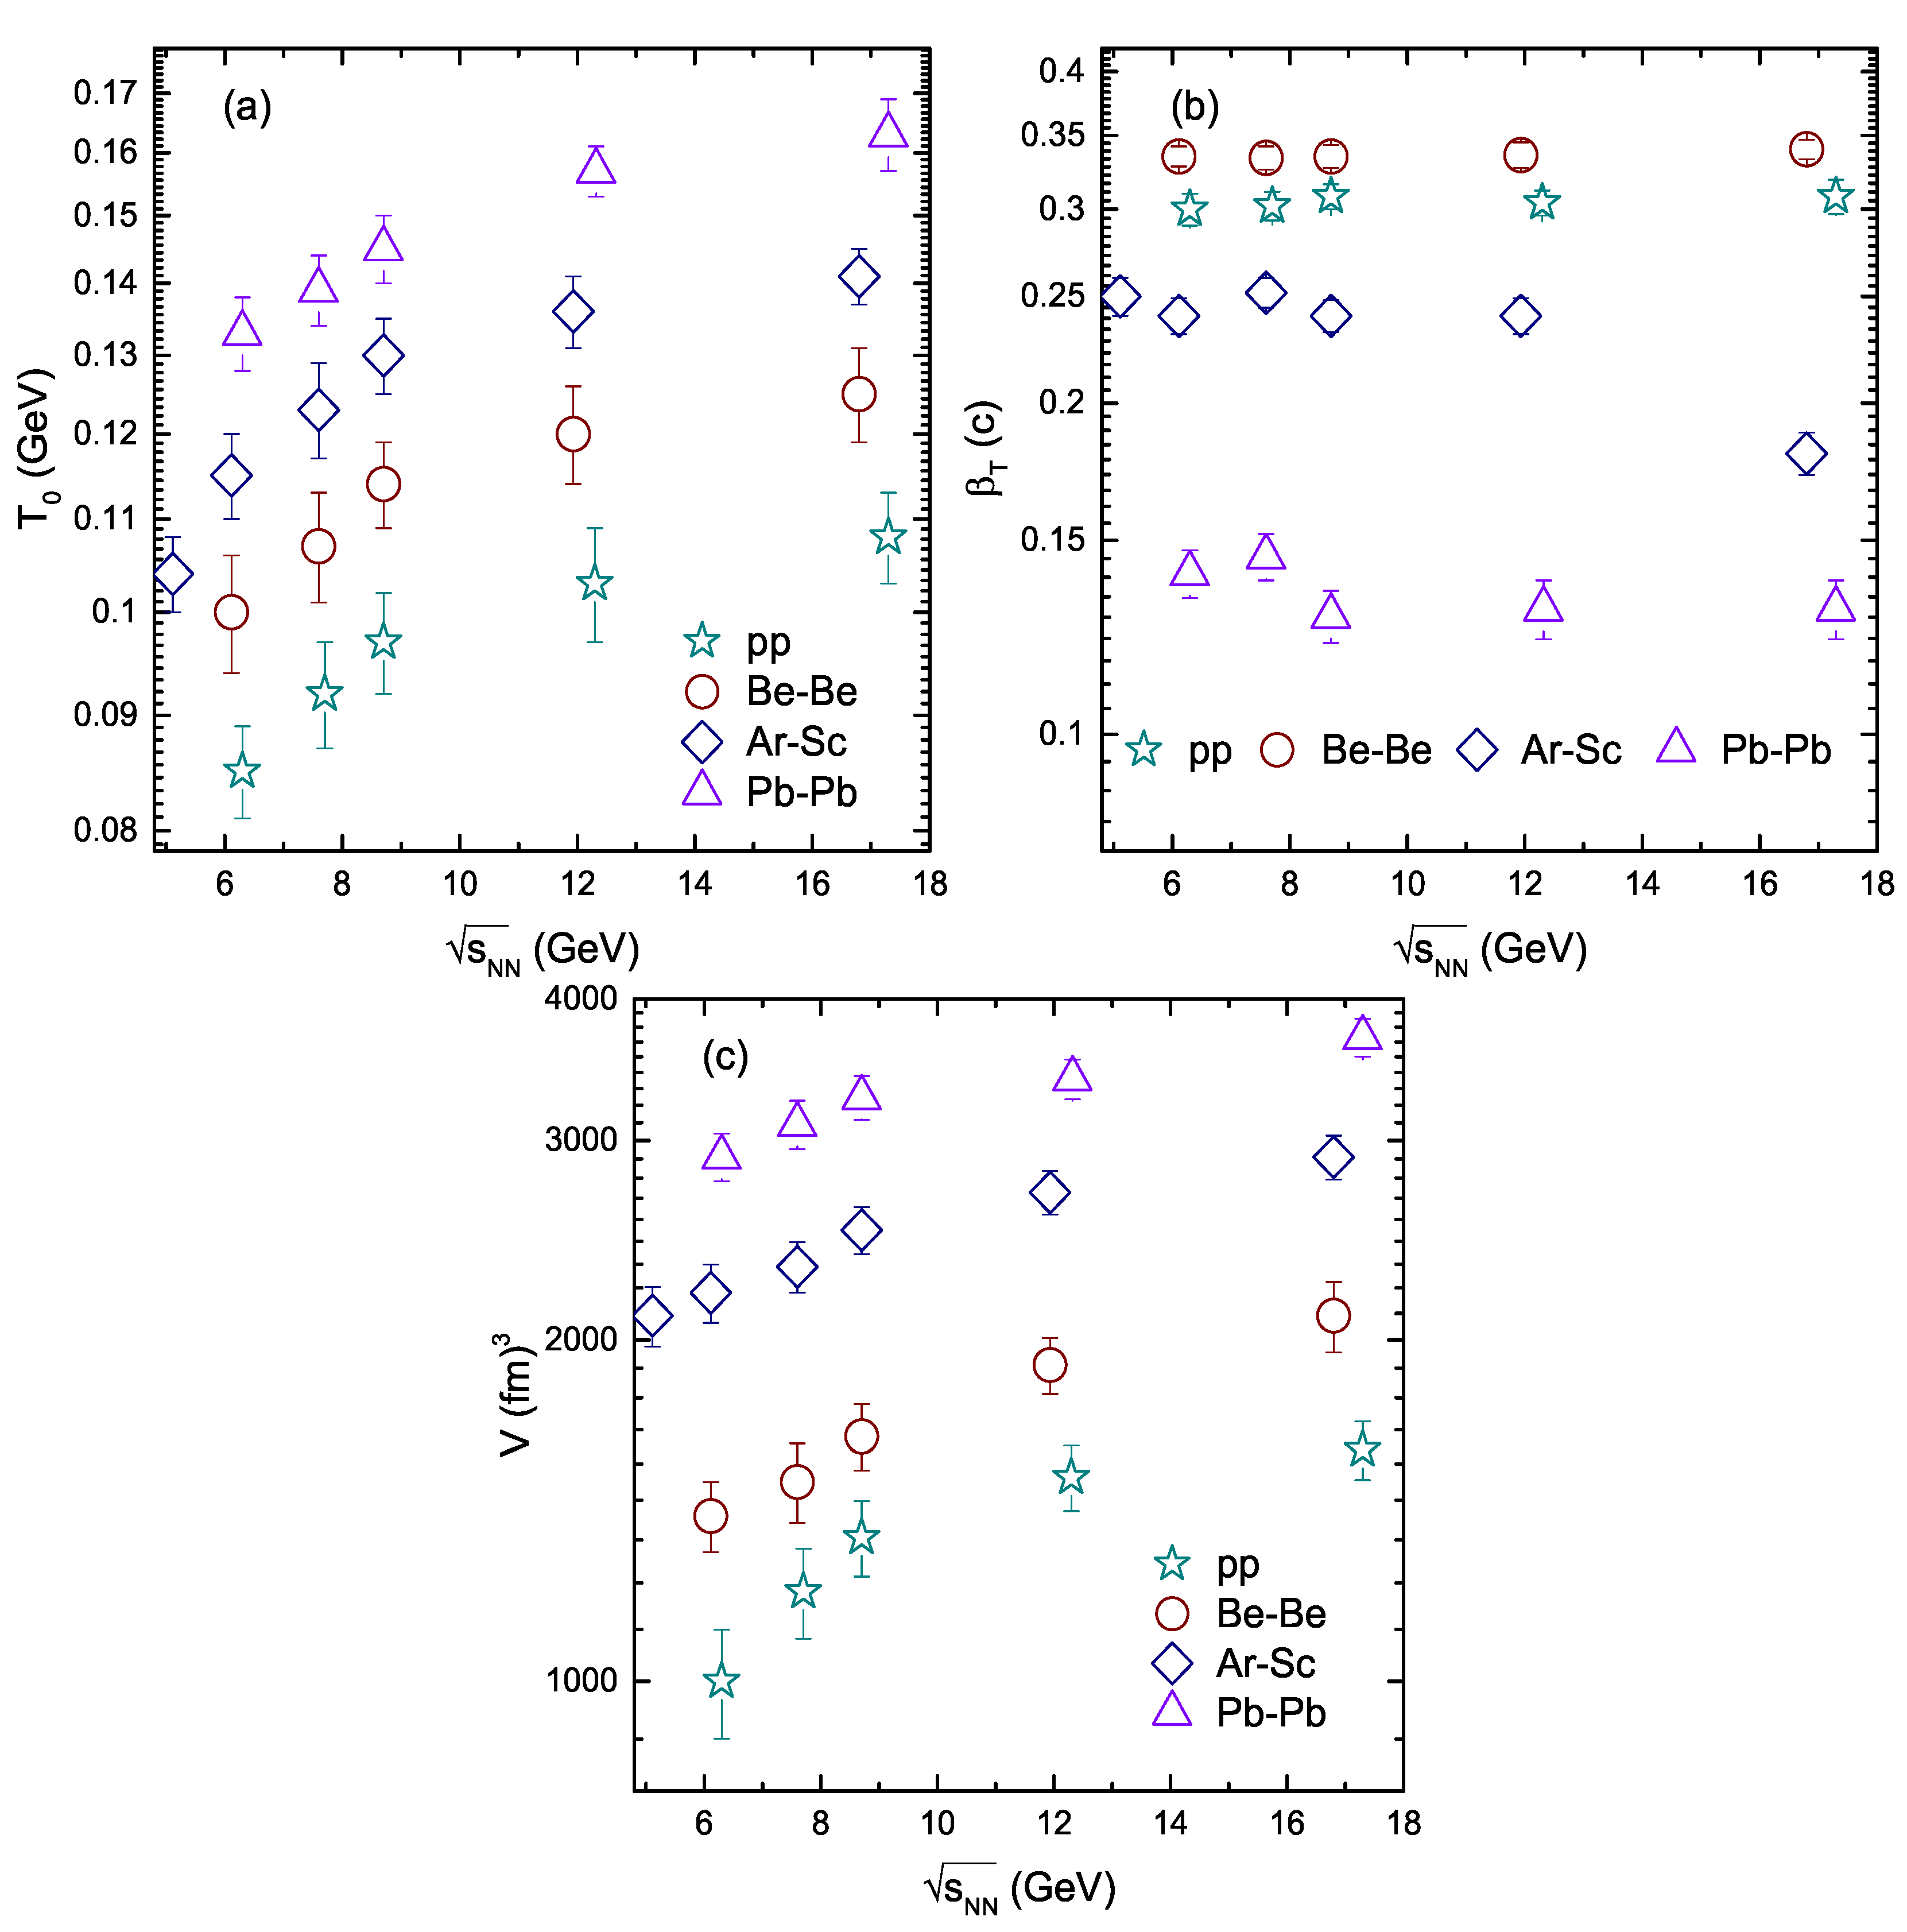
- We studied the dependence of and on collision energy and cross-section. and were found to increase with the increase in collision energy and collision cross-section. This increase is due to the transfer of more energy in the system at higher energies and in large colliding systems.
- was observed to remain constant with the increase in energy due to the invariant collective flow with increasing energy. There is no dependence of transverse flow velocity on the collision cross-section.
- V was found to increase with increasing collision energy because of the large initial bulk at higher energies, and it was also larger for large collision cross-sections. Furthermore, the mean transverse momentum increased with increasing collision energy due to a greater transfer of energy in the system at higher energies. It was also observed that mean transverse momentum was larger for the systems with large collision cross-sections because, in large collision section systems, the transfer of energy is larger.
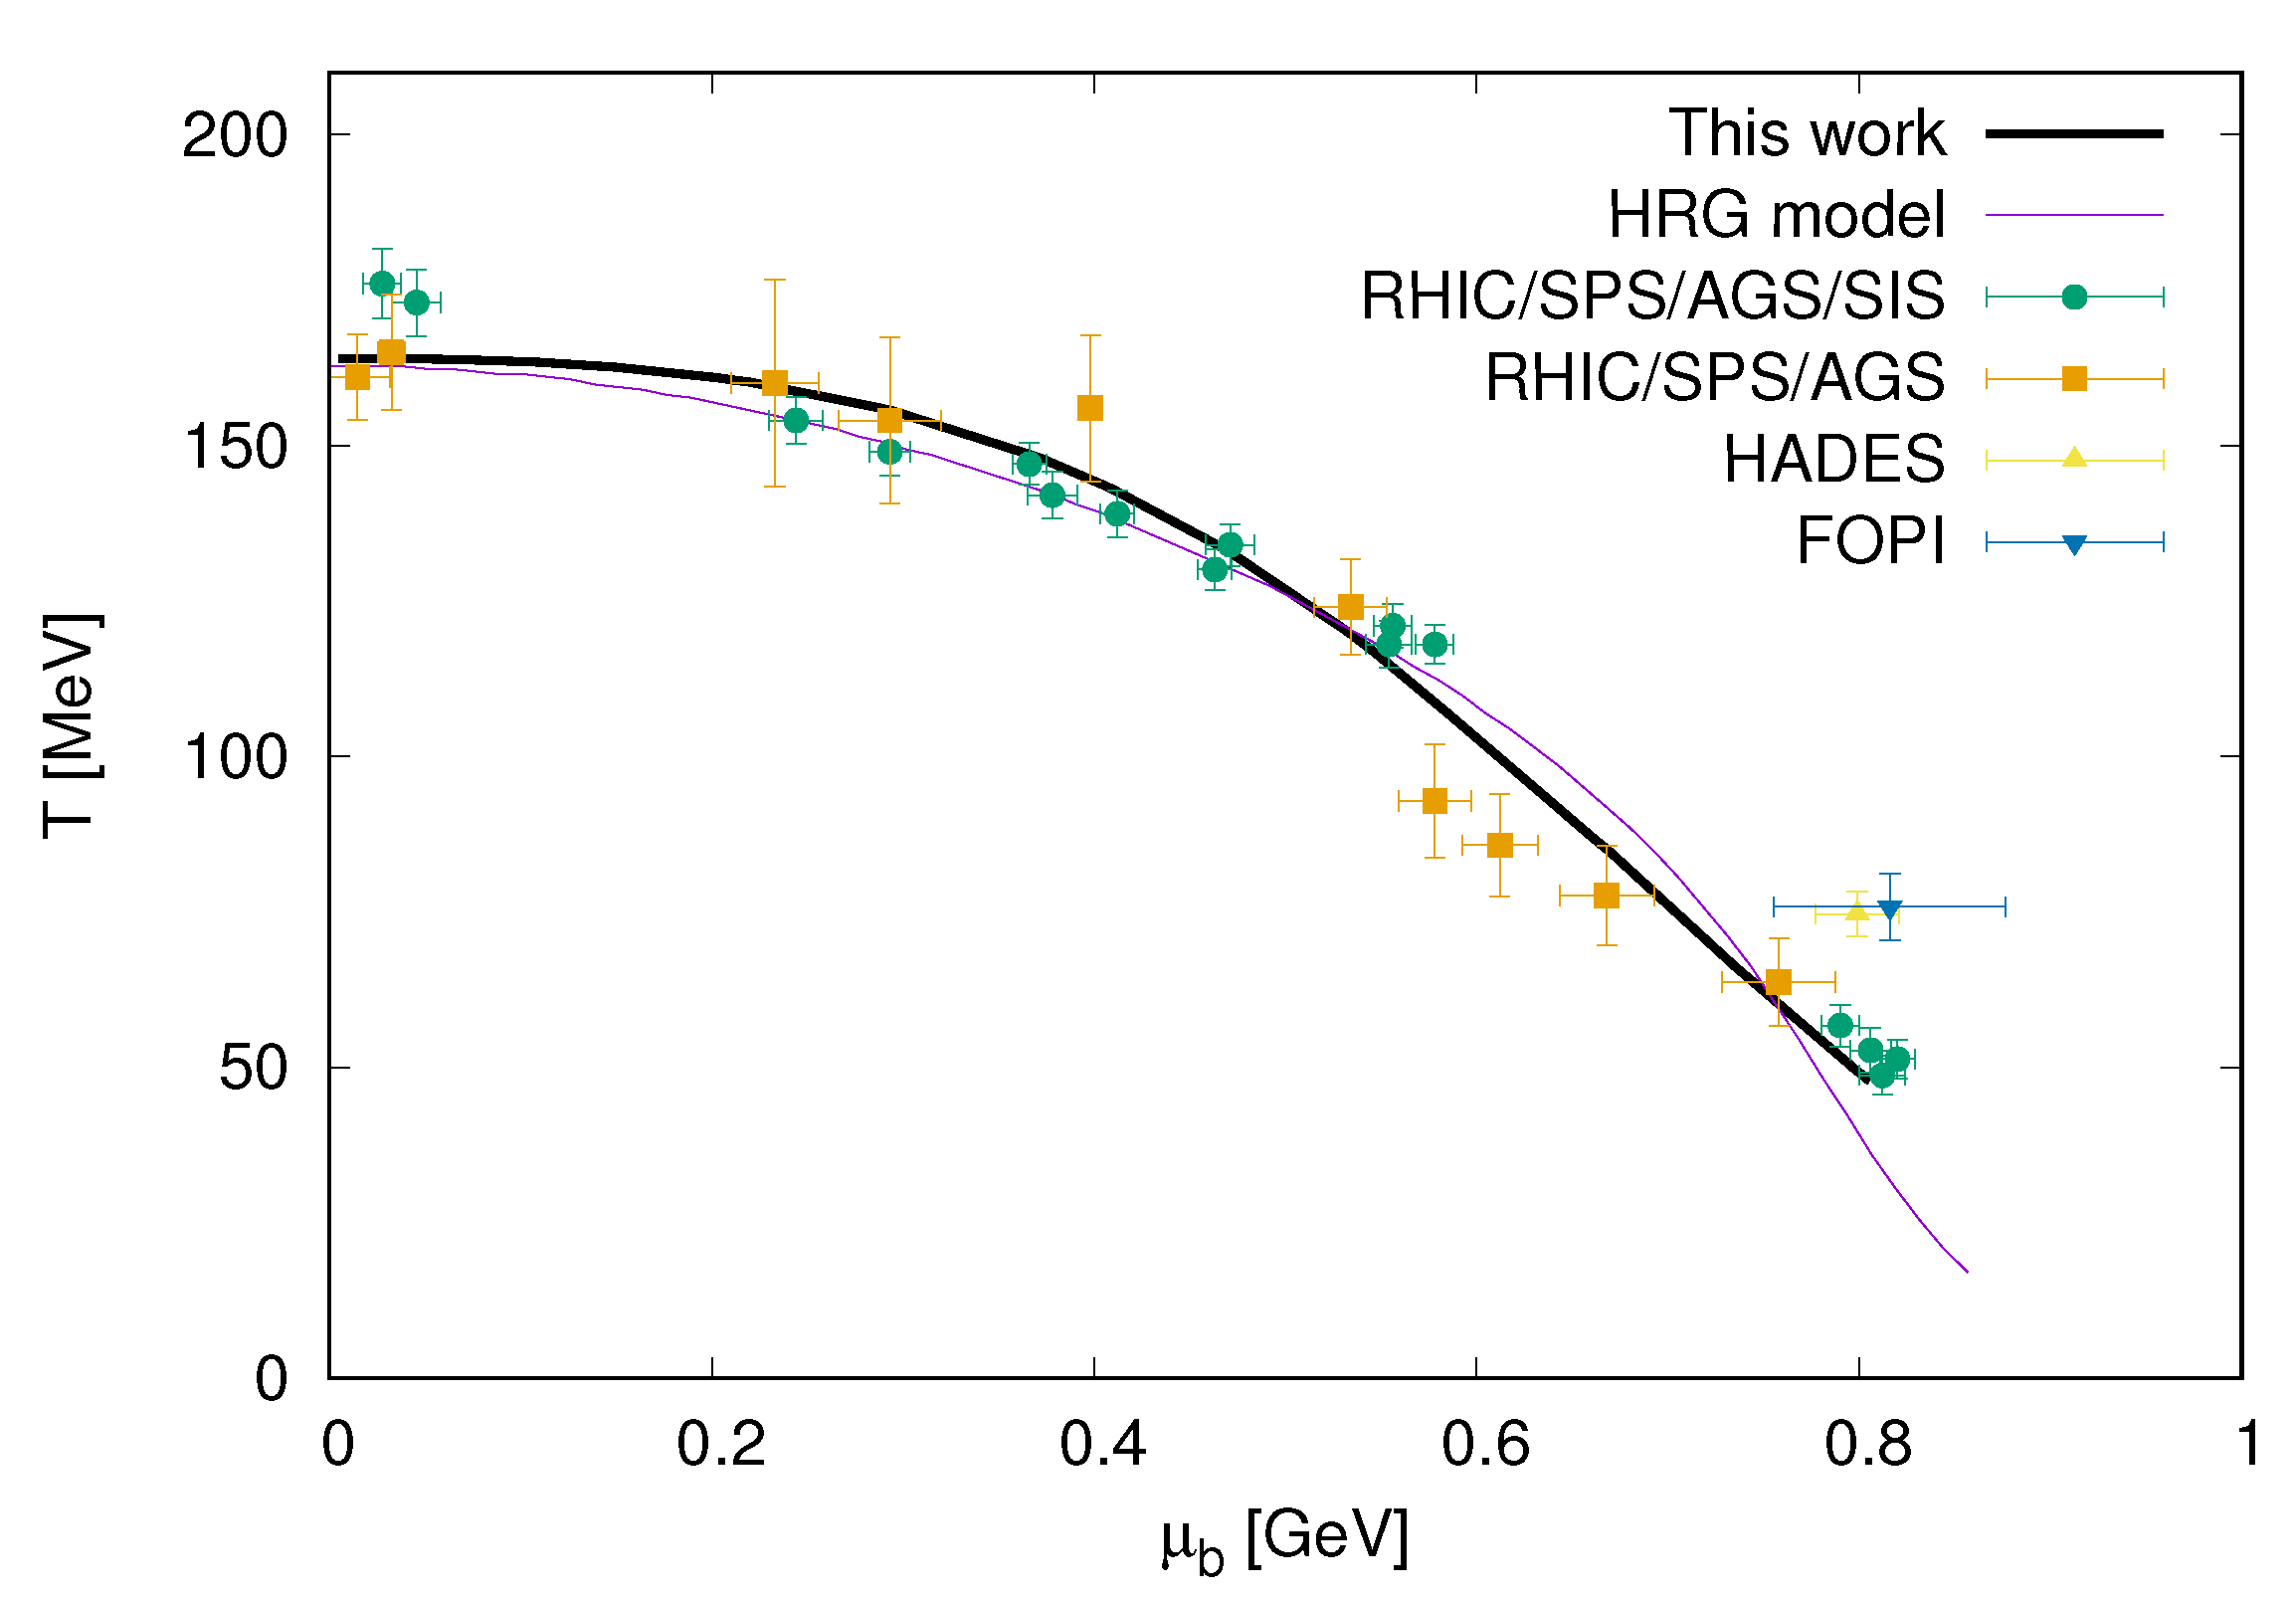
- Finally, the chemical potential and temperature show excellent agreement in comparison to the HRG model and different experimental data at the chemical freeze-out, revealing the ability of the Blast-wave model with Boltzmann–Gibbs statistics to manifest features of the chemical freeze-out.
Author Contributions
Funding
Institutional Review Board Statement
Informed Consent Statement
Data Availability Statement
Acknowledgments
Conflicts of Interest
References
- Liu, F.H.; Fakhraddin, S.; Lacey, R.A.; Sahoo, R.; Sarkisyan-Grinbaum, E.K.; Singh, B.K. Properties of Chemical and Kinetic Freeze-Outs in High-Energy Nuclear Collisions. Adv. High Energy Phys. 2018, 2018, 9184574. [Google Scholar] [CrossRef]
- Xu, J.; Ko, C.M. Chemical freeze-out in relativistic heavy-ion collisions. Phys. Lett. B 2017, 772, 290–293. [Google Scholar] [CrossRef]
- Tawfik, A.N.; Yassin, H.; Elyazeed, E.R.A. Chemical freeze-out in Hawking-Unruh radiation and quark-hadron transition. Phys. Rev. D 2015, 92, 085002. [Google Scholar] [CrossRef]
- Tawfik, A. The Influence of strange quarks on QCD phase diagram and chemical freeze-out: Results from the hadron resonance gas model. J. Phys. G 2005, 31, S1105–S1110. [Google Scholar] [CrossRef]
- Lao, H.L.; Liu, F.H.; Li, B.C.; Duan, M.Y.; Lacey, R.A. Examining the model dependence of the determination of kinetic freeze-out temperature and transverse flow velocity in small collision system. Nucl. Sci. Tech. 2018, 29, 164. [Google Scholar] [CrossRef]
- Schnedermann, E.; Sollfrank, J.; Heinz, U.W. Thermal phenomenology of hadrons from 200 to A/GeV S+S collisions. Phys. Rev. C 1993, 48, 2462–2475. [Google Scholar] [CrossRef]
- Zhang, S.; Ma, Y.G.; Chen, J.H.; Zhong, C. Production of Kaon and Λ in Nucleus-Nucleus Collisions at Ultrarelativistic Energy from a Blast-Wave Model. Adv. High Energy Phys. 2015, 2015, 460590. [Google Scholar] [CrossRef]
- Ajaz, M.; Khubrani, A.M.; Waqas, M.; Haj Ismail, A.A.K.; Dawi, E.A. Collective properties of hadrons in comparison of models prediction in pp collisions at 7 TeV. Results Phys. 2022, 36, 105433. [Google Scholar] [CrossRef]
- Abelev, B.; Adam, J.; Adamová, D.; Adare, A.M.; Aggarwal, M.M.; Rinella, G.A.; Agocs, A.G.; Agostinelli, A.; Salazar, S.A.; Ahammed, Z.; et al. Pion, Kaon, and Proton Production in Central Pb–Pb Collisions at = 2.76 TeV. Phys. Rev. Lett. 2012, 109, 252301. [Google Scholar] [CrossRef] [PubMed]
- Das, S. Centrality dependence of freeze-out parameters from the beam energy scan at STAR. Nucl. Phys. A 2013, 904–905, 891c–894c. [Google Scholar] [CrossRef]
- Das, S. Identified particle production and freeze-out properties in heavy-ion collisions at RHIC Beam Energy Scan program. EPJ Web Conf. 2015, 90, 08007. [Google Scholar] [CrossRef]
- Adamczyk, L.; Adkins, J.K.; Agakishiev, G.; Aggarwal, M.M.; Ahammed, Z.; Ajitanand, N.N.; Alekseev, I.; Anderson, D.M.; Aoyama, R.; Aparin, A.; et al. Bulk Properties of the Medium Produced in Relativistic Heavy-Ion Collisions from the Beam Energy Scan Program. Phys. Rev. C 2017, 96, 044904. [Google Scholar] [CrossRef]
- Zhang, S.; Ma, Y.G.; Chen, J.H.; Zhong, C. Beam energy dependence of Hanbury-Brown-Twiss radii from a blast-wave model. Adv. High Energy Phys. 2016, 2016, 9414239. [Google Scholar] [CrossRef]
- Chatterjee, S.; Das, S.; Kumar, L.; Mishra, D.; Mohanty, B.; Sahoo, R.; Sharma, N. Freeze-Out Parameters in Heavy-Ion Collisions at AGS, SPS, RHIC, and LHC Energies. Adv. High Energy Phys. 2015, 2015, 349013. [Google Scholar] [CrossRef]
- Luo, X. Exploring the QCD Phase Structure with Beam Energy Scan in Heavy-ion Collisions. Nucl. Phys. A 2016, 956, 75–82. [Google Scholar] [CrossRef]
- Lao, H.L.; Liu, F.H.; Li, B.C.; Duan, M.Y. Kinetic freeze-out temperatures in central and peripheral collisions: Which one is larger? Nucl. Sci. Tech. 2018, 29, 82. [Google Scholar] [CrossRef]
- Waqas, M.; Peng, G.X.; Liu, F.H. An evidence of triple kinetic freezeout scenario observed in all centrality intervals in Cu–Cu, Au–Au and Pb–Pb collisions at high energies. J. Phys. G 2021, 48, 075108. [Google Scholar] [CrossRef]
- Waqas, M.; Peng, G.X.; Liu, F.H.; Wazir, Z. Effects of coalescence and isospin symmetry on the freezeout of light nuclei and their anti-particles. Sci. Rep. 2021, 11, 20252. [Google Scholar] [CrossRef]
- Haj Ismail, A. Monte Carlo simulation of the cosmic muon charge ratio. Kuwait J. Sci. 2022, 49, 1–8. [Google Scholar] [CrossRef]
- Alba, P.; Bellwied, R.; Mantovani-Sarti, V.; Noronha-Hostler, J.; Parotto, P.; Portillo-Vazquez, I.; Ratti, C.; Stafford, J.M. Chemical freeze-out parameters of net-kaons in heavy-ion collisions. Nucl. Phys. A 2021, 1005, 121865. [Google Scholar] [CrossRef]
- Ajaz, M.; Waqas, M.; Peng, G.X.; Yasin, Z.; Younis, H.; Haj Ismail, A.A.K. Study of pT spectra of light particles using modified Hagedorn function and cosmic rays Monte Carlo event generators in proton–proton collisions at = 900 GeV. Eur. Phys. J. Plus 2022, 137, 52. [Google Scholar] [CrossRef]
- Li, L.L.; Haj Ismail, A.A.K. Study of Bulk Properties of Strange Particles in Au+Au Collisions at sNN = 54.4 GeV. Entropy 2022, 24, 1720. [Google Scholar] [CrossRef] [PubMed]
- Bugaev, K.A.; Oliinychenko, D.R.; Cleymans, J.; Ivanytskyi, A.I.; Mishustin, I.N.; Nikonov, E.G.; Sagun, V.V. Chemical Freeze-out of Strange Particles and Possible Root of Strangeness Suppression. EPL 2013, 104, 22002. [Google Scholar] [CrossRef]
- Tawfik, A.N. Equilibrium statistical-thermal models in high-energy physics. Int. J. Mod. Phys. A 2014, 29, 1430021. [Google Scholar] [CrossRef]
- Tawfik, A.N. Koppe’s Work of 1948: A fundamental for non-equilibrium rate of particle production. Z. Naturforsch. A 2014, 69, 106–107. [Google Scholar] [CrossRef]
- Karsch, F.; Redlich, K.; Tawfik, A. Thermodynamics at nonzero baryon number density: A Comparison of lattice and hadron resonance gas model calculations. Phys. Lett. B 2003, 571, 67–74. [Google Scholar] [CrossRef]
- Karsch, F.; Redlich, K.; Tawfik, A. Hadron resonance mass spectrum and lattice QCD thermodynamics. Eur. Phys. J. C 2003, 29, 549–556. [Google Scholar] [CrossRef]
- Adamovich, M.I.; Aggarwal, M.M.; Alexandrov, Y.A.; Amirikas, R.; Andreeva, N.P.; Anzon, Z.V.; Arora, R.; Avetyan, F.A.; Badyal, S.K.; Bakich, A.M.; et al. Produced particle multiplicity dependence on centrality in nucleus-nucleus collisions. J. Phys. G 1996, 22, 1469–1481. [Google Scholar] [CrossRef]
- Chatrchyan, S.; The CMS Collaboration; Khachatryan, V.; Sirunyan, A.M.; Tumasyan, A.; Adam, W.; Aguilo, E.; Bergauer, T.; Dragicevic, M.; Erö, J.; et al. Measurement of the Relative Prompt Production Rate of χc2 and χc1 in pp Collisions at =7 TeV. Eur. Phys. J. C 2012, 72, 2251. [Google Scholar] [CrossRef]
- Suleymanov, M. The meaning behind observed pT regions at the LHC energies. Int. J. Mod. Phys. E 2018, 27, 1850008. [Google Scholar] [CrossRef]
- Waqas, M.; Peng, G.X. Study of Proton, Deuteron, and Triton at 54.4 GeV. Adv. High Energy Phys. 2021, 2021, 6674470. [Google Scholar] [CrossRef]
- Cleymans, J.; Worku, D. Relativistic Thermodynamics: Transverse Momentum Distributions in High-Energy Physics. Eur. Phys. J. A 2012, 48, 160. [Google Scholar] [CrossRef]
- Tsallis, C. Possible Generalization of Boltzmann-Gibbs Statistics. J. Statist. Phys. 1988, 52, 479–487. [Google Scholar] [CrossRef]
- Biro, T.S.; Purcsel, G.; Urmossy, K. Non-Extensive Approach to Quark Matter. Eur. Phys. J. A 2009, 40, 325–340. [Google Scholar] [CrossRef]
- Zheng, H.; Zhu, L. Comparing the Tsallis Distribution with and without Thermodynamical Description in p + p Collisions. Adv. High Energy Phys. 2016, 2016, 9632126. [Google Scholar] [CrossRef]
- Ajaz, M.; Ismail, A.A.K.H.; Ahmed, A.; Wazir, Z.; Shehzadi, R.; Younis, H.; Khan, G.; Khan, R.; Ali, S.; Waqas, M.; et al. Centrality dependence of PT distributions and nuclear modification factor of charged particles in Pb–Pb interactions at SNN = 2.76 TeV. Results Phys. 2021, 30, 104790. [Google Scholar] [CrossRef]
- Liu, F.H.; Gao, Y.Q.; Tian, T.; Li, B.C. Unified description of transverse momentum spectrums contributed by soft and hard processes in high-energy nuclear collisions. Eur. Phys. J. A 2014, 50, 94. [Google Scholar] [CrossRef]
- Gao, L.N.; Liu, F.H.; Lacey, R.A. Excitation functions of parameters in Erlang distribution, Schwinger mechanism, and Tsallis statistics in RHIC BES program. Eur. Phys. J. A 2016, 52, 137. [Google Scholar] [CrossRef]
- Xie, W.J. Transverse momentum spectra in high-energy nucleus-nucleus, proton-nucleus and proton-proton collisions. Chin. Phys. C 2011, 35, 1111–1119. [Google Scholar] [CrossRef]
- Schwinger, J.S. On gauge invariance and vacuum polarization. Phys. Rev. 1951, 82, 664–679. [Google Scholar] [CrossRef]
- Wang, R.C.; Wong, C.Y. Finite Size Effect in the Schwinger Particle Production Mechanism. Phys. Rev. D 1988, 38, 348–359. [Google Scholar] [CrossRef] [PubMed]
- Wong, C.Y. Introduction to High-Energy Heavy Ion Collisions; World Scientific Publishing Co.: Singapore, 1995. [Google Scholar]
- Braun-Munzinger, P.; Redlich, K.; Stachel, J. Particle production in heavy ion collisions. In Quark-Gluon Plasma 3; World Scientific Publishing Co.: Singapore, 2003; pp. 491–599. [Google Scholar] [CrossRef]
- Abelev, B.I.; Aggarwal, M.M.; Ahammed, Z.; Alakhverdyants, A.V.; Anderson, B.D.; Arkhipkin, D.; Averichev, G.S.; Balewski, J.; Barannikova, O.; Barnby, L.S.; et al. Identified particle production, azimuthal anisotropy, and interferometry measurements in Au+Au collisions at s(NN)**(1/2) = 9.2- GeV. Phys. Rev. C 2010, 81, 024911. [Google Scholar] [CrossRef]
- Tang, Z.; Xu, Y.; Ruan, L.; van Buren, G.; Wang, F.; Xu, Z. Spectra and radial flow at RHIC with Tsallis statistics in a Blast-Wave description. Phys. Rev. C 2009, 79, 051901. [Google Scholar] [CrossRef]
- Tang, Z.; Yi, L.; Ruan, L.; Shao, M.; Chen, H.; Li, C.; Mohanty, B.; Sorensen, P.; Tang, A.; Xu, Z. Statistical Origin of Constituent-Quark Scaling in the QGP hadronization. Chin. Phys. Lett. 2013, 30, 031201. [Google Scholar] [CrossRef]
- Jiang, K.; Zhu, Y.; Liu, W.; Chen, H.; Li, C.; Ruan, L.; Tang, Z.; Xu, Z.; Xu, Z. Onset of radial flow in p+p collisions. Phys. Rev. C 2015, 91, 024910. [Google Scholar] [CrossRef]
- Dogra, S.M. Particle Production and Correlations in Ultra-Relativistic Nucleus-Nucleus Collisions. Ph.D. Thesis, Jammu University, Jammu, India, 2008. [Google Scholar]
- Petrovici, M.; Andrei, C.; Berceanu, I.; Bercuci, A.; Herghelegiu, A.; Pop, A. Recent results and open questions on collective type phenomena from A-A to pp collisions. AIP Conf. Proc. 2015, 1645, 52–60. [Google Scholar] [CrossRef]
- Adam, J.; Adamczyk, L.; Adams, J.R.; Adkins, J.K.; Agakishiev, G.; Aggarwal, M.M.; Ahammed, Z.; Alekseev, I.; Anderson, D.M.; Aoyama, R.; et al. Strange hadron production in Au+Au collisions at = 7.7, 11.5, 19.6, 27, and 39 GeV. Phys. Rev. C 2020, 102, 034909. [Google Scholar] [CrossRef]
- Gutay, L.J.; Hirsch, A.S.; Pajares, C.; Scharenberg, R.P.; Srivastava, B.K. De-Confinement in small systems: Clustering of color sources in high multiplicity p collisions at = 1.8 TeV. Int. J. Mod. Phys. E 2015, 24, 1550101. [Google Scholar] [CrossRef]
- Scharenberg, R.P.; Srivastava, B.K.; Pajares, C. Exploring the initial stage of high multiplicity proton-proton collisions by determining the initial temperature of the quark-gluon plasma. Phys. Rev. D 2019, 100, 114040. [Google Scholar] [CrossRef]
- Sahoo, P.; De, S.; Tiwari, S.K.; Sahoo, R. Energy and Centrality Dependent Study of Deconfinement Phase Transition in a Color String Percolation Approach at RHIC Energies. Eur. Phys. J. A 2018, 54, 136. [Google Scholar] [CrossRef]
- Aduszkiewicz, A.; Ali, Y.; Andronov, E.; Antićić, T.; Baatar, B.; Baszczyk, M.; Bhosale, S.; Blondel, A.; Bogomilov, M.; Brandin, A.; et al. Measurements of π±, K±, p and spectra in proton-proton interactions at 20, 31, 40, 80 and 158 GeV/c with the NA61/SHINE spectrometer at the CERN SPS. Eur. Phys. J. C 2017, 77, 671. [Google Scholar] [CrossRef]
- Acharya, A.; Adhikary, H.; Aduszkiewicz, A.; Allison, K.K.; Andronov, E.V.; Antićić, T.; Babkin, V.; Baszczyk, M.; Bhosale, S.; Blondel, A.; et al. Measurements of π− production in 7Be + 9Be collisions at beam momenta from 19A to 150AGeV/c in the NA61/SHINE experiment at the CERN SPS. Eur. Phys. J. C 2021, 80, 961. [Google Scholar] [CrossRef]
- Acharya, A.; Adhikary, H.; Allison, K.K.; Andronov, E.V.; Antićić, T.; Babkin, V.; Baszczyk, M.; Bhosale, S.; Blondel, A.; Bogomilov, M.; et al. Spectra and mean multiplicities of π− in central40Ar+45Sc collisions at 13A, 19A, 30A, 40A, 75A and 150AGeV/c beam momenta measured by the NA61/SHINE spectrometer at the CERN SPS. Eur. Phys. J. C 2021, 81, 397. [Google Scholar] [CrossRef]
- Alt, C.; Anticic, T.; Baatar, B.; Barna, D.; Bartke, J.; Betev, L.; Białkowska, H.; Blume, C.; Boimska, B.; Botje, M.; et al. Pion and kaon production in central Pb + Pb collisions at 20-A and 30-A-GeV: Evidence for the onset of deconfinement. Phys. Rev. C 2008, 77, 024903. [Google Scholar] [CrossRef]
- Afanasiev, S.V.; Anticic, T.; Barna, D.; Bartke, J.; Barton, R.A.; Behler, M.; Betev, L.; Białkowska, H.; Billmeier, A.; Blume, C.; et al. Energy dependence of pion and kaon production in central Pb + Pb collisions. Phys. Rev. C 2002, 66, 054902. [Google Scholar] [CrossRef]
- Waqas, M.; Peng, G.X.; Ajaz, M.; Khubrani, A.M.; Dawi, E.A.; Khan, M.A.; Tawfik, A. Pseudorapidity dependence of the transverse momentum distribution of charged particles in pp collisions at 0.9, 2.36, and 7 TeV. Results Phys. 2022, 42, 105989. [Google Scholar] [CrossRef]
- Waqas, M.; Peng, G.X.; Ajaz, M.; Wazir, Z.; Ismail, A.A.K.H. Decoupling of non-strange, strange and multi-strange particles from the system in Cu–Cu, Au–Au and Pb–Pb collisions at high energies. Chin. J. Phys. 2022, 77, 1713–1722. [Google Scholar] [CrossRef]
- Lao, H.L.; Liu, F.H.; Ma, B.Q. Analyzing Transverse Momentum Spectra of Pions, Kaons and Protons in p–p, p–A and A–A Collisions via the Blast-Wave Model with Fluctuations. Entropy 2021, 23, 803. [Google Scholar] [CrossRef] [PubMed]
- Tawfik, A. Chemical Freeze-Out and Higher Order Multiplicity Moments. Nucl. Phys. A 2014, 922, 225–236. [Google Scholar] [CrossRef]
- Tawfik, A. On the Higher Moments of Particle Multiplicity, Chemical Freeze-Out and QCD Critical Endpoint. Adv. High Energy Phys. 2013, 2013, 574871. [Google Scholar] [CrossRef]
- Tawfik, A. On the conditions driving the chemical freeze-out. EPL 2006, 75, 420. [Google Scholar] [CrossRef]
- Andronic, A.; Braun-Munzinger, P.; Redlich, K.; Stachel, J. Decoding the phase structure of QCD via particle production at high energy. Nature 2018, 561, 321–330. [Google Scholar] [CrossRef] [PubMed]
- Sharma, N.; Cleymans, J.; Hippolyte, B.; Paradza, M. A Comparison of p-p, p-Pb, Pb-Pb Collisions in the Thermal Model: Multiplicity Dependence of Thermal Parameters. Phys. Rev. C 2019, 99, 044914. [Google Scholar] [CrossRef]


| Collisions | Energy | (GeV) | (c) | /dof | ||
|---|---|---|---|---|---|---|
| Figure 1a | 20 GeV | 2/3 | ||||
| pp | 31 GeV | 0.2/- | ||||
| 40 GeV | 1/- | |||||
| 80 GeV | 0.03/- | |||||
| 158 GeV | 0.1/1 | |||||
| Figure 1b | 19 GeV | 1/13 | ||||
| Be–Be | 31 GeV | 5/14 | ||||
| 40 GeV | 3/14 | |||||
| 75 GeV | 8.5 | 4/14 | ||||
| 150 GeV | 1.5/14 | |||||
| Figure 1c | 13 GeV | 13/16 | ||||
| Ar–Sc | 19 GeV | 11/16 | ||||
| 30 GeV | 8/16 | |||||
| 40 GeV | 12/16 | |||||
| 75 GeV | 37/16 | |||||
| 150 GeV | 12/16 | |||||
| Figure 1d | 20 GeV | 45/12 | ||||
| Pb–Pb | 30 GeV | 36/12 | ||||
| 40 GeV | 23/10 | |||||
| 80 GeV | 12/10 | |||||
| 160 GeV | 15/10 |
Disclaimer/Publisher’s Note: The statements, opinions and data contained in all publications are solely those of the individual author(s) and contributor(s) and not of MDPI and/or the editor(s). MDPI and/or the editor(s) disclaim responsibility for any injury to people or property resulting from any ideas, methods, instructions or products referred to in the content. |
© 2023 by the authors. Licensee MDPI, Basel, Switzerland. This article is an open access article distributed under the terms and conditions of the Creative Commons Attribution (CC BY) license (https://creativecommons.org/licenses/by/4.0/).
Share and Cite
Waqas, M.; AbdelKader, A.; Ajaz, M.; Tawfik, A.N.; Wazir, Z.; Haj Ismail, A.A.K.; Luo, S.J.; Khan, H.Z. Dependence of Freeze-Out Parameters on Collision Energies and Cross-Sections. Universe 2023, 9, 44. https://0-doi-org.brum.beds.ac.uk/10.3390/universe9010044
Waqas M, AbdelKader A, Ajaz M, Tawfik AN, Wazir Z, Haj Ismail AAK, Luo SJ, Khan HZ. Dependence of Freeze-Out Parameters on Collision Energies and Cross-Sections. Universe. 2023; 9(1):44. https://0-doi-org.brum.beds.ac.uk/10.3390/universe9010044
Chicago/Turabian StyleWaqas, Muhammad, Atef AbdelKader, Muhammad Ajaz, Abdel Nasser Tawfik, Zafar Wazir, Abd Al Karim Haj Ismail, Shi Jun Luo, and Hafsa Zar Khan. 2023. "Dependence of Freeze-Out Parameters on Collision Energies and Cross-Sections" Universe 9, no. 1: 44. https://0-doi-org.brum.beds.ac.uk/10.3390/universe9010044