1. Introduction
In the last decades, there has been significant progress towards methods aimed at identifying the aspects that control the rock mass behaviour for preserving personnel safety and commercial productivity in rock mining. Thanks to technological advances, it is possible to obtain detailed information concerning morphometric measurements (e.g., changes in excavation morphologies, dimensions, and surveying of as-built layouts). Similarly, detailed 3D models of both surface and underground excavations can be easily produced. Laser Scanning (LS) and Digital Photogrammetry (DP) techniques and topographic surveying through modern Total Station (TS) and Global Navigation Satellite System (GNSS), allow for the acquisition and georeferencing of highly detailed spatial info (i.e., 3D clouds constituted by millions of points). LS and DP can be used to perform structural geological analyses and slope stability assessments of rock masses [
1,
2,
3,
4,
5,
6,
7,
8], to identify rock failure precursors [
9], for geological data collection [
10,
11,
12,
13] and to analyse an active bedrock normal fault scarp based on kinematic indicators reconstruction [
14].
Notwithstanding the advantages of remote sensing techniques, conventional in-situ surveys, such as geological and engineering-geological mapping, still provide a source of fundamental data that both validates and integrates the information possibly acquired using LS and DP. When used together, remote sensing and conventional mapping techniques allow reducing data uncertainty and provide spatial completeness, accuracy, and a better characterisation of data variability. Indeed, the reliability of rock engineering analysis depends on the quality, quantity, and interpretation of available information. Data collection and data management, indeed, are mandatory requirements in rock mechanics, and they represent the only way to decrease uncertainty.
A further application of LS and DP is represented by multitemporal analysis, since the acquisition of a large amount of data, in a very short time allows to perform accurate 3D comparison even in complex morphologies [
15,
16,
17,
18]. Multitemporal Terrestrial Laser Scanning (M-TLS), used in this study, is, therefore, a useful and capable method for the analysis of mine environments through time, helping in identifying critical areas for further rock mechanic investigations. M-TLS and subsequent 3D analysis through change detection techniques can be used for the assessment and management of the mining risk, and they are usually integrated into mine planning and design processes. This is particularly important when complex geotechnical problems are involved, highlighting areas that might be worth considering for in-depth geo-mechanical analysis.
In this context, many design structures in mining practice require detailed rock mechanics analyses using accurate data and advanced numerical tools. Stress and stability analyses, indeed, can be carried out using continuous and/or discontinuous numerical approaches, and they are currently used in the civil and mining engineering sectors due to the possibility to take account of complex rock mass deformation and failure [
19,
20,
21].
The integration of these methods was applied in this paper to an Italian underground marble mine complex composed of three different quarries named, respectively, Tacca Bianca, Fitta and Macchietta; the latter is the only active quarry and represents the case study of this paper. Field surveys started in May 2014 using geomatics, geological and engineering-geological techniques. Due to stability issues of the quarry walls, a further geomatic survey was carried out in February 2016 with the goal of measuring walls morphological variations and performing a stability analysis of the quarry. Moreover, to obtain the full extent of the whole underground marble mine complex and to use the exact morphologies and geospatial positions into numerical models, the Fitta and Tacca Bianca quarries were also considered during the second and a third LS surveys, respectively.
The use of M-TLS has allowed the realization of a change detection analysis capable of identifying modified areas within the active quarry by using the Multiscale Model-to-Model Cloud Comparison (M3C2) algorithm [
16]. This algorithm has the advantage of employing point cloud data to perform accurate change detection inspection, reducing the approximations derived from using surface meshing techniques or Digital Surface Models (DSMs).
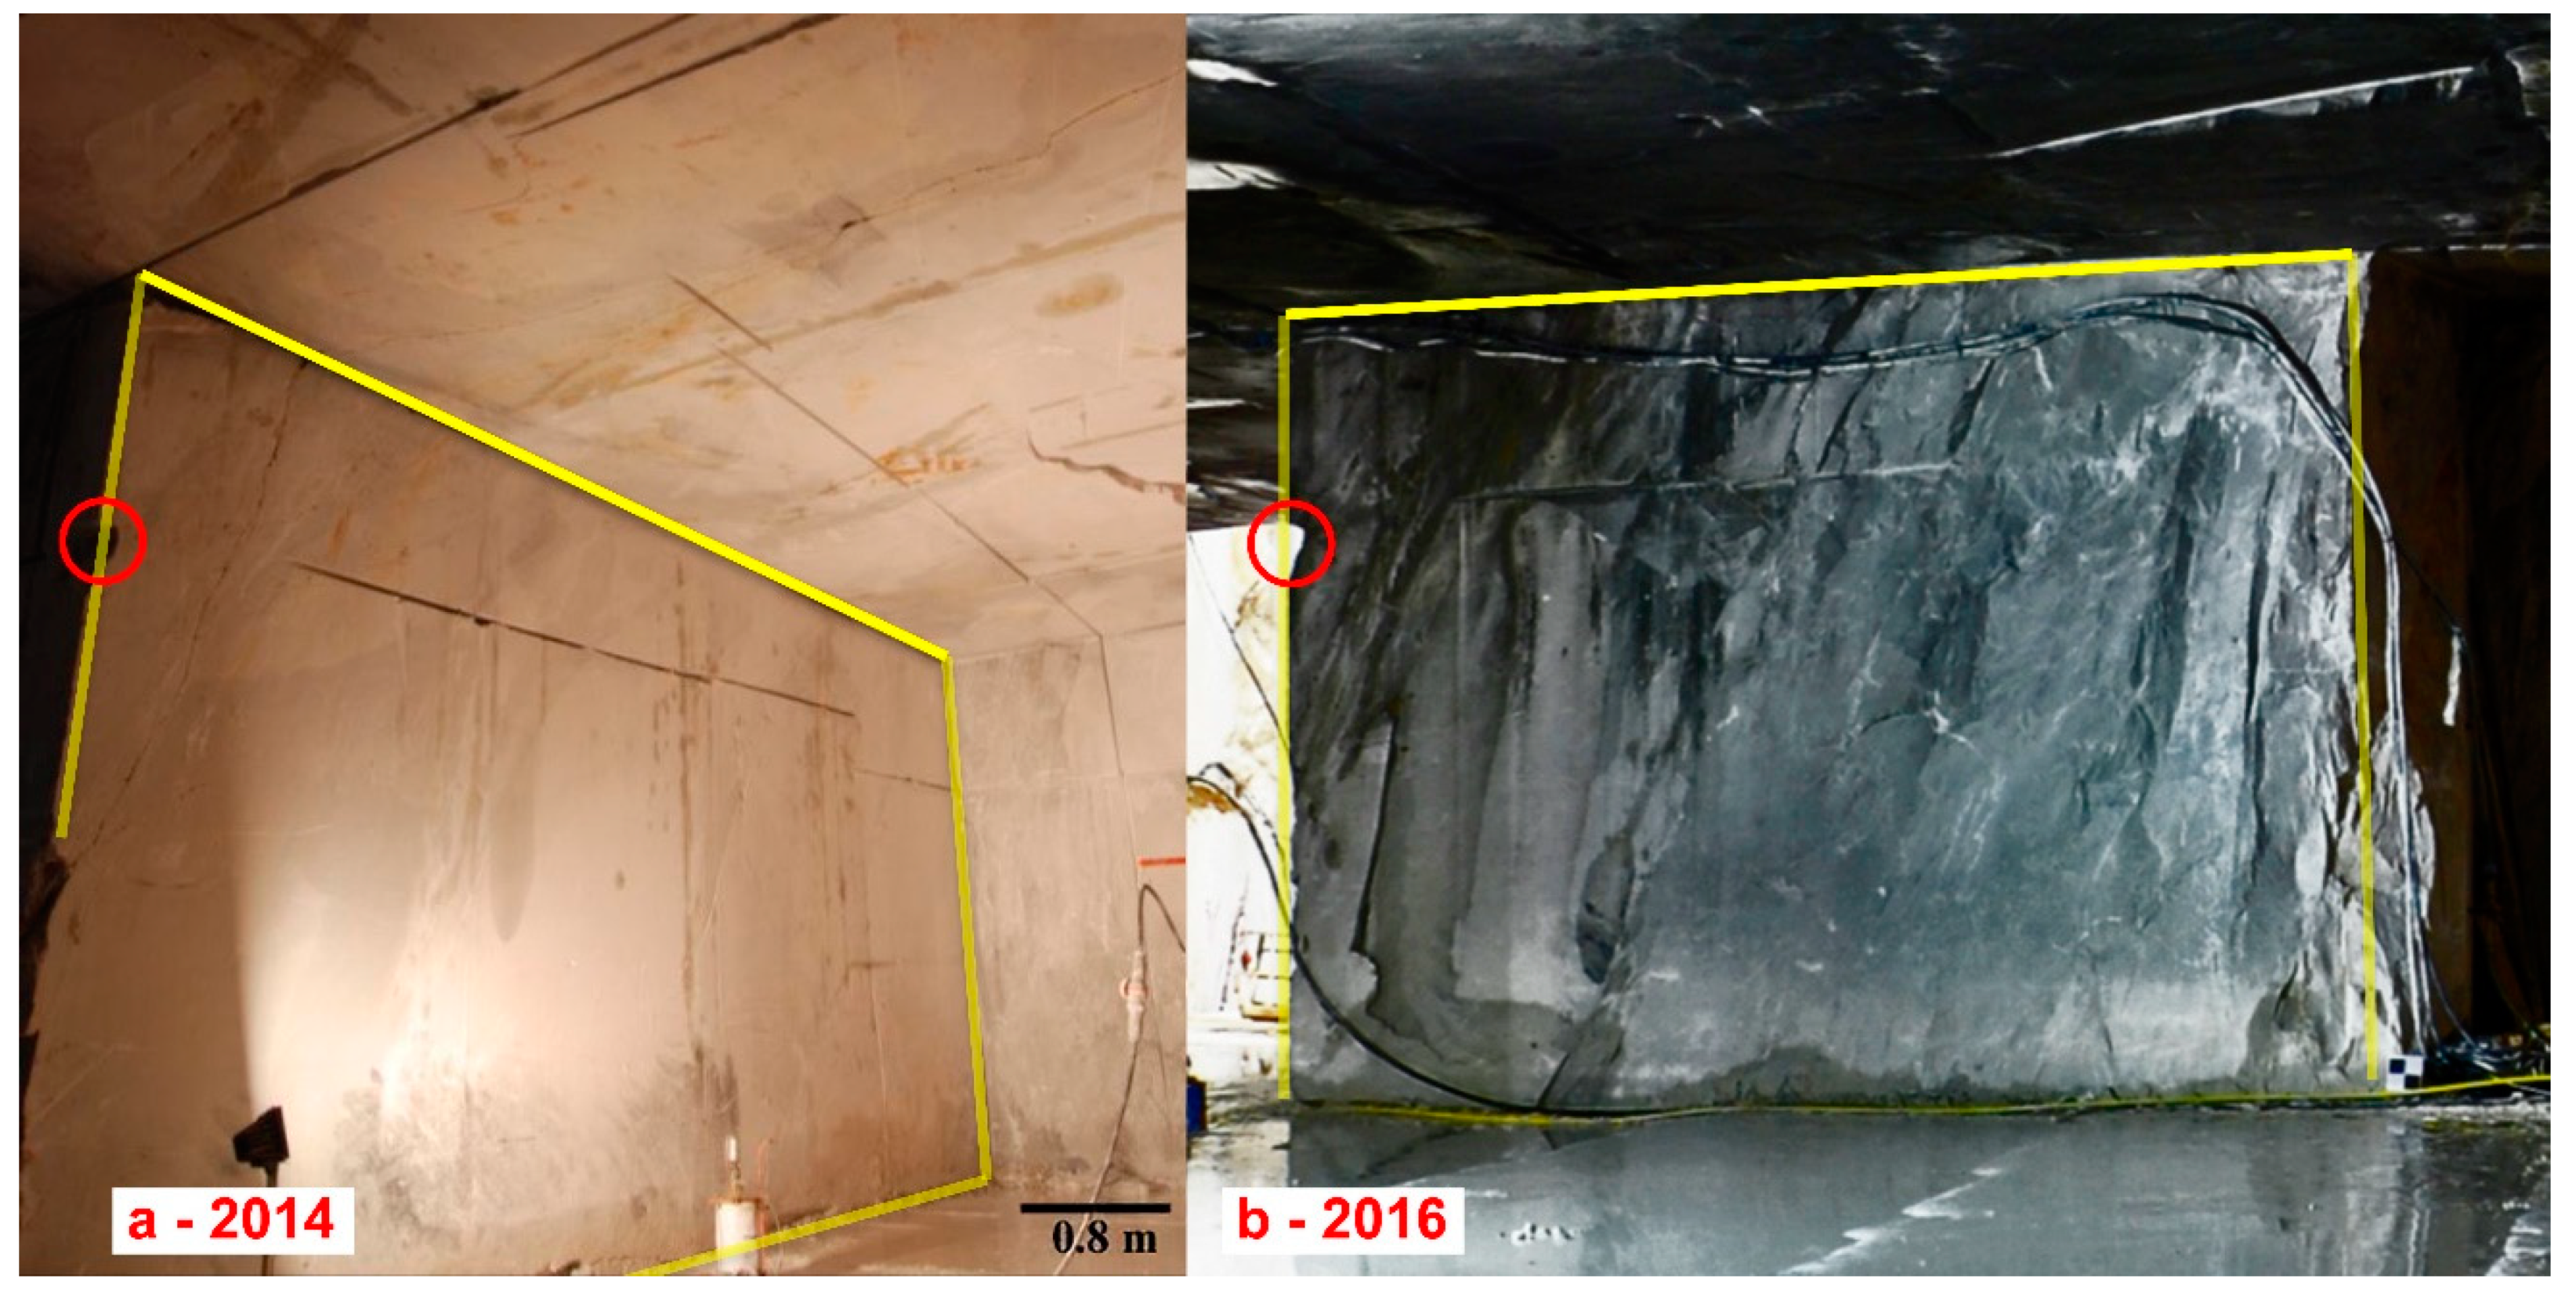
Unfortunately, a pillar spalling failure was identified inside the underground part of the Macchietta quarry (
Figure 1). Despite the focus of the paper being change detection analysis, due to this event, this area was analysed using a preliminary elastic Finite Element Method (FEM) approach to verify the possibility of critical stress concentrations that may lead to the accumulation and growth of stress-induced fractures (i.e., spalling behaviour).
2. Geographical and Geological Setting
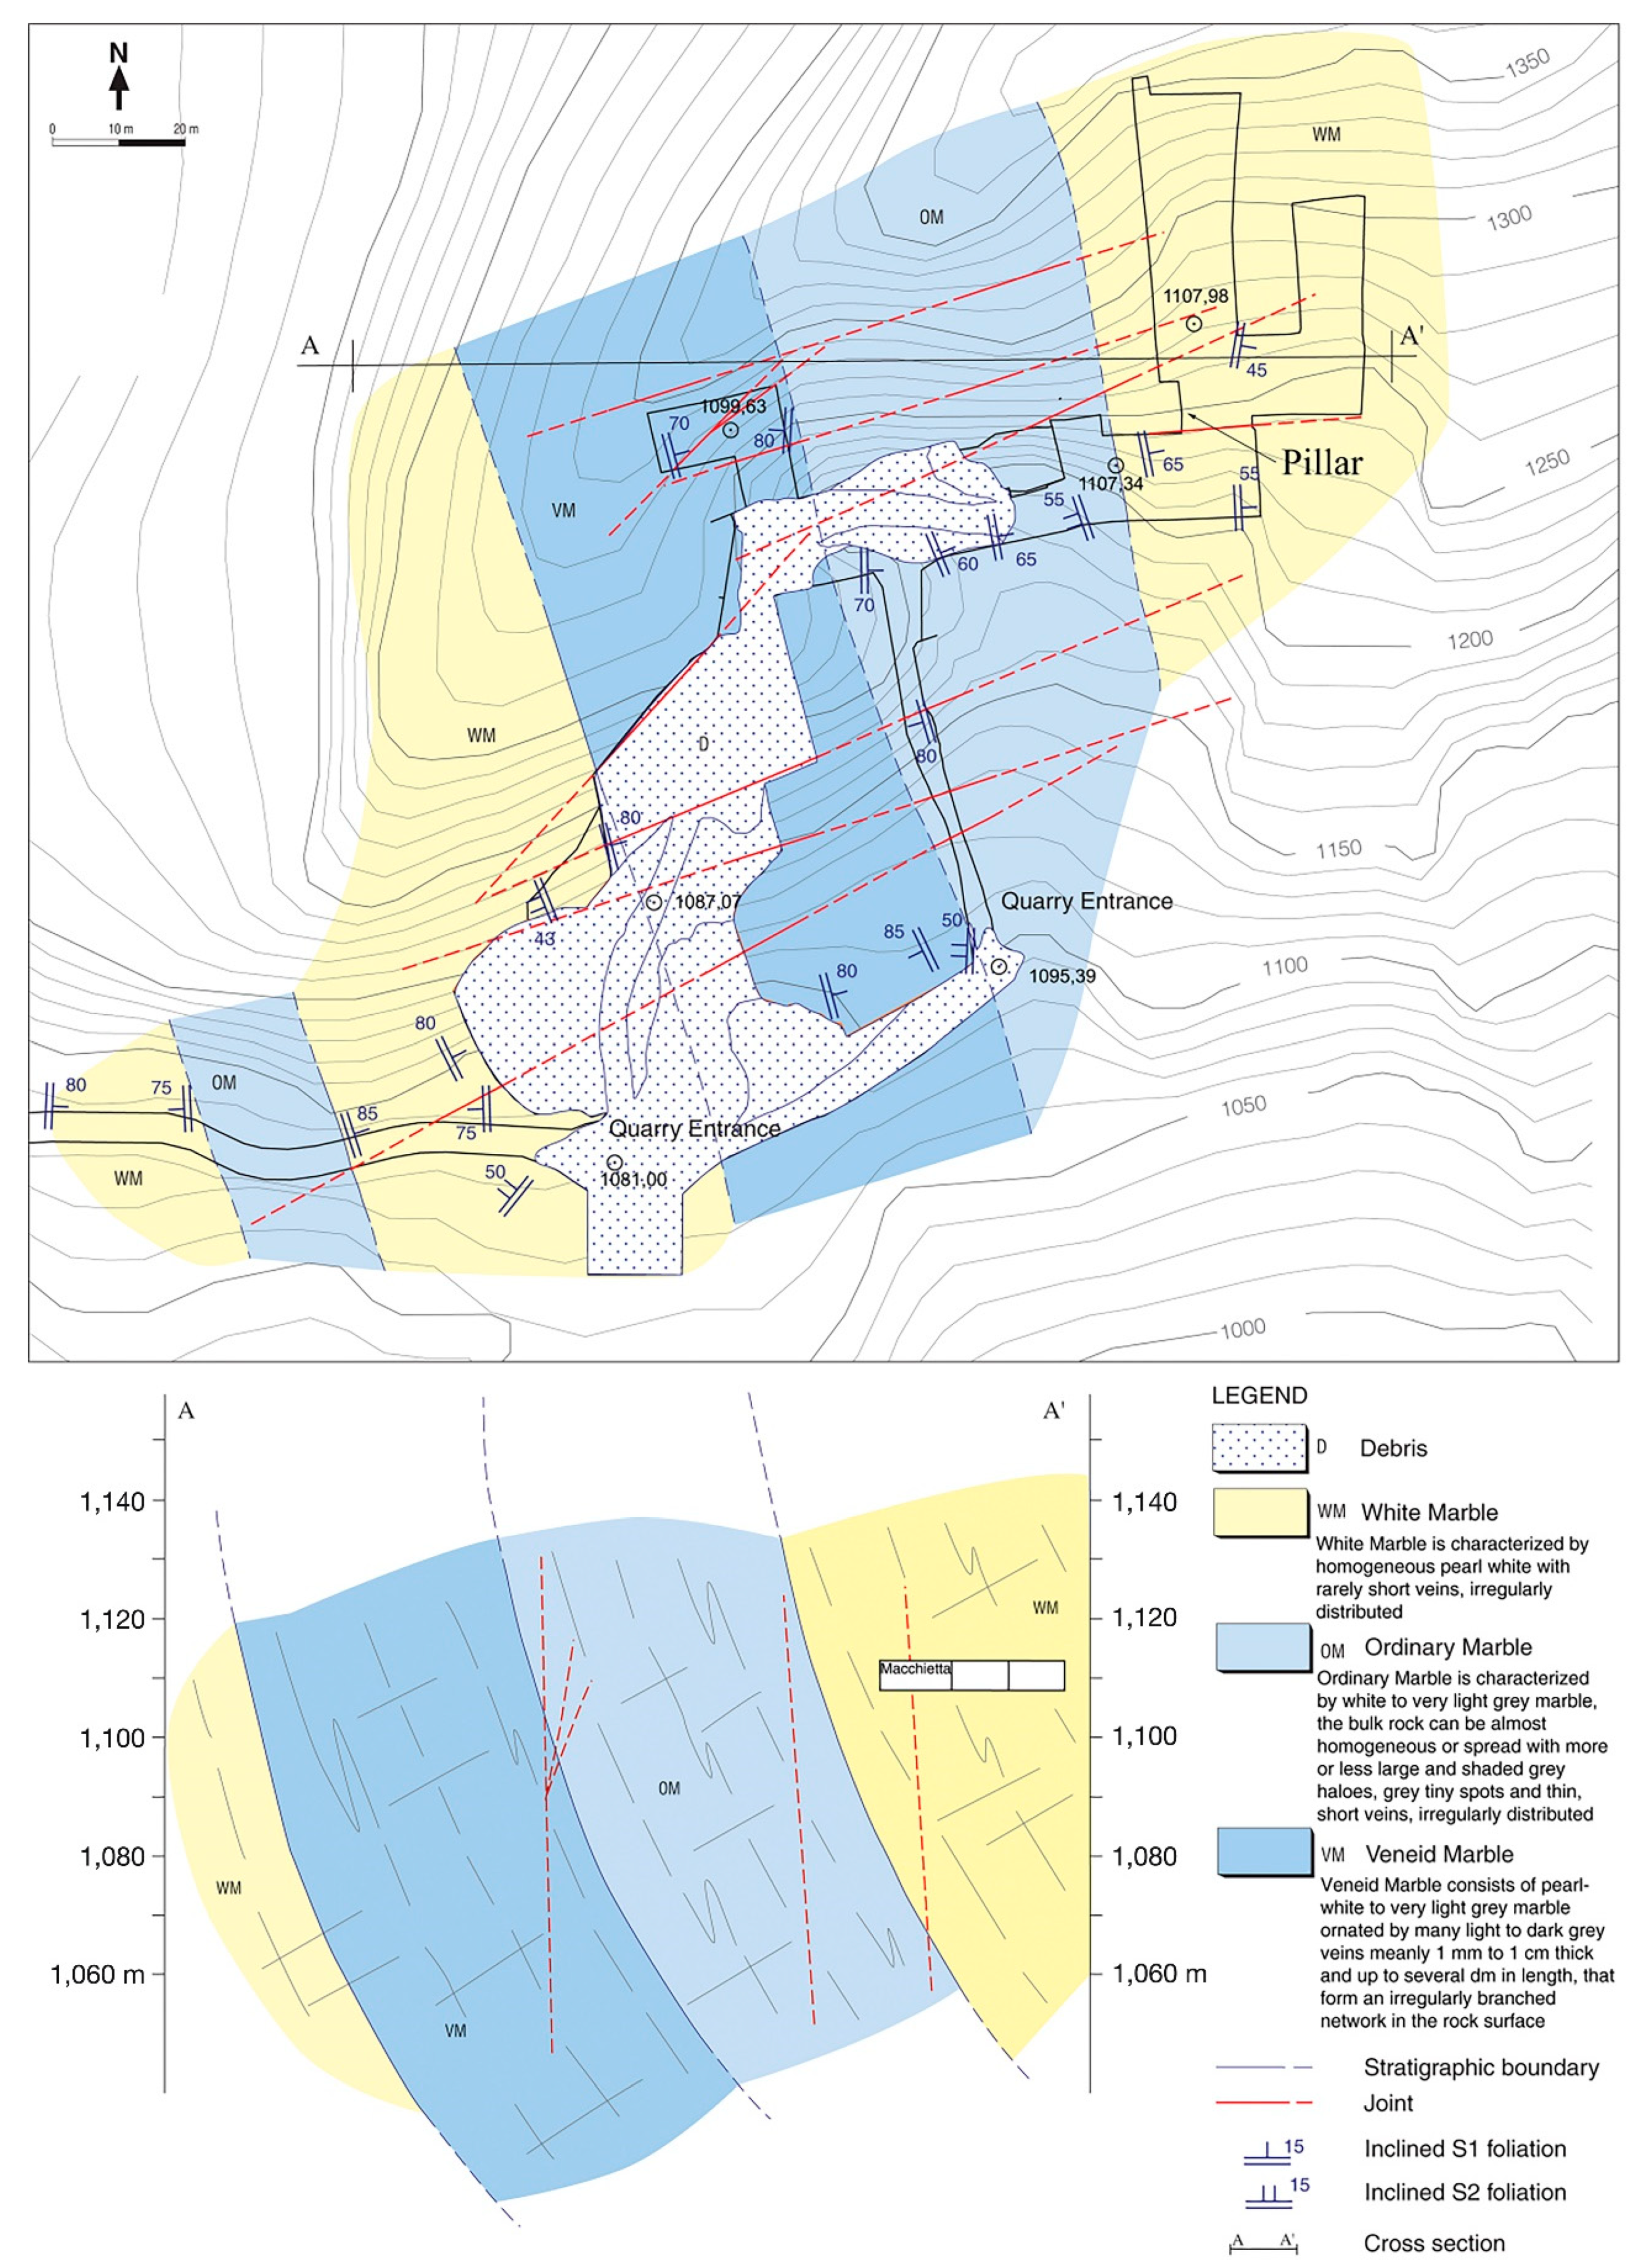
The study focuses on a marble quarry complex located in the Apuan Alps marble district in the province of Lucca (Italy). The whole area takes its name from the Tacca Bianca quarry, located almost 100 m above. The quarry understudy, named Macchietta, represents the lower and latest portion of the complex and merges itself with the intermediate and abandoned Fitta quarry. The entrance of the Macchietta quarry is located at 1080 m above sea level (m a.s.l.), with the exploitation area composed of three different tunnels with bottom and roof at 1108 and 1114 m a.s.l, respectively.
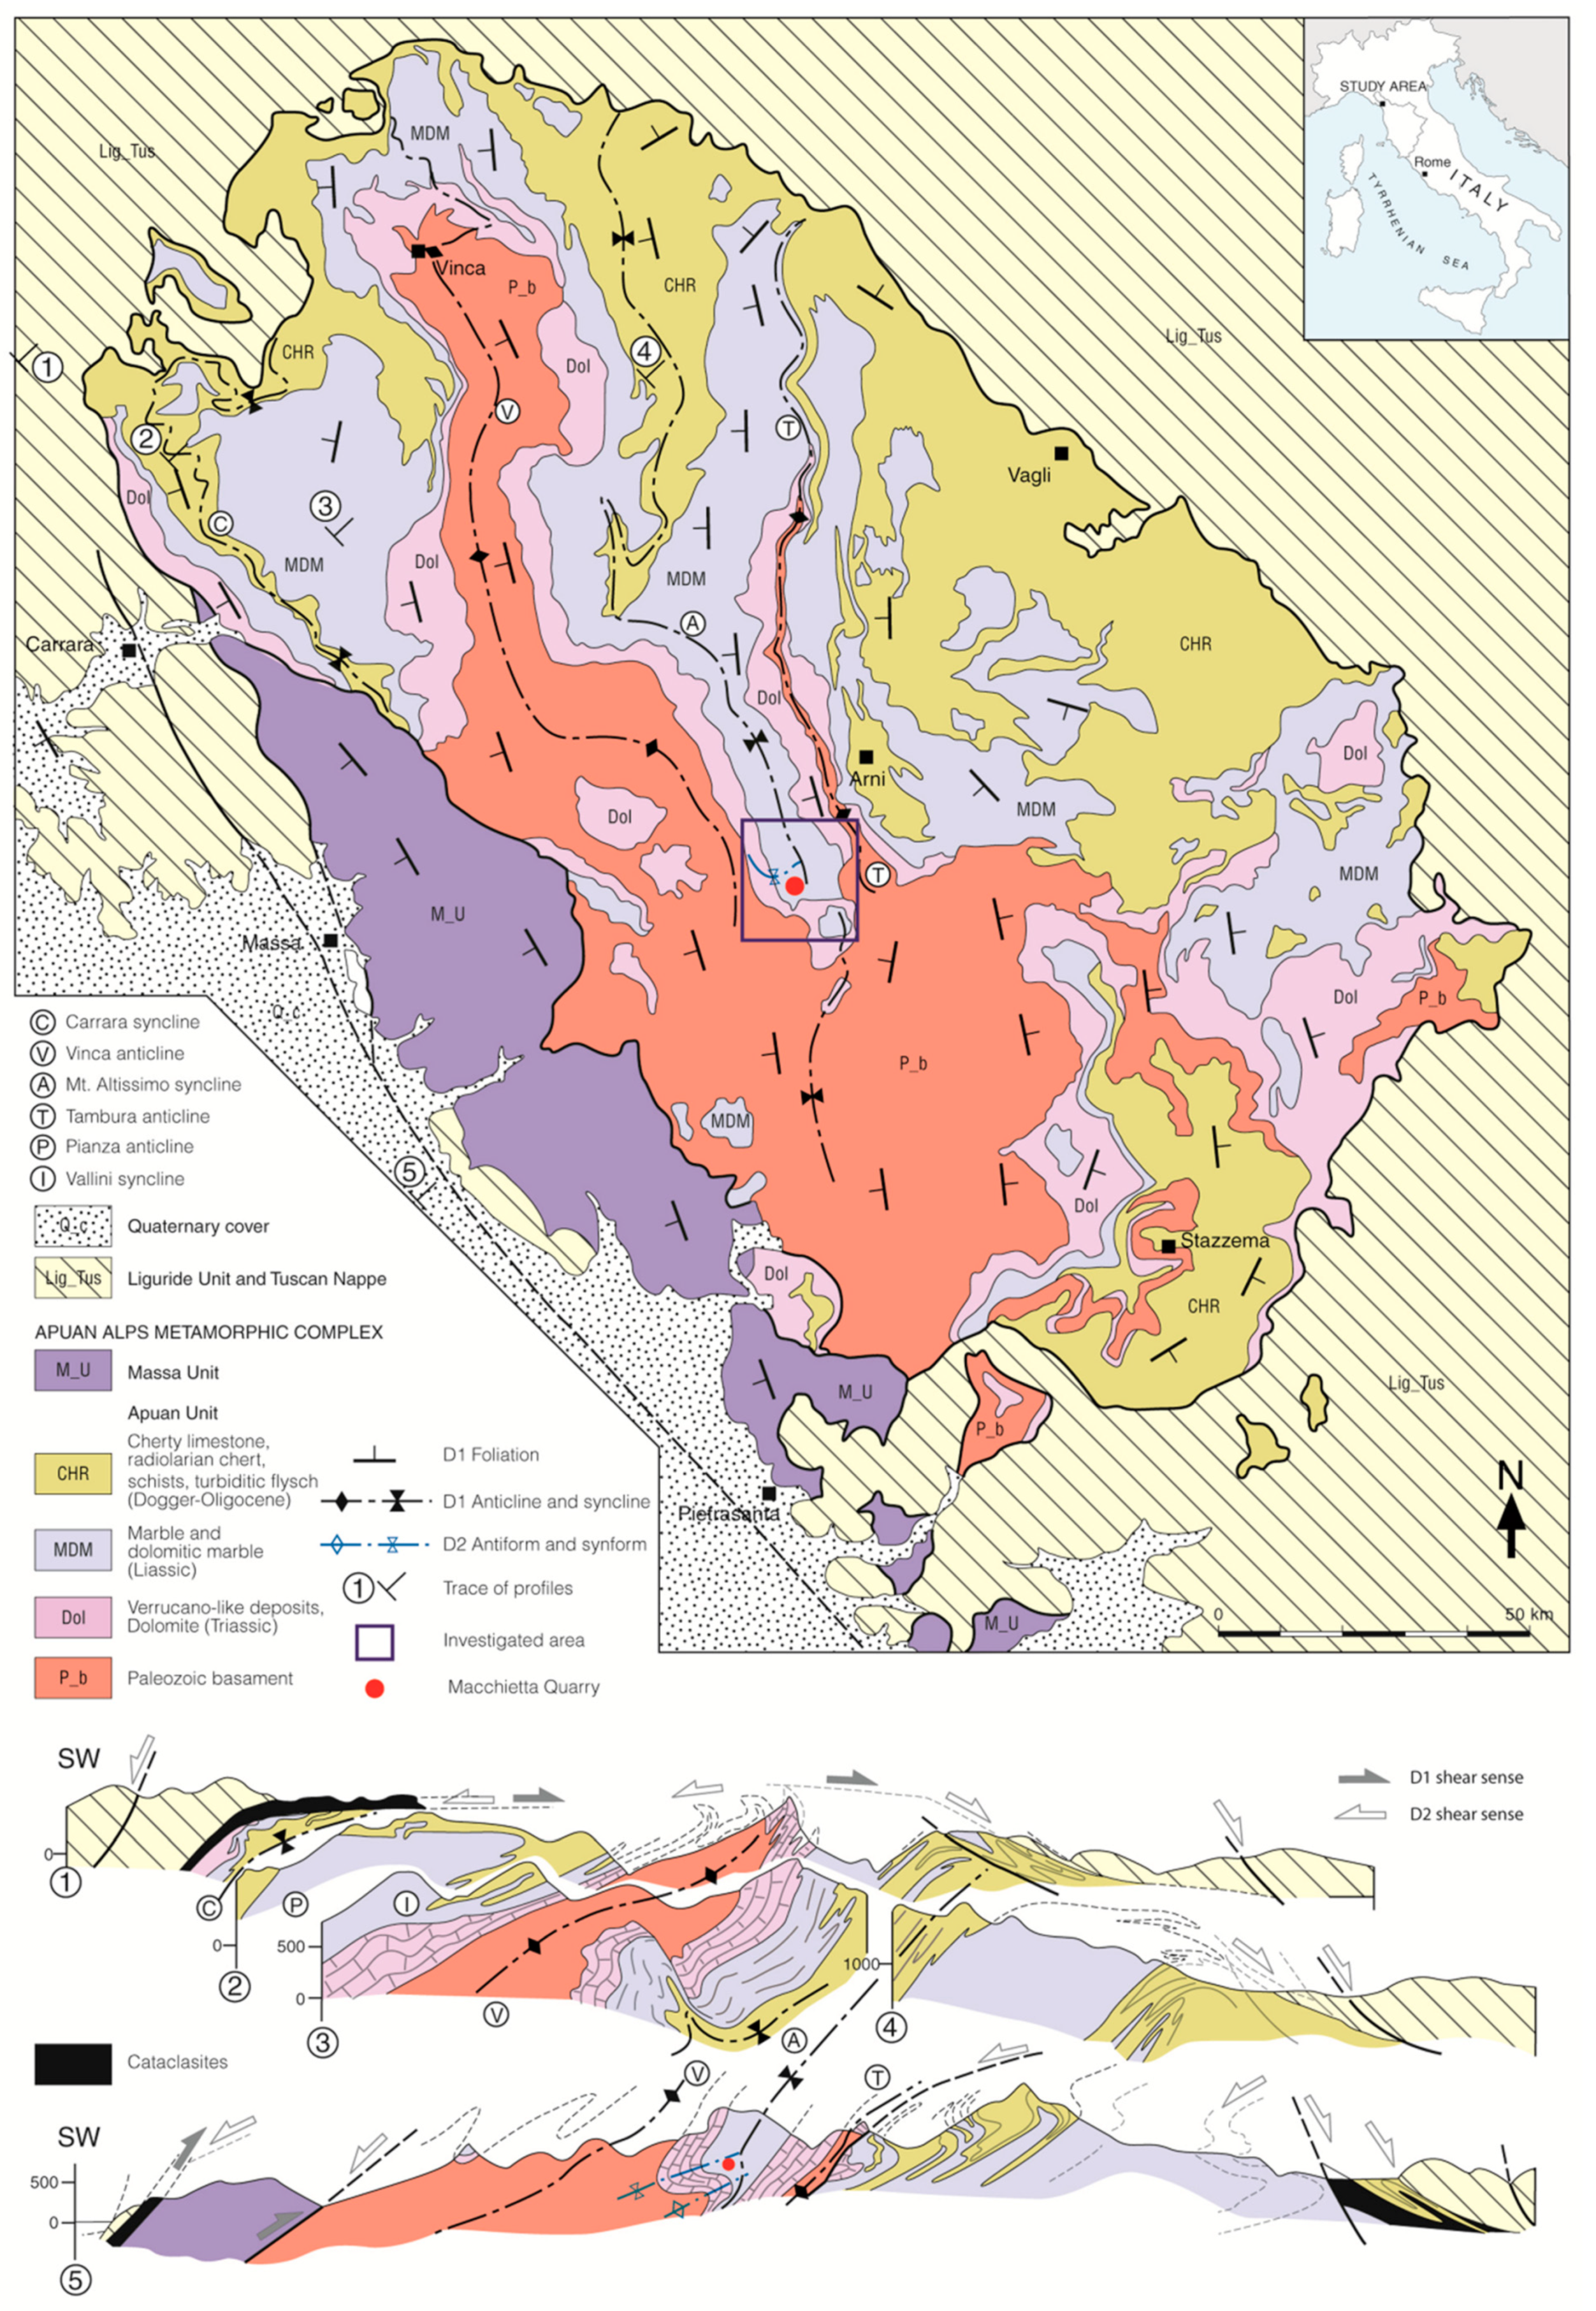
The quarry is in the S-W side of Mt. Altissimo syncline, belonging to the Apuan Unit (
Figure 2). The marble-cored of the Mt. Altissimo syncline is the result of the compressional tectonics of the Tertiary orogenesis, which can be related to the D1 phase of Carmignani and Kligfield [
22]. The compressive tectonics generated kilometric-scale to microscopic isoclinal-subisoclinal synmetamorphic folds (NE-verging), associated with a penetrative axial planar S1 foliation and L1 stretching lineation. The D1 structural setting reveals a composite origin resulting from the local superposition of two generations of structures related to successive deformation stages [
23]. The Mt. Altissimo syncline and its inverted limb are severely affected by the subsequent D2 tectonic phase of extensional characteristics. This phase generated non-cylindrical parasitic folds, with sub-horizontal axial planar crenulations, characterised by hectometric to microscopic scale (SW-verging); the partitioning of deformation was strong and controlled by the difference in rock-types inherited from the D1 strain features.
The mining area involves the youngest lithologies in the core of the Mt. Altissimo syncline ([
23,
24] and reference therein) consisting of White Marble, Ordinary Marble and Veneid Marble (Hettangian). It is characterised by the presence of foliation structures belonging to both D1 and D2 tectonic events and a widespread network of joints and faults with sub-metric to few metres long offsets (
Figure 3).
3. Methods
3.1. Geomatic Surveys
The morphology of the Macchietta quarry and its multitemporal evolution was investigated through 2 georeferenced TLS surveys. The first survey was executed in May 2014 by using a ScanStation2 device (Leica Geosystems AG, San Gallo, Switzerland),
Table 1. The scanner was alternated with a Nikon
TM D80 digital camera to acquire high-resolution images later aligned to the point cloud using methods already described in [
6]. Considering the complex shape of the quarry and the need to minimise shadows in the data, 9 laser stations were executed (2 of which were outside of the underground quarry) with a scanning spatial resolution set to 0.05 m at a distance of 50 m.
During the TLS survey, a conventional topographic field survey, using 2 GNSS geodetic receivers and a reflectorless TS, was carried out in order to register and to georeference, with adequate spatial accuracy, the resultant point clouds. A total of 57 targets, acting as physical constraints in the roto-translation of point clouds, were placed uniformly over the scan scenes (at least 5 targets for each scan with the goal of limiting errors and improving accuracy) and measured using the TS with millimetric accuracy. Five High-Definition Surveying (HDS) targets were screwed on metal plates solidly and permanently fixed on the rock walls in unserved external quarry areas in a way it was possible to re-measure them during the further TLS surveys. Two GNSS receivers, operating in static modality and recording continuous signals from the satellite constellation for more than 3 h, were located in the external service area of the underground quarry and used to obtain the geographic coordinates of the origin of the TS survey and its 0-azimuth direction. Therefore, the TS survey had origin in the vicinity of the GNSS device (external service area) and continued inside the underground quarry by using traditional topographic techniques (i.e., Intersection Method).
By means of a topographic intersection using the TS, a millimetric error was achieved when measuring the 5 HDS targets of the permanent network in February 2016. In this way, similarly as for the 2014 survey, a series of 37 targets were uniformly distributed within the quarry areas and measured by using a TS with the goal of georeferencing the new point cloud and to register it to the previous one (year 2014-point cloud).
During the second TLS survey, a Trimble
TM TX8 device was used (
Table 1), and the Fitta quarry was included in the scanned areas. The scanner, in this case, was alternated with a Nikon
TM D7100 digital camera with the goal of acquiring co-axial photos to be used for point cloud texturing. Point clouds were measured from eight different scanning positions underground, with the scanning resolution set to 0.01 m at a distance of 50 m (standard mode).
The Tacca Bianca quarry was surveyed following the same devices and approaches used during the second survey. A total of 14 scans were realised, 4 of which were outside of the underground mine. The scanning resolution was set to 0.01 m at a distance of 50 m (standard mode).
3.2. Change Detection Analysis
The M3C2 plug-in of CloudCompare open-source software was used to perform an accurate change detection analysis directly using the point clouds acquired in 2 different periods [
16]. The plug-in computes the local distance (L
M3C2(i)) between 2 point clouds along the normal surface direction only if it intersects any points on the final point cloud. Additionally, the algorithm estimates a confidence interval at 95% (LOD
95%(d)) based on Gaussian statistics (Equation (1)) for each distance in such a way to know if a significant change was detected or not. The distance accuracy and the reliability of the resulting change depend on point the cloud roughness (σ
i) and registration error (reg).
Equation (1) is function of “reg” and local cloud roughness σ1 and σ2 computed on the two sub-clouds n1 and n2 at the projection scale “d” used to measure the distance between the reference and compared point clouds. The test was statistically significant if the detection value (LOD95%(d)) was shorter than the measured distance (LM3C2(d)), with n1 and n2 greater than 4. Conversely, the LOD95%(d) value was considered non-significant if the level of detection overcame the measured distance.
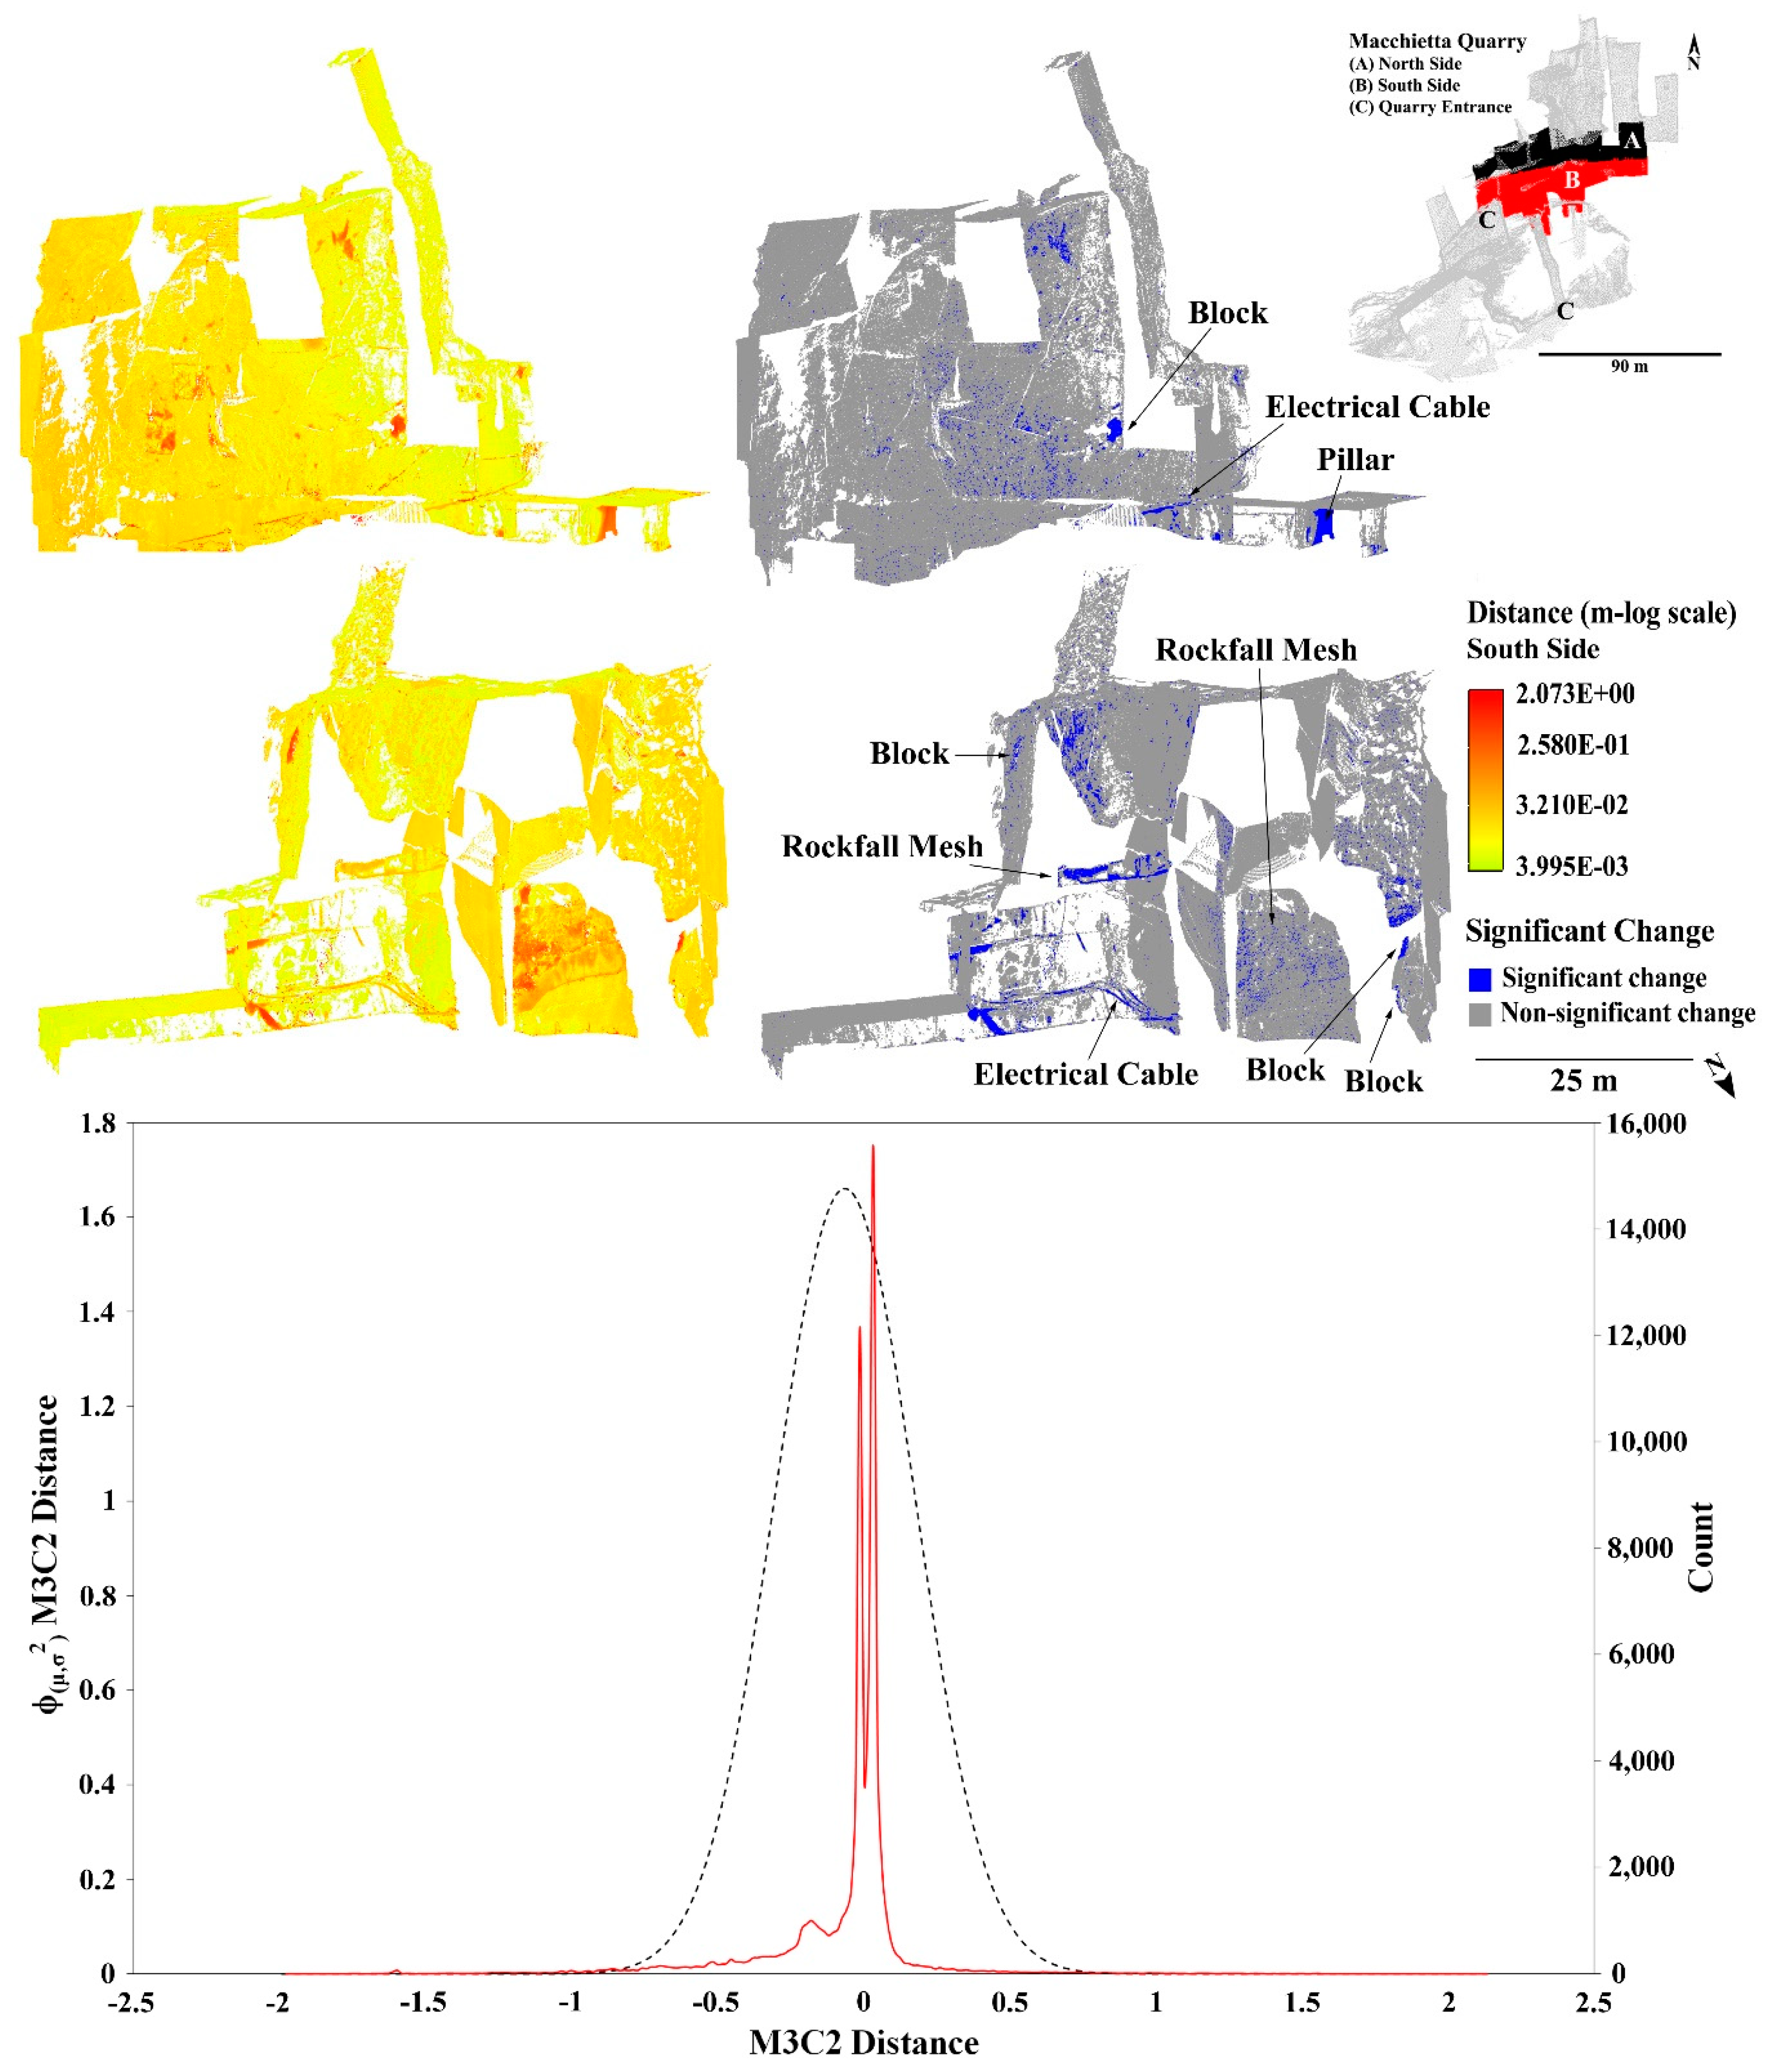
The change detection analysis for the Macchietta quarry data followed 2 steps: (1) analysis of the areas changed in time to identify valid model scenarios; (2) high precision measurement of morphological variations of the identified failure.
3.2.1. Step 1: Identification of Valid Model Scenarios
The change detection analysis was carried out comparing several portions of the point clouds. Due to both morphological complexity of the quarry walls and normal computation influence on the LM3C2(i) value, the quarry was segmented into 68 homogenous areas (sub-parallel point cloud pairs).
The point cloud generated in 2014 was generally used as a reference due to its higher volume density (1270.49 pts/m
3), whereas the point cloud acquired in 2016 was used as the compared cloud (1243.68 pts/m
3). Only in specific cases the split point cloud from 2016 was used as a reference because of a local higher density. Furthermore, the point clouds were sub-sampled at 0.05 m and cleaned up, removing machines, workers and tools (a further detailed editing was necessary during the second step analysis). Each pair of point clouds was run separately to use different values of normal scale, projection scale and maximum length of the cylinder (
Table 2). The normal scale (D in
Table 2) corresponds to the diameter of a disk centred in a given core point “i”. The disk comprises neighbour points, utilised to automatically fit a plane from which a normal vector is defined [
16]. A uniform normal scale, or a range of normal scales, can be iteratively applied to the considered point cloud. The orientation of the normal (i.e., vertical or horizontal) can be also selected. “d” in
Table 2 is the diameter of a cylinder, which intersects the clouds under comparison and, going through a given point “i”, it has the major axis oriented along the normal vector. The cylinder separates 2 subsets from the clouds, whose mean distribution gives their average positions, i
1 and i
2. By this method, the local distance between the point clouds corresponds to the length of the major axis segment between i
1 and i
2. The length standard deviation estimates the point cloud roughness along the normal direction. The max cylinder depth corresponds to the magnitude of difference between the compared point clouds. In some cases (e.g., missing blocks due to excavation activities), it was necessary to adjust the cylinder maximum length to increase the computational intensity of difference between the 2 clouds. For each pair of point clouds, a properly orientation of the normal was used and a total “reg” value of about 0.005 m was calculated; this value was obtained by considering the propagation of the mean absolute errors computed for both the 2014 (mae
2014) and 2016 TLS data (mae
2016) as it follows ([
26]–Equation (2)):
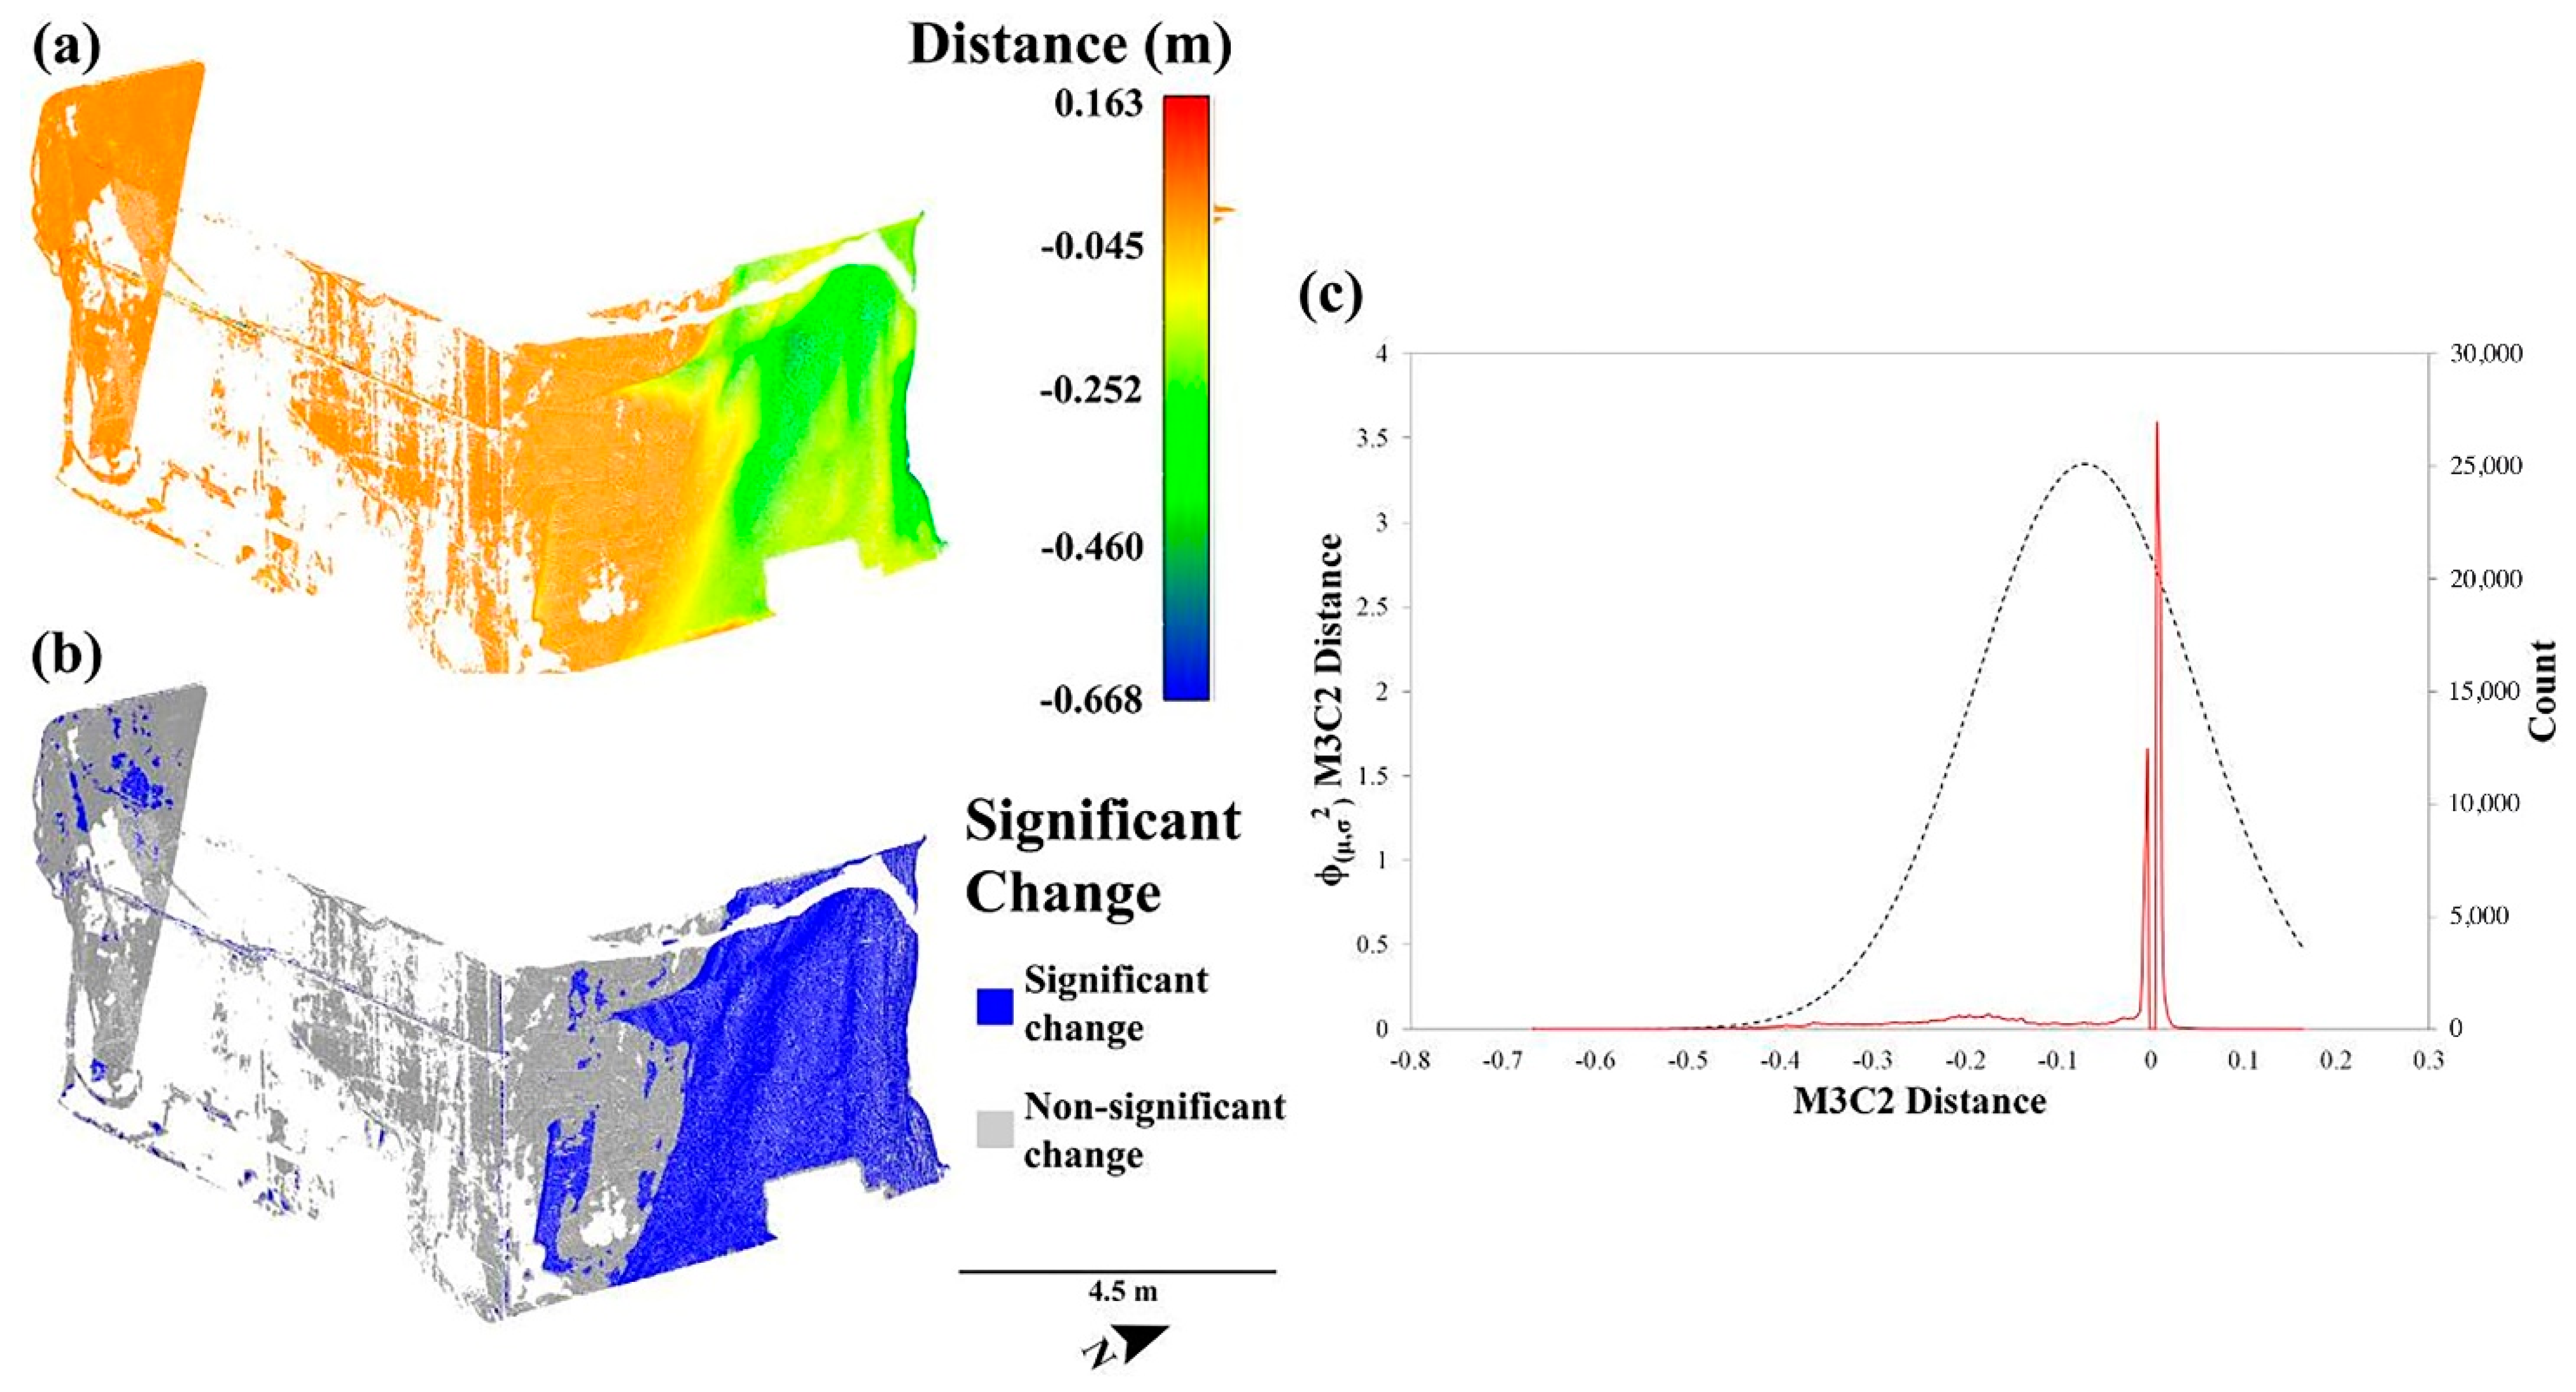
3.2.2. Step 2: Change Detection Analysis of the Identified Failure
Point clouds referring to the quarry sidewalls in the identified damage area were not sub-sampled, additional editing was still necessary to remove small electrical cables and worker tools that did not influence the first step outcome, allowing to carry out a high precision analysis and to avoid false distances in the output results. Distances of every face of the analysed pillar were computed separately by using the parameters shown of
Table 2. A registration error (reg) of 0.005 m, as computed in Step 1, was used.
3.3. Sidewalls Analysis by Numerical Modelling
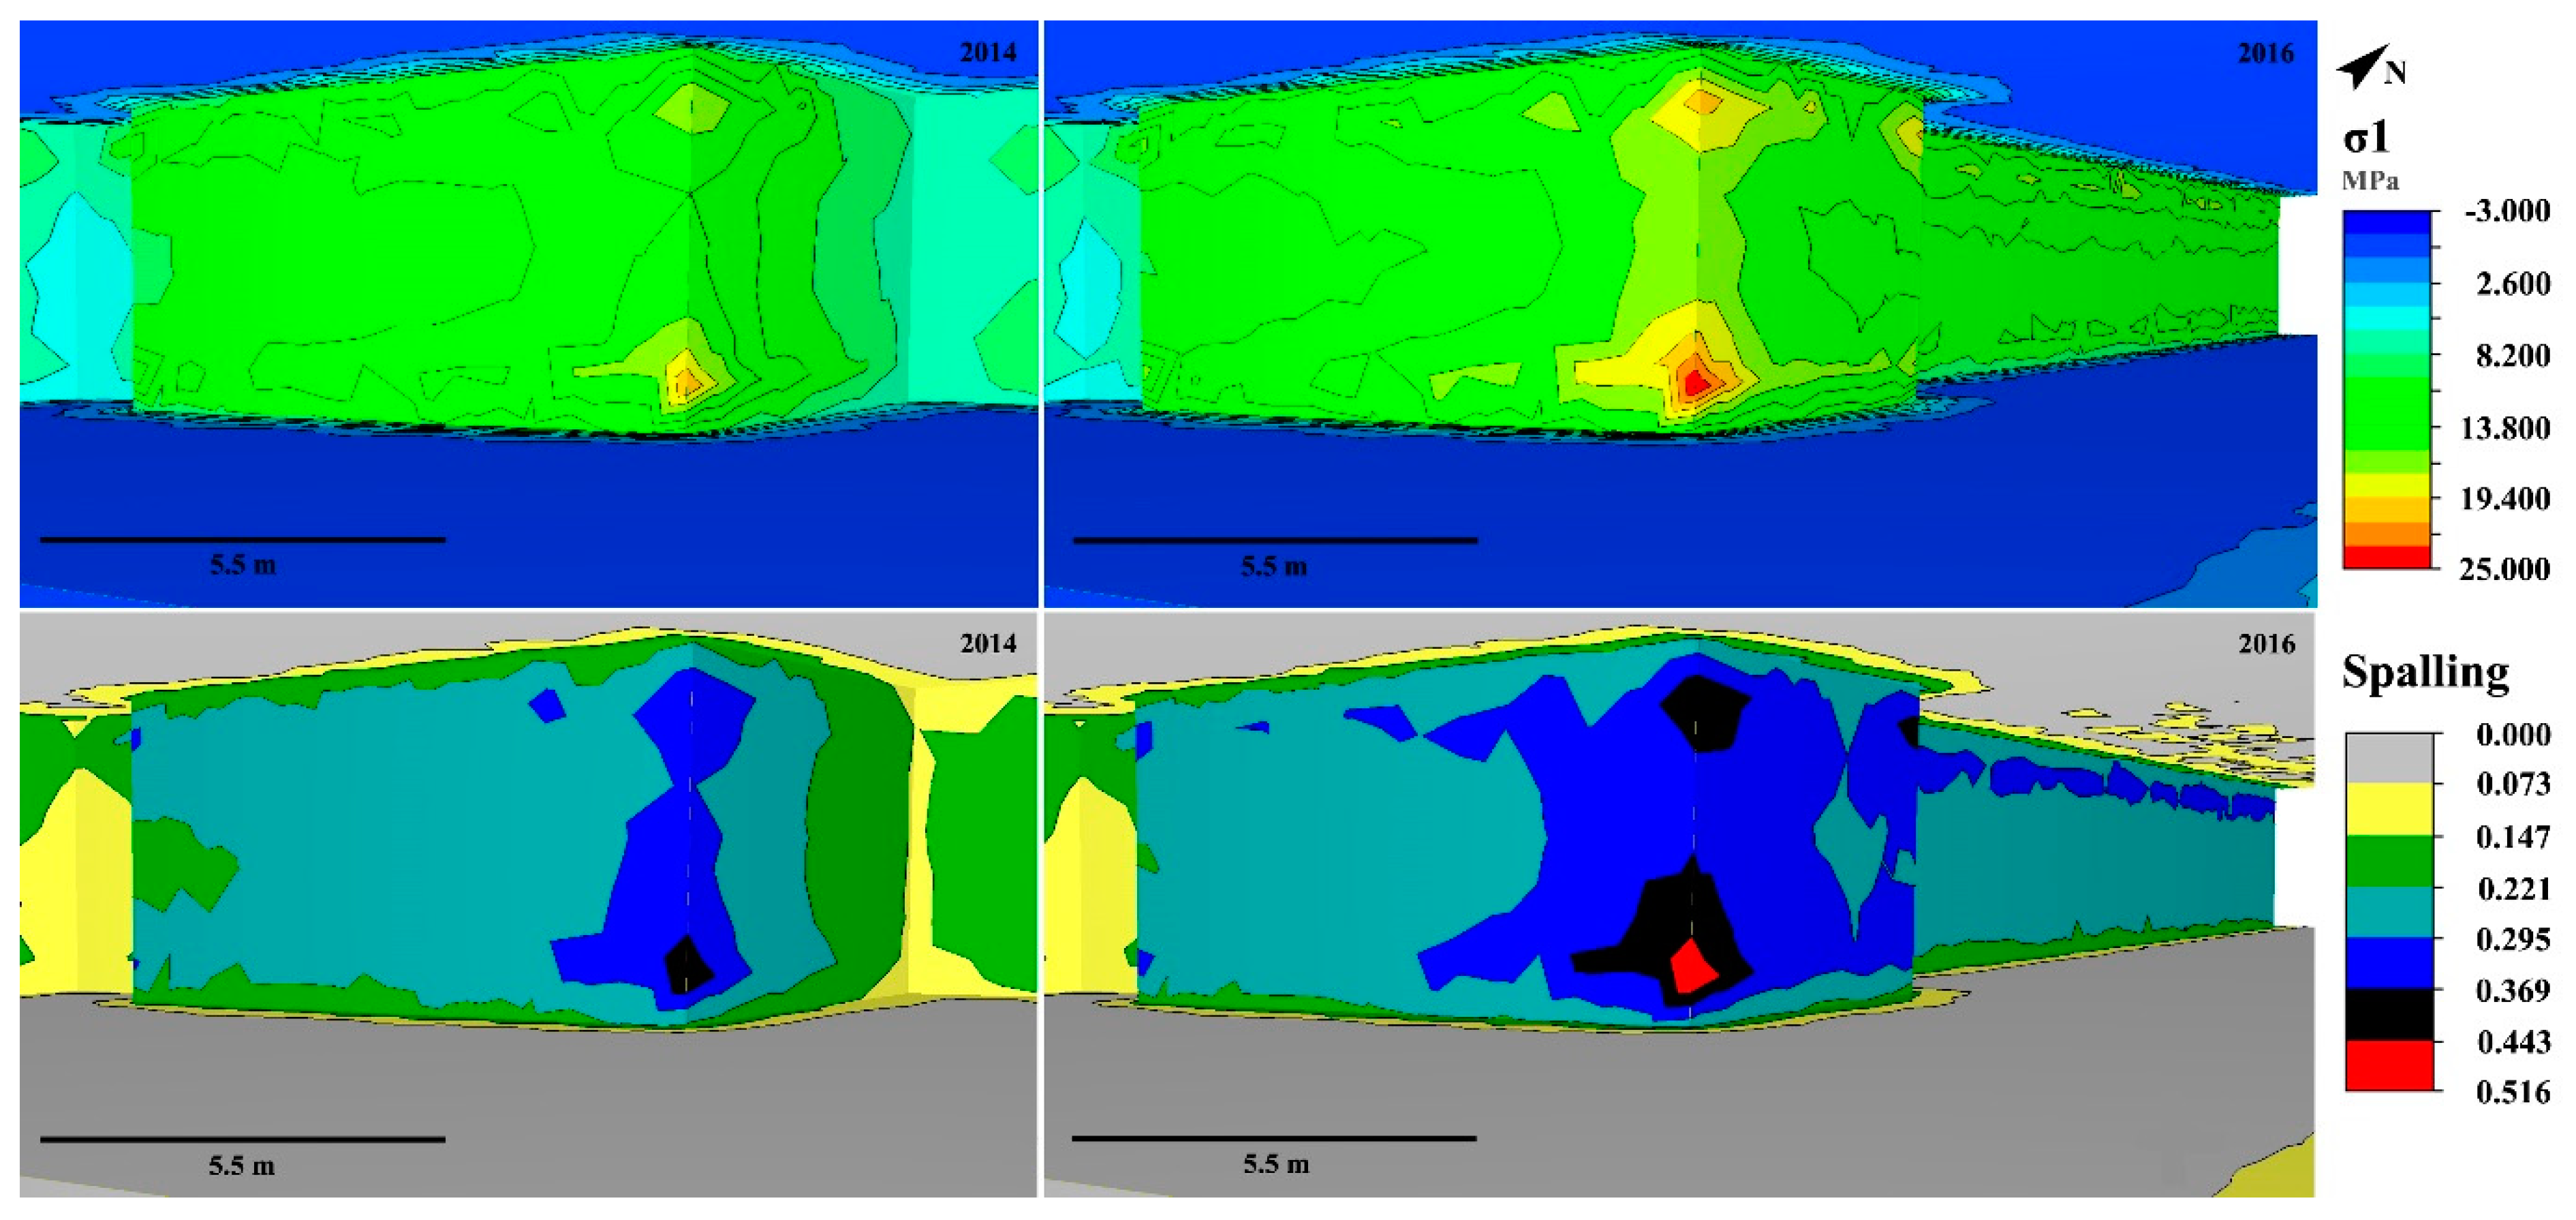
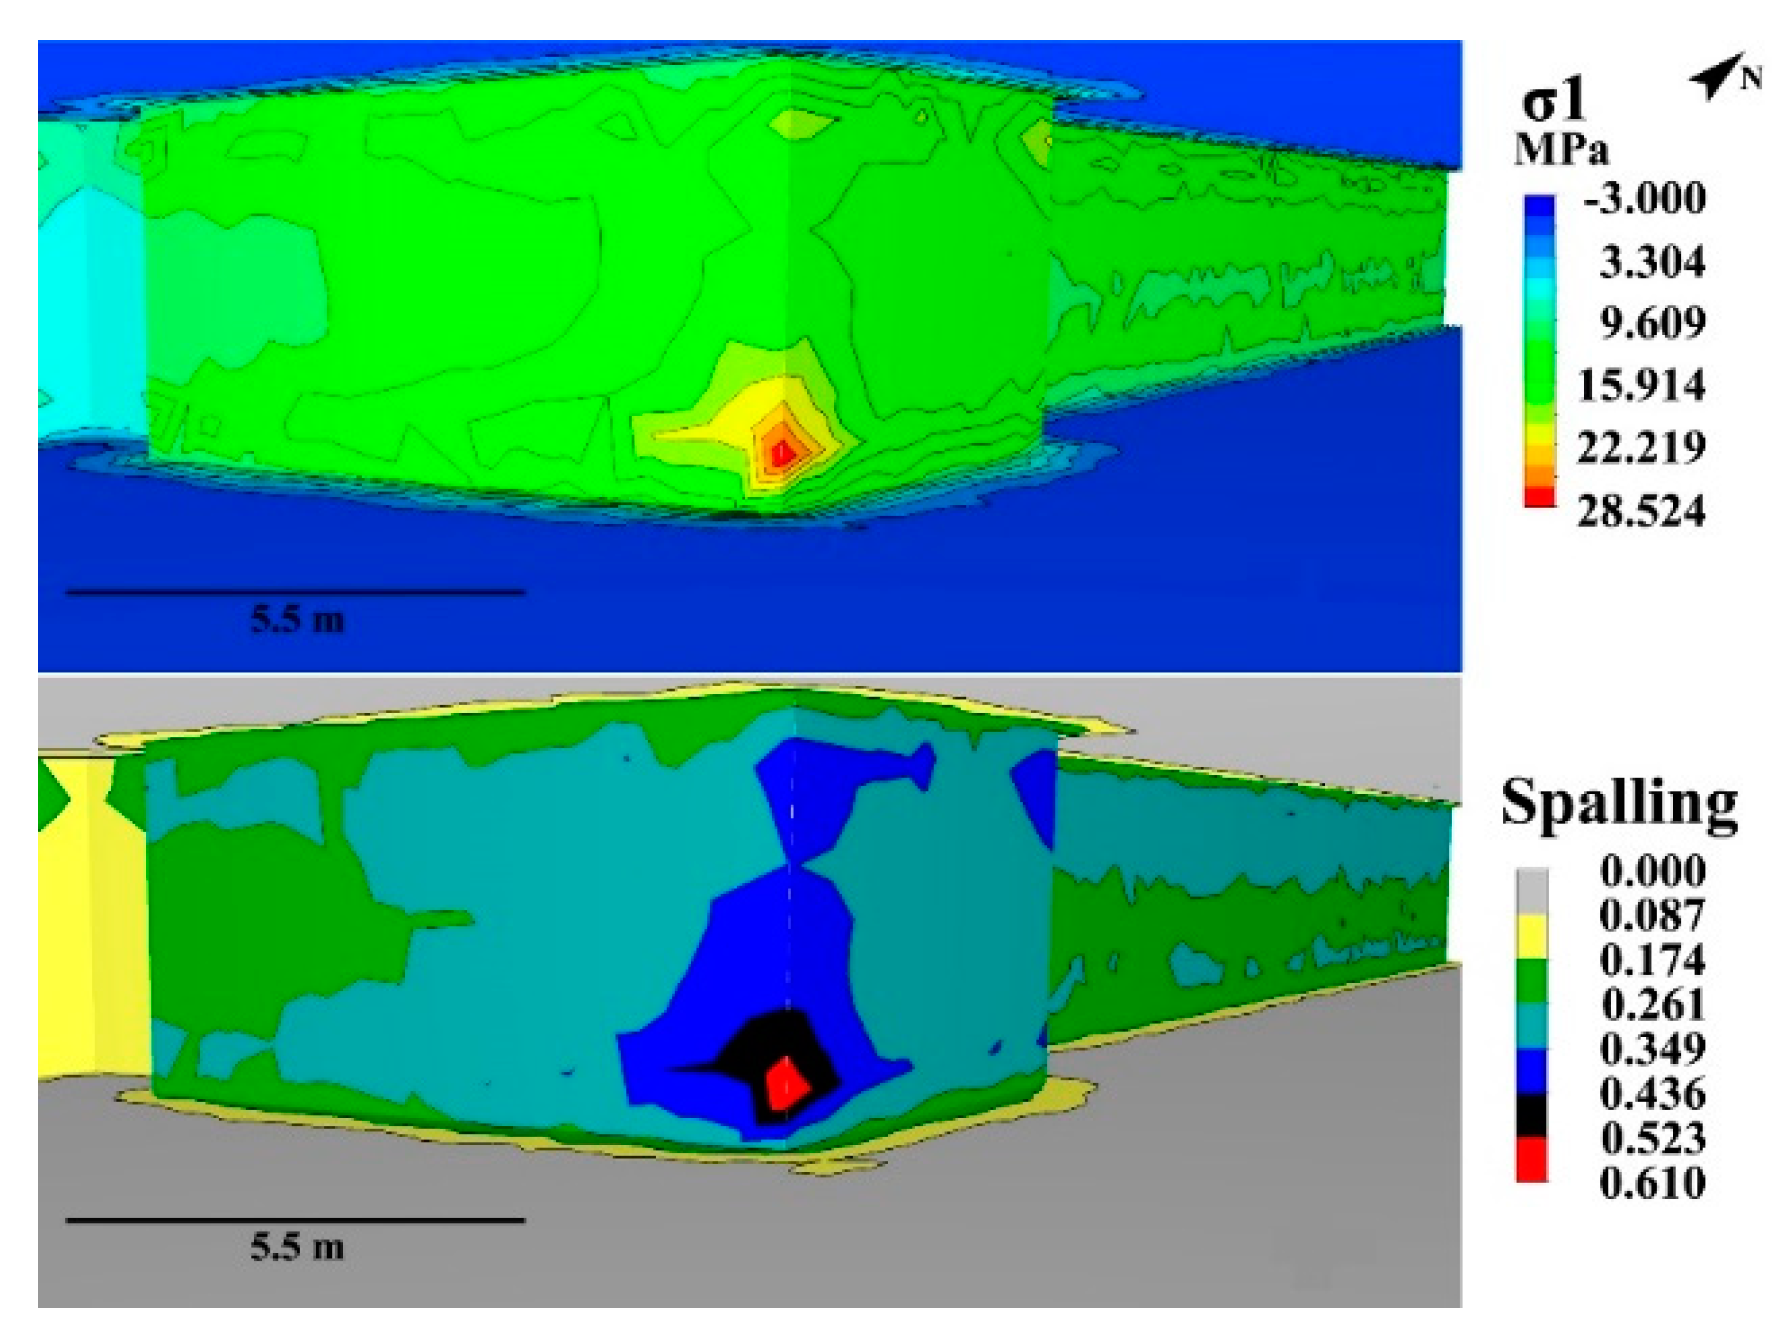
With the aim of understanding and relating the M3C2 distance results to the possible mechanical behaviour of the rock mass, numerical analyses were carried out using the FEM code RS3 (Rocscience
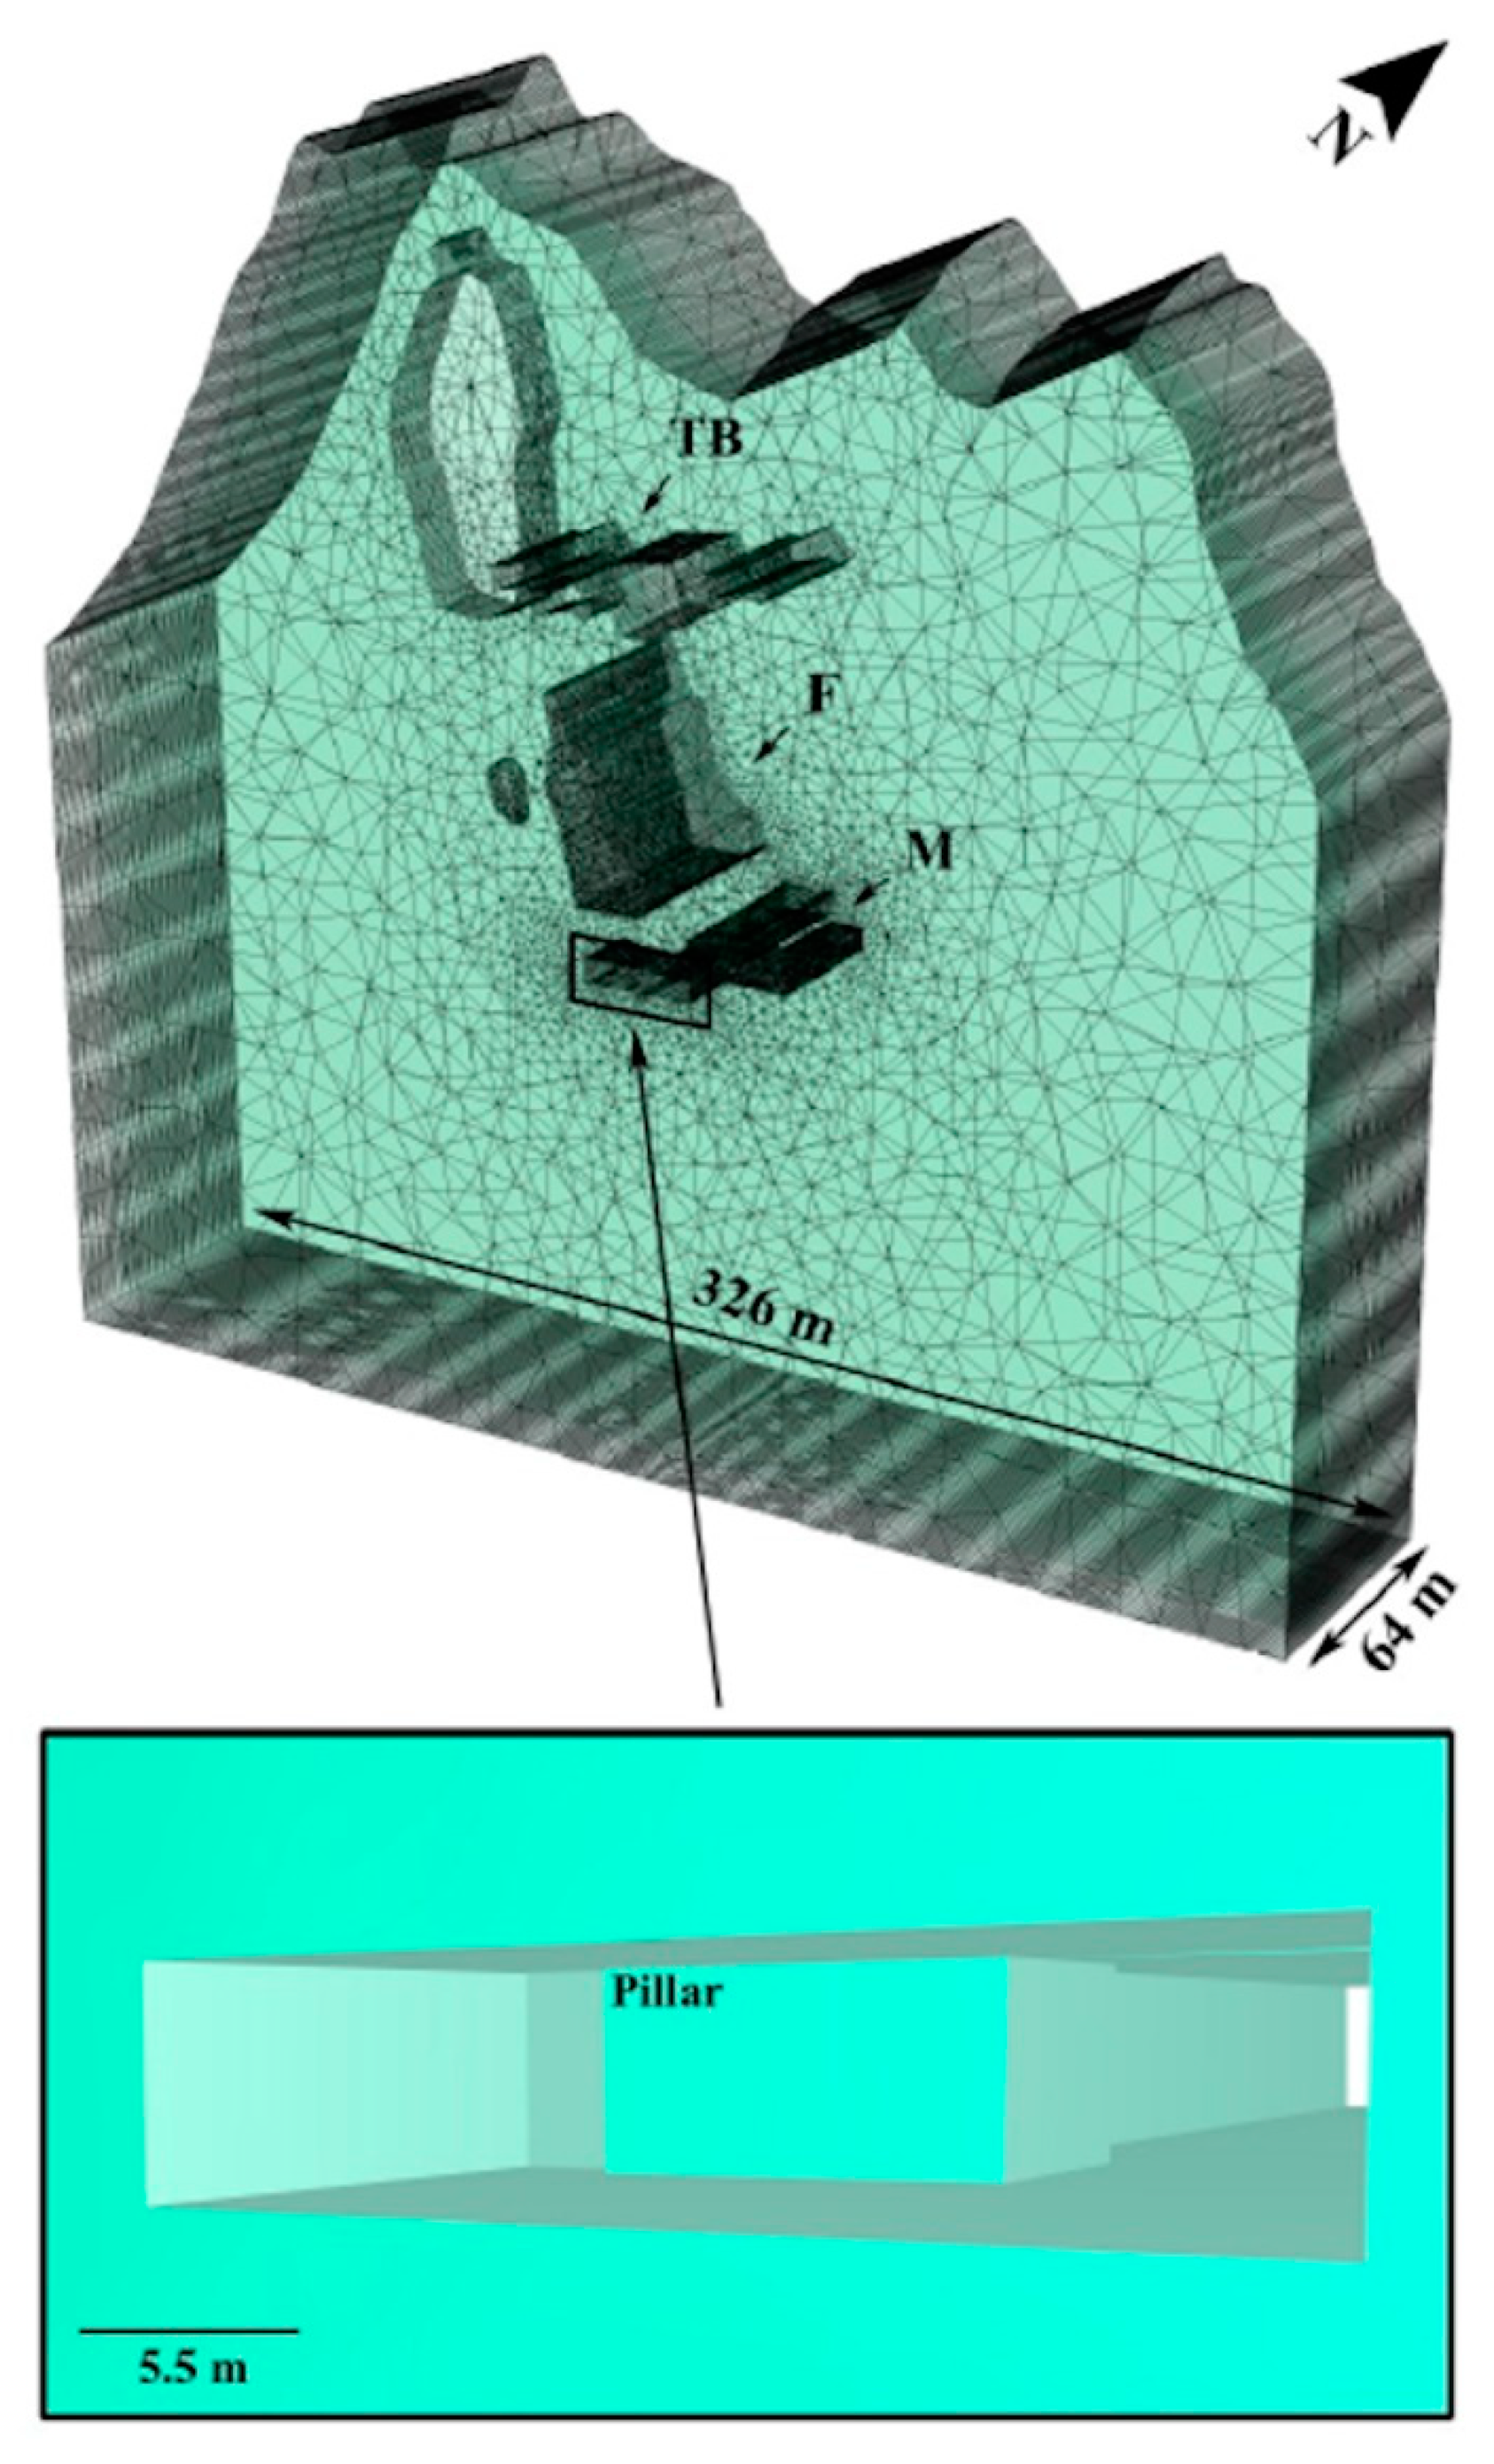
TM). The model, shown in
Figure 4, was generated using a simplified geometry elaborated from the 3D point cloud obtained from 2016 TLS, while the external surface boundary, which defines the extents of the FEM mesh, was added by using a topographic section obtained from the Tuscany Region Digital Terrain Model (10 × 10 m cell resolution).
The number of edges of the external and excavation boundaries were kept to a minimum, but at the same time sufficient to obtain a simple good quality mesh (this strategy is useful to limit useless computing time). Then, the mesh was customised by increasing the element density in the proximity of areas under consideration. Simplified geometries for the Tacca Bianca and the Fitta quarries were also used in the model due to the limited information available about the excavation time-sequencing for those extraction sites. An excavation-relaxation approach was used to simulate the progressive advance of the Macchietta quarry (1 m user-defined progressive excavation advance). This approach allowed for a gradual reduction of the forces applied to the excavation boundaries.
The material properties were defined using the RocData code (Rocscience
TM), taking into consideration the intact rock material properties shown in
Table 3. The results of new laboratory tests were used to constrain the material properties used in the numerical model (
Table 4). Note that the strength of the marble material was scaled using the relation proposed by [
27] to account for the mesh size used in the model. Elmo et al. [
28] found that this approach was suitable for the calibration of intact and rock mass properties in FEM analyses. Two mesh sizes were considered in the model, 0.8 m (in the near surroundings the Macchietta quarry) and 2 m (for the whole simulation). Following these characteristics, the calculated uniaxial compressive strengths were 73 MPa and 62 MPa, respectively (
Table 3). The effects of foliation on the modelling results were tested by using an isotropic elastic material (i.e., no foliation) and an elastic transversely anisotropic material (i.e., foliation coincident with the anisotropic plane).
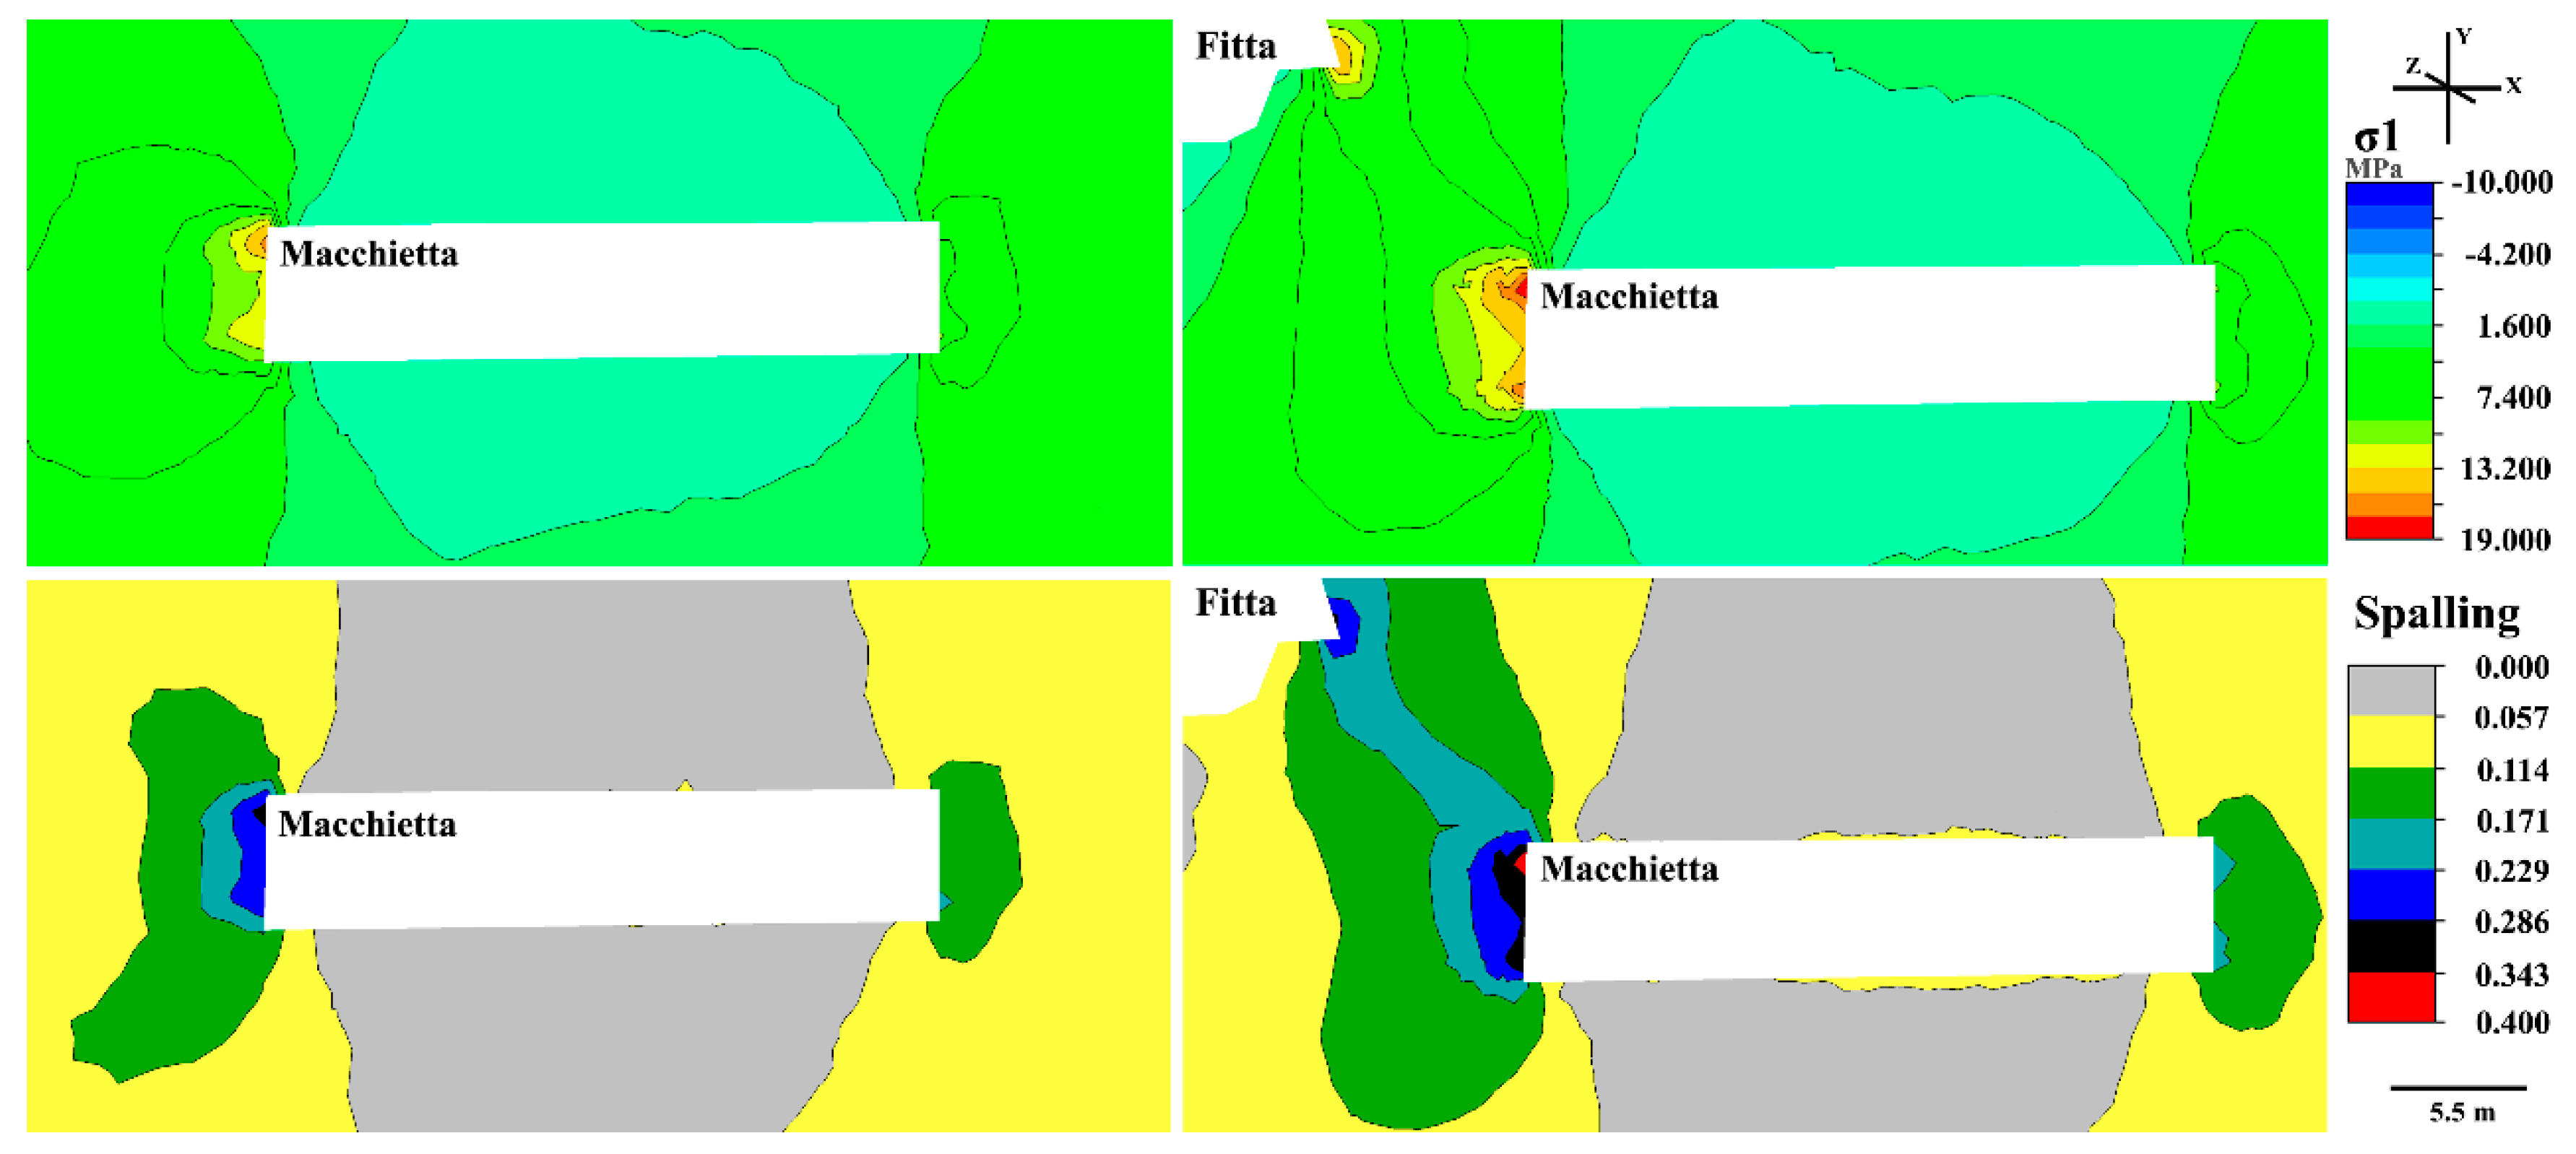
Spalling behaviour was analysed focusing on the Spalling Criterion [
29,
30], given by Equation (3):
As a general guideline, spalling criterion value of 0.4 indicates damage initiation, beginning of fracturing; 0.7 indicates potential for rock burst to occur; values lower than 0.4 indicate no potential for burst of failure to develop.
5. Discussion
The main goal of this research was to evaluate if M-TLS and subsequent 3D analysis (i.e., change detection) can be used to assess mining hazards in evolving environments, such as mining contexts, to minimize the risk for operators.
An aspect of fundamental importance for understanding the stress-strain behaviour of a rock mass at the advancing of excavation is the reconstruction of its geometrical setting. To acquire such data with high accuracy, the remote acquisition of spatial information related to the surfaces of the quarry was carried out by using the TLS technology.
TLS was used in order to carry out a point clouds comparison using the M3C2 algorithm. The possibility to acquire a huge amount of data in a very short time allowed to perform accurate 3D comparisons of M-TLS data. A key factor was represented by how the TLS surveys were aligned and integrated into the same coordinate system. This is an essential factor and a crucial step to perform a reliable change detection analysis. Indeed, it is important to reduce the systematic errors during the geomatic surveys avoiding further uncertainties during the point clouds comparison. This step was overcome by means of a topographic intersection using Iterative Closest Point algorithms [
32] and many targets from the permanently installed network in unserved quarry areas. In this way, a systematic millimetric error equal to the final intersection calculation was added. Through this technique, it was possible to integrate the new topographic survey (year 2016) into the same coordinate system of the first one (year 2014). Thanks to carefully designed differences in reflectivity between the target centre and the main target surface, it was possible to achieve accurate and precise intersection results. Moreover, TS laser beam divergence was avoided by means of turning targets oriented perpendicular to the laser beam. This approach allows the use of a minimum number of intersection targets, in contrast with the alignment method that requires a greater and well-distributed number of targets (the accuracy increases with the number of reference points [
33]).
The M3C2 is a powerful, free and accurate algorithm that allows performing truthful change detection analysis using directly point cloud data. This approach allows avoiding useless approximations (e.g., comparisons among mesh models) and adds accuracy troubles (e.g., interpolation) during a change detection analysis [
16]. The M3C2 computes the local distance between two point clouds along the normal surface direction only if it intersects any point on the final point cloud. Moreover, in order to verify the distance measurement accuracy and the reliability of the occurred change, the algorithm estimates a confidence interval for each distance measurement. In this way, it is possible to obtain a robust computation of the source of uncertainty allowing to evaluate the impact of both local roughness and local density on the detected distance measurement. Nevertheless, some problems related to the morphological complexity of the quarry during distance computations have been faced. Indeed, a critical aspect is represented by normal computation during a change detection analysis. The surface normal vector is computed by fitting a plane to the neighbours defined by the normal scale “D” in the proximity of “i”. This method is robust to noise but very bad with sharp edges and corners [
34]. Indeed, the reliability of the best-fit plane is related to the level of noise and the number/distance of neighbours [
34]. Furthermore, a rough morphology can cause local shadowing in point clouds with related additional uncertainty in normal computation. To minimise the problems with the local surface model, it was chosen to divide the point clouds into 68 sub-parallel areas and run the change detection analysis by comparing every pair of point clouds separately. In this context, the change detection analysis was carried out by using different normal scale and projection scale values. This method allowed the avoiding of over- or under-estimation of distances (L
M3C2) and consequently the presence of significant false changes, caused, for example, by missing data. Furthermore, it was possible to verify whether the normal scale was 20–25 times the roughness estimated at scale D for each point cloud pair and whether at least 4 points were used to compute the average position of each cloud (e.g., the eastern pillar wall is characterised by 470,32 and 216,80 points respectively for the 2016- and 2014-point clouds estimated by using a sphere with a radius of 0.25 m).
In this context, the first approach was used to rapidly identify changed zones in the quarry; the second one, instead, represents an in-depth analysis of the rate of morphological variations (from decimetre to millimetre) that occurred to an internal pillar during the quarrying activities. This high-precision analysis allowed to keep details because of small-scale values. Indeed, Lague et al. [
16] proved that using large normal and projection scale values can smooth out the details causing approximations during the distance computation. The analysis highlights how structural deformations are characterised by a general negative rate (i.e., spalling) with a post-failure area concentrated through the eastern wall of the pillar. The other walls can be classified as truly stable surfaces, probably due to the presence of supports.
The change detection analysis through the whole quarry showed up general stability of the rock surfaces. However, considering that the LOD95% test is a function of point density and local cloud roughness, the non-changed computed value (94.9%) can be characterised by an overrated interpretation. Indeed, areas with low point density (e.g., upper parts of the quarry) or local high values of roughness (e.g., objects not completely removed in the first step) can influence the statistical analysis. Changing areas, instead, correspond to unstable or potentially unstable blocks and rock debris, naturally fallen or removed during maintenance work, meshes for rockfall protection, electrical cables and water tubes not eliminated during the point cloud editing.
To improve the reliability and reduce uncertainties during the change detection analysis, further approaches may be carried out by using as much as possible the same scan positions from different temporal surveys. This can allow avoiding shadows and missing point data that can affect the local roughness and the local density of clouds determining a better evaluation of the change rate during the statistical analysis. Furthermore, in accordance with Lague et al. [
16], the use of non-changing fixed reference objects in the different temporal scans can be a useful method to check the result’s reliability during the M3C2 analysis.
FEM numerical analysis was successfully used in providing a better understanding of the mechanisms that likely controlled the rock mass damage observed in the pillar of the Macchietta quarry. Despite its simplified modelling, there is good conformity between the change detection results and the field observations (e.g., location of spalling damage). The FEM analysis demonstrates that even though the stresses do not reach very high magnitudes, they may be large enough to induce spalling in the direction of the maximum principal stress near the excavated boundaries. Indeed, the spalling ratio in some areas of the pillar reaches values greater than 0.4, which would indicate damage initiation and fracturing [
29,
30]. Therefore, the numerical modelling successfully indicated stress redistribution in consequence of underground excavation capable of causing spalling failure in the area of the pillar under examination. Even though any kind of discontinuity is considered in the FEM analysis, this is an important result that allows for a better understanding of the failure mechanism on the Macchietta quarry and can help in adopting proper prevention measures. The modelling results have also shown the role of proximity of the two underground quarries and the effects in terms of stress redistribution induced by the presence of the Fitta quarry few meters above. Indeed, the average state of stress in the zone of influence of the structure is of primary importance on the post-excavation stress distribution in the excavation near-field rock [
35].
However, the continuum nature of the FEM analysis is such that it was not possible to explicitly account for the presence of foliation and other structural planes of weakness. Field geological observations and the interpretation of TLS data suggest that the S1 foliation may play a significant role in the observed pillar damage by locally redistributing stresses. Future research should focus on this aspect in order to obtain a complete quantitative and qualitative assessment of the geomechanical mining risk.
To conclude, TLS, point clouds comparison and numerical modelling allowed the obtaining of a rock mechanic-based knowledge related to the risk-design assessment with the aim of providing the knowledge to prevent re-occurrence in the quarry planning, underlying failure mechanism of the identified pillar failure.
6. Conclusions
Different approaches, such as change detection analysis and numerical modelling, have been presented to study the stability that has impacted the surfaces of an underground marble quarry in the Apuan Alps (Italy). The proposed approaches fully took account of modern methodologies in order to study morphometric and structural changes of the underground excavation. Furthermore, a geo-structural analysis was carried out through modern and classical methods in order to obtain the complete knowledge necessary to understand and guide the rock mass behaviour for stability numerical modelling.
The morphometric changes within the quarry were analysed by using the M3C2 CloudCompare freeware algorithm. This study highlights how a change detection analysis is suitable to control morphological variations in a complex environment and to obtain a full knowledge of the rock mass behaviour during the time, to maintain safety, to ensure adequate quality control of the quarrying operations, and to plan future developments of the extraction. In particular, a high-definition change detection analysis represents a suitable method for controlling mining and industrial processes as well as for identifying the root cause of a failure and managing complex stability analysis using advanced numerical tools. To examine the M3C2 distance results, a proper FEM numerical approach was used. Results demonstrate that a preliminary numerical approach allows focusing the attention on the stress redistribution around complex underground excavations and limit the impact that a complex geological history would have on the interpretation of results.
Following the results from the FEM analysis, a further Finite-Discrete Element Method numerical approach should be used to analyse the transition from continuous to discontinuous state in the pillar, including the presence of discontinuities. In this context, a hybrid analysis could be carried out to study how stress redistribution leads to the propagation and coalescence of the pre-existing fractures and the formation of new cracks.


