Article

Spatiotemporal Distribution Patterns and Local Driving Factors of Regional Development in Java

by
Andrea Emma Pravitasari
1,2,*,
Ernan Rustiadi
1,2,
Rista Ardy Priatama
3,
Alfin Murtadho
2,
Adib Ahmad Kurnia
4,
Setyardi Pratika Mulya
1,2,
Izuru Saizen
5,
Candraningratri Ekaputri Widodo
2 and
Siti Wulandari
2
1
Division of Regional Development Planning, Department of Soil Science and Land Resources, Faculty of Agriculture, IPB University, Bogor 16680, Indonesia
2
Center for Regional System Analysis, Planning, and Development (CRESTPENT), IPB University, Bogor 16127, Indonesia
3
Regional Planning Science Study Program, Postgraduate School, IPB University, Bogor 16680, Indonesia
4
Regional and Rural Development Planning Science Study Program, Faculty of Economics and Management, IPB University, Bogor 16680, Indonesia
5
Laboratory of Regional Planning, Graduate School of Global Environmental Studies, Kyoto University, Yoshida Honmachi, Sakyo Ward, Kyoto 606-8501, Japan
*
Author to whom correspondence should be addressed.
ISPRS Int. J. Geo-Inf. 2021, 10(12), 812; https://0-doi-org.brum.beds.ac.uk/10.3390/ijgi10120812
Submission received: 23 September 2021 / Revised: 20 November 2021 / Accepted: 24 November 2021 / Published: 30 November 2021

Abstract

:
Although uneven regional development has long been an issue in Java, most parts of the territory experienced an increased level of development over the last two decades. Due to the variance in local background and spatial heterogeneity, the driving factors of the development level should, theoretically, vary over space. Therefore, in this study, we aim to investigate the local factors that influence the development level of Java’s regions. We used the spatiotemporal pattern analysis, ordinary least squares (OLS) regression, and geographically weighted regression (GWR), utilizing the regional development index as the predicted variable, and the social level, economy, infrastructure, land use, and environmental barriers as predictors. As per our results, it was found that the level of development in Java has improved over the past two decades. Metropolitan areas continued to lead this improvement. All the predictors that we examined significantly affected regional development. However, the spatial pattern of the local regression coefficients of Human Development Index (HDI), landslide, paddy conversion, and crime shifted due to changes in the spatial concentration of development activities.

1. Introduction

Java has been identified as the most populous island in the world; in fact, it is home to 56% of Indonesia’s total population [1]. Although it only covers 6.9% of the country’s land area, several main metropolitan areas of Indonesia are located on this island, including that of Jakarta (Jabodetabek), which serves as an economic center for national economic activities and is the capital city of Indonesia [2,3]. The mega-urbanization of Java is reflected in the spatial patterns of its urban population growth [4]. The centrality of this island to Indonesia as a whole is undeniable. For instance, Java contributes 59% of Indonesia’s annual gross regional domestic product (GRDP) [5].
Regardless of Java’s contribution to the country’s economic performance, development within Java shows a persistently uneven level of development among its regions [6,7]. Most of Java’s GRDP is centered in its metropolitan areas, particularly their cores. The rapid development of regions in Java is driven by development and economic activities in metropolitans and large cities. Metropolitan Jakarta alone contributes 25.52% of the country’s national gross domestic product (GRDP) [8]. Fortunately, this issue does not profoundly affect public stability, as the poverty rate in Java has seen a steady decline [9]. Nevertheless, the fact remains that the gap between the developed areas and the less-developed areas continues to widen, which is still considered a fresh topic in terms of discussions pertaining to Java’s development.
The uneven level of regional development implies that regional performance varies across space. It may also be influenced by the following factors: population density, availability of facilities, regional infrastructure, presence and type of settlements or built-up areas, magnitude of trade and industrial activities, accessibility, and regional income [10,11]. In addition, some factors might hinder regional development, such as the boundaries of environmental carrying capacity. However, in terms of what development agenda should be carried out in which area, clearer pictures of how the level of development is distributed and of the local factors that are most dominant in the level of regional development in that location, are needed.
An understanding of the relationship between local factors and the level of regional development can be the government’s information base for planning its development agenda. The World Bank [12] emphasizes the importance of development that takes into account local conditions, since a concept that is successfully implemented in one place may not necessarily be appropriate for another due to differences in the local environments. Since the application of decentralization policy in the late 1990s, information on spatial heterogeneity in development-related factors has been a central necessity for the government, especially in the composition of regional policy and budgeting. The driving factors for regional development can be divided into two sets. The first includes what encourages, and the second regards what hinders regional development. Apart from the rarity of supporting factors, a region may become less developed due to the number of obstacles within it.
The level of regional development is determined by five factors that can vary spatially. The first and the second are the social and economic aspects [13]. They are manifested in the quality of human resources, population size for industrialization, social capital, and GRDP. The quality of human resources may include the quality of education, health, purchasing power, per capita income, and poverty rate [14,15]. The third aspect is regional infrastructure, which can be measured by the number of social, health, education, and economic facilities, and the state of the road network [16]. Land use is the fourth indicator of regional development [17]. Industrial activities generally require less land, but support workers are relative to the ratio of land to workers in the agricultural sector. Finally, environmental barriers are deemed a purely limiting factor [18]. Regions with striking environmental barriers, such as natural disasters, often have limited options for socioeconomic development. The combination of these five aspects and their spatial distribution can theoretically affect variations in the level of regional development.
Another factor that determines regional development is the geographical advantage over distance to developed regions. Here Tobler’s law of geography is applied, such that proximate regions are more influenced than distant ones [19]. Regions around a metropolitan area have a greater chance of obtaining spread effects. Although this positive impact also spills over to other more distant regions, most of the spread effects necessarily concentrate around the metropolitan core.
However, regions that are far from the metropolitan areas may not always be more backward. For instance, Pangandaran and Cilacap Regency are relatively far from metropolitan areas, but they have shown satisfying development over the last decade, even better than the others that are closer to metropolitan areas. The factors that have driven the development of these two regencies are different from those that have influence over areas adjacent to metropolitan cores. Sapena and Ruiz [20] have noted that the driving factors that influence urban areas vary due to their differing development trajectories and their inherent spatial heterogeneity. Some urban areas may develop due to economic agglomeration, while some others do so because of mutual connectivity with the surrounding rich hinterland [21].
Studies of regional disparity conducted by scholars in Indonesia mostly focus on the central aspects of economic development inequality [22,23,24]. The dominant centralization policy implemented by the government of Indonesia for decades before it was altered in 2000 not only created economic disparities but also created gaps in human capital and public infrastructure [25]. This centralization policy, combined with a space-blind policy, has resulted in a development of human capital and public infrastructure that was closely focused on metropolitan areas such as Jakarta [25], which generally have topographical conditions that are not rough. In response to these problems and gaps, this study describes the factors that influence the development of Java, both those that hinder and those that encourage the development of municipalities/regions in Java.
In this study, we use spatiotemporal and multidimensional development approaches, investigating social, economic, and environmental aspects, including public infrastructure. A spatiotemporal approach is needed to determine which areas have improved and which are lagging in terms of development, especially after decentralization (regional autonomy) was implemented in 2000. In addition, this study also describes the factors that influence the development of Java in a spatiotemporal manner. The use of a multidimensional approach to aspects of development is due to the regional disparity that occurs not only in economic aspects but also in the social aspect (human capital); the social, economic, and environmental aspects are considered pillars of sustainable development [26]. In the end, the results of this study can be used as an evaluation tool to determine whether decentralization and regional autonomy (examples of place-based policy) have succeeded in reducing regional disparities in Java. In addition, the results of this study can support the development of further recommendations to the central government and local governments as they establish policies aiming to improve the development of each regency or municipality in Java.

2. Materials and Methods

In this study, the level of regional development is proxied by the regional development index (RDI). The spatiotemporal distribution pattern of the development level of Java is represented by the growth of the RDI for the following years: 1996, 2000, 2011, and 2017. The RDI is one method that is often used among Indonesian researchers in place of GRDP because it takes into account the ratio between the number of facilities and the population. Here, facilities include education, health, economy, and government services [27,28]. The data were obtained from Indonesia’s statistics agency. The index was calculated using a weighted scalogram, which involves three steps. First, the facilities’ service capacity was calculated using the following formula:
A i j = X i j P i / 1000
where Aij is the index of the facility j in region i, Xij is the number of facilities j in region i, and Pi is the populations in region i. The facilities included social, health, education, and economic facilities, whether state- or private-owned. i = 1, 2, 3, …, n (number of region); j = 1, 2, 3, …., m (number of facilities). Then, the following formula was used to determine the weight of each j in the region i (Iij):
I i j = X i j / X . j A i j
where X.j is the sum of facility j. Then, we standardized the data from the new variables using weighted data (Iij) in the following formula:
K i j = I i j m i n   I j / S j
where Kij is the raw scalogram index value, min Ij is the minimum value of I in facility j, and Sj is the standard deviation value of j.
Finally, the RDI was calculated as follows:
R D I i j = i = 1 n K i j
The driving forces for Java’s development were identified using ordinary least squares (OLS) and a geographically weighted regression (GWR) model. OLS and GWR were implemented in Statistica 7 (StatSoft, Tulsa, OK, USA) and ArcGIS 10.3 (ESRI, Redlands, CA, USA), respectively. First, variables were analyzed using OLS to identify what we call “global driving factors”. RDI was the dependent variable (Y), while the independent variables (X) were the 11 variables presented in Table 1. These 11 variables were selected from the forward stepwise regression model. The OLS tested the significance of their influence on RDI. These independent variables were chosen to represent the following five aspects, that is, economy, social, infrastructure, land use, and environmental barriers [13,17,18].
GRDP and distance to central business district (CBD) were chosen to represent the economic aspects. GRDP shows the economic performance of a region, while distance to CBD is a representation of physical distance to the economic center, which could also influence the level of regional development. According to Tadjoeddin et al. [29], the level of development in the social aspect can be observed from the level of human resources and the level of crime. High crime levels tend to inhibit investment activities and human creativity in sociocultural life [30]. For infrastructure, we used the number of educational facilities. Previously, we have used several variables related to facilities, including education, health, and social facilities. Among the three, only educational facilities were found to be significantly correlated with RDI.
The level of regional development in Indonesia is, generally, closely related to the phenomenon of conversion of agricultural land to non-agriculture [13,31,32], whose growth follows the construction of roads [33]. The added value to agricultural land around the settlement center that is lower than the value added to non-agricultural land triggers changes in land use from agricultural to non-agricultural land. Therefore, we chose this conversion phenomenon to represent land use. Finally, the level of regional development is correlated with the quality of the carrying capacity. Areas that have a limited carrying capacity tend to limit their economic activities. The massive development and increasing population produce new problems, such as declining environmental quality, including the increasing disasters [26]. We chose floods, landslides, droughts, and tuberculosis incidence (disease burden) as a representation of the region’s carrying capacity. The unit of analysis used in the model is the regency or municipality.
GWR was used to model the spatial pattern and spatial dependence of the driving factors of RDI. GWR is a statistical method used to identify local spatial variation. This model addresses the non-stationary and allows the local spatial variations to vary over space. GWR is developed from a global regression model, the basis of which comes from nonparametric regression [34]. Various studies have applied the GWR model for identifying the spatial variation of regional development [35], natural resources [36,37], social conditions [38,39], and urban expansion [16,40]. The result of this analysis is a regression model whose parameter values apply only to the observation locations and differ across locations [34].
In this study, the significant variables (X to Y) on OLS were selected and further analyzed using GWR to describe the characteristics of the spatial pattern and the spatial dependence of the independent variables, employing 2000 and 2017 data. The dependent variable remained the RDI. The formula for the GWR model is as follows:
Y j = C 0 u j , v j + i = 1 p C i ( u j , v j ) X i j + ε j
where Yj is the dependent variable for observation j, Xij is the independent variable Xi at location j, uj,vj is a coordinate point for the location of observation j, C0 (uj,vj) is the intercept for observation j, and Ci (uj,vj) is the regression coefficient or local parameter estimate for independent variable Xi at location j. The optimal bandwidth of the GWR analysis was set by minimizing the corrected Akaike information criterion with a correction for finite sample sizes [34]. All the data used in this study were obtained from Statistics Indonesia (Badan Pusat Statistik, BPS).

3. Results

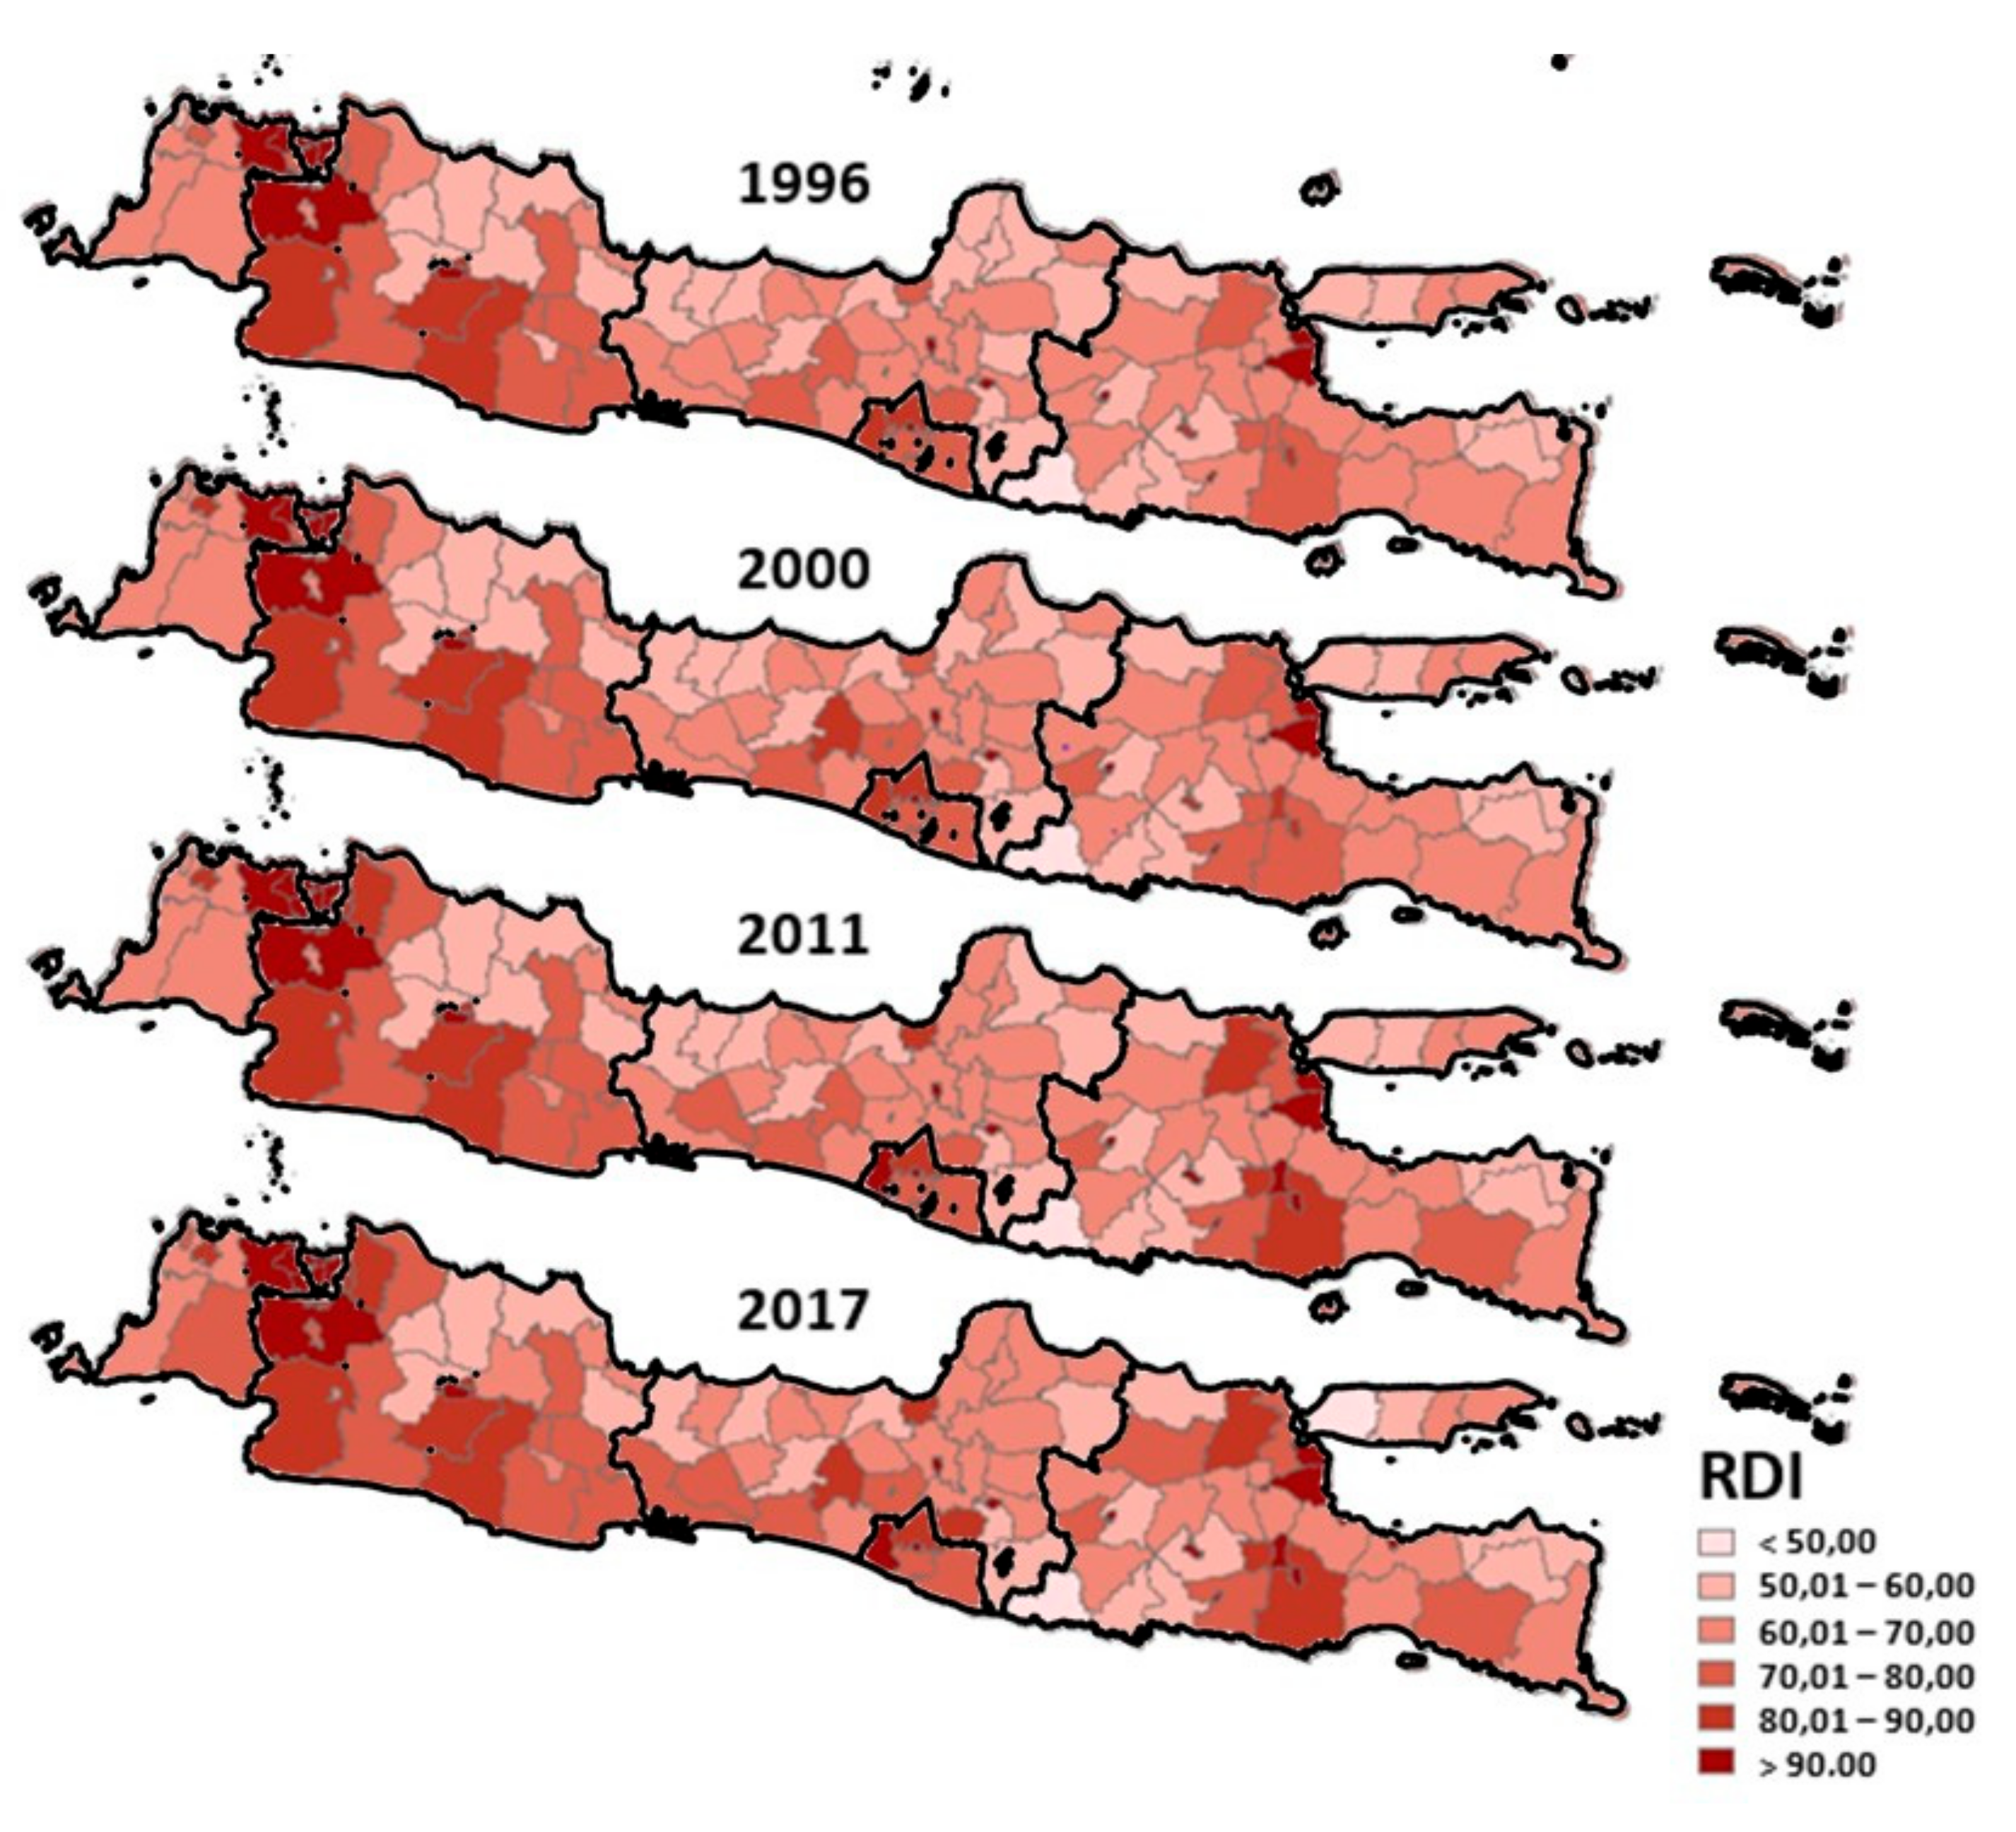
3.1. Spatiotemporal Distribution Pattern of RDI

Over the last two decades, the level of development of Java was noted to improve. The RDI increased from 1996 to 2017, as indicated by the rise in the descriptive values of RDI. In 1996, the minimum, maximum, and mean values were 46.56, 130.21, and 73.47, respectively. In 2017, these scores increased to 48.22, 135.48, and 78.10, respectively. Figure 1 shows the spatiotemporal distribution patterns of Java’s RDI.
The spatial patterns of RDI for all examined years showed that high values of RDI were discovered in the metropolitan areas or large municipalities. In the temporal perspective, the regencies/municipalities adjacent to metropolitan areas or large municipalities experienced an increase in terms of RDI. Greater Jakarta was a striking example of this pattern. Jakarta and its surroundings are considered a megapolitan area due to the large total area and continuing extension of the suburban areas [41]. However, it should be noted that Central Java experienced a striking growth in its development level over the previous decades. This improvement tended to be spatially random (Figure 1).

3.2. Global Driving Factors Affecting the Regional Development of Java

All 11 variables examined in the OLS have significantly affected the RDI of Java’s regions (Table 2). For each, p < 0.01, except for landslide occurrence, drought occurrence, and distance to the CBD (p < 0.05). These results imply that the level of development is linked to various dimensional aspects, including social and economic aspects [13], land use aspects [17], and environmental barrier [18].
The relationship of independent variables toward RDI differed in the direction of their effects. Some variables had a positive relationship to the RDI, while others had adverse effects. GRDP (X1), the Human Development Index (HDI; X3), the crime rate (X4), the number of non-formal and formal educational facilities (X5 and X6), and the conversion of paddies into built-up areas (X7) were noted to have positive effects on RDI (Table 2). Meanwhile, the variables with negative influences on RDI were the three variables related to environmental barriers (flood, landslide, and drought, or X8, X9, and X10, respectively), distance to the CBD (X2), and tuberculosis burden (X11). X6 and X11 exhibited the highest impact on RDI. The equation for the OLS model is shown below:
Y = 0.00 X1 − 2.00 X2 + 1.76 X3 + 8.87 X4 + 0.01 X5 + 17.86 X6 + 0.02 X7 − 2.00 X8 − 0.56 X9 − 1.52 X10 − 20.93 X11 − 66.31 (R-square = 0.78).
However, this result is somewhat difficult to interpret, especially for X4, X8, X9, X10, and X11. The last four, that are, for flood, landslide, drought, and tuberculosis, respectively, can be seen in two perspective: environmental barrier and environmental degradation. They have different logic of interpretation in which the first is about the limit of the carrying capacity while the second is the negative externality of human activities. The incidence of crime (X4) is also questionable whether it is a driving factor or a negative externality of economic activity. These issues would be discussed in Section 4.

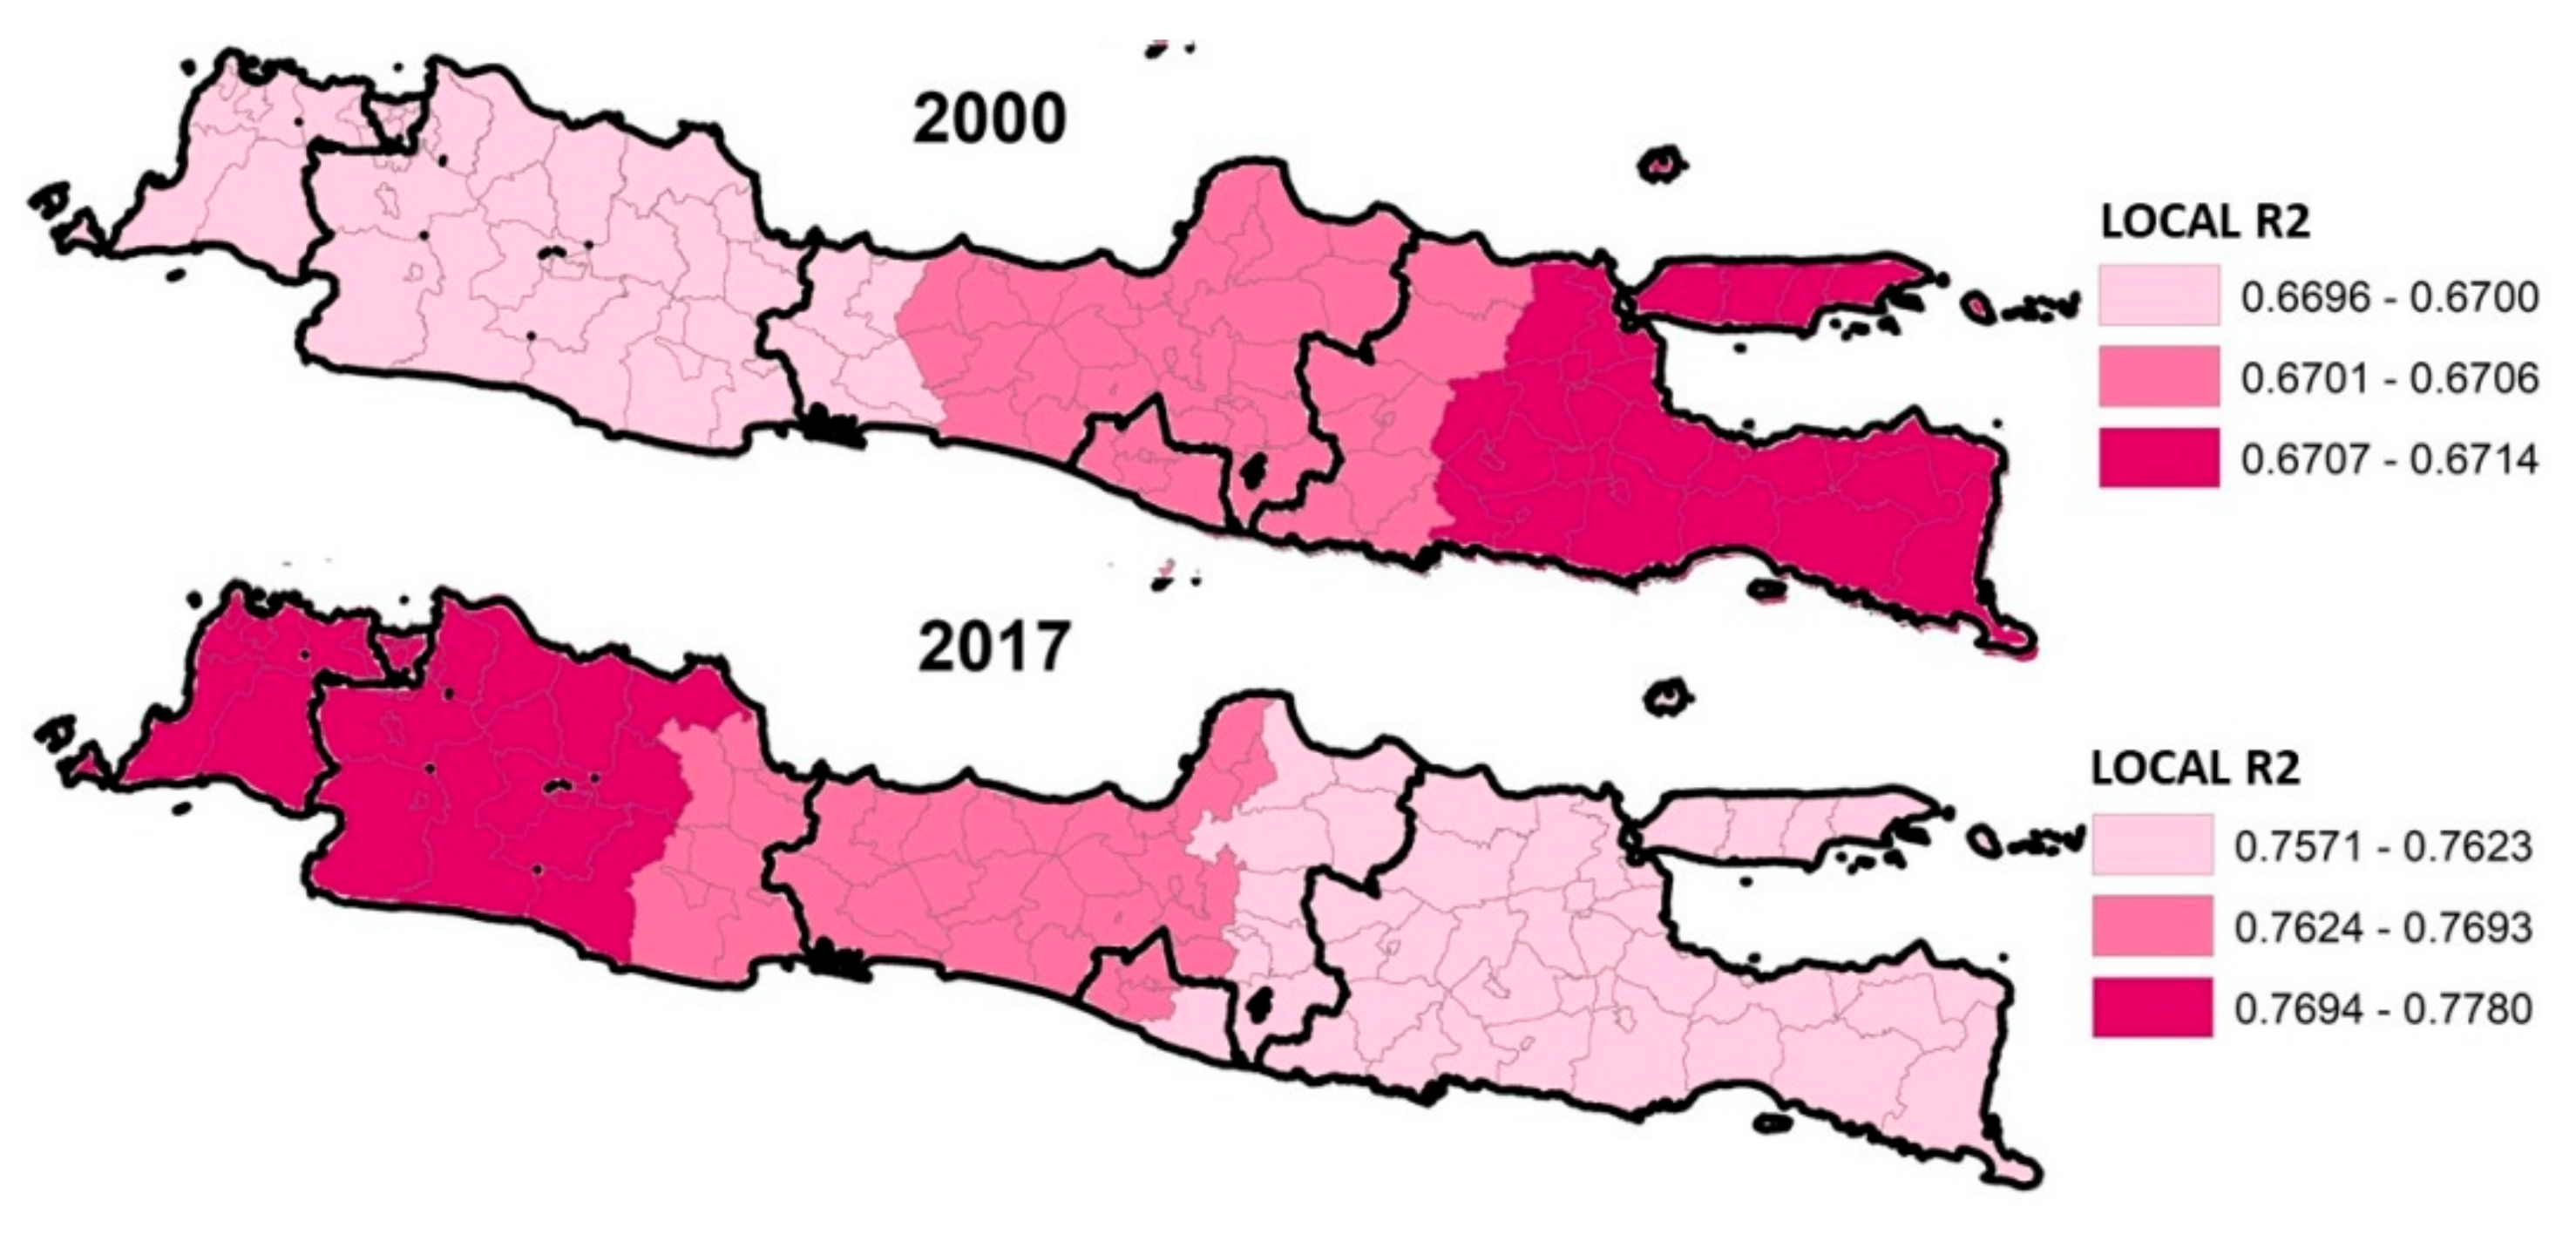
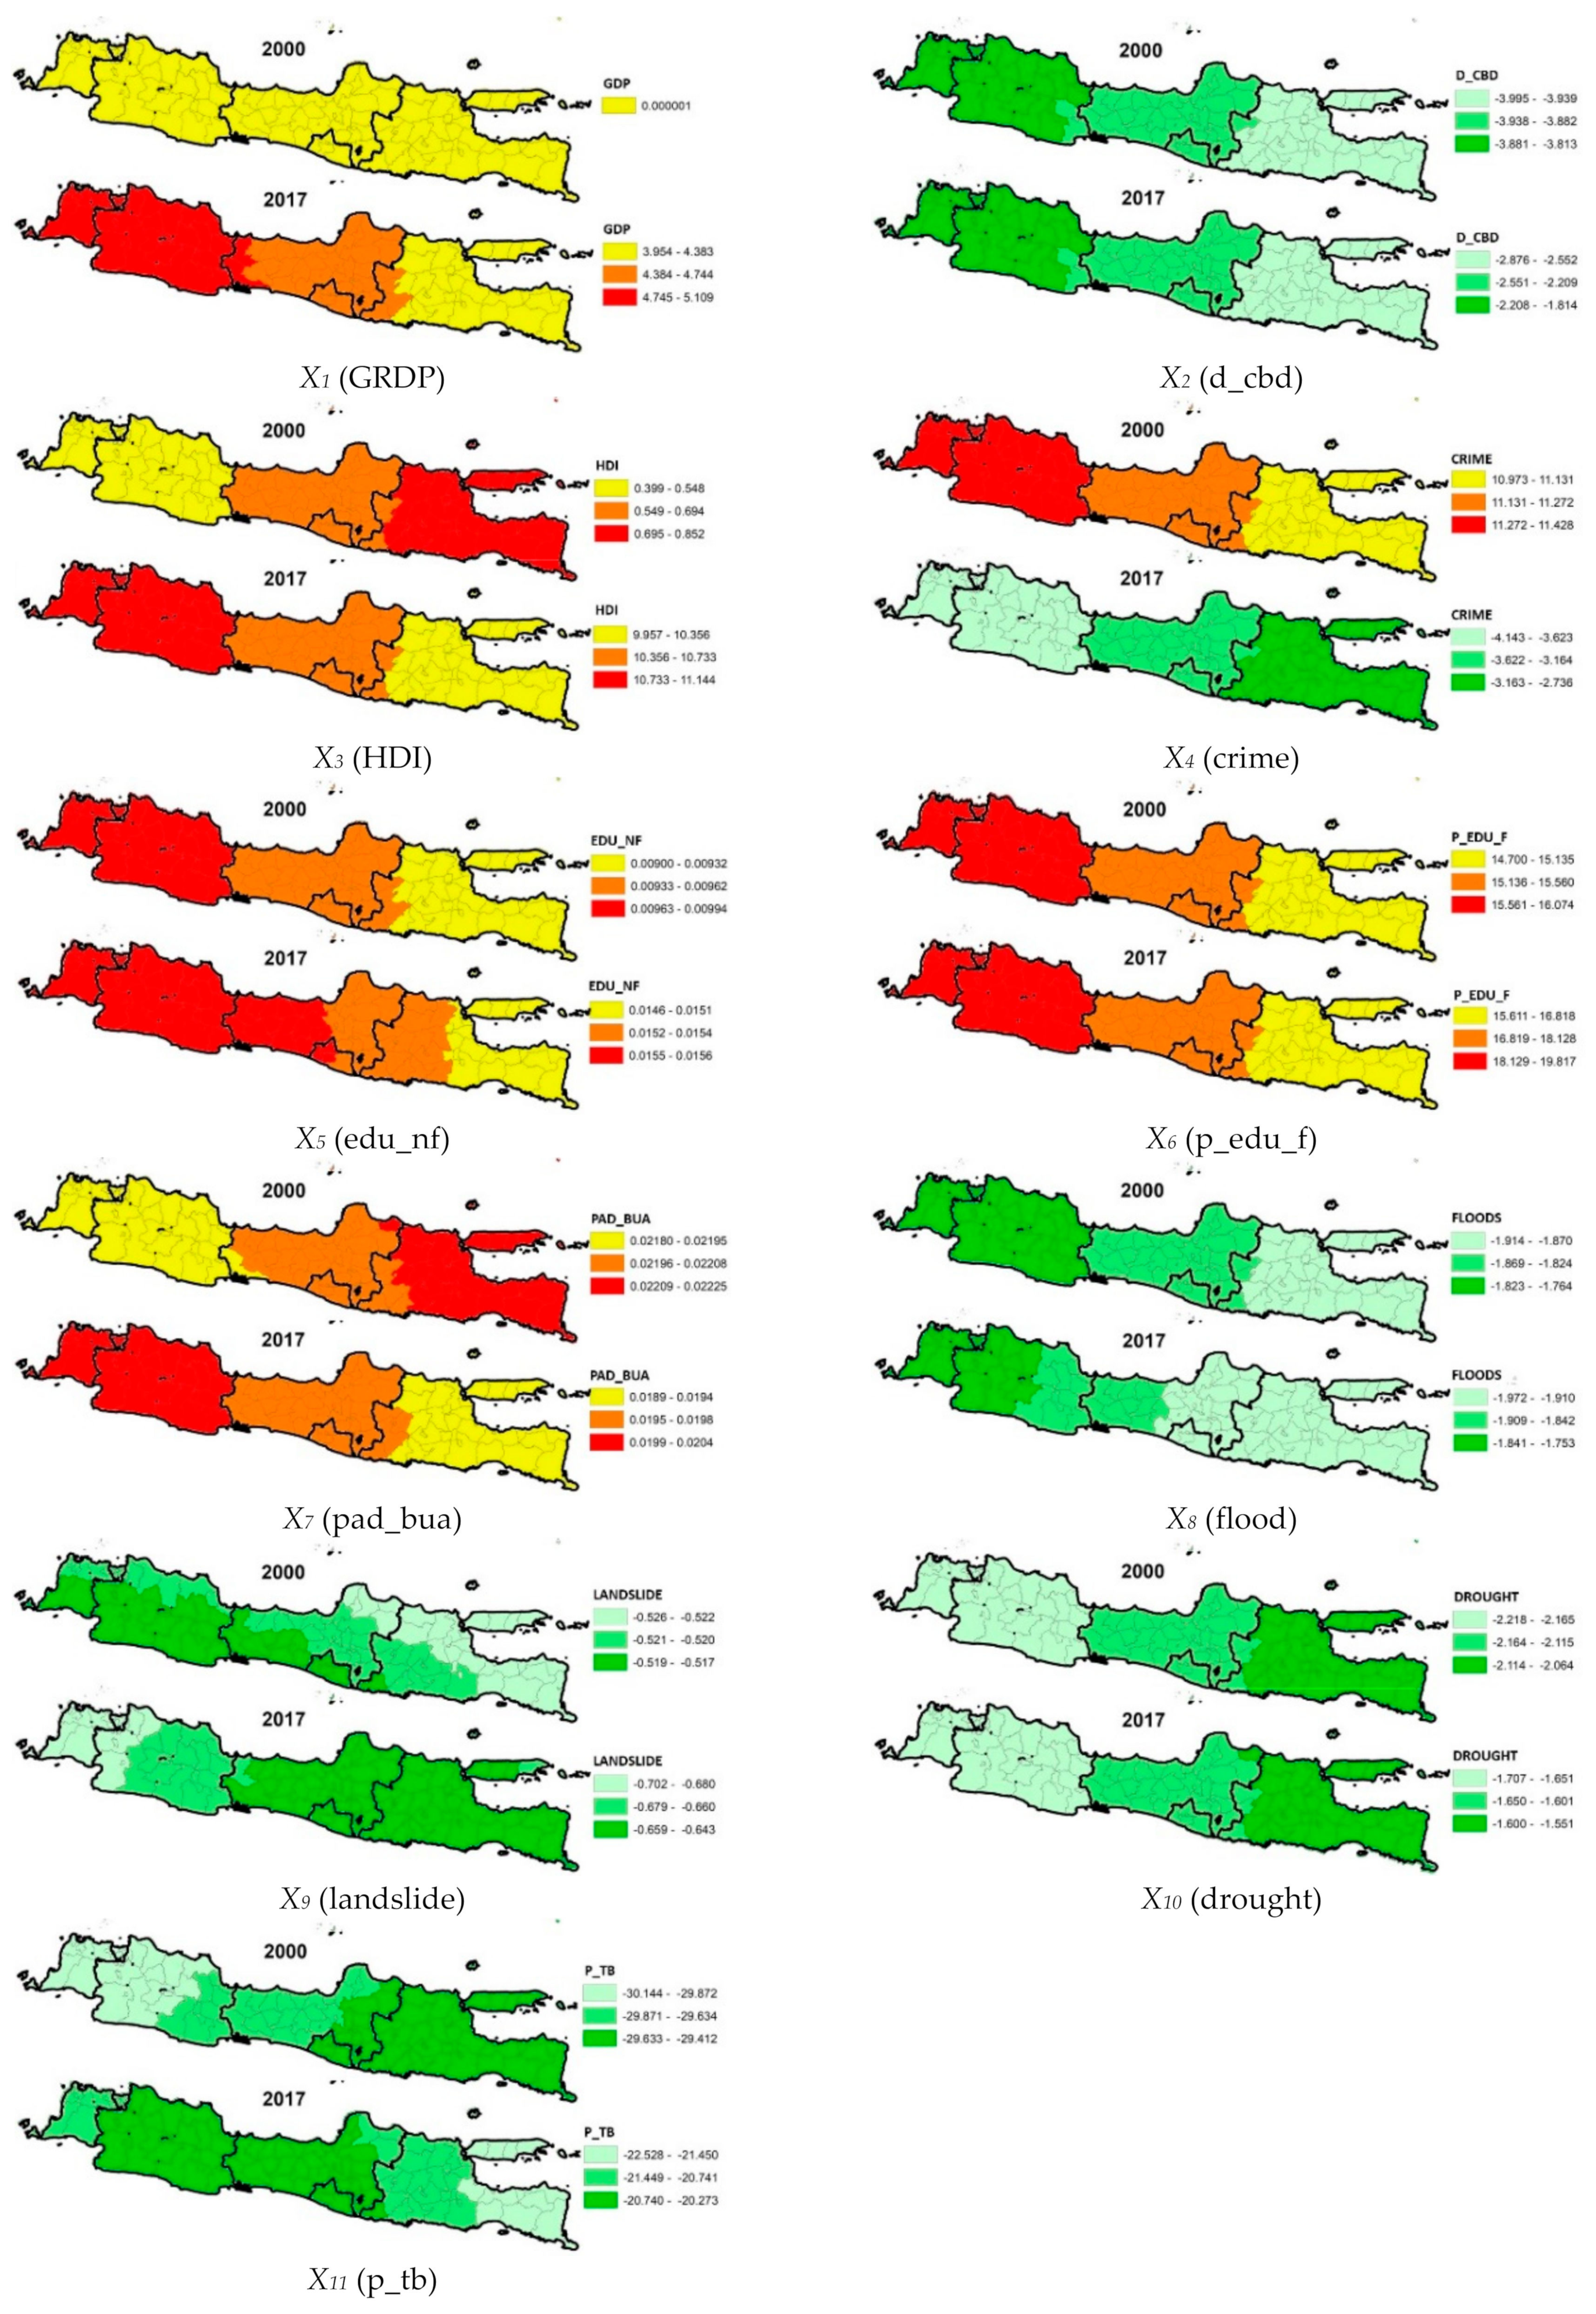
3.3. Local Driving Factors Affecting Regional Development of Java

Because the 11 dependent variables examined in OLS were all statistically significant, they were also used in GWR. The spatial pattern of the R-square was shifted from 2000 to 2017. In general, the GWR model of 2017 features higher local R-square values than that of 2000. The local R-square determined for 2000 was relatively the same across regions. It might show a gradual increase from the western to the eastern part of Java, but the local R-square in 2000 showed the relatively narrow range of 0.669 to 0.671 (Figure 2).
For 2017, the range of the local R-square was larger than it had been, reaching 0.757 to 0.778. For 2017, the westernmost part of Java had the highest local R-square score, whereas the easternmost part had the lowest score. The gradual decline existed from the west to the east. The shift in local R-square might be caused by the higher intensity of development in western Java than in eastern Java from 2000–2017.
The GRDP (X1) and HDI (X3) showed a positive relation to RDI. In the 2017 model, they had a notably higher regression coefficient to explain RDI than that of 2000 (Figure 3). Then, the number of non-formal and percentage of formal educational facilities (X5 and X6) had a similar regression coefficient to RDI between 2000 and 2017. Environmental issues (floods, landslides, and droughts; X8, X9, and X10, respectively) negatively impacted RDI, with relatively similar estimated parameters between 2000 and 2017. Paddy conversion was found to be positively correlated with RDI both in 2000 and 2017, with similar parameter estimate values. The distance to the CBD (X2) and tuberculosis occurrence (X11) were negative predictors for the RDI. Finally, the coefficient of criminal occurrence was inconsistent between 2000 and 2017; it was positively connected to the RDI of 2000, but it became negative for the 2017 model.
In general, GWR models demonstrate the same pattern: a regular gradation of coefficient values from west to east. However, exceptions still exist, particularly for landslides. The RDI of the western part of Java had a stronger positive effect, due to GRDP (X1) and HDI (X3), than eastern Java. Jakarta, as a metropolitan and port city located in western Java, played a crucial role in creating the GRDP and HDI of the surrounding regions [41].
The pattern shift of the regression coefficient occurred in paddy conversion, tuberculosis incidence, landslides, and crime rate (Figure 3). The RDI of the eastern regions initially was strongly related to paddy conversion. However, this conversion gained prominence in explaining the RDI of western Java for the 2017 model. The opposite pattern was seen in tuberculosis incidence. The RDI of western Java was initially vulnerable to tuberculosis incidence, but that influence was more decisive for eastern Java in the 2017 model.
The pattern of the regression coefficient for landslides might be different from that of others, which tends to show a gradual change from north to south. Landslides are strongly related to hilly landscapes and may indicate a low regional environmental capacity to support human activities. The southern part of Java is more mountainous than the northern part [42]. Thus, landslides on the south were more intensive than on the north side. The reduced evidence of landslides on the north side had a substantial effect on the high RDI.
Finally, the changes in the crime rate showed the greatest contrast. For the 2000 model, crime occurrence had a positive correlation on RDI. This implies that crime rates are related to the level of regional development. Meanwhile, in the 2017 model, areas with a high RDI were characterized by low crime rates. We predict that this was due to the increasingly large contrasts in poverty levels between municipalities and regencies, leading to higher crime rates in regencies (areas with low RDI).

4. Discussion

4.1. Imbalanced Spatial Distribution of RDI

The more developed regions of Java are concentrated in metropolitan areas or large municipalities and their surrounding areas [43] as indicated in Section 3.1. Such a concentrated pattern increased after the government policy instituted an open economy during the New Order, 1966–1998 [22]. Regions with the appropriate conditions for industrialization, such as concentrated population and suitable infrastructure, caught up with investment earlier [44]. These regions were largely bordering the metropolitan or large cities. Port cities like Jakarta and Surabaya obtained the highest benefits from this policy. Subsequently, the development of a centralized region created an imbalance between districts directly adjacent to metropolitan areas and districts located far from the metropolitan area [41].

4.2. Driving Factors of Regional Development of Java

Social and economic aspect, land use aspect, and environmental degradation are linked to the level of regional development, but their roles are not always supporting. The presence of some attributes may have elevated the development level of a regions, while the presence of others was an impediment to development. GRDP undeniably has positive connection to development, as has been addressed by many scholars. The HDI and educational infrastructure are also known to be vital. HDI has a non-decreasing marginal return due to the belief that a person with a higher level of education can more easily obtain additional knowledge [45]. Human capital promoting technological improvement is a factor in the endogenous growth theory, which emphasizes that technological change is the result of tax policy, basic research funding, and education. These factors may indicate the presence of researchers and entrepreneurs who can respond to economic incentives and potentially influence the long-run prospects of the economy [46,47].
However, there are some phenomena that should be carefully interpreted while addressing regional development of Java. Firstly, development in Java is typically associated with the conversion of paddies. Unfortunately, this phenomenon has brought another issue to light, i.e., the loss of fertile land that is vital for sustaining the country’s food supply [31]. The presence of this issue is followed by the poverty caused by the rising number of farmworkers (agricultural laborers without land ownership). Furthermore, Pribadi and Pauleit [48] have shown that paddy conversion has led farmers to open lands with less suitable conditions for farming activities, such as in hilly landscapes around mountains. Hence, maintaining the level of development while protecting agricultural land to meet the food demand should be a highlight of the agenda.
Secondly, the level of regional development is in line with the occurrence of crime (X4) in the regions. On the one hand, this result shows the social consequences of increasing development. This might indicate that the development of Java’s regions, especially those that are highly developed, did not guarantee meeting the basic needs of all people. In developing countries, wealth is often accumulated by a small percentage of people. As a result, wealth spreads unevenly among communities. The World Bank [49] has shown that the Gini ratio of Indonesia has been above 4.0 since 2011, whereas in previous years, it was always below 4.0. In Java, crime and social conflicts are often linked with worsening inequality [29]. Thus, increasing development should not come hand-in-hand with increasing crime rates, which is only possible by alleviating the inequality.
Then, low environmental carrying capacity–proxied by the evidence of flood, landslide, and drought in this article–is the one hindering the regional growth. Natural disasters often limit the possible activities of the local people. However, in another perspective, it should also be noted that natural disasters are often caused by development activities itself [50]. Large cities often experience environmental degradation as negative externality of economic activities. Thus, at one site, a natural disaster may be an inherent barrier in the region, while at another, it is a sign that development exceeds the environmental carrying capacity.

4.3. The Spatial Shift of Development’s Driving Factors

During the last two decades, there has been as shift in the explanatory power of development’s driving factors over Java’s regions. In 2000, eastern Java was slightly higher to be affected by the factors of regional development, discussed in Section 4.2, than western Java. However, such pattern of explanatory power reversed in 2017. The higher intensity of development in western Java over the east from 2000–2017 might be the cause. The western part of Java, especially around Jakarta metropolitan area, remained attractive for laborers and companies.
Despite social problems in Jakarta due to in-migration, agglomeration has continued throughout 2000–2017. Moreover, a tendency toward conurbation was seen between metropolitan Jakarta and metropolitan Bandung [31], where both are in the western part of Java. On the other hand, Jakarta, as the capital city of Indonesia, is known for its high population density, which continues to increase year-by-year because of urban agglomeration, especially along the toll roads area in the northern part, and the non-toll roads area in the southern part of the region.
Some phenomena strengthened the spatial shift of the driving factors in explaining development level. Firstly, in recent decades, a massive paddy conversion has occurred in western Java, due to the higher rate of urbanization, especially in the northern part of western Java, than in other parts of the island [2,31]. Secondly, massive urbanization and agglomeration in western Java during the last two decades accelerated their GRDP and HDI. Thirdly, the incidence of tuberculosis somehow intensified in western Java during, especially in 2017. Due to urbanization and agglomeration, western Java is more densely populated, accelerating the transmission of this disease. However, the most suffering regions are those located in southern side of western Java, which were less developed than the north.

5. Conclusions

This study showed that the level of regional development of Java has improved over the past two decades. Generally, the regional development level is affected by factors related to social, economic, infrastructure, land use, and environmental barriers. HDI, education facilities, GRDP, and paddy conversion into built-up areas have a positive impact on the regional development levels. However, environmental barriers (floods, landslides, droughts, and tuberculosis) have negatively impacted the region’s development level. The spatial pattern of the power of local driving factors shifted between 2000 and 2017, especially in terms of the following factors: HDI, landslide, paddy conversion, tuberculosis, and crime. Initially, the development level of the eastern part of Java could be largely explained by HDI, landslides, and paddy conversions in 2000. However, the profound development of western Java during over the past two decades was largely responsible for similar changes in 2017. Java’s mega-urbanization appears unstoppable, and it is a daunting challenge for the central and local governments to manage spatial urban growth and improve regional development in Java in the near future. These research results can be used as an evaluation tool to provide place-based policy for reducing regional disparity in Java and contribute further recommendations to the central and local governments for determining policies aiming at improving regional development in each regency/municipality. This study has some limitations. First is the concept of regional development level that we use, which focuses on infrastructure; while it provides a better picture of the population’s purchasing power and preferences, as represented by the ratio between the number of facilities per population, it also reduces other dimensions, including economic performance, institutions, human resources, and the environment. In addition, we also failed to consider the quality of the infrastructure. Second, the level of development within a region actually varies (MAUP/modifiable area unit problem), such as between sub-districts; however, in this article, such within-region variations are deemed homogeneous. MAUP may accelerate the biased result. The third limitation is the possibility of reciprocal relationships between the independent variables, which are not thematized. For our analytical technique, we only employ straight-line distance measures from the centroid in the GWR. Our study area also has issues in the GWR: some regencies (e.g., in Madura Island) are separated from mainland Java. The analysis may be biased due to this issue. For future research, we suggest that the analysis be done at the sub-district level, or in smaller units, to capture the development of spatial areas more accurately. The concept of development level should include economic, social, and environmental performances, which are considered pillars of the Sustainable Development Goals. Types of distance also should be more varied, taking economic or time distance into account as well.

Author Contributions

Conceptualization, Andrea Emma Pravitasari, Ernan Rustiadi and Izuru Saizen; data curation, Setyardi Pratika Mulya; formal analysis, Rista Ardy Priatama, Alfin Murtadho, and Siti Wulandari; methodology, Andrea Emma Pravitasari and Ernan Rustiadi; supervision, Andrea Emma Pravitasari; writing—original draft, Adib Ahmad Kurnia, Candraningratri Ekaputri Widodo and Siti Wulandari; writing—review and editing, Andrea Emma Pravitasari, Rista Ardy Priatama, and Candraningratri Ekaputri Widodo. All authors have read and agreed to the published version of the manuscript.

Funding

This research and the APC were funded by the Directorate of Research and Community Service (DPRM), Ministry of Education, Culture, Research, and Technology, Republic of Indonesia. (Contract no: 1/E1/KP.PTNBH/2021).

Data Availability Statement

The data presented in this study are available on request from the corresponding author. The data, indeed, can be accessed on the website of Statistics Agency—precisely on the provincial, regency, and municipality Statistics Agencies’ websites. The data available online have not been unified in a single dataset. To obtain the data of individual cases, e.g., of Bogor Regency, one may search on https://jabar.bps.go.id accessed on 18 November 2021 (Statistics Agency of West Java Province) or https://bogorkab.bps.go.id accessed on 15 November 2021 (Statistics Agency of Bogor Regency). Our data are not publicly available because the data were obtained by an agreement between the Department of Soil Science and Land Resource (IPB University) and the Indonesia Statistics Agency.

Conflicts of Interest

The authors declare no conflict of interest. The funders had no role in (a) the design of the study; (b) the collection, analyses, or interpretation of data; (c) the writing of the manuscript; or (d) the decision to publish the results.

References

  1. Jones, G.W. The 2010–2035 Indonesian Population Projection: Understanding the Causes, Consequences and Policy Option for Population and Development; UNFPA Indonesia: Jakarta, Indonesia, 2013. [Google Scholar]
  2. Pravitasari, A.E. Study on Impact of Urbanization and Rapid Urban Expansion in Java and Jabodetabek Megacity, Indonesia. Thesis, Kyoto University, Kyoto, Japan. 2015. Available online: https://www.researchgate.net/profile/Andrea-Pravitasari-2/publication/303859966_STUDY_ON_IMPACT_OF_URBANIZATION_AND_RAPID_URBAN_EXPANSION_IN_JAVA_AND_JABODETABEK_MEGACITY_INDONESIA/links/5759097208aed88462068475/STUDY-ON-IMPACT-OF-URBANIZATION-AND-RAPID-URBAN-EXPANSION-IN-JAVA-AND-JABODETABEK-MEGACITY-INDONESIA.pdf (accessed on 19 November 2021).
  3. Pravitasari, A.E.; Rustiadi, E.; Mulya, S.P.; Widodo, C.E.; Indraprahasta, G.S.; Fuadina, L.N.; Karyati, N.E.; Murtadho, A. Measuring Urban and Regional Sustainability Performance in Java: A Comparison Study Between 6 Metropolitan Areas. In Proceedings of the 6th International Conference of Jabodetabek Study Forum, Bogor, Indonesia, 29–30 August 2018. [Google Scholar] [CrossRef]
  4. Firman, T. The urbanisation of Java, 2000tal spillovers, ‘the island of mega-urban regions’. Asian Popul. Stud. 2017, 13, 50–66. [Google Scholar] [CrossRef]
  5. Statistics Agency. Produk Domestik Regional Bruto Provinsi-Provinsi di Indonesia Menurut Lapangan Usaha 2015–2019; Statistics Agency: Jakarta, Indonesia, 2020. [Google Scholar]
  6. Firdaus, M.; Krismanti, W.R. The Dynamics of Regional Disparity in Java Island After Fiscal Decentralization. Int. J. Econ. Manag. 2012, 6, 150–166. [Google Scholar]
  7. Rustiadi, E.; Panuju, D.R.; Pravitasari, A.E. Java Island: Regional Disparity and Sustainability Perspective. J. Kinerja 2010, 14, 94–114. [Google Scholar]
  8. Rustiadi, E.; Pribadi, D.O.; Pravitasari, A.E.; Agrisantika, T. The Dynamics of Population, Economic Hegemony and Land Use/Cover Change of Jabodetabek Region (Jakarta Megacity). Atlas 2012, 5, 51–56. [Google Scholar]
  9. Agusta, I. Ketimpangan Wilayah Dan Kebijakan Penanggulangan Di Indonesia; Yayasan Pustaka Obor Indonesia: Bogor, Indonesia, 2014. [Google Scholar]
  10. McCall, T. What Do We Mean by Regional Development? Institute for Regional Development, University of Tasmania: Tasmania, Australia, 2010. [Google Scholar]
  11. Hu, Z.; Wang, Y.; Liu, Y.; Long, H.; Peng, J. Spatio-Temporal Patterns of Urban-Rural Development and Transformation in East of the “Hu Huanyong Line”, China. ISPRS Int. J. Geo-Inf. 2016, 5, 24. [Google Scholar] [CrossRef] [Green Version]
  12. World Bank. World Development Report 2009: Reshaping Economic Geography; The World Bank: Washington, DC, USA, 2009; Volume 1. [Google Scholar] [CrossRef]
  13. Hudalah, D.; Firman, T. Beyond Property: Industrial Estates and Post-Suburban Transformation in Jakarta Metropolitan Region. Cities 2012, 29, 40–48. [Google Scholar] [CrossRef]
  14. Cui, X.; Li, S.; Wang, X.; Xue, X. Driving Factors of Urban Land Growth in Guangzhou and Its Implications for Sustainable Development. Front. Earth Sci. 2019, 13, 464–477. [Google Scholar] [CrossRef]
  15. Bhatti, S.S.; Tripathi, N.K. Built-up area extraction using Landsat 8 OLI imagery. GIScience Remote. Sens. 2014, 51, 445–467. [Google Scholar] [CrossRef] [Green Version]
  16. Pravitasari, A.E.; Saizen, I.; Tsutsumida, N.; Rustiadi, E.; Pribadi, D.O. Local Spatially Dependent Driving Forces of Urban Expansion in an Emerging Asian Megacity: The Case of Greater Jakarta (Jabodetabek). J. Sustain. Dev. 2015, 8, 108. [Google Scholar] [CrossRef] [Green Version]
  17. Long, H.; Heilig, G.K.; Li, X.; Zhang, M. Socio-Economic Development and Land-Use Change: Analysis of Rural Housing Land Transition in the Transect of the Yangtse River, China. Land Use Policy 2007, 24, 141–153. [Google Scholar] [CrossRef]
  18. Dou, H.; Zhao, X. Climate Change and Its Human Dimensions Based on GIS and Meteorological Statistics in Pearl River Delta, Southern China. Meteorol. Appl. 2011, 18, 111–122. [Google Scholar] [CrossRef]
  19. Kurnia, A.A.; Rustiadi, E.; Pravitasari, A.E. Characterizing Industrial-Dominated Suburban Formation Using Quantitative Zoning Method: The Case of Bekasi Regency, Indonesia. Sustainability 2020, 12, 8094. [Google Scholar] [CrossRef]
  20. Sapena, M.; Ruiz, L.Á. Analysis of Land Use/Land Cover Spatio-Temporal Metrics and Population Dynamics for Urban Growth Characterization. Comput. Environ. Urban Syst. 2019, 73, 27–39. [Google Scholar] [CrossRef]
  21. Frick, S.A.; Rodríguez-Pose, A. Change in Urban Concentration and Economic Growth. World Dev. 2018, 105, 156–170. [Google Scholar] [CrossRef]
  22. Resosudarmo, B.; Vidyattama, Y. Regional Income Disparity in Indonesia: A Panel Data Analysis. ASEAN Econ. Bull. 2006, 23, 31–44. [Google Scholar] [CrossRef]
  23. Sukwika, T. Peran Pembangunan Infrastruktur terhadap Ketimpangan Ekonomi Antarwilayah di Indonesia. J. Wil Dan Lingkung. 2018, 6, 115. [Google Scholar] [CrossRef]
  24. Talitha, T.; Firman, T.; Hudalah, D. Welcoming two decades of decentralization in Indonesia: A regional development perspective. Territ. Polit. Gov. 2020, 8, 690–708. [Google Scholar] [CrossRef]
  25. Hill, H.; Resosudarmo, B.P.; Vidyattama, Y. Indonesia’s Changing Economic Geography. Bull. Indones. Econ. Stud. 2008, 44, 407–435. [Google Scholar] [CrossRef]
  26. Pravitasari, A.E.; Saizen, I.; Rustiadi, E. Towards Resilience of Jabodetabek Megacity: Developing Local Sustainability Index with Considering Local Spatial Interdependency. Int. J. Sustain. Future Hum. Secur. 2016, 4, 27–34. [Google Scholar] [CrossRef]
  27. Ramadhan, A.; Sutandi, A.; Pravitasari, A.E. Analysis of The Regional Development Level in Aceh Province. In Proceedings of the 6th International Conference of Jabodetabek Study Forum, Bogor, Indonesia, 29–30 August 2018. [Google Scholar] [CrossRef]
  28. Murtadho, A.; Pravitasari, A.E.; Munibah, K.; Rustiadi, E. Spatial distribution pattern of village development index in Karawang Regency using spatial autocorrelation approach. J. Pembang. Wil. Dan Kota. 2020, 16, 102–111. [Google Scholar] [CrossRef]
  29. Tadjoeddin, M.Z.; Yumna, A.; Gultom, S.E.; Rakhmadi, M.F.; Hidayat, M.F.; Suryahadi, A. Ketimpangan Dan Stabilitas Di Indonesia Yang Demokratis Dan Terdesentralisasi; Hadiz, L., Ed.; The SMERU Research Institute: Jakarta, Indonesia, 2017. [Google Scholar]
  30. Zhu, J.; Simarmata, H.A. Formal Land Rights versus Informal Land Rights: Governance for Sustainable Urbanization in the Jakarta Metropolitan Region, Indonesia. Land Use Policy 2015, 43, 63–73. [Google Scholar] [CrossRef]
  31. Rustiadi, E.; Pravitasari, A.E.; Setiawan, Y.; Mulya, S.P.; Pribadi, D.O.; Tsutsumida, N. Impact of Continuous Jakarta Megacity Urban Expansion on the Formation of the Jakarta-Bandung Conurbation over the Rice Farm Regions. Cities 2021, 111, 103000. [Google Scholar] [CrossRef]
  32. Wijaya, H.B.; Kurniawati, H.; Hutama, S.T.E.W. Industrialization Impact on Worker Mobility and Land Use in Peri Urban Area (Case study of Semarang District, Indonesia). In Proceedings of the 2nd Geoplanning—International Conference on Geomatics and Planning, Surakarta-Central Java, Indonesia, 9–10 August 2017. [Google Scholar] [CrossRef]
  33. Fuadina, L.N.; Rustiadi, E.; Pravitasari, A.E. Analisis Faktor-Faktor yang Mempengaruhi Urban Sprawl di Kawasan Cekungan Bandung. TATALOKA 2021, 23, 105–114. [Google Scholar] [CrossRef]
  34. Fotheringham, A.S.; Brunsdon, C.; Charlton, M. Geographically Weighted Regression: The Analysis of Spatially Varying Relationships; John Wiley & Sons: Chicester, UK, 2002. [Google Scholar]
  35. Yu, D. Spatial Varying Development Mechanisms in the Great Beijing Area. Ann. Reg. Sci. 2006, 40, 173–190. [Google Scholar] [CrossRef]
  36. Clement, F.; Orange, D.; Williams, M.; Mulley, C.; Epprecht, M. Drivers of Afforestation in Northern Vietnam: Assessing Local Variations Using Geographically Weighted Regression. Appl. Geogr. 2009, 29, 561–576. [Google Scholar] [CrossRef]
  37. Jaimes, N.B.P.; Sendra, J.B.; Delgado, M.G.; Plata, R.F. Exploring the Driving Forces behind Deforestation in the State of Mexico (Mexico) Using Geographically Weighted Regression. Appl. Geogr. 2010, 30, 576–591. [Google Scholar] [CrossRef]
  38. Farrow, A.; Larrea, C.; Hyman, G.; Lema, G. Exploring the Spatial Variation of Food Poverty in Ecuador. Food Policy 2005, 30, 510–531. [Google Scholar] [CrossRef] [Green Version]
  39. Malczewski, J.; Poetz, A. Residential Burglaries and Neighborhood Socioeconomic Context in London, Ontario: Global and Local Regression Analysis. Prof. Geogr. 2005, 57, 516–529. [Google Scholar] [CrossRef]
  40. Pravitasari, A.E.; Rustiadi, E.; Mulya, S.P.; Setiawan, Y.; Fuadina, L.N.; Murtadho, A. Identifying the Driving Forces of Urban Expansion and Its Environmental Impact in Jakarta-Bandung Mega Urban Region. In Proceedings of the 4th International Symposium on LAPAN-IPB Satellite for Food Security and Environmental Monitoring, Bogor, Indonesia, 9–11 October 2017. [Google Scholar] [CrossRef] [Green Version]
  41. Kurnianto, F.A.; Baskara, M.R.A.; Alfani, A.F.; Febrian, F.; Lestari, N. An Overview of Landscapes and Stratigraphy in Tertiary and Quartenary Volcanic Regions of East Java Indonesia. Int. J. Sci. Technol. Res. 2019, 8, 165–170. [Google Scholar]
  42. Buchori, I.; Sugiri, A.; Maryono, M.; Pramitasari, A.; Pamungkas, I.T.D. Theorizing Spatial Dynamics of Metropolitan Regions: A Preliminary Study in Java and Madura Islands, Indonesia. Sustain. Cities Soc. 2017, 35, 468–482. [Google Scholar] [CrossRef]
  43. Setyono, J.S.; Yunus, H.S.; Giyarsih, S.R. The Spatial Pattern of Urbanization and Small Cities Development in Central Java: A Case Study of Semarang-Yogyakarta-Surakarta Region. J. Geomatics Plan. 2016, 3, 53–66. [Google Scholar] [CrossRef] [Green Version]
  44. Hill, H.; Resosudarmo, B.P.; Vidyattama, Y. Economic Geography of Indonesia: Location, Connectivity, and Resources. In Reshaping Economic Geography in East Asia; Huang, Y., Magnoli Bocchi, A., Eds.; World Bank: Washington, DC, USA, 2009; pp. 115–134. [Google Scholar]
  45. Ghosh, T.; Parab, P.M. Assessing India’s productivity trends and endogenous growth: New evidence from technology, human capital and foreign direct investment. Econ. Model. 2021, 97, 182–195. [Google Scholar] [CrossRef]
  46. Romer, P.M. Endogenous Technological Change. J. Political Econ. 1990, 98, S71–S102. [Google Scholar] [CrossRef] [Green Version]
  47. Jones, C.I. Paul Romer: Ideas, Nonrivalry, and Endogenous Growth. Scand. J. Econ. 2019, 121, 859–883. [Google Scholar] [CrossRef]
  48. Pribadi, D.O.; Pauleit, S. The Dynamics of Peri-Urban Agriculture during Rapid Urbanization of Jabodetabek Metropolitan Area. Land Use Policy 2015, 48, 13–24. [Google Scholar] [CrossRef]
  49. World Bank. Indonesia’s Rising Divide; World Bank: Jakarta, Indonesia, 2016. [Google Scholar]
  50. Vollmer, D.; Pribadi, D.O.; Remondi, F.; Rustiadi, E.; Grêt-Regamey, A. Prioritizing Ecosystem Services in Rapidly Urbanizing River Basins: A Spatial Multi-Criteria Analytic Approach. Sustain. Cities Soc. 2016, 20, 237–252. [Google Scholar] [CrossRef]
Figure 1. Spatiotemporal distribution pattern of RDI of Java.
Ijgi 10 00812 g001
Figure 2. Local R-square of RDI in 2000 and 2017 based on the GWR model.
Ijgi 10 00812 g002
Figure 3. Parameter estimates of independent variables by GWR model. fGRDP (Gross regional domestic product); d_cbd (Distance to the central business district; HDI (Human development index); crime (Crime rate in the region); edu_nf (non-formal educational facilities; p_edu_nf (Ratio of formal educational facilities to the total population; pad_bua (Area converted from paddy to built-up land in the last 3 years; flood (Number of floods); landslides (Number of landslides); drought (Number of drought); p_tb (Percentage of people suffering from tuberculosis).
Ijgi 10 00812 g003
Table 1. Independent variables (X) included in the OLS and GWR models.
AspectVariableCode
EconomicGross regional domestic product (GRDP) (constant price)X1 (GRDP)
Distance to the central business district (CBD)X2 (d_cbd)
SocialHuman Development Index (HDI)X3 (HDI)
Crime rate in the regionX4 (crime)
InfrastructureNon-formal educational facilitiesX5 (edu_nf)
Ratio of formal educational facilities to the total populationX6 (p_edu_f)
Land useArea converted from paddy to built-up land in the last 3 yearsX7 (pad_bua)
Environmental barriersNumber of floodsX8 (flood)
Number of landslides X9 (landslide)
Number of droughts X10 (drought)
Percentage of people suffering from tuberculosis (TB)X11 (p_tb)
Table 2. OLS regression summary.
CodeBetaStd Err. of BetaBStd Err. of Bt(106)p-Level
Intercept −66.30723.493−2.8220.006
X1 (GRDP)0.2460.0590.0000.0004.1330.000
X2 (d_cbd)−0.1660.070−2.0000.840−2.3800.019
X3 (HDI)0.4720.0771.7650.2886.1320.000
X4 (crime)0.2390.0618.8752.2883.8780.000
X5 (edu_nf)0.2310.0850.0140.0052.7030.008
X6 (p_edu_f)0.3150.06517.8583.6724.8630.000
X7 (pad_bua)0.2550.0810.0210.0073.1530.002
X8 (flood)−0.2490.049−2.0010.392−5.1130.000
X9 (landslide)−0.1150.053−0.5640.261−2.1620.033
X10 (drought)−0.1250.059−1.5230.720−2.1140.037
X11 (p_tb)−0.1290.049−20.9297.947−2.6340.009
fGRDP (Gross regional domestic product); d_cbd (Distance to the central business district; HDI (Human development index); crime (Crime rate in the region); edu_nf (non-formal educational facilities; p_edu_nf (Ratio of formal educational facilities to the total population; pad_bua (Area converted from paddy to built-up land in the last 3 years; flood (Number of floods); landslides (Number of landslides); drought (Number of drought); p_tb (Percentage of people suffering from tuberculosis).
Publisher’s Note: MDPI stays neutral with regard to jurisdictional claims in published maps and institutional affiliations.

