
SDG Indicator 11.3.1 and Secondary Cities: An Analysis and Assessment

1
Department of Ecosystem Science and Sustainability, Colorado State University, Fort Collins, CO 80523-1476, USA
2
Lincoln Institute of Land Policy, 11010 North Tatum Boulevard, Suite D-101, Phoenix, AZ 85028, USA
3
Department of Anthropology and Geography, Colorado State University, Fort Collins, CO 80523-1787, USA
*
Author to whom correspondence should be addressed.
ISPRS Int. J. Geo-Inf. 2021, 10(11), 713; https://0-doi-org.brum.beds.ac.uk/10.3390/ijgi10110713
Submission received: 9 August 2021
/
Revised: 25 September 2021
/
Accepted: 15 October 2021
/
Published: 20 October 2021
(This article belongs to the Special Issue Geographical Analysis, Urban Modelling, Spatial Statistics, Econometric and Multidimensional Evaluation in Urban Environment)
Abstract
:Secondary cities are rapidly growing areas in low- and middle-income countries that lack data, planning, and essential services for sustainable development. Their rapid, informal growth patterns mean secondary cities are often data-poor and under-resourced, impacting the ability of governments to target development efforts, respond to emergencies, and design sustainable futures. The United Nations’ Sustainable Development Goal (SDG) 11 focuses on inclusive, safe, resilient, and sustainable cities and human settlements. SDG Indicator (SDGI) 11.3.1 calculates the ratio of land consumption rate to population growth rate to enhance inclusive and sustainable urbanization. Our paper compares three cities—Denpasar, Indonesia; Kharkiv, Ukraine; and Mekelle, Ethiopia—that were part of the Secondary Cities (2C) Initiative of the U.S. Department of State, Office of the Geographer and Global Issues to assess SDGI 11.3.1. The 2C Initiative focused on field-based participatory mapping for data generation to assist city planning. Urban form and population data are critical for calculating and visually representing this ratio. We examine the spatial extent of each city to assess land use efficiency (LUE) and track changes in urban form over time. With limited demographic and spatial data for secondary cities, we speculate whether SDGI 11.3.1 is useful for small- and medium-sized cities.
1. Introduction
The 21st century is experiencing the emergence of the world’s secondary cities as major urbanizing areas. Secondary cities are defined by population, size, function, economic importance, and their regional influence within the country. The population of a secondary city may range between 10% and 50% of the country’s largest city. They are urban centers providing critical support functions for governance, transportation, and production services. Characteristically, they are poorly mapped with limited data and information on infrastructure, land tenure, and planning and exhibit rapid unplanned and informal growth patterns [1,2]. This creates numerous environmental security and sustainability issues that impact the ability of governments to implement development efforts, respond to emergencies, and design sustainable futures [3].
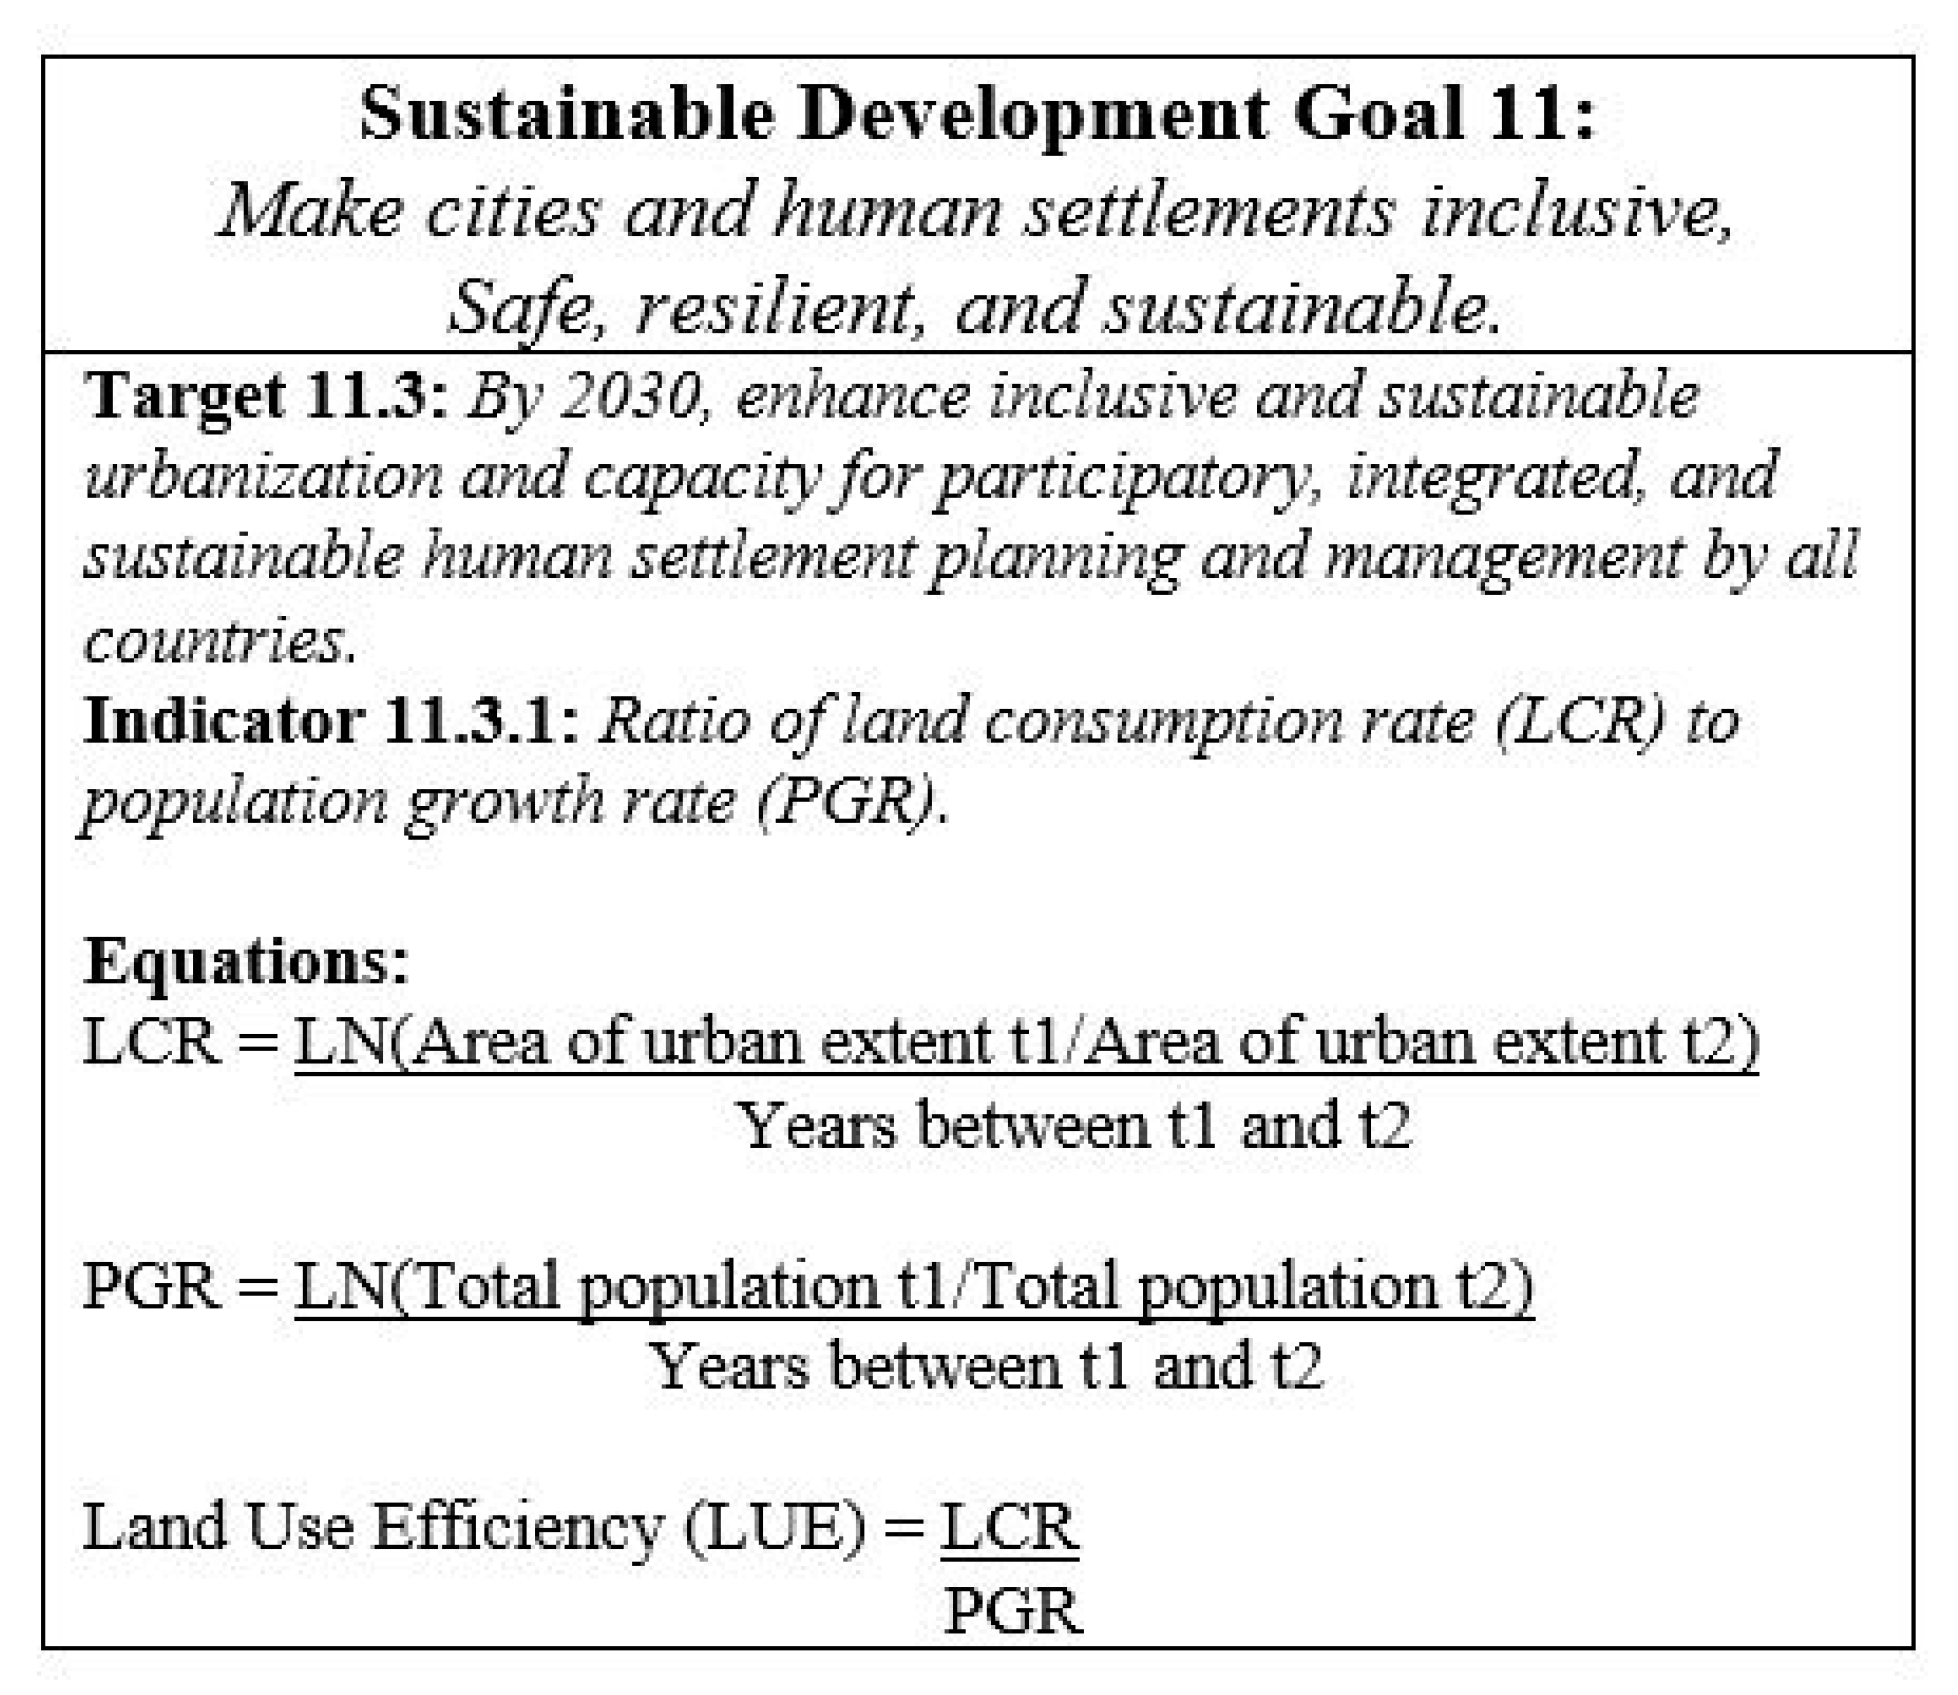
The Secondary Cities (2C) Initiative was a field-based initiative of the Office of the Geographer, U.S. Department of State. From 2015 to 2019, the 2C Initiative mapped secondary cities in low- and middle-income countries (LMICs) to address resilience (e.g., adaptive capacity of informal settlements to meet the needs of vulnerable populations), human security (e.g., access to basic services such as water, food, electricity, and housing), and emergency preparedness (e.g., planning for natural disasters). The project built local to global and public-private partnerships to improve geospatial capacity, enhance data generation, conduct local mapping, and enable science-based decision making for urban planning. The project objectives align with the urban Sustainable Development Goal (SDG) 11, to make cities and human settlements inclusive, safe, resilient, and sustainable, which includes SDG Target 11.3 (to enhance inclusive and sustainable urbanization and capacity for participatory, integrated, and sustainable human settlement planning and management in all countries by 2030) [4]. One of the measures developed to assess SDG Target 11.3 is SDG Indicator (SDGI) 11.3.1. Due to this close alignment with urban goals and our focus on geospatial data and participatory mapping, we chose to apply SDGI 11.3.1 to 2C Initiative cities, to measure how efficiently secondary cities utilize land [5].
SDGI 11.3.1 is defined as the ratio of land consumption rate (LCR) to population growth rate (PGR), a measure of land use efficiency (LUE), as the United Nations documentation. After Schiavina et al, we use Land Use Efficiency (LUE) in this paper rather than LCRPGR. Importantly, this is the same measure.Specifically, SDGI 11.3.1 highlights the urgency for participatory human settlement planning and management by demonstrating the relationship between two characteristics that measure city size—population and urban form. A city’s urban form is comprised of the spatial pattern of human activities, such as transportation development, services, housing and settlement structure [6,7,8]. Secondary cities are part of the rapidly growing urban landscape. Not only are secondary cities rapidly growing, but the number of secondary cities is also increasing. In 2030, there will be more than twice as many medium size cities as there were in 1990, outnumbering megacities. [9] Fueled by the rural to urban transformation and changing migration patterns in lower and middle income countries, secondary cities reflect socio-political changes where rapid urban expansion outstrips infrastructure and increases peri-urban areas (or informal settlements) [8,10].
In September 2015, the SDGs were adopted as a global indicator framework for monitoring progress agreed upon by United Nation member states. There are 17 SDGs that have 169 associated targets with 231 measurable indicators. UN 2030 Agenda for Sustainable Development identifies cities for explicit analysis to inform urban sustainable governance and responds to SDG 11 [11]. Classified as a sub-national unit, SDG includes cities in the reporting framework indicating their importance in regional and national development and their contribution to societal sustainability [12]. SDG 11, otherwise known as the ‘urban goal’ focuses on a sub-national unit of measurement—the city—composed of 10 targets ( cultural heritage, sustainable transportation, environmental standards, etc.) and 15 indicators (proportion of population living in urban slums, proportion of urban solid waste collected, etc.) [2]. One of the indicators for SDG 11 is SDGI 11.3.1, which measures LUE—the relationship between population density and urban form (Figure 1).
Population and urban form are directly related [13]. Urban form refers to the physical characteristics of a city—its size, area, and configuration [14]. SDGI 11.3.1 defines the functional urban form as the urban agglomeration inclusive of central city and outgrowth or the built-up area [4]. SDGI 11.3.1 evaluates whether a city is increasing at a rate less than, greater than, or at the same rate of population growth [5]. Between 2000 and 2014, the areas occupied by cities grew 1.28 times faster than their populations [15]. Generally, urban densities of cities have been declining, creating transportation networks, access to services, and environmental sustainability challenges [15]. To address these important urban issues, SDGI 11.3.1 aids in assessing and tracking city growth and the population where local data are needed for planning and development efforts, providing essential services, and implementing sustainable policies.
The SDG indicators are ranked into three tiers depending upon the level of methodological development and data availability for analysis. SDGI 11.3.1 is categorized as a Tier II indicator meaning that an established methodology exists, but data are not easily available despite that data availability is key to calculating this indicator. Simon et al. [12] identifies ten principles for SDG indicators, of which three in particular pertain to SDGI 11.3.1: the need for standard metrics in measuring urban development; the availability for reliable, open-sourced data; and the role of geospatial data and methods of disaggregation in order to track smaller-scale inequities of SDG outcomes. A few reasons these data are not readily available and SDGI 11.3.1 is particularly challenging to implement, include (1) urban areas around the world are very heterogeneous [1,12]; (2) there is no globally accepted definition of an urban area [11,13]; (3) there are no standardized metrics for measuring urban development [12]; and (4) data are unevenly available in different urban settings and national contexts [12,16].
Several case studies grapple with these common issues and assess the utility of SDGI 11.3.1 applied to a variety of cities around the world. These case studies are from both the Global North and South, utilize similar approaches, and reflect the heterogeneous-ness of cities as well as the challenge of implementing this metric. Simon et al. [12] compares five cities (Gothenburg, Sweden; Greater Manchester, UK; Cape Town, South Africa; Bangalore, India; Kisumu, Nigeria) to test the application of SDGI 11.3.1 across a representative sample of urban contexts and conditions around the world. Hansson et al. [17] builds on Simon et al. [12] and assesses sustainable urban development in Gothenburg, Sweden, discussing the challenge of applying global indicators in diverse urban contexts.
Several studies explore the application of SDGI 11.3.1. Koch and Krellenberg [18] describe how this indicator is designed to scale up from local to regional to national levels playing a major role for examining and understanding cities. They explore the relationship between national-urban interactions in Germany to assess how SDGs can be implemented in cities and contextualized for specific urban geographies to inform urban sustainability in national policy [18]. Nicolau et al. [19] and Wang et al. [20] explore the application of SDGI 11.3.1 in the national context. Wang et al. [20] discusses the use of earth observation data as a critical data source for measuring urban growth in China. Nicolau et al. [19] describes the utility of land use/land cover data in calculating land use efficiency in Portugal by comparing two different land use/land cover datasets to calculate LUE throughout the country. Abdulkadir et al. [21] presents a case study in Gombe, Nigeria, using open source data and tools. These studies reinforce the heterogeneous nature of cities yet also reveal areas of convergence (e.g., scientific thresholds of environmental metrics in using land use/land cover datasets) with respect to SDG indicators in general and to SDGI 11.3.1 specifically [11]. Multiple data types (population, land use/land cover, global indicators) can be used to assess this indicator yielding both insights about urban change and novel ways SDGI 11.3.1 can be assessed.
We contribute to the emerging literature examining the application of SDGI 11.3.1 to selected case studies of three 2C Initiative cities. Our study complements research on urbanization in two areas. We assess the utility of SDGI 11.3.1 for small- and medium-sized cities, adding to the diversity of case studies on specific cities to apply this indicator [10,11,12,18,19,21,22]. In addition, this suite of case study sites emphasizes the importance of the local scale to address issues related to growth and development where city and regional governments require geospatial data that is often lacking and under-examined [22]. We examine how this indicator tracks the spatial extent of urban change over time (1975–2015) and how this metric can provide policy guidance for city planning. Our study applies the SDGI 11.3.1 for cross-city and country comparisons where we measure progress and performance where the indicator informs local strategies and allocates resource [17]. We aim to assess how this indicator can facilitate sustainable urban policy. We situate our study within the U.N.’s “Monitoring and Reporting the SDGs, Module 3” using the Global Human Settlement Layer’s (GHSL) built-up and population datasets. We compare our results for LUE to the UN-Urban Centre Database (UCD) (2019) that comprises over 10,000 urban centers. We conclude with observations noting the necessity of local knowledge and input to identify recommendations for guiding national and local governments in their monitoring of urban development.
2. Materials and Methods
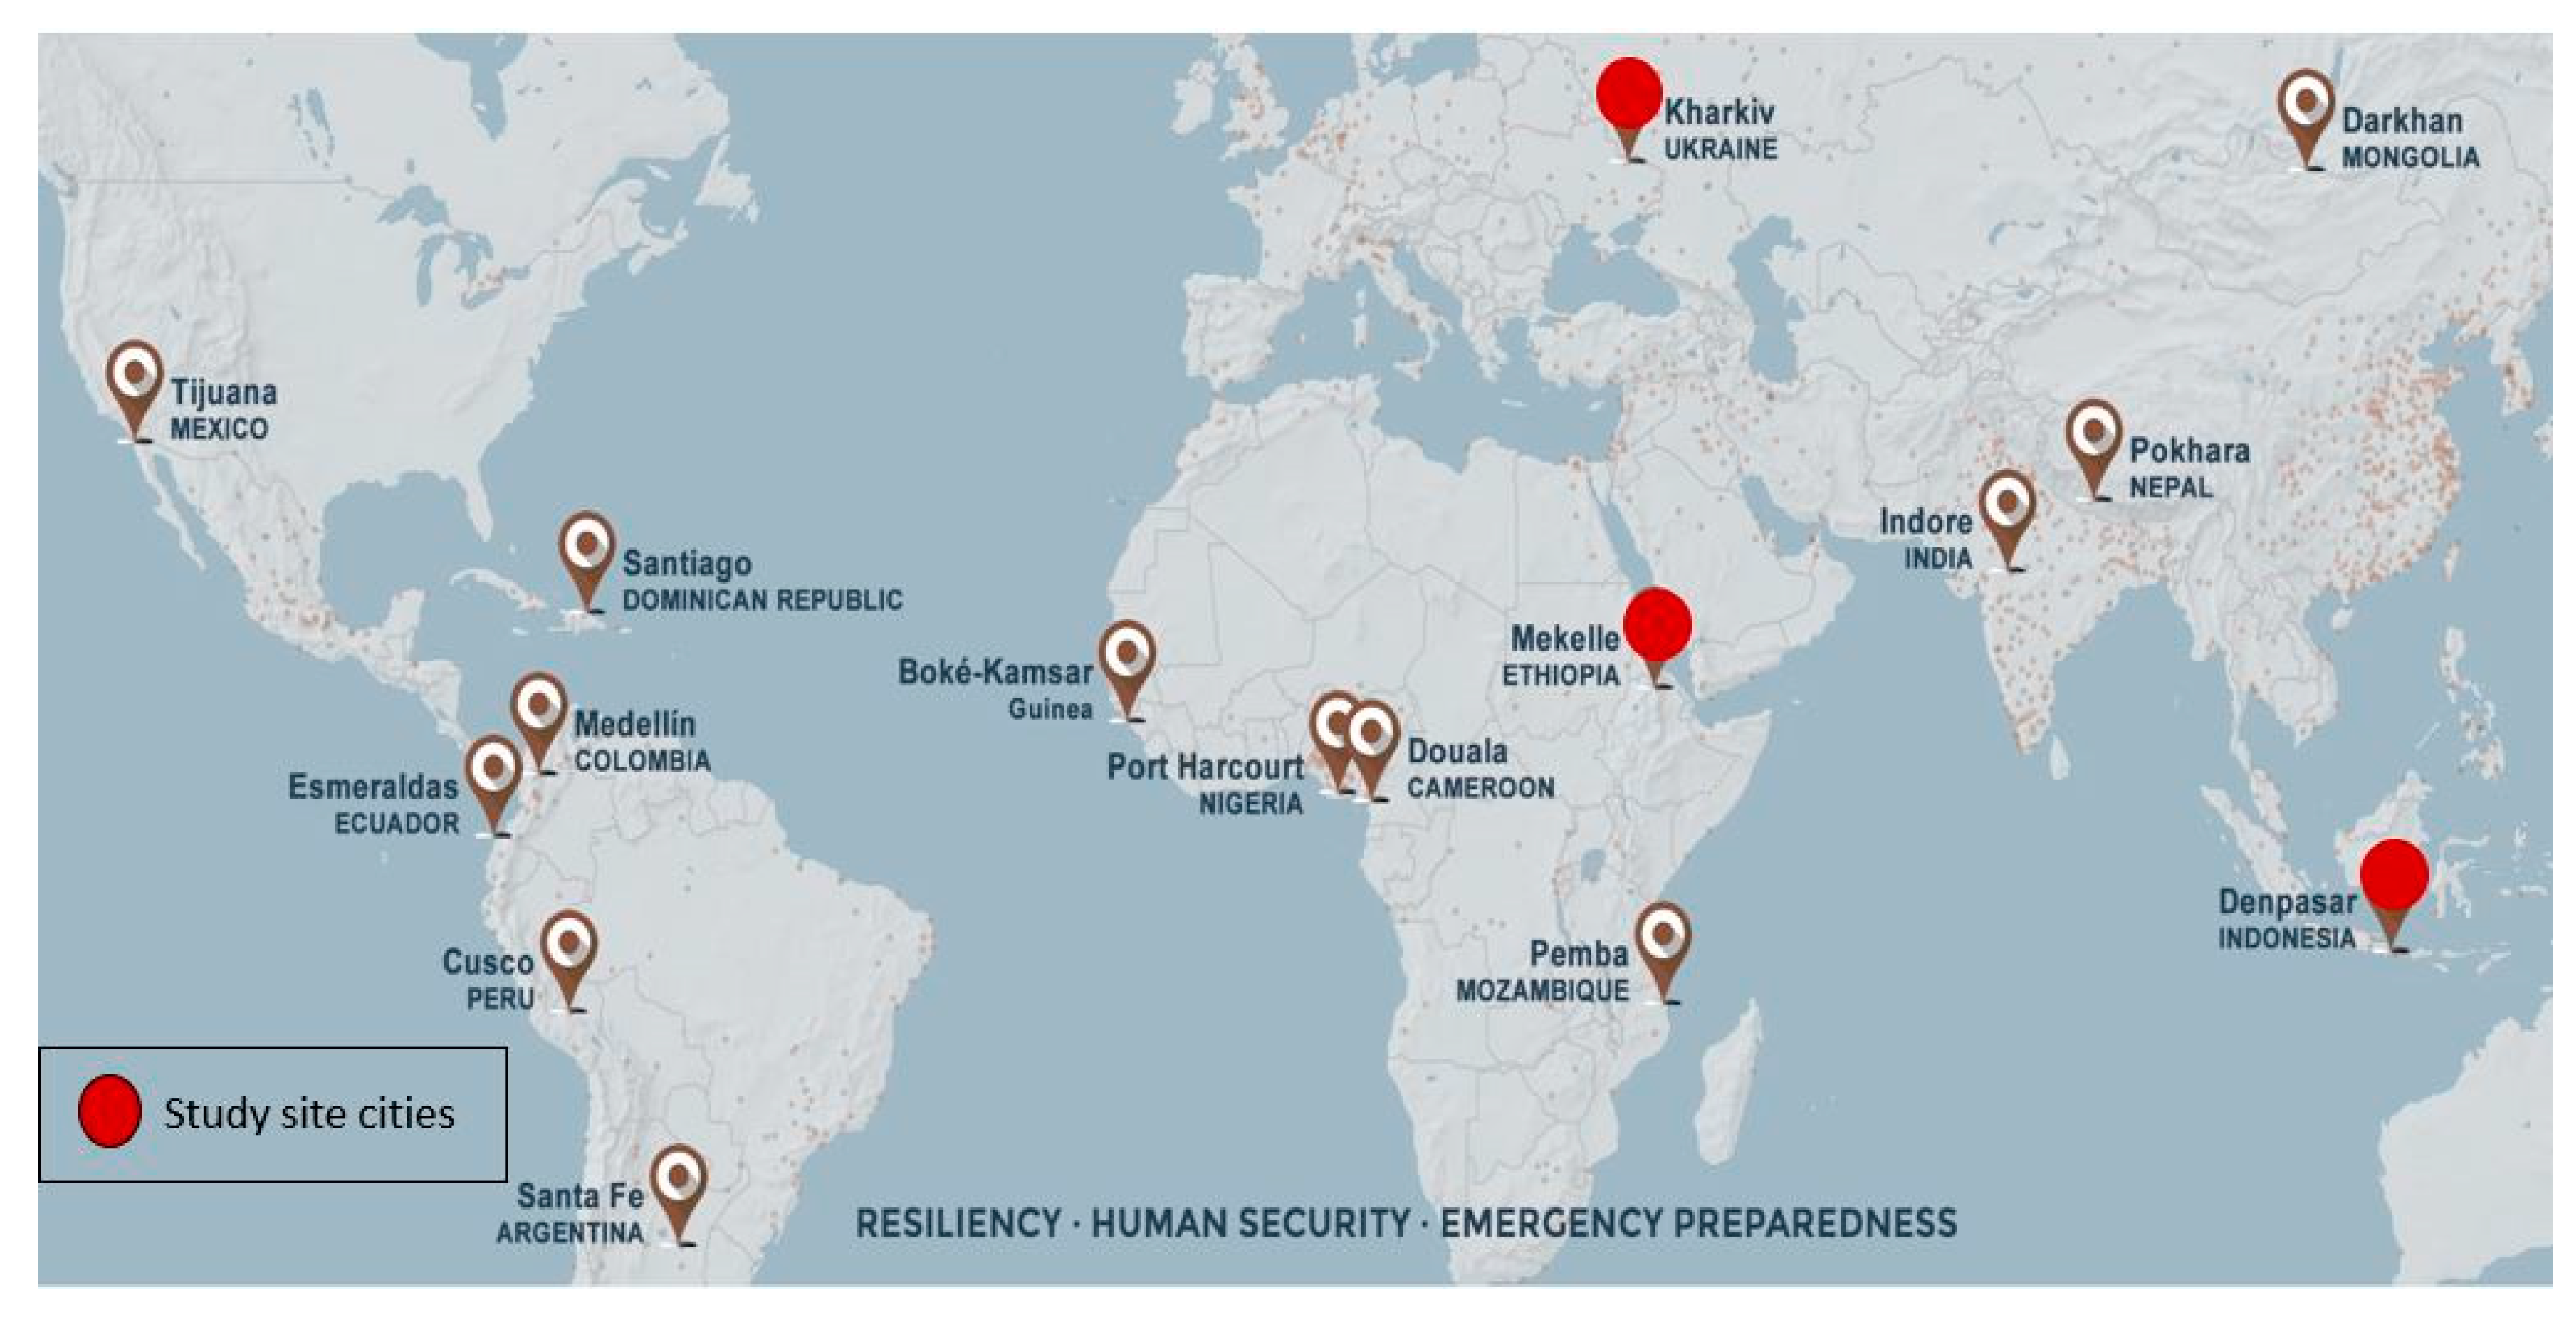
The 2C Initiative supports cities’ efforts to generate data, map, and analyze urban areas. From 2015 to 2019, the 2C Initiative partnered with local governments, non-governmental agencies (NGOs), and universities, on sixteen projects located in four continents (refer to the Secondary Cities website; see Note 1). We selected three cities—Denpasar, Indonesia; Kharkiv, Ukraine; and Mekelle, Ethiopia—from the sixteen 2C Initiative based on population, world region, and city geography to get a broad understanding of common challenges for calculating SDGI 11.3.1 in these selected secondary cities (Figure 2, Supplementary Materials).
We chose these cities due to their representational diversity (e.g., city characteristics inclusive of population, area, and location) and data availability (Table 1). Population data were not available for most of the 2C cities for the measurement period of our analysis. A key source of urban and rural population estimates, and projections is the WUP derived from the UN World Population Prospects (WPP). This dataset does not have population figures for urban agglomerations less than 300,000, a characteristic of many secondary cities including several of the 2C city partners (see Note 2). Furthermore, many of the 2C cities did not have the GHSL time series (epochs) necessary to calculate SDGI 11.3.1. Both, population data and GHSL data that covered all four epochs, are essential to calculate SDGI 11.3.1 ratio for sound analytical comparison purposes (see Note 3). Despite these limitations, we apply the SDGI 11.3.1 to these three diverse secondary cities to contribute to the understanding of urban development over time and space and provide a “proof of concept” application for secondary cities. Specifically, we examine whether SDGI 11.3.1 can provide the basis to track urban change over time for small and medium-sized cities and identify linkages between socio-political events and the built environment [10].
2.1. Selected 2C Initiative Cities: Denpasar, Indonesia; Kharkiv, Ukraine; Mekelle, Ethiopia
Situated on the Island of Bali, Indonesia, Denpasar is the capital city of the Bali province. Bali is a tourist destination in Southeast Asia and considered “the center of government, commerce, business, and education” [24] (p. 566). The influx of population, development of tourism, and limited land resources transitioned a previously agrarian society to a wage-based economy focused on tourism [25]. The change has caused an unstable economy, unsustainable urban growth patterns, and affected the original character and identity of Denpasar [24,25,26]. Development in the late 1990s and early 2000s concentrated in the coastal areas where high-rise hotels were built. During the early 2000s, Bali experienced an economic decline due to changes in global economy and two bombing events in 2002 and 2005 [27]. However, renewed tourism activity has spread, and population continues to grow requiring transportation networks that need more space [28]. Demand has increased for infrastructure and services as the city faces road congestion, transportation hazards, and environmental concerns, resulting due to urban growth [24,28]. Tourist development, inter-island migration, and rapid urban growth have contributed to waste management challenges [29].
Kharkiv is the administrative capital of Kharkiv Oblast (or region) and is the second largest city in Ukraine. Although the majority of the population is Ukrainian, the city’s largest minority is of Russian descent due to its historical dependence on and proximity to Russia—located approximately 40 km from the Russian border. Significant urbanization throughout Ukraine is noted during the Soviet period in the 1980s. Kharkiv and other urban agglomerations formed for economic development and defense objectives [30]. These cities were seen as a labor resource, where the urban population grew mainly due to extensive development of industry [30]. Kharkiv continues to be influenced by its proximity to Russia and the ongoing border conflict that arguably remains the most contentious post-Soviet Union border conflict [31,32]. Loss in urban population since 1995 [23], and migration to other urban areas across Ukraine has continued [30]. Kharkiv has undergone some expansion since the early 1900s, although most changes are related to intensification of land use and density rather than the extent of its urban footprint [33] unlike trends we have seen in other 2C cities.
Reports show African cities are predicted to continue to have the greatest amount of urban expansion globally [34]. Mekelle City, the capital of Tigray Regional State in northern Ethiopia, is a political, economic, and cultural center of Ethiopia [35,36,37]. It is the second largest city in Ethiopia and one of the fastest growing cities in the country [36,37]. Similar to Kharkiv, city growth occurred due to rural migration [37]. Rapid development has impacted its local cultural heritage sites (such as the deterioration of masonry mansions) [37]. Access to water and water quality challenges are part of the daily life in Mekelle [38,39]. In 2009, it was estimated that only 51–60% of families had access to tap water and water was obtained from untreated wells, bought from local vendors, or extracted from shallow boreholes [40]. In 2021, the Tigray Region of Ethiopia became the center of regional conflict and Mekelle is the epicenter of military activity as well as migration conflict refugees to and from the city [41].
2.2. The Global Human Settlement Layer Data
GHSL has been applied to research on disaster risk reduction, urbanization, and human settlement dynamics [13]. Researchers conclude that the GHSL can evaluate land consumption and population at the country [21], regional [42,43,44], or megacity scale [43]. Our research applies the GHSL dataset to the secondary city scale.
GHSL contains data on population (GHS-pop), built-up areas (GHS-built), and settlement (GHS-SMOD), that are divided into four epochs: 1975, 1990, 2000, and 2014, which, in turn, are classified by population and physical infrastructure [45]. The GHSL-built dataset is a spatial, thematic, temporal, high-resolution raster dataset based upon 40 years of Landsat imagery [2]. We opted to use this dataset as we believe it represents the best available and comprehensive data for this analysis of the 2C study sites. The accessibility of Landsat data further demonstrates the challenges this methodology poses to apply the SDGI 11.3.1 particularly when higher resolution imagery is not available. GHSL-built data show change in the human presence on the planet since 1975 and are available in 38-m, 250-m, and 1-km resolution [46]. We used the 38-m resolution for our analysis to capture the highest resolution of an urban built-up area as possible with existing data. We did not use the GHS-SMOD layer as the spatial resolution is 1-km and too coarse for our study.
The GHSL-POP dataset depicts the distribution of population, expressed as the number of people per cell for the same four epochs. Data were disaggregated from administrative units to grid cells, informed by the distribution and density of urban (built-up) areas as mapped in the GHSL global layer, and is available at two different resolutions, 250-m resolution and 1 km resolution [47]. We used the 250-m resolution for our analysis, which matched the area of administrative units of our study sites generating 250-m grids with built-up areas [48]. This layer is particularly useful for areas that do not have high resolution data on population density which is the case for our study sites, however, this layer assumes equal distribution of the population in the urban built-up areas [4,48]. In addition, we compare our outcomes to the UN Urban Centre Database (UN-UCD) hosted by the European Commission, which uses the GHS-built and GHS-pop grids to house SDGI 11.3.1 results for over 10,000 urban centers [49].
2.3. Calculating the LUE
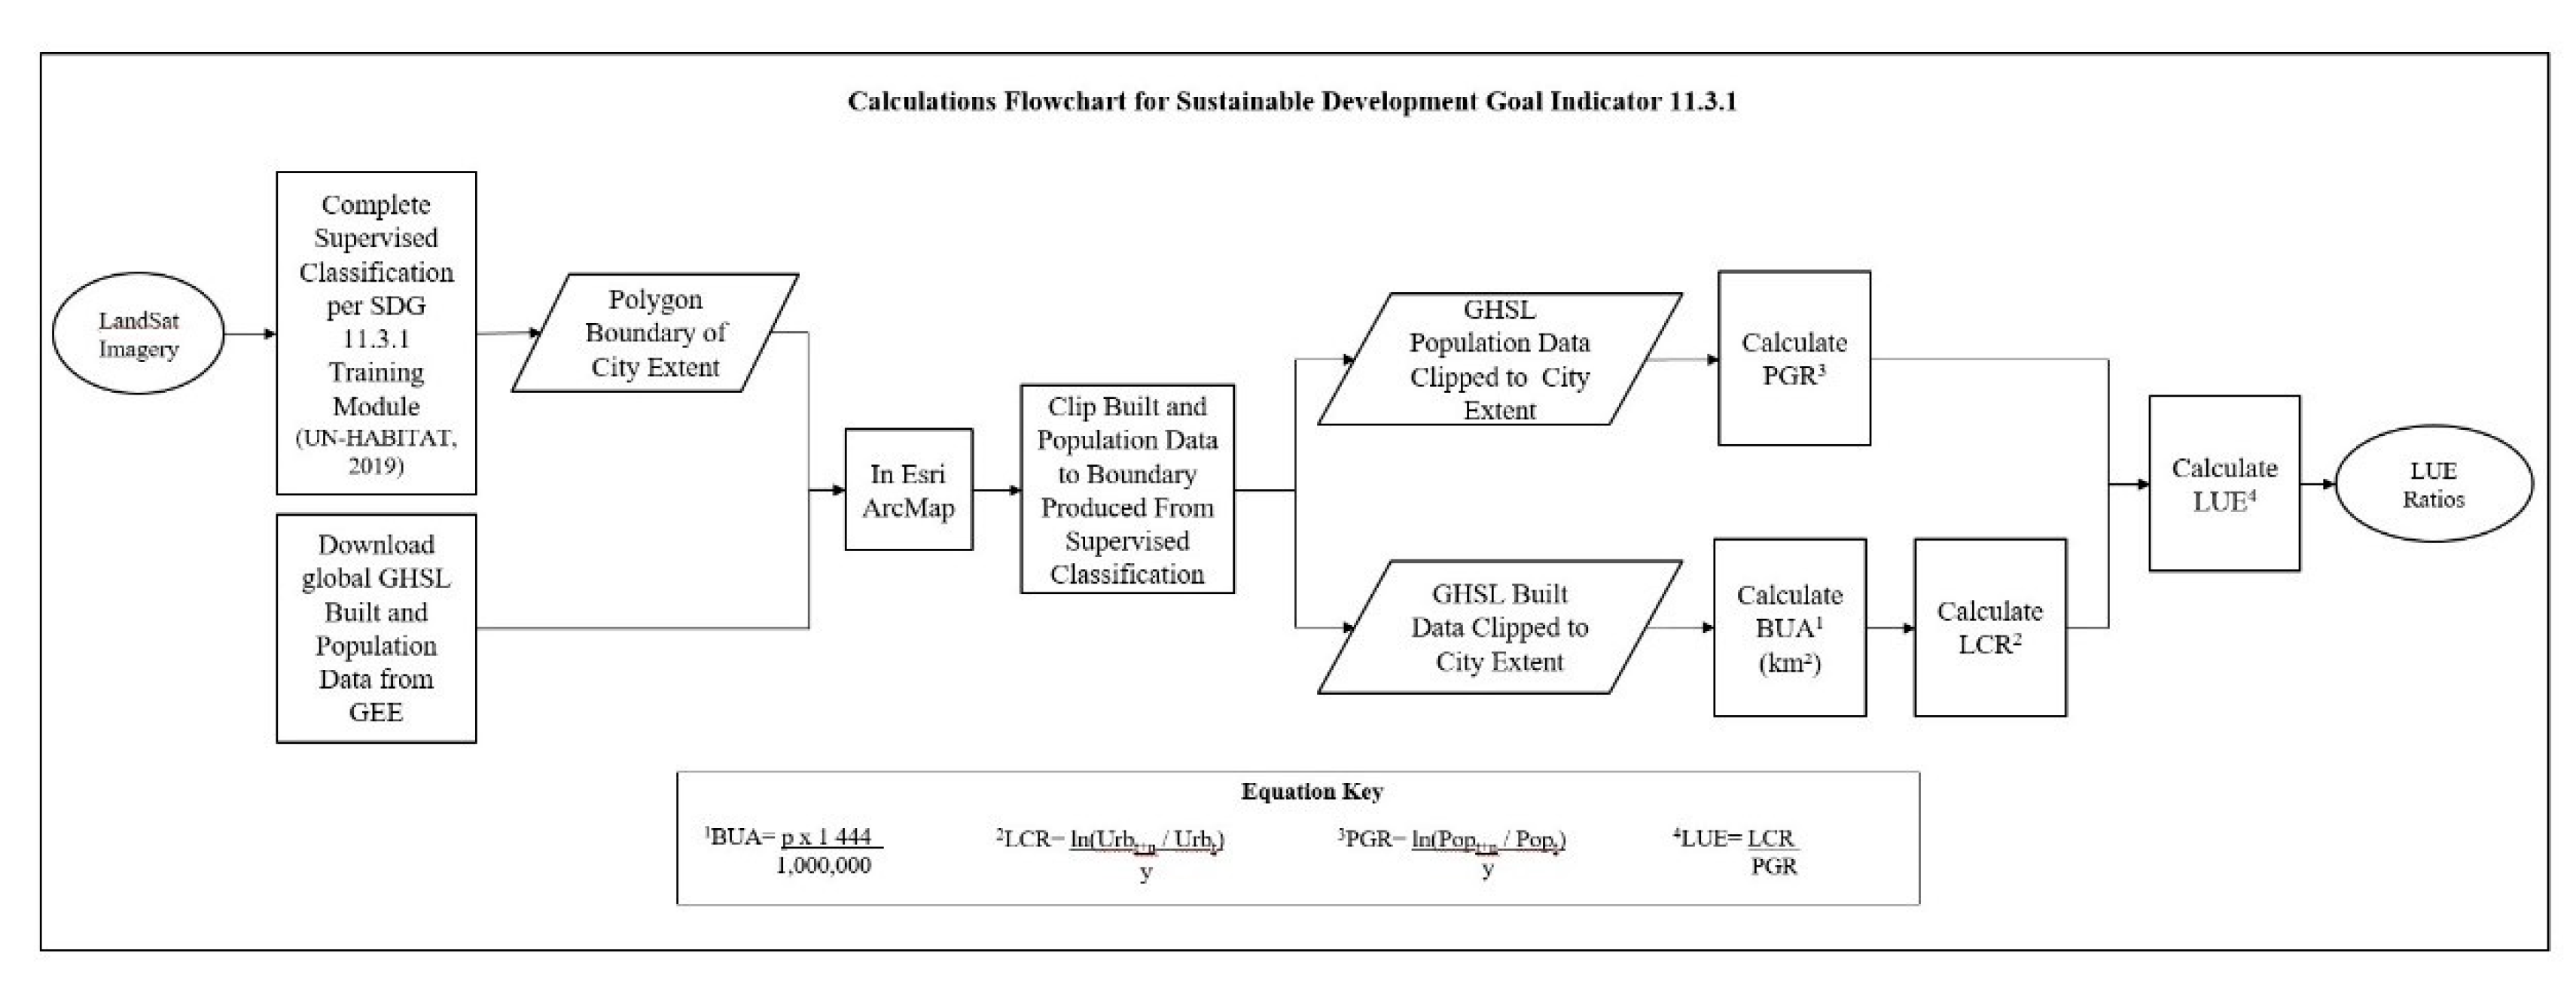
We used Google Earth Engine (GEE) to download and export GHS-pop and GHS-built data. Following the U.N.’s Module 3 on “Monitoring and Reporting the SDGs” Annex 1, we completed a supervised classification to capture each city’s area with the most urban character (i.e., buildings and roadways) [5]. We clipped the built and population datasets to the polygon produced from the supervised classification (Figure 3). It is important to note the urban/city extent does not necessarily match the existing municipal boundaries due to rapid growth and unplanned development extending beyond these boundaries [5]. Further confounding defining the urban spatial extent are the number of disparate data sources and a lack of agreement on defining the “official” city extent.
Using the GHS-pop and GHS-built data layers (Table 2; Figure 4), we calculated PGR (population growth rate) and LCR (land consumption rate) following UN guidelines for all GHSL epochs.
The equation for PGR is [4,47]:
where Popt+n is the total population within the city in the current/final year, Popt is the total population within the city in the past/initial year, and y is the number of years between two measurement periods (epochs) [4,50].
The LCR equation is [4,50]
where Urbt+n is the total areal extent of the urban agglomeration in km2 for the current year, Urbt is the total areal extent of the urban agglomeration in km2 for the past/initial year, and y is the number of years between the two measurement years (measurement period) [4,50].
A LUE ratio greater than one means increased land consumption outstrips population growth indicating that urban sprawl is occurring [5]. Ratios between zero and one represent land consumption and population growth rates that are relatively constant where outlying land is preserved, and population density is higher in urban built-up areas (Table 3). In some cases, the LUE ratio is less than one indicating urban change due to decreased population indicating changing land consumption patterns. Equations were calculated for all GHSL epochs (see Appendix A).
To better understand the type of growth, U.N.’s Module 3 on “Monitoring and Supporting the SDGs” recommends calculating two additional secondary indicators, which utilizes the same datasets: (1) the rate of urban infill and (2) land consumption per capita. The rate of urban infill measures how many new developments emerge in a time period in the first time period’s urban extent [5]. This calculation is the total built up area in time period 2 (t2t) within time period 1 (t1) boundary minus the total built up areas in time period 1(t1), divided by the total built up areas in time period 1.
The land consumption per capita (LCPC) is the average amount of land each person consumes during each analysis period [5]. This secondary indicator can help countries understand when a city loses built-up areas (negative LUE values) or identify where dense and informal settlements are developing [5]. We calculated the LCPC for each epoch by dividing the built-up area (Urbt) in square meters by the population:
where Urbt is the total amount of urban area within a boundary, in this case for 2015, and Popt is the total population.
We compared the results of our LUE calculation to the UN-UCD LCRPGR (land consumption rate to population growth rate) for our selected cities. The UN-UCD uses the same methodology we have used for this study. The U.N. states “we adopted the extent of built-up areas as the input data for land consumption, and population as input for demographic change…” [5] (p. 26).
3. Results
3.1. Inter-City LUE Comparisons
The GSHL data allow us to examine the changing nature of urban form and population over a 40-year time period for three diverse secondary cities (Table 4). Urban footprint of the three cities indicates the intertwined nature of land consumption and population change with urban expansion a common denominator.
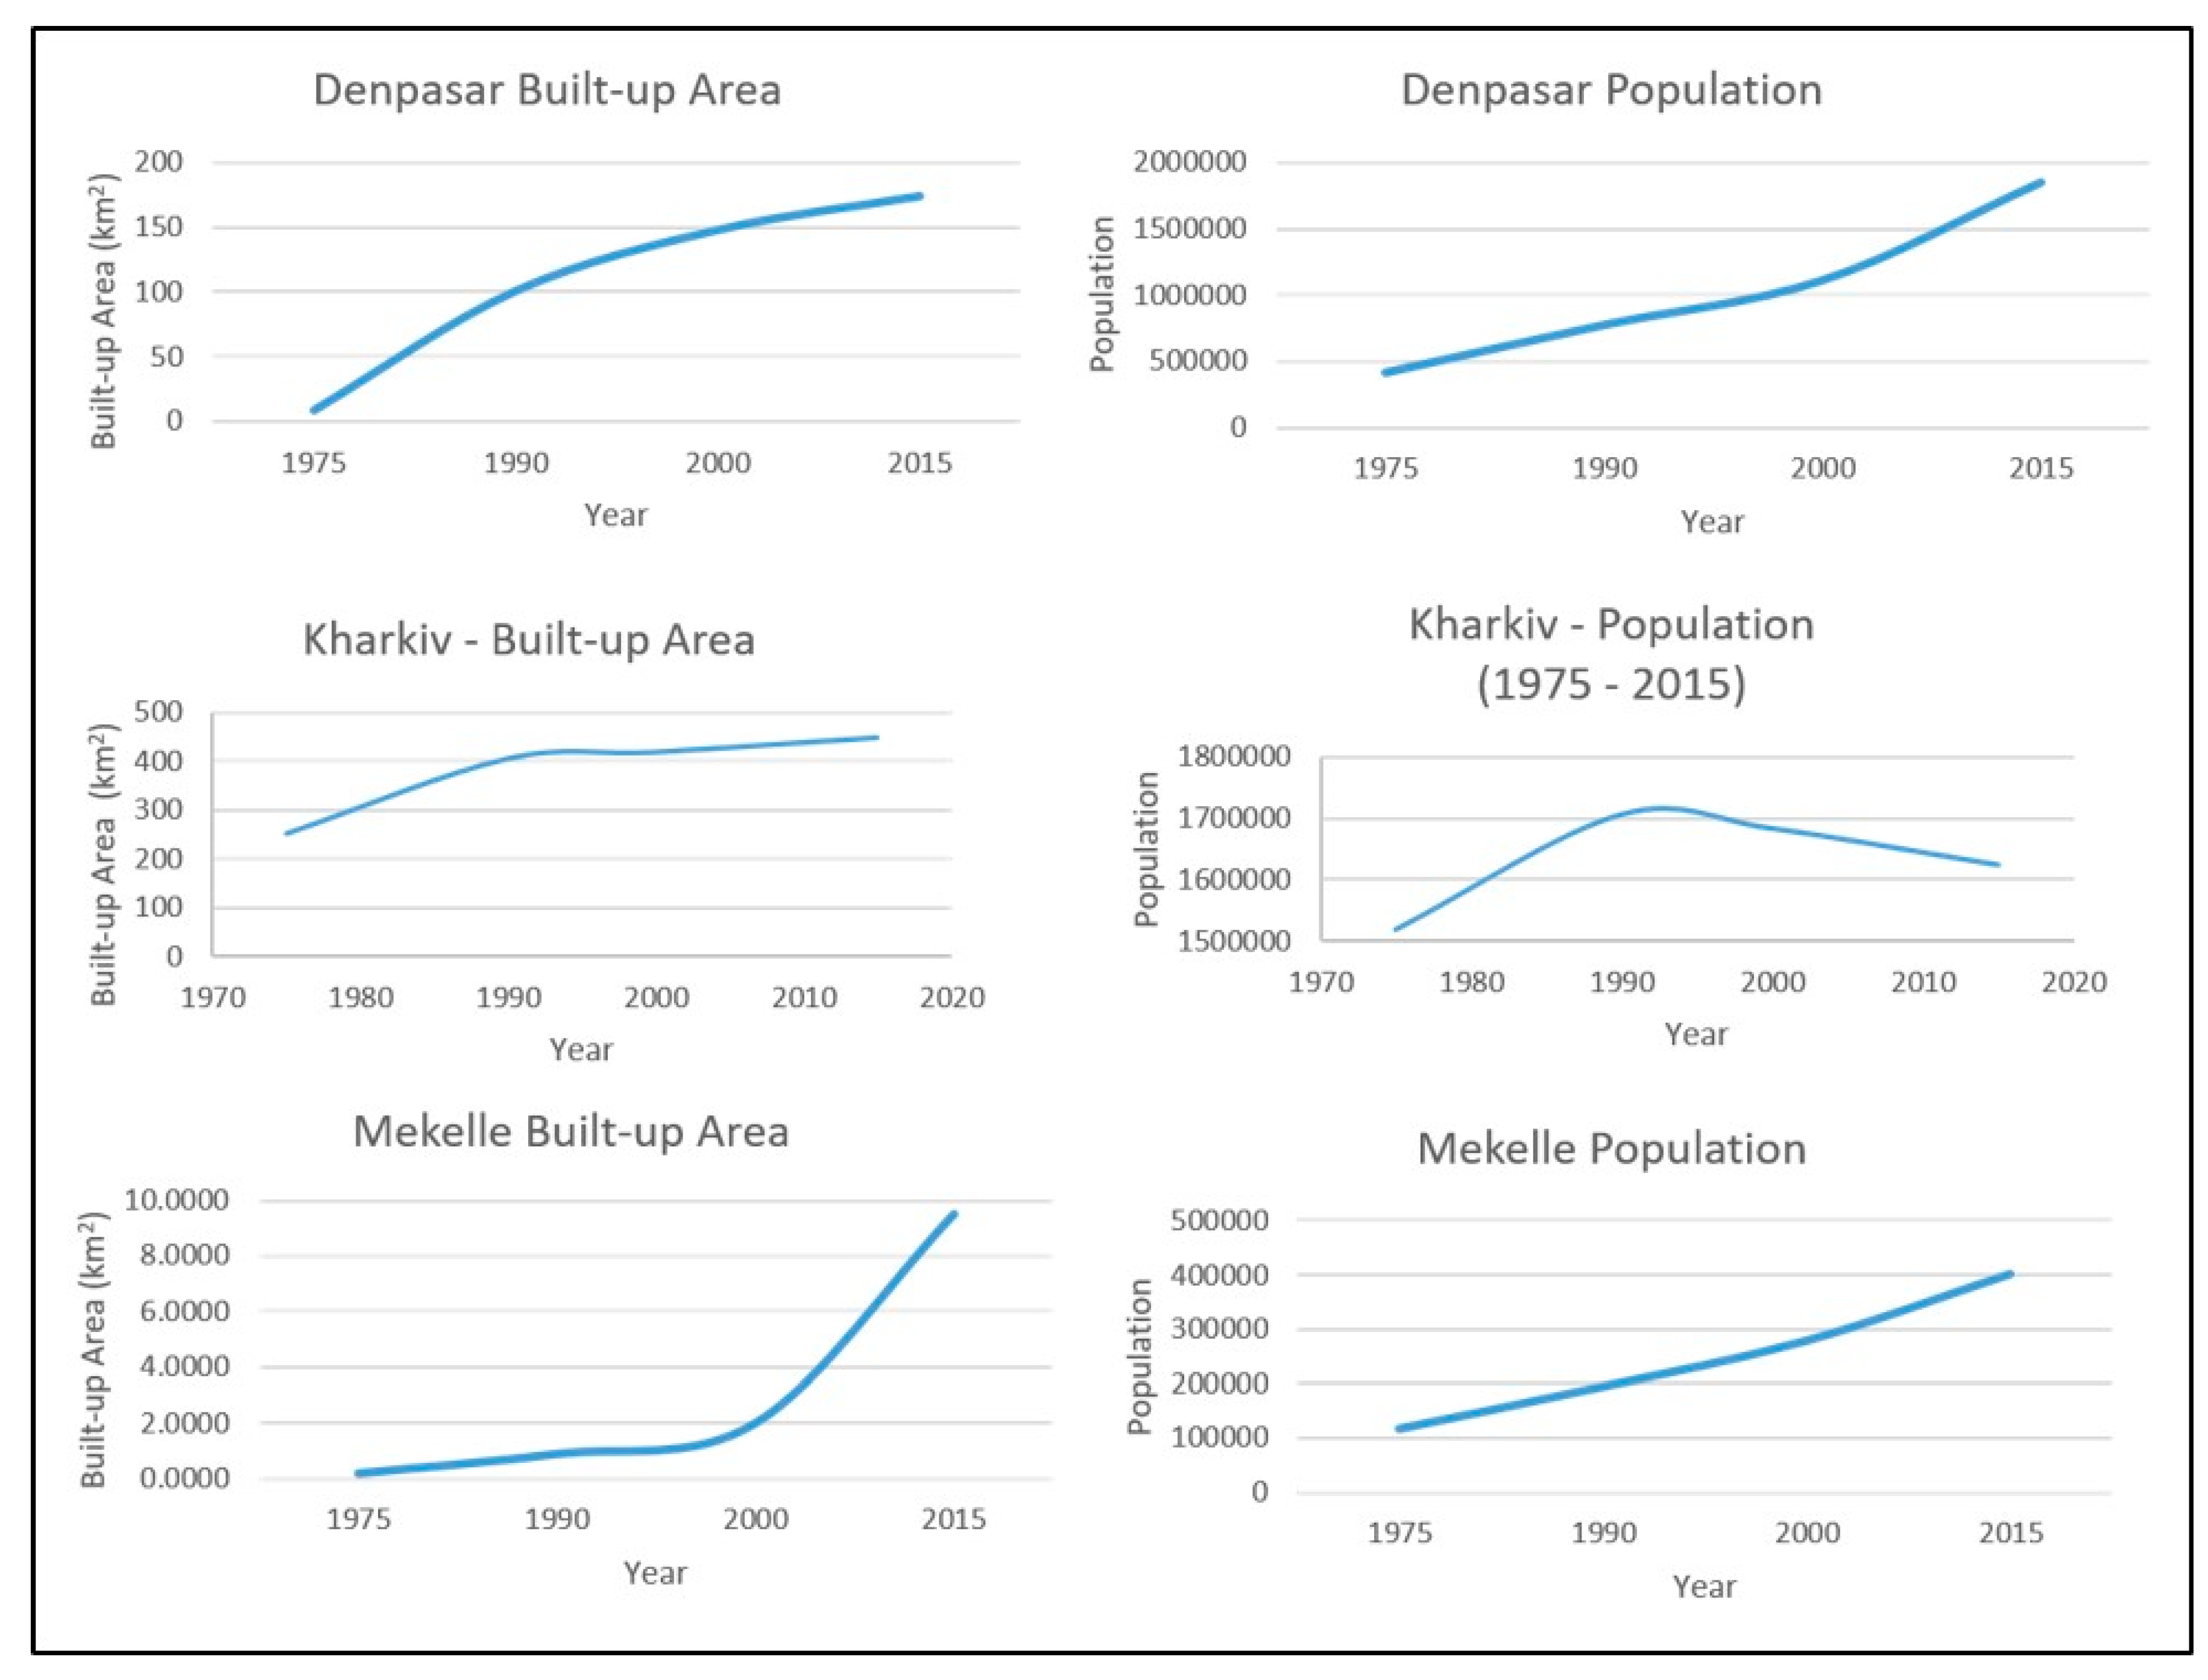
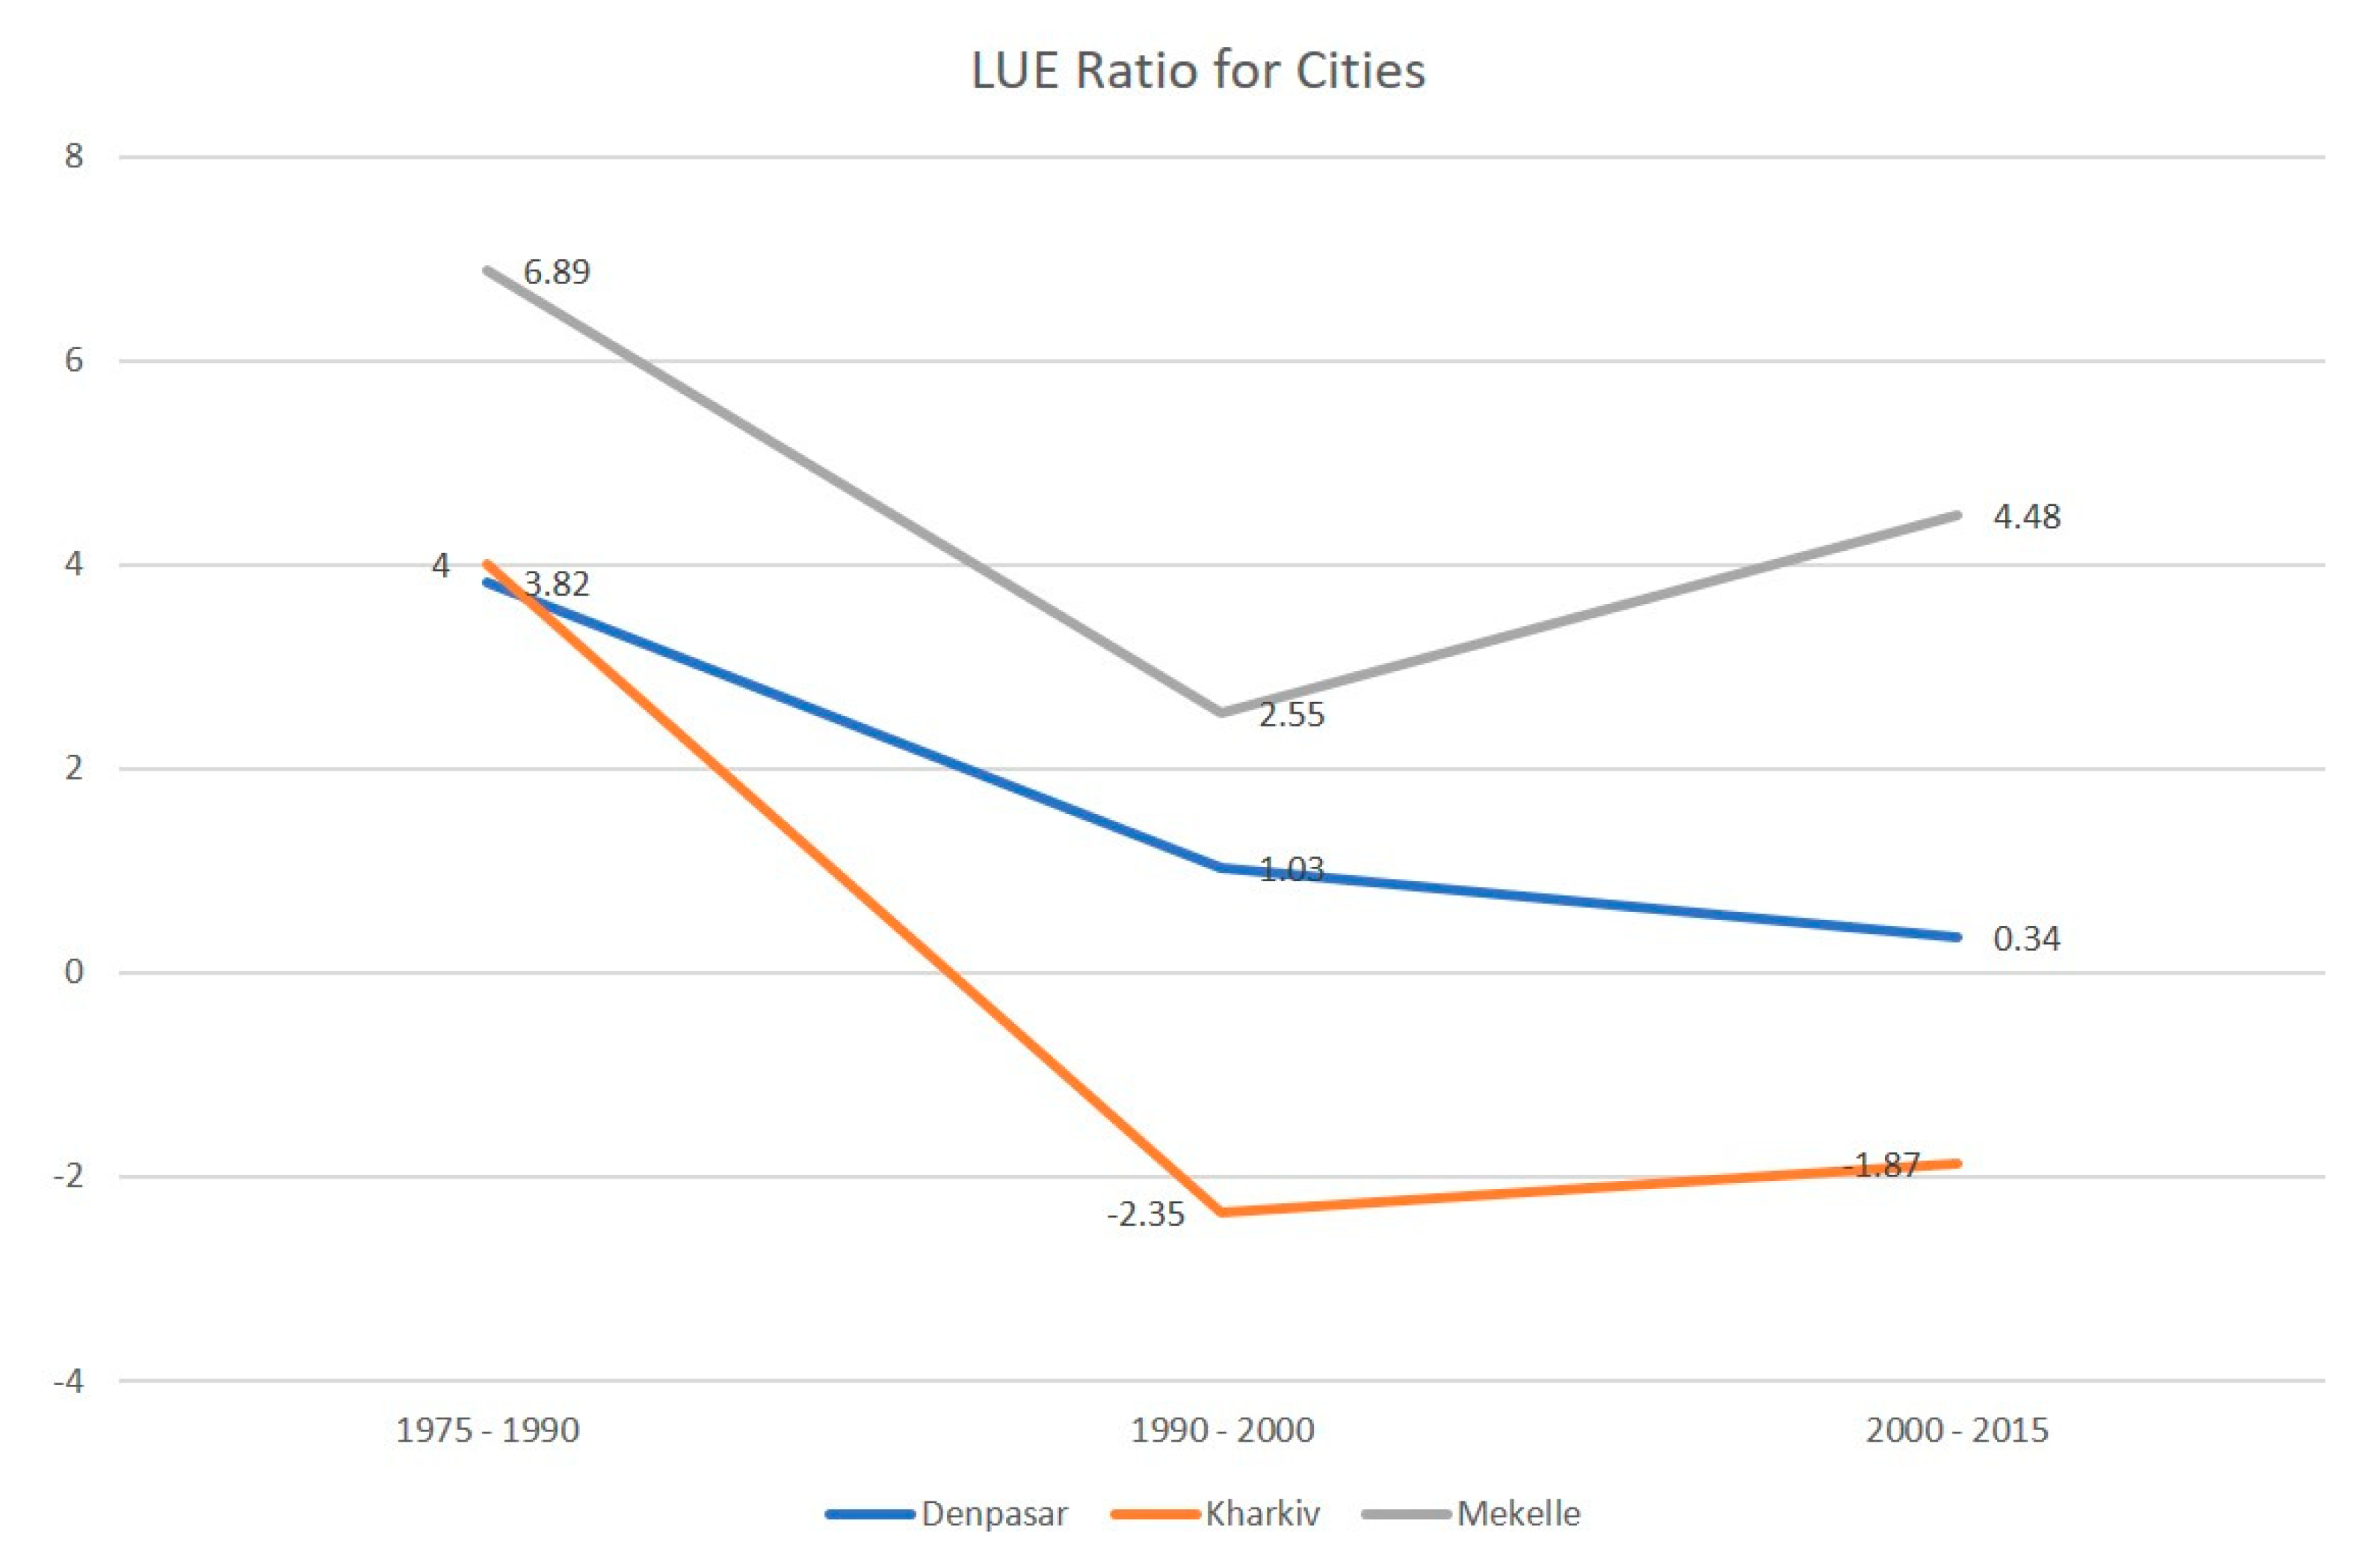
The LUE ratio affirms how secondary cities are rapidly growing with land consumption outstripping population growth (Figure 5). All city LUE ratios are above 1—indicating that increasing land consumption where all cities expanded in area from 1975 to 2015 (calculated as the difference between 1975 and 2015): Denpasar (177.75 km2), Mekelle (8.86 km2), and Kharkiv (194.07 km2) (derived from Table 2). While population increased across the cities, (Denpasar and Mekelle’s LUE ratios for all GHSL epochs were greater than zero, indicating that increased population growth and land consumption occurred at a similar rate), while Kharkiv’s LUE ratios include negative ratio results indicating changes in urban form driven by decreases in population due to changing land consumption patterns over time.
Further asserting the growth trajectory of secondary cities are the changes in population and land consumption (Table 5). Both Denpasar and Mekelle have experienced explosive growth over the 40-year time frame; however, Kharkiv has experienced less population growth despite a large rate of land consumption. These values further confirm the rapid expansion of secondary cities in terms of both population increase (Mekelle and Denpasar) and land consumption (Kharkiv). Over time, both Mekelle and Kharkiv have the capacity to expand into the hinterland to accommodate increased population, whereas Denpasar does not due to its coastal location.
Between 1990 and 2014, the rate of urban infill calculated for each city indicates changing city patterns and urban form (Table 6). In Denpasar, rate of urban infill (72%) suggests that density may be increasing within the urban extent. The urban extent of Mekelle includes the airport area located a considerable distance from the city center; the rate of urban infill (954%) indicates a high capacity for urban infill to occur. In Kharkiv, lower rate of urban infill (10%) implies that new development may be slowing and occurring within the existing urban extent.
Table 7 tracks the increasing land consumption over time where all cities demonstrate that the land consumption per capita continued to increase with the largest increases occurring in the last GHSL epoch (2000–2015). By 2015, Denpasar shows a marked reduced land consumption per capita (reduced by 37.50 m2 per person between 2000 and 2015 compared to an increase of 3.91 m2 per person between 1990 and 2000), land consumption in Mekelle continues to increase (increased by 16.36 m2 per person between 2000 and 2015 from 3.55 km2 between 1990 and 2000), and Kharkiv has been relatively stable (average increase of 20 m2 per person between 1990 and 2015).
3.2. City LUE Results
Denpasar has had a steady decline in the LUE during the 40-year period. In 1975–1990, the LUE was 3.83 (1975–1990 GHSL epoch) and the LUE was 0.34 (2000–2015 GHSL epoch) (Table 4). Denpasar showed greater land consumption from 1975 to 1990, while later epochs experienced lower rates of population growth and land consumption. Denpasar is located on the island of Bali with limited options of land consumption, pushing the city toward compactness and increased population density. The land consumption per capita value is a declining trend for cities such as Denpasar experiencing increased density, where there is limited space to expand [5]. If population trends continue to increase city officials will need to consider planning alternatives that address issues of infill of vacant city parcels, vertical growth (i.e., high rise housing options), or limitations to further development (i.e., building moratoriums). Denpasar’s LUE between 0 and 1 indicates similar rates of land consumption and population growth, produced from the LCPC (Table 7). Although the ratio indicates population and land consumption are increasing at a similar rate, local officials need to verify these results.
Kharkiv’s LUE ratio indicates significant land consumption compared to population growth from 1975 to 1990 (Table 4). The other epochs (1990–2000 and 2000–2015) have negative ratios because population decreased while land consumption increased (Table 2). Kharkiv increased in population and land consumption from 1975 to 1990. From 1990 to 2000, Kharkiv decreased in population and remained consistent in urban extent. With an LUE of −1.87 from 2000 to 2015, Kharkiv experienced a slight decrease in population and slight increase in land consumption. Social and political conflict from Soviet rule impacted urban growth; rural migration from 1913 to 2000 increased urban populations around the country, including Kharkiv [30]. However, since the 1980s, Kharkiv has been subject to high mortality and low fertility rates [30]. From 1993, rapid population decline has also occurred due to economic collapse [30,33]. Kharkiv has experienced population fluctuations, but overall steady land consumption is suggested by the overall LUE ratio of 4.98.
Mekelle has rapidly grown from 2000 to 2015. Mekelle showed an increase in population and urban extent over the 40 years with an initial population of 115,777 and urban extent of 0.21 km2. By 2015, the city’s population was 394,372 and urban extent had expanded to 9.49 km2. The LUE changed over time from 6.89 during 1975 to 1990 (indicating significant growth in both land area and population) to LUEs of 2.55 (1990–2000) and 4.48 (2000–2015). Studies show African cities have experienced the greatest amount of urban expansion and population growth [51]. The growth in both population and land expansion is reflected in the LUE ratio.
3.3. Comparing LUE and UN-LCRPGR Ratios
The UN-UCD includes calculations for our three cities for the time period of 1990–2015. We recalculate our LUE using the supervised classification that defines our city extent and match the UN-UCD time span of 1990–2015 (Table 8).
UN-LCRPGR indicates Denpasar had an increase in land consumption and population, with a larger increase in population. Our results indicate Denpasar had greater land consumption. Depending on boundaries, our supervised classification may have included additional areas north of the city not included in the UN-UCD LCRPGR values. An agreed upon definition of the boundary extent is important because Denpasar urban planners need to plan sustainably as the city continues to exhibit patterns of greater land consumption.
For Kharkiv, the LUE and UN-UCD LCRPGR ratios for 1990–2015 indicates that land consumption and population growth were more closely aligned with lower rates of land consumption and population growth (Table 4). As in the case of Denpasar, we suggest that the discrepancy between the values is related to the boundary used for determining the ratios (see Discussion). Various factors impact city growth over this time frame. Kharkiv’s population decreased slightly from 1990 to 2000 and 2000 to 2015 (Table 2). This produced negative PGR values, while land consumption continued producing positive LCR values.
The Mekelle comparison of LUE and UN-UCD LCRPGR is similar to Denpasar, in that the UN-UDC LCRPGR ratio indicates greater population than land consumption but there were increases in both. Our results indicate greater land consumption (Table 6 and Table 7). The LUE and UN-UDC LCRPGR show the greatest discrepancy between values. The LUE displayed greater land consumption while the UN-UDC LCRPGR ratio suggests a city with a near balance between population growth and land consumption. Mekelle’s population grew but at a greater rate than land consumption. The LUE and UN-UDC LCRPGR ratios are consistent with reports of the African continent’s expanding urban areas.
4. Discussion
The Atlas of Urban Expansions defines urban growth in several ways: infill, extension, leapfrog development, and inclusion [52]. Infill is the addition of built-up areas within the urban area that were previously open space; extension is the expanding perimeter of the city; leapfrog development refers to new developments of urban character not spatially coincident with existing urban areas; and inclusion are those built-up areas originally outside of the main urban area that become surrounded by the outward growth of the city [52]. Our three cities exhibit all these patterns of urban growth throughout the 40-year time period.
Denpasar’s growth demonstrates evidence of extensive growth over the last 40 years. More recently, Denpasar land consumption has decreased due to the limitations of island environments (i.e., limited land area, rising sea level, cyclonic storms) leaving us to infer that infill will need to be used as a planning tool to manage city growth. Predictions indicate that Denpasar will continue to experience population growth [28] and will need robust creative sustainable planning for living situations to ensure a human security for local residents. The Secondary Cities Initiative facilitated communication between city officials, the local non-governmental organization—the Gringgo Foundation (implementing the 2C Denpasar project), and local universities (i.e., university students collected field data) to develop city geospatial data. While the project specifically focused on waste management (i.e., recycling centers, trash dumps, illegal trash dumps, and potential transportation routes for waste collection) additional analyses were conducted on land use/land cover to assess city growth and there was a keen interest from local government in further using these data for urban planning.
Kharkiv is situated in a valley crisscrossed by rivers where river management (i.e., damming rivers, construction of surface canals and subservice conduits) was a key aspect of city development in the early 1900s [53]. Urban expansion—extension and inclusion—was facilitated by industrial development, the emergence of Kharkiv as a nexus of higher education (i.e., there are 34 universities located there), and numerous city parks created over 100 years ago. However, due to a combination of social factors and the border conflict with Russia population growth has decreased [32]. Given Kharkiv’s increase in land consumption over the past 40 years (from 241.79 km2 in 1975 to 446.47 km2 in 2015) and decrease in population since 1990, Kharkiv is a city where infill is a strategy for planning initiatives. The 2C Kharkiv project revealed an interest from city leaders and local non-governmental organizations (Red Crescent and refugee centers) in identifying vacant building across the city and their potential for relocating refugees from Ukraine’s eastern border conflict with Russia.
Mekelle has faced consistent growth over the 40 years of this analysis but has notable leapfrog development as evidenced from remote sensed imagery (1990—Landsat imagery). For example, the airport is southeast of Mekelle’s city (104 km from Mekelle city center) where change detection analysis using GHSL-built and satellite imagery reveal an emerging built-up area nearby. Field validation of buildings will reveal if these are commercial buildings for airport use or residential buildings. Such local input and knowledge are needed to inform SDGI 11.3.1 to augment the limitations of remote analyses. Mekelle is rapidly changing as the city is located in an area of intense regional conflict where population fluctuations will impact patterns of urbanization. The 2C Mekelle project facilitated the generation of baseline data specifically emphasizing water access. Due to climate change, continuing drought, and the emerging conflict in the region, access to water is a critical indicator not only for managing city growth but also for human well-being (consider SDG 6—access to water and sanitation). This conflict will further impact data development due to limited access to the city compromising the nascent effort to develop robust geospatial data amidst an increasingly precarious political situation.
We encountered several issues in calculating SDGI 11.3.1 for the 2C cities in our project and assume these issues will be reflected in most LMICs. These include a lack of available GHSL data for cities, download difficulties with both GHSL datasets due to the size of the datasets and the low bandwidth as well as interrupted internet service many LMICs encounter, and boundary uncertainties and discrepancies between authoritative and local datasets. Compounding these issues are the local conditions on site, in particular conflict, political change (i.e., election cycles and changing political priorities), and adequate technical infrastructure (i.e., access to internet, computer hardware, and geospatial software). Despite these challenges, SDGI 11.3.1 analysis of land consumption and population are possible due to increased access to spatial data and satellite images to track urban changes [50]. While data availability and accuracy are improving [36], access and processing of satellite imagery requires the necessary infrastructure (i.e., internet connectivity, consistent electricity, computational power) and technical expertise (i.e., competence in the geospatial sciences), which are often limiting factors in LMICs [54].
There are some limitations in the GHSL data that should be noted. The GHSL-built data only characterize a pixel as having a building [46]. The presence of a building is not enough to determine the type of growth (e.g., urban or rural) or population density (e.g., how many people may live in the building; number of floors in a building) in the city. Local experts familiar with the city and surrounding areas can identify how a ‘building’ defines city growth based on local knowledge and can assist in the validation of results. Further, the use of Landsat imagery extends the time span of our study while potentially compromising spatial accuracy of the urban area due to the low resolution of Landsat images. However, using the available Landsat imagery provides us with an initial assessment of these cities to identify trends with the opportunity to engage with local experts to confirm our findings. Our next step will be to obtain higher resolution imagery to further examine our outcomes.
In addition, city spatial extents are dynamic and often do not match the administrative or municipal boundaries. However, understanding where administrative boundaries occur can assist in defining urban growth patterns that reflect sprawl or leapfrog development, and where services such as transportation networks may need to extend. Further, the boundary used for the LUE analysis affect and even change the results. The boundary determines urban area used in the equations PGR and LCR, altering LUE ratios. The boundaries utilized by the UN-UCD are different than the boundaries we used for our analysis. We derived a boundary for each epoch to calculate the LUE ratios. We also calculated the LUE based on the same timeframe as the UN-UCD LCRLGR ratio and this produced different results. Including local input and data can improve determining the boundary that is representative of the urban area in question. We recommend obtaining guidance from city residents with local knowledge to define the boundary used to calculate SDGI 11.3.1 to ensure the entire area of interest (e.g., peri-urban area) is included in analyses. Riad et al. demonstrate the importance of local understanding integrated with remotely sensed data to assess land use/land cover change in urban areas, [10]. Applying SDGI 11.3.1 to the 2C projects was outside the 2C Initiative scope and purpose; however, this analysis has indicated that our next steps will be further examination of applying this indicator to the 2C city network.
The socio, political, historical, and economic context of each of the city’s development is key in assessing and understanding the LUE ratio over time. Population growth is facilitated by several factors (i.e., economic opportunities, access to markets and resources, education) and land consumption has a variety of patterns (i.e., infill, inclusion) that result from where people choose or are forced to live (i.e., conflict, political change, ethnic marginalization). Informal development is another key aspect of many secondary cities [1] driven by economic, social, and political events. Identifying the configuration and location of informal settlements are critical to managing and planning for services. A limitation of the GHSL-built data layer is how the spatial extent of informal settlements are captured by the various sensors and spectral signatures of building materials on remotely sensed images [47]. However, the ability to map urban extent is rapidly changing due to using other datasets (i.e., night lights), artificial intelligence to train the data classification, and local knowledge [10,55]. Informal development can be overlooked or mis-mapped if it cannot be captured by sensors, modeling, or interpretation of the satellite images.
5. Conclusions: Scale of Land Use Efficiency
The LUE ratios calculated for Denpasar, Kharkiv, and Mekelle reflect historical and social factors that have influenced the growth of the city. Denpasar experienced reduced urban growth in the early 2000s due to the economic downturn and terrorist events on the island of Bali—impacting tourism and slowing construction of high-end hotels. Kharkiv’s urban expansion fluctuated over the 40-year period reflecting the changes due to Soviet influence and regional conflict. Mekelle, a cultural, political, and economic hub of northern Ethiopia, faces changing conditions due to ethnic and civil struggles in the area that potentially will reshape the city. Conducting an analysis of SDGI 11.3.1 provides a baseline assessment that can be improved with local input and knowledge and access to higher resolution imagery. SDGI 11.3.1 is important for understanding urban form and population for secondary cities however its application is dependent upon data availability and instruction on how to apply this indicator for local urban planners. The UN-UCD LCRPGR products also create baseline assessments of many cities, including secondary cities but do not include the nuances of urban change that impact urban form.
The 2C Initiative provides local data that did not previous exist to begin the process of mapping and generating data for select secondary cities. This initiative created and fostered geospatial user networks with universities, private sector workers, municipal employees, and NGOs. Our partners are familiar with their city providing local knowledge to identify where and what land is being consumed and the local dynamics of population growth. We highly recommend collaborating with local experts to validate the type of development cities experience and how that will affect city growth moving forward.
Our research demonstrates that the SDGI 11.3.1 can be applied to diverse secondary cities with limited data. However, the process is not straightforward for local urban planners in secondary cities without adequate instruction, access to data, geospatial tools, and computer technology in order to conduct the analysis. Consulting with local experts assist in validating GHSL data for SDGI 11.3.1 and other global datasets for SDG indicators that rely on geospatial data. Additionally, local communities and governments can provide the context for urban change due to socio-political conditions. The impetus to apply SDGI 11.3.1 goes beyond the annual reporting to the relevant UN organizations to identify ways for broader community participation in urban planning.
SDGI 11.3.1 provides guidance in identifying and examining trends of urban change. The ratios provide some indications of the city’s form, but not why the city is changing. Coupling these results with an assessment of other SDG indicators, the scientific literature, and local input on historical events and current situations informs urban change in ways remote analysis may miss. Next steps to further assess SDG 11.3 are to evaluate SDGI 11.3.2—to assess the proportion of cities with a structure of civil society participation in urban planning and management that operates regularly and democratically, which is also a local endeavor. Our emphasis to include local experts in the analysis aligns with the premise of calculating SDGI 11.3.2.
NOTES:
Note 1: The Secondary Cities Initiative included the following projects:
- Six projects in Latin America (Cusco, Peru; Esmeraldas, Ecuador; Medellín, Colombia; Santa Fe, Argentina; Santiago de los Caballeros, Dominican Republic; and Tijuana, Mexico);
- Five projects in Eastern Europe and Asia (Denpasar, Indonesia; Darkhan, Mongolia; Kharkiv, Ukraine; Indore, India; and Pokhara, Nepal); and
- Five projects in Africa (Boke-Kamsar, Guinea; Douala, Cameroon; Mekelle, Ethiopia; Pemba, Mozambique; and Port Harcourt, Nigeria) (see https://secondarycities.state.gov/; Accessed date: 15 July 2021).
Note 2: 2C cities that less than 300,000 people: Emeraldas, Ecuador; Darkhan, Mongolia.
Note 3: 2C cities that do not have GHSL epochs needed to calculate SDGI 11.3.1: Medellin, Colombia, Cusco, Peru.
Supplementary Materials
The following are available online at https://0-www-mdpi-com.brum.beds.ac.uk/article/10.3390/ijgi10110713/s1.
Author Contributions
Conceptualization of project, exploration of background materials, and development of research activity: Melinda Laituri, Danielle Davis, Faith Sternlieb. Methodology to apply the SDGI 11.3.1 to selected secondary cities; examination of cities and selection process: Melinda Laituri, Danielle Davis. Data curation is the responsibility of the principal investigator: Melinda Laituri. Writing—Review and Project Administration. Writing and review were the co-equal responsibility of all co-authors with Laituri overseeing the writing process—Melinda Laituri, Faith Sternlieb, Kathleen Galvin. Project Administration was overseen by the principle investigator (Laituri) and project management conducted by Sternlieb. Funding acquisition: Melinda Laituri. All authors have read and agreed to the published version of the manuscript.
Funding
This research received no external funding.
Institutional Review Board Statement
Not applicable.
Informed Consent Statement
Not applicable.
Data Availability Statement
Data for this study were openly available from the GHSL Global Human Settlement Layer (https://ghsl.jrc.ec.europa.eu/download.php accessed on 4 April 2021) and LandSat imagery (https://landsat.gsfc.nasa.gov/data accessed on 4 April 2021).
Acknowledgments
This research was made possible by the Association of American Geographers research grant # 19AQMM18D0097. This research is based upon the Secondary Cities Initiative in the Office of the Geographer, Department of State. Any opinions, findings, and conclusions or recommendations expressed in this material are those of the author(s) and do not reflect the views of the American Association of Geographers or the Office of the Geographer. We appreciate the support of the Geospatial Centroid interns at CSU in assisting in the spatial analysis and supervised classification. We appreciate the support from the Lincoln Institute of Land Policy. Thoughtful comments from anonymous reviewers were helpful in improving the manuscript.
Conflicts of Interest
The authors declare no conflict of interest.
Appendix A
All Study Site Cities spreadsheet.
References
- Roberts, B.H. Managing Systems of Secondary Cities: Policy Responses in International Development. 2014. Available online: https://www.citiesalliance.org/sites/citiesalliance.org/files/1d%20(i)%20-%20Managing%20Systems%20of%20Secondary%20Cities%20Book_low_res.pdf (accessed on 4 April 2021).
- United Nations Human Settlements Programme (UN-HABITAT). Urbanization and Development: Emerging Futures; (No. HS/038/16E); UN-Habitat: Nairobi, Kenya, 2016. [Google Scholar]
- Perry, G.; Laituri, M.; Cline, L. Why Secondary Cities Deserve More Attention. New Secur. Beat. 2020. Available online: https://www.newsecuritybeat.org/2020/10/secondary-cities-deserve-attention/ (accessed on 7 July 2021).
- United Nations Human Settlements Programme (UN-HABITAT). Monitoring Framework for Sustainable Development Goal 11; UN-Habitat: Nairobi, Kenya, 2016; Available online: https://unhabitat.org/sdg-goal-11-monitoring-framework/ (accessed on 6 June 2021).
- United Nations Human Settlements Programme (UN-HABITAT). Indicator 11.3.1 Training Module Land Consumption. 2019. Available online: https://data.unhabitat.org/datasets/875facc5fba84d35b31d139969e54555 (accessed on 15 July 2021).
- Anderson, W.P.; Kanaroglou, P.S.; Miller, E.J. Urban Form, Energy and the Environment: A Review of Issues, Evidence and Policy. Urban Stud. 1996, 33, 7–35. [Google Scholar] [CrossRef]
- Rode, P.; Floater, G.; Thomopoulos, N.; Docherty, J.; Schwinger, P.; Mahendra, A.; Fang, W. Accessibility in Cities: Transport and Urban Form. In Disrupting Mobility. Lecture Notes in Mobility Series; Meyer, G., Shaheen, S., Eds.; Springer: Cham, Switzerland, 2017. [Google Scholar] [CrossRef] [Green Version]
- Tsai, Y. Housing Demand Forces and Land Use towards Urban Compactness: A Push-Accessibility-Pull Analysis Framework. Urban Stud. 2015, 52, 2441–2457. Available online: www.jstor.org/stable/26146149 (accessed on 29 July 2021).
- United Nations DESA (Department of Economic and Social Affairs). World Urbanization Prospects: The 2014 Revision; United Nations Population Division: New York, NY, USA, 2015; ISBN 978-92-1-151517-6. [Google Scholar]
- Riad, P.; Graefe, S.; Hussein, H.; Buerkert, A. Landscape transformation processes in two large and two small cities in Egypt and Jordan over the last firve decades using remote sensing data. Landsc. Urban Plan. 2019, 197, 103766. [Google Scholar] [CrossRef]
- Fenton, P.; Gustafsson, S. Moving from high-level words to local action—governance for urban sustainability in municipalities. Curr. Opin. Environ. Sustain. 2017, 26–27, 129–133. [Google Scholar] [CrossRef]
- Simon, D.; Arfvidsson, H.; Anand, G.; Bazaz, A.; Fenna, G.; Foster, K.; Jain, G.; Hansson, S.; Evans, L.M.; Moodley, N.; et al. Developing and testing the Urban Sustainable Development Goal’s targets and indicators—A five-city study. Int. Inst. Environ. Dev. (IIED) 2015, 28, 49–63. [Google Scholar] [CrossRef]
- Pesaresi, M.; Ehrlich, D.; Ferri, S.; Florczyk, A.; Freire, S.; Haag, F.; Halkia, M.; Julea, A.M.; Kemper, T.; Soille, P. Global human settlement analysis for disaster risk reduction. Int. Arch. Photogramm. Remote. Sens. Spat. Inf. Sci. 2015, 40, 837. [Google Scholar] [CrossRef] [Green Version]
- Živković, J. Urban Form and Function. In Climate Action. Encyclopedia of the UN Sustainable Development Goals; Leal Filho, W., Azeiteiro, U., Azul, A., Brandli, L., Özuyar, P., Wall, T., Eds.; Springer: Cham, Switzerland, 2019. [Google Scholar] [CrossRef]
- United Nations Department of Economic and Social Affairs (UN-DESA) Sustainable Development. Available online: https://sdgs.un.org/goals/goal11 (accessed on 15 December 2020).
- United Nations Policy Brief. Accelerating SDG 11 Achievement Policy Brief in Support of the First SDG 11 Review at the UN High-Level Political Forum 2018. 2018. Available online: https://sustainabledevelopment.un.org/content/documents/194452018_HLPF_Thematic_Review_of_SDG_11_UNHabitat_12_June_2018_original.pdf (accessed on 6 June 2021).
- Hansson, S.; Arfvidsson, H.; Simon, D. Governance for sustainable urban development: The double function of SDG indicators. Area Dev. Policy 2019, 4, 217–235. [Google Scholar] [CrossRef] [Green Version]
- Koch, F.; Krellenberg, K. How to contextualize SDG 11? Looking at Indicators for Sustainable Development in Germany. ISPRS Int. J. Geo-Inf. 2018, 7, 464. [Google Scholar] [CrossRef] [Green Version]
- Nicolau, R.; David, J.; Caetano, M.; Pereira, J. Ratio of land consumption rate to population growth rate—Analysis of different formulations applied to mainland Portugal. ISPRS Int. J. Geo-Inf. 2019, 8, 10. [Google Scholar] [CrossRef] [Green Version]
- Wang, Y.; Huang, C.; Feng, Y.; Zhao, M.; Gu, J. Using earth observation for monitoring SDG 11.3.1 Ration of land consumption rate to population growth rate in mainland China. Remote Sens. 2020, 12, 357. [Google Scholar] [CrossRef] [Green Version]
- Abdulkadir, I.; Kumar, J.S.; Noon, M. Ratio of Land Consumption Rate to the Population Growth Rate—A Case of Metropolitan Gombe. Preprints 2019, 2019120047. [Google Scholar] [CrossRef]
- UCLG (United Cities and Lcoal Governments). Local and Regional Government’s Report to the 2019 HLPF 3rd Report. Towards the Localization of the SDGs. 2019. Available online: https://www.uclg.org/sites/default/files/towards_the_localization_of_the_sdgs_0.pdf (accessed on 11 July 2021).
- United Nations Department of Economic and Social Affairs (UN-DESA). World Urbanization Prospects: The 2018 Revision, Online Edition. 2018. Available online: https://esa.un.org/unpd/wup/DataSources/ (accessed on 6 July 2021).
- Prajnawrdhi, T.A.; Karuppannan, S.; Sivam, A. Preserving Cultural Heritage of Denpasar: Local Community Perspectives. Procedia Environ. Sci. 2015, 28, 557–566. [Google Scholar] [CrossRef] [Green Version]
- Fagertun, A. Labour in Paradise: Gender, Class and Social Mobility in the Informal Tourism Economy of Urban Bali, Indonesia. J. Dev. Stud. 2017, 53, 331–345. [Google Scholar] [CrossRef]
- Wiryananda, N.; Hasibuan, H.; Madiasworo, T. Study of urban spatial utilization on socio-cultural and environment based on sustainability index (study in Denpasar city). IOP Conf. Ser. Earth Environ. Sci. 2018, 126, 012136. [Google Scholar] [CrossRef]
- Sudiarta, K. Sustainable Tourism Development: Case study in Denpasar Municipality, Bali, Indonesia. Trop. Coasts 2012, 17, 46–56. Available online: http://www.pemsea.org/sites/default/files/tc-17-2-denpasar.pdf (accessed on 15 May 2021).
- Widodo, K.H.; Soemardijito, J.; Perdana, Y.R. Issues and challenges in urban logistics planning in Indonesia. In City Logistics 3: Towards Sustainable and Liveable Cities; Taniguchi, E., Thompson, E., Eds.; Wiley: Hoboken, NJ, USA, 2018. [Google Scholar]
- Damanhuri, E.; Handoko, W.; Padmi, T. Municipal Solid Waste Management in Indonesia. In Municipal Solid Waste Management in Asia and the Pacific Islands: Challenges and Strategic Solutions; Periathamby, A., Tanaka, M., Eds.; Springer: Singapore, 2014. [Google Scholar] [CrossRef]
- Petryshyn, H. Changes in Population in the Context of Urban Development of Ukraine throughout the 20th and 21st centuries. Archit. Stud. 2016, 2, 41–47. Available online: http://nbuv.gov.ua/UJRN/arc_2016_2_1_9 (accessed on 15 May 2021).
- Trenin, D. The End of Eurasia: Russia on the Border Between Geopolitics and Globalization; Carnegie Endowment for International Peace: Washington, DC, USA, 2002. [Google Scholar]
- Zayats, D.V.; Zotova, M.V.; Turov, N.L.; Klyuchnikov, M.I. Impact of crisis in Russia–Ukraine relations on cross-border interactions in Belgorod oblast. Reg. Res. Russ. 2017, 7, 384–394. [Google Scholar] [CrossRef]
- Niemets, K.; Kravchenko, K.; Mazurova, A.; Sehida, K.; Lurie, A. Regional settlement system as a basis for the formation of growth poles (case of Kharkiv region). J. Socio-Econ. Geogr. 2018, 24, 39–46. Available online: http://nbuv.gov.ua/UJRN/Chseg_2018_24_6 (accessed on 15 May 2021). [CrossRef]
- Organization for Economic Cooperation and Development (OECD). Africa’s Urbanization Dynamics 2020: Africapolis, Mapping a New Urban Geography. In West African Studies; Organization for Economic Cooperation and Development (OECD): Paris, France, 2020; ISSN 2074353X. [Google Scholar] [CrossRef]
- Alok, K. Ancient Cultural Linkage of Ethiopia with India: Case of Almaqah Temple of Yeha (Ethiopia). Int. J. Manag. 2020, 11, 1528–1536. [Google Scholar] [CrossRef]
- Fenta, A.A.; Yasuda, H.; Haregeweyn, N.; Belay, A.S.; Hadush, Z.; Gebremedhin, M.A.; Mekonnen, G. The dynamics of urban expansion and land use/land cover changes using remote sensing and spatial metrics: The case of Mekelle City of northern Ethiopia. Int. J. Remote. Sens. 2017, 38, 4107–4129. [Google Scholar] [CrossRef]
- Okazaki, R. Deterioration of Heritage by Informal Urbanization in Mekelle, Ethiopia. J. Asian Archit. Build. Eng. 2011, 10, 343–350. [Google Scholar] [CrossRef]
- Castro, A.; Maoulidi, M.; A Water and Sanitation Needs Assessment for Mekelle City, Ethiopia. MCI Social Sector Working Paper Series N7/2009. Available online: https://academiccommons.columbia.edu/doi/10.7916/D8GM8F57 (accessed on 2 June 2021).
- Gegreegziabher, K.; Tadesse, T. Household demand for improved water supply services in Mekelle City, Northern Ethiopia. Water Policy 2011, 13. [Google Scholar] [CrossRef] [Green Version]
- Asgedom, D.B. Assessing Causes and Challenges of Urban Water Supply: The Case of Mekelle City. Int. J. Sci. Res. 2014, 3, 1922–1928. [Google Scholar]
- Devermont, J. The Battle of Mekelle and Its Implications for Ethiopia. Critical Questions, Center for Strategic and International Studies. 2020. Available online: https://www.csis.org/analysis/battle-mekelle-and-its-implications-ethiopia (accessed on 3 June 2021).
- Melchiorri, M.; Florczyk, A.J.; Freire, S.; Schiavina, M.; Pesaresi, M.; Kemper, T. Unveiling 25 Years of Planetary Urbanization with Remote Sensing: Perspectives from the Global Human Settlement Layer. Remote. Sens. 2018, 10, 768. [Google Scholar] [CrossRef] [Green Version]
- Melchiorri, M.; Pesaresi, M.; Florczyk, A.J.; Corbane, C.; Kemper, T. Principles and Applications of the Global Human Settlement Layer as Baseline for the Land Use Efficiency Indicator—SDG 11.3.1. ISPRS Int. J. Geo-Inf. 2019, 8, 96. [Google Scholar] [CrossRef] [Green Version]
- Schiavina, M.; Melchiorri, M.; Corbane, C.; Florczyk, A.J.; Freire, S.; Pesaresi, M.; Kemper, T. Multi-Scale Estimation of Land Use Efficiency (SDG 11.3.1) across 25 Years Using Global Open and Free Data. Sustainability 2019, 11, 5674. [Google Scholar] [CrossRef] [Green Version]
- Pesaresi, M.; Ehrlich, D.; Ferri, S.; Florczyk, A.; Freire, S.; Matina, H.; Julea, A.M.; Kemper, T.; Soille, P.; Syrris, V. Operating Procedure for the Production of the Global Human Settlement Layer from Landsat Data of the Epochs 1975, 1990, 2000, and 2014. Publ. Off. Eur. Union 2016. [Google Scholar] [CrossRef]
- Pesaresi, M.; Melchiorri, M.; Siragusa, A.; Kemper, T. Mapping Human Presence on Earth with the Global Human Settlement Layer; No. EUR 28116 EN; Publications Office of the European Union: Luxembourg, 2016; pp. 1–137. Available online: https://ghsl.jrc.ec.europa.eu/documents/Atlas_2016.pdf (accessed on 14 July 2021).
- European Commission-Joint Research Centre (EC-JRC). Atlas of the Human Planet 2020—Open Geoinformation for Research, Policy, and Action; European Commission: Luxembourg, 2020; ISBN 978-92-76-27388-2. [Google Scholar]
- Bustos, A.; Hall, O.; Niedomysl, T. A pixel level evaluation of five multitemporal global gridded population datasets: A case study in Sweden, 1990–2015. Popul. Environ. 2020, 42, 255–277. [Google Scholar] [CrossRef]
- Florczyk, A.J.; Melchiorri, M.; Corbane, C.; Schiavina, M.; Maffenini, L.; Pesaresi, M.; Politis, P.; Sabo, F.; Freire, S.; Ehrlich, D.; et al. Description of the GHS Urban. Centre Database 2015, Public Release 2019, Version 1.0; Publications Office of the European Union: Luxembourg, 2019; ISBN 978-92-99753-2. [Google Scholar] [CrossRef]
- United Nations-Human Settlements Programme (UN-HABITAT). Metadata on SDGs Indicator 11.3.1 Indicator Category: Tier II. 2018. Available online: https://unhabitat.org/sites/default/files/2020/07/metadata_on_sdg_indicator_11.3.1.pdf (accessed on 11 July 2021).
- Lamson-Hall, P.; Angel, S.; DeGroot, D.; Martin, R.; Tafesse, T. A new plan for African Cities: The Ethiopia Urban Expansion Initiative. Urban Stud. 2018, 56, 1234–1249. [Google Scholar] [CrossRef] [Green Version]
- Angel, S.; Blei, A.; Parent, J.; Lamson-Hall, L.; Sanchez, N.G.; Civco, D.; Lei, R.Q.; Thom, K. Atlas of Urban. Expansion, The 2016 Edition; NYU Urban Expansion Program at New York University, UN-Habitat, and the Lincoln Institute of Land Policy: New York, NY, USA, 2016; Available online: https://www.lincolninst.edu/publications/other/atlas-urban-expansion-2016-edition (accessed on 14 July 2021).
- Davis, D.; Diadin, D.; Shores, A.; Khandogina, O.; Laituri, M. Capacity of urban springs to support emergency water needs, a secondary city case study: Kharkiv, Ukraine. Urban Water J. 2020, 17, 368–376. [Google Scholar] [CrossRef]
- Davis, D.B. Evaluating the Utility of Global Versus Local Geospatial Data for Secondary Cities. Master’s Thesis, Colorado State University, Fort Collins, CO, USA, 2019, unpublished. [Google Scholar]
- Marconcini, M.; Metz-Marconcini, A.; Üreyen, S.; Palacios-Lopez, D.; Hanke, W.; Bachofer, F.; Zeidler, J.; Esch, T.; Gorelick, N.; Kakarla, A.; et al. Outlining where humans live, the World Settlement Footprint 2015. Sci. Data 2020, 7, 242. [Google Scholar] [CrossRef] [PubMed]
Figure 1.
UN Sustainable Development Goal 11.

Figure 2.
Secondary Cities (2C) Initiative cities with study site cities identified.

Figure 3.
Steps to complete land consumption rate (LCR) calculation and land consumption rate to population growth rate or Land Use Efficiency (LUE) ratio from Sustainable Development Goal Indicator (SDGI) 11.3.1. We completed a supervised classification using LandSat imagery per instructions set out in the SDG 11.3.1 Training Module (UN-HABITAT, 2019). We downloaded the GHSL Built and Population datasets from Google Earth Engine (GEE). In Esri ArcMap, we clipped the Built and Population datasets to the polygon boundary produced from the supervised classification that define the city extent. We calculated the built-up area (BUA), which lead to completing the LCR calculation. We calculated the PGR, then calculated the LUE to get the land consumption to population growth ratio.

Figure 4.
Built-up Area and Population for Denpasar, Kharkiv, and Mekelle. Source: Global Human Settlement layers—Population: GHSL-pop; Built-up Area: GHSL-built, 2018.
Figure 4.
Built-up Area and Population for Denpasar, Kharkiv, and Mekelle. Source: Global Human Settlement layers—Population: GHSL-pop; Built-up Area: GHSL-built, 2018.

Figure 5.
LUE Ratios for study site cities (GHSL Epochs 1975–2015).

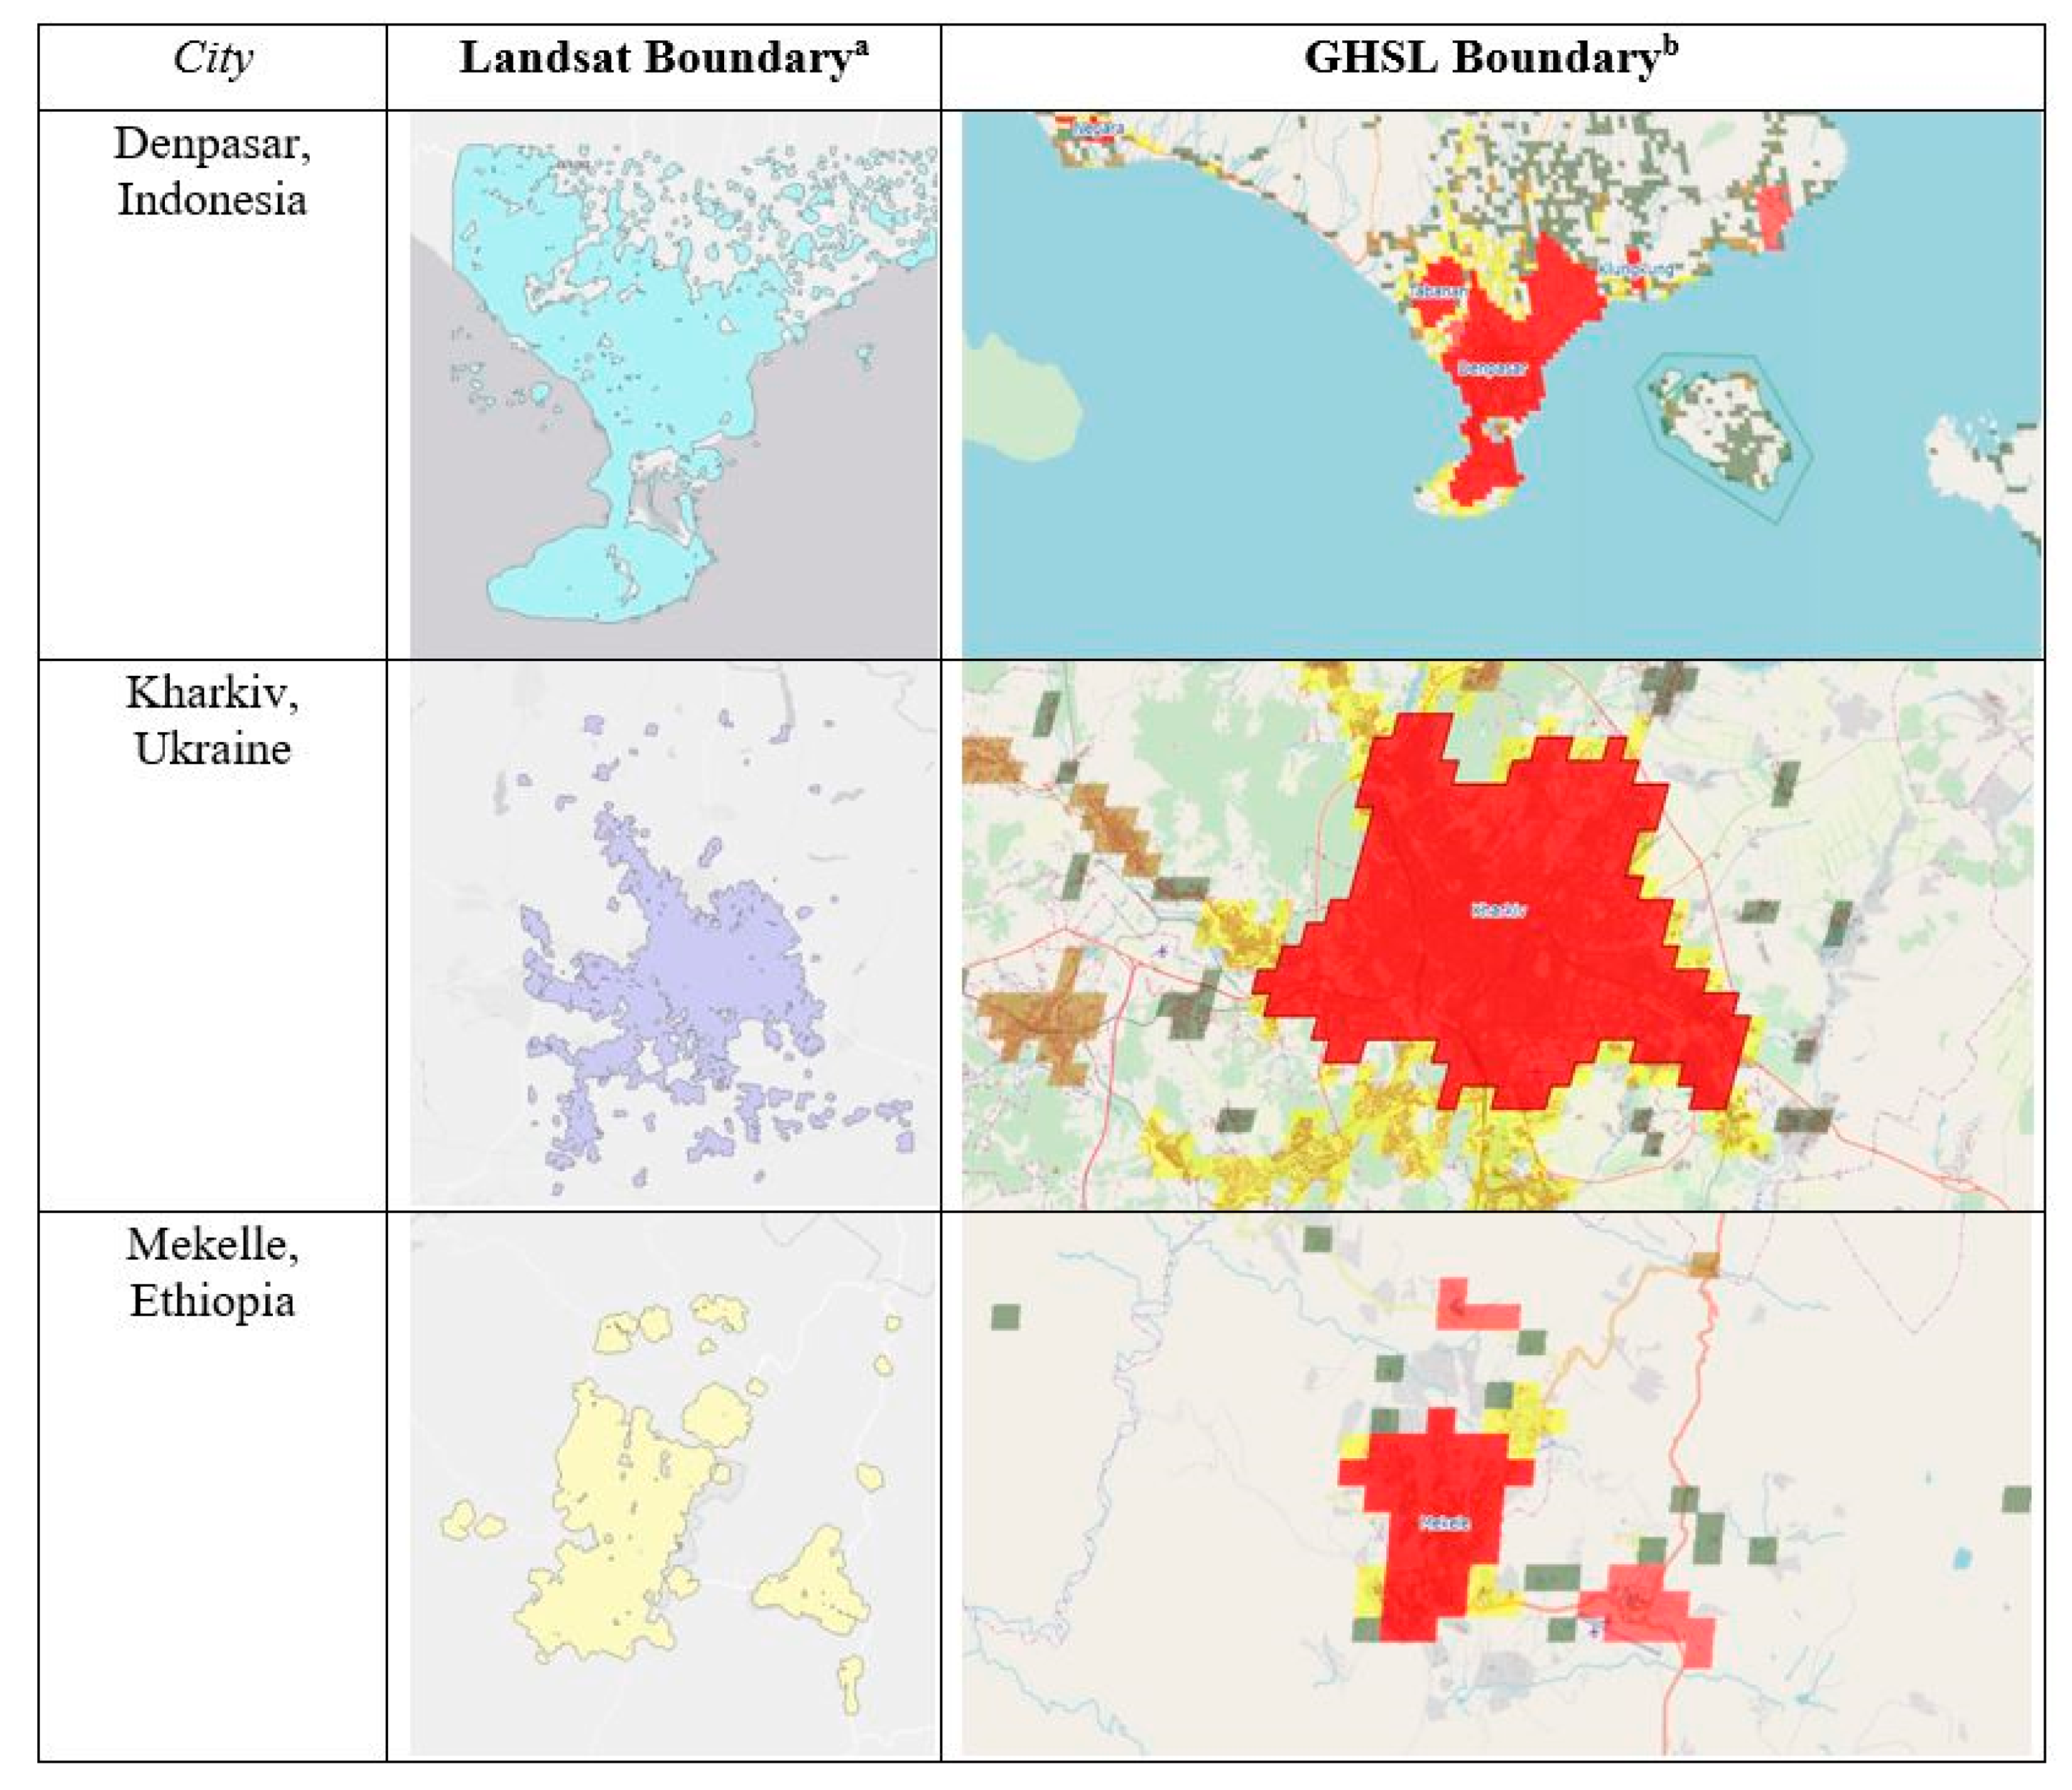
Figure 6.
City extent comparison between Landsat classified boundary and GHSL boundary epochs. a Landsat boundary derived from supervised classification of Landsat imagery. b GHSL boundary downloaded from Urban Centre Database UCDB R2019A, https://ghsl.jrc.ec.europa.eu/ucdb2018visual.php (accessed date: 15 July 2021).


Table 1.
Three Secondary City Initiative cities used to calculate SDG Indicator 11.3.1.
| Secondary Cities Selected for Analysis | ||||
|---|---|---|---|---|
| City | Population a | Population Year | World Region | City Geography |
| Denpasar, Bali, Indonesia | 883,814 | 2015 | Asia | Island, Coastal |
| Kharkiv, Ukraine | 1,442,204 | 2015 | Europe | Inland |
| Mekelle, Ethiopia | 440,042 | 2015 | Africa | Highlands |
a UN-Department of Economic and Social Affairs (UN-DESA), 2018a [23].
Table 2.
Built-up areas and population for Denpasar, Indonesia, Kharkiv, Ukraine, and Mekelle, Ethiopia.
Table 2.
Built-up areas and population for Denpasar, Indonesia, Kharkiv, Ukraine, and Mekelle, Ethiopia.
| City | Built-up Area (km2) | Population | ||||||
|---|---|---|---|---|---|---|---|---|
| 1975 | 1990 | 2000 | 2015 | 1975 | 1990 | 2000 | 2015 | |
| Denpasar | 10.1 | 108.91 | 158.18 | 187.76 | 414,889 | 773,921 | 1,110,717 | 1,848,407 |
| Kharkiv | 253.14 | 404.78 | 417.95 | 447.21 | 1,518,409 | 1,707,647 | 1,684,508 | 1,624,713 |
| Mekelle | 0.02 | 0.69 | 1.72 | 8.88 | 115,777 | 191,460 | 273,444 | 394,372 |
Source: Global Human Settlement layers-Population: GHSL-pop; Built-up Area: GHSL-built, 2018.
Table 3.
Land Use Efficiency (LUE) ratio interpretation.
| Explanation of LUE Results | ||
|---|---|---|
| Ratio Relationship to 1 | Urban Change | Definition |
| LUE < 1 (negative LUE values) | ↓ population growth | Decrease in population due to changes in land consumption |
| 0 < LUE < 1 | Rate of population growth EQUALS rate of land consumption | Population growth and land consumption occurs at similar rate |
| LUE > 1 (positive LUE values) | ↑ land consumption > population growth | Land consumption occurs at a faster rate than population growth population |
↓ Decrease; ↑ increase.
Table 4.
Land Use Efficiency (LUE) for Denpasar, Indonesia; Kharkiv, Ukraine; and Mekelle, Ethiopia.
Table 4.
Land Use Efficiency (LUE) for Denpasar, Indonesia; Kharkiv, Ukraine; and Mekelle, Ethiopia.
| Land Use Efficiency (LUE) a | ||||||
|---|---|---|---|---|---|---|
| City | Population Growth Rate (PGR) b | Land Consumption Rate (LCR) b | 1975–1990 | 1990–2000 | 2000–2015 | 1975–2015 |
| Denpasar | 0.037 | 0.073 | 3.82 | 1.03 | 0.34 | 1.96 |
| Kharkiv | 0.0017 | 0.014 | 4.00 | −2.35 | −1.87 | 8.41 |
| Mekelle | 0.031 | 0.150 | 6.89 | 2.55 | 4.48 | 4.91 |
a Refer to equation 3: LCR/PGR = LUE. b PGR and LCR values in this table are calculated using data for the 40-year time frame—1975 and 2015. Values for all epochs are in Appendix A.
Table 5.
Changes in population and land consumption.
| Change in Populations and Land Consumption (1975–2015) | ||
|---|---|---|
| City | Population (% Change) | Land Consumption-km2 (% Change) |
| Denpasar | 1,433,518 (345%) | 177.75 (18%) |
| Kharkiv | 1518.409 (7%) | 194.07 (78%) |
| Mekelle | 278,595 (240%) | 8.86 (443%) |
Table 6.
Rate of urban infill.
| Rate of Urban Infill (1990–2015) a | |||
|---|---|---|---|
| Built-Up Area (km2) b | |||
| City | 1990 | 2015 | Rate of Urban Infill |
| Denpasar | 108.91 | 187.87 | 72% |
| Kharkiv | 404.78 | 447.21 | 10% |
| Mekelle | 0.69 | 8.88 | 1186% |
a Rate of urban infill derived for 1990–2015; Rate of urban infill for epoch 1975–1990 for all cities is over 1000% indicating rapid growth and urban change during this time frame. b Built-up area derived from Landsat classification.
Table 7.
Land consumption per capita (LCPC) per square meter (UN HABITAT, 2016b).
| Land Consumption per Capita (LCPC) (m2 per Person) | ||||
|---|---|---|---|---|
| City | 1975 | 1990 | 2000 | 2015 |
| Denpasar | 19.59 | 127.33 | 131.24 | 93.74 |
| Kharkiv | 159.22 | 232.85 | 248.05 | 274.72 |
| Mekelle | 1.80 | 4.66 | 7.21 | 23.57 |
Table 8.
LUE (Land Use Efficiency) and UN-LCRPGR ratio comparison.
| LUE (Land Use Efficiency) Comparison with UN-LCRPGR a Ratios (1990–2015) | ||
|---|---|---|
| City | UN-LCRPGR | LUE |
| Denpasar | 0.2 | 0.62 |
| Kharkiv | −1.4 | 0.11 |
| Mekelle | 0.9 | 3.64 |
a UN-LCRPGR = land consumption rate to population growth rate ratio; UN-LCRPGR is derived for epochs 1990–2000 and 2000–2015. Source: UN-Urban Centre Database [47]. The discrepancy in numbers is due to several reasons. First, it is likely due to a difference in the urban spatial extent, or the boundaries used in the supervised classification as compared to the boundary used by GHSL (Figure 6). However, there is no definitive way to conclude this until boundary definitions are clearly determined.
Publisher’s Note: MDPI stays neutral with regard to jurisdictional claims in published maps and institutional affiliations. |
© 2021 by the authors. Licensee MDPI, Basel, Switzerland. This article is an open access article distributed under the terms and conditions of the Creative Commons Attribution (CC BY) license (https://creativecommons.org/licenses/by/4.0/).
Share and Cite
MDPI and ACS Style
Laituri, M.; Davis, D.; Sternlieb, F.; Galvin, K. SDG Indicator 11.3.1 and Secondary Cities: An Analysis and Assessment. ISPRS Int. J. Geo-Inf. 2021, 10, 713. https://0-doi-org.brum.beds.ac.uk/10.3390/ijgi10110713
AMA Style
Laituri M, Davis D, Sternlieb F, Galvin K. SDG Indicator 11.3.1 and Secondary Cities: An Analysis and Assessment. ISPRS International Journal of Geo-Information. 2021; 10(11):713. https://0-doi-org.brum.beds.ac.uk/10.3390/ijgi10110713
Chicago/Turabian StyleLaituri, Melinda, Danielle Davis, Faith Sternlieb, and Kathleen Galvin. 2021. "SDG Indicator 11.3.1 and Secondary Cities: An Analysis and Assessment" ISPRS International Journal of Geo-Information 10, no. 11: 713. https://0-doi-org.brum.beds.ac.uk/10.3390/ijgi10110713
Note that from the first issue of 2016, this journal uses article numbers instead of page numbers. See further details here.