Article

Spatial-Planning-Based Ecosystem Adaptation (SPBEA): A Concept and Modeling of Prone Shoreline Retreat Areas

1
Center for Research, Promotion and Cooperation, Geospatial Information Agency (BIG), Cibinong 16911, Indonesia
2
Oceanography Department, Faculty of Fisheries and Marine Sciences, Diponegoro University, Semarang 50275, Indonesia
3
Regional Research Centre for Tropical Biology, SEAMEO BIOTROP, Bogor 16134, Indonesia
4
Geoscience and Digital Earth Centre, Faculty of Built Environment & Surveying, Universiti Teknologi Malaysia, Johor Bahru 81310, Malaysia
5
Department of Civil engineering, National Yang Ming Chiao Tung University, Hsin-Chu 30010, Taiwan
6
Department of Civil, Environmental and Geodetic Engineering, The Ohio State University, Columbus, OH 43210, USA
7
Department of Electrical and Computer Engineering, The Ohio State University, Columbus, OH 43210, USA
8
Translational Data Analytics Institute, The Ohio State University, Columbus, OH 43210, USA
9
Aerospace Information Research Institute, Chinese Academy of Sciences, Haidian District, Beijing 100094, China
*
Author to whom correspondence should be addressed.
ISPRS Int. J. Geo-Inf. 2021, 10(3), 176; https://0-doi-org.brum.beds.ac.uk/10.3390/ijgi10030176
Submission received: 22 January 2021 / Revised: 10 March 2021 / Accepted: 15 March 2021 / Published: 17 March 2021

Abstract

:
Ecosystem-based adaptation to climate change impacts, such as shoreline retreat, has been promoted at the international, national, and even local levels. However, among scientists, opinions about how to implement it in spatial-planning practices are varied. Science-based environmental factors, human wellbeing, and sustainable development can be strengthened by developing spatial-planning-based ecosystem adaptations (SPBEAs). Therefore, this article aims to assess how the SPBEA model can be developed within an area prone to shoreline retreat. A coastal area of the Sayung subdistrict in Central Java, Indonesia, was selected as a study area because it has experienced a massive shoreline retreat. A multicriteria analysis (MCA) method was employed for developing the model by using the geographic information system (GIS) technique of analysis, divided into three steps: the fishpond zone determination, which involved the analytical hierarchy process (AHP) method in the process of model development; the fishpond site determination; SPBEA fishpond site development. The results show that the SPBEA model is the best practice solution for combatting shoreline retreat because of tidal waves and/or sea-level rise. The spatial site management should empower the coastal protection zone and the sustainable fishpond zone by implementing a silvofishery approach.

1. Introduction

Climate change has presented a significant impact on the coastal environment. Flooding, abrasion, and shoreline retreat are examples of those impacts caused by storm surge [1], high tide [2], or sea-level rise [3,4,5] which have been triggered by climate change. The impact is elevating with human behavior in utilizing existing natural resources. Conversion of coastal ecosystems to intensive agricultural areas or settlements and groundwater discharge are examples of human exploitation of the coastal ecosystem which could endanger the coastal area against disaster of storm surges, high tide, sea-level rise, or land subsidence. Land subsidence is one type of relative sea-level rise related to the local vertical coastal and seafloor motion [3,6].
High tide, tidal wave, and relative sea-level rise, whether individually or in combination, have significant effects on natural-resource systems and the social life of coastal communities [7], one of which is shoreline retreat. Projection models of shoreline retreat as an effect of high tide and relative sea-level rise were created by [3,5,8]. Indeed, [9] showed how shoreline retreat can destroy infrastructure, lead to loss of land, and destroy agricultural land on the north coast of Java. This ongoing shoreline retreat has forced the local community to adapt. Furthermore, [10] studied how societies respond to shoreline retreat threats by infrastructure development to slow down or halt the effects. However, these adaptations will not be a success without an understanding of the coastal ecosystem’s functions. To mitigate the effects of ocean-based disasters on the coastal area, the ecosystem services, the ecosystem mechanisms, and the importance of adapting to the changing coastal situation should be understood. Coastal-ecosystem functions and mechanisms, particularly intertidal wetlands, may play an important role in reducing the impact of coastal hazards caused by rising sea levels and tidal waves through their role in wave attenuation, sediment capture, vertical accretion, erosion reduction, and the mitigation of storm surges and debris movement [11].
Ecosystem-based management has been promoted internationally as the best way to ensure the sustainability of marine environments since it is characterized by sustainability, ecological health, and human inclusion in the ecosystem [12]. Science-based environmental factors, human wellbeing, and sustainable development can be strengthened through developing spatial-planning-based ecosystem adaptations (SPBEAs). Accordingly, [13] operationalized how ecosystem-based adaptation can be implemented in urban planning in Sweden from a local government perspective. On the other hand, [3] studied how this ecosystem-based adaptation can be implemented in a rural area for shrimp pond spatial planning. Therefore, the implementation of SPBEA is important within a continuing shoreline retreat-prone area.
The key objective of this study was to assess how the SPBEA model can be developed for an area prone to shoreline retreat. The geographic information system (GIS) technique was applied to develop the model. GIS is an efficient and effective technique since it can assist in modeling and summarizing complex spatial data into a spatially specific requirement in spatial planning [14,15]. The application of GIS as a decision-making tool, especially in spatial planning and spatial adaptation modeling, has been widely implemented in various countries, such as in [16] which studied the use of GIS for aquaculture spatial planning in Europe and [17] which used GIS as a tool to develop an adaptation model to climate change in Greece. Asian countries such as Indonesia have also used GIS as a tool for spatial planning decision support system development [14,18].
The GIS technique applied can also be varied from a simple overlay technique, using a weighted-score analysis up to the development of spatial decision support system tools (SDSS) [16,18]. The development of SPBEA using the GIS technique, on the other hand, cannot rely on a single technique, but rather requires a multicriteria analysis (MCA) combining spatial analysis techniques, such as buffers and overlays, as well as new algorithm development and the use of surveying and remote sensing for generating input data. However, the spatial data and the GIS technique used may vary depending on the specific spatial requirements for planning. For this purpose, a coastal area of the Sayung subdistrict, Central Java, Indonesia, was selected as the study site because it has experienced massive shoreline retreat over the last three decades. At the same time, detailed spatial planning methods with an ecosystem-based approach are not yet available, especially for coastal rural settlement areas. Unlike previous research, the SPBEA model presented herein combines land system data with land suitability data, which are rarely used in the development of spatial planning and adaptation models. Indeed, more advanced techniques such as SDSS tools were not implemented in this study. This SPBEA model focuses on the spatial distribution of fishpond culture in the coastal area of rural Sayung, on which the majority of local communities depend as their main livelihood.

2. Materials and Methods
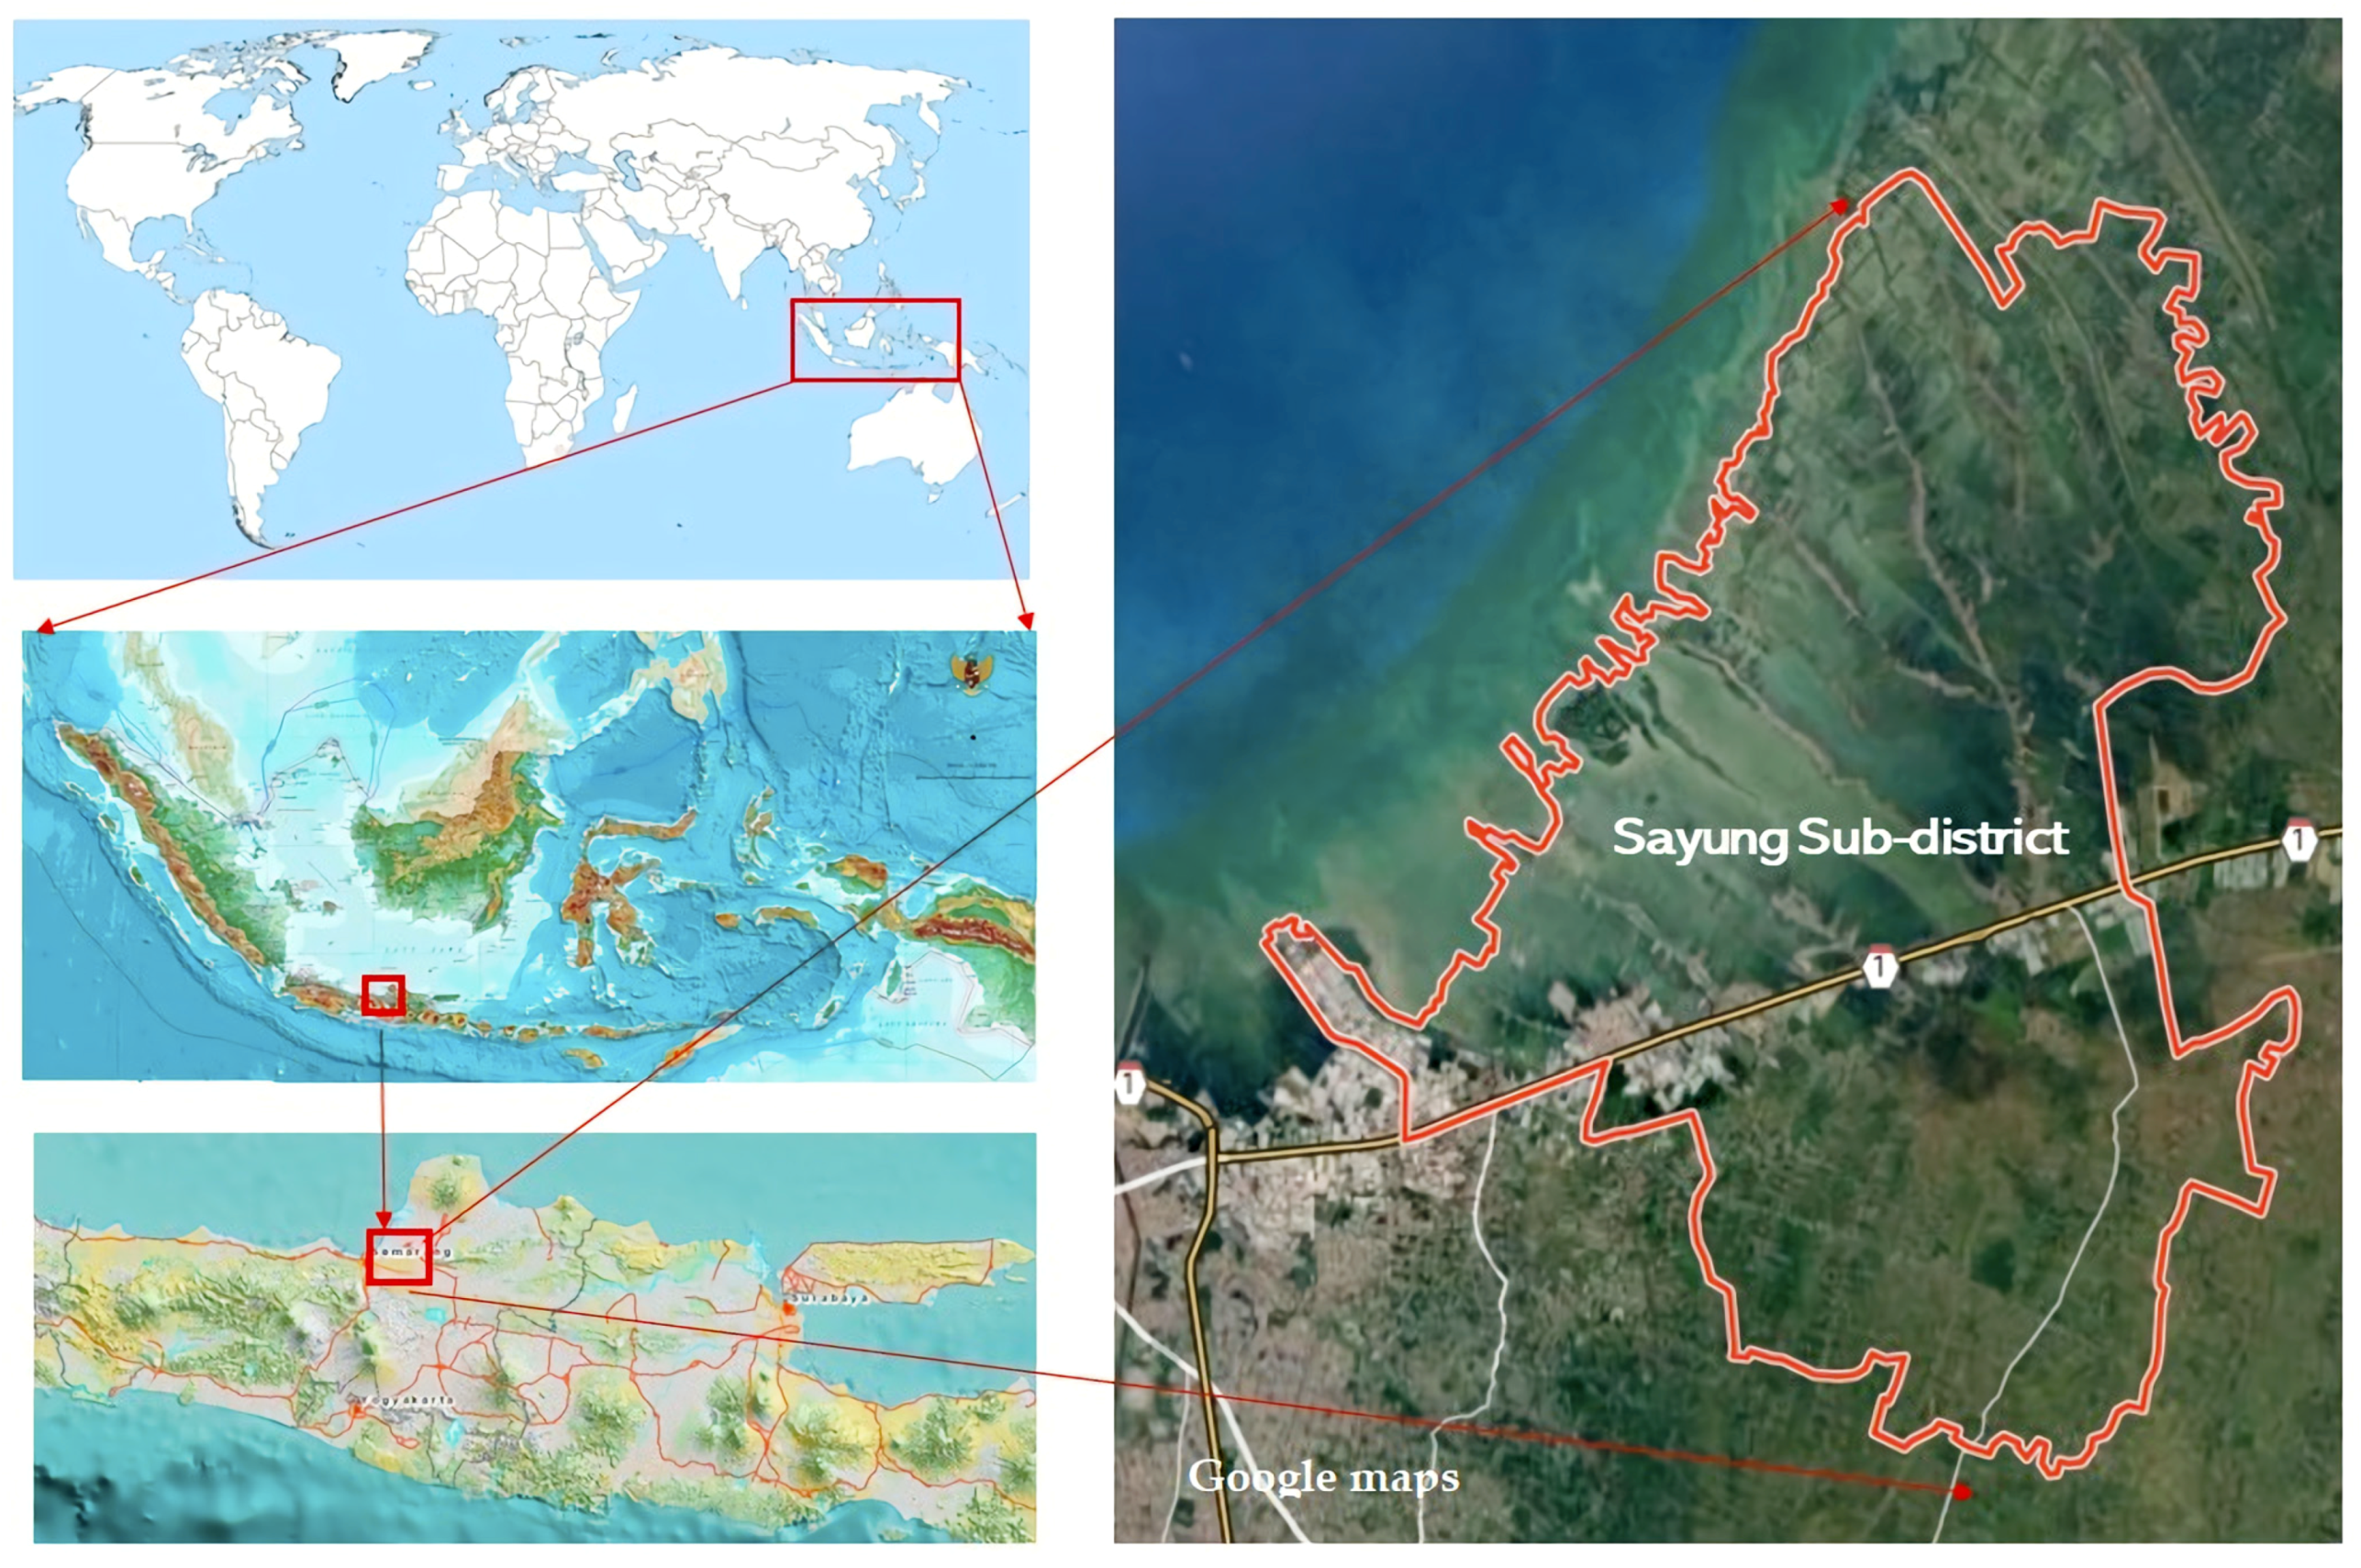
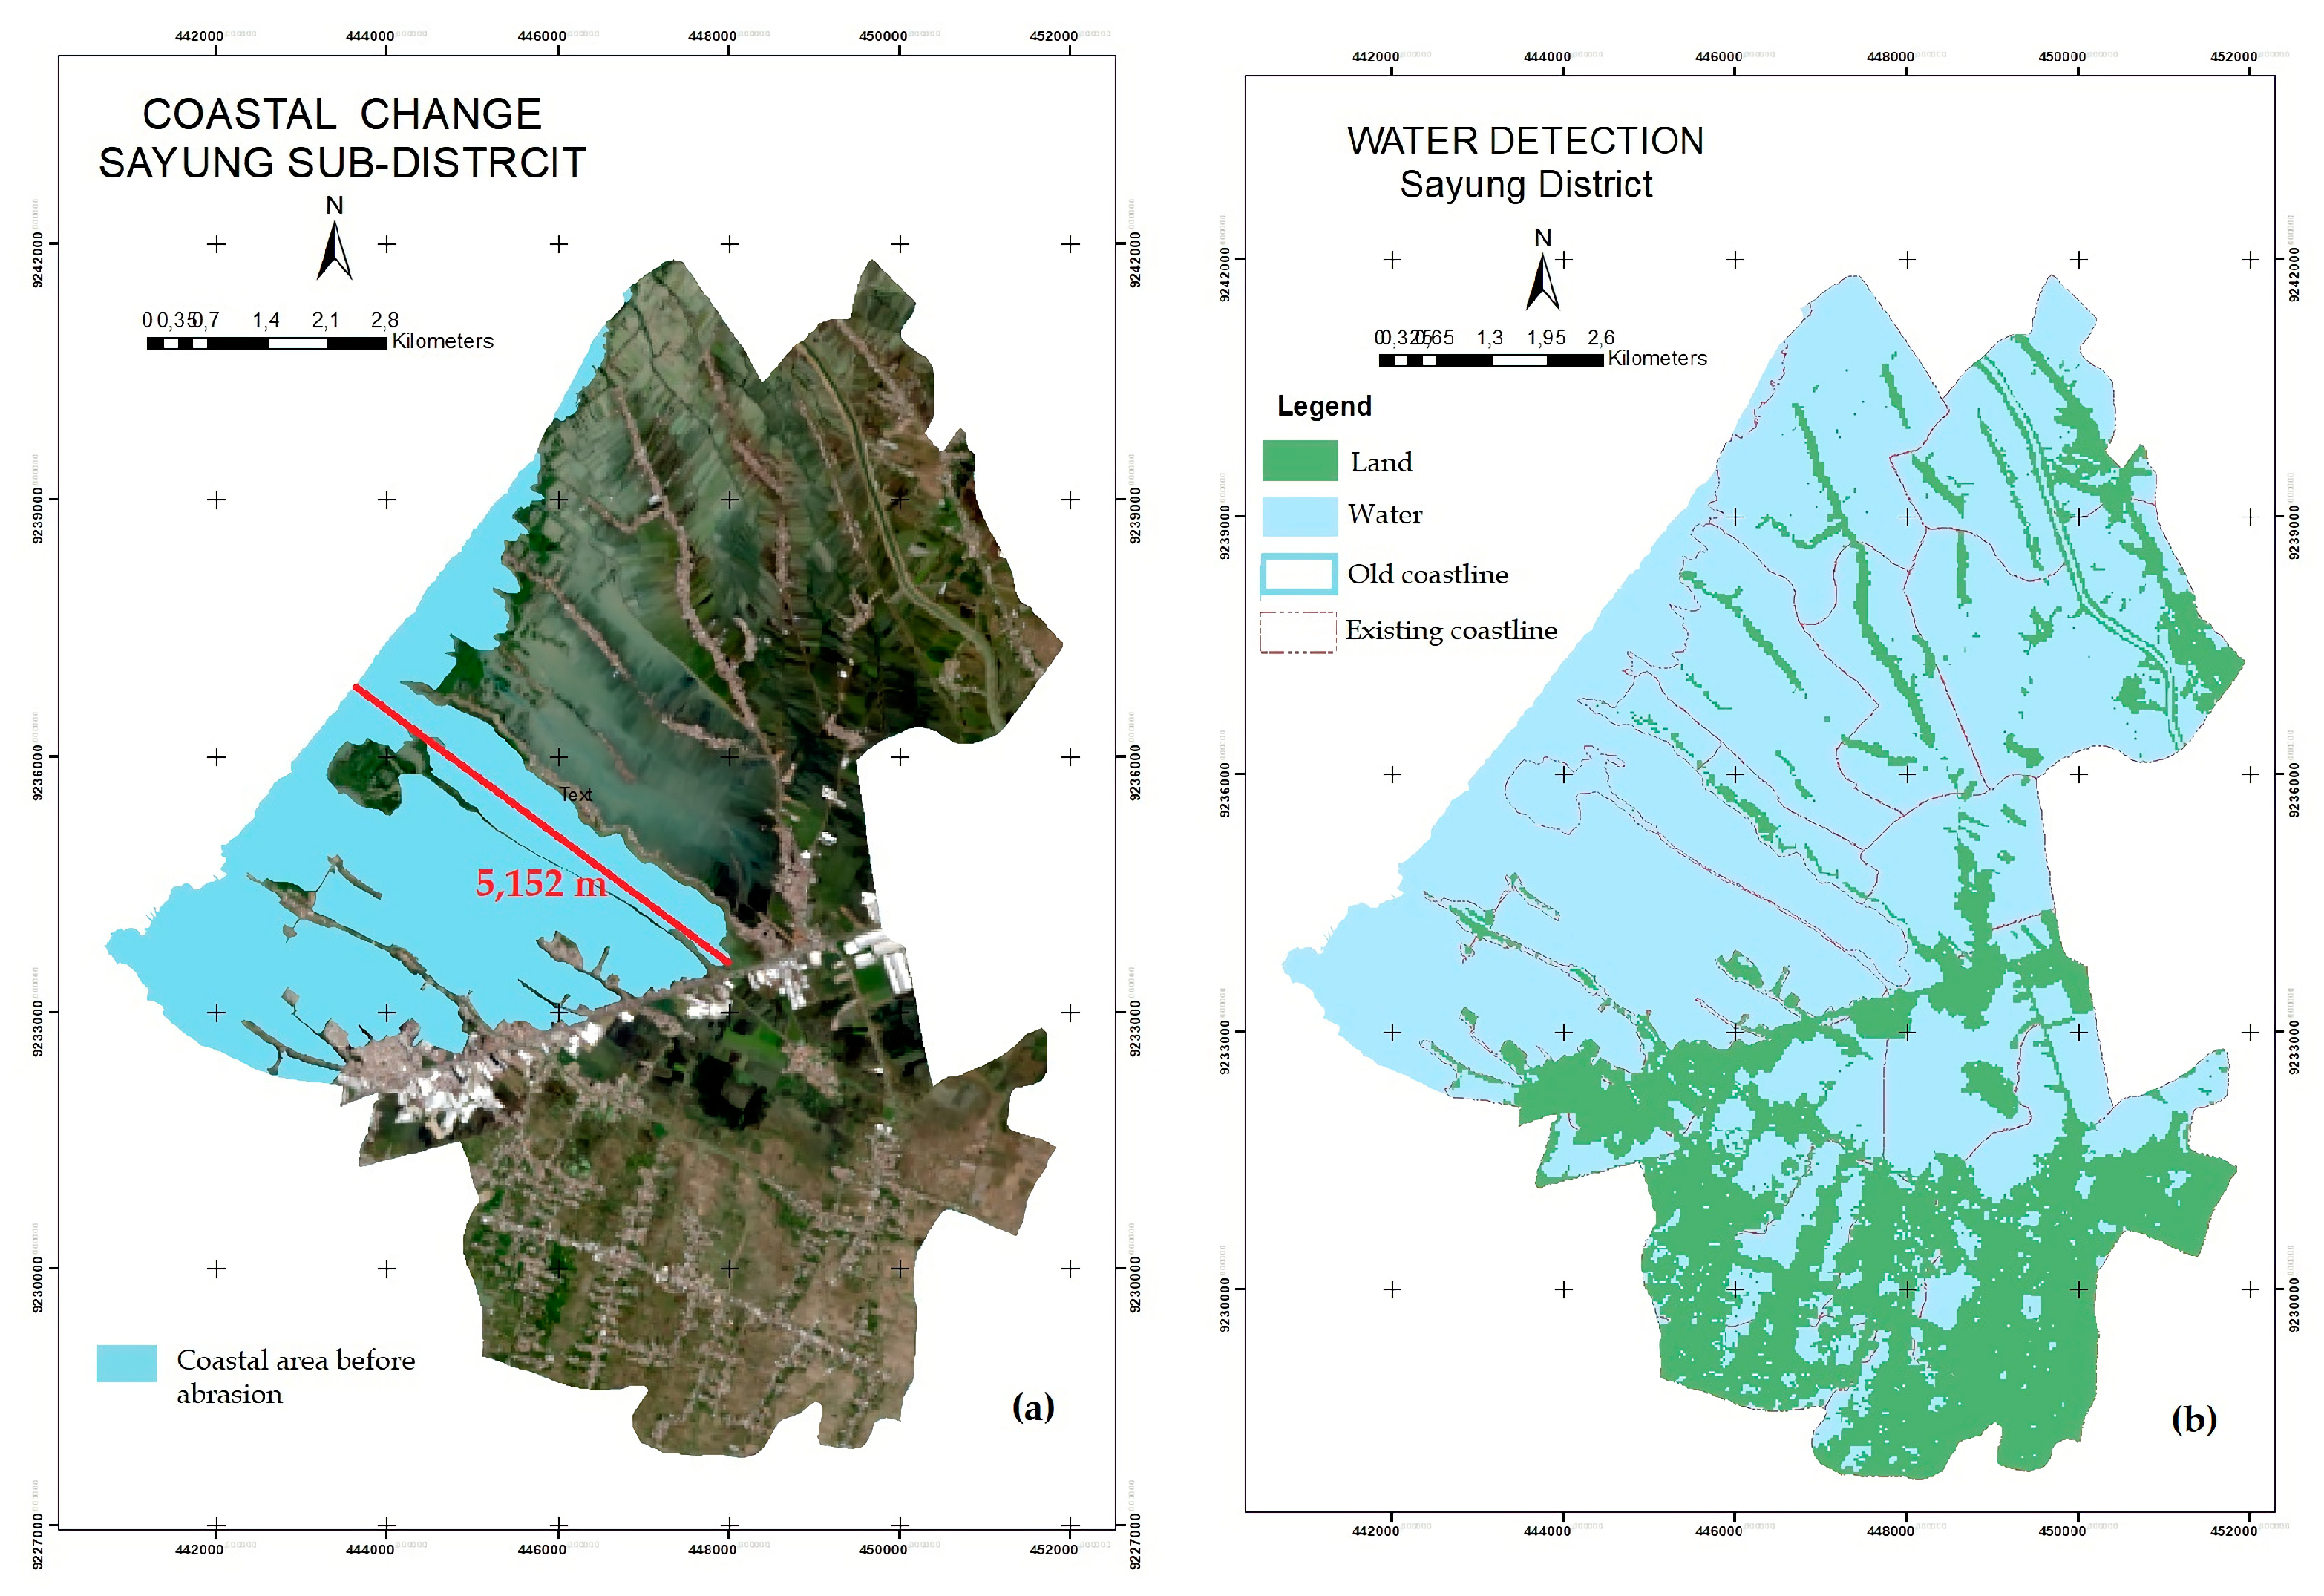
2.1. The Study Area

Sayung is a subdistrict on the northern coast of the Demak district, Central Java, Indonesia (see Figure 1). This coastal area has arisen from river sediment forming a quarter alluvium geologic formation [19] and has a reddish-brown alluvium soil type to the north and hydromorphic alluvium to the south [20]. The coastal area of Sayung is a lowland with relatively flat topography, i.e., slope less than 2% and elevation of 0–5 m above sea level [21].
This area has experienced massive shoreline retreat caused by relative sea-level rise related to land subsidence, land-use conversion, and high tide. The area has lost 25 km2 of land to the sea [22], or about 5152 m of coastline has moved inland [23], which can be seen in Figure 2a. Research by [24] indicates that the land subsidence in this area ranges from 8.35–12.31 cm per year, with an average sea level increase of about 8.294 cm per year [21]. Because of these changes, tidal inundation, which locals call “rob”, occurs daily in the study area, not only at high tide but also at low tide [25]. The inundation of seawater is illustrated in Figure 2b, which shows the normalized difference water index (NDWI) image using the near-infrared (NIR) and shortwave infrared-1 (SWIR-1) bands of Landsat 8 Oli.
Figure 1. Location of the study area, obtained from Google Maps and [26,27].
Ijgi 10 00176 g001
Land use in this subdistrict is dominated by fishponds in the north and rice fields in the south, with areas of 5825.66 ha and 13,621.7 ha, respectively [29]. The land use has been linked to local communities, whose livelihood depends on the farms and fishponds [30]. Indeed, a map of the land system shows that the coastal area is a better land system for aquaculture and mangrove ecosystems, as a KJP (kajapah) land system type, an intertidal swamp under halophytic vegetation, with sedimentary alluvium soil [31,32]. Considering the environmental problems that occur in this area, [33] suggested that the implementation of an ecosystem-based approach would be a solution for sustainable management. Therefore, a design based on spatial-planning-based ecosystem adaptation (SPBEA) needs to be developed.

2.2. Methodological Design of SPBEA Model

A multicriteria analysis (MCA) was incorporated into the GIS environment to develop a model [34]. The SPBEA model was developed in three steps (Figure 3). The first was the fishpond zone determination sub-model, which involved an analytical hierarchy process (AHP) method in model development. The output of this step was the land potential for fishponds. The second was the fishpond site determination, where the output was the model of spatial allocation for fishponds. The third step was the SPBEA fishpond site development, with the output being the SPBEA site management planning model.
The data for this study consisted of the following:
(a)
Land system digital map of Demak district scale 1:50,000 from the Badan Informasi Geospasial (BIG).
(b)
Land-use/land-cover data obtained from the Badan Informasi Geospasial (BIG) digital Rupabumi map (base map) of Sayung at a 1:5000 and 1:25,000 scales.
(c)
Spatial plan of Demak District of Regional Government of Demak, year 2020.
(d)
High-resolution orthorectified image of Timbulskolo village obtained from BIG.
(e)
Landsat 8 Oli image derived on 29 July 2020, downloaded from https://earthexplorer.usgs.gov/ (accessed on 22 January 2021).
(f)
Soil map of Demak District at a 1:50,000 scale obtained from Balai Besar Sumberdaya Lahan Pertanian (BBSDLP).
(g)
The slope data obtained from the BIG seamless digital elevation model (DEM) and National Bathymetry website (https://tides.big.go.id/DEMNAS (accessed on 22 January 2021)).
(h)
pH, salinity, social, and environment information from field data, obtained in February and December 2020.
(i)
Flood-prone area derived from normalized difference water index (NDWI) of Landsat 8 Oli.
(j)
Green belt and protection zone derived from the spatial analysis of Rupabumi map, Landsat 8 Oli image, and high-resolution orthorectified image of Timbulsloko village.
Figure 2 summarizes and explains the use of the data for development of the SPBEA.
The three steps of the activity are explained in more detail in the upcoming sections.

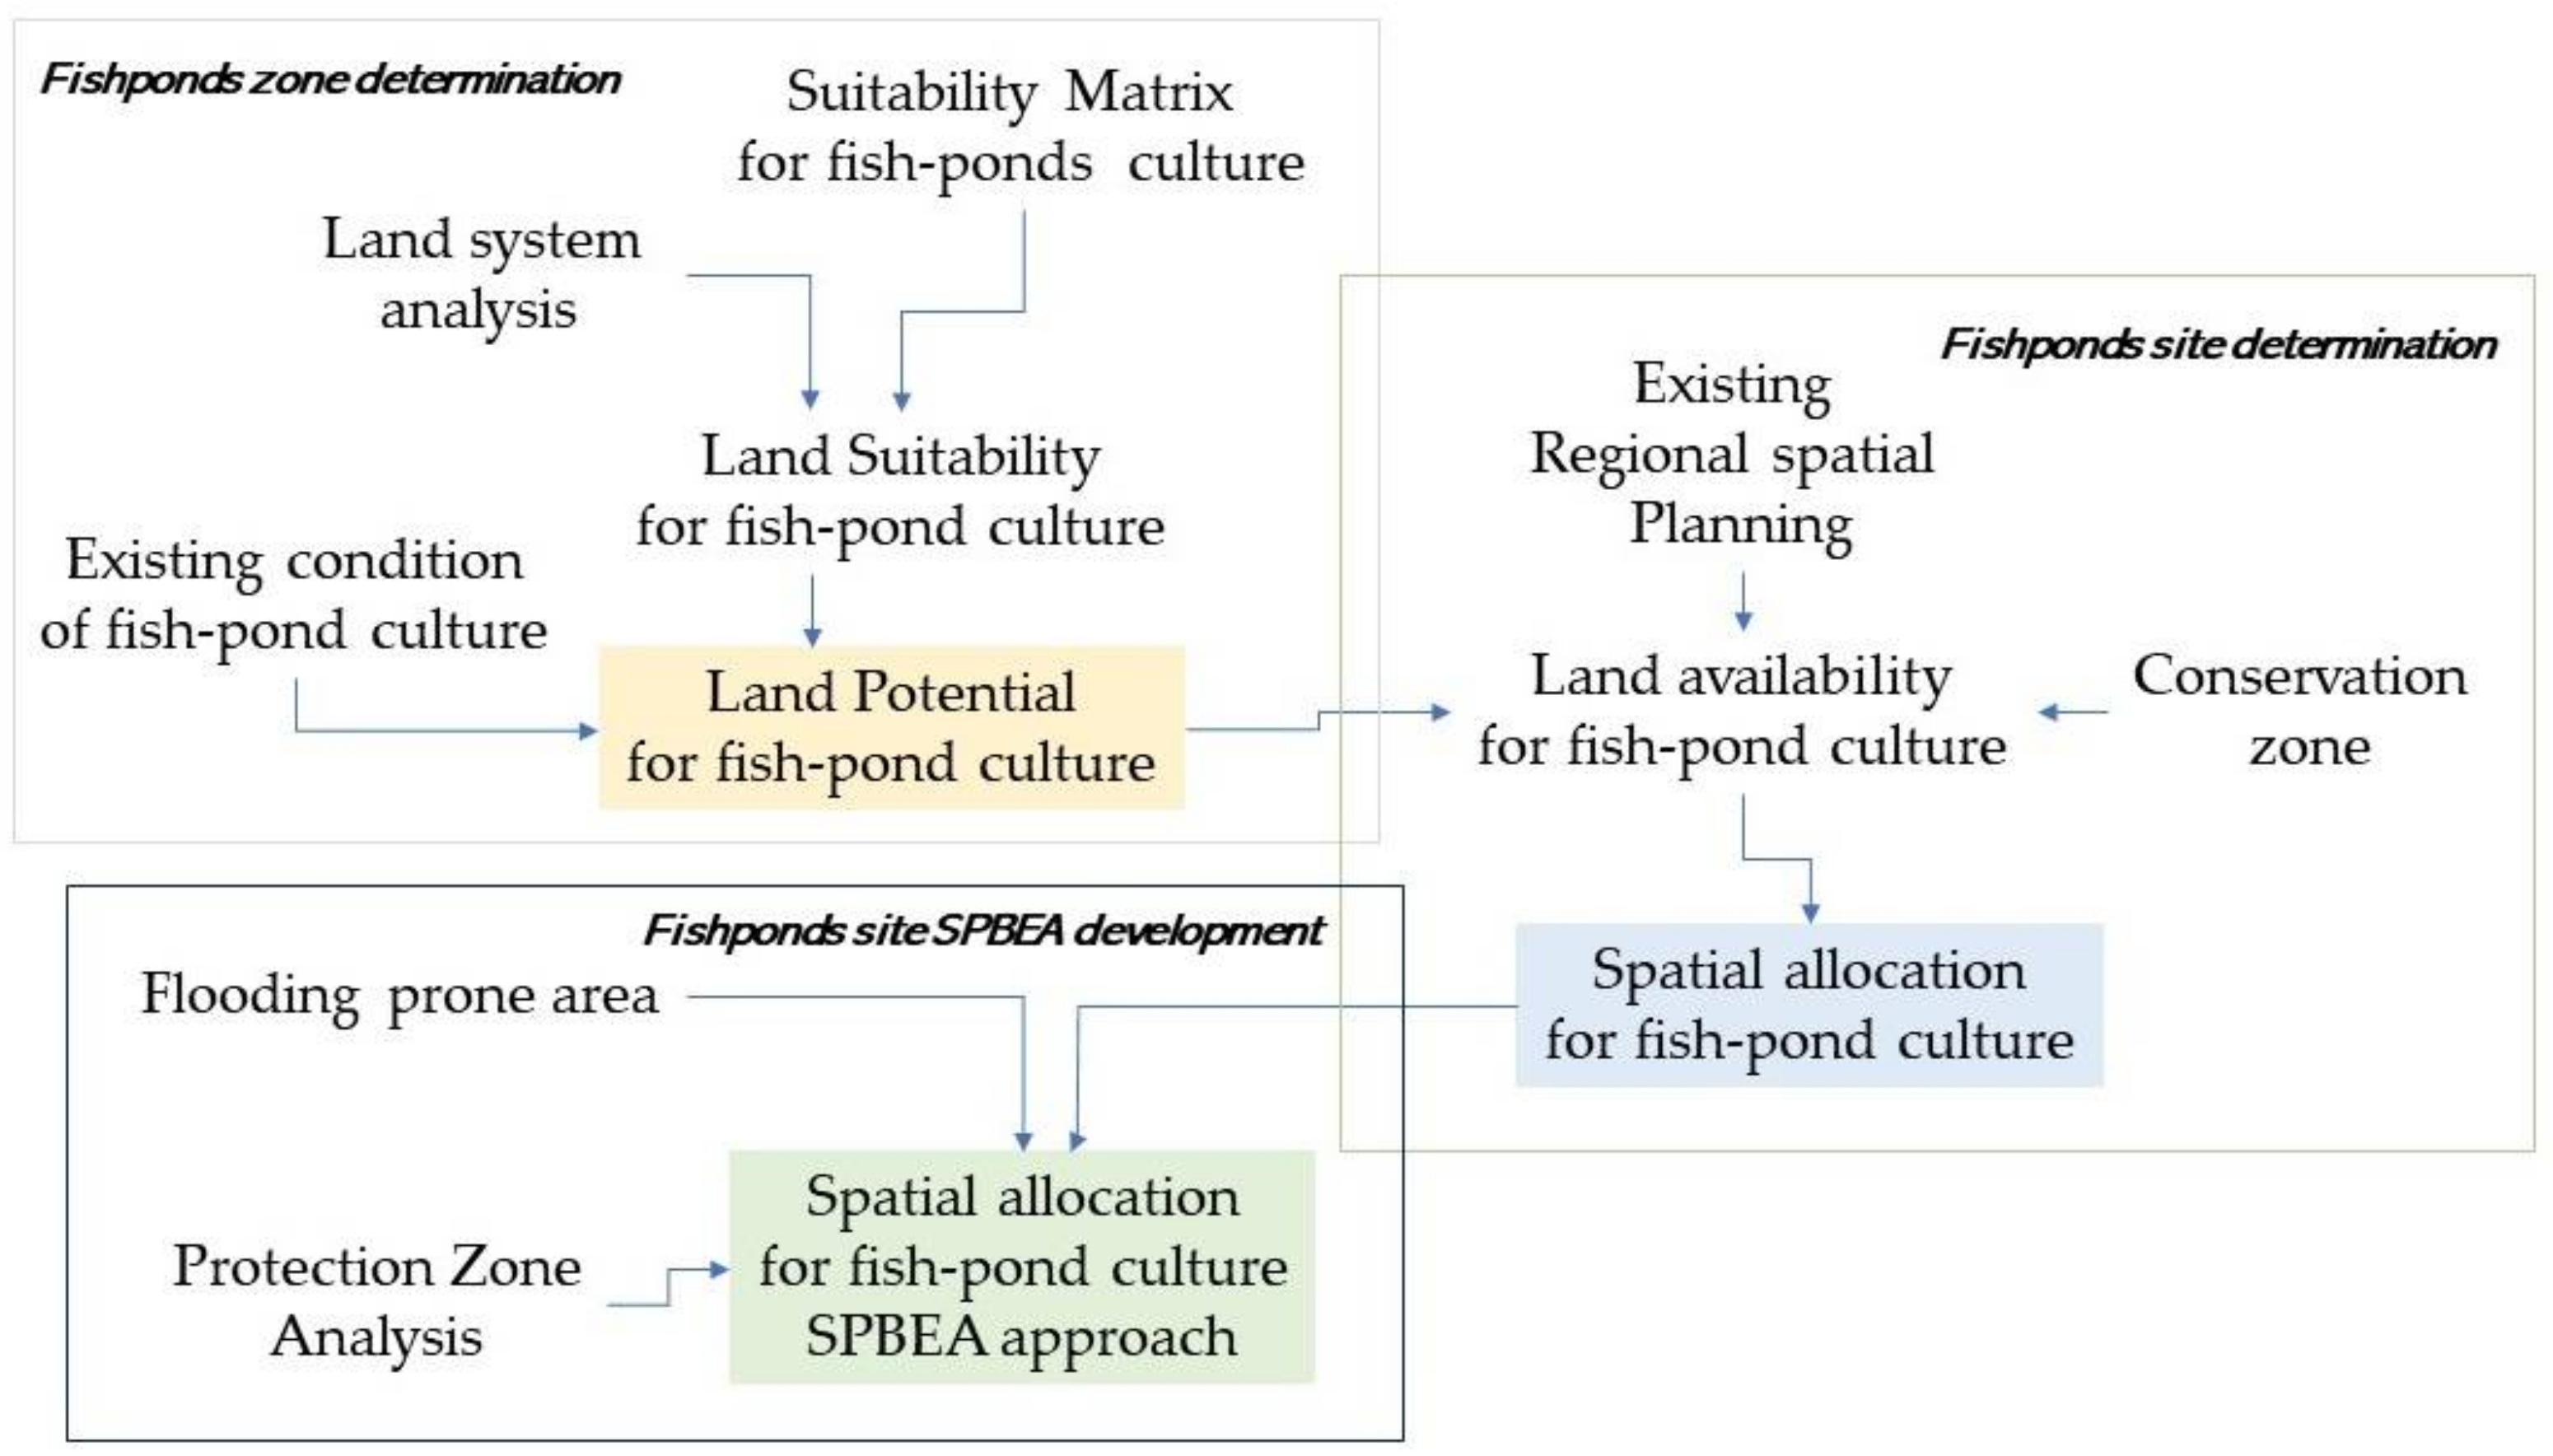
2.2.1. Fishpond Spatial Zone Determination

An integration of two processes for land suitability analysis was used to determine the appropriate zone for fishpond cultivation, i.e., suitability for fishpond culture-based AHP and suitability based on land system. The GIS technique of algorithm-based overlay analysis, intersection overlay, spatial joint, and simple query was employed in this step.

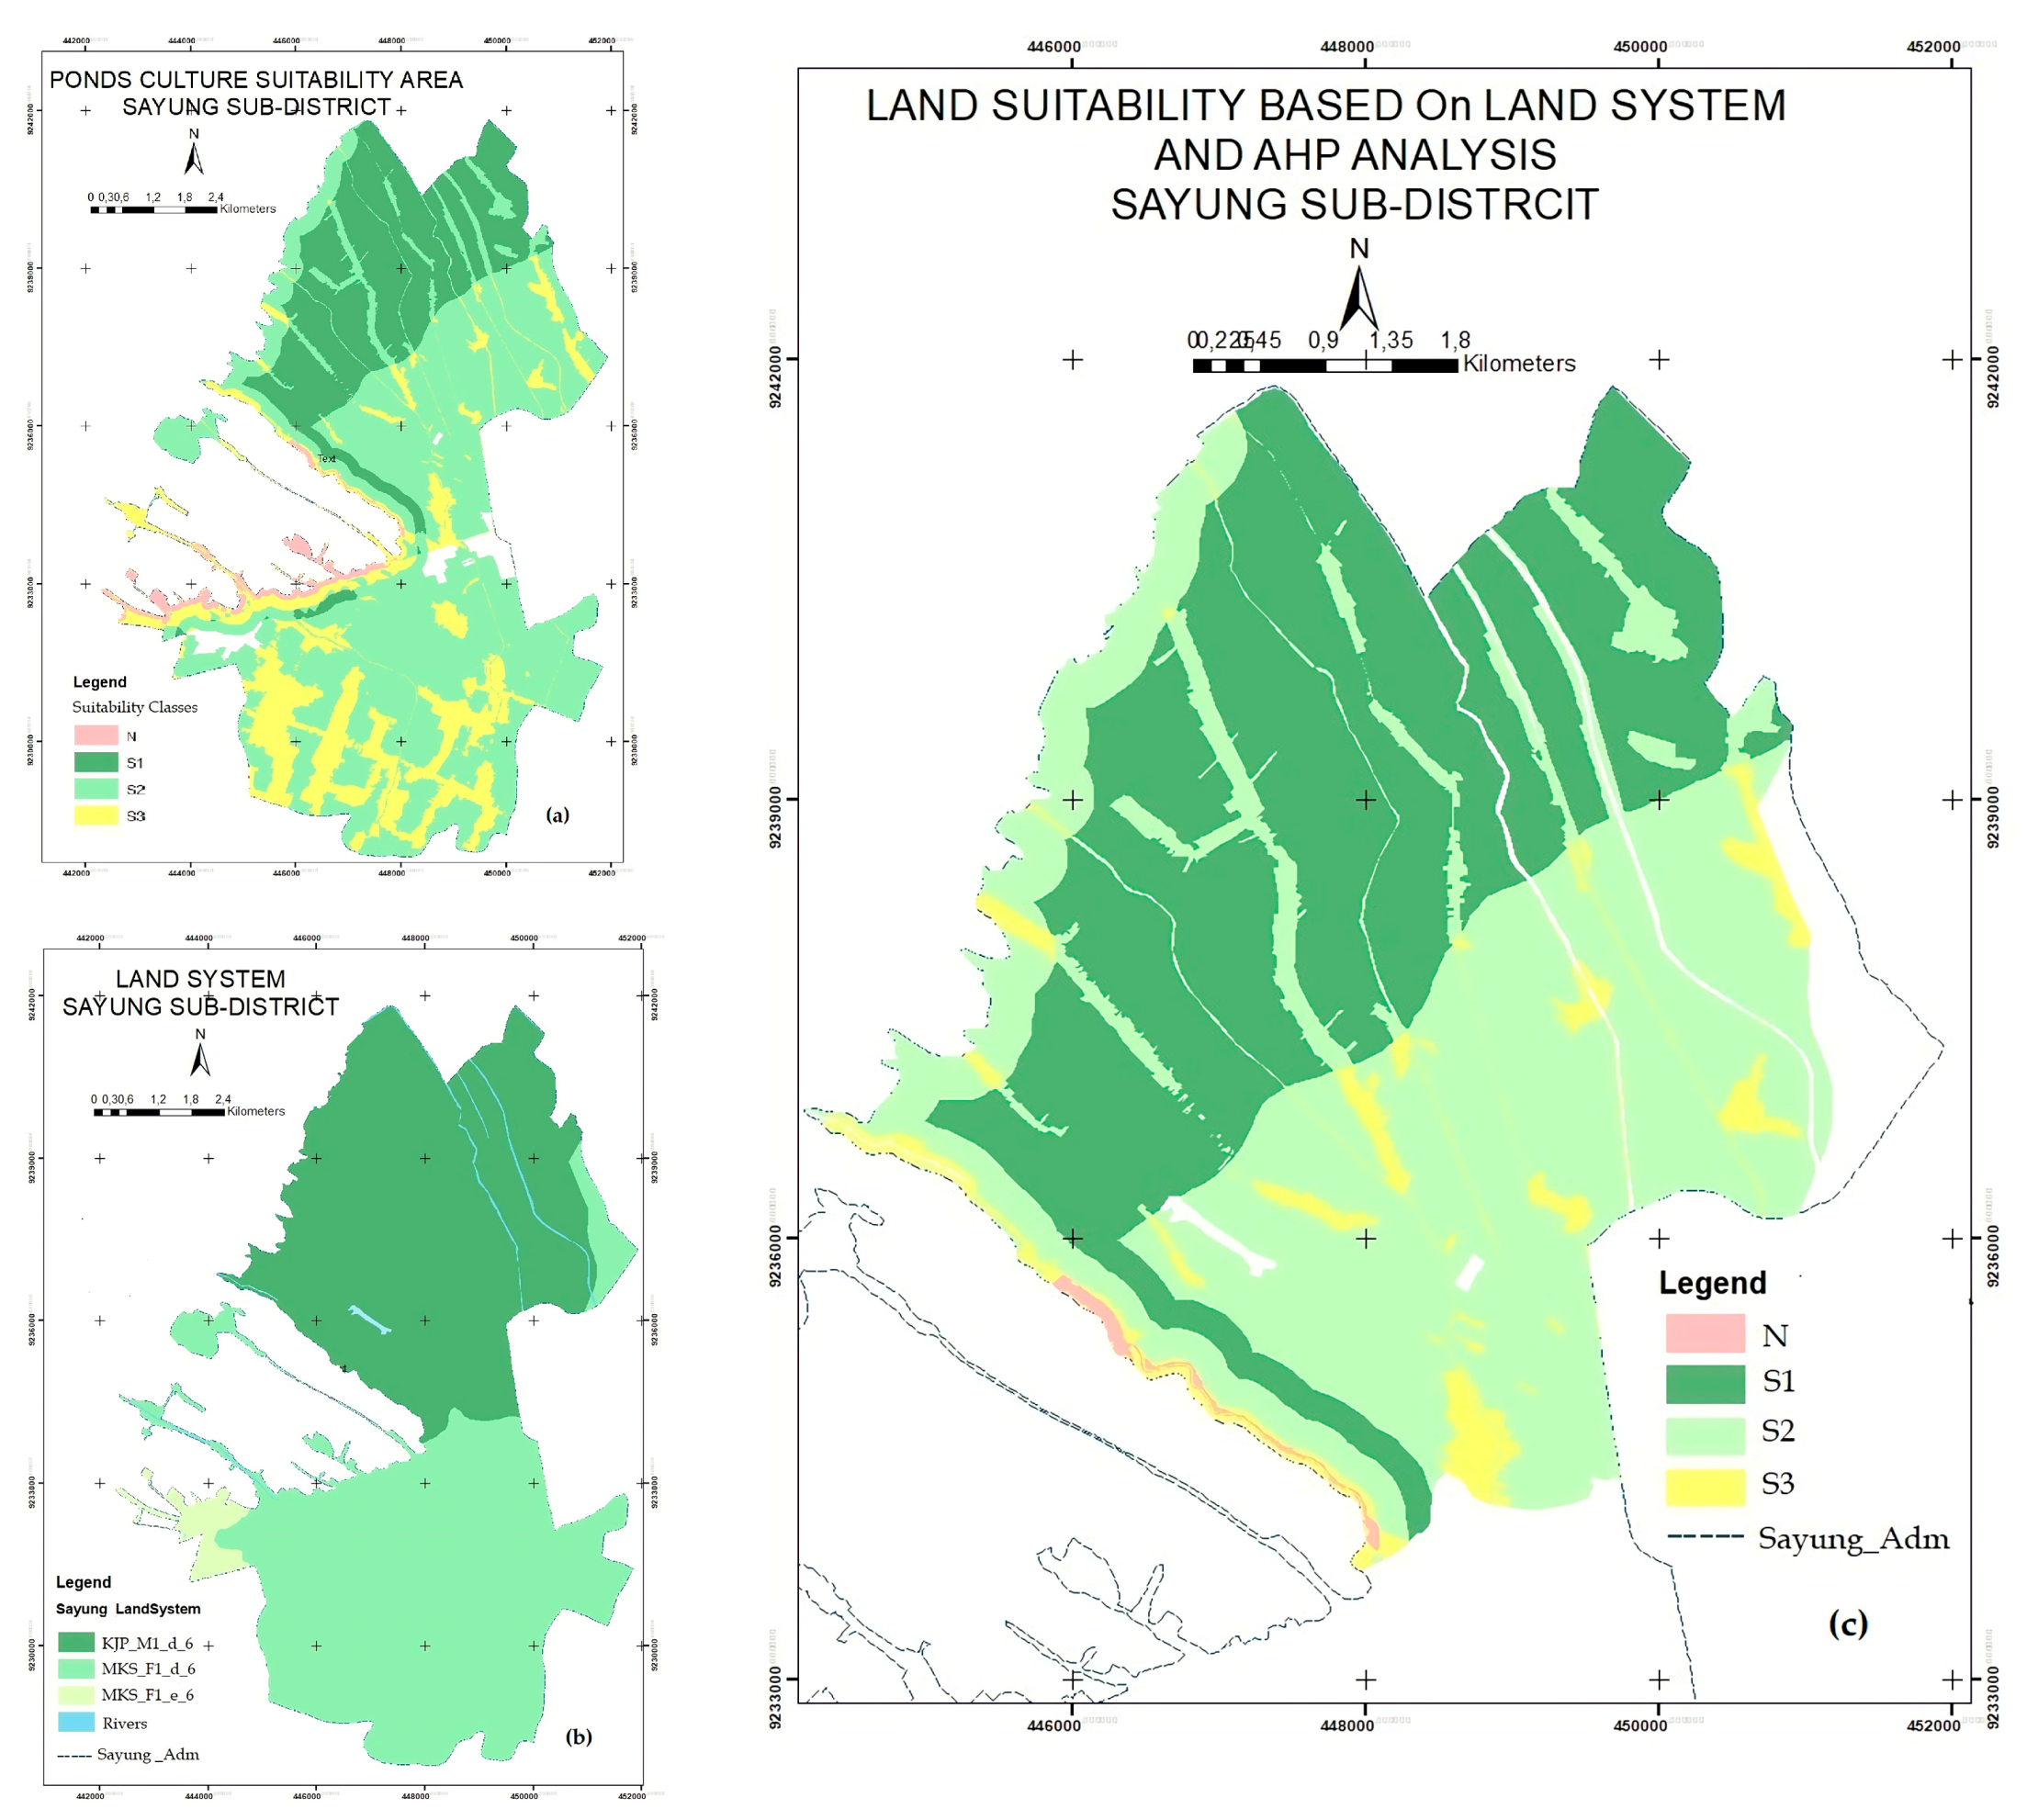
The Suitability for Fishpond Culture-Based AHP

The AHP method was employed because it can reduce subjectivity in decision-making by providing a collection of selection filters (hierarchies), thus allowing a choice between complex alternatives [35]. Three experts in spatial environments and spatial marine culture were involved in the process of algorithm development using the AHP method. The AHP judgment was derived by identifying the scaled hierarchical structure of the parameters, followed by developing and normalizing the pairwise comparison matrix to synthesize the priority level to obtain the weight values, and then the weighted decision was calculated on the basis of the normalized matrix and the eigenvectors [36].
The weight of each criterion or sub-criterion was determined by comparing the paired matrices in the context of the AHP [37]. This analysis allowed us to define the prioritization of each parameter. However, the subjective preferences of researchers might lead to inconsistencies in the definition of prioritization. Therefore, to define the acceptable value for this inconsistency, the consistency ratio (CR) was calculated. A CR value less than 0.1 denotes consistency (Table 1).
Continuing from the AHP result, the coastal area was classified as highly suitable (S1), moderately suitable (S2), marginally suitable (S3), and unsuitable (N) [38,39]. Then, a land suitability matrix was defined according to the priority of the weight of each respective parameter from the AHP assessment (Table 2).
The formula for suitability classification was defined from this matrix. According to [36], the equation can be defined as follows:
S i =   w i s i ,
where S i is the suitability class i, w i is the weighting factors class i, and s is the scoring value of parameter i for suitability class i.
Then, by implementing the AHP results, the following equation was obtained:
S i = 1.8 s i 1 + 1.4 s i 2 + 1.2 s i 3 +   1.0 i 4 +   0.8 i 5 + 0.5   s i 6 +   0.4 s i 7 ,
where 1.8 to 0.4 is the weighting or priority value of parameter i to n.
The determination of the suitability class interval (x) using Equation (1) can be defined as follows:
x i =   w s i m a x + w s i m i n 2 .
The interval classes were defined as S 1 => x 1 , S 2 =   x 1   to   x 2 , S 3 =   x 2   to   x 3 , and N = < x 3 , where x 1 is the average value of ( S 1 ) and ( S 2 ) , x 2 is the average value of class ( S 2 ) and S 3 , and x 3 is the average value of class S 3 and N, and ( S 1 ) is very suitable, ( S 2 ) is moderately suitable, ( S 3 ) is marginally suitable, and (N) is unsuitable.

Integrating the Suitability for Fishpond Culture-Based AHP with Land System Analysis

The authors of [40] stated that a land system is a land facet assembly with geomorphological and geographical relationships and with recurring land, soil, and vegetation patterns. Land systems consist of eight categories: lithology, hydrology, climate, vegetation, land use, soil, topography, and land fragmentation [41]. These physical land system characteristics have already been implemented for land suitability for agriculture, livestock (cattle), brackish fisheries, and agroforestry [41]. For this study, the land system analysis consisted of the spatial categorization of the land into the land unit which was the most suitable for fishpond culture.
The Sayung subdistrict has three types of land systems: (a) an intertidal swamp under halophytic vegetation (KJP), (b) coalescent estuarine/riverine plains in dry areas (MKS-F1-e), and (c) a fluvial plain with poor drainage in a dry area (MKS-F1-d) [31]. In the Sayung case, KJP is the most suitable land system for brackish fisheries, ponds, and mangrove cultivation [32]. This is related to the characteristics of this land, i.e., an intertidal swamp under halophytic vegetation, low and wide coastal land that is partly inundated, average rainfall between 400 and 3100 mm, 2–10 wet months and 0–7 dry months per year, and a marine group [32,42]. The land system is used to complement the characteristics of land suitability for fishpond culture obtained from land suitability-based AHP. Integrating both land system analysis and land suitability-based AHP allows defining the most precise land suitability for the area of interest, as expressed in the following equation:
S S i =   S i A   S i L ,
where S S i is the suitability class i, S i A is suitability class i derived from the AHP-based analysis, and S S L is the suitability class derived from land system analysis.

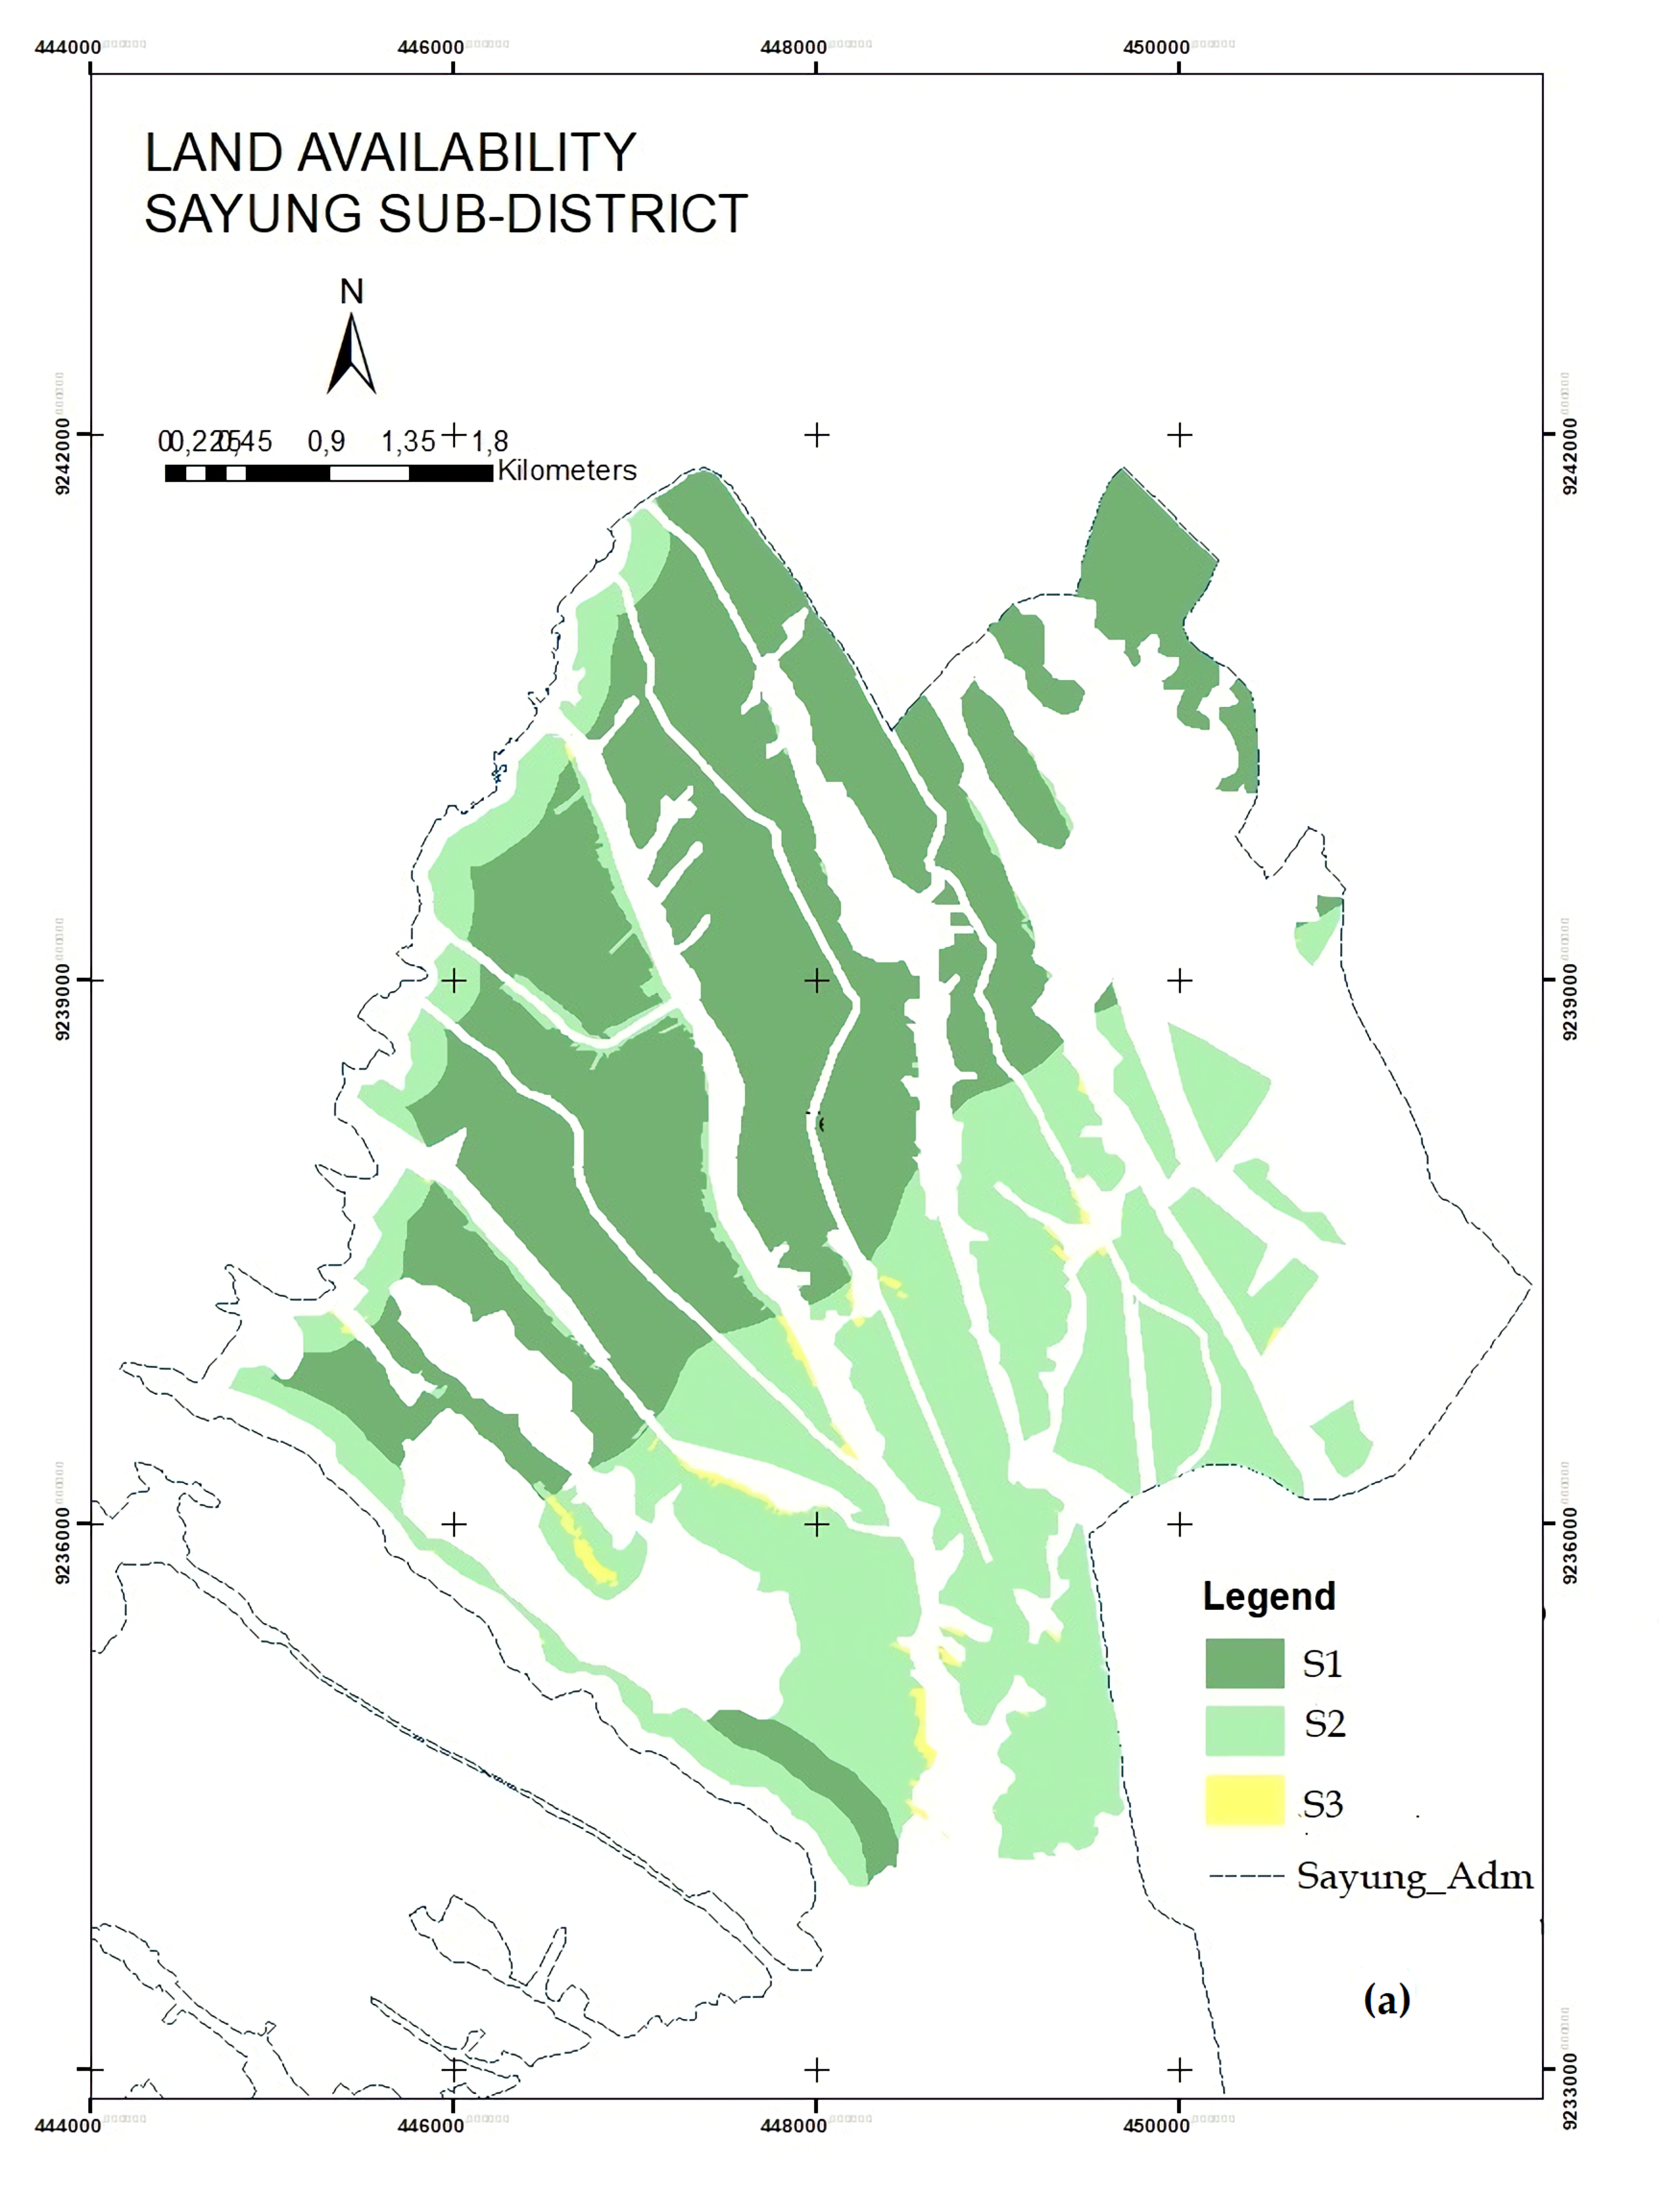
Land Potential Analysis

The objective of the fishpond culture zone selection is to identify the potential land to be used as a fishpond zone. The land potential analysis was developed using both the land suitability classes and the existing land conditions of areas under fishpond culture. The potential zone was defined by adding the assessment of the multiple years featuring fishpond culture, in which the pond production was good and profitable for the local farmers. The potential classes were still defined by the class of suitability, as defined above. The equation can be explained as follows:
S P i =   S S i + S P e ,
where S P i is the potential fishponds class i and S P e is the existing pond.

2.2.2. Fishpond Spatial Site Determination

A parcel of land may have the potential to be developed into a fishpond culture site, but it may not be available for future use due to certain criteria in the SPBEA design. To be available, potential land must not be part of a conservation or other protected areas, such as greenbelts along the coast and rivers; moreover, they must have a clear ownership status and must be part of the spatial planning zone. Conservation is an efficient and effective means of addressing biodiversity loss, helping to buffer society from the effects of climate change, and maintaining critical ecosystem services on which all societies depend upon [43]. Indeed, coastal greenbelts are important for the prevention of coastal erosion and the reduction of other natural hazards, such as tidal surges [44]. The GIS technique of buffering, with an intersecting spatial overlay of intersecting, following the algorithm can be applied for this step.
The algorithm used in the land availability analysis is as follows:
S a i =   S P i c I m o ,
where S a i is land available class i, P i is the potential area class i for fishpond culture, c is the conservation zone, and I m o is the land use of class m to o.
However, the availability status of the land remains unclear without considering the regional spatial regulation and policy. Thus, the assessment of the SPBEA should be adjusted to the regional government regulations on spatial planning. The land is only available in a cultural zone defined by the fishery cultivation zone and the zone for rural settlement. The output of this assessment is the spatial allocation for fishpond culture and can be described in the following algorithm:
S A i =   S a i   S P x y ,
where S a i   is the land allocation for fishponds, S a i is available land for fishponds, and S P x y is the spatial zone for zone x and y.

2.2.3. Fishpond Spatial Site SPBEA Development

Following the result of the fishpond sites, the site management analysis for fishpond culture was carried out using a high-resolution remote-sensing image analysis obtained from the BIG equipped with field data to determine the existing land use, followed by a site-planning analysis. A visual interpretation was employed for high-resolution remote-sensing images, which classified the area into mangrove, net ponds, fishponds, settlements, gardening/roads, and rivers. For the site-planning analysis, the fishpond design followed [45] regarding the design and followed a modification of [46] for the percentage of mangroves in a pond area. The percentage of mangrove was 40% to 60% depending on the location’s exposure to ocean or rivers. An NDWI model was also employed to assess the tidal flooding into the area (Figure 2b). The algorithm of NDWI can be explained as follows:
N D W I   =   N I R S W I R 1 N I R +   S W I R 1 ,
where NIR is the infrared band of Landsat 8 Oli and SWIR1 is the shortwave infrared band of Landsat 8 Oli.
In terms of the detailed location, the site analysis focused on the coastal villages that were most affected by the shoreline retreat due to tidal waves and abrasion.

3. Results and Discussion

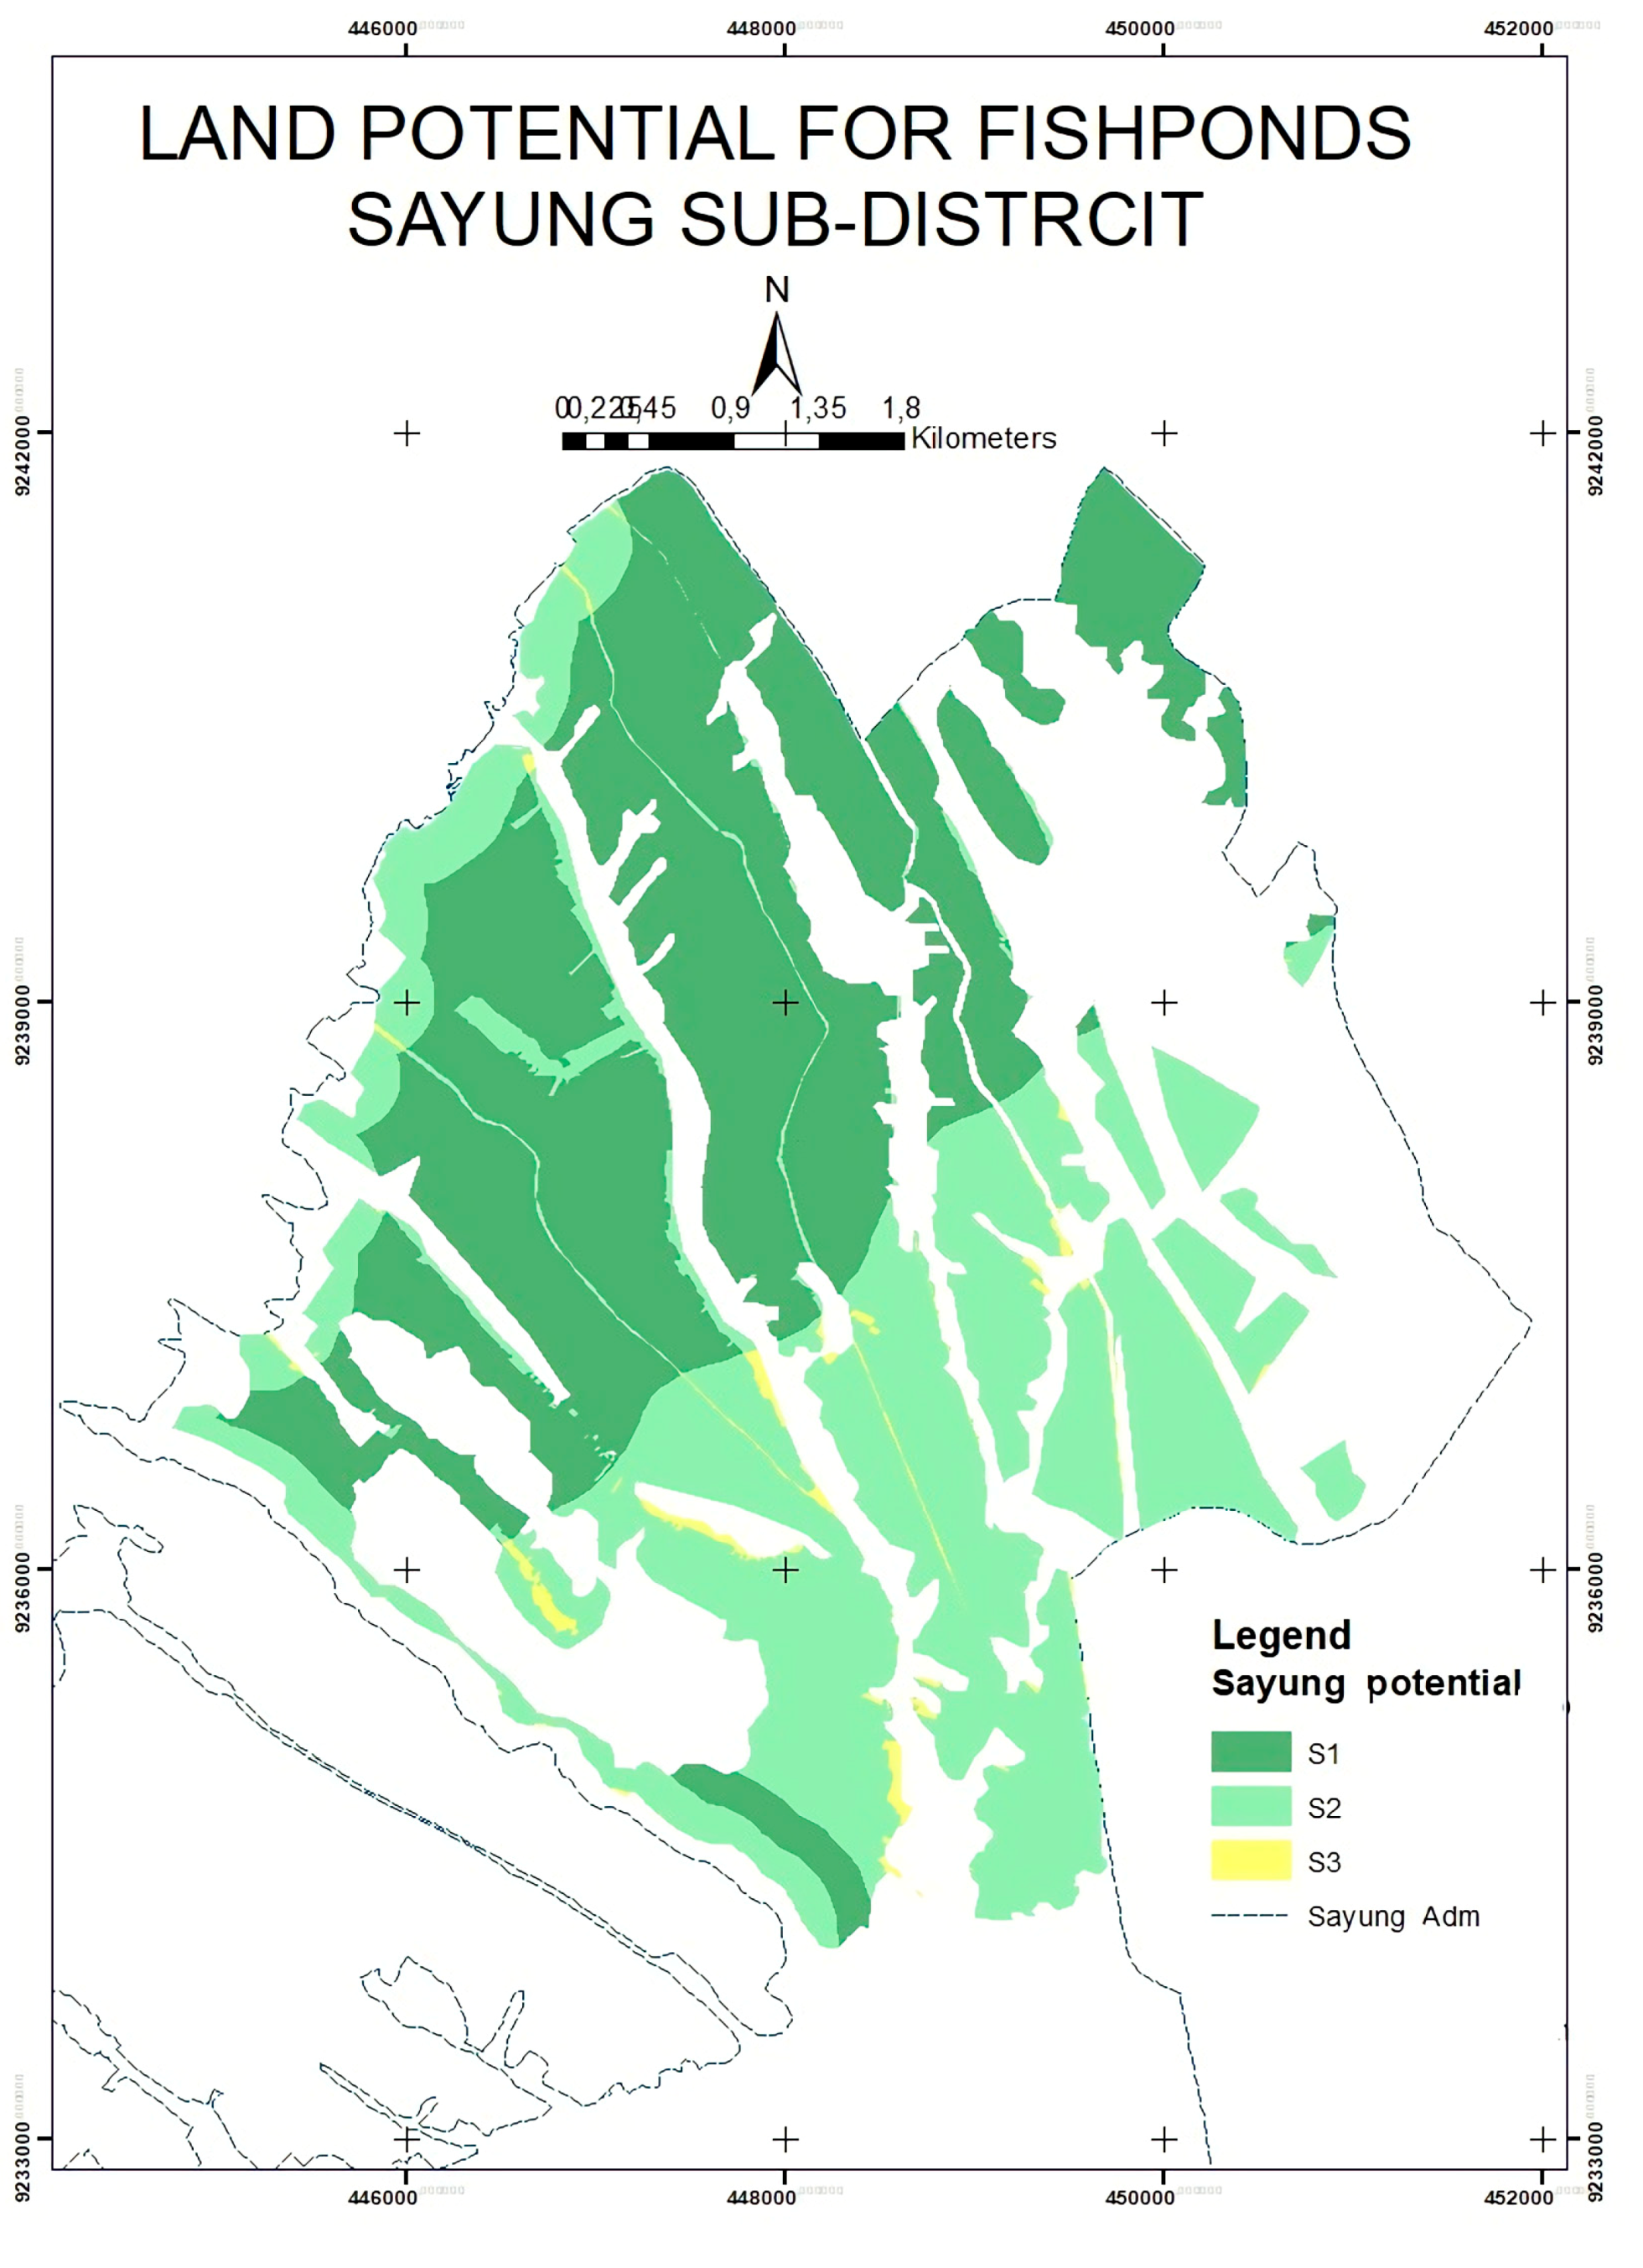
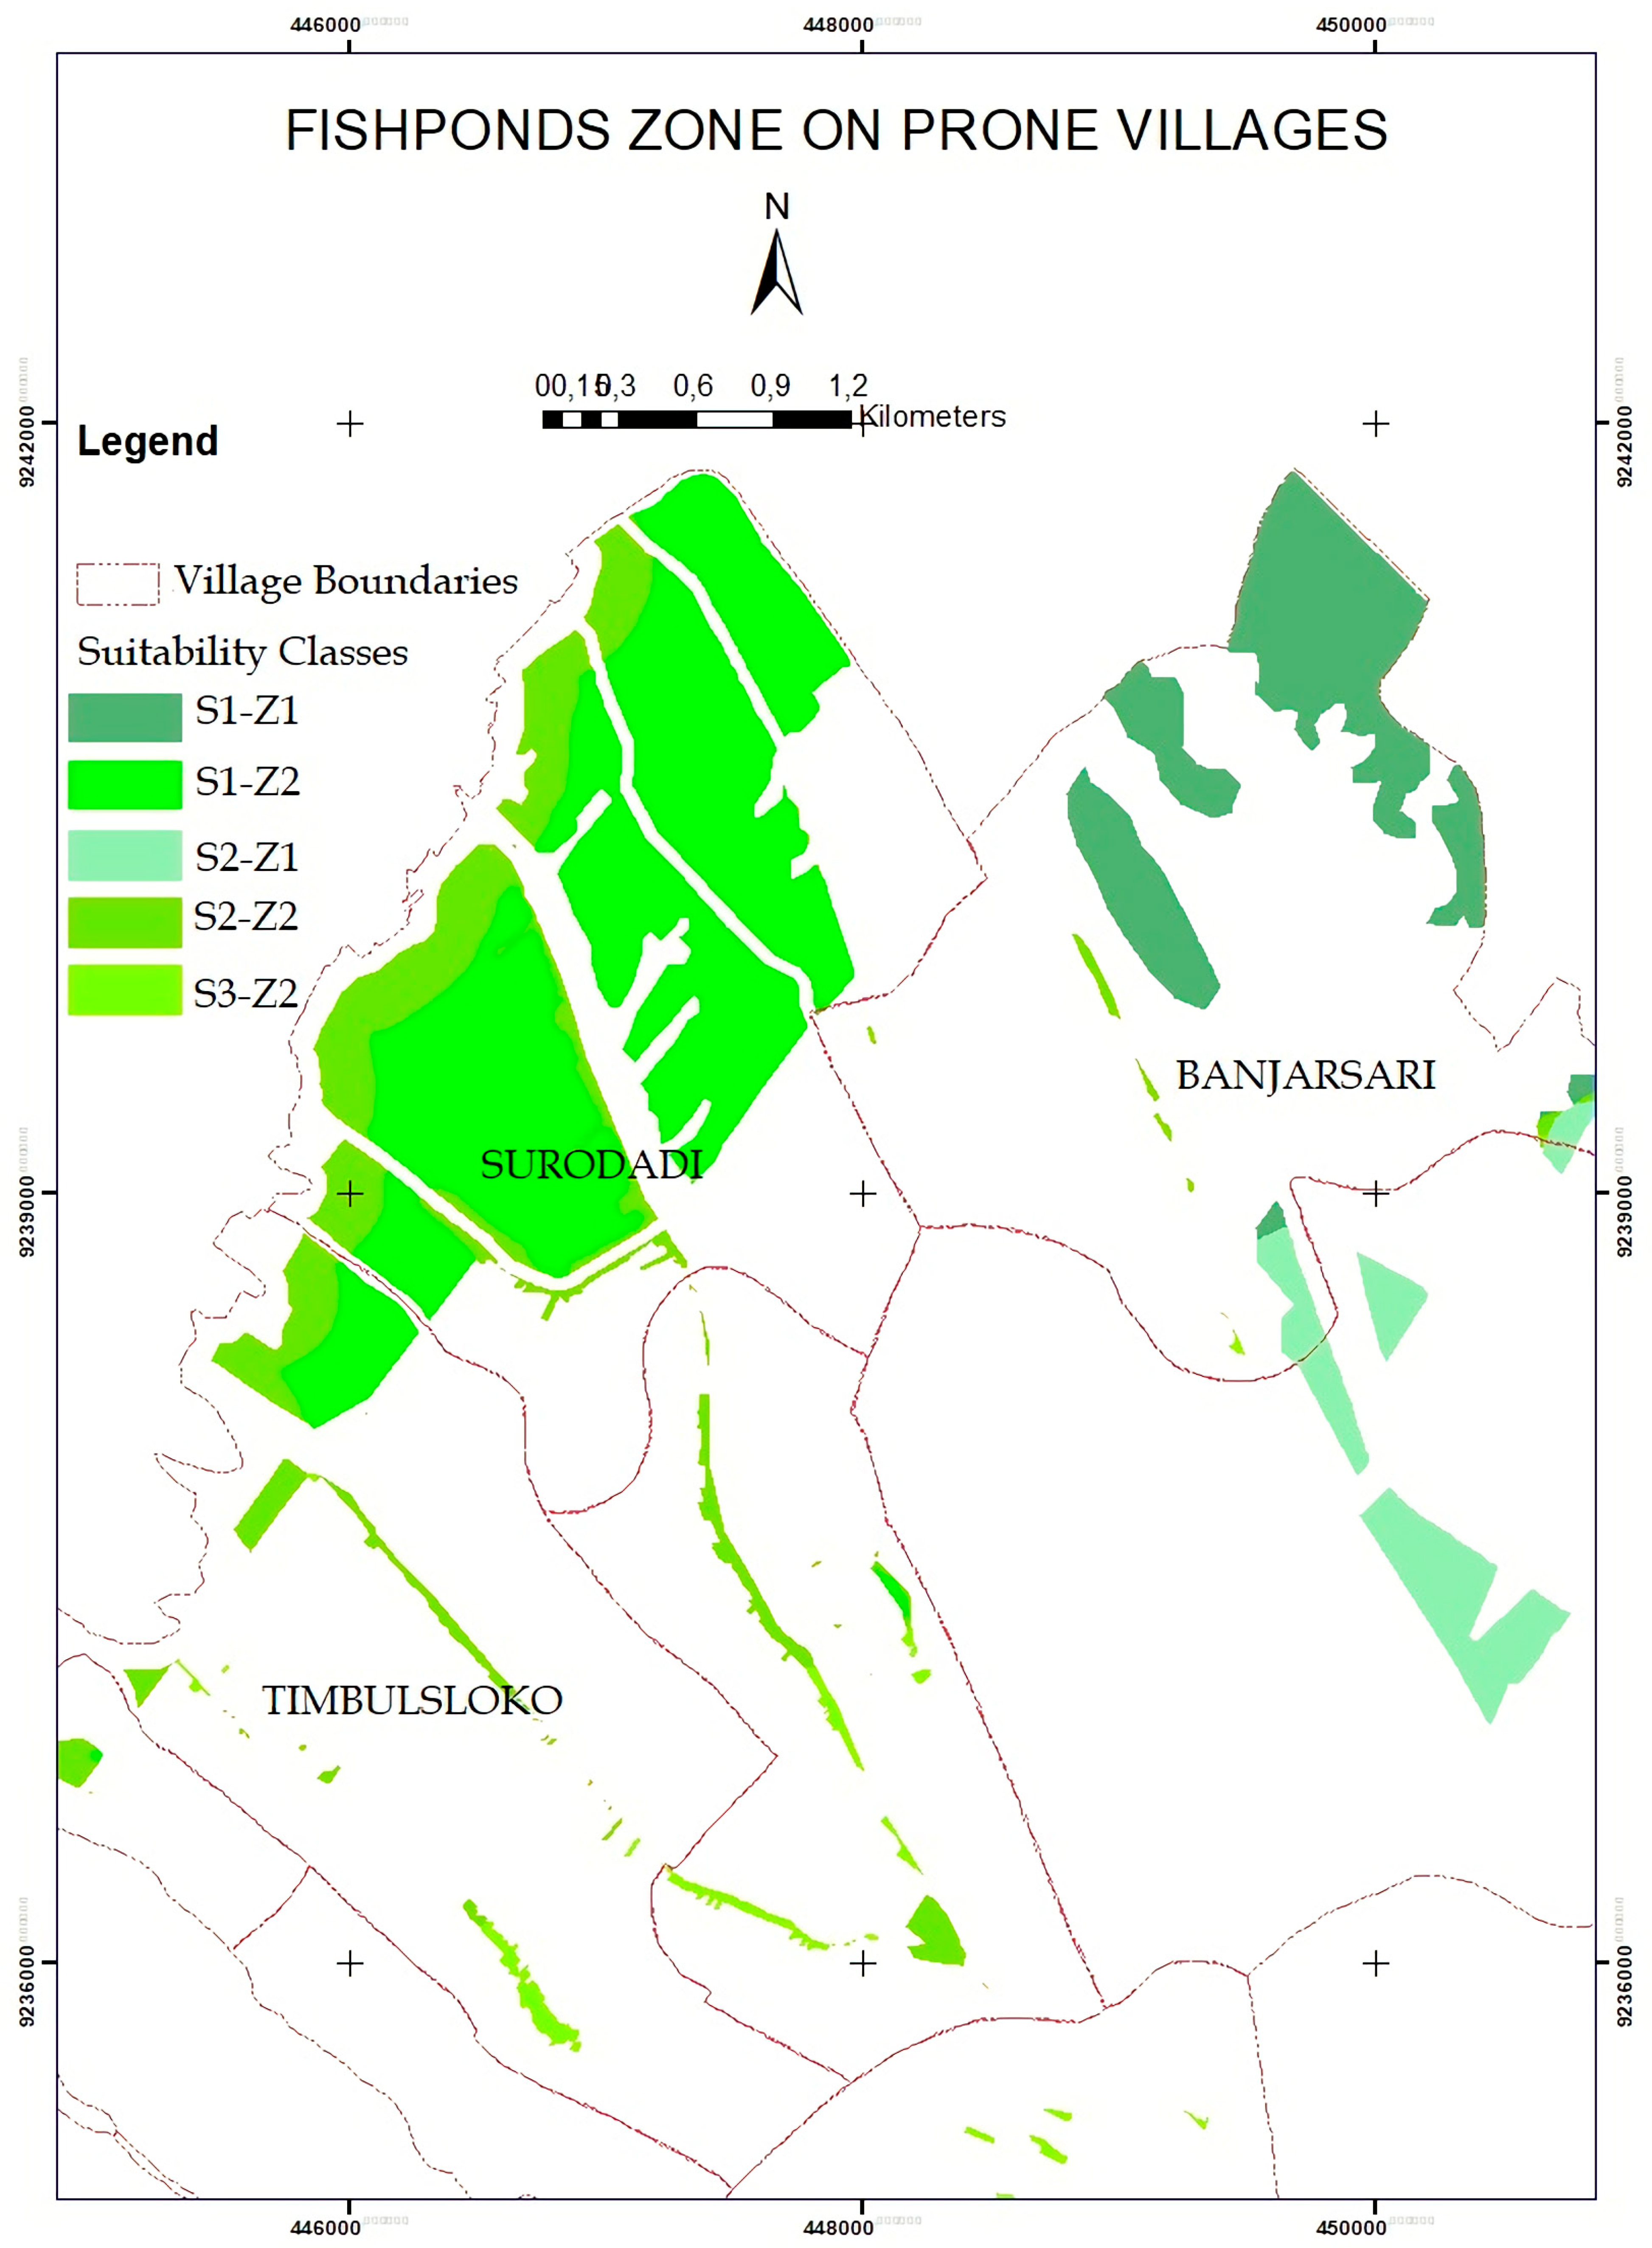
3.1. Fishpond Zone Determination

The result of GIS analysis for land suitability-based AHP showed that the fishpond culture zone could be classified into highly suitable (S1), moderately suitable (S2), marginally suitable (S3), and unsuitable (N) (Figure 4a). However, there were spatial differences in the distribution of pond culture when the assessment of the land systems was applied (Figure 4c). Each unit in the land system classified the landscape according to the principles of ecology, where it was assumed that there was a close relationship among the lithology, hydroclimate, landforms, soil, and organisms [41,47,48].
The Sayung subdistrict has three units of land systems: KJP intertidal plain, MKS fluvial plain, and MKS estuarine plain (Figure 4b). An assessment of the suitability of the land systems to be allocated as fishponds can be seen in Table 3.
It can be seen that, according to the parameters of a land system, the KJP land system is the most suitable for fishpond culture.
By considering the conditions of the ponds, the GIS analysis of the potential land for fishpond cultivation is shown in Figure 5. This potential fishpond planning was supported by the multiyear fishpond activities, whereby the livelihood of the local community depends on aquaculture land, which consists of 750 hectares and has produced milkfish and shrimp since 1995 [50].

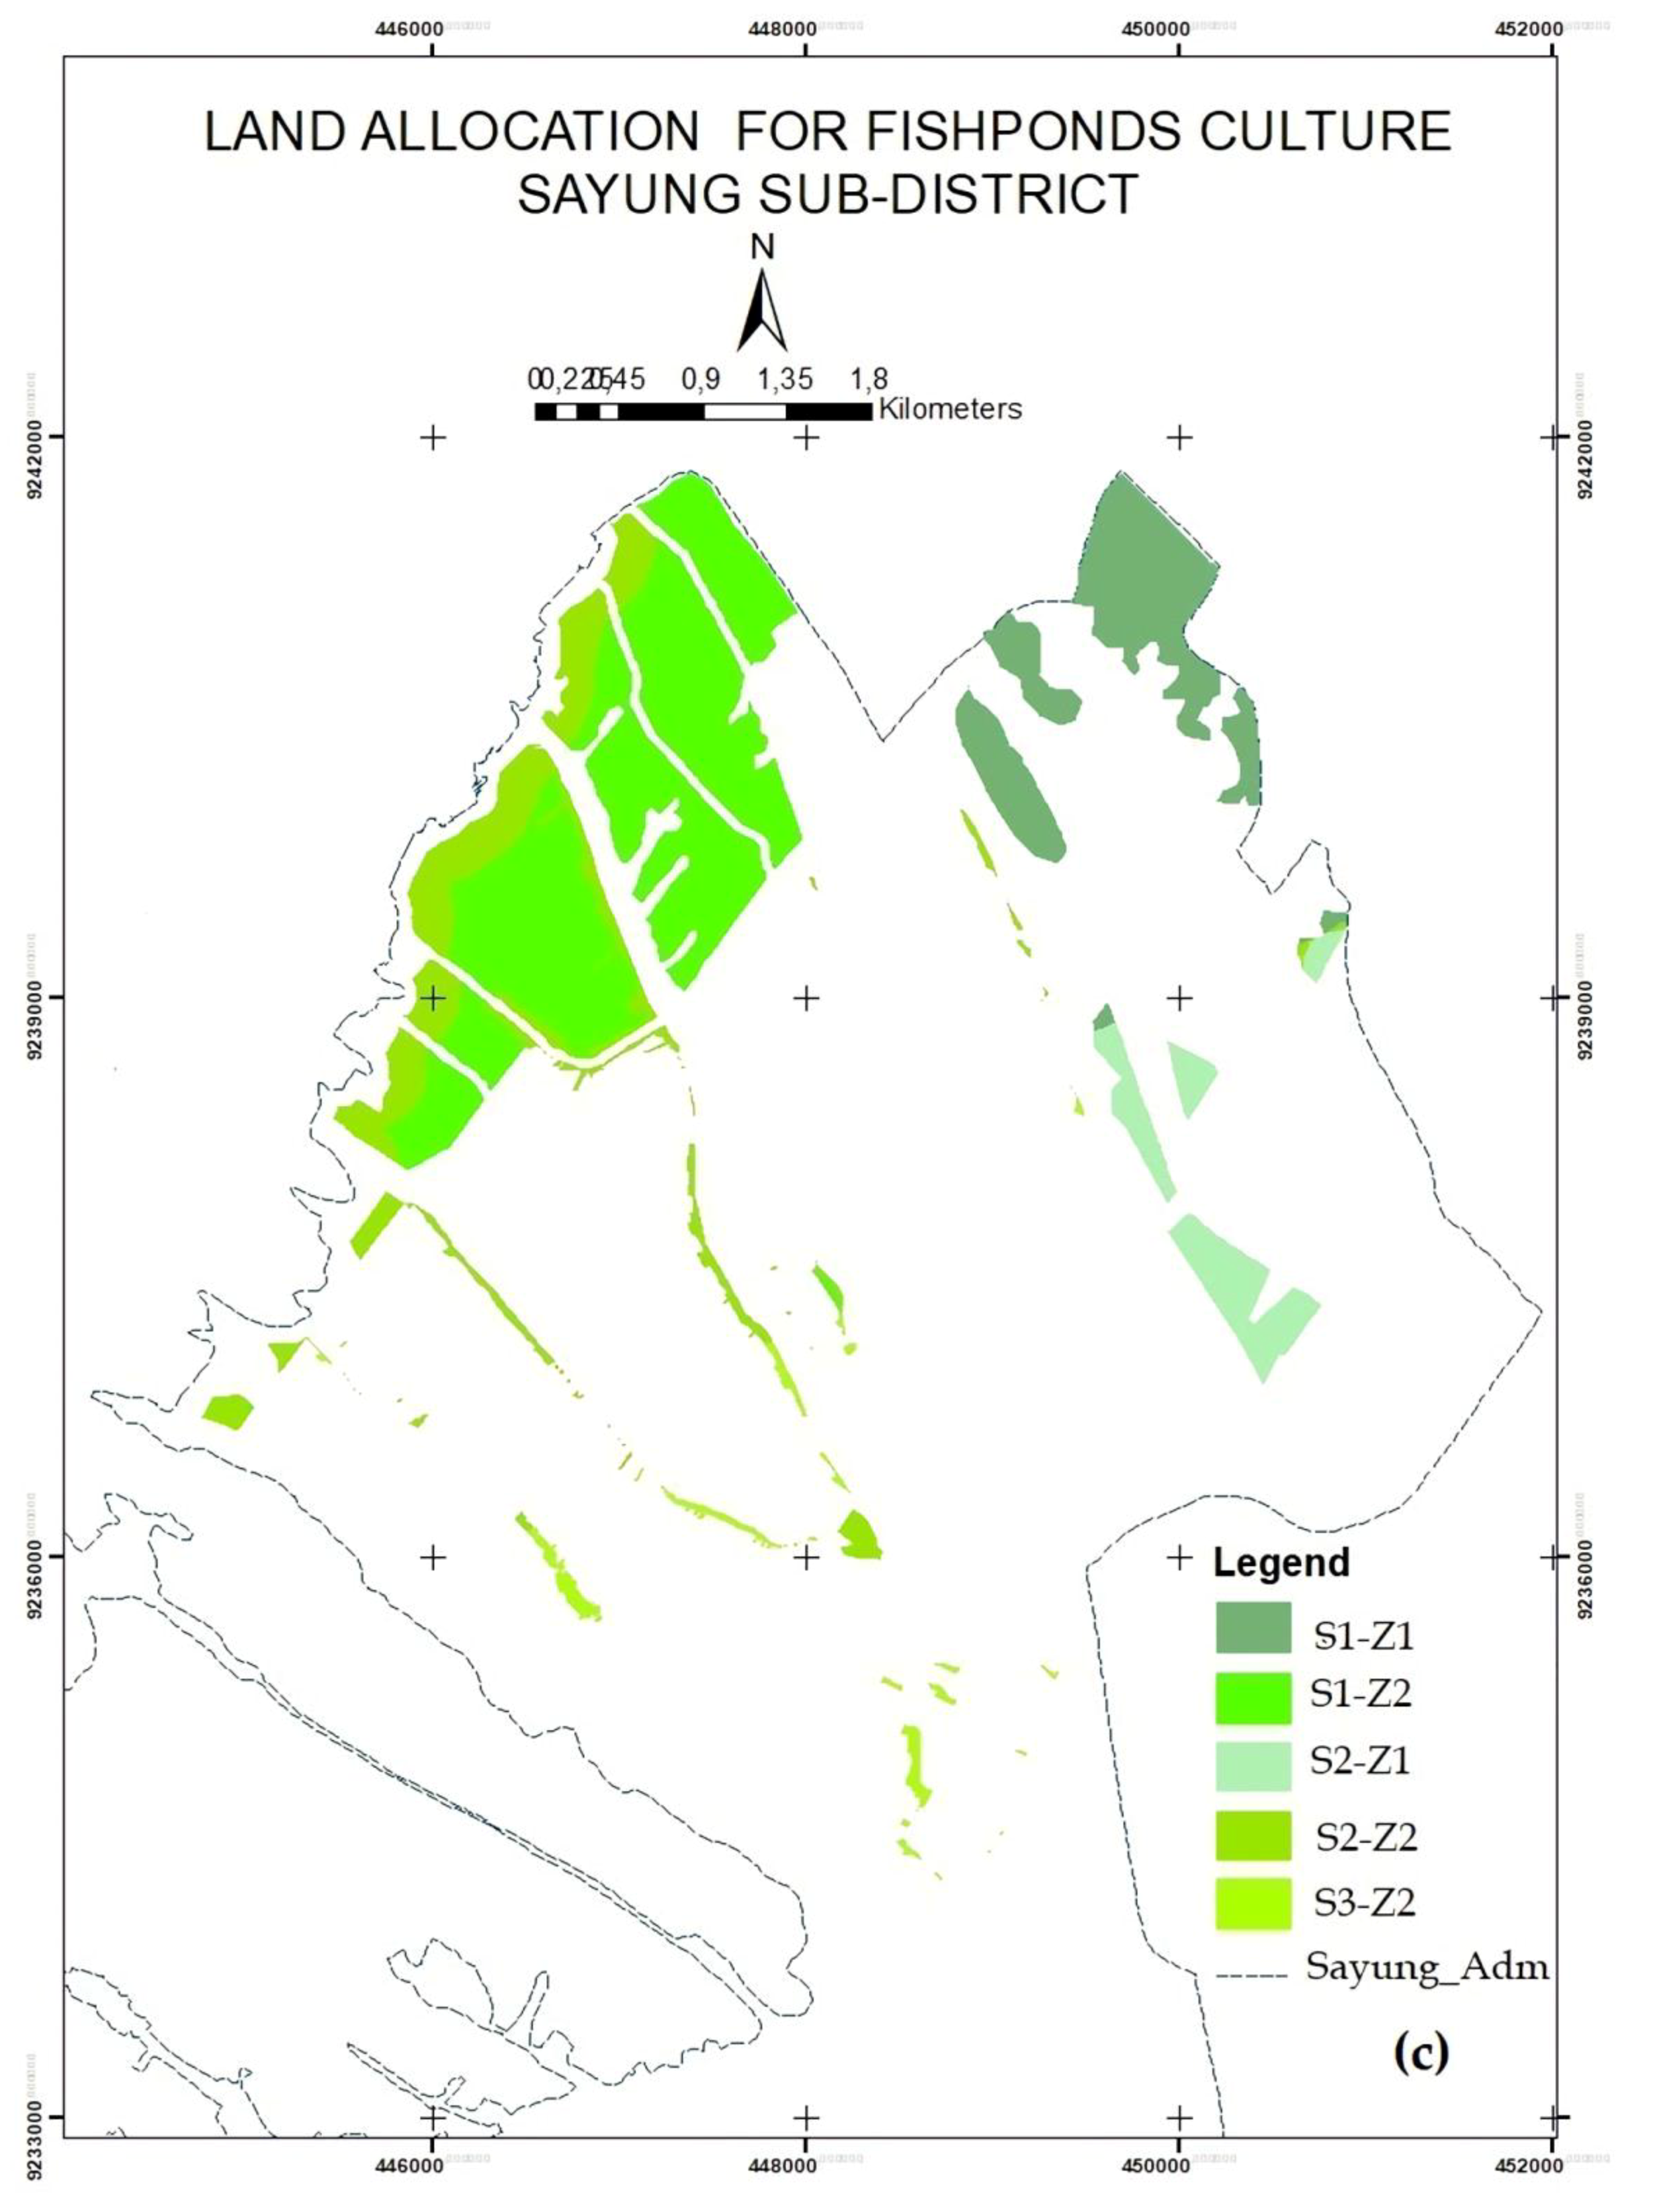
3.2. Fishpond Spatial Site Determination

Following the land potential analysis results, land availability (Figure 6a) and land allocation (Figure 6c) were spatially defined.
Land suitable for marine culture is not necessarily allocated for cultivation. Many requirements must be fulfilled so that fishpond culture activities can proceed, such as not being included in a protected area, having a clear status of land ownership, and being compliant with regional spatial-planning regulations (Figure 6b). The authors of [51] claimed that conservation areas are a key component in defining the allocation of coastal-space use to reduce the risk of adverse impacts of climate change. Indeed, in defining a spatial site allocation for marine culture, a collection of relevant information and a review of policy and legal frameworks will need to be undertaken [33], such as the regulation of spatial planning.
Figure 6. Fishpond spatial site allocation: (a) available land for fishponds; (b) regional spatial planning [52]; (c) land allocation for fishpond culture.
Ijgi 10 00176 g006aIjgi 10 00176 g006bIjgi 10 00176 g006c
The local government of Demak district issued regional regulation No. 1/2020 [52] concerning the spatial plan for Demak district, whereby the Sayung coastal area was planned to be developed into rural and urban settlements along with industrial and fishery culture zones (Figure 6b). This made the ponds’ possible spatial allocation site smaller than it would otherwise be. The most suitable spatial land allocation was in the fishery culture zone, whereas the highly suitable class (S1-Z1) dominated the analysis results (Table 4). Meanwhile, in the rural settlement zone, it is still possible to develop fishpond culture activities. Rural areas do not consist solely of settlements; there are also agricultural, fishery, and livestock activities which are the main source of livelihood for the rural population. The national law of villages, (Law No. 6 of 2014), as stated by [53], supports the idea that villages are the economic strength of rural areas, where the agricultural sector is the main pillar of social activities. In developing countries, the lives of rural people are very dependent on the natural resources available in their environment [54]. Thus, in rural areas that are at risk of coastal retreats and tidal floods, adaptation in aquaculture is required to improve the existing ecosystem. Maintaining some of the ecosystem services is a path toward sustainable coastal aquaculture [55].
Within the rural settlement zone, the highly suitable class (S2-Z2) dominated the spatial analysis results (Table 4).

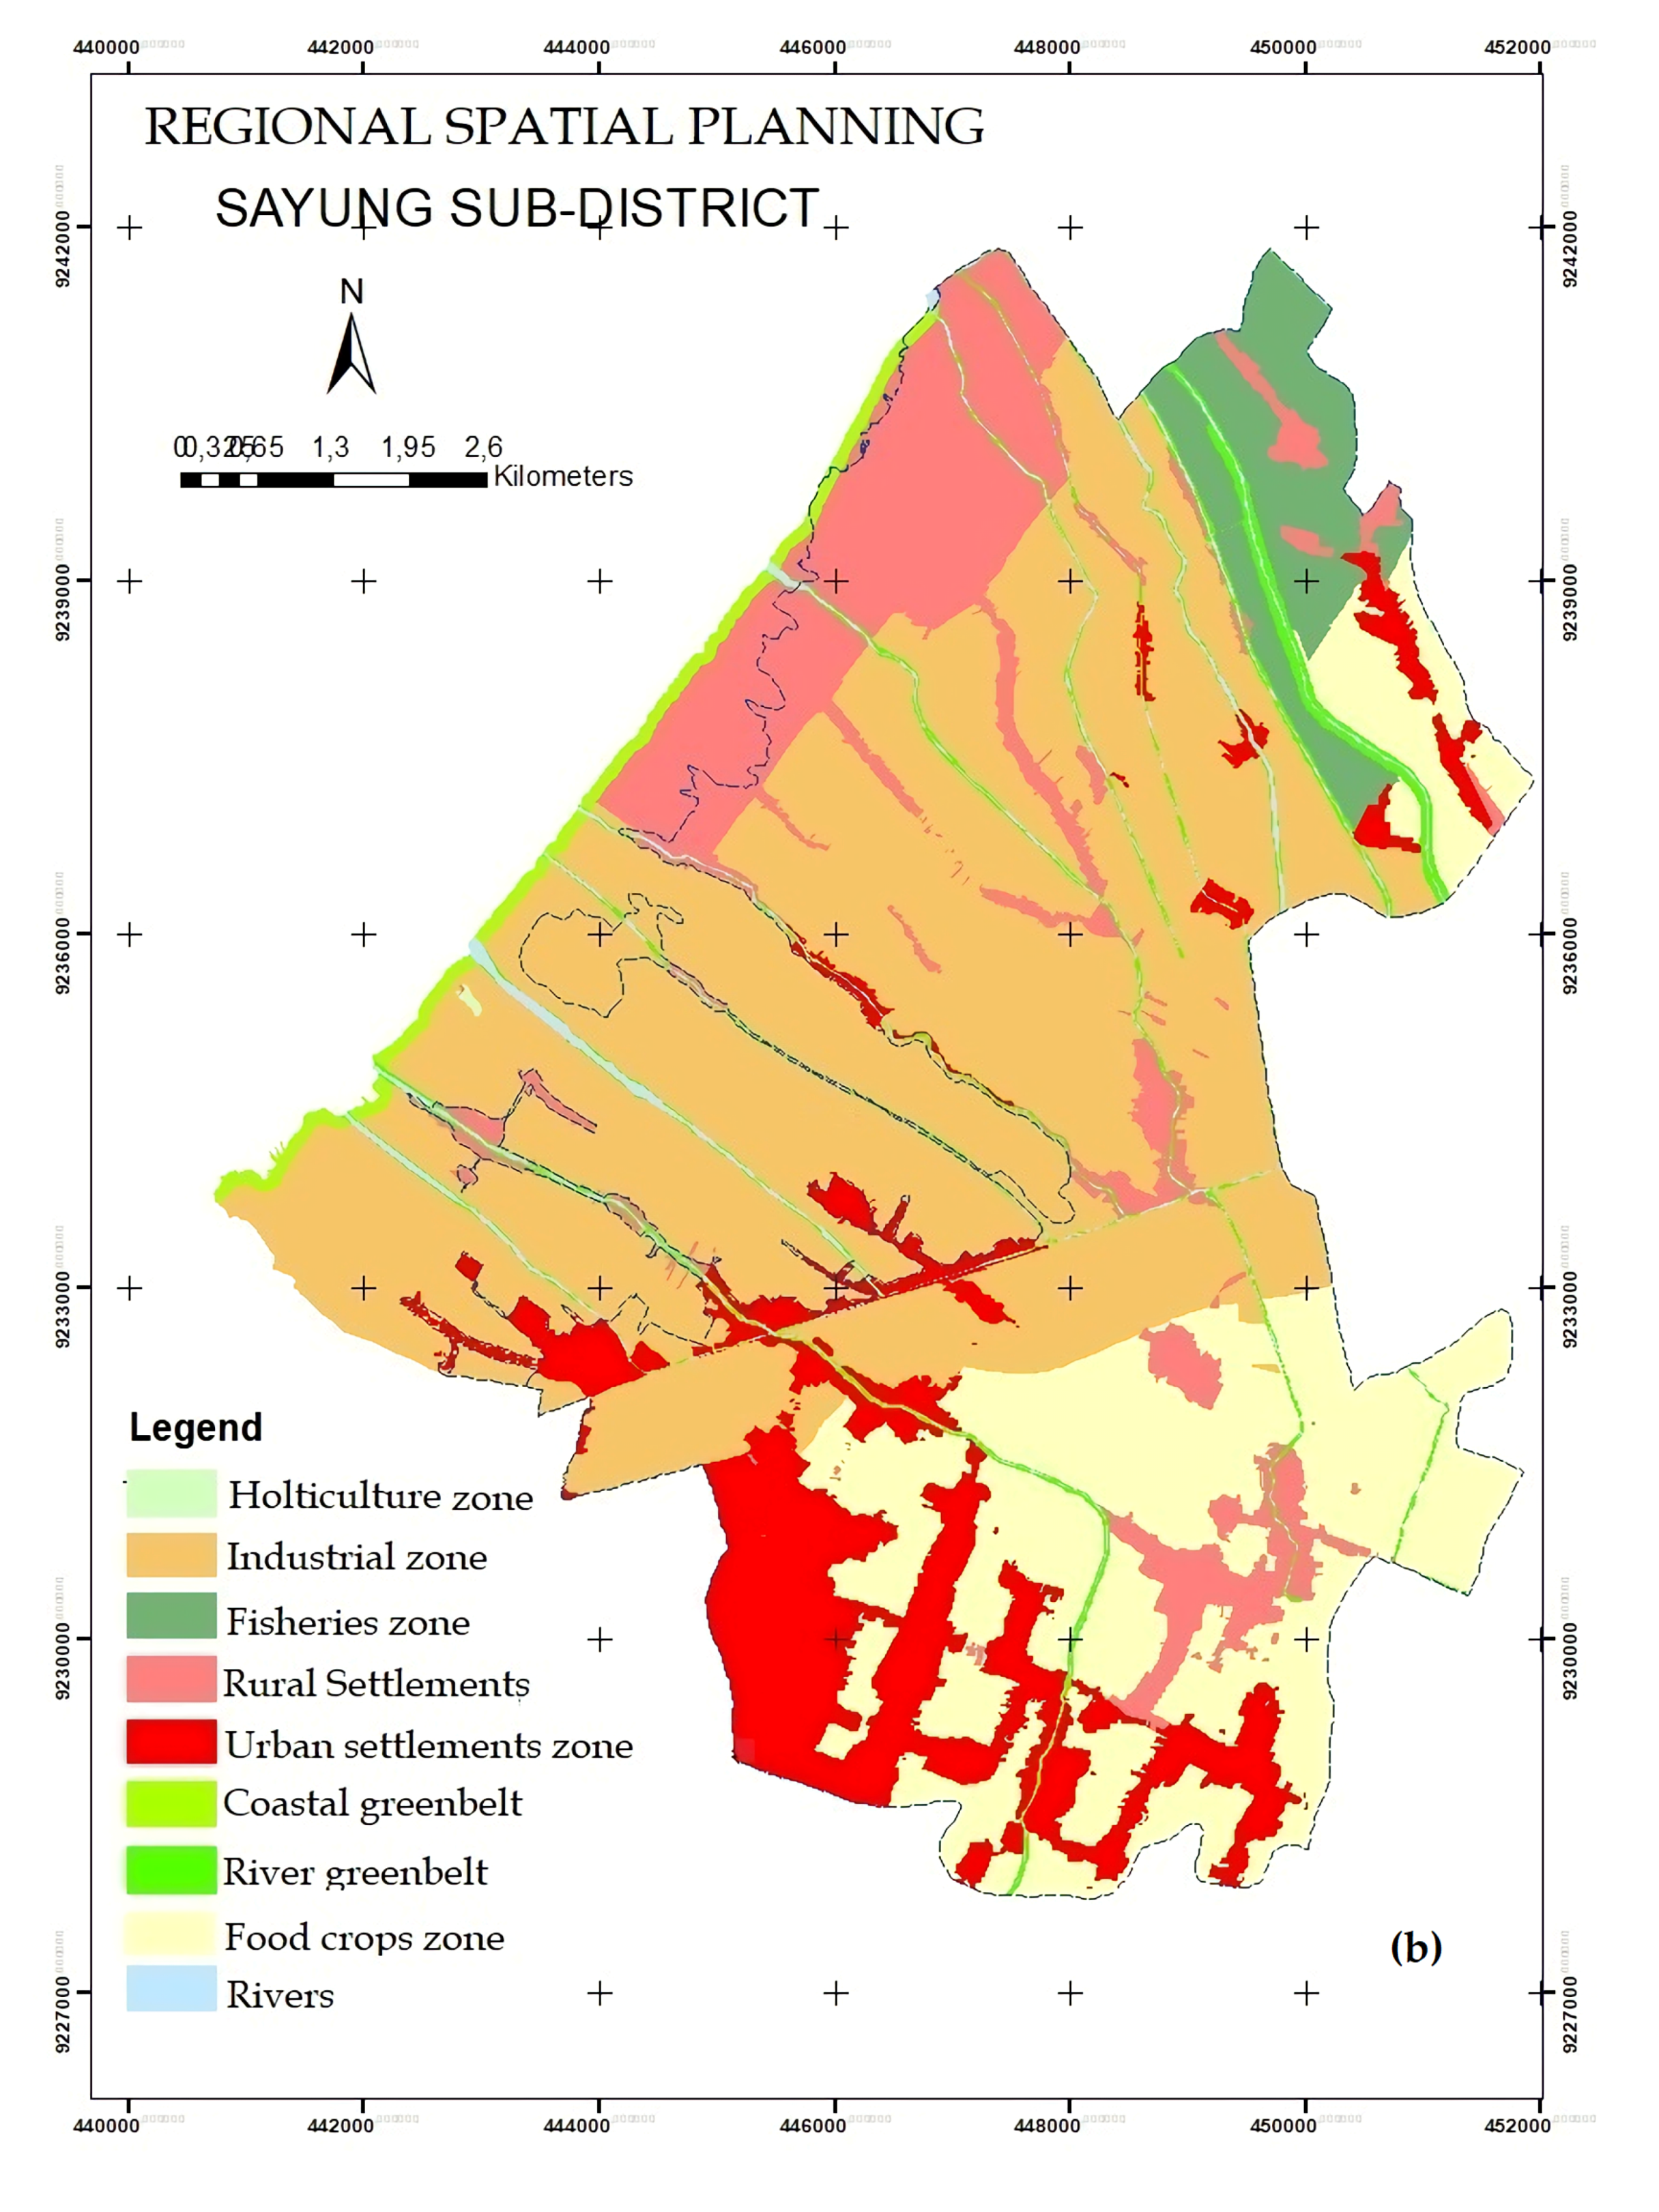
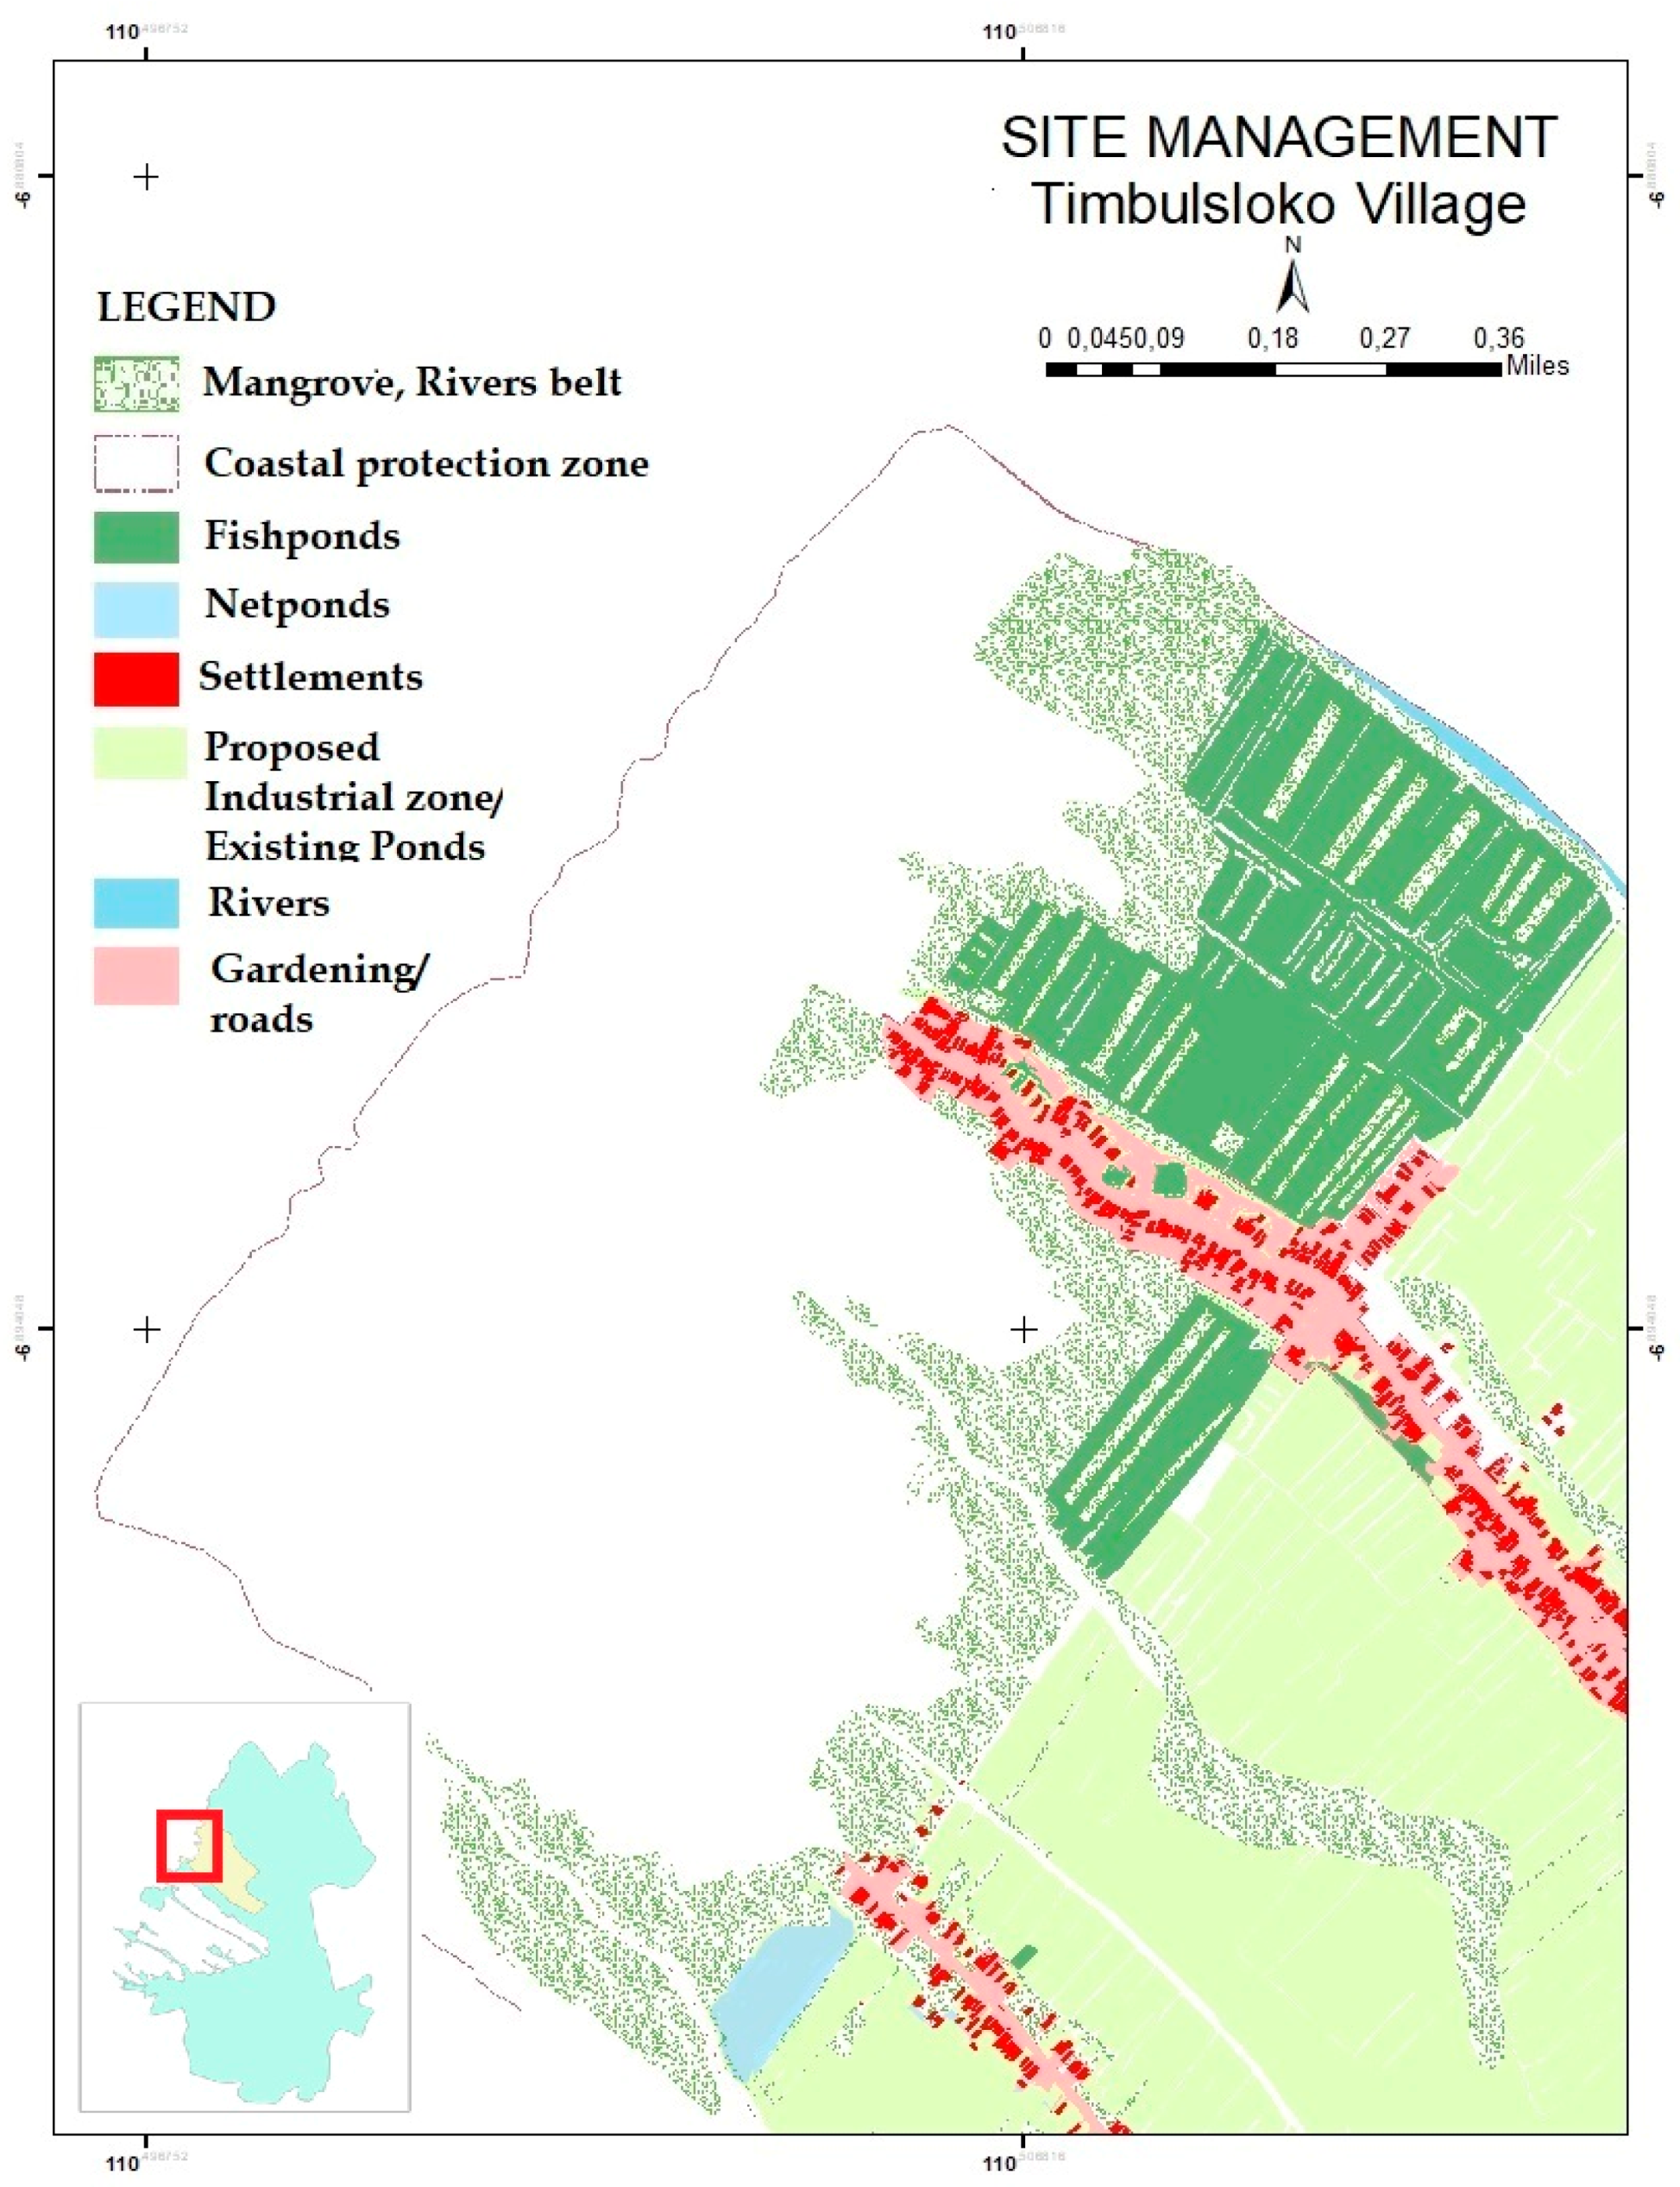
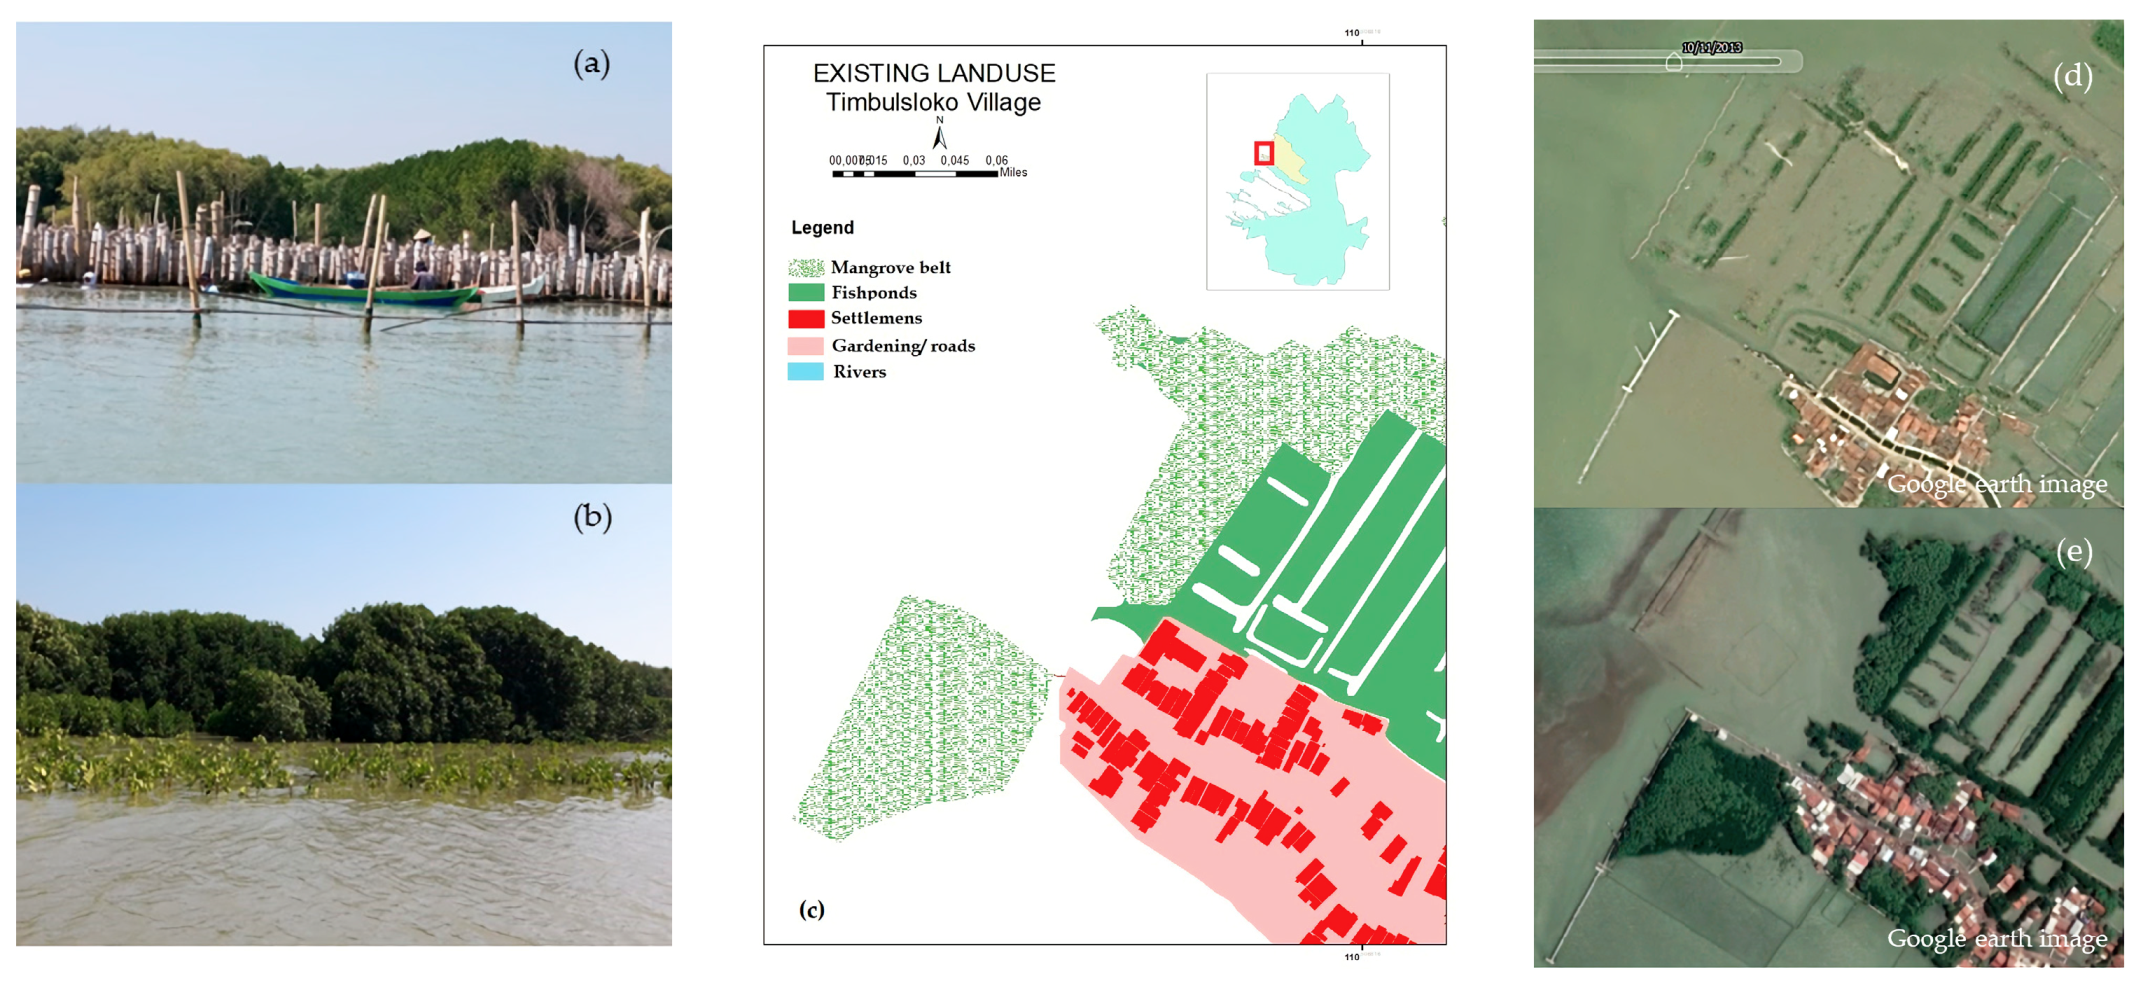
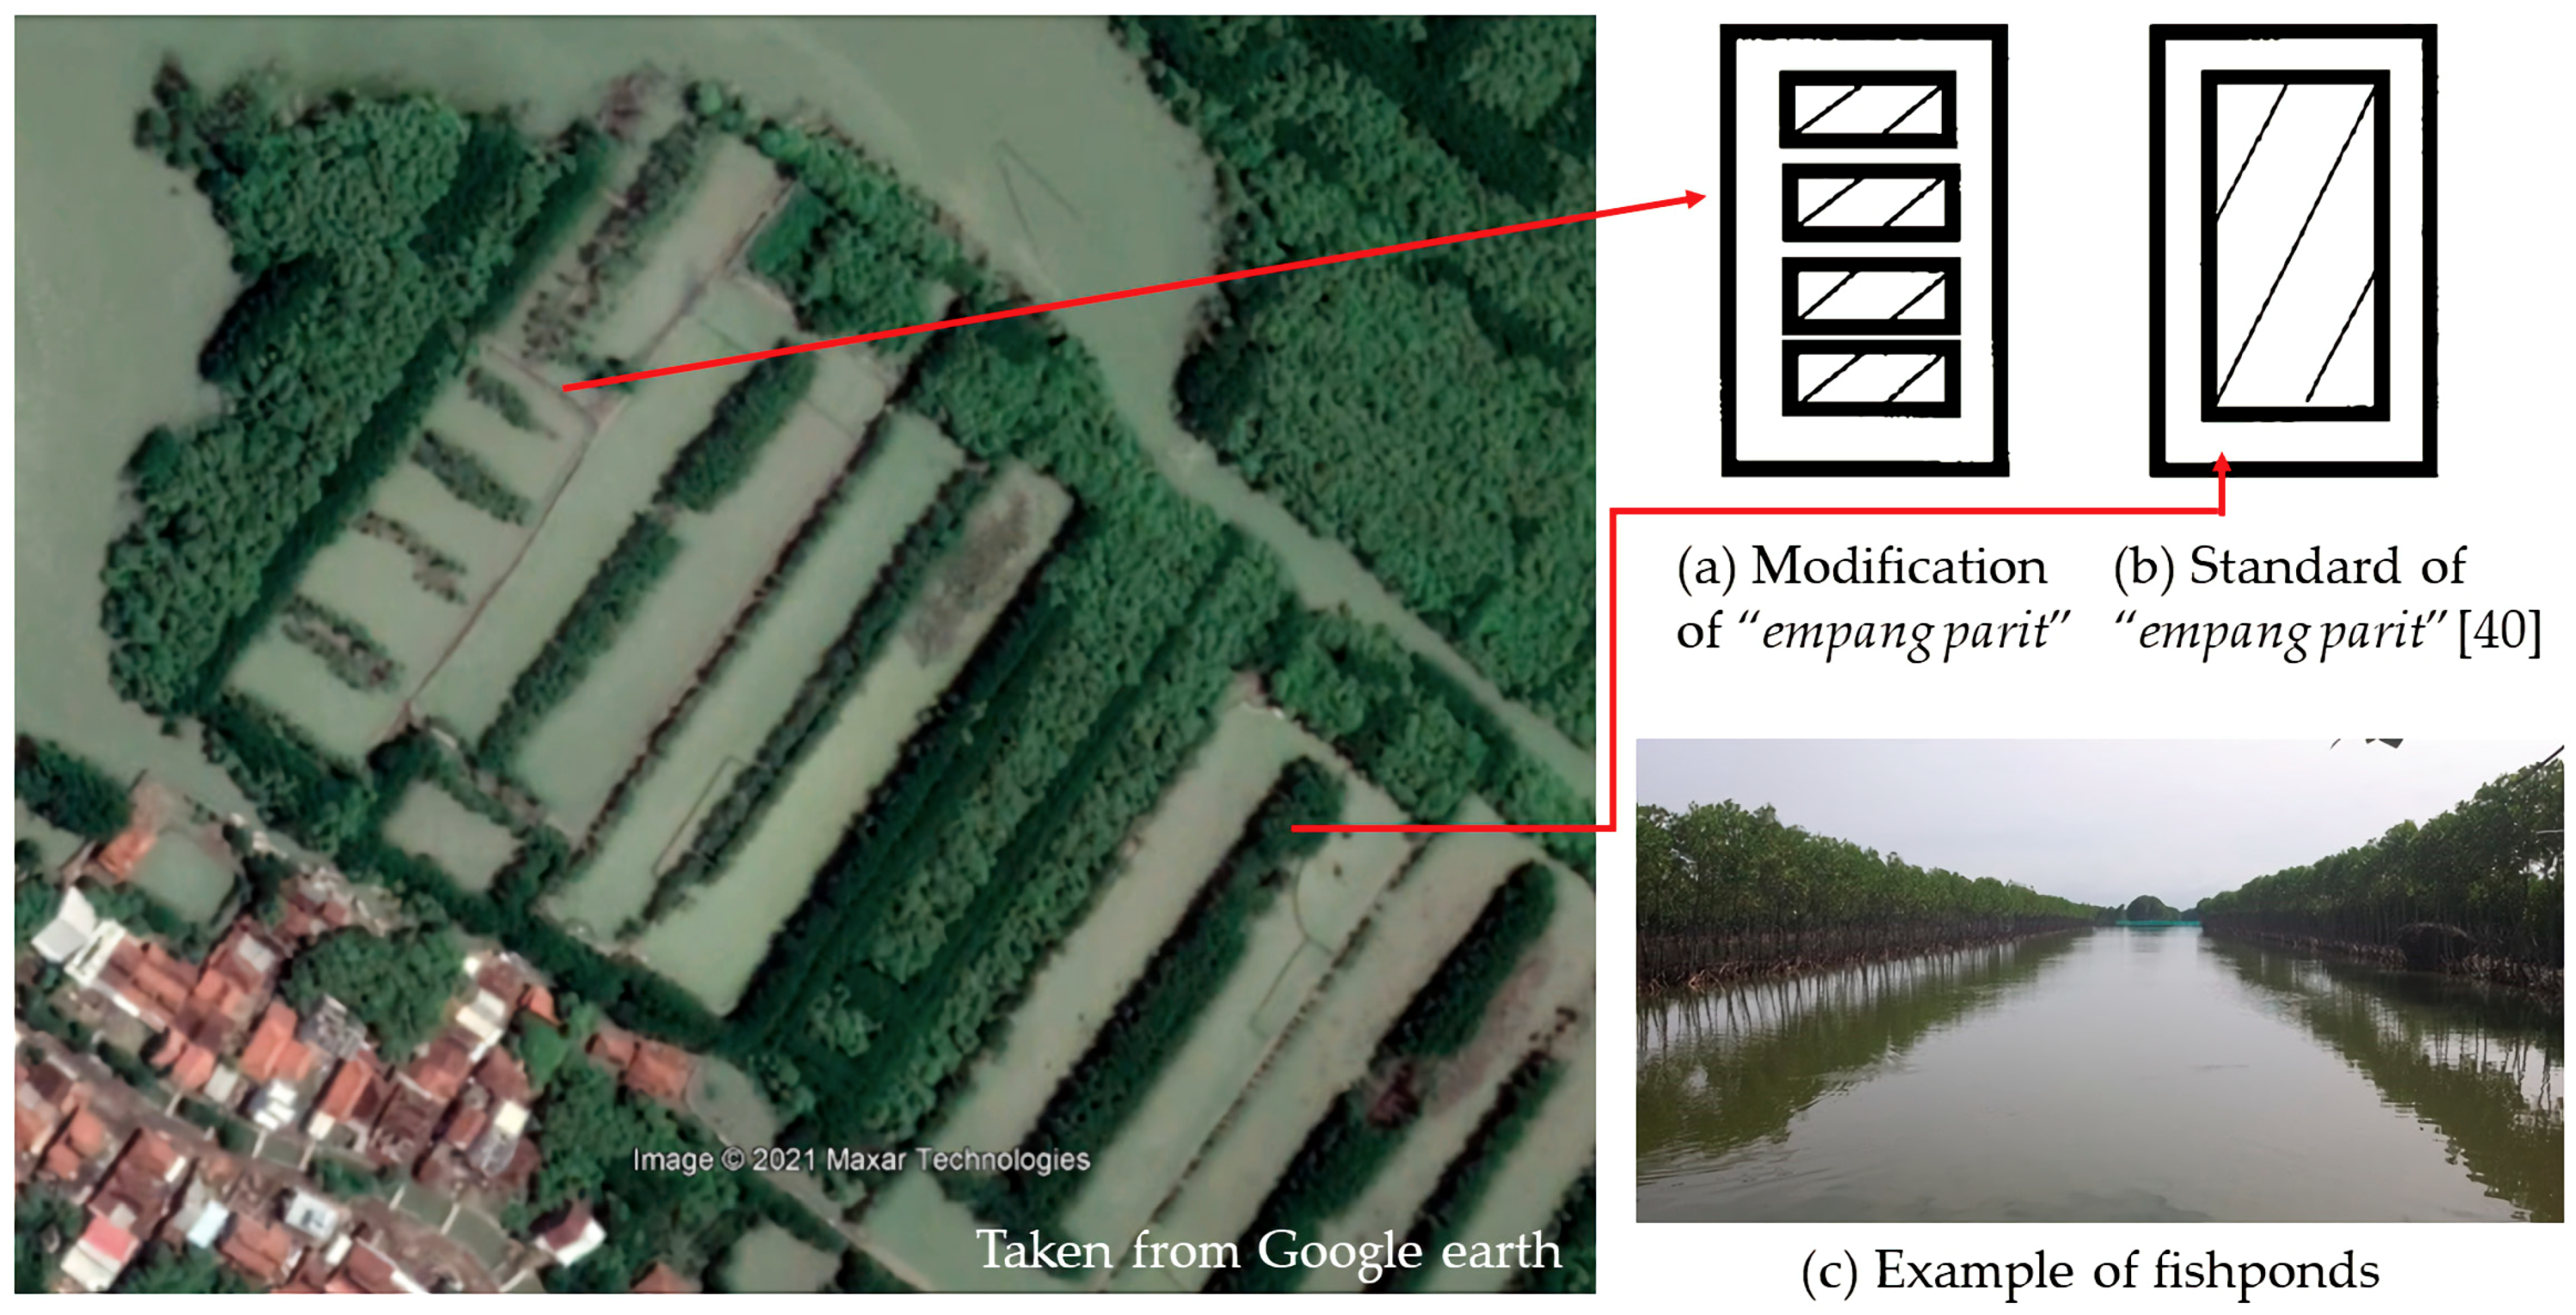
3.3. Fishpond Spatial Site Management

The results of the spatial site allocation for fishpond culture showed that only a small area of the three villages in the Sayung subdistrict could be further developed into fishpond areas, specifically, the area of the northern coasts of the Timbulsloko, Surodadi, and Banjarsari villages (Figure 7). For Banjarsari, the results of the spatial suitability analysis were consistent with the regional spatial plan, which designated it as a fishery culture zone, but not with Timbulsloko and Surodadi villages, which were designated to be rural settlements. Meanwhile, the southern region of the villages is more developed as agricultural land. It seems that the utilization of the area for agriculture by the local community needs to be considered in the spatial planning because it has become part of the local community’s sociocultural life. This is in line with [56], which stated that the ideals of rural development should include the empowerment of rural society, the protection of environmental quality, the conservation of local resources, the preservation of local cultural heritage, and the sustainable defence of agricultural land.
The problem with the above allocation is the degree to which the sustainability of cultivation activities can be achieved, due to the presence of a very intensive coastal retreat and the occurrence of daily tidal floods that have affected the region (Figure 2a,b). A coastal adaptation of detailed marine spatial planning has to be employed to mitigate this threat from the ocean [57]. A strategy for adaptation that would also manage the environment and aquaculture is needed. In this case, [11,13,58,59] suggested spatial-based ecosystem adaptation (SPBEA) as the solution for coastal management to face the threat of the ocean. The two villages bordering the sea, Timbulsloko and Surodadi, experienced a decline in the area of ponds due to exposure to tidal waves. The area of fishponds in Surodadi experienced a decrease of 28%, with a decrease of 70% in Timbulsloko [50]. For further analysis, the village of Timbulsloko, which has experienced the most severe abrasion, became the focus of the SPBEA assessment.

Site Management of Timbulsloko Village

As an area prone to coastal inundation, the SPBEA model of Timbulsloko has to consider the features of the protection zone, the coastal and river belt zone, the fishpond and net pond zone, and the settlement and its infrastructure zone in its detailed spatial analysis. These features were identified as the result of field observation, whereby the village can be spatially designed as a fishing village. In addition to being able to maintain the culture and lifestyle of coastal communities which are dependent on aquaculture, a rural fishing village can also be an attraction for ecotourism. The authors of [60,61] support the claim that fisheries and tourism create benefits for the local community because a fishing village has the potential to develop as a destination for marine tourism. Indeed, findings from [62] also support that fishing-based coastal village planning is a valid approach for strengthening the economy of coastal communities. The result of SPBEA analysis by using a visual interpretation of high-resolution images integrated with the detailed analysis of the spatial allocation can be seen in Figure 8.
Figure 8 illustrates the concept of SPBEA consisting of the following features: (a) the protection zone which considers the previous coastline as the boundary, (b) the mangrove belt area which, in the future, can be developed into a mangrove ecotourism area, (c) fishponds under the concept of silvofisheries, which can be designed either as a food stock or as an agri-tourism object, (d) the settlement areas, (e) net ponds, and (f) gardening areas that are consistent.
The coastal belt protection zone was predicted from visual interpretation of sedimentation and the existing hybrids within the coastline. Timbulsloko has implemented a conservation strategy for its coastal areas through a hybrid engineering method. Hybrid engineering combines technological and ecosystem-based solutions that use a permeable structure as a sediment trap, followed by mangrove planting once sedimentation begins to form [63] (Figure 9a,d). At some sites, this method has succeeded in forming new mangrove belts as a coastal protection ecosystem against the effects of abrasive tidal waves (Figure 9d). The use of mangrove belts is not the only method of coastal protection, however, and the fishpond activities of the local community should also follow an ecosystem-based approach which can be assessed and predicted visually in the image. Fishpond spatial-planning-based ecosystem adaptation is capable of maintaining the sustainability of ecosystems and environmental conservation, along with minimizing disputes between resource users [14]. Indeed, implementing fishpond spatial-planning-based ecosystem adaptations can assist decision-makers to address environmental impacts from a spatial perspective and can make planning decisions more transparent [64].
The most suitable fishpond management method for this purpose is the silvofishery method, as can be visually interpreted. The authors of [3] proved that the ecosystem adaptation of silvofisheries has succeeded in increasing not only the economic value of fish farms but also the value of the environment, through what is described as an economic–ecologic approach. In Timbulskolo, several pond farmers have begun putting this concept into practice, as seen in Figure 10.
In contrast to the SPBEA, there is an industrial area that has been planned in the regional spatial planning [52]. This area can be proposed for introducing ponds, since industrial activities may have an impact on the SPBEA of coastal rural areas.

3.4. What We Have Learnt about the SPBEA Analysis

Conceptually, the above results show how GIS analysis was used in the development of the SPBEA model. The design of the SPBEA concept was carried out hierarchically, starting from the determination of the zone, in this case, the fishpond culture zone, to the configuration of the site in the available and allocated zones, and then to a detailed SPBEA assessment within the site allocated for development (see Figure 3). This spatial analysis structure implements the concept proposed by [33] for the potential steps in spatial planning and management processes for inland aquaculture. In contrast to the many studies of spatial suitability analysis that are generally conducted based on AHP, the development of the SPBEA filters the results of the land assessment analysis using the land system data, which is defined by the basic characteristics of the land’s natural conditions. The input of the land system in the SPBEA analysis represents an improvement of the ecosystem approach, the characteristics of which can be derived from the land system spatial data. Aspects of restoring the natural conditions of the ecosystem can also be used for zoning by providing spatial information of conservation areas and greenbelts. The same is also done in a more detailed spatial arrangement of the site, where ecosystem components must also be part of the fishpond culture spatial zone. Therefore, the basic spatial data used for the SPBEA model have been fully acknowledged, including land system, land use, soil, slope, climate, water parameters, conservation zone, land ownership, and/or government spatial plans. Meanwhile, the features in SPBEA should at least include the protection zone, greenbelt, ponds, settlements, and infrastructure. This study has also shown that the SPBEA concept is a solution to climate change impacts, particularly in coastal areas.

4. Conclusions and Recommendations

This study conceptually defined the process of SPBEA analysis in a hierarchical manner, along with the spatial data needed. A spatial algorithm was also developed to support the SPBEA method. It seems that development of the spatial system needs to be carried out in the future to integrate the process, the data, and the algorithm as rules for shaping the SPBEA model. Thus, in the future, it can become the guideline for the implementation of SPBEA issues. Furthermore, site-based SPBEA arrangement requires input from the local community as a direct object of spatial planning. Therefore, a community-based SPBEA approach is needed, which is often a weakness in spatial planning practice, especially in developing countries. This is a realm of government policy, both local and central, that needs further consideration to achieve sustainable spatial planning and prosperous rural communities.

Author Contributions

The main contributor to this research article was Dewayany Sutrisno (conceptualization, method development, analysis, and original draft preparation) and Mulyanto Darmawan (analysis, data curation and original draft preparation). Other contributors include Ati Rahadiati (analysis, data curation), Muhammad Helmi and Armaiki Yusmur (data analysis), and Mazlan Hashim, Peter Tian-Yuan Shih, Rongjun Qin, and Li Zhang (reviewing and editing). All authors have read and agreed to the published version of the manuscript.

Funding

This research was funded by the Asia Pacific Network for Global Change Research (APN) (https://www.apn-gcr.org), grant number CBA2019-11SY-Sutrisno, supported in-kind by Geospatial Center for Excellent, Geospatial Information Agency/Badan informasi Geospasial (BIG), the Indonesian Society for Remote Sensing (MAPIN/ISRS), University technology Malaysia, Seameo Biotrop, China Academy of Sciences, Ohio state university, and National Yang Ming Chiao Tung University.

Institutional Review Board Statement

Not applicable.

Informed Consent Statement

Not applicable.

Data Availability Statement

Not applicable.

Acknowledgments

On this occasion, we would like to express our deepest gratitude to Mazlan bin Hashim from the Malaysia University of Technology, Peter Tian-yuan Shih from Yang-Ming Chiao Tung University-Taiwan, Rong-jun Qin from Ohio University, Zhang Li from China Academy of Sciences, and M. Helmi from Diponegoro University, who enriched our concepts through administrative and technical support and opportunities financed by their respective institutions. This article may be compiled as input for the implementation of an increase in human resource capacity.

Conflicts of Interest

The authors declare no conflict of interest.

References

  1. Spencer, T.; Brooks, S.M.; Evans, B.R.; Tempest, J.A.; Möller, I. Southern North Sea storm surge event of 5 December 2013: Water levels, waves and coastal impacts. Earth Sci. Rev. 2015, 146, 120–145. [Google Scholar] [CrossRef] [Green Version]
  2. Kausarian, H.; Batara, B.; Putra, D.B.E. The Phenomena of Flood Caused by the Seawater Tidal and its Solution for the Rapid-growth City: A case study in Dumai City, Riau Province, Indonesia. J. Geosci. Eng. Environ. Technol. 2018, 3, 39–46. [Google Scholar] [CrossRef] [Green Version]
  3. Sutrisno, D. Sea Level Rise and Its Impact on Rural Deltas: A Shoreline Retreat Approach; Lap Lambert Academic Publishing Company: Saarbrücken, Germany, 2013. [Google Scholar]
  4. Ezcurra, P.; Rivera-Collazo, I.C. An assessment of the impacts of climate change on Puerto Rico’s Cultural Heritage with a case study on sea-level rise. J. Cult. Herit. 2018, 32, 198–209. [Google Scholar] [CrossRef]
  5. Thiéblemont, R.; Le Cozannet, G.; Toimil, A.; Meyssignac, B.; Losada, I.J. Likely and High-End Impacts of Regional Sea-Level Rise on the Shoreline Change of European Sandy Coasts Under a High Greenhouse Gas Emissions Scenario. Water 2019, 11, 2607. [Google Scholar] [CrossRef] [Green Version]
  6. Gregory, J.M.; Griffies, S.M.; Hughes, C.W.; Lowe, J.A.; Church, J.A.; Fukimori, I.; Gomez, N.; Kopp, R.E.; Landerer, F.; Le Cozannet, G.; et al. Concepts and Terminology for Sea Level: Mean, Variability and Change, Both Local and Global. Surv. Geophys. 2019, 40, 1251–1289. [Google Scholar] [CrossRef] [Green Version]
  7. Bhadwal, S.; Cowie, A.; Delusca, K.; Flores-Renteria, D.; Hermans, K.; Jobbagy, E.; Kurz, W.; Li, D.; Sonwa, D.J.; Stringer, L. Chapter 4: Land degradation. In Climate Change and Land: An IPCC Special Report on Climate Change, Desertification, Land Deg-Radation, Sustainable Land Management, Food Security, and Greenhouse Gas Fluxes in Terrestrial Ecosystems; The Intergovernmental Panel on Climate Change (IPCC): Genève, Switzerland, 2019. [Google Scholar]
  8. Le Cozannet, G.; Garcin, M.; Yates, M.; Idier, D.; Meyssignac, B. Approaches to evaluate the recent impacts of sea-level rise on shoreline changes. Earth Sci. Rev. 2014, 138, 47–60. [Google Scholar] [CrossRef] [Green Version]
  9. Hassan, M.I.; Rahmat, N.H. The effect of coastline changes to local community’s social-economic. In Proceedings of the Interna-tional Conference on Geomatic and Geospatial Technology (GGT) 2016, The In-ternational Archives of the Photogrammetry, Remote Sensing and Spatial Information Sciences, Kuala Lumpur, Malaysia, 3–5 October 2016; Volume XLII-4/W1, pp. 25–35. [Google Scholar] [CrossRef] [Green Version]
  10. Dugan, J.; Airoldi, L.; Chapman, M.; Walker, S.; Schlacher, T. Estuarine and Coastal Structures. Treat. Estuar. Coast. Sci. 2011, 17–41. [Google Scholar] [CrossRef]
  11. Spalding, M.D.; Ruffo, S.; Lacambra, C.; Meliane, I.; Hale, L.Z.; Shepard, C.C.; Beck, M.W. The role of ecosystems in coastal protection: Adapting to climate change and coastal hazards. Ocean Coast. Manag. 2014, 90, 50–57. [Google Scholar] [CrossRef]
  12. Santos, C.F.; Domingos, T.; Ferreira, M.A.; Orbach, M.; De Andrade, F.P. How sustainable is sustainable marine spatial planning? Part I—Linking the concepts. Mar. Policy 2014, 49, 59–65. [Google Scholar] [CrossRef]
  13. Wamsler, C.; Niven, L.; Beery, T.H.; Bramryd, T.; Ekelund, N.; Jönsson, K.I.; Stålhammar, S. Operationalizing Ecosystem-Based Adaptation: Harnessing Ecosystem Services to Buffer Communities against Climate Change. Ecol. Soc. 2016, 21. [Google Scholar] [CrossRef] [Green Version]
  14. Triana, K.; Wahyudi, A.J. GIS Developments for Ecosystem-based Marine Spatial Planning and the Challenges Faced in Indonesia. ASEAN J. Sci. Technol. Dev. 2019, 36, 113–118. [Google Scholar] [CrossRef]
  15. Noble, M.M.; Harasti, D.; Pittock, J.; Doran, B. Linking the social to the ecological using GIS methods in marine spatial planning and management to support resilience: A review. Mar. Policy 2019, 108, 103657. [Google Scholar] [CrossRef]
  16. Gimpel, A.; Stelzenmüller, V.; Töpsch, S.; Galparsoro, I.; Gubbins, M.; Miller, D.; Murillas, A.; Murray, A.G.; Pınarbaşı, K.; Roca, G.; et al. A GIS-based tool for an integrated assessment of spatial planning trade-offs with aquaculture. Sci. Total Environ. 2018, 627, 1644–1655. [Google Scholar] [CrossRef] [PubMed]
  17. Yiannakou, A.; Salata, K.-D. Adaptation to Climate Change through Spatial Planning in Compact Urban Areas: A Case Study in the City of Thessaloniki. Sustain. J. Rec. 2017, 9, 271. [Google Scholar] [CrossRef] [Green Version]
  18. Sutrisno, D.; Gill, S.N.; Suseno, S. The development of spatial decision support system tool for marine spatial planning. Int. J. Digit. Earth 2017, 11, 863–879. [Google Scholar] [CrossRef]
  19. Pusat Penelitian dan Pengembangan Geologi. Peta Geologi Jawa Tengah; P3G: Bandung, Indonesia, 1995.
  20. Balai Besar Penelitian dan Pengembangan Sumber Daya Lahan Pertanian. Peta Tanah Demak, Sekala 1: 50.000; BBSDLP: Bogor, Indonesia, 2010.
  21. Utami, W.S.; Subardjo, P.; Helmi, M. Studi perubahan garis pantai akibat kenaikan muka air laut di Kecamatan Sayung, Kabupaten Demak. J. Oceanogr. 2017, 6, 281–287. [Google Scholar]
  22. Dewi, R.S.; Bijker, W. Dynamics of shoreline changes in the coastal region of Sayung, Indonesia. Egypt. J. Remote Sens. Space Sci. 2020, 23, 181–193. [Google Scholar] [CrossRef]
  23. Helmi, M.; Pribadi, R. Integrated Coastal Landscape Management: An Adaptation to Related Climate Change Impact Case Study: Sayung District, Demak, Central Java. In Proceedings of the Kick off Meetings Integrated Coastal Landscape Management: An Adaptation to Related Climate Change Impact, Semarang, Indonesia, 20 November 2019. [Google Scholar]
  24. Hidayat, T.A.; Helmi, M.; Widada, W.; Satriadi, A.; Setiyono, H.; Ismanto, A.; Yusuf, M. Pengolahan data satelit Sentinel-1 dan pasut untuk mengkaji area genangan akibat banjir pasang di Kecamatan Sayung, Kabupaten Demak. Indones. J. Oceanogr. 2020, 2, 1–7. [Google Scholar]
  25. Andreas, H.; Abidin, H.Z.; Sarsito, D.A.; Pradipta, D. Insight Analysis on Dyke Protection Against Land Subsidence and The Sea Level Rise Around Northern Coast of Java (Pantura) Indonesia. J. Geomat. Plan. 2018, 5, 101–114. [Google Scholar] [CrossRef]
  26. World Map. Available online: http://sahimiqm.blogspot.com/2017/01/peta-dunia-kosong.html (accessed on 13 August 2020).
  27. Peta NKRI. Peta Propinsi Jawa Tengah. Available online: https://tanahair.indonesia.go.id/portal-web/download/perwilayah (accessed on 28 December 2020).
  28. Badan Informasi Geospasial. Topographic Maps of Sayung and Weung, Sheet Scale 1: 25.000. BIG. 2013. Available online: https://portal.ina-sdi.or.id/downloadaoi/ (accessed on 15 January 2020).
  29. Badan Informasi Geospasial. Peta Penutup Lahan Demak, Skala 1: 50.000; BIG: Cibinong, Indonesia, 2016.
  30. Marfai, M.A. Preliminary Assessment of coastal erosion and local community adaptation in Sayung Coastal Area, Central Java-Indonesia. Quaest. Geogr. 2012, 31, 47–55. [Google Scholar] [CrossRef]
  31. Badan Informasi Geospasial. Peta Land System; BIG: Cibinong, Indonesia, 2017.
  32. Kementerian Lingkungan Hidup dan Kehutanan. Rencana Teknik Rehabilitasi Hutan dan Lahan Daerah Aliran Sungai (rtk-rhldas) Tahun 2014–2029 Wilayah BPDAS Mahakam Berau; RTkRHL-DAS Wilayah BPDAS Mahakam Berau Tahun 2014–2029; KLHK: Berau, Indonesia, 2014.
  33. Manjarrez, J.A.; Soto, D.; Brummett, R. Aquaculture Zoning, Site Selection and Area Management under the Ecosystem Approach to Aquaculture: A Handbook; Food and Agriculture Organization of The United Nations/The World Bank: Rome, Italy, 2017. [Google Scholar]
  34. Francisco, H.R.; Corrêia, A.F.; Feiden, A. Classification of Areas Suitable for Fish Farming Using Geotechnology and Multi-Criteria Analysis. ISPRS Int. J. Geo-Inf. 2019, 8, 394. [Google Scholar] [CrossRef] [Green Version]
  35. Yunis, C.R.C.; López, R.S.; Cruz, S.M.O.; Castillo, E.B.; López, J.O.S.; Trigoso, D.I.; Briceño, N.B.R.; López, S.; Manuel, S. Land Suitability for Sustainable Aquaculture of Rainbow Trout (Oncorhynchus mykiss) in Molinopampa (Peru) Based on RS, GIS, and AHP. ISPRS Int. J. Geo-Inf. 2020, 9, 28. [Google Scholar] [CrossRef] [Green Version]
  36. Sutrisno, D.; Rahadiati, A.; Rudiastuti, A.W.; Dewi, R.S. Munawaroh Urban Coastal Flood-Prone Mapping under the Combined Impact of Tidal Wave and Heavy Rainfall: A Proposal to the Existing National Standard. ISPRS Int. J. Geo-Inf. 2020, 9, 525. [Google Scholar] [CrossRef]
  37. Liu, F.; Zou, S.-C.; Li, Q. Deriving priorities from pairwise comparison matrices with a novel consistency index. Appl. Math. Comput. 2020, 374, 125059. [Google Scholar] [CrossRef]
  38. Assefa, W.W.; Abebe, W.B. GIS modeling of potentially suitable sites for aquaculture development in the Lake Tana basin, Northwest Ethiopia. Agric. Food Secur. 2018, 7, 72. [Google Scholar] [CrossRef] [Green Version]
  39. Sutrisno, D. The Development of Marine Spatial Planning and Its Application for Floating Fish Net Culture. J. Geomat. Plan. 2017, 4, 41. [Google Scholar] [CrossRef] [Green Version]
  40. McKenzie, N.J.; Grundy, M.J.; Webster, R. Guidelines for Surveying Soil and Land Resources; CSIRO Publishing: Victoria, Australia, 2008; 557p. [Google Scholar]
  41. Poniman, A.; Nurwadjedi; Lumban-Tobing, P. Developing the national land resource database for supporting spatial land use planning. In Proceedings of the 3rd FIG Regional Conference, Jakarta, Indonesia, 3–7 October 2004. [Google Scholar]
  42. Marjenah, M.; Ariyanto, A. Suitability of some species for intercropped with tropical almond (Terminalia Catappa Linn.) on some land system in East Kalimantan and its prospects as plantation forest. J. Penelit. Ekosistem Dipterokarpa 2018, 4, 57–70. [Google Scholar]
  43. He, M.; Cliquet, A. Challenges for Protected Areas Management in China. Sustain. J. Rec. 2020, 12, 5879. [Google Scholar] [CrossRef]
  44. Habiba, U.; Shaw, R. Improvement of responses and recovery approaches for cyclone hazards in coastal Bangladesh. Sci. Technol. Disaster Risk Reduct. Asia 2018, 409–430. [Google Scholar] [CrossRef]
  45. FitzGerald, W.J. Chapter 8: Silvofiheries: Integrated mangrove forest aquaculture systems. In Ecological Aquaculture: The Evolution of the Blue Revolution; Costa-Pierce, B.A., Ed.; Blackwell Publishing, Ltd.: Oxford, UK, 2002; ISBN 0-632-04961-8. [Google Scholar]
  46. Takashima, F. Silvofishery: An aquaculture system harmonized with the environment. In Proceedings of the Workshop on Mangrove-Friendly Aquaculture Organized by the SEAFDEC Aquaculture Department, Iloilo City, Philippines, 11–15 January 1999; Southeast Asian Fisheries Development Center, Aquaculture Department: Tigbauan, Philippines; Iloilo, Philippines, 2000; pp. 13–19. [Google Scholar]
  47. Nurwadjedi. Klasifikasi bentuklahan semi detil (skala 1: 50.000/1: 25.000. Hasil pengembangan Peta REPPPROT skala 1:250.000. Globe 2000, 2, 72–83. [Google Scholar]
  48. Suharta, N. Sistem lahan Barongtongkok di Kalimantan: Potensi, kendala, dan pengembangannya untuk pertanian lahan kering. J. Litbang Pertan. 2007, 26, 1–8. [Google Scholar]
  49. Onrizal, O.; Kusmana, C. Ecological study on mangrove forest in East Coast of North Sumatra. Biodivers. J. Biol. Divers. 2008, 9, 25–29. [Google Scholar] [CrossRef]
  50. Ismail, C.S.; Singka, C.; Hariyanto, H.; Suharini, E. Pengaruh abrasi terhadap tingkat pendapatan petani tambak di Kecamatan Sayung Kabupaten Demak. Geo Image 2012, 1, 58–61. [Google Scholar]
  51. Kirkman, S.P.; Holness, S.; Harris, L.R.; Sink, K.J.; Lombard, A.T.; Kainge, P.; Majiedt, P.; Nsiangango, S.E.; Nsingi, K.K.; Samaai, T. Using Systematic Conservation Planning to support Marine Spatial Planning and achieve marine protection targets in the transboundary Benguela Ecosystem. Ocean Coast. Manag. 2019, 168, 117–129. [Google Scholar] [CrossRef]
  52. Lembaran Daerah Kabupaten Demak Tahun 2020 Nomor 1. Peraturan daerah Kabupaten Demak nomor 1 tahun 2020 Tentang Perubahan Atas Peraturan Daerah Kabupaten Demak Nomor 6 Tahun 2011 Tentang Rencana tata Ruang Wilayah Kabupaten Demak Tahun 2011–2031; Pemda Kabupaten Demak: Demak, Indoensia, 2000.
  53. Sulistyawan, B.S.; Verweij, P.A.; Boot, R.G.; Purwanti, B.; Rumbiak, W.; Wattimena, M.C.; Rahawarin, P.; Adzan, G. Integrating participatory GIS into spatial planning regulation: The case of Merauke District, Papua, Indonesia. Int. J. Commons 2018, 12, 25–59. [Google Scholar] [CrossRef] [Green Version]
  54. Rahman, H.T.; Hickey, G.M. An Analytical Framework for Assessing Context-Specific Rural Livelihood Vulnerability. Sustain. J. Rec. 2020, 12, 5654. [Google Scholar] [CrossRef]
  55. Akber, A.; Aziz, A.A.; Lovelock, C. Major drivers of coastal aquaculture expansion in Southeast Asia. Ocean Coast. Manag. 2020, 198, 105364. [Google Scholar] [CrossRef]
  56. Akbar, A.A.S.; Pratiwi, O.C.; Nurprojo, I.S.; Firdaus, S. The search for a common livelihood space between rural and industrial areas. Masy. Kebud. Polit. 2020, 33, 87–100. [Google Scholar] [CrossRef]
  57. Maragno, D.; Dall’Omo, C.F.; Pozzer, G.; Bassan, N.; Musco, F. Land–Sea Interaction: Integrating Climate Adaptation Planning and Maritime Spatial Planning in the North Adriatic Basin. Sustain. J. Rec. 2020, 12, 5319. [Google Scholar] [CrossRef]
  58. Katsanevakis, S.; Stelzenmüller, V.; South, A.; Sørensen, T.K.; Jones, P.J.; Kerr, S.; Badalamenti, F.; Anagnostou, C.; Breen, P.; Chust, G.; et al. Ecosystem-based marine spatial management: Review of concepts, policies, tools, and critical issues. Ocean Coast. Manag. 2011, 54, 807–820. [Google Scholar] [CrossRef] [Green Version]
  59. Taufani, A.; Pardo, M.D.L.; Wesenbeeck, B.V. Ecosystem-Based Adaptation at Scale through Building with Nature: Towards Resilient Coasts in Indonesia. Report; 1220476-000-ZKS-0006, 28 August 2018, final; Deltares: Delft, The Netherland.
  60. González, R.C.L.; Antelo, M.D.L.; Ángeles, P. Fishing Tourism as an Opportunity for Sustainable Rural Development—The Case of Galicia, Spain. Land 2020, 9, 437. [Google Scholar] [CrossRef]
  61. Marpaung, B.O. Communication Strategy Planning of Fisherman Kampung Medan Belawan as a Tourist Destination. Procedia Soc. Behav. Sci. 2016, 234, 344–352. [Google Scholar] [CrossRef] [Green Version]
  62. Rudianto, R.; Yanuhar, U. Coastal rural development planning: Fishery management. Wacana 2018, 21, 211–215. [Google Scholar]
  63. Winterwerp, H.; van Wesenbeeck, B.; van Dalfsen, J.; Tonneijck, F.; Astra, A.; Verschure, S.; van Eijk, P. A Sustainable Solution for Massive Coastal Erosion in Central JAVA: Towards Regional Scale Application of Hybrid Engineering ~Discussion Paper; Deltares: Delft, The Netherland, 2014. [Google Scholar]
  64. Hammar, L.; Molander, S.; Pålsson, J.; Crona, J.S.; Carneiro, G.; Johansson, T.; Hume, D.; Kågesten, G.; Mattsson, D.; Törnqvist, O.; et al. Cumulative impact assessment for ecosys-tem-based marine spatial planning. Sci. Total Environ. 2020, 734, 139024. [Google Scholar] [CrossRef] [PubMed]
Figure 2. (a) Illustration of shoreline retreat area in the Sayung subdistrict (blue), overlaid on an image from Landsat 8 Oli on 29 July 2020 and [28]; (b) water detection of Sayung subdistrict based on normalized difference water index (NDWI) according to an image from Landsat 8 Oli 29 July 2020, which may correlate with the inundation problems.
Ijgi 10 00176 g002
Figure 3. The steps of spatial-planning-based ecosystem adaptation (SPBEA) model development.
Ijgi 10 00176 g003
Figure 4. Fishpond zoning: (a) suitability zone based on AHP analysis; (b) land system map of Sayung subdistrict [31]; (c) land suitability based on land system and AHP suitability analysis.
Ijgi 10 00176 g004
Figure 5. Land potential for fishpond culture.
Ijgi 10 00176 g005
Figure 7. Administrative boundaries of fishpond zone. Zoning can be found in the three villages of Timbulsloko, Surodadi, and Banjarsari.
Ijgi 10 00176 g007
Figure 8. Site-planning management of SPBEA.
Ijgi 10 00176 g008
Figure 9. An example of how the cultivation of the fishponds can be implemented with environmental adaptation: (a,d) the hybrid engineering technique, developed as trap sediments; (b) mangrove belt development as a protection zone for fishpond culture and rural community activities; (c) spatial illustration of Timbulsloko in applying hybrid technology and silvofisheries; (e) how the mangrove belt and silvofisheries have been developed.
Ijgi 10 00176 g009
Figure 10. Silvofishery practices in Timbulsloko, which can be categorized as (a) modification of empang sari type and (b) empang sari standard, while (c) fishpond example in the study area.
Ijgi 10 00176 g010
Table 1. Analytical hierarchy process (AHP) judgment matrix and consistency ratio assessment.
DCDRLUSoSlpHSaPriority
DC1.02.02.02.02.03.03.01.8
DR0.51.02.02.02.03.03.01.4
LU0.50.51.02.02.03.03.01.2
So0.50.50.51.02.03.03.01.0
Sl0.50.50.50.51.03.03.00.8
pH0.30.30.30.30.31.02.00.5
Sa0.30.30.30.30.30.51.00.4
λ7.398
Consistency Index (CI)0.066
RI1.32
Consistency Ratio (CR)0.050
Note: DC = distance to coastline, DR= distance to rivers, LU = land use, So = soil, Sl = slope, Sa = salinity.
Table 2. Suitability matrices for fishpond culture.
ParametersW Suitability Classification (Weight Scoring)Ref
S1S2S3N
ClassSClassSClassSClassS
Environment
DC (m)1.8300–5004>500, <40003100–3002<100, >40001[1]
DR (m)1.4<5004500–1000 31000–1500 2>15001[3]
LU1.2Pd, WL 4SF, O, RF 3MO, CL 2St, GY, Ind, Rv 1[1]
Soil1.0Alluvial4Entisol3Inceptisol2Ultisol1[1]
Slope (%)0.8≤24>2, ≤53>5, ≤102>101[2]
Water quality
pH0.56.5–8.5 45.5–6.5, 8.5–9.5 34.0–5.5; 9.5–0.5 2<4.0, >10.5 1[1]
Salinity (‰) 0.415–25 425–30 35–15, 30–35 2<5, >35 1[1]
Note: DC = distance to coastline, DR = distance to rivers, LU = land use, W = weight, S = score, Ref = reference, Pd = ponds, WL = wetlands, SF = swamp forest, O = orchard, RF = rice fields, MO = mixed orchards, CL = croplands, St = settlements, GY = graveyards, Ind = industrial, Rv = rivers.
Table 3. Characteristics of the land systems of the Sayung subdistrict.
ParametersLand System
KJPMKS
PhysiographicSlope (m)<2<2
elevation (%)<22–9.9
Morphology FlatFlat to gently sloping
Landform SwampEstuarine
Riverine plains
Genesis Marine Fluvial
Land use Aquaculture, MangrovesPaddy fields
Cropland
Settlements
Industry
GeologyLithologySedimentarySedimentary
Rock typeAlluvium,
Recent estuarine-marine
Recent estuarine-marine,
Riverine
ClimateRainfall (mm)400–3100 1000–2400
Wet months 2–101–4
Dry months 0–75–9
SoilTypeAlluvium
Association of sulfaquents,
hydraquents
Association of tropaquepts,
fluvaquents,
ustropepts
Solum (cm)>150Peat: 0–10
Mineral > 150
TextureSandy loam to clay loamClay loam, silty clay loam, sandy clay loam
pH7<7
Drainage Poor DrainagePoor to moderate
Groundwater depth (cm) 0–45 0–45
Salinity Moderately salineNone to very slightly saline
Suitability Brackish fisheries
Ponds
Mangroves
Agriculture
Settlements
Source: [32,49].
Table 4. Classification and land allocation for fishponds in fishing zones and rural settlements.
Fisheries ZoneRural Settlement Zone
ClassesArea ClassesArea
S1-Z12015.53 S1-Z214,691.73
S2-Z11645.57 S2-Z229,451.67
S3-Z1 S3-Z211,966.78
Publisher’s Note: MDPI stays neutral with regard to jurisdictional claims in published maps and institutional affiliations.

