
A Geomorphic Approach for Identifying Flash Flood Potential Areas in the East Rapti River Basin of Nepal

 , , ,
, , ,  ,
,
Abstract
:1. Introduction
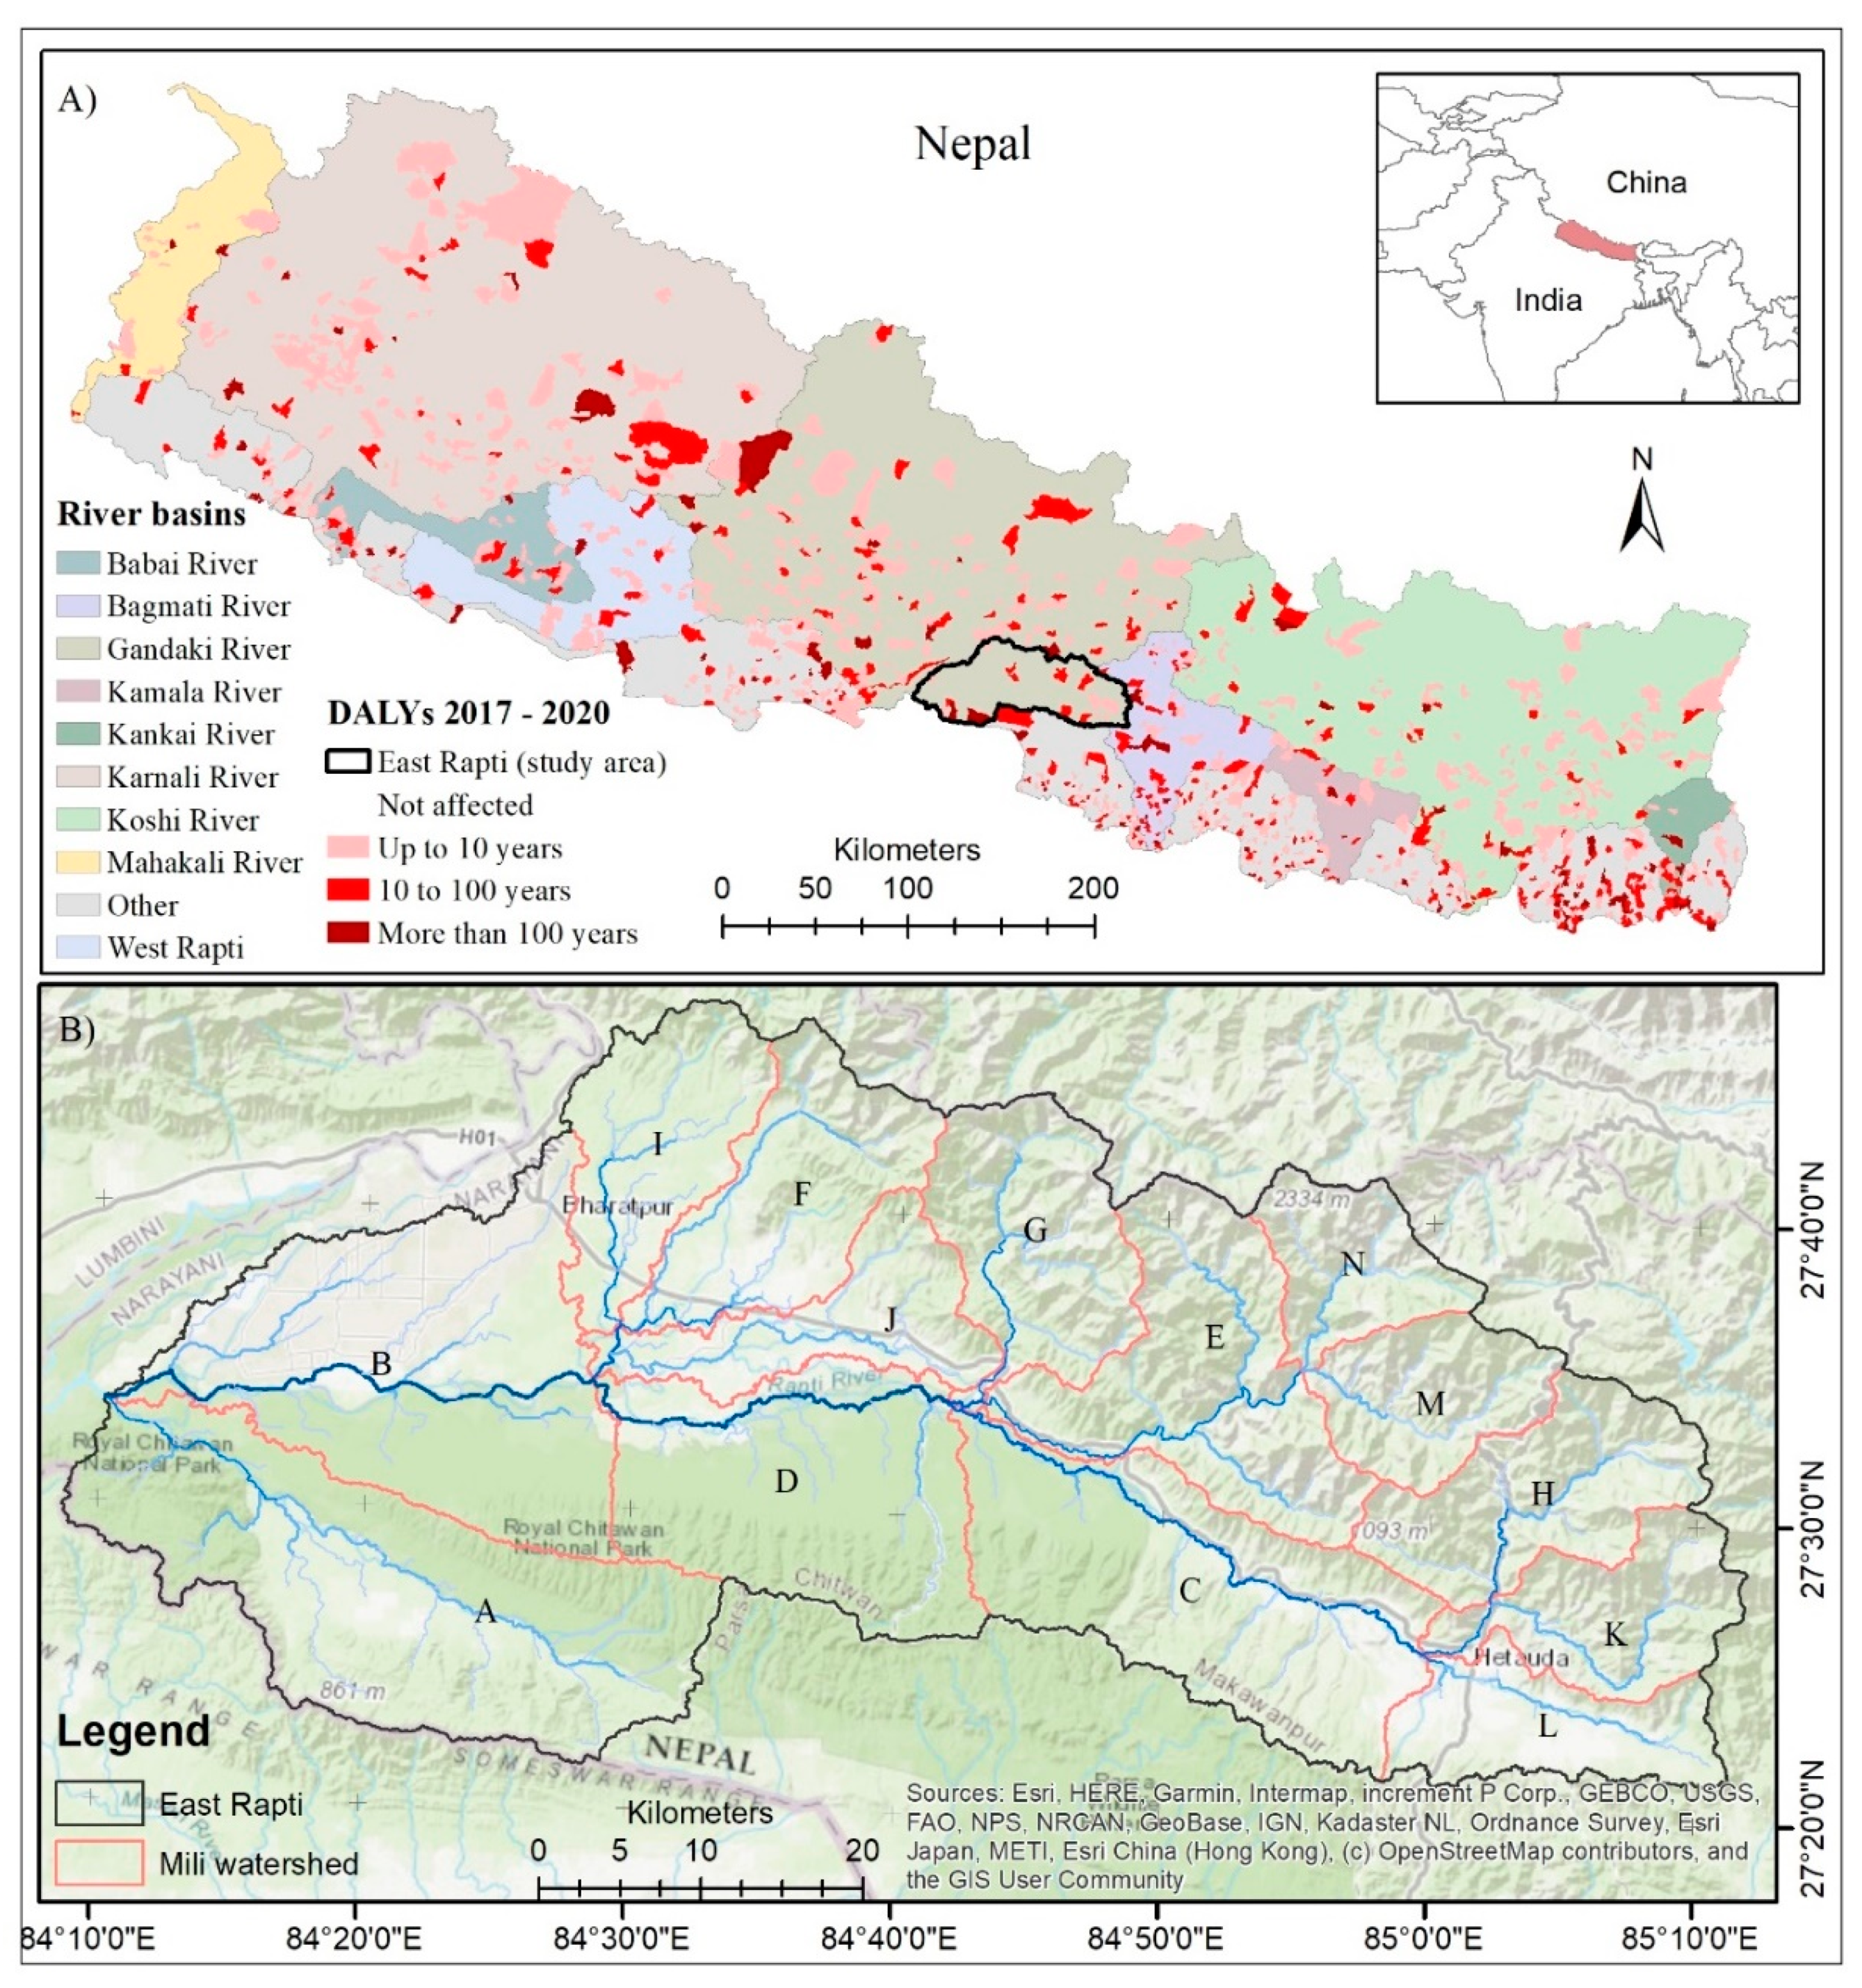
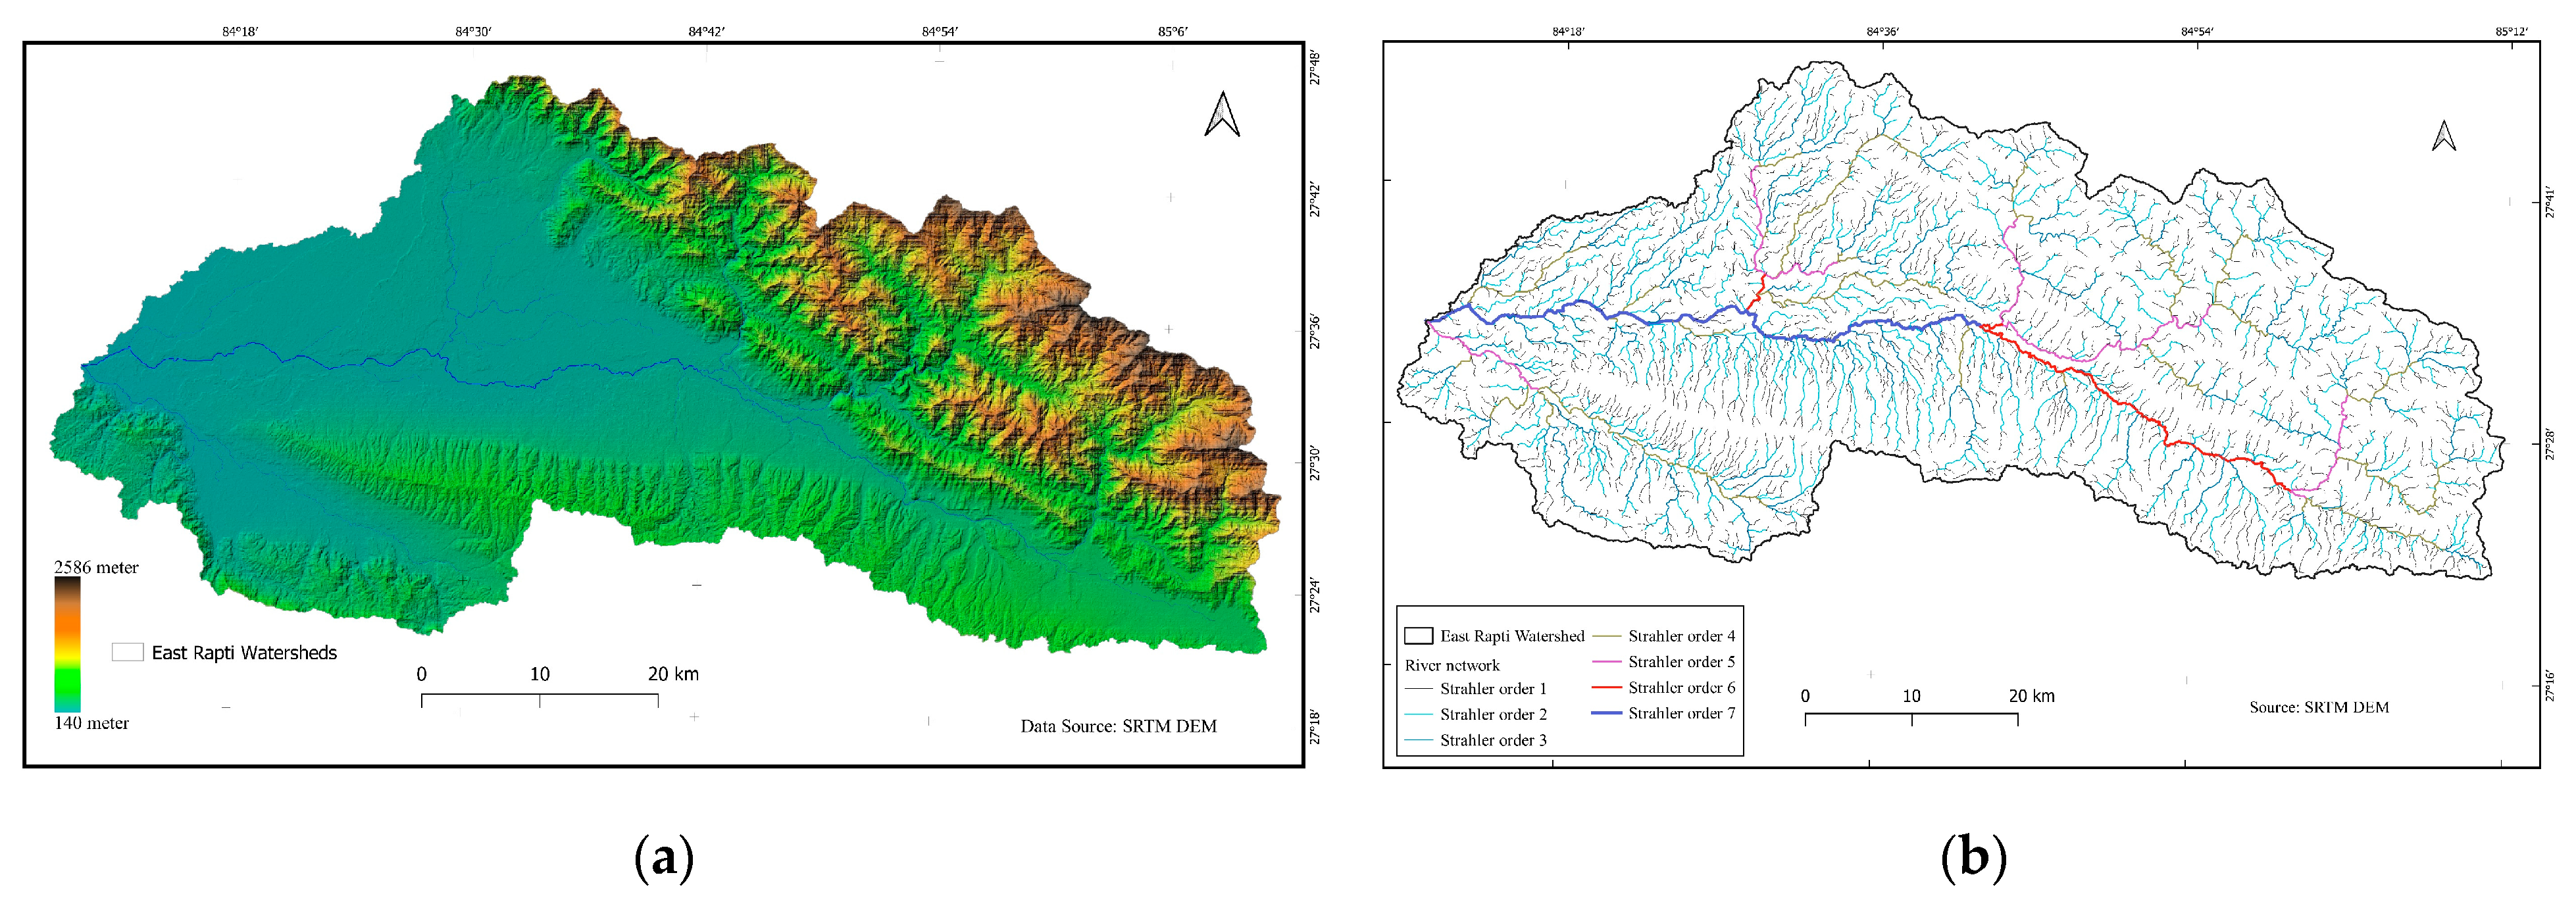
2. Study Area
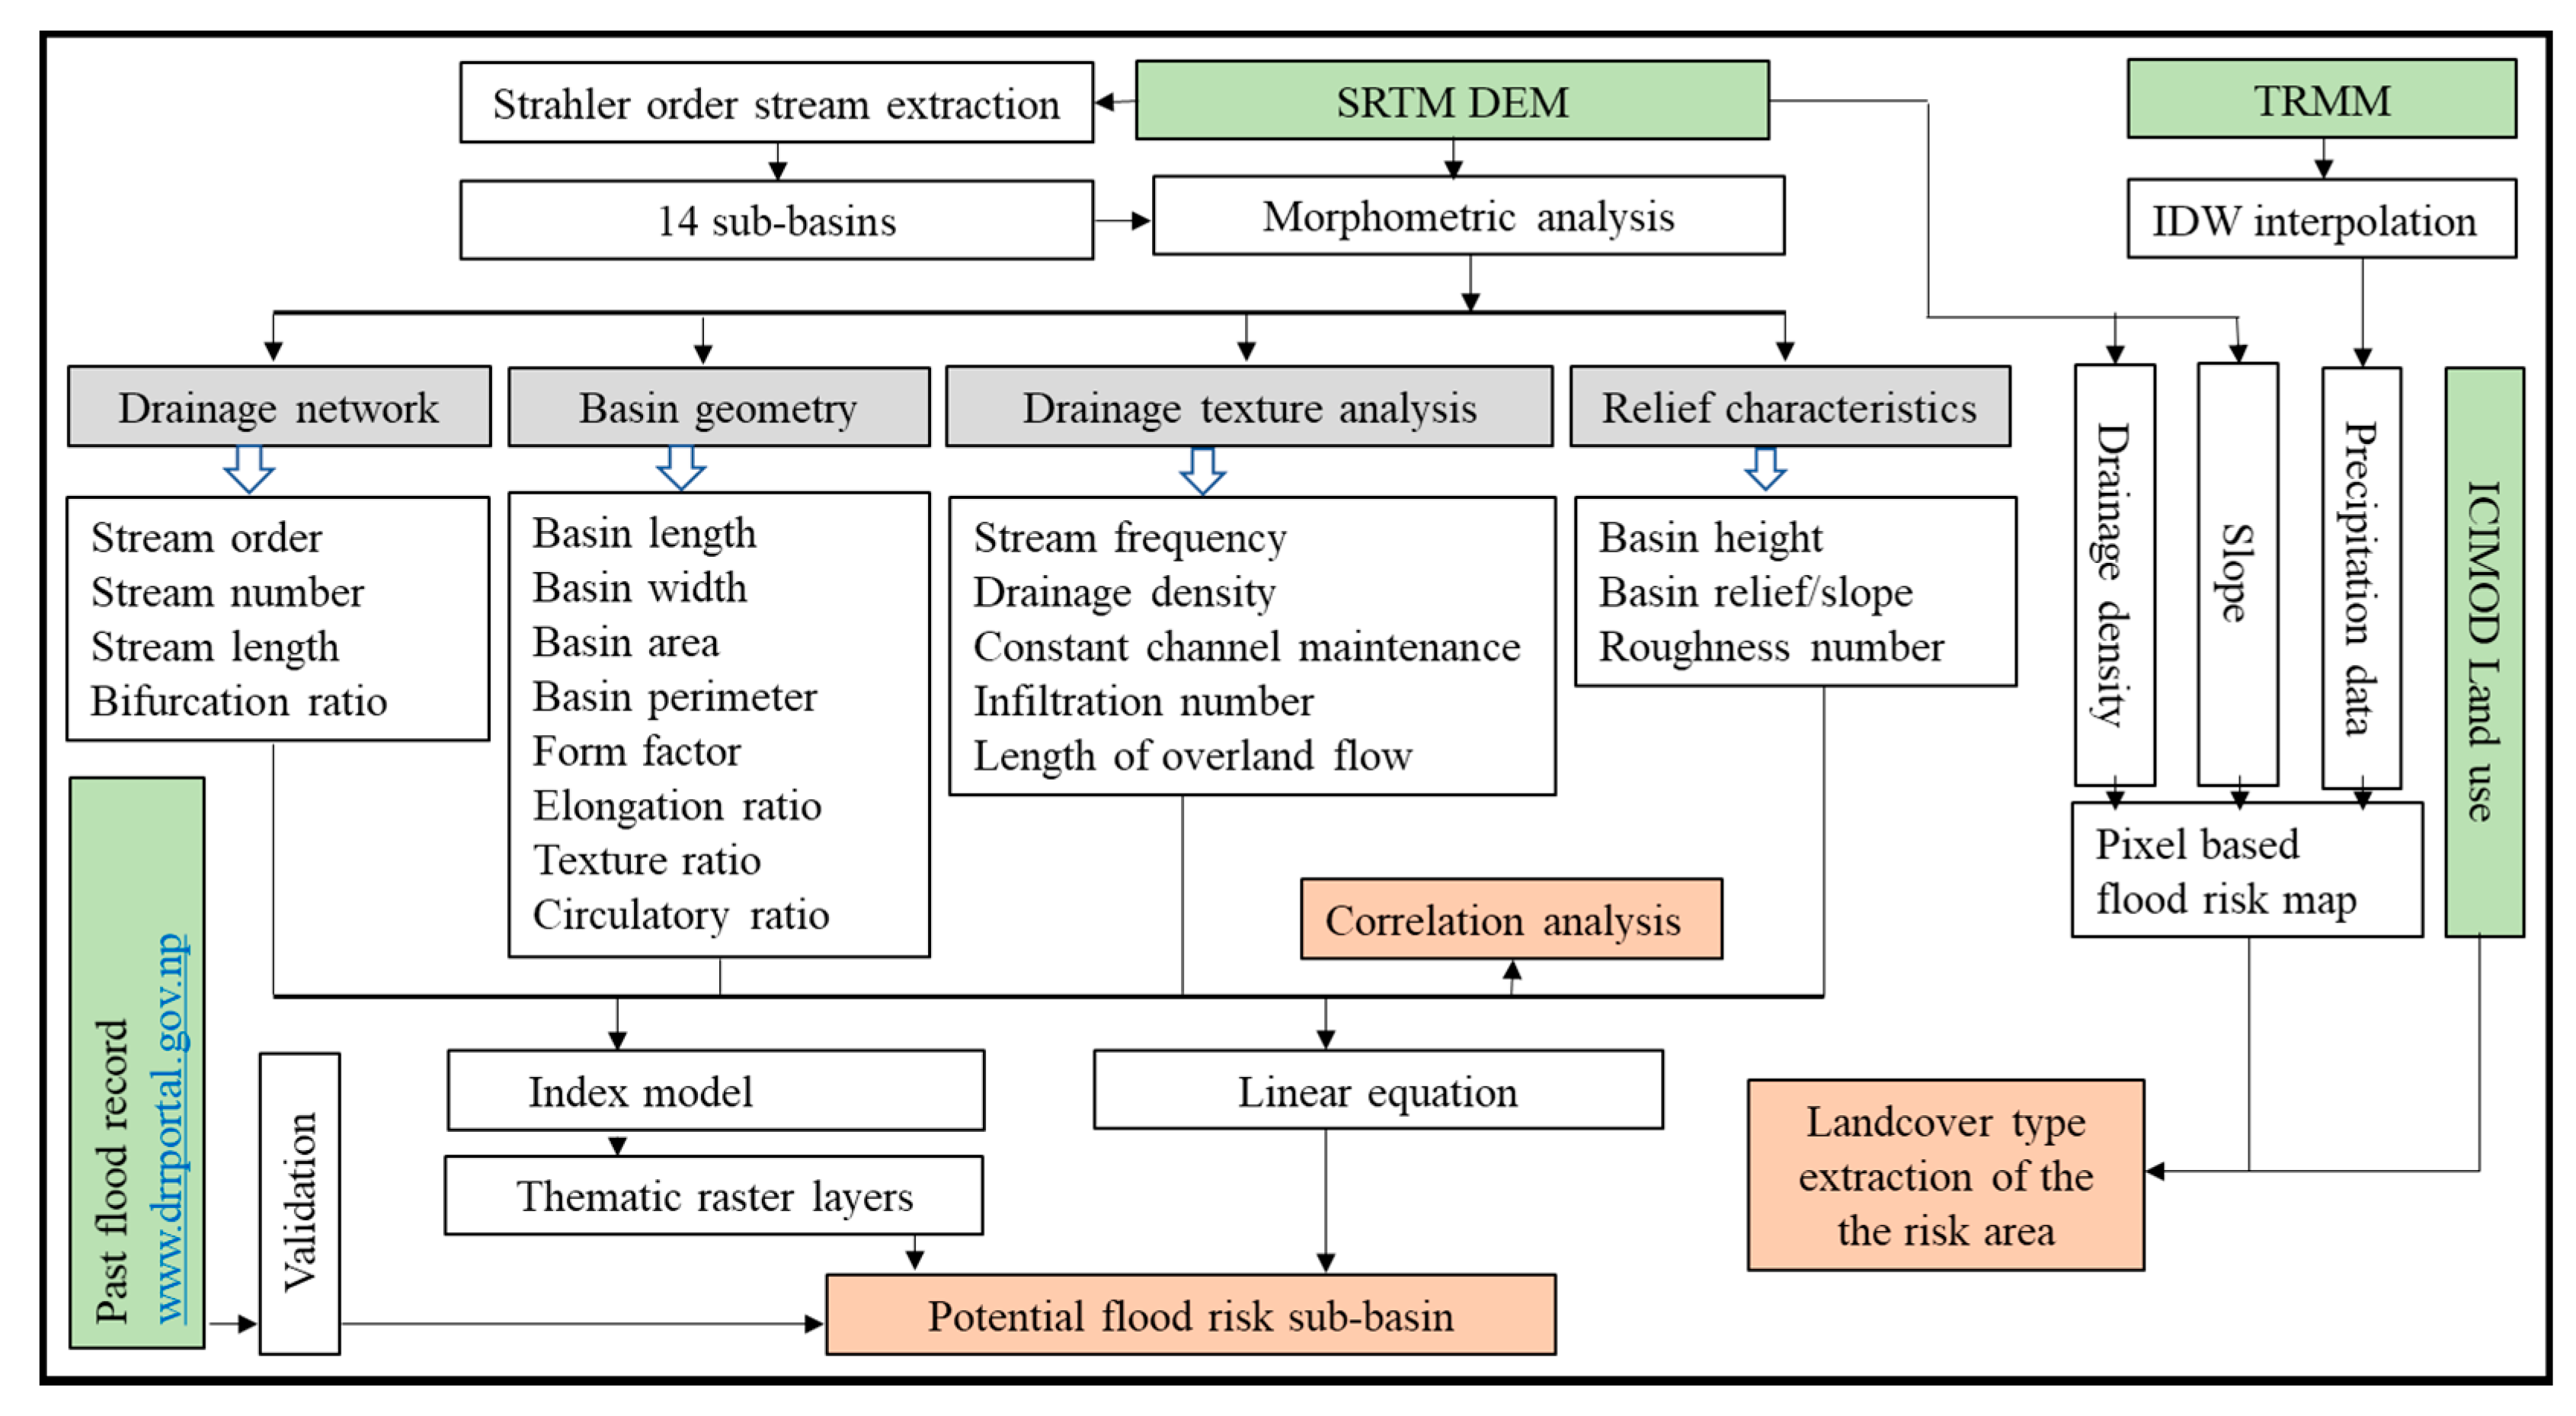
3. Materials and Methods
3.1. Morphometric Parameters
Mapping Flash Flood Risk Areas

| No | Parameters | Equations | Reference |
|---|---|---|---|
| A. Drainage Network | |||
| 1 | Stream Order (u) | Strahler stream order | [53] |
| 2 | Stream number (Nu) | [56] | |
| 3 | Stream length (Lu) | [57] | |
| 4 | Bifurcation ratio (Rb) | [57] | |
| B. Basin geometry | |||
| 5 | Basin length in km (Lb) | [60] | |
| 6 | Basin width in km (Wb) | [60] | |
| 7 | Area in km (A) | A | [54] |
| 8 | Perimeter in km (P) | P | [54] |
| 9 | Form factor (Rf) | [56] | |
| 10 | Elongation ratio (Le) | [54] | |
| 11 | Texture ratio (T) | [54] | |
| 12 | Circulatory ratio (Rc) | [55] | |
| C. Drainage texture analysis | |||
| 13 | Stream frequency (Fs) | [56] | |
| 14 | Drainage density in km/km2 (Dd) | [56] | |
| 15 | Constant channel maintenance (C) | [54] | |
| 16 | Infiltration number (If) | [61] | |
| 17 | Length of overland flow in km (Lg) | [56] | |
| D. Relief characteristics | |||
| 18 | Basin height in km (Bh) | [53] | |
| 19 | Basin relief/slope in km (Rh) | [54] | |
| 20 | Ruggedness number (Rn) | [53] | |
3.2. Data Used
4. Results and Discussions
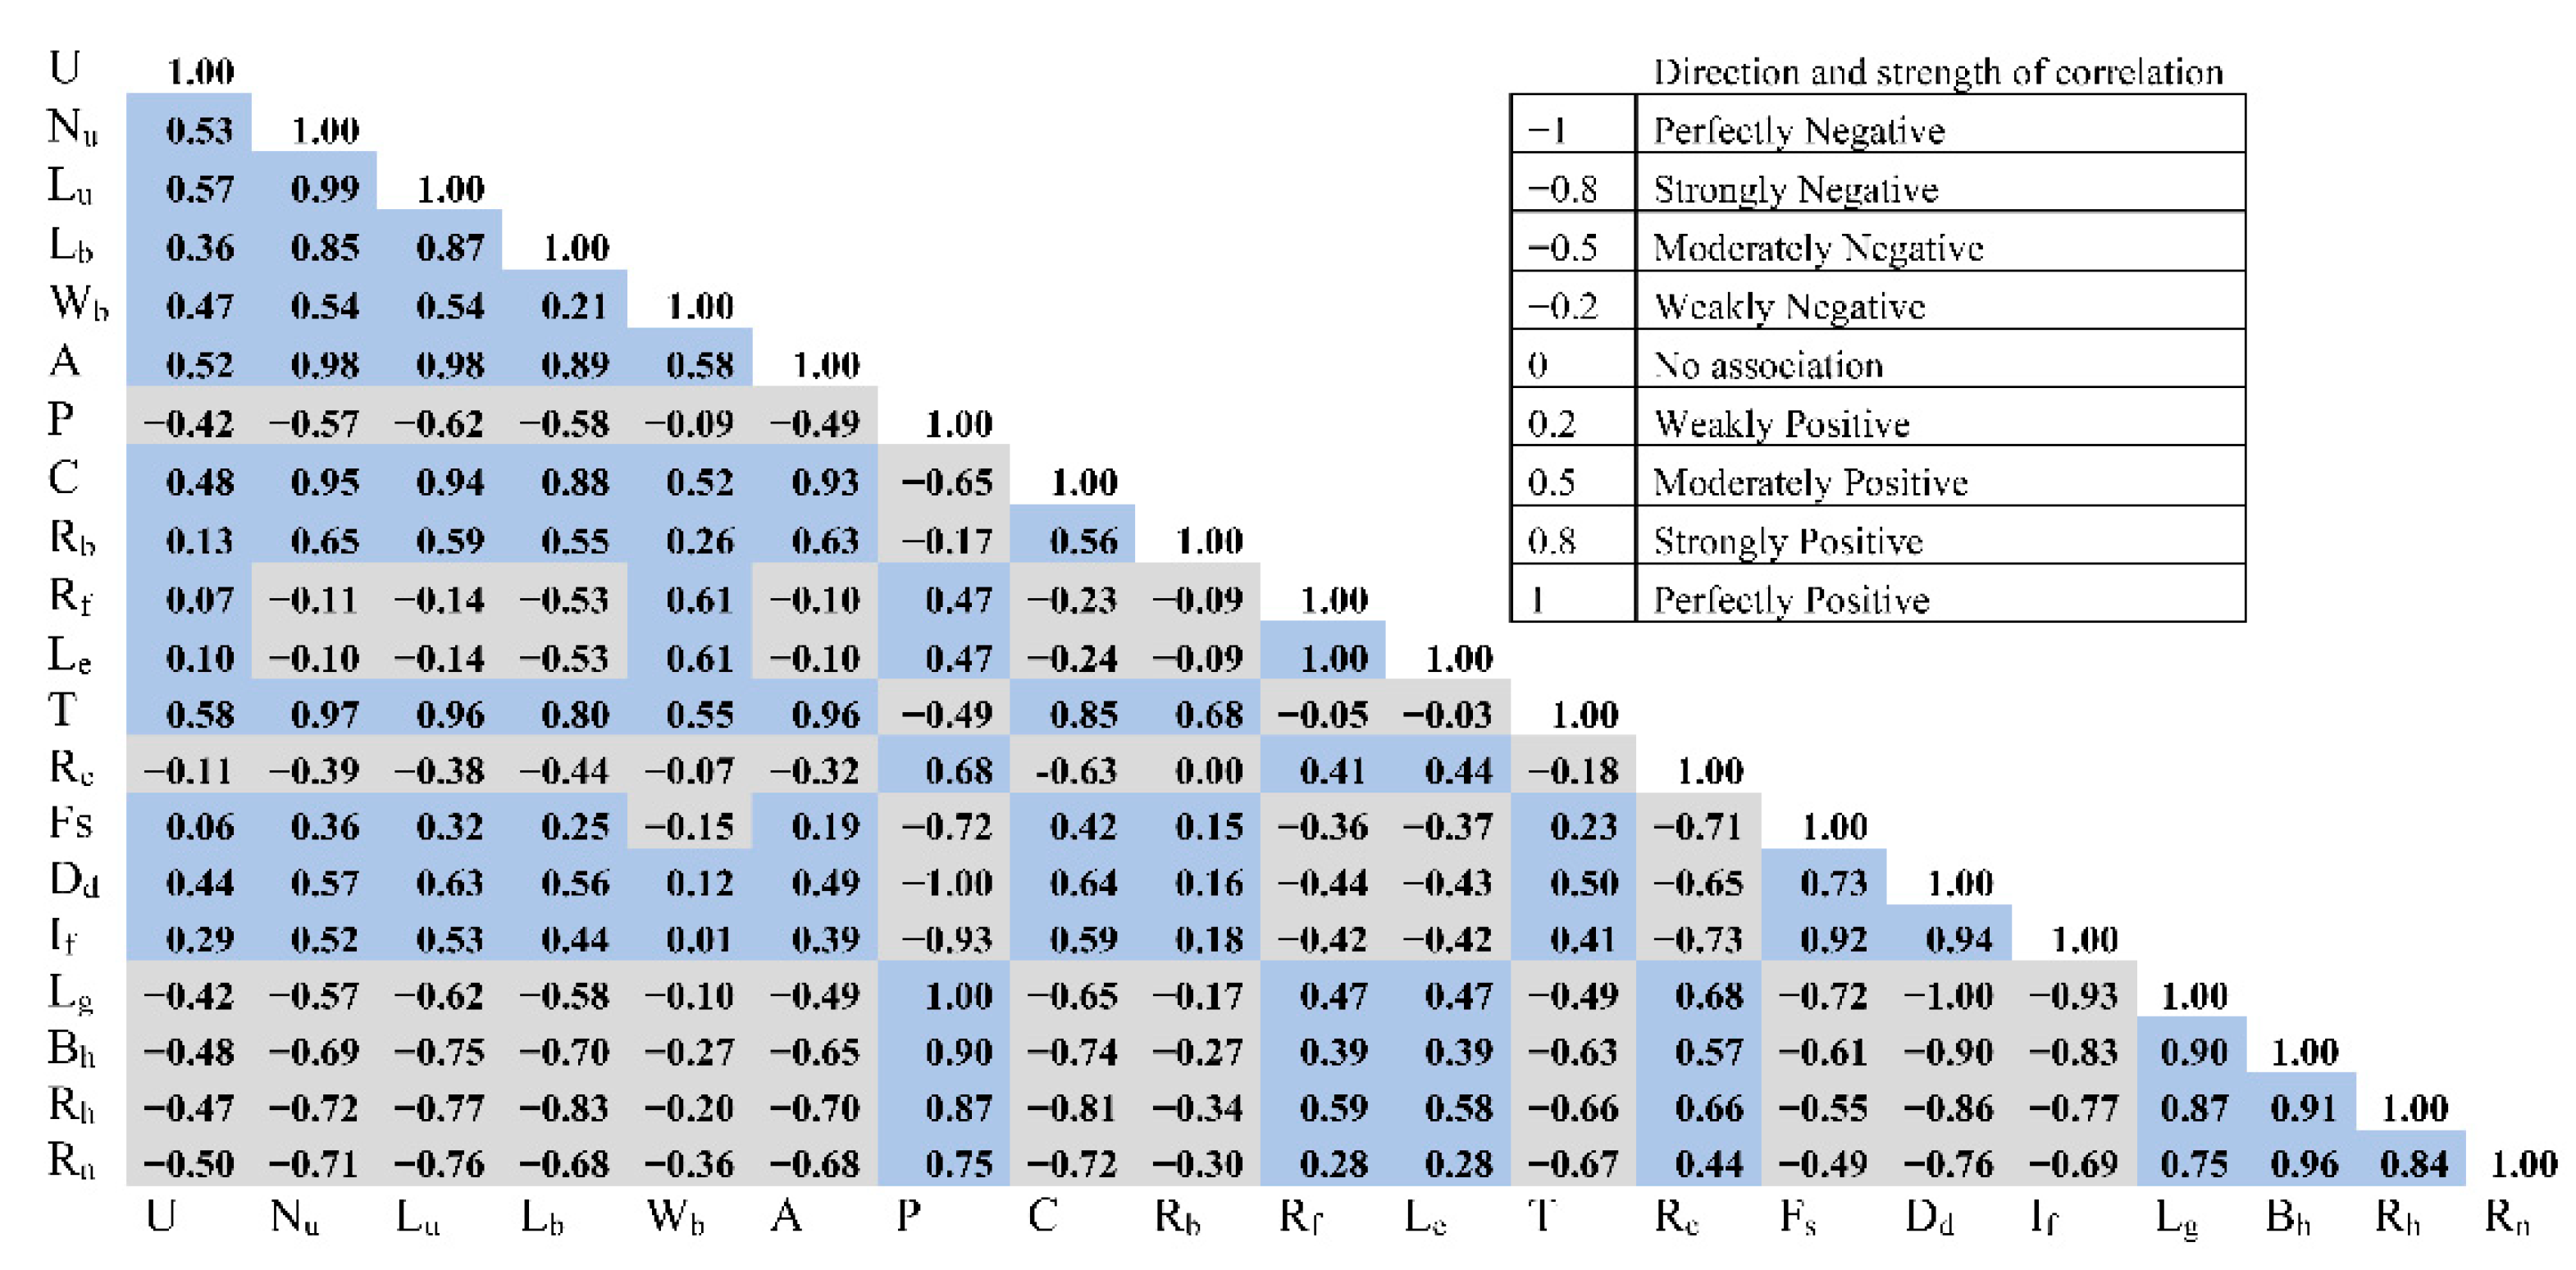
4.1. Morphometric Analysis
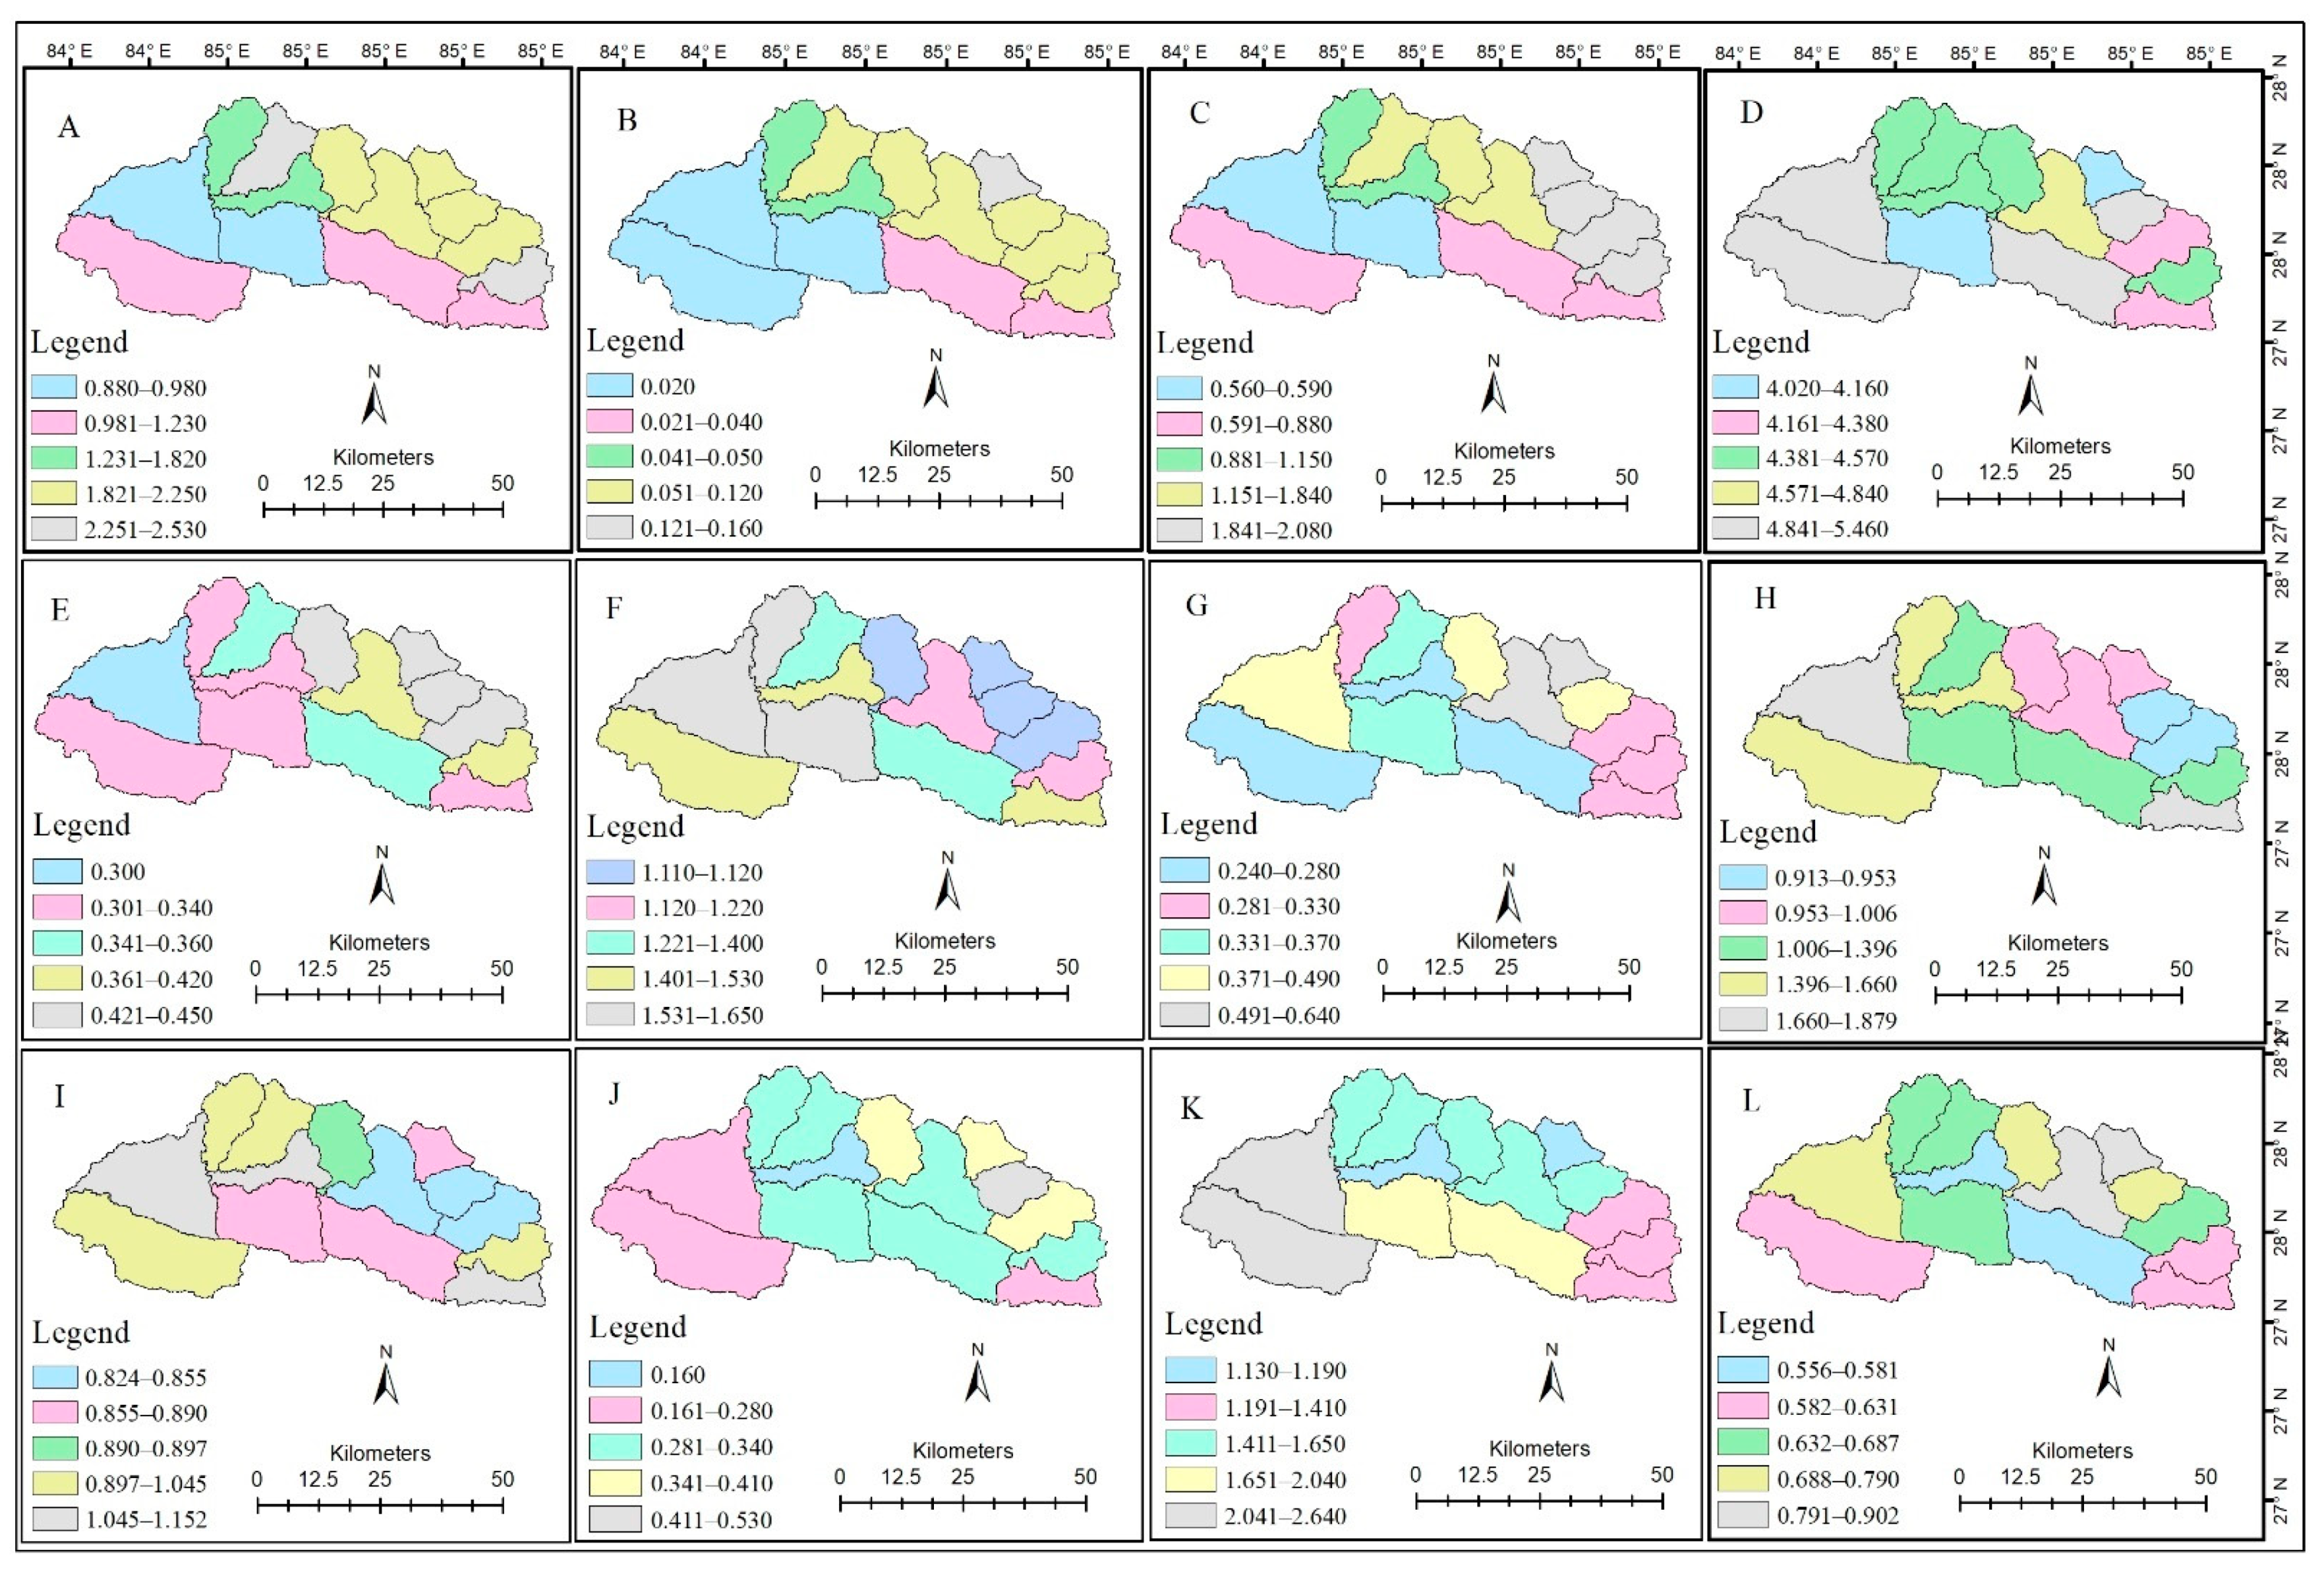
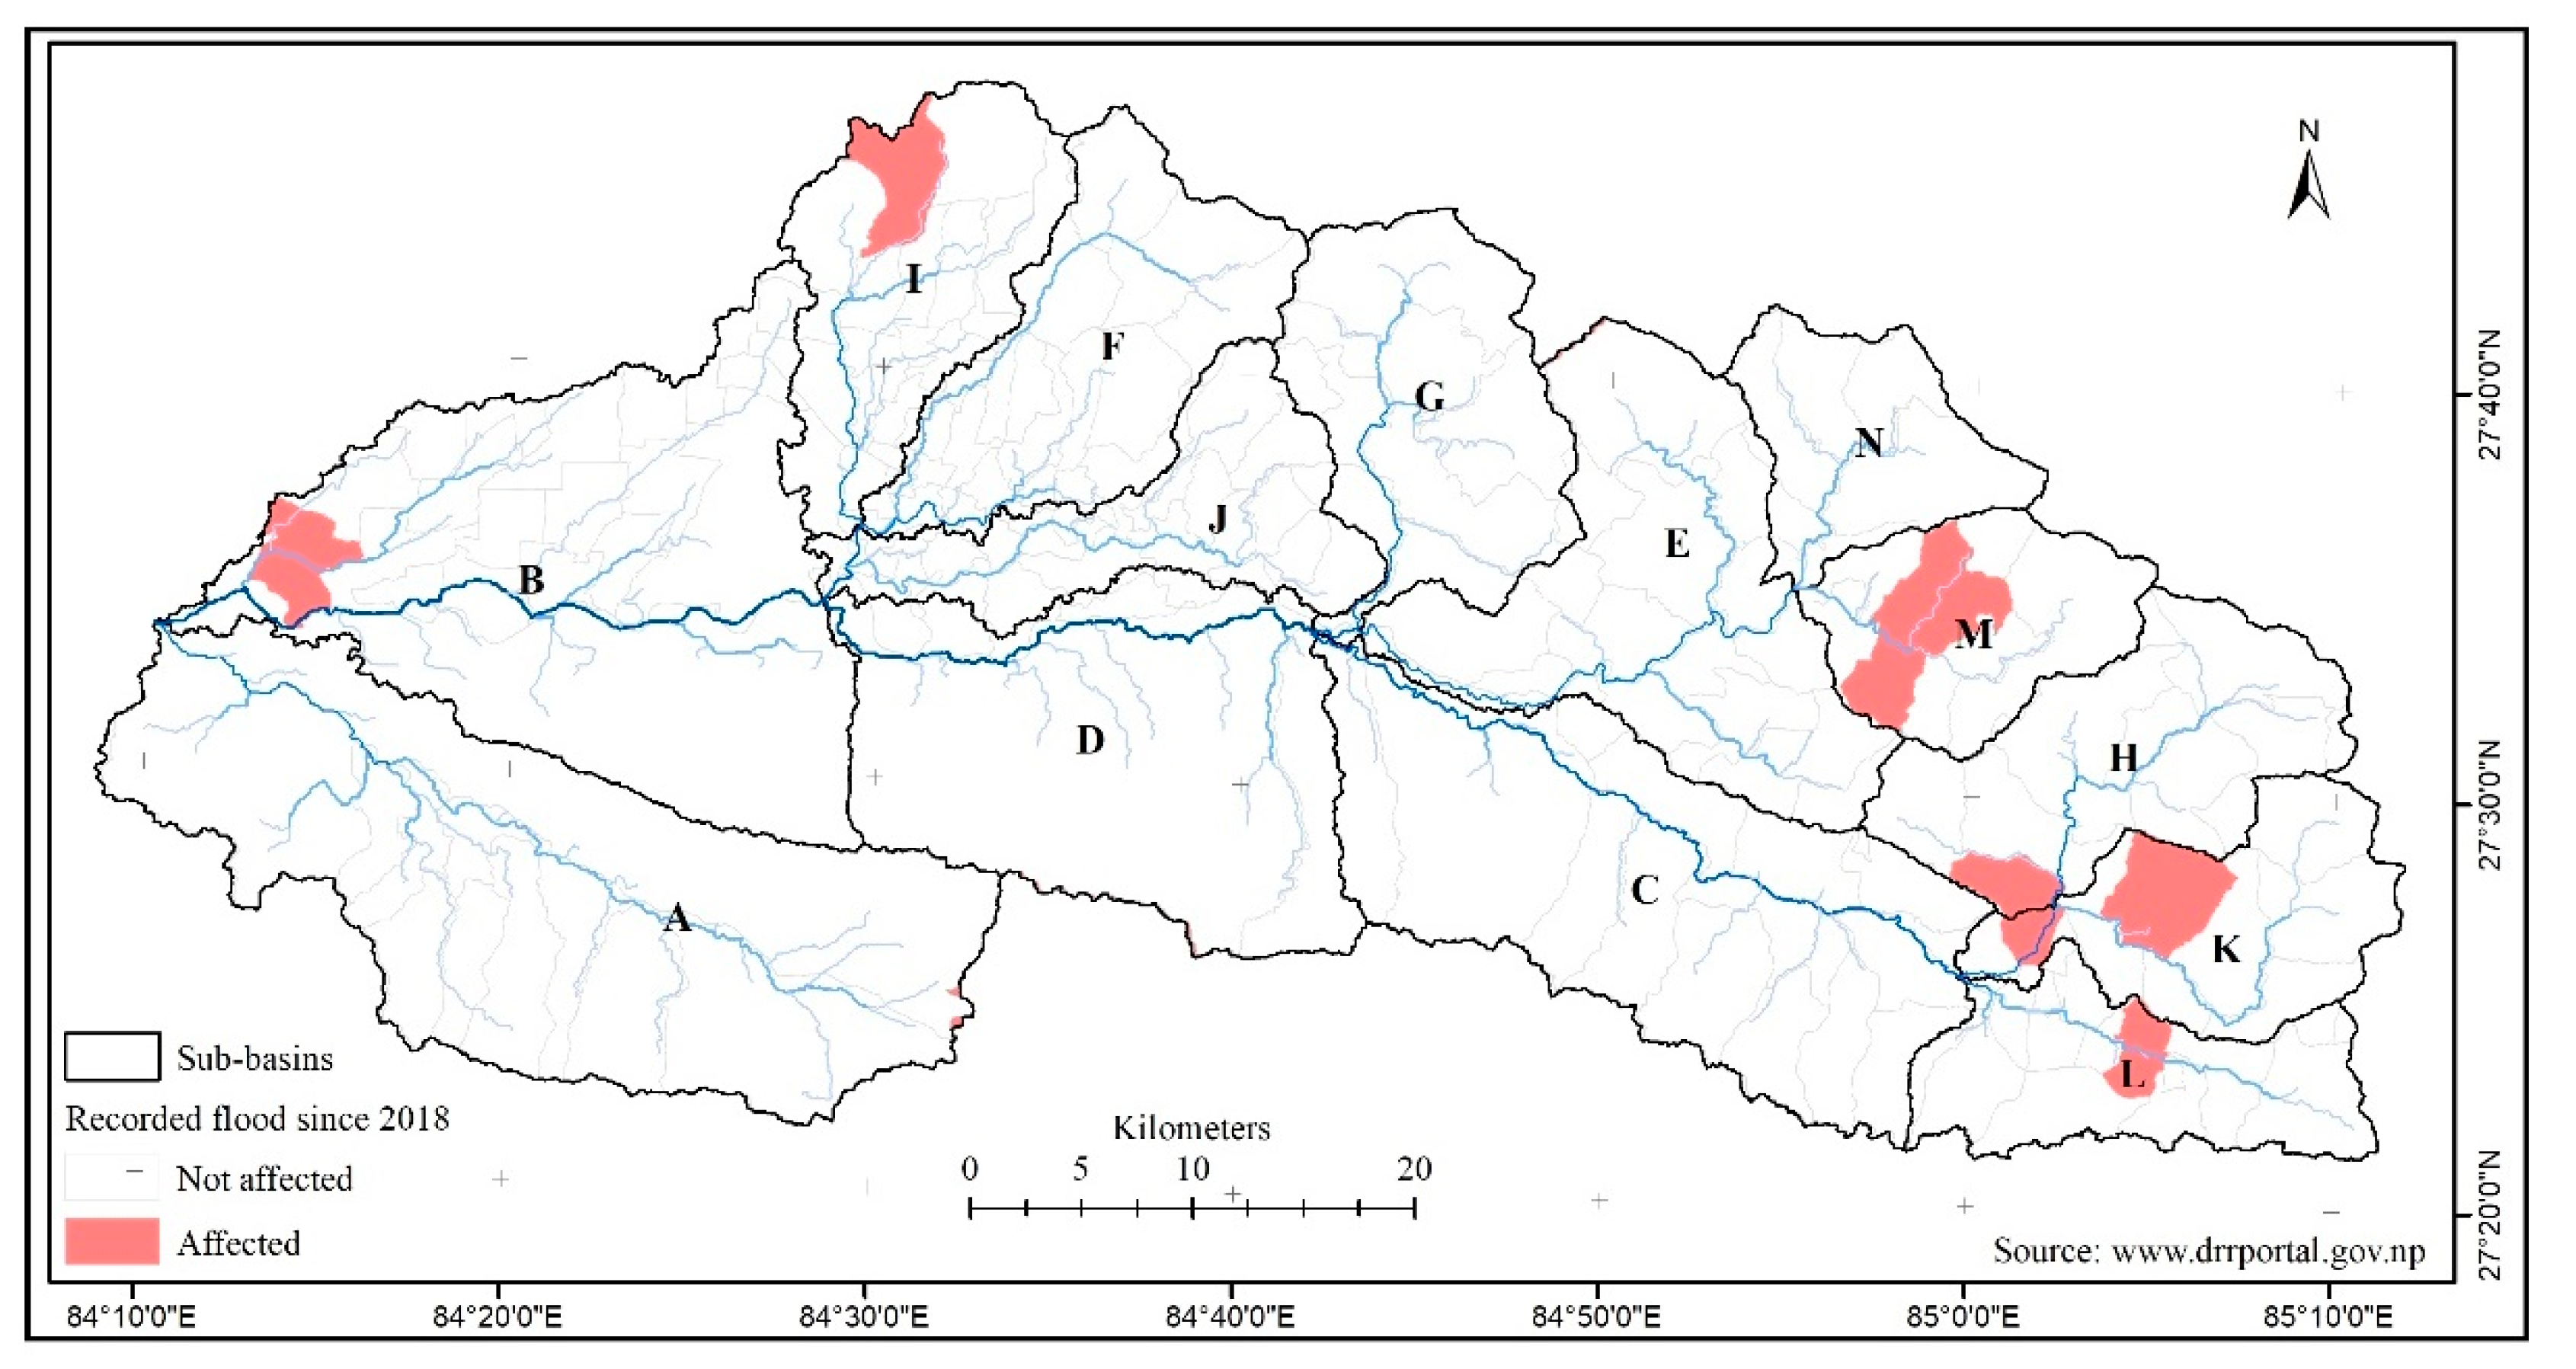
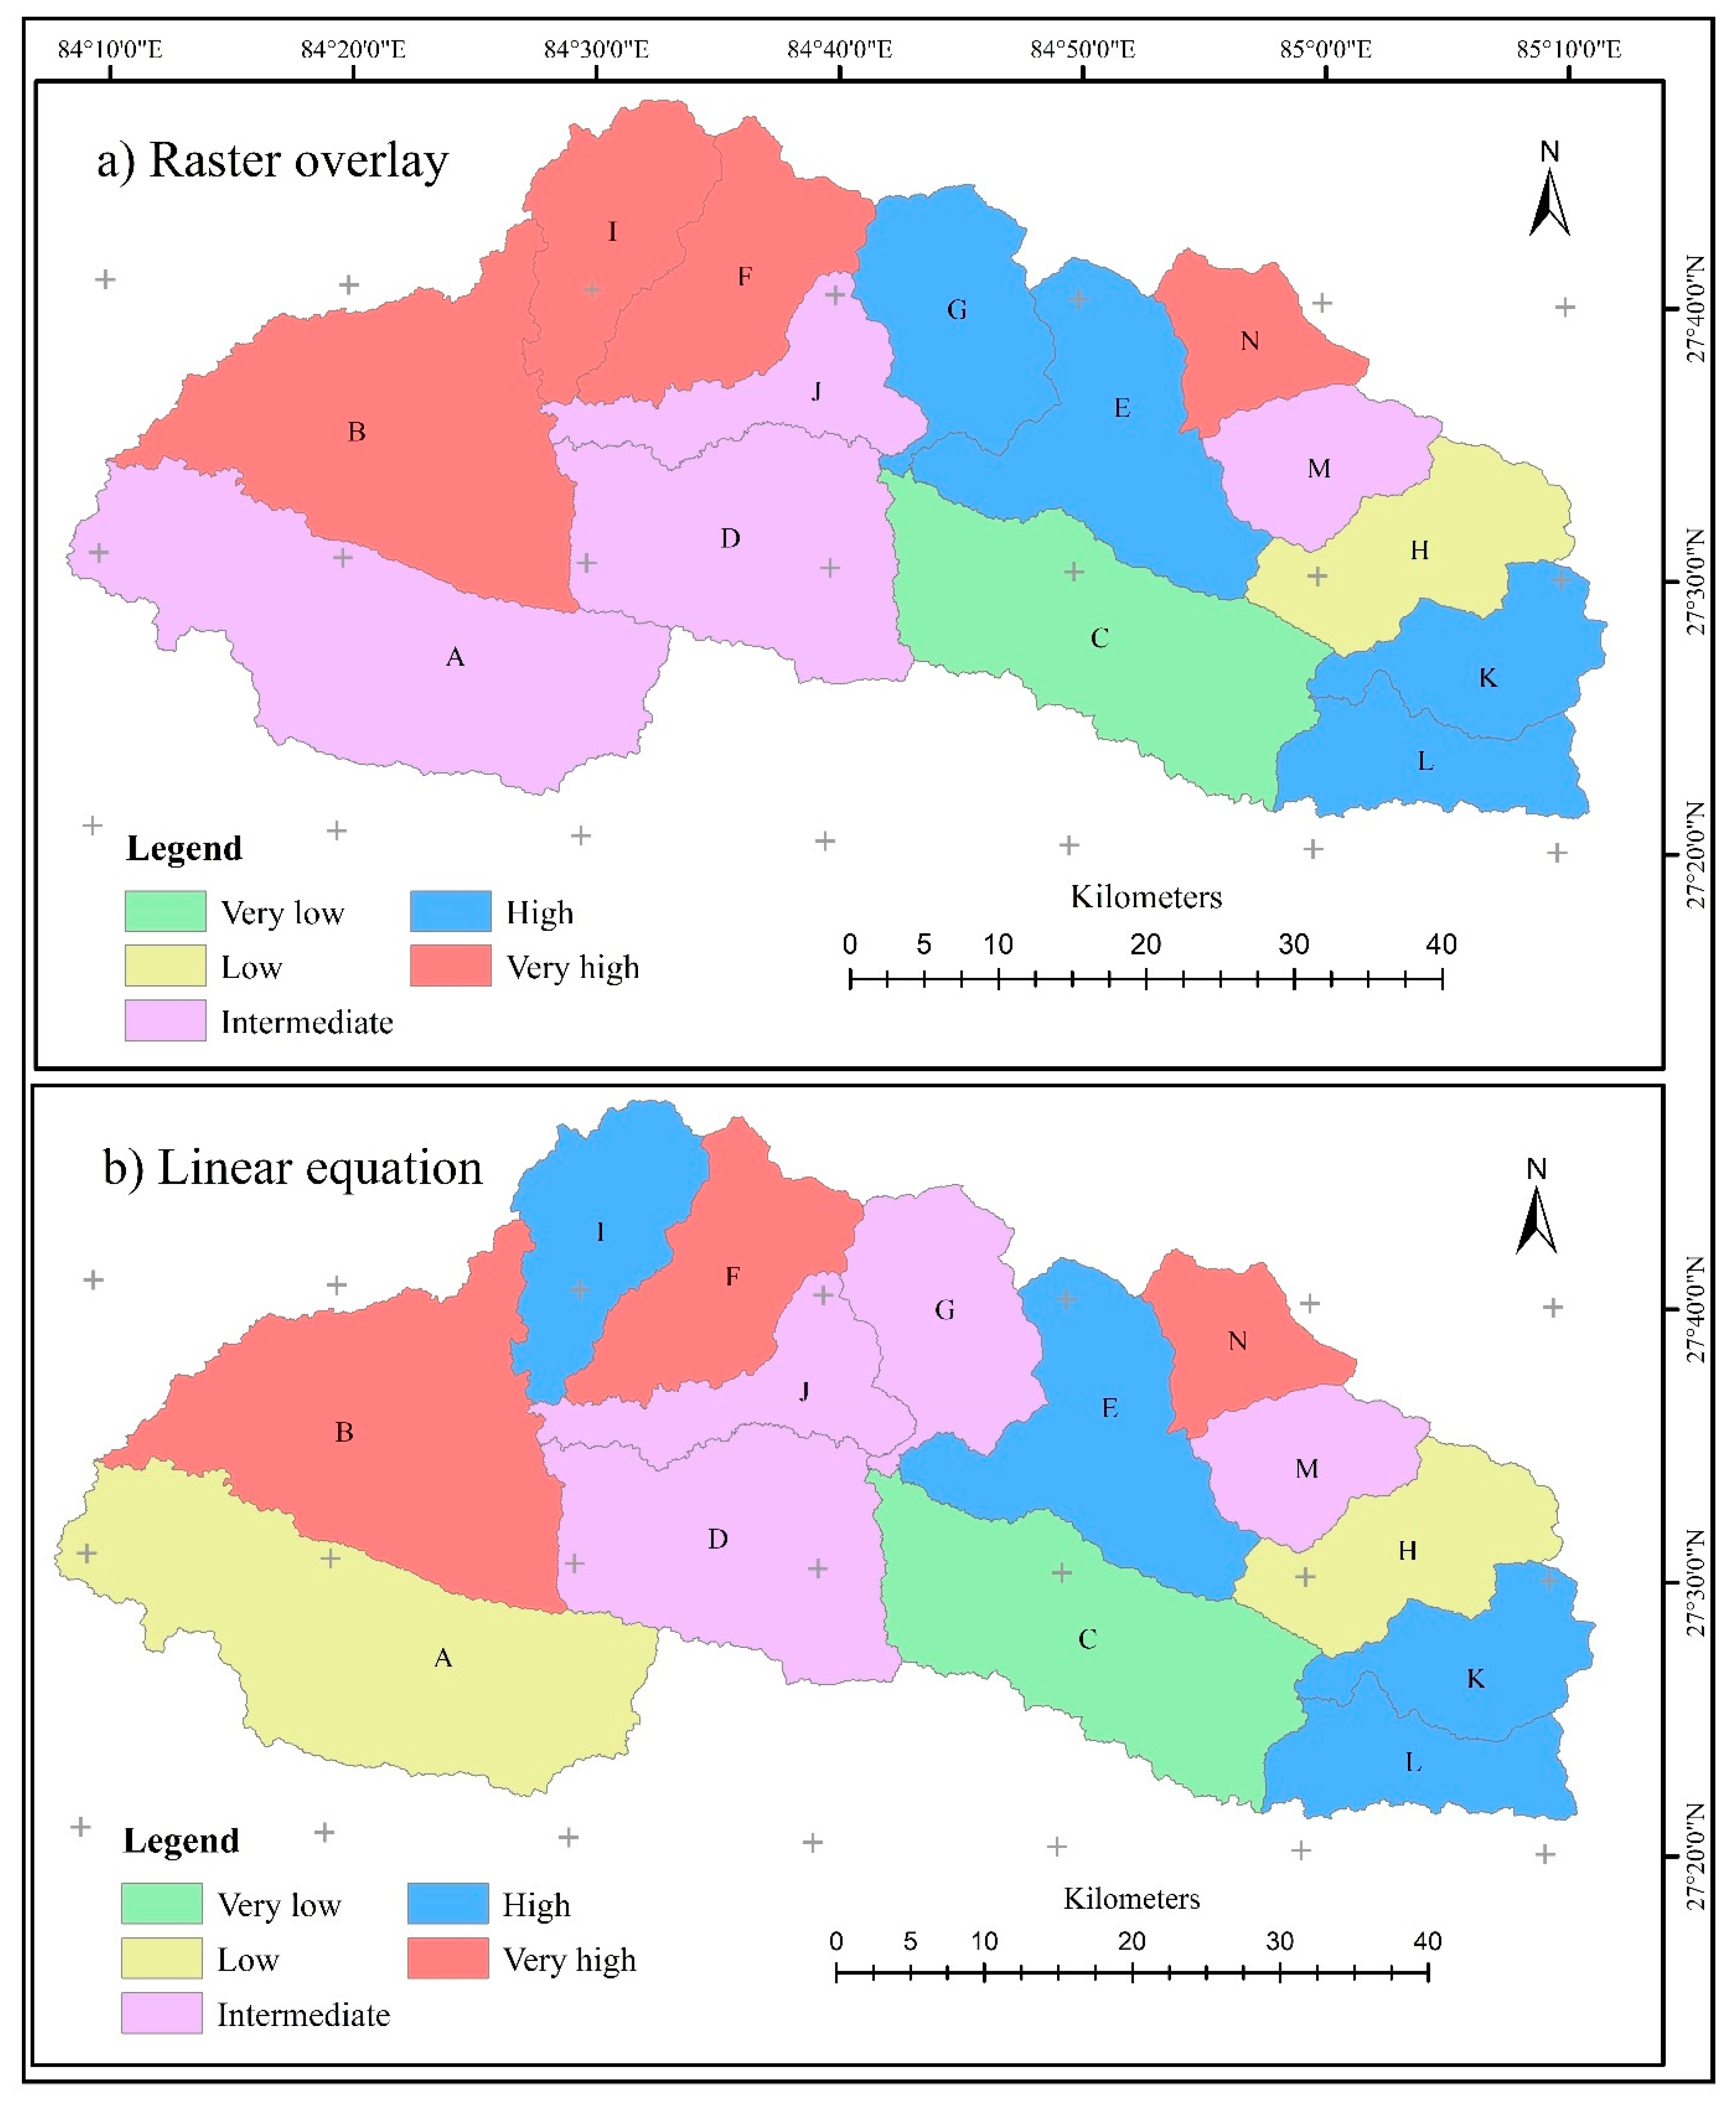
4.2. Mapping Flash Flood Potential Areas
4.3. Linear Equation-Based Risk Mapping
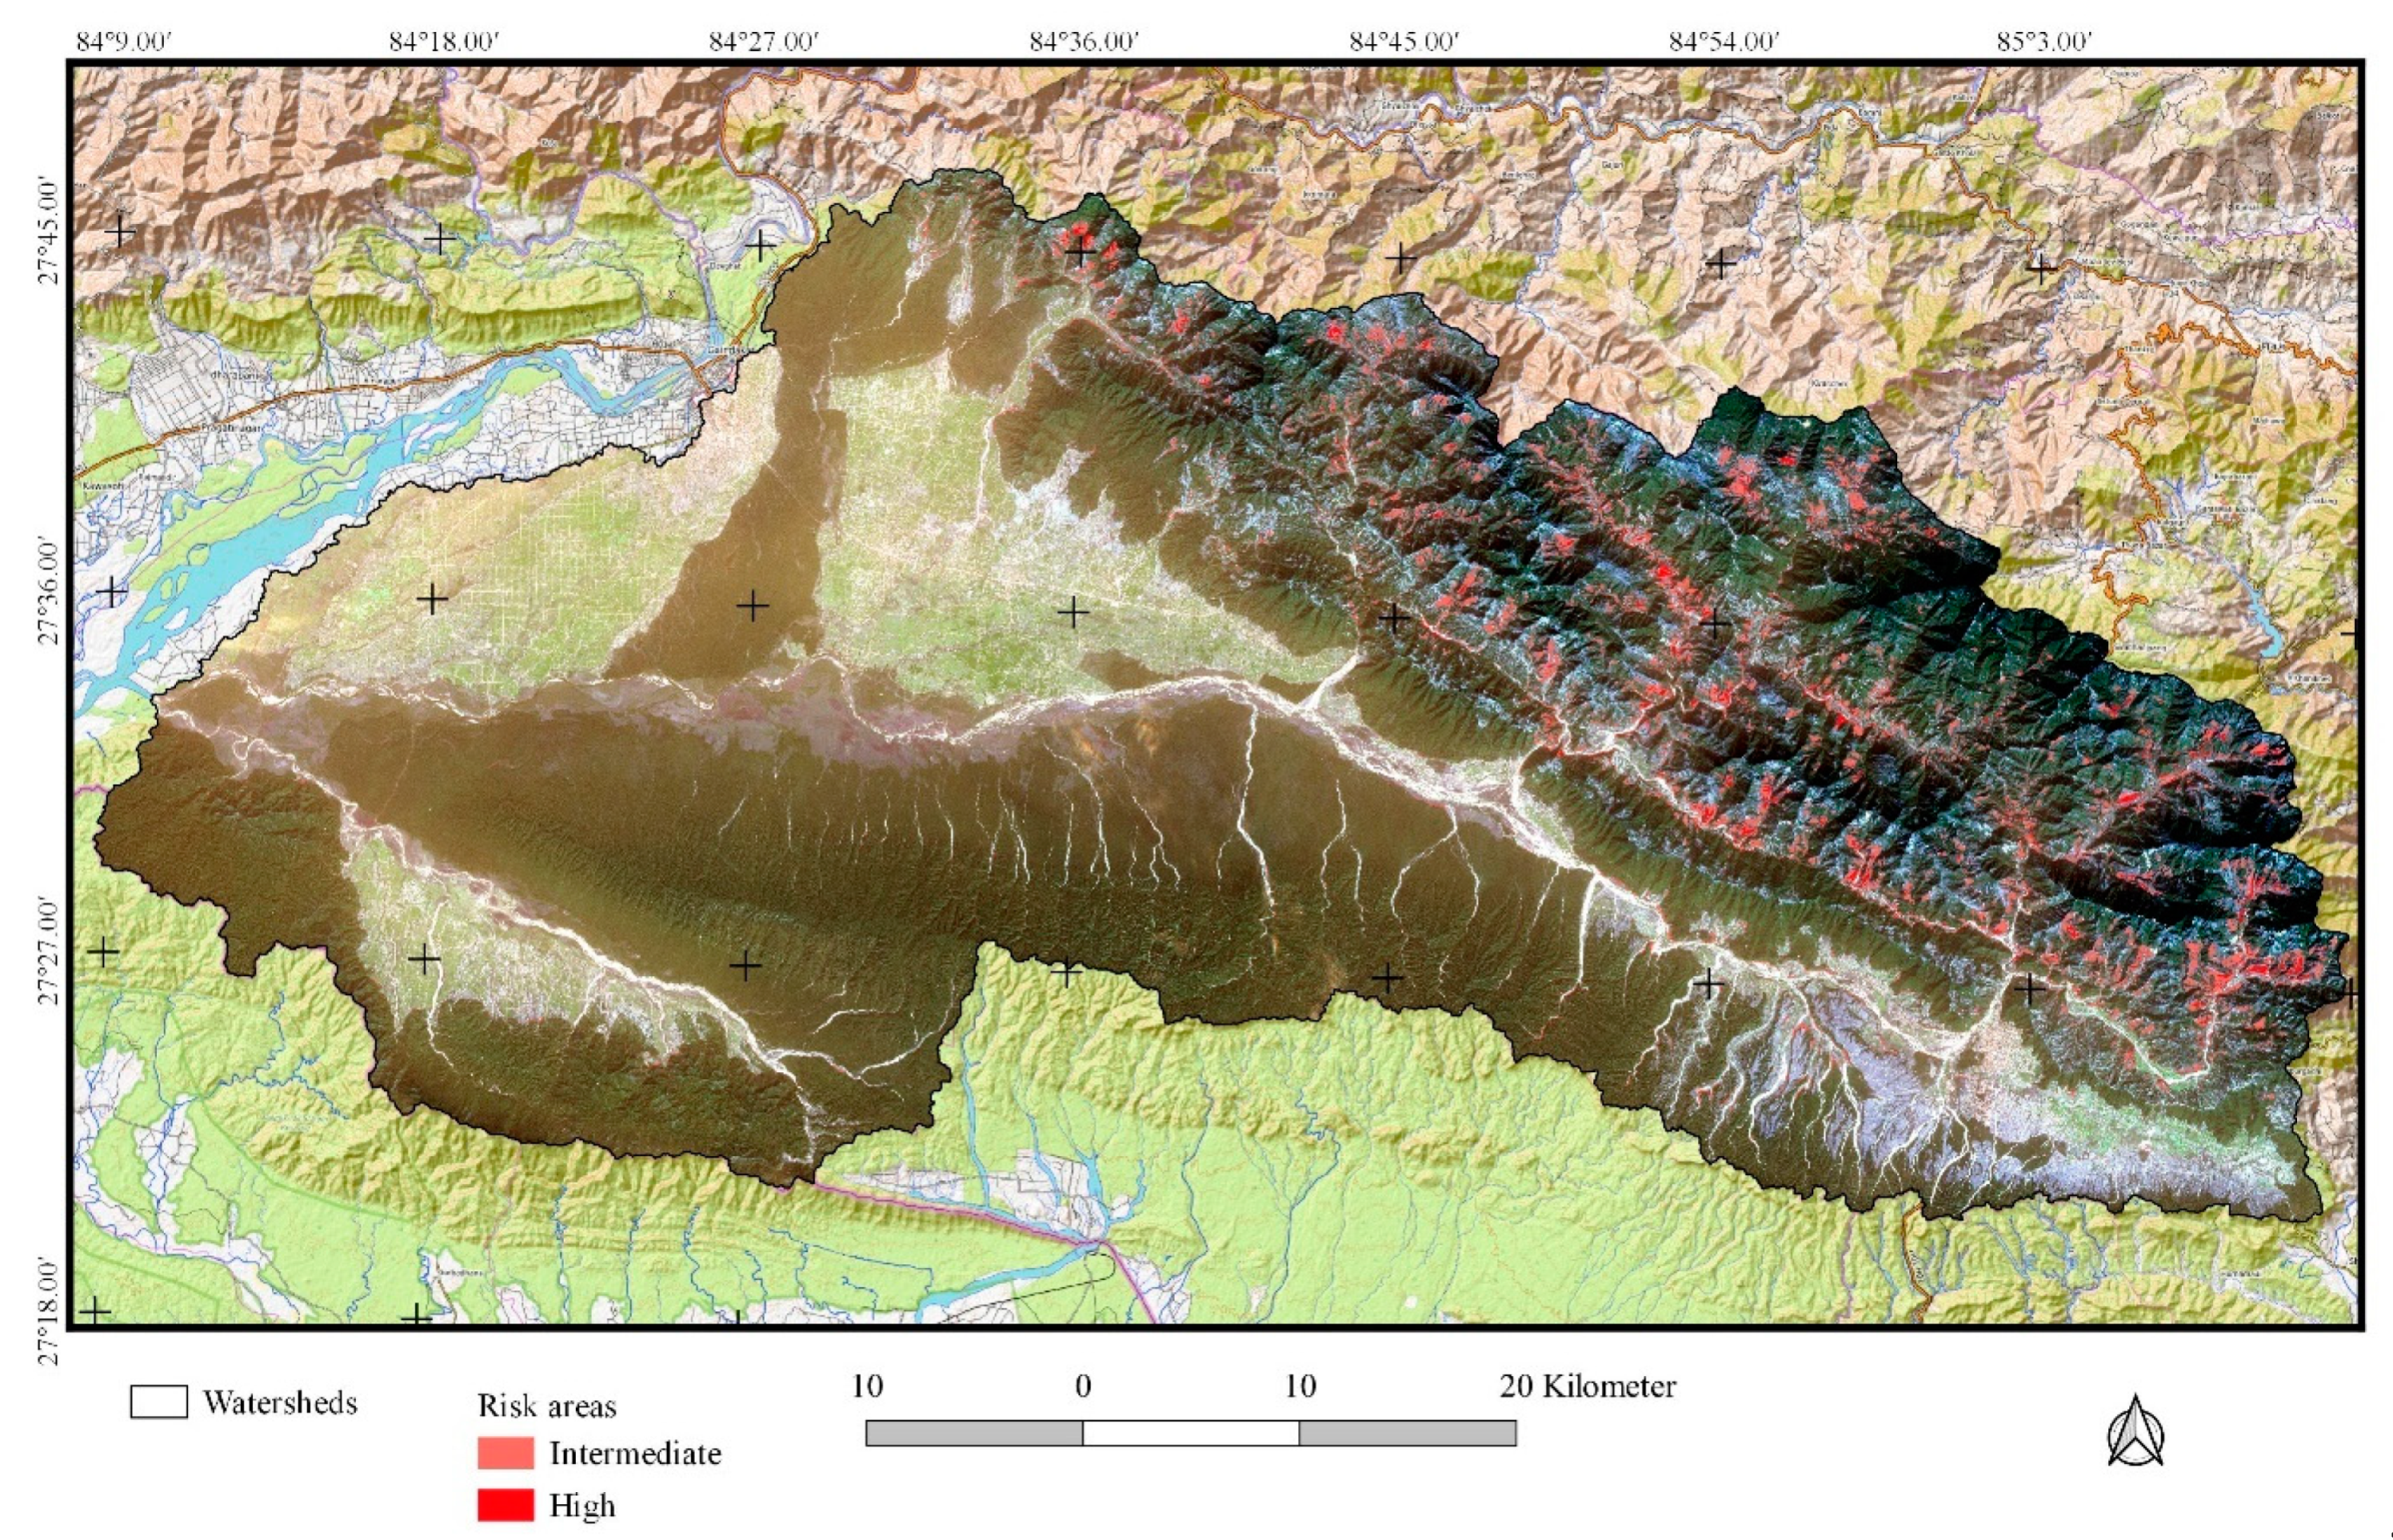
4.4. Pixel Wise Flash Flood Risk Identification
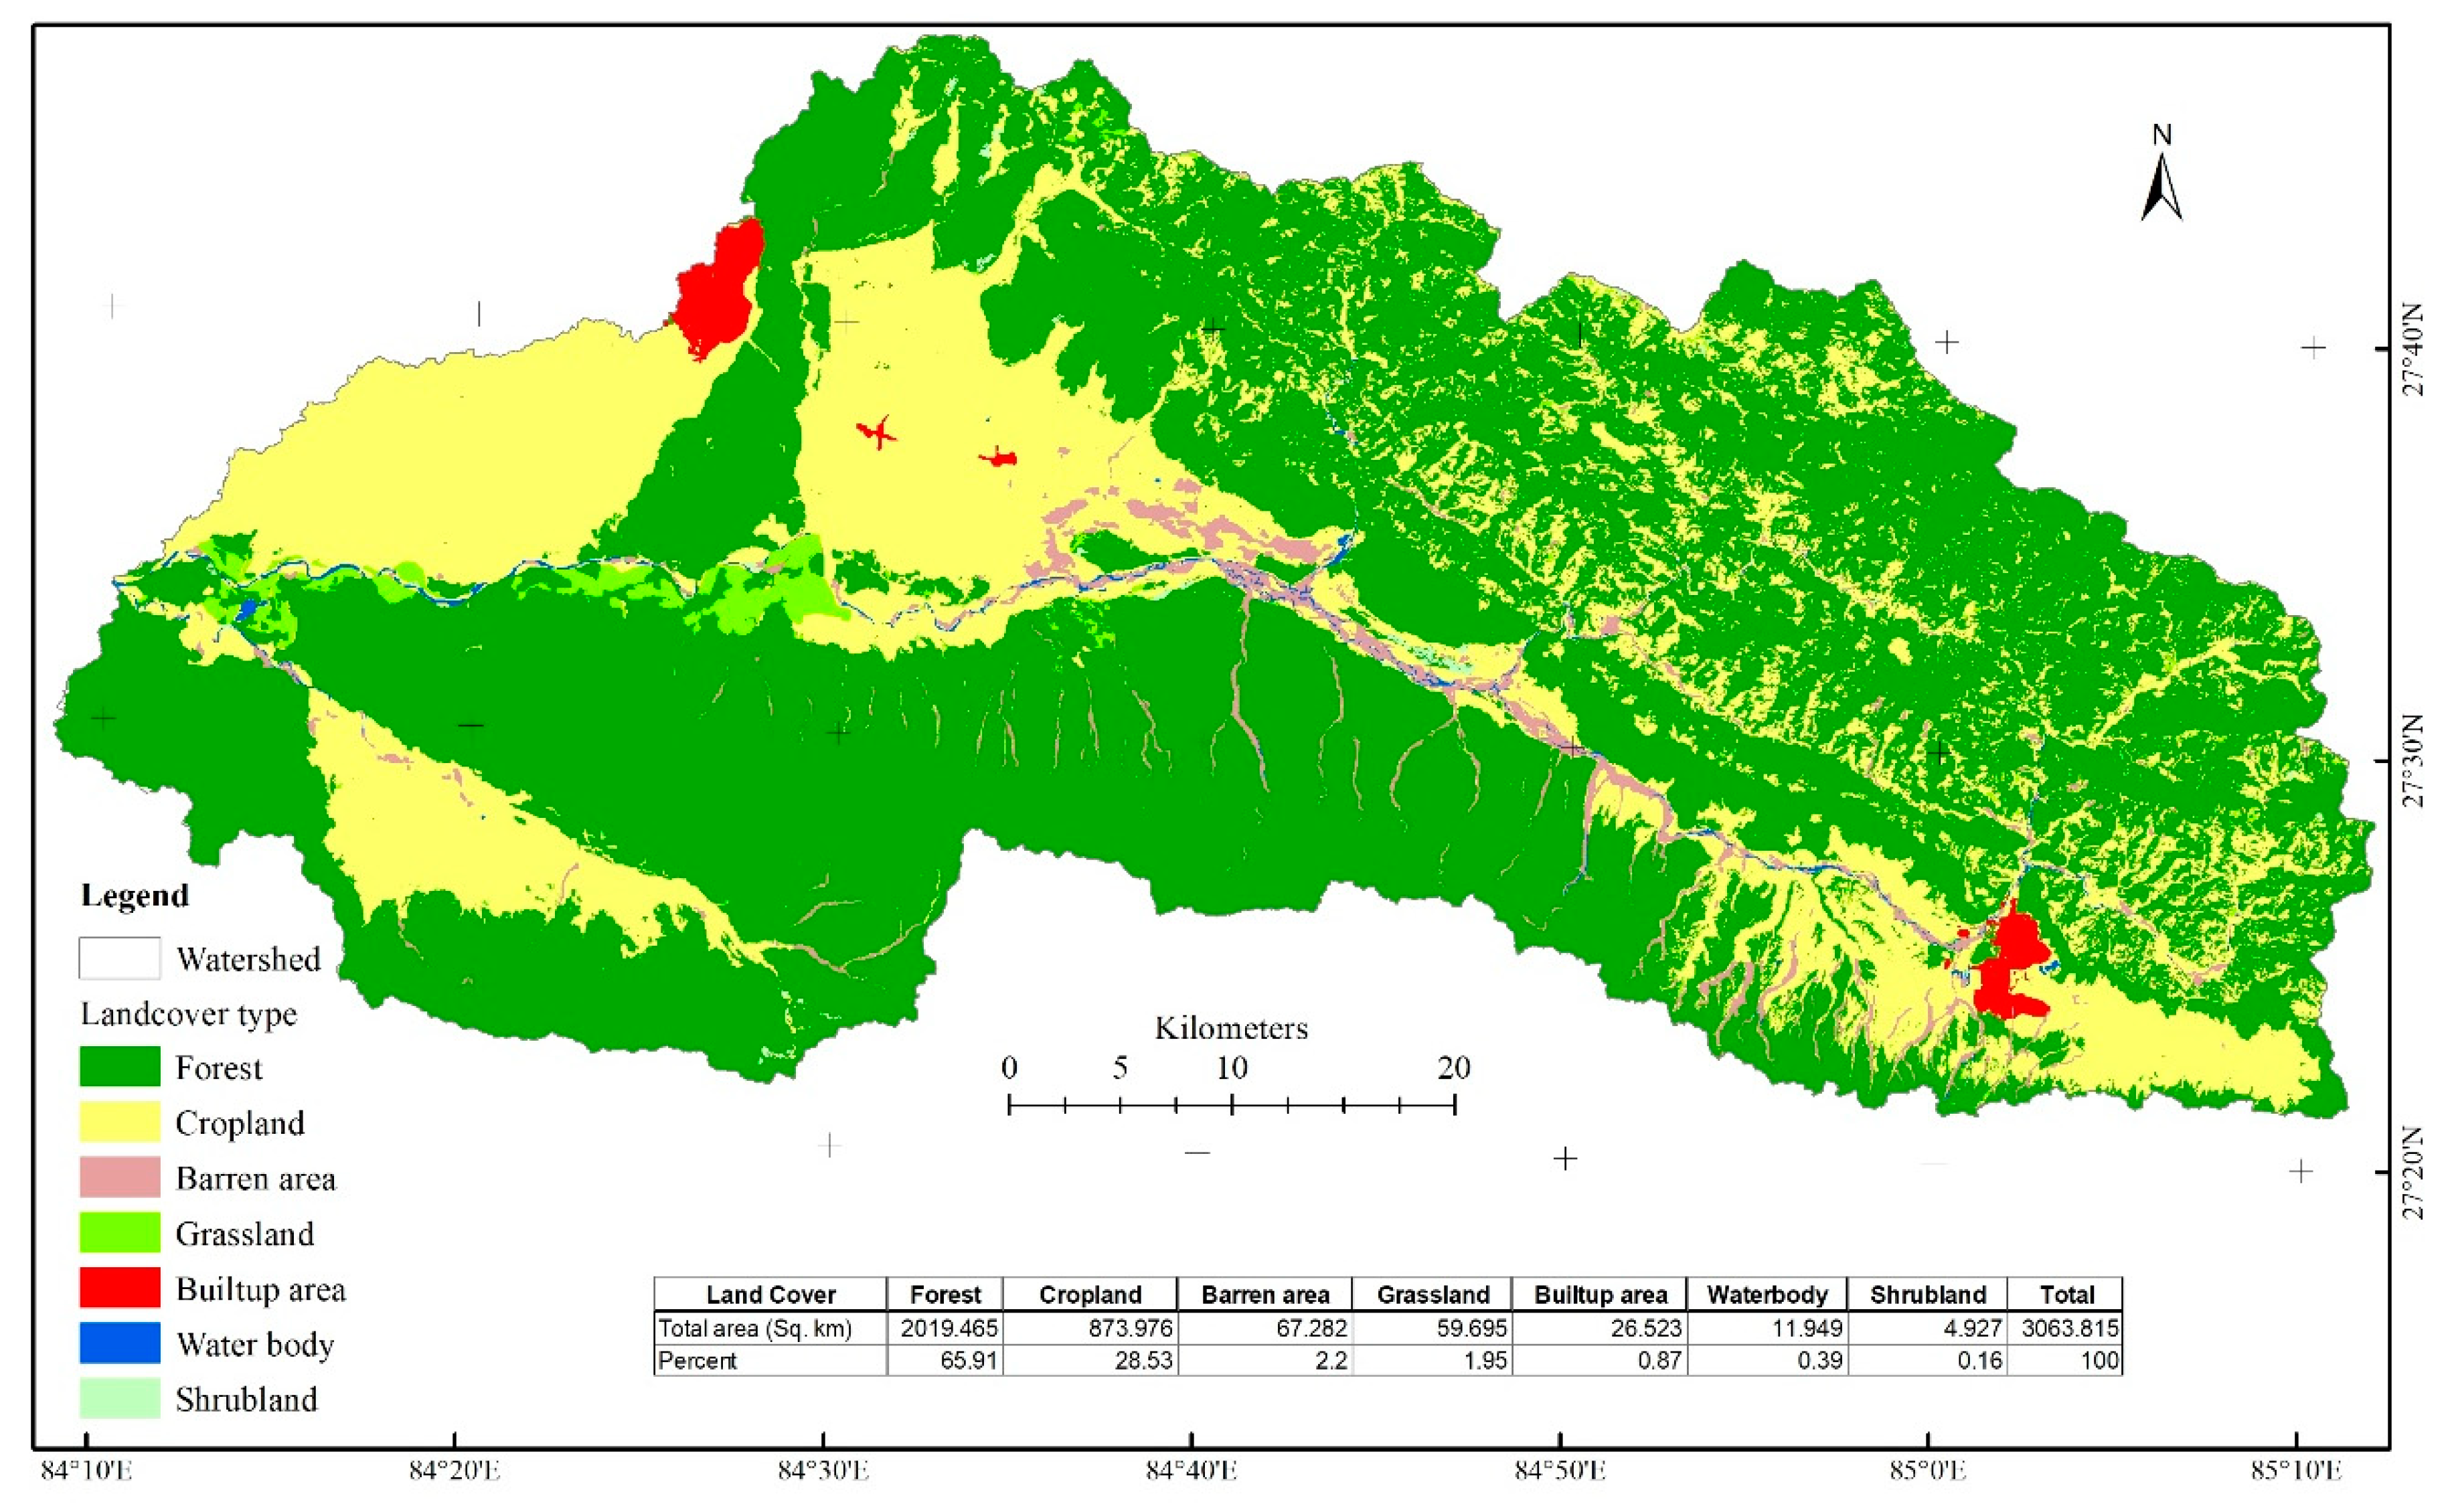
Land Cover Type under Flood Risk Areas
5. Conclusions
Author Contributions
Funding
Acknowledgments
Conflicts of Interest
References
- EM-DAT. The International Disaster Database. Available online: www.emdat.be (accessed on 10 August 2020).
- Antonetti, M.; Horat, C.; Sideris, I.V.; Zappa, M. Ensemble flood forecasting considering dominant runoff processes—Part 1: Set-up and application to nested basins (Emme, Switzerland). Nat. Hazards Earth Syst. Sci. 2019, 19, 19–40. [Google Scholar] [CrossRef] [Green Version]
- Saharia, M.; Kirstetter, P.E.; Vergara, H.; Gourley, J.J.; Hong, Y.; Giroud, M. Mapping flash flood severity in the United States. J. Hydrometeorol. 2017, 18, 397–411. [Google Scholar] [CrossRef]
- Jonkman, S.N. Global perspectives on loss of human life caused by floods. Nat. Hazards 2005, 34, 151–175. [Google Scholar] [CrossRef]
- Gaume, E.; Bain, V.; Bernardara, P.; Newinger, O.; Barbuc, M.; Bateman, A.; Blaškovičová, L.; Blöschl, G.; Borga, M.; Dumitrescu, A.; et al. A compilation of data on European flash floods. J. Hydrol. 2009, 367, 70–78. [Google Scholar] [CrossRef] [Green Version]
- Mignot, E.; Li, X.F.; Dewals, B. Experimental modelling of urban flooding: A review. J. Hydrol. 2019, 568, 334–342. [Google Scholar] [CrossRef] [Green Version]
- Navarro, O.; Restrepo-Ochoa, D.; Munoz-Duque, L.A.; Zapa-Perez, K.; Ameline, A.; Mercier, D.; Fleury-Bahi, G. Determinants of coping strategies in two types of natural hazards: Flash floods and costal flooding. Int. J. Disaster Risk Reduct. 2020, 46, 101514. [Google Scholar] [CrossRef]
- Kastridis, A.; Stathis, D. The Effect of Rainfall Intensity on the Flood Generation of Mountainous Watersheds (Chalkidiki Prefecture, North Greece); Springer: Cham, Switzerland, 2017; pp. 341–347. [Google Scholar]
- Norbiato, D.; Borga, M.; Esposti, S.D.; Gaume, E.; Anquetin, S. Flash flood warning based on rainfall thresholds and soil moisture conditions: An assessment for gauged and ungauged basins. J. Hydrol. 2008, 362, 274–290. [Google Scholar] [CrossRef]
- Collier, C.G. Flash flood forecasting: What are the limits of predictability? Q. J. R. Meteorol. Soc. 2007, 133, 3–23. [Google Scholar] [CrossRef]
- Youssef, A.M.; Pradhan, B.; Hassan, A.M. Flash flood risk estimation along the St. Katherine road, Southern Sinai, Egypt using GIS based morphometry and satellite imagery. Environ. Earth Sci. 2011, 62, 611–623. [Google Scholar] [CrossRef]
- Costache, R.; Pham, Q.B.; Sharifi, E.; Linh, N.T.T.; Abba, S.I.; Vojtek, M.; Vojteková, J.; Nhi, P.T.T.; Khoi, D.N. Flash-flood susceptibility assessment using multi-criteria decision making and machine learning supported by remote sensing and gis techniques. Remote Sens. 2020, 12, 106. [Google Scholar] [CrossRef] [Green Version]
- Diakakis, M.; Andreadakis, E.; Nikolopoulos, E.I.; Spyrou, N.I.; Gogou, M.E.; Deligiannakis, G.; Katsetsiadou, N.K.; Antoniadis, Z.; Melaki, M.; Georgakopoulos, A.; et al. An integrated approach of ground and aerial observations in flash flood disaster investigations. The case of the 2017 Mandra flash flood in Greece. Int. J. Disaster Risk Reduct. 2019, 33, 290–309. [Google Scholar] [CrossRef]
- Costache, R.; Bui, D.T. Identification of areas prone to flash-flood phenomena using multiple-criteria decision-making, bivariate statistics, machine learning and their ensembles. Sci. Total Environ. 2020, 712, 136492. [Google Scholar] [CrossRef] [PubMed]
- WMO. Manual on Flood Forecasting and Warning; World Meteorological Organization (WMO): Geneva, Switzerland, 2011. [Google Scholar]
- Karki, R.; Hasson, S.U.; Schickhoff, U.; Scholten, T.; Böhner, J. Rising precipitation extremes across Nepal. Climate 2017, 5, 4. [Google Scholar] [CrossRef] [Green Version]
- Li, L.L.; Yang, J.T.; Wu, J. Future flood risk assessment under the effects of land use and climate change in the tiaoxi basin. Sensors 2020, 20, 6079. [Google Scholar] [CrossRef]
- Gaume, E.; Borga, M.; Llasat, M.C.; Maouche, S.; Lang, M.; Diakakis, M. Mediterranean Extreme Floods and Flash Floods; Institut de Recherche pour le Développement: Marseille, France, 2016; pp. 133–144. [Google Scholar]
- Adhikari, K.R. Diagnosis of the East Rapti river basin of Nepal. In Integrated Water-Resources Management in a River-Basin Context; International Water Management Institute: Gujarat, India, 2001; p. 57. [Google Scholar]
- Terti, G.; Ruin, I.; Gourley, J.J.; Kirstetter, P.; Flamig, Z.; Blanchet, J.; Arthur, A.; Anquetin, S. Toward probabilistic prediction of flash flood human impacts. Risk Anal. 2019, 39, 140–161. [Google Scholar] [CrossRef] [PubMed]
- Safarina, A.B.; Karnisah, I.; Permana, A.S. Study of the effect of river basin morphology change on threshold parameters in cimahi flood early warning system. In Proceedings of the 11th Aceh International Workshop and Expo on Sustainable Tsunami Disaster Recovery, Banda Aceh, Indonesia, 10–12 October 2018. [Google Scholar]
- Jamshed, A.; Birkmann, J.; McMillan, J.M.; Rana, I.A.; Feldmeyer, D.; Sauter, H. How do rural-urban linkages change after an extreme flood event? Empirical evidence from rural communities in Pakistan. Sci. Total Environ. 2021, 750. [Google Scholar] [CrossRef] [PubMed]
- Zhu, S.N.; Dai, Q.; Zhao, B.R.; Shao, J.Q. Assessment of population exposure to urban flood at the building scale. Water 2020, 12, 3253. [Google Scholar] [CrossRef]
- Faccini, F.; Luino, F.; Paliaga, G.; Sacchini, A.; Turconi, L.; de Jong, C. Role of rainfall intensity and urban sprawl in the 2014 flash flood in Genoa City, Bisagno catchment (Liguria, Italy). Appl. Geogr. 2018, 98, 224–241. [Google Scholar] [CrossRef]
- Widiasari, I.; Nugoho, L.E.; Widyawan, W.; Efendi, R. Context-based hydrology time series data for a flood prediction model using LSTM. In Proceedings of the 5th International Conference on Information Technology, Computer, and Electrical Engineering (Icitacee), Semarang, Indonesia, 27–28 September 2018; pp. 385–390. [Google Scholar]
- Gaume, E.; Borga, M. Post-flood field investigations in upland catchments after major flash floods: Proposal of a methodology and illustrations. J. Flood Risk Manag. 2008, 1, 175–189. [Google Scholar] [CrossRef]
- Di Baldassarre, G.; Nardi, F.; Annis, A.; Odongo, V.; Rusca, M.; Grimaldi, S. Brief communication: Comparing hydrological and hydrogeomorphic paradigms for global flood hazard mapping. Nat. Hazards Earth Syst. Sci. 2020, 20, 1415–1419. [Google Scholar] [CrossRef]
- Manfreda, S.; Leo, M.D.; Sole, A. Detection of flood-prone areas using digital elevation models. J. Hydrol. Eng. 2011, 16, 781–790. [Google Scholar] [CrossRef]
- Petroselli, A.; Vojtek, M.; Vojtekova, J. Flood mapping in small ungauged basins: A comparison of different approaches for two case studies in Slovakia. Hydrol. Res. 2019, 50, 379–392. [Google Scholar] [CrossRef] [Green Version]
- Ahmed, A.; Hewa, G.; Alrajhi, A. Flood susceptibility mapping using a geomorphometric approach in South Australian basins. Nat. Hazards 2021, 106, 629–653. [Google Scholar] [CrossRef]
- Pham, B.T.; Avand, M.; Janizadeh, S.; Phong, T.V.; Al-Ansari, N.; Ho, L.S.; Das, S.; Le, H.V.; Amini, A.; Bozchaloei, S.K. GIS based hybrid computational approaches for flash flood susceptibility assessment. Water 2020, 12, 683. [Google Scholar] [CrossRef] [Green Version]
- Iosub, M.; Minea, I.; Chelariu, O.E.; Ursu, A. Assessment of flash flood susceptibility potential in Moldavian Plain (Romania). J. Flood Risk Manag. 2020. [Google Scholar] [CrossRef]
- Abdelkareem, M. Targeting flash flood potential areas using remotely sensed data and GIS techniques. Nat. Hazards 2017, 85, 19–37. [Google Scholar] [CrossRef]
- Rijal, K.P. Comparative study of flood calculation approaches, a case study of East Rapti River Basin, Nepal. Hydro Nepal J. Water Energy Environ. 2014, 15, 60–64. [Google Scholar] [CrossRef] [Green Version]
- Chalise, S. High mountain hydrology in changing climates: Perspectives from the Hindu Kush-Himalayas. In Developments in Hydrology of Mountain Areas; UNESCO: Paris, France, 1997; pp. 23–31. [Google Scholar]
- Smakhtin, V.U.; Shilpkar, R.L. Planning for Environmental Water Allocations: An Example of Hydrology-Based Assessment in the East Rapti River, Nepal; International Water Management Institute (IWMN): Colombo, Sri Lanka, 2005. [Google Scholar]
- Abdel-Fattah, M.; Saber, M.; Kantoush, S.A.; Khalil, M.F.; Sumi, T.; Sefelnasr, A.M. A hydrological and geomorphometric approach to understanding the generation of wadi flash floods. Water 2017, 9, 553. [Google Scholar] [CrossRef] [Green Version]
- Adan, M.S.G.; Dewan, A.; Zannat, K.E.; Abdullah, A.Y.M. The use of watershed geomorphic data in flash flood susceptibility zoning: A case study of Karnaphuli and Sangu river basin of Bangaladesh. Nat. Hazards 2019, 99, 425–448. [Google Scholar] [CrossRef]
- Hussein, S.; Abdelkareem, M.; Hussein, R.; Askalany, M. Using remote sensing data for predicting potential areas to flash flood hazards and water resources. Remote Sens. Appl. Soc. Environ. 2019, 16, 100254. [Google Scholar] [CrossRef]
- Vuichard, D.; Zimmermann, M. The Langmoche flash-flood, Khumbu Himal, Nepal. Mt. Res. Dev. 1986, 6, 90–94. [Google Scholar] [CrossRef]
- Talchabhadel, R.; Sharma, R. Real time data analysis of west Rapti River Basin of Nepal. J. Geosci. Environ. Prot. 2014, 6, 53–61. [Google Scholar] [CrossRef]
- Sharma, T.P.P.; Zhang, J.H.; Koju, U.A.; Zhang, S.; Bai, Y.; Suwal, M.K. Review of flood disaster studies in Nepal: A remote sensing perspective. Int. J. Disaster Risk Reduct. 2019, 34, 18–27. [Google Scholar] [CrossRef]
- Dhakal, S. Flood hazard in Nepal and new approach of risk reduction. Int. J. Landslide Environ. 2014, 1, 13–14. [Google Scholar]
- Uddin, K.; Shrestha, H.L.; Murthy, M.S.; Bajracharya, B.; Shrestha, B.; Gilani, H.; Pradhan, S.; Dangol, B. Development of 2010 national land cover database for the Nepal. J. Environ. Manag. 2015, 148, 82–90. [Google Scholar] [CrossRef]
- Government of Nepal. National Economic Census 2018 Report; National Planning Commission, Central Bureau of Statistics: Kathmandu, Nepal, 2020; p. 180.
- Shukla, A.; Shivakoti, G.; Poudel, R.; Joshi, N. A process documentation study explaining dynamism in water rights in East Chitwan. In Proceedings of the International Conference, Chitwan, Nepal, 17–21 March 1996. [Google Scholar]
- WHO. WHO Methods and Data Sources for Global Burden of Disease Estimates 2000–2011; World Health Organization (WHO): Geneva, Switzerland, 2013. [Google Scholar]
- Noy, I. A global comprehensive measure of the impact of natural hazards and disasters. Glob. Policy 2016, 7. [Google Scholar] [CrossRef]
- Government of Nepal. Nepal Disaster Risk Reduction Portal; Government of Nepal: Kathmandu, Nepal, 2020; Volume 2020.
- Dewals, B.; Bruwier, M.; Mustafa, A.; Peltier, Y.; Saadi, I.; Archambeau, P.; Erpicum, S.; Orban, P.; Cools, M.; Dassargues, A.; et al. Landuse change and future flood risk: An integrated and multi-scale approach. In Proceedings of the 36th IAHR World Congress, The Hague, The Netherlands, 28 June–3 July 2015; pp. 5105–5116. [Google Scholar]
- Shilpakar, R.L.; Bastiaanssen, W.G.; Molden, D.J. A remote sensing-based approach for water accounting in the East Rapti River Basin, Nepal. Himal. J. Sci. 2011, 7, 15–30. [Google Scholar] [CrossRef] [Green Version]
- Kabenge, M.; Elaru, J.; Wang, H.; Li, F. Characterizing flood hazard risk in data-scarce areas, using a remote sensing and GIS-based flood hazard index. Nat. Hazards 2017, 89, 1369–1387. [Google Scholar] [CrossRef]
- Strahler, A.N. Quantitative analysis of watershed geomorphology. Eos Trans. Am. Geophys. Union 1957, 38, 913–920. [Google Scholar] [CrossRef] [Green Version]
- Schumm, S.A. Evolution of drainage systems and slopes in badlands at Perth AMboy, New Jersey. Geol. Soc. Am. Bull. 1956, 67, 597–646. [Google Scholar] [CrossRef]
- Miller, V.C. Quantitative Geomorphic Study of Drainage Basin Characteristics in the Clinch Mountain Area, Virginia and Tennessee; Columbia University: New York, NY, USA, 1953. [Google Scholar]
- Horton, R.E. Erosional development of streams and their drainage basins: Hydrophysical approach to quantitative morphology. Geol. Soc. Am. Bull. 1945, 56, 275–370. [Google Scholar] [CrossRef] [Green Version]
- Strahler, A.N. Part II. Quantitative geomorphology of drainage basins and channel networks. In Handbook of Applied Hydrology; McGraw-Hill: New York, NY, USA, 1964; pp. 4–39. [Google Scholar]
- Jenks, G.F. The data model concept in statistical mapping. Int. Yearb. Cartogr. 1967, 7, 186–190. [Google Scholar]
- Davis, J.C.; Sampson, R.J. Statistics and Data Analysis in Geology; Wiley: Hoboken, NJ, USA, 1986. [Google Scholar]
- Gregory, K.J.; Walling, D.E. Drainage Basin Form and Process: A Geomorphological Approach; Edward Arnold Publishers Ltd.: London, UK, 1973; p. 456. [Google Scholar]
- Faniran, A. The index of drainage intensity—A provisional new drainage factor. Aust. J. Sci. 1968, 31, 328–330. [Google Scholar]
- Yang, L.; Meng, X.; Zhang, X. SRTM DEM and its application advances. Int. J. Remote Sens. 2011, 32, 3875–3896. [Google Scholar] [CrossRef]
- Ludwig, R.; Mauser, W. Modelling catchment hydrology within a GIS based SVAT-model framework. Hydrol. Earth Syst. Sci. 2000, 4, 239–249. [Google Scholar] [CrossRef] [Green Version]
- Tarboton, D.G. A new method for the determination of flow directions and upslope areas in grid digital elevation models. Water Resour. Res. 1997, 33, 309–319. [Google Scholar] [CrossRef] [Green Version]
- Yuan, F.; Zhang, L.M.; Soe, K.M.W.; Ren, L.L.; Zhao, C.X.; Zhu, Y.H.; Jiang, S.H.; Liu, Y. Applications of TRMM- and GPM-era multiple-satellite precipitation products for flood simulations at sub-daily scales in a sparsely gauged watershed in Myanmar. Remote Sens. 2019, 11, 140. [Google Scholar] [CrossRef] [Green Version]
- Zhao, T.B.; Yatagai, A. Evaluation of TRMM 3B42 product using a new gauge-based analysis of daily precipitation over China. Int. J. Climatol. 2014, 34, 2749–2762. [Google Scholar] [CrossRef]
- Shi, Y.F.; Li, L.; Zhang, L.L. Application and comparing of IDW and Kriging interpolation in spatial rainfall information. In Proceedings of the Geoinformatics 2007: Geospatial Information Science, Nanjing, China, 25–27 May 2007. [Google Scholar] [CrossRef]
- Capolongo, D.; Refice, A.; Bocchiola, D.; D’Addabbo, A.; Vouvalidis, K.; Soncini, A.; Zingaro, M.; Bovenga, F.; Stamatopoulos, L. Coupling multitemporal remote sensing with geomorphology and hydrological modeling for post flood recovery in the Strymonas dammed river basin (Greece). Sci. Total Environ. 2019, 651, 1958–1968. [Google Scholar] [CrossRef]
- Haggett, P.; Chorley, R.J. Network Analysis in Geography; Edward Arnold Publishers Ltd.: London, UK, 1969. [Google Scholar]
- Chorley, R.J.; Malm, D.E.G.; Pogorzelski, H.A. A new standard for estimating drainage basin shape. Am. J. Sci. 1957, 255, 138–141. [Google Scholar] [CrossRef]
- Marafuz, I.; Rodrigues, C.; Gomes, A. Analysis and assessment of urban flash floods on areas with limited available altimetry data (Arouca, NW Portugal): A methodological approach. Environ. Earth Sci. 2015, 73, 2937–2949. [Google Scholar] [CrossRef]
- Kastridis, A.; Stathis, D. Natural and anthropogenic flash flood generation in mountainous watersheds—The case of Apollonia torrent. In Proceedings of the Protection and Restoration of the Environment XI. Water Resources Management, Thessaloniki, Greece, 3–6 July 2012; pp. 126–135. [Google Scholar]


| N | M | L | K | J | I | H | G | F | E | D | C | B | A | |
|---|---|---|---|---|---|---|---|---|---|---|---|---|---|---|
| U | 5 | 5 | 5 | 5 | 5 | 5 | 5 | 6 | 6 | 5 | 7 | 6 | 7 | 5 |
| Nu | 130 | 157 | 220 | 203 | 228 | 250 | 215 | 250 | 269 | 338 | 427 | 490 | 768 | 745 |
| Lu | 108.33 | 129.06 | 191.34 | 160.74 | 201.19 | 252.71 | 190.88 | 194.8 | 255.04 | 291.8 | 478.9 | 478.31 | 689.42 | 687.68 |
| Lb | 12.38 | 16.18 | 20.41 | 20.54 | 23.48 | 21.95 | 22.88 | 20.09 | 22.18 | 20.18 | 28.62 | 35.89 | 29.17 | 40.36 |
| Wb | 13.51 | 11.49 | 8.99 | 8.47 | 10.61 | 11.33 | 10.27 | 14.2 | 10.34 | 22.58 | 18.41 | 12.28 | 19.64 | 14.74 |
| A | 97.86 | 115.74 | 124.96 | 131.97 | 133.92 | 159.58 | 172.27 | 173.76 | 181.73 | 247.58 | 303.74 | 341.51 | 416.94 | 462.95 |
| C | 0.903 | 0.897 | 0.653 | 0.821 | 0.666 | 0.631 | 0.903 | 0.892 | 0.713 | 0.848 | 0.634 | 0.714 | 0.605 | 0.673 |
| P | 54.65 | 52.39 | 78.61 | 72.32 | 101.84 | 80.02 | 76.03 | 78.26 | 86.54 | 103 | 105.27 | 120.36 | 144.9 | 144.72 |
| Rb | 4.02 | 5.42 | 4.38 | 4.52 | 4.52 | 4.54 | 4.34 | 4.57 | 4.48 | 4.84 | 4.16 | 5.35 | 5.46 | 5.44 |
| Rf | 0.639 | 0.442 | 0.3 | 0.313 | 0.243 | 0.331 | 0.329 | 0.431 | 0.369 | 0.608 | 0.371 | 0.265 | 0.49 | 0.284 |
| Le | 0.902 | 0.75 | 0.618 | 0.631 | 0.556 | 0.649 | 0.647 | 0.74 | 0.686 | 0.88 | 0.687 | 0.581 | 0.79 | 0.602 |
| T | 1.189 | 1.508 | 1.399 | 1.41 | 1.129 | 1.562 | 1.407 | 1.597 | 1.56 | 1.65 | 2.014 | 2.036 | 2.643 | 2.577 |
| Rc | 0.412 | 0.53 | 0.254 | 0.317 | 0.162 | 0.313 | 0.374 | 0.357 | 0.305 | 0.293 | 0.344 | 0.296 | 0.25 | 0.278 |
| Fs | 0.889 | 0.855 | 1.152 | 0.977 | 1.105 | 0.99 | 0.824 | 0.898 | 0.968 | 0.852 | 0.886 | 0.89 | 1.137 | 1.045 |
| Dd | 1.107 | 1.115 | 1.531 | 1.218 | 1.502 | 1.584 | 1.108 | 1.121 | 1.403 | 1.179 | 1.577 | 1.401 | 1.654 | 1.485 |
| If | 0.984 | 0.954 | 1.765 | 1.191 | 1.66 | 1.568 | 0.913 | 1.007 | 1.359 | 1.004 | 1.396 | 1.247 | 1.88 | 1.553 |
| Lg | 0.452 | 0.448 | 0.327 | 0.411 | 0.333 | 0.316 | 0.451 | 0.446 | 0.356 | 0.424 | 0.317 | 0.357 | 0.302 | 0.337 |
| Bh | 1.96 | 2 | 0.75 | 2.08 | 1.1 | 1.15 | 2.03 | 1.84 | 1.75 | 1.81 | 0.56 | 0.88 | 0.59 | 0.74 |
| Rh | 0.158 | 0.124 | 0.037 | 0.101 | 0.047 | 0.052 | 0.089 | 0.092 | 0.079 | 0.09 | 0.02 | 0.025 | 0.02 | 0.018 |
| Rn | 2.17 | 2.23 | 1.148 | 2.533 | 1.653 | 1.821 | 2.249 | 2.063 | 2.456 | 2.133 | 0.883 | 1.233 | 0.976 | 1.099 |
| Factor | Class | Weight | Factor | Class | Weight |
|---|---|---|---|---|---|
| (A) Roughness number (Rn) | 0.880–0.980 | 1 | (G) Form factor (Rf) | 0.240–0.280 | 1 |
| 0.981–1.230 | 2 | 0.281–0.330 | 2 | ||
| 1.231–1.820 | 3 | 0.331–0.370 | 3 | ||
| 1.821–2.250 | 4 | 0.371–0.490 | 4 | ||
| 2.250–2.530 | 5 | 0.491–0.640 | 5 | ||
| (B) Relief ratio (Rh) | 0.020 | 1 | (H) Infiltration number (If) | 0.913–0.953 | 1 |
| 0.021–0.040 | 2 | 0.954–1.006 | 2 | ||
| 0.041–0.050 | 3 | 1.007–1.396 | 3 | ||
| 0.051–0.120 | 4 | 1.397–1.660 | 4 | ||
| 0.121–0.160 | 5 | 1.661–1.879 | 5 | ||
| (C) Basin height (Bh) | 0.560–0.590 | 1 | (I) Stream frequency (Fs) | 0.824–0.855 | 1 |
| 0.591–0.880 | 2 | 0.856–0.890 | 2 | ||
| 0.881–1.150 | 3 | 0.891–0.897 | 3 | ||
| 1.151–1.840 | 4 | 0.898–1.045 | 4 | ||
| 1.841–2.080 | 5 | 1.046–1.152 | 5 | ||
| (D) Bifurcation ratio (Rb) | 4.020–4.160 | 5 | (J) Circulatory ratio (Rc) | 0.160 | 1 |
| 4.161–4.380 | 4 | 0.161–0.280 | 2 | ||
| 4.381–4.570 | 3 | 0.281–0.340 | 3 | ||
| 4.571–4.840 | 2 | 0.341–0.410 | 4 | ||
| 4.841–5.460 | 1 | 0.411–0.530 | 5 | ||
| (E) Length of overland flow (Lg) | 0.300 | 5 | (K) Texture ratio (T) | 1.130–1.190 | 1 |
| 0.301–0.340 | 4 | 1.191–1.410 | 2 | ||
| 0.341–0.360 | 3 | 1.411–1.650 | 3 | ||
| 0.361–0.420 | 2 | 1.651–2.040 | 4 | ||
| 0.421–0.450 | 1 | 2.041–2.640 | 5 | ||
| (F) Drainage Density (Dd) | 1.110–1.120 | 1 | (L) Elongation ratio (Le) | 0.556–0.581 | 1 |
| 1.121–1.220 | 2 | 0.582–0.631 | 2 | ||
| 1.221–1.400 | 3 | 0.632–0.687 | 3 | ||
| 1.401–1.530 | 4 | 0.688–0.790 | 4 | ||
| 1.531–1.650 | 5 | 0.791–0.902 | 5 |
| Rb | Rf | Le | T | Rc | Fs | Dd | If | Lg | Bh | Rh | Rn | Sum | Degree | |
|---|---|---|---|---|---|---|---|---|---|---|---|---|---|---|
| N | 5.000 | 4.995 | 5.000 | 1.159 | 3.714 | 1.789 | 1.000 | 1.293 | 1.000 | 4.684 | 5.009 | 4.119 | 38.763 | 5 |
| M | 1.111 | 3.011 | 3.248 | 2.001 | 5.000 | 1.379 | 1.059 | 1.168 | 1.088 | 4.789 | 4.017 | 4.266 | 32.137 | 3 |
| L | 4.000 | 1.576 | 1.716 | 1.714 | 1.999 | 5.000 | 4.105 | 4.523 | 4.353 | 1.500 | 1.536 | 1.643 | 33.664 | 4 |
| K | 3.611 | 1.705 | 1.868 | 1.743 | 2.684 | 2.868 | 1.812 | 2.147 | 2.103 | 5.000 | 3.379 | 5.001 | 33.922 | 4 |
| J | 3.611 | 0.999 | 1.000 | 1.000 | 1.000 | 4.424 | 3.893 | 4.091 | 4.185 | 2.421 | 1.824 | 2.866 | 31.314 | 3 |
| I | 3.556 | 1.891 | 2.080 | 2.144 | 2.642 | 3.022 | 4.488 | 3.709 | 4.642 | 2.553 | 1.983 | 3.274 | 35.983 | 5 |
| H | 4.111 | 1.869 | 2.055 | 1.735 | 3.309 | 1.000 | 1.008 | 1.000 | 1.011 | 4.868 | 3.021 | 4.312 | 29.300 | 2 |
| G | 3.472 | 2.894 | 3.133 | 2.237 | 3.114 | 1.896 | 1.103 | 1.386 | 1.152 | 4.368 | 3.103 | 3.860 | 31.717 | 4 |
| F | 3.722 | 2.277 | 2.501 | 2.138 | 2.552 | 2.758 | 3.169 | 2.845 | 3.556 | 4.132 | 2.740 | 4.813 | 37.204 | 5 |
| E | 2.722 | 4.686 | 4.747 | 2.377 | 2.425 | 1.341 | 1.524 | 1.377 | 1.735 | 4.289 | 3.048 | 4.031 | 34.305 | 4 |
| D | 4.611 | 2.291 | 2.516 | 3.337 | 2.982 | 1.748 | 4.438 | 2.999 | 4.605 | 1.000 | 1.045 | 1.000 | 32.572 | 3 |
| C | 1.306 | 1.224 | 1.288 | 3.395 | 2.458 | 1.803 | 3.149 | 2.380 | 3.537 | 1.842 | 1.186 | 1.847 | 25.414 | 1 |
| B | 1.000 | 3.495 | 5.000 | 1.159 | 3.714 | 4.811 | 5.000 | 5.000 | 5.000 | 1.079 | 1.064 | 1.224 | 38.328 | 5 |
| A | 1.056 | 1.416 | 3.248 | 2.001 | 5.000 | 3.697 | 3.770 | 3.647 | 4.083 | 1.474 | 1.010 | 1.524 | 30.285 | 3 |
| Land Use Type | High | % | Medium | % | Less | % | Not Affected | % | Grand Total | % |
|---|---|---|---|---|---|---|---|---|---|---|
| Built up area | 0.000 | 0.00 | 0.023 | 0.09 | 1.453 | 5.48 | 25.047 | 94.43 | 26.523 | 0.87 |
| Agriculture land | 11.298 | 1.29 | 51.400 | 5.88 | 147.066 | 16.83 | 665.133 | 76.10 | 873.976 | 28.53 |
| Grassland | 1.018 | 1.71 | 4.399 | 7.37 | 11.799 | 19.76 | 42.478 | 71.16 | 59.695 | 1.95 |
| Barren land | 0.225 | 0.33 | 1.750 | 2.60 | 12.051 | 17.91 | 53.256 | 79.15 | 67.282 | 2.20 |
| Shrubland | 0.075 | 1.53 | 0.100 | 2.04 | 1.234 | 25.05 | 3.517 | 71.39 | 4.927 | 0.16 |
| Forest | 64.154 | 3.18 | 247.586 | 12.26 | 758.176 | 37.54 | 949.548 | 47.02 | 2019.465 | 65.91 |
| Water body | 0.114 | 0.96 | 0.549 | 4.59 | 1.830 | 15.31 | 9.456 | 79.14 | 11.949 | 0.39 |
| Total | 76.885 | 2.53 | 305.785 | 10.07 | 932.155 | 30.69 | 1723.389 | 56.74 | 3037.292 | 100.00 |
Publisher’s Note: MDPI stays neutral with regard to jurisdictional claims in published maps and institutional affiliations. |
© 2021 by the authors. Licensee MDPI, Basel, Switzerland. This article is an open access article distributed under the terms and conditions of the Creative Commons Attribution (CC BY) license (https://creativecommons.org/licenses/by/4.0/).
Share and Cite
Pangali Sharma, T.P.; Zhang, J.; Khanal, N.R.; Prodhan, F.A.; Nanzad, L.; Zhang, D.; Nepal, P. A Geomorphic Approach for Identifying Flash Flood Potential Areas in the East Rapti River Basin of Nepal. ISPRS Int. J. Geo-Inf. 2021, 10, 247. https://0-doi-org.brum.beds.ac.uk/10.3390/ijgi10040247
Pangali Sharma TP, Zhang J, Khanal NR, Prodhan FA, Nanzad L, Zhang D, Nepal P. A Geomorphic Approach for Identifying Flash Flood Potential Areas in the East Rapti River Basin of Nepal. ISPRS International Journal of Geo-Information. 2021; 10(4):247. https://0-doi-org.brum.beds.ac.uk/10.3390/ijgi10040247
Chicago/Turabian StylePangali Sharma, Til Prasad, Jiahua Zhang, Narendra Raj Khanal, Foyez Ahmed Prodhan, Lkhagvadorj Nanzad, Da Zhang, and Pashupati Nepal. 2021. "A Geomorphic Approach for Identifying Flash Flood Potential Areas in the East Rapti River Basin of Nepal" ISPRS International Journal of Geo-Information 10, no. 4: 247. https://0-doi-org.brum.beds.ac.uk/10.3390/ijgi10040247