Article

Structure-Level 3D Building Model Encoding Method for Progressive Transmission

1
Jiangsu Provincial Key Laboratory of Geographic Information Science and Technology, Key Laboratory for Land Satellite Remote Sensing Applications of Ministry of Natural Resources, School of Geography and Ocean Science, Nanjing University, Nanjing 210023, China
2
Jiangsu Center for Collaborative Innovation in Novel Software Technology and Industrialization, Nanjing University, Nanjing 210023, China
*
Author to whom correspondence should be addressed.
ISPRS Int. J. Geo-Inf. 2021, 10(5), 306; https://0-doi-org.brum.beds.ac.uk/10.3390/ijgi10050306
Submission received: 7 April 2021 / Revised: 26 April 2021 / Accepted: 2 May 2021 / Published: 6 May 2021

Abstract

:
Progressive encoding and transmission, i.e., a crucial technical foundation of 3D Web Geographic Information Systems (WebGIS), addresses the contradiction between massive 3D building data and limited network transmission capacity. Most progressive encoding algorithms, taking vertices, edges or triangles as encoding units, may break the inherent geometric and topological characteristics of 3D building models. Thus, a novel 3D building model encoding method that can maintain the internal characteristics is proposed, which can be used for high-efficiency progressive transmission. With this method, each building is decomposed into three types of fundamental structures: main structure, independent structure and attached structure. A structural topology graph (STG) was constructed based on the connections among structures. Guided by STG, one or more structures were wrapped as the smallest incremental transmission unit, denoted as transmission node. When requested, the real-time position of viewpoint, orientation and visual importance of nodes are used to pick up expected nodes for responding. The results confirm that the proposed method can better maintain the geometric and topological characteristics while encoding 3D building models. While serving for transmission, the proposed method not only effectively reduces the transmission load, but also provides users with a better consistency experience on the building appearance at different simplification levels.

1. Introduction

The 3D building model, which is widely used in 3D navigation and digital cities, is essential to the virtual geographic environment [1]. 3D building models have substantial data because of their rich details. Massive building model data not only impose a heavy load on network transmission but also pose a huge challenge to client rendering [2]. In order to meet the needs of real-time interaction, level of details (LOD) [3] is proposed. However, because no correlations exist among the models at different levels, a lot of data is repeatedly transmitted, greatly wasting network transmission resources.
To address the contradiction between massive model data and limited network transmission capacity, a progressive encoding and transmission strategy has been developed [4,5,6,7]. The prerequisite of progressive transmission is to simplify a 3D model into a basic model with many increments. During the transmission, the basic model is first transmitted, and then increments are transmitted progressively to refine the model on demand or in a fixed order, which significantly reduces data redundancy among a series of transmissions [8]. Progressive Mesh (PM), the most widely used algorithm proposed by Hoppe in 1996 [9,10], can progressively encode large-scale free-form 3D surface models into multi-resolution models very well. However, 3D building models have much stricter geometric constraints on the mesh, such as parallel, perpendicular, coplanar, etc., which are quite different from the free-form surface models. Several components, as parts of 3D building models, combined through various connections, can lead to complex internal topological relationships [11]. Many existing algorithms, e.g., PM, taking vertices, edges or triangles as progressive encoding increments, may break the inherent constraints inside the building model, leading to unreal appearance deformation.
For example, Figure 1a depicts that the vertical relationship between the window frame and the wall is broken. In addition, in Figure 1b, the support plate under the water tower is oversimplified, causing the water tower to be suspended in the air, distorting the spatial relationship between the support plate, water tower and pillars. Notably, there are severe defects for the traditional encoding methods to be directly applied to the 3D building models. However, there has been little research on progressive encoding and transmission that maintain internal characteristics of the building with complex components.
This study explores a novel 3D building model encoding method that can maintain the internal geometric and topological characteristics and be used for high-efficiency progressive transmission. With this method, each building model is decomposed into three types of structures: main structure, independent structure and attached structure. Using the connection relationship of these structures, one or more structures are wrapped as the smallest incremental transmission unit, denoted as the transmission node. Based on the real-time position of viewpoint and attributes of nodes, expected nodes are dynamically picked up and responded to the client for model refinement. The results confirm that the proposed method can better maintain the geometric and topological characteristics while encoding 3D building models. In addition, when serving for the transmission, the real-time network load is significantly reduced.

2. Related Work

2.1. Structure Recognition

A structure is a vital feature of building models, which reflects the design process and design rules of building models. In addition, it affects the recognition of the model by humans [12]. Sakurai et al. [13] indicated that a structure is a single face or a set of connected faces with certain characteristic combinations of topology and geometry. The main task of structural recognition is to identify these faces. Presently, researchers in computer-aided design have conducted extensive research on structural feature recognition. Among them, the graph-based method has become one of the main streams after years of research [14]. Joshi et al. [15] proposed a feature recognition algorithm based on the attribute adjacency graph (AAG). This algorithm pre-defined a series of rules and effectively extracted holes, steps and other structures in the solid model. Gao and Shah [16] combined aspects of graph-based and hint-based feature recognition with delta volume decomposition, added attributes to the face based on AAG and proposed an extended adjacent attribute graph (EAAG), which can effectively extract interactive feature structures. Notably, graph-based algorithms can effectively extract various structures of the model, but further research is required in sub-graph matching efficiency, processing and recognition of complex features [17].
In addition, artificial neural networks (ANNs) have been used in structural feature recognition. Jun and Raja [18] extracted geometric attributes from the scan points of the model, including concave/convex and open/closed attributes. Using these attributes as the input to the ANN module can effectively identify prismatic part machining features. Notably, ANNs (1) can learn and induce, (2) have a high tolerance for input errors and (3) can flexibly identify new feature types [19]. However, using ANNs to identify structures from complex componentized buildings requires further exploration.
To recognize building structures, Li et al. [20] divided the geometric structures of building models into three categories: embedded structures, compositional structures and connecting structures. Then, EAAG was used to extract these structures, and a robust scheme with progressive simplification was proposed. Thiemann and Sester [21] improved the polyhedral segmentation algorithm proposed by Ribelles et al. [22]. In particular, they used planes to segment buildings to obtain structures and used a cell model to represent the topological adjacency of the structure. Kada [23] defined a set of extraction rules based on the angle relationship of the face, which can effectively identify the extrusion, notch and tip of the building. The aforementioned structure identification methods are mostly used to generate a higher-quality LOD model by reducing structures. However, there has been little research on extracting structure for progressive transmission. To extract structure for progressive transmission, the proposed method uses the mesh segmentation method and the graph-based method to extract the structure in the building.

2.2. Progressive Encoding and Transmission
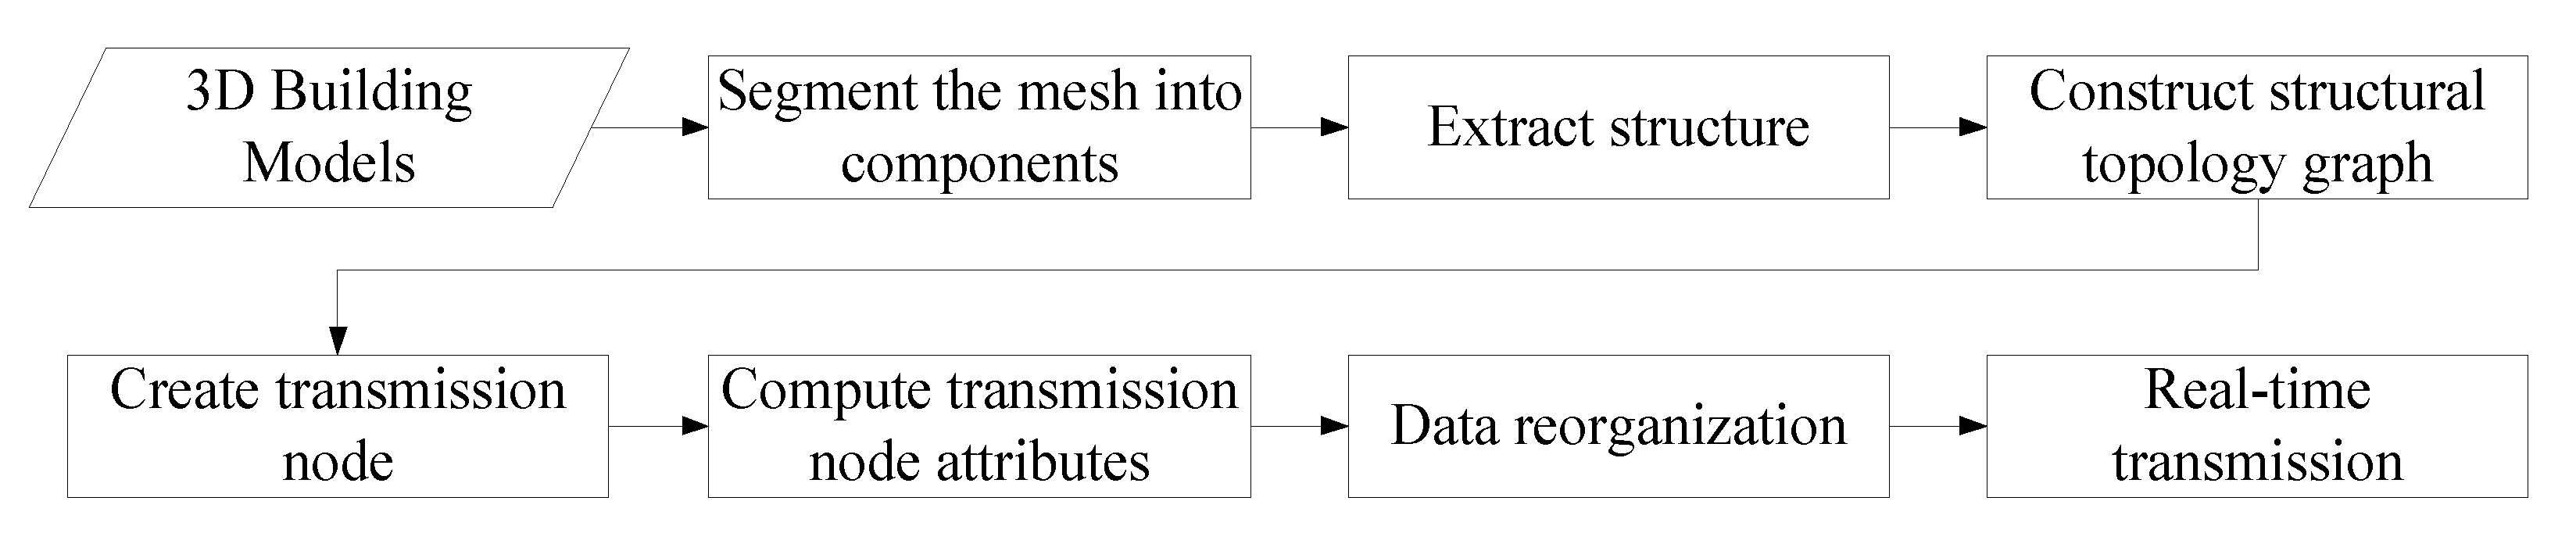
To address the shortcomings of data redundancy in discrete LOD, researchers in computer graphics have proposed numerous progressive encoding methods for 3D models. The key task of progressive coding is to progressively simplify 3D models and encode simplified data. Hoppe [9] proposed a progressive mesh, which divided the complex 3D model into a basic mesh representing the lowest resolution model and mesh increments. With the continuous transmission of mesh increments, the mesh resolution is also increased. To this end, Popović and Hoppe [24] further improved the fidelity of the model in the encoding process by allowing the topological relationship to be changed. Hoppe [25] reduced the rendering and transmission pressures by changing the viewpoint parameters to selectively refine the progressive mesh. This type of algorithm is often applied to continuous surfaces, such as terrain, and has achieved good results. Most of these algorithms use geometric primitives, such as vertices, edges and triangles, as the encoding units. The aforementioned progressive mesh series algorithm simplified models based on the edge collapse operation, which recorded the sequence of the edge collapse operation as the increment unit. In addition, Chen et al. [6] simplified models based on the vertex clustering algorithm and realized the progressive visualization of complex 3D models by using vertex data as the encoding units. Hou and Liu [26] used a half-edge structure to store models and redesigned the weight computing method of Garland’s QEM (Quadric Error Metrics) algorithm [27] based on the importance degree of the vertex, which can promptly generate progressive meshes. However, these methods do not consider the geometric and topological constraints of the building and breaking these constraints will cause a severe appearance impact and cognitive ambiguity. Therefore, a progressive encoding method, specifically for buildings, should be explored.
Regarding the progressive encoding of building models, Kada [28] presented a progressive encoding and transmission scheme for 3D building models. This scheme is based on string grammars that generate string representations of planar half-space models, which can progressively transmit building models with simple structures. However, this method cannot be used to encode complex building models. To better describe the spatial composition of each building model and the relationship among different building models, Sun [29] constructed a multilevel semantic model, which can better guide the transmission of building models based on semantic conditions. From the perspective of structural cognition, Sun [12] performed multi-resolution data organization and expression on 3D building models based on detailed structure removal. The appearance of the model can still be maintained at different resolutions. Since this algorithm needs to construct a face connection relationship, it is challenging to apply it to componentized buildings.
In essence, when the progressive encoding algorithm for the free-form surface model is directly applied to building models, the geometric and topological constraints of the building will be very easily broken. While used for building models with complex components, existing progressive encoding algorithms face many difficulties and result in some unreasonable effects. Thus, this study aims to maintain the internal geometric and topological characteristics of building models while progressively encoding and transmitting the building models.

3. Methodology

The algorithm flow is illustrated in Figure 2. First, we segment the mesh of the building models into components, from which we extract structures and construct a structural topology graph. Then, one or more structures are wrapped in the transmission node. Next, the attributes of these nodes used for transmission are computed, and finally, data of these nodes are reorganized according to the attributes to store them in the server for progressive transmission.

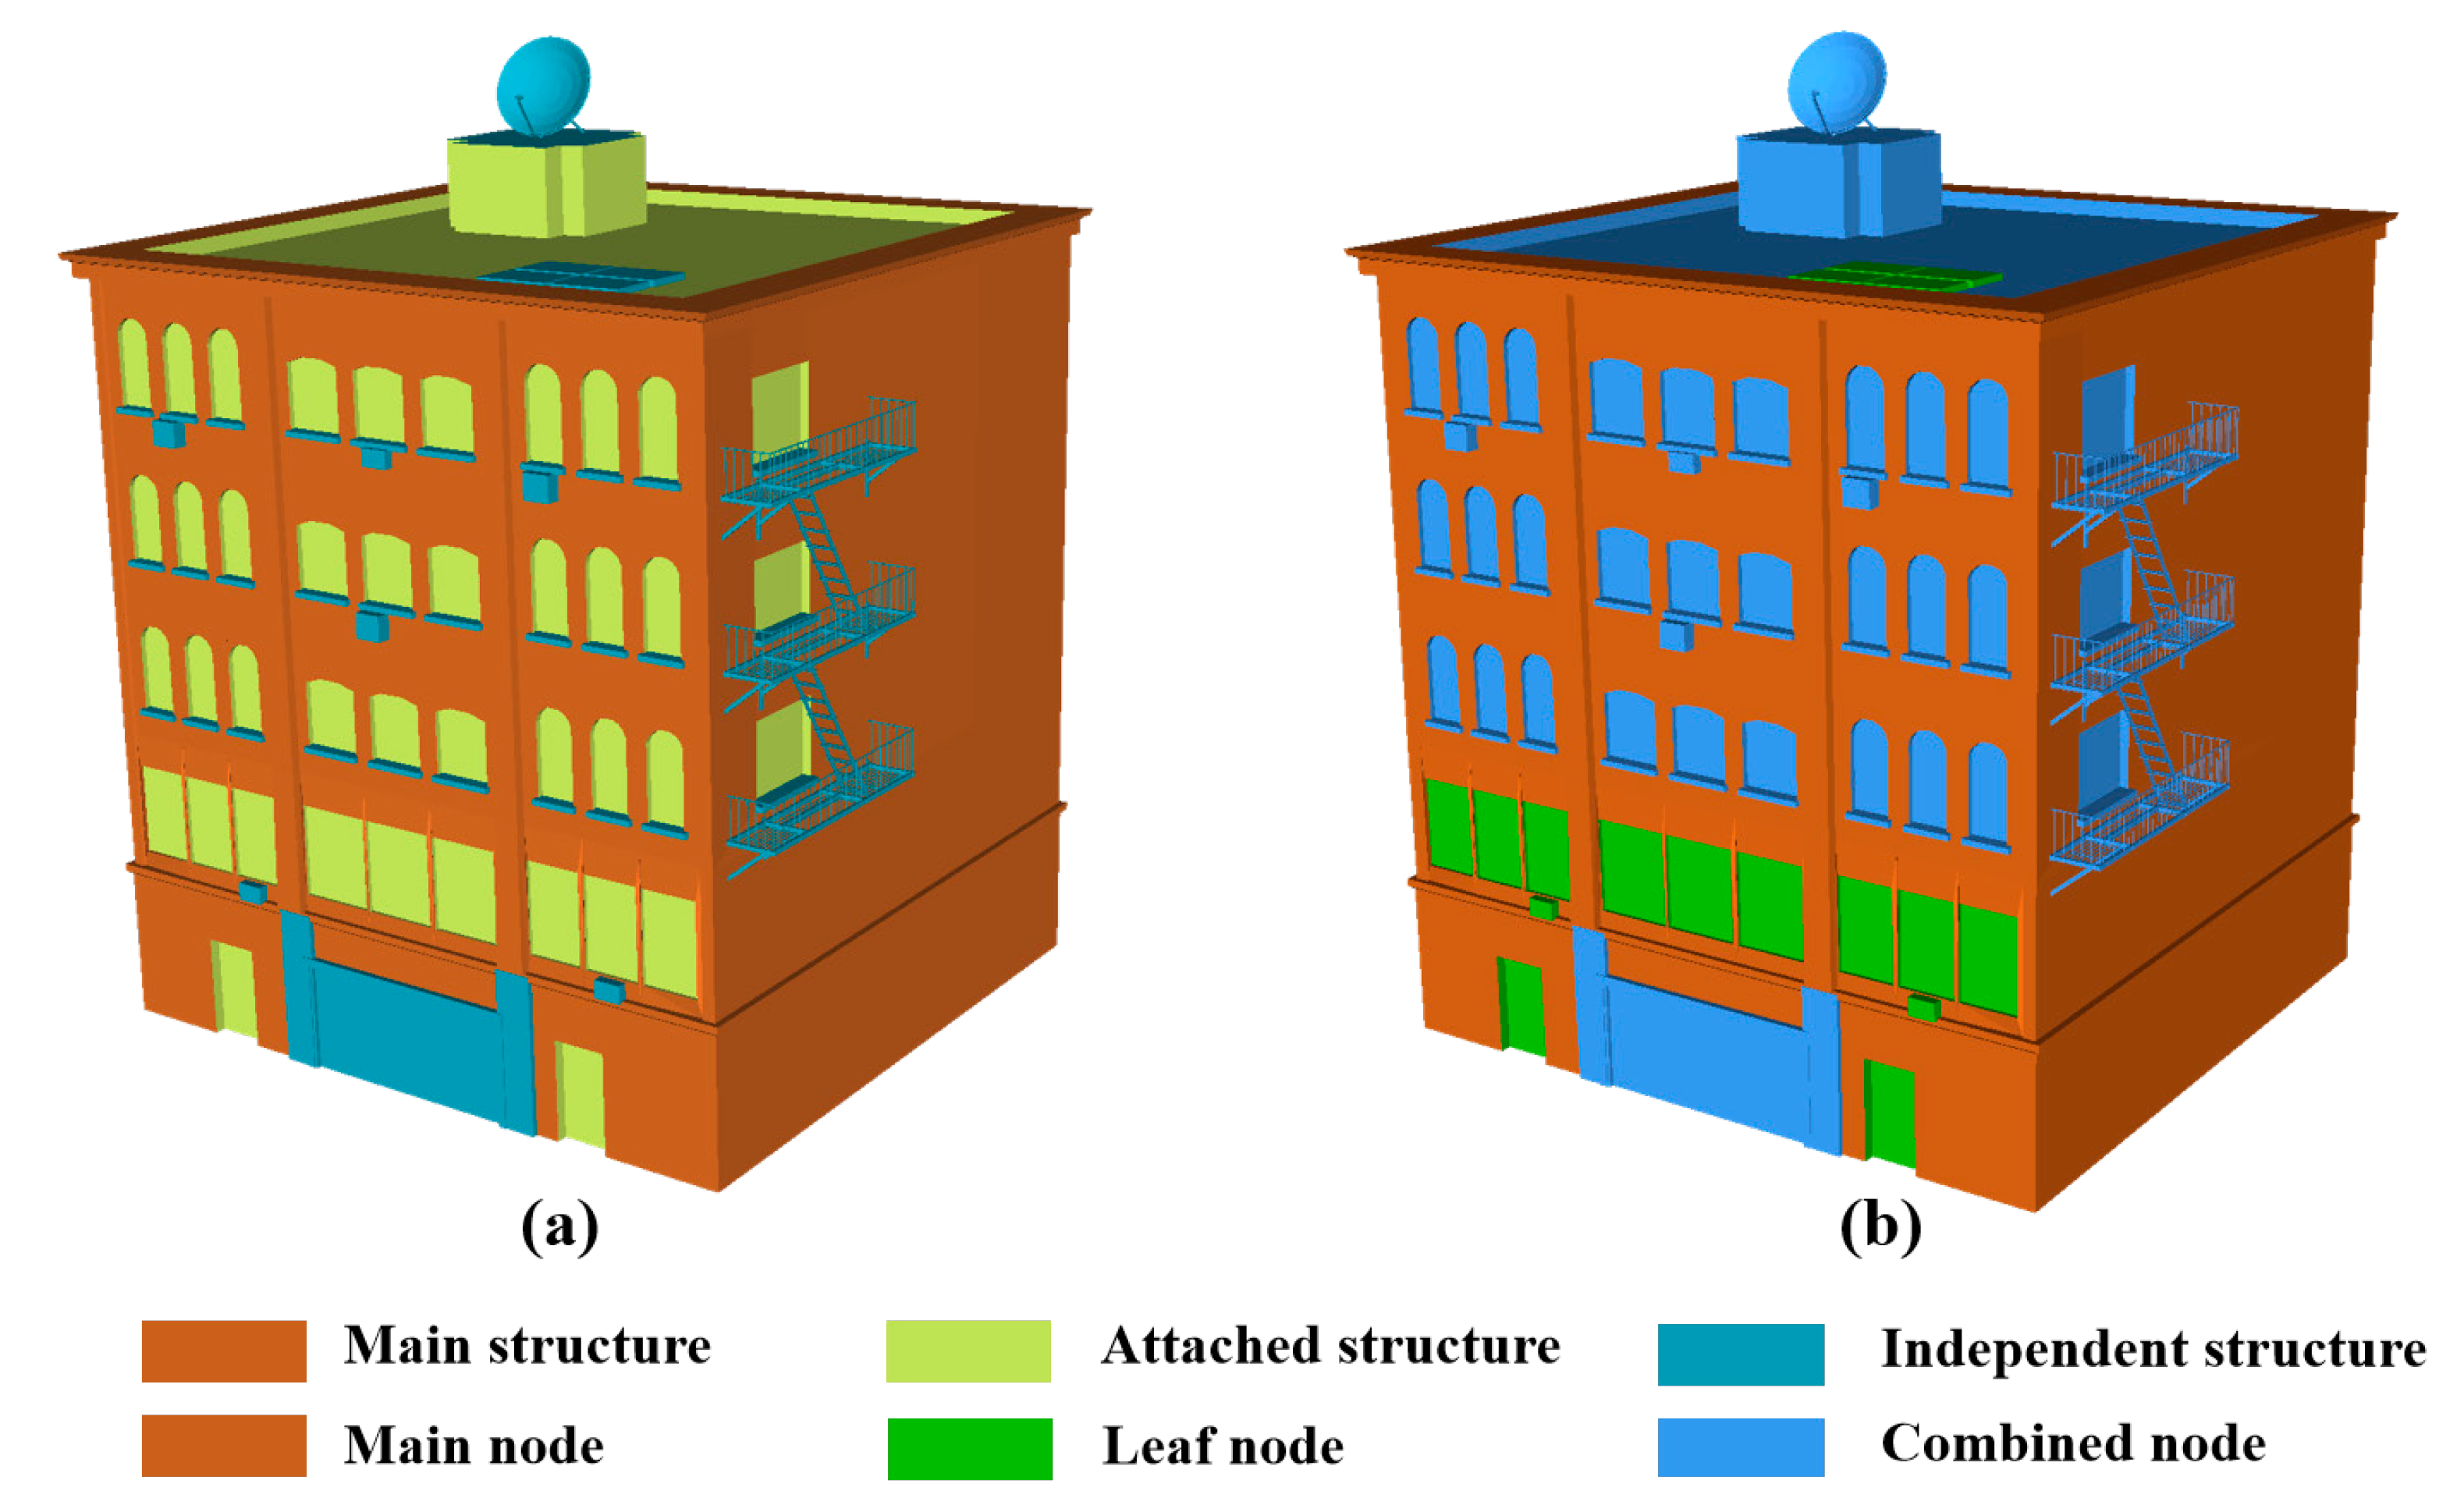
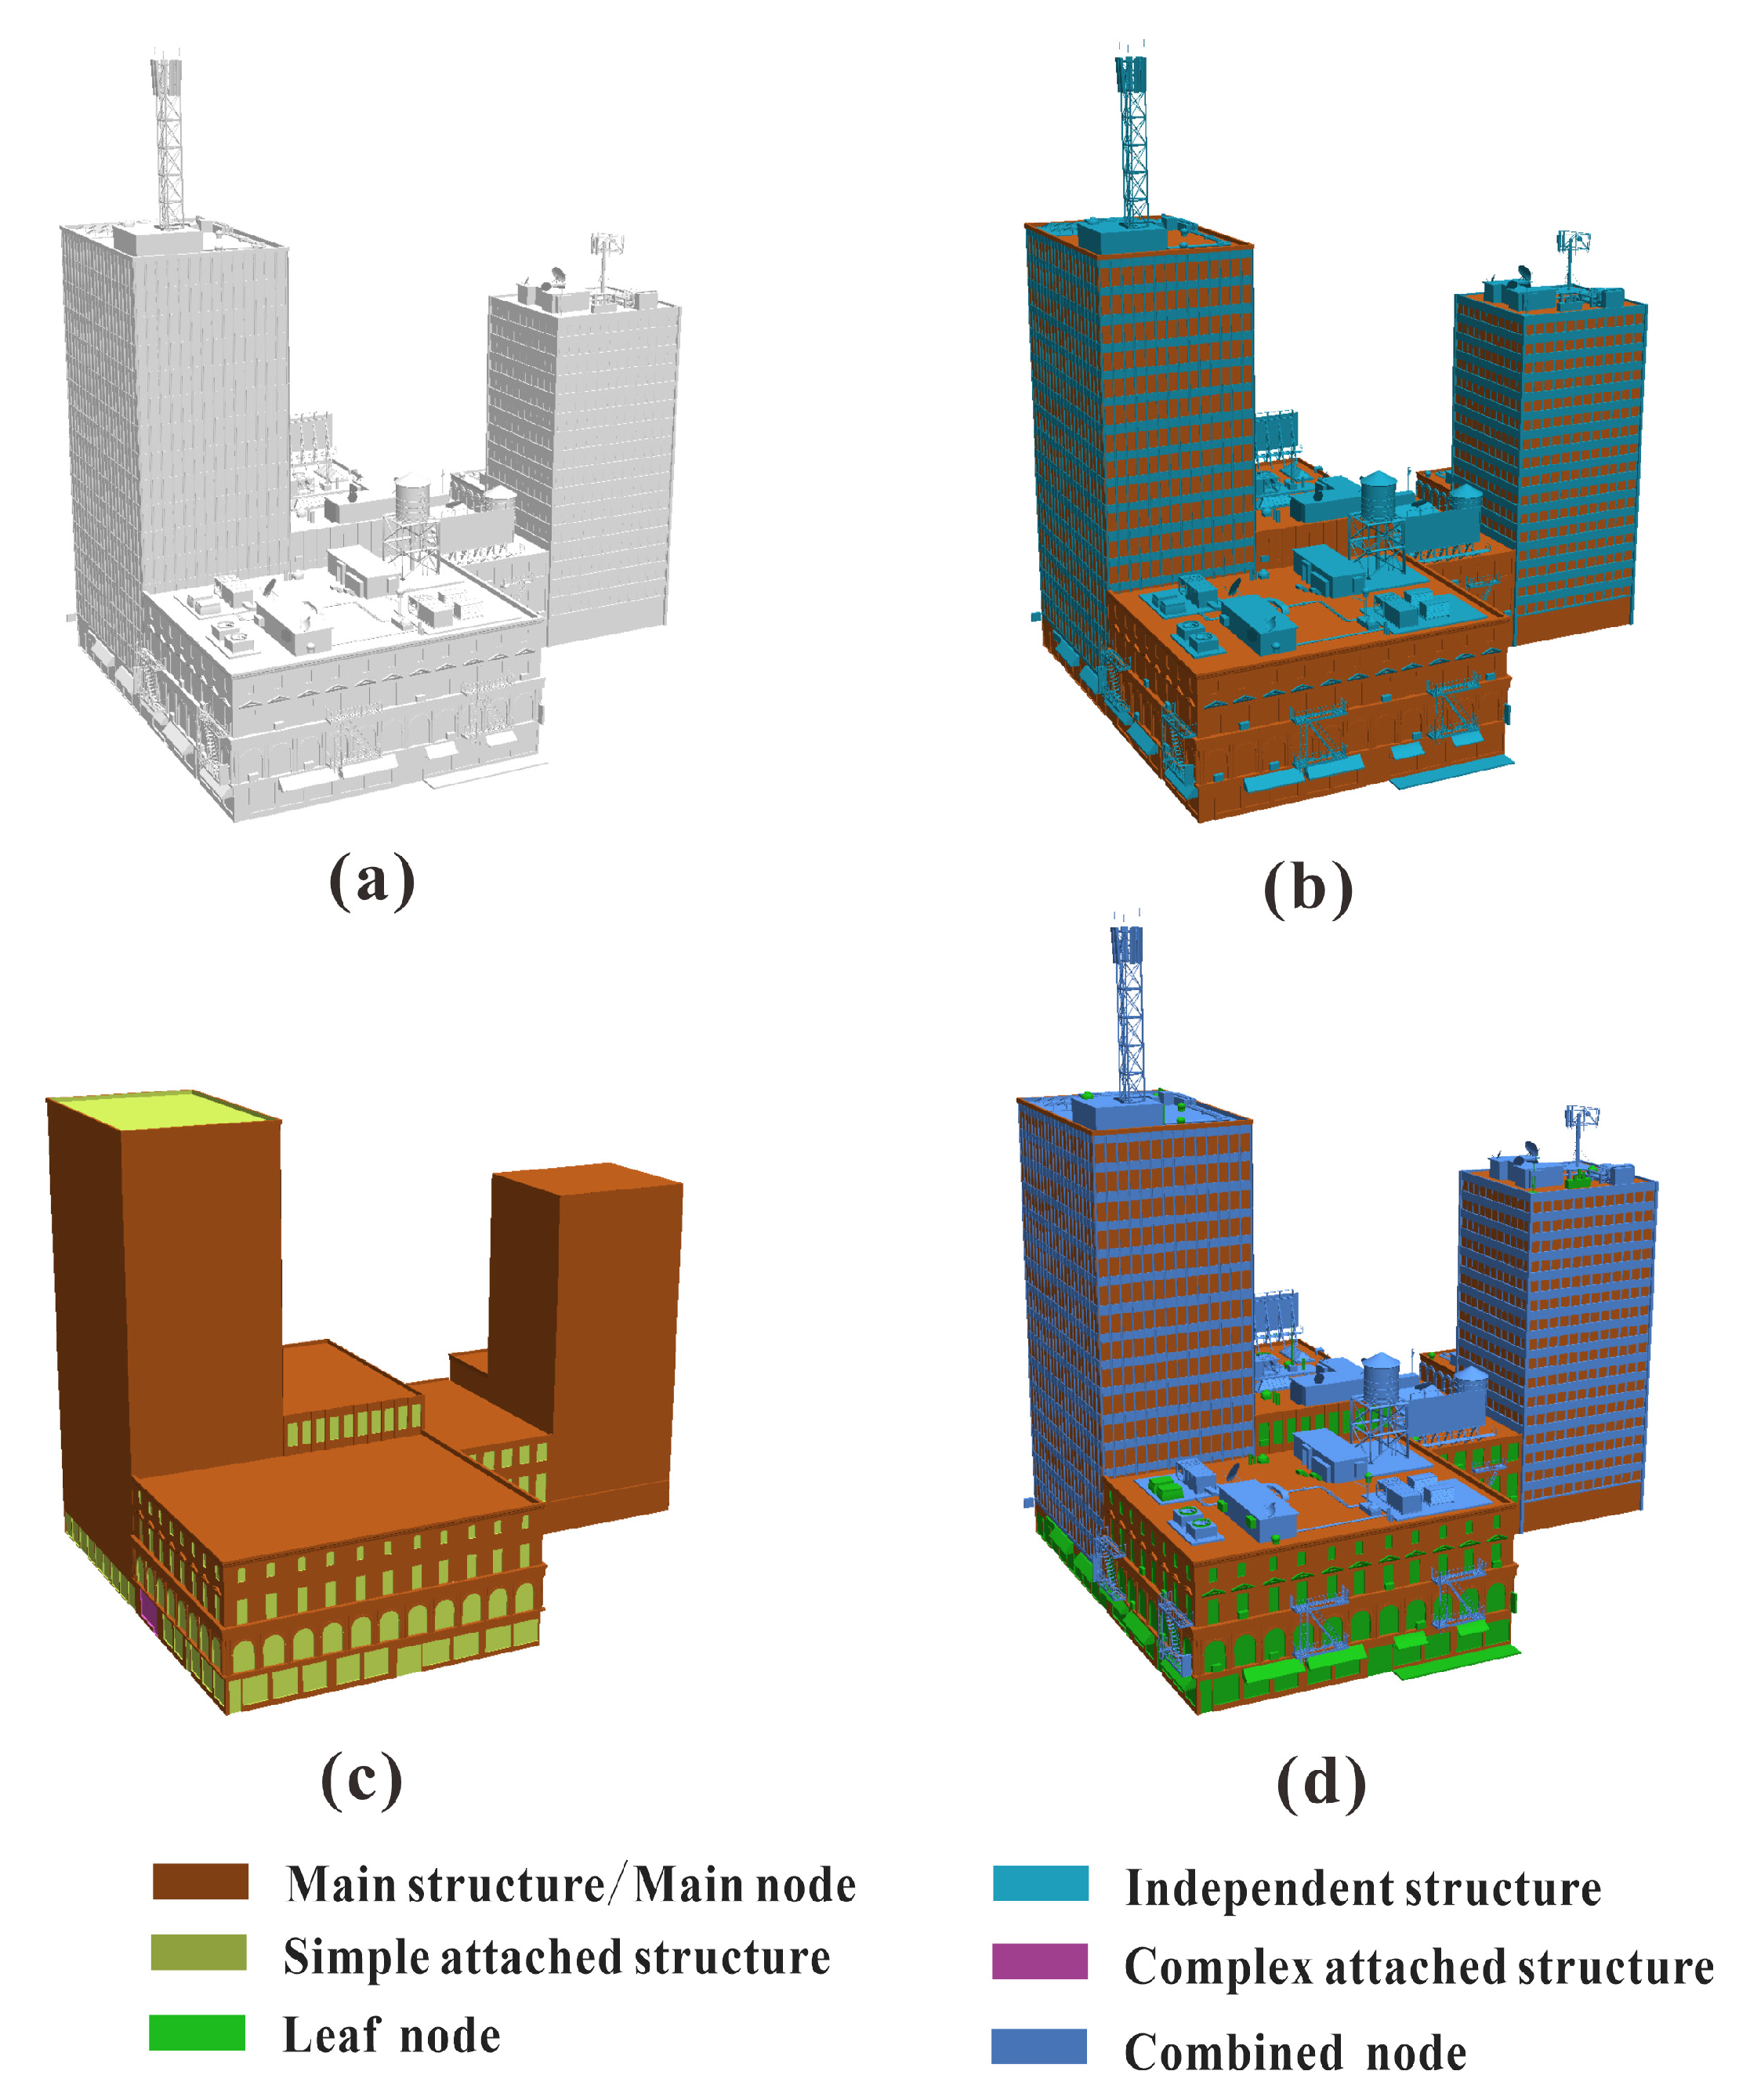
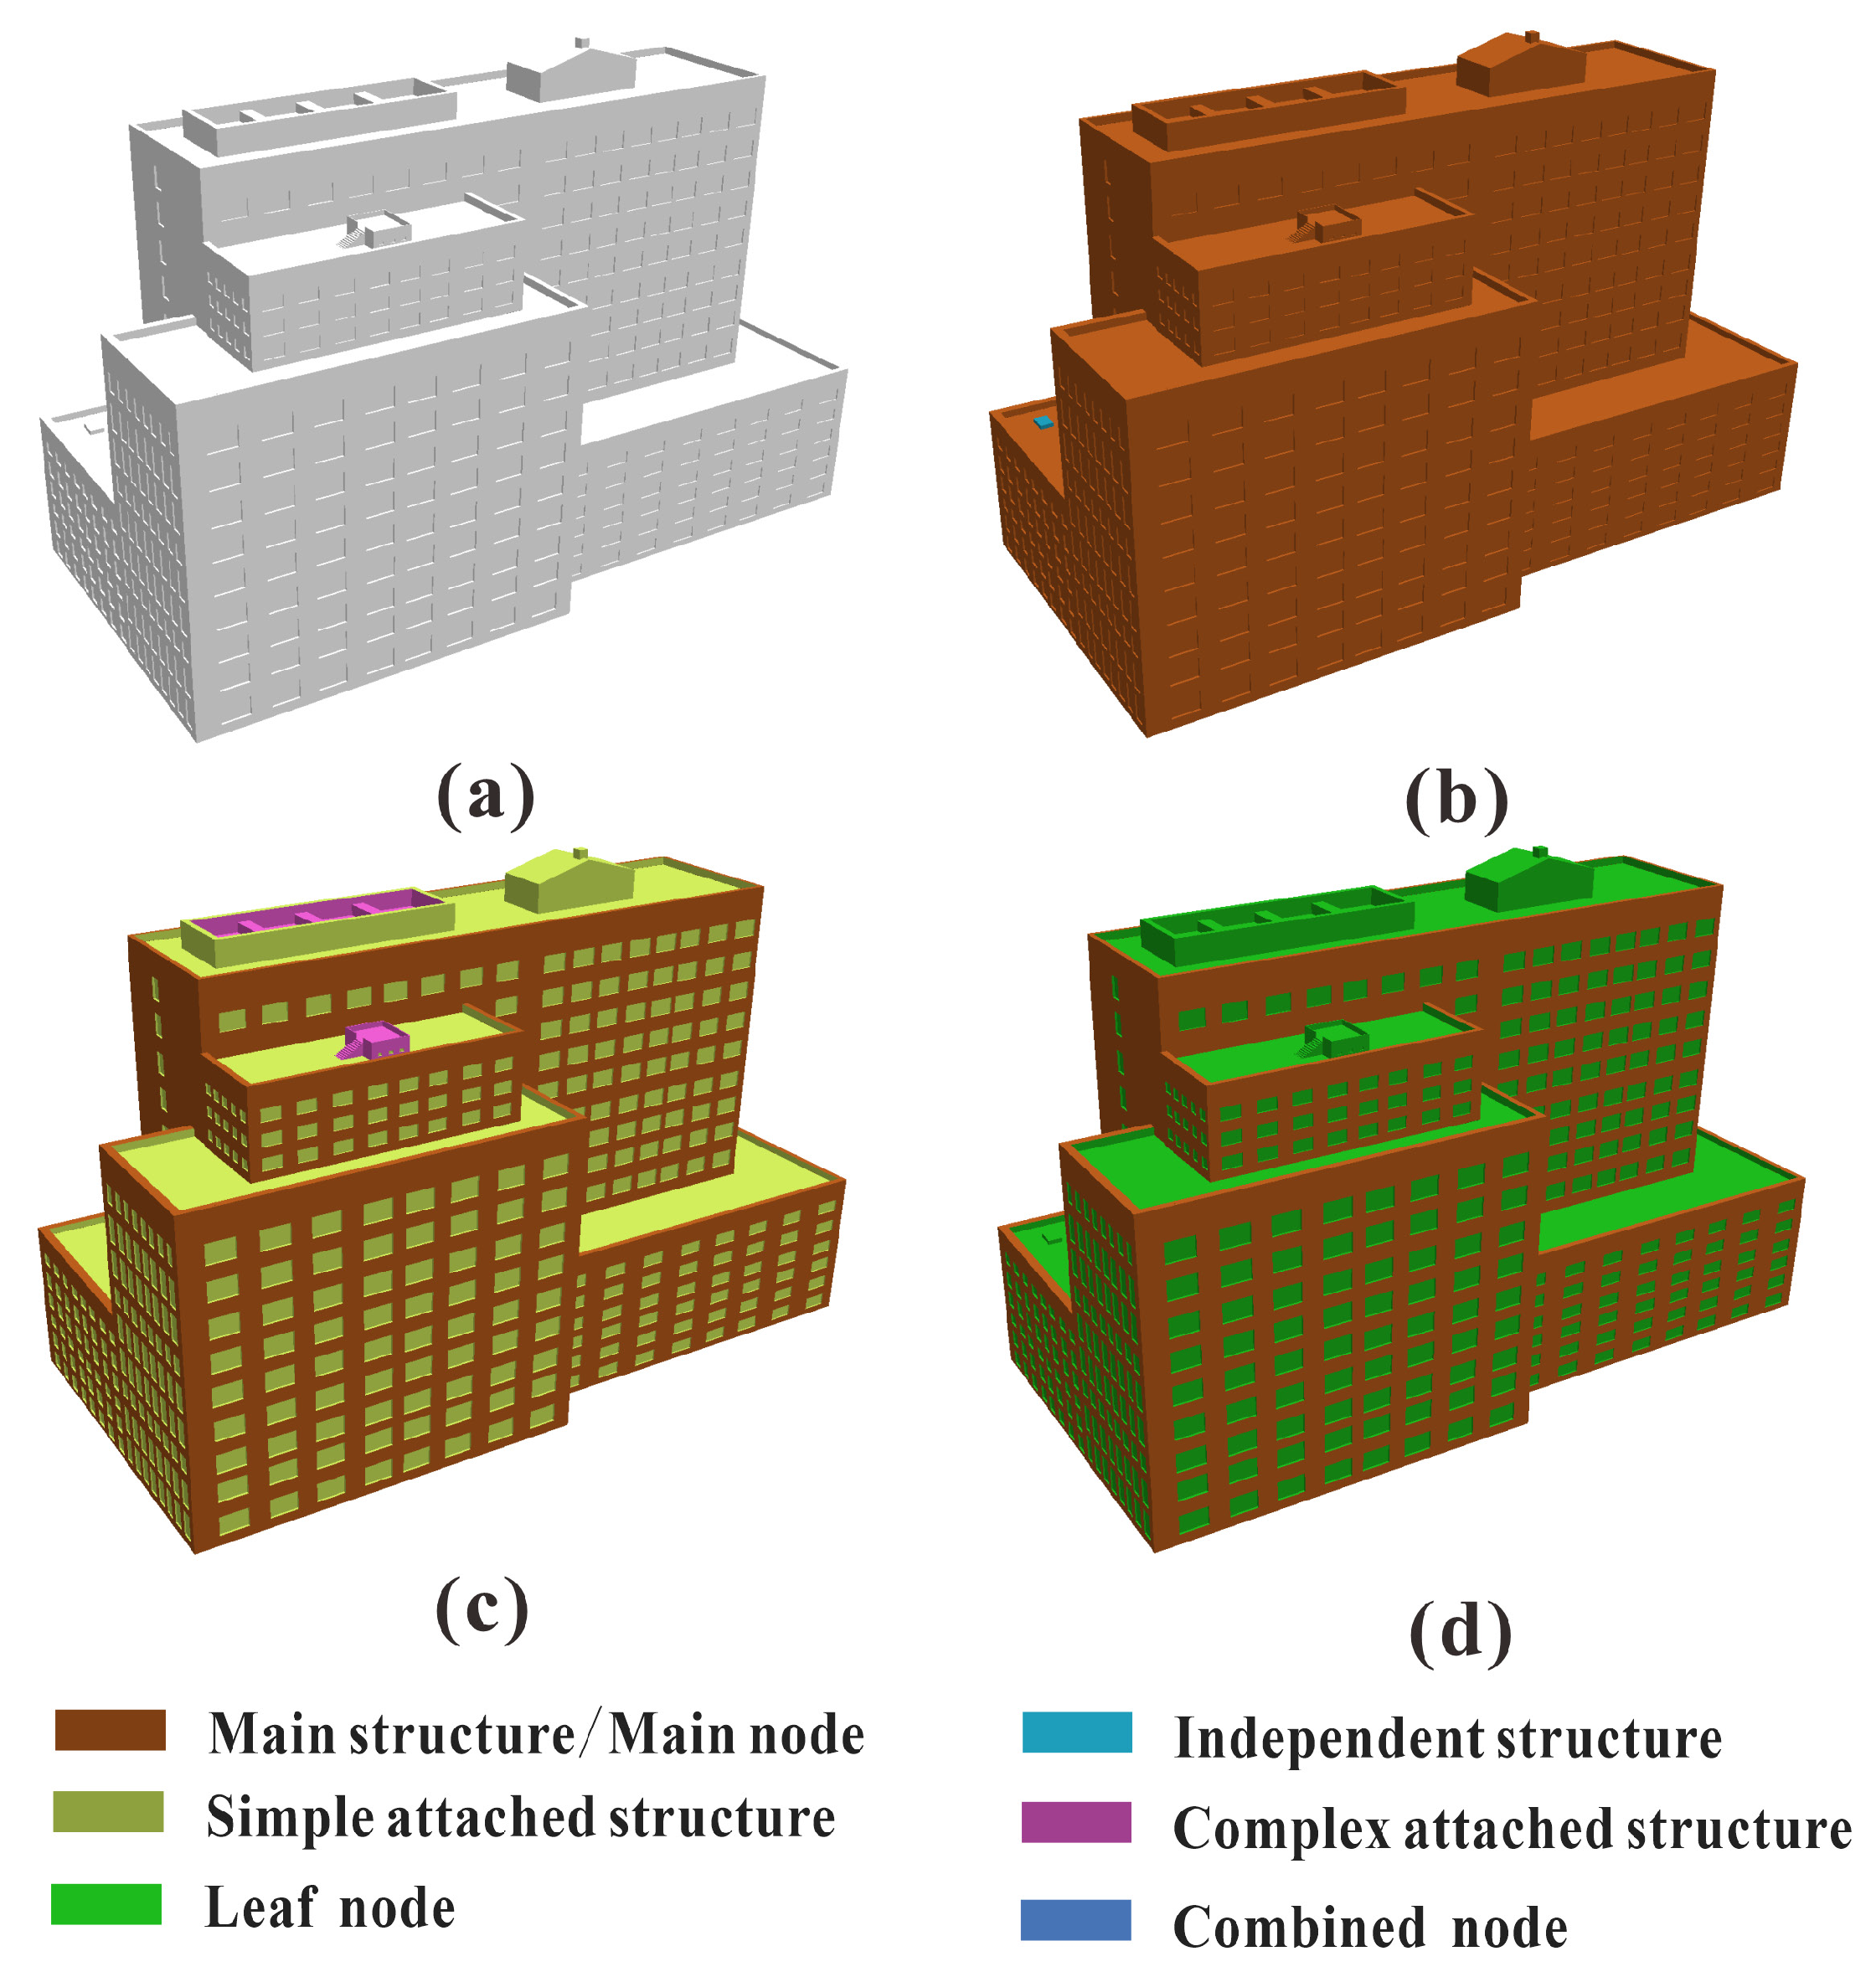
3.1. Decompose the Building into Structures

3.1.1. Segment the Mesh

From an abstract perspective, a building model can be seen as a combination of different types of structures [20]. In this study, definitions of components and structures are different. Specifically, the component is an independent triangular mesh that does not contain explicit semantic information, such as the radar receiver shown in Figure 3. Conversely, the structure is a set of triangles that express specific semantics. A component can directly express a structure, such as an air conditioner, as shown in Figure 3b. In addition, it can include multiple structures, such as windows embedded in the wall, and the two structures together form the main component. Notably, we begin by segmenting the building into multiple components and then extract the structure from the components.
This research expresses the building models based on She’s data structure [30], which records the connection relationships among triangles. When there is an identical shared edge between the two triangles, they are defined as adjacent triangles. This research uses the breadth-first search algorithm to segment the building model mesh into components. The specific steps are as follows:
Step 1: Traverse the model mesh to build a triangle set, t S e t .
Step 2: Take out an unvisited triangle, t , from t S e t , set t as visited, put it into queue, q , and create a new component, c .
Step 3: Take out triangle, t , from q , add it to component c , traverse all unvisited neighbor triangles of t , set it as visited, and put it into queue, q , repeat step 3 until there are no triangles in q .
Step 4: Repeat steps 2 and 3 until all triangles in t S e t are visited.
The mesh segmentation results are shown in Figure 3, where different colors represent different components. Based on these components, we decompose the 3D building model into three types of basic structures: main, independent and attached structures. It is evident that the appearance of the building models is mainly expressed by several main components, and the other components play a decorative role. Each main component is composed of the main structure and an attached structure. The main structure is usually the entire wall after removing the attached structure. The attached structure is embedded in the main components, with obvious protrusions and depressions, such as the window in Figure 3. The remaining auxiliary components were independent structures. These structures often have the characteristics of a small surface area and small volume. Removing such structures does not leave holes on the surface of the building.

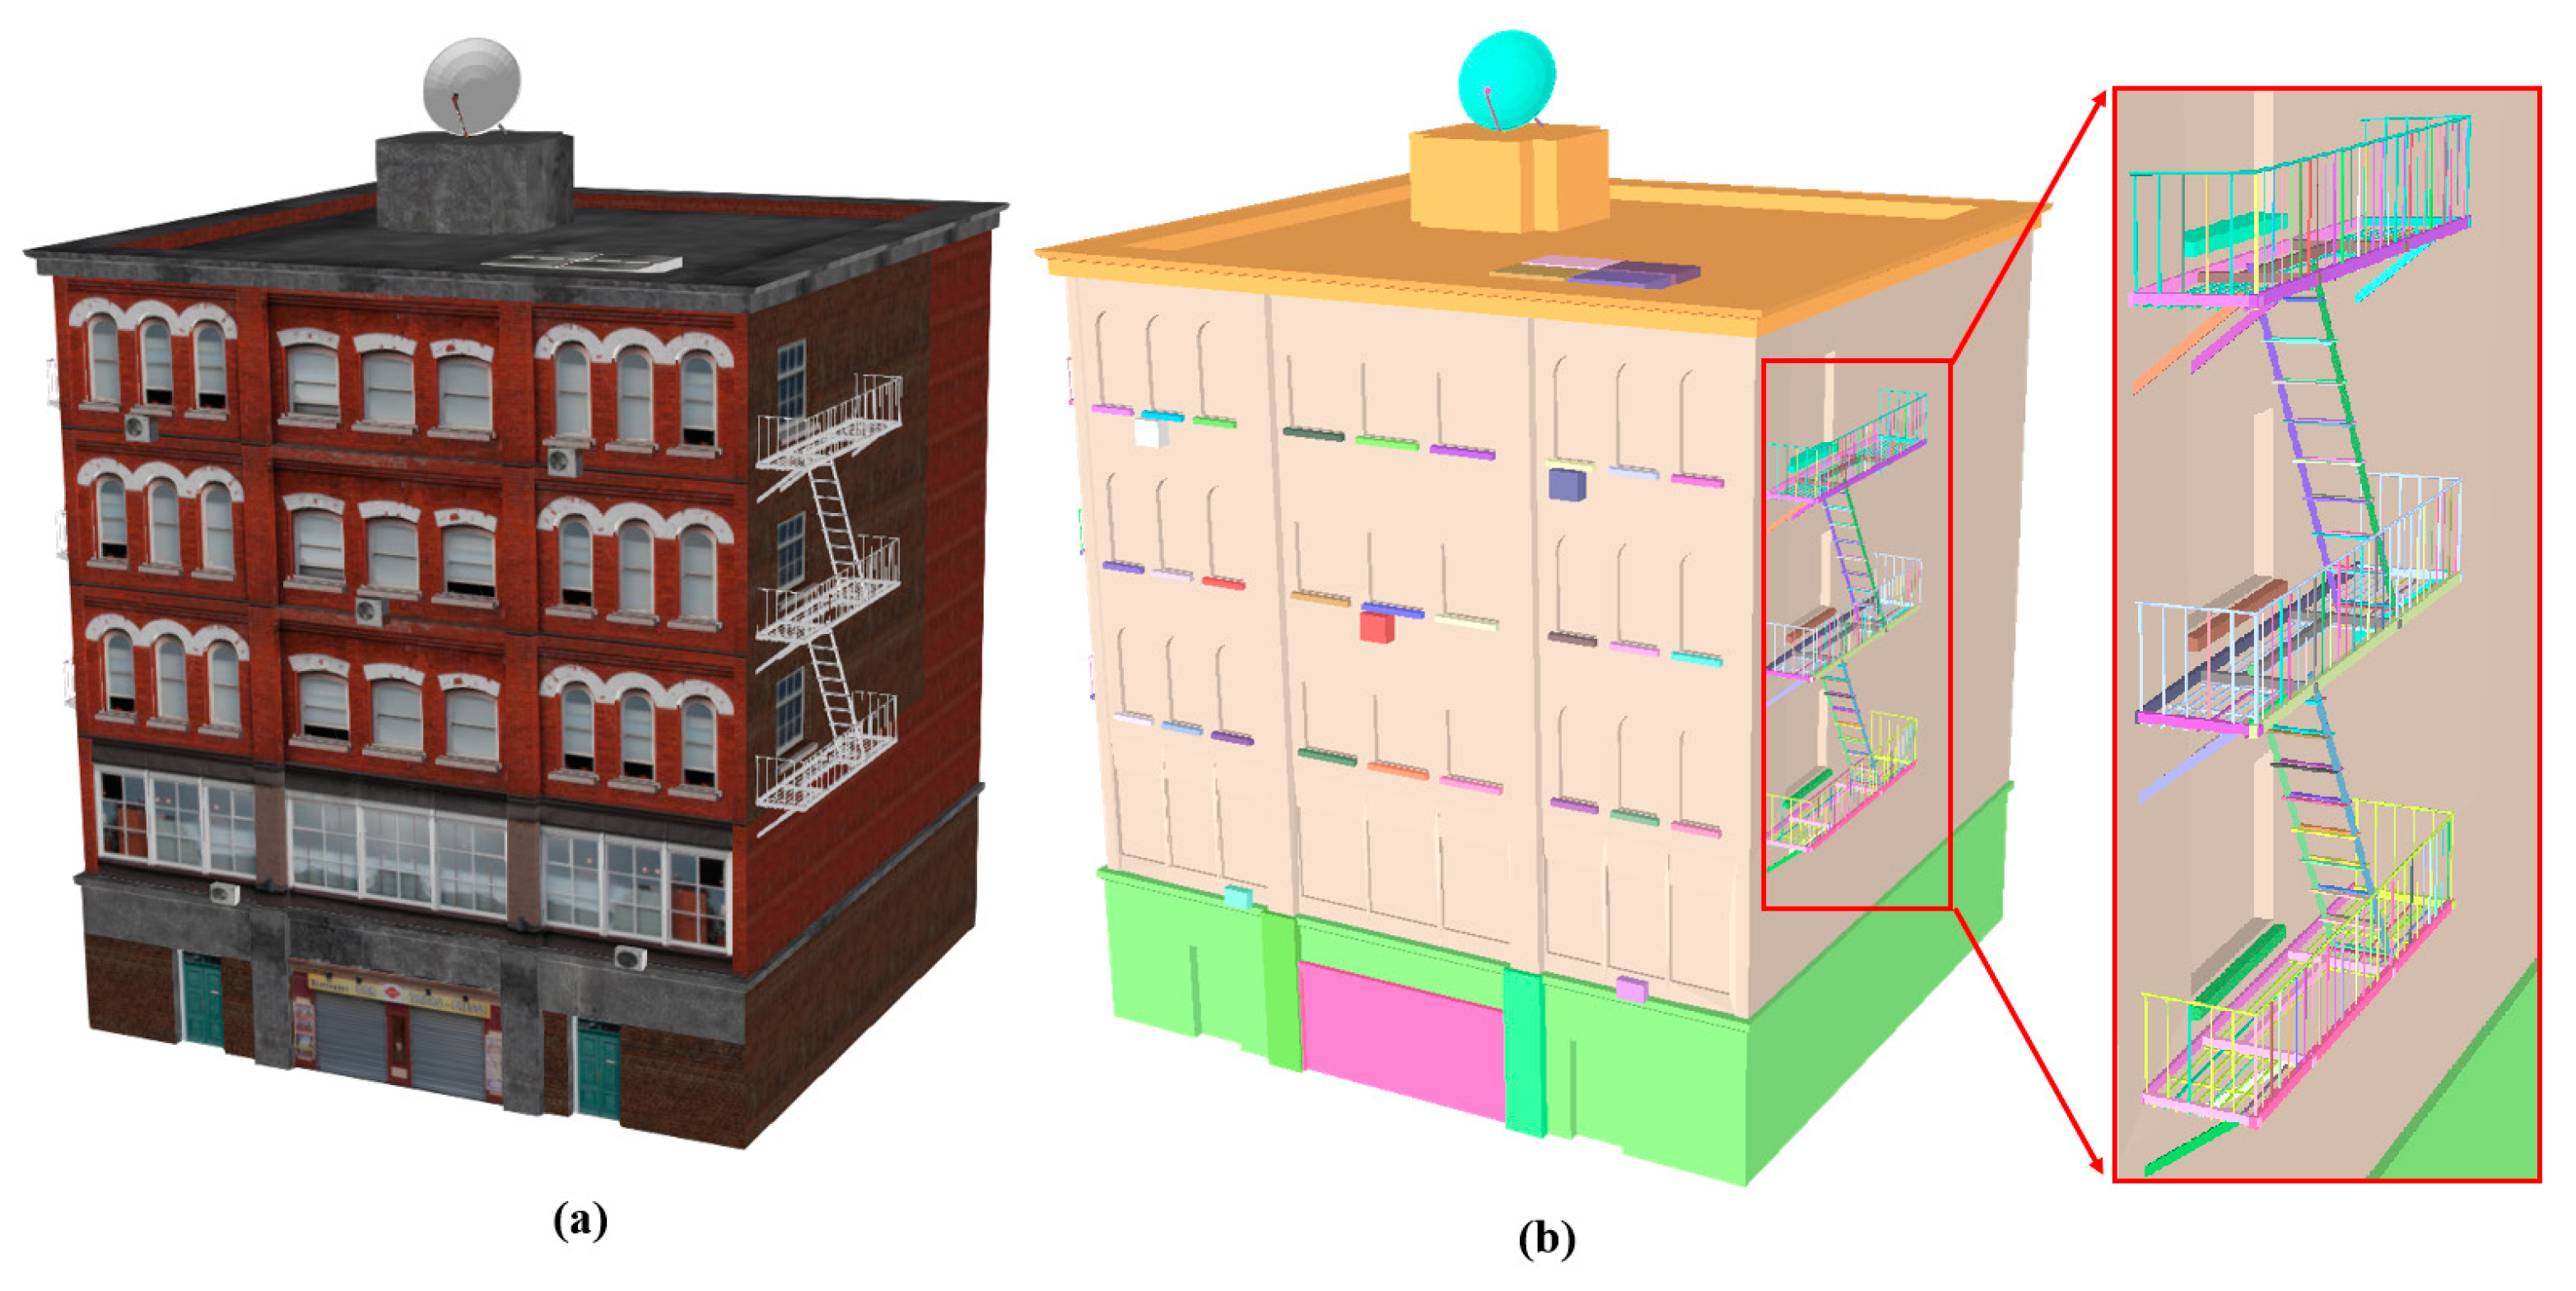
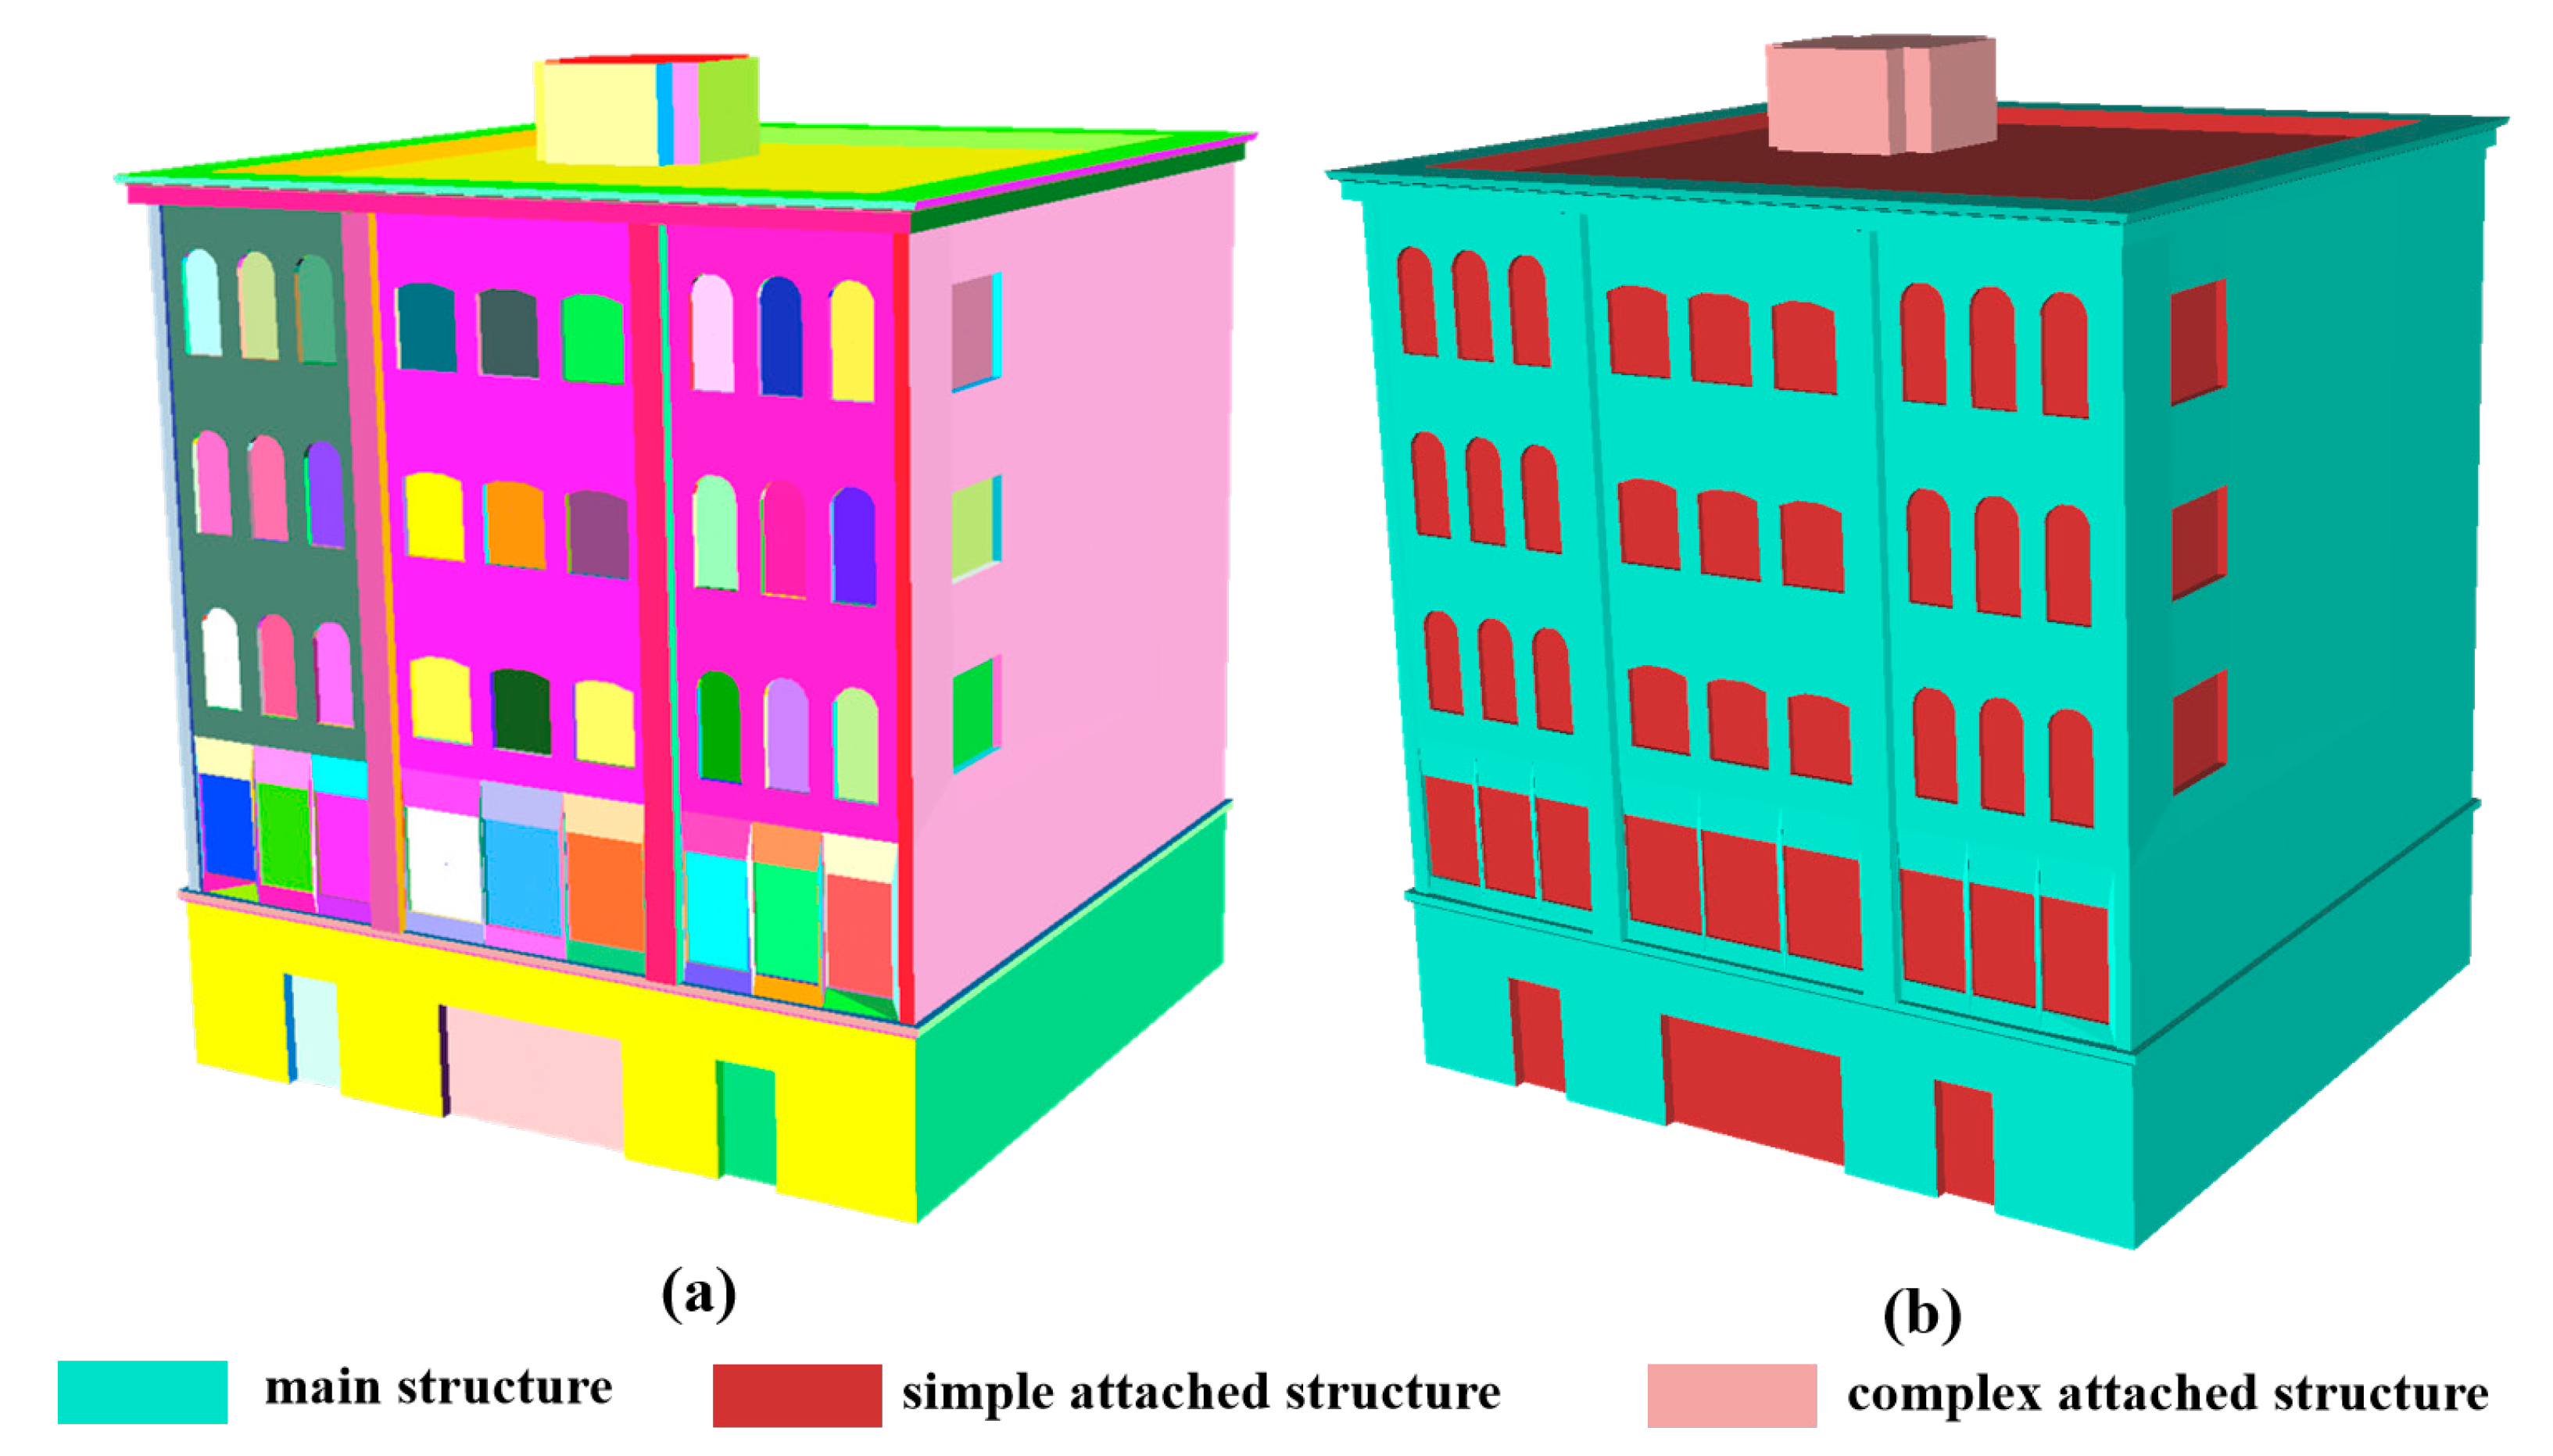
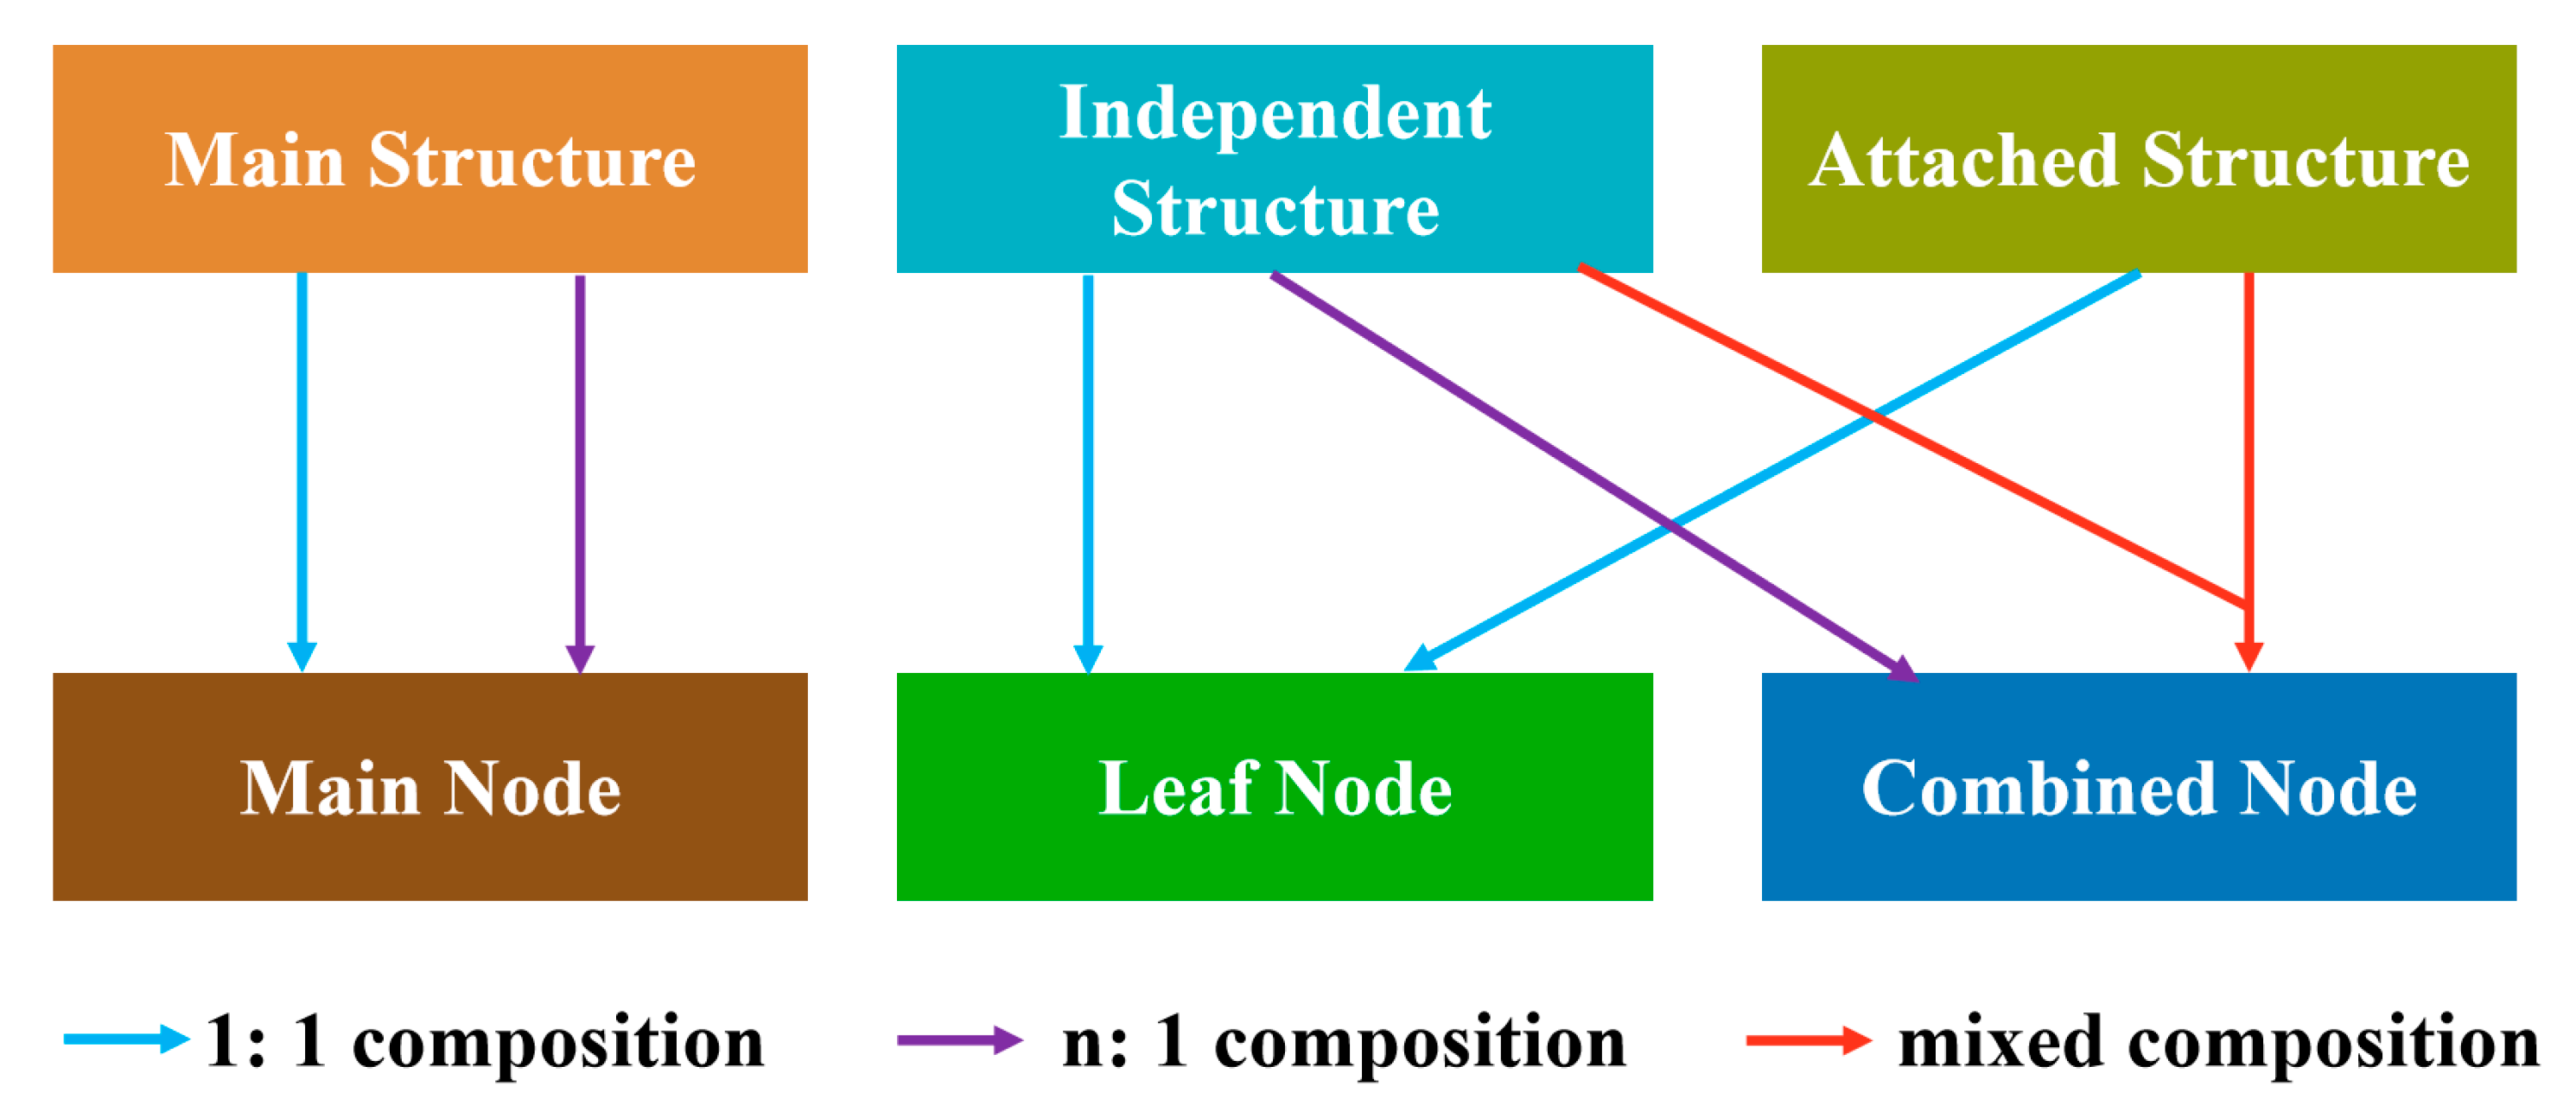
3.1.2. Extract Main Components and Independent Structure

The main idea of extracting the independent structure is to distinguish the main components from the building components, and the remaining components are independent structures. Thus, we propose a method to identify independent structures considering the volume and surface area. We used the volume and surface area of the components to extract the independent structures. The details are as follows:
Step 1: Calculate the volume, V i , of the oriented bounding box (OBB) of each component and the surface area, S j , of the component.
Step 2: Sort the components in descending order according to the volume. According to the order of volume from largest to smallest, perform an accumulation operation on volume, V i , one by one to obtain V s u m . When V s u m V t o t a l × t 1 , the accumulation stops, and the accumulated components form set I .
Step 3: Sort the components in descending order according to surface area. According to the order of the surface area from largest to smallest, perform an accumulation operation on the surface area, S j , one by one to obtain S s u m . When S s u m S t o t a l × t 2 , the accumulation stops, and the accumulated components form a set J .
Step 4: Return the components B = { I   J } .
Among them, B contains the main components, and the remaining components are called independent structures. t 1 and t 2 are the thresholds, ranging from 0 to 1, which can be adjusted freely according to the degree of fragmentation of the individual components of the building.

3.1.3. Extract Attached Structures

The prerequisite for extracting attached structures is to obtain the connection relationship of the face. We used the greedy clustering algorithm [20] to perform mesh clustering on the main components before extracting the attached structures. This method clusters triangles with similar normal vectors into faces. The results are shown in Figure 4a. Subsequently, we calculated the angle between the faces. When the angle is less than 180°, there is a concave connection between the faces, whereas when the angle is greater than 180°, there is a convex connection between the faces. According to these connection relations, an AAG [15] was constructed. AAG expresses the face and the connection relationship in a graph, which can be represented as AAG = { F , E , A } , where F is the face obtained by clustering, E is the connection between the two faces, and A is the concave-convex attribute of E . Using the graph search algorithm in AAG can effectively extract the attached structure.
We divide the attached structure into simple and complex attached structures and define the following extraction rules:
In AAG, for a subgraph, g , and its neighbor subgraph,   n , if (1) the internal connections of g are concave, while all the connections between g and n are convex, or (2) the internal connections of g are convex, while all the connections between g and n are concave, then we consider g to be a simple attached structure. If the number of inner faces of n is 1 and all the connections of g and n are the same, we consider g to be a complex attached structure.
As shown in Figure 5a, there are two face sets: a simple attached structure (left) and a complex attached structure (right). In Figure 5b, each face is expressed as a node, and the color of the edge represents the connection relationship between the faces. There are two attached structures in AAG: a simple attached structure (left subgraph) and a complex attached structure (right subgraph). Specifically, according to the extraction rules, when a group of faces has the same internal concave-convex connection relationship but opposite to the external concave-convex connection relationship, it is recognized as a simple attached structure. Simple attached structures are widely present on the main components of a building, such as windows and doors. In contrast, when a group of faces has different internal connection relationships, regardless of the complexity of the connection relationship, as long as the group of faces is connected to only one face and has the same concave-convex connection relationship with the face, it will be recognized as a complex attached structure.
Since simple attached structures may be embedded in complex attached structures, we first extract simple attached structures and remove them from AAG. This process was performed iteratively until all simple attached structures were removed, and then the complex structures were extracted. When the number of faces of the attached structure is less than or equal to 3, extracting the structure for transmission will result in unnecessary redundancy; therefore, we do not extract them. When extracted to the end, the regular wall is easily over-extracted as a simple attached structure; therefore, when the volume of OBB of the simple attached structure is greater than half of the volume of the main components, the structure is not extracted.
Since attached structures are embedded in the main components, when attached structures are removed, holes will be left on the surface of the main structure, severely affecting the appearance of the building. To minimize the visual impact caused by the removal of the structure, we used the algorithm of Gao [31] to triangulate the holes to generate a temporary mesh, called the hole triangle mesh. To maintain the texture of the triangular mesh of holes, we used the projection method to generate a temporary texture [32]. Owing to the preservation of the texture, the appearance of the building was well-maintained.

3.2. Data Organization for Progressive Transmission

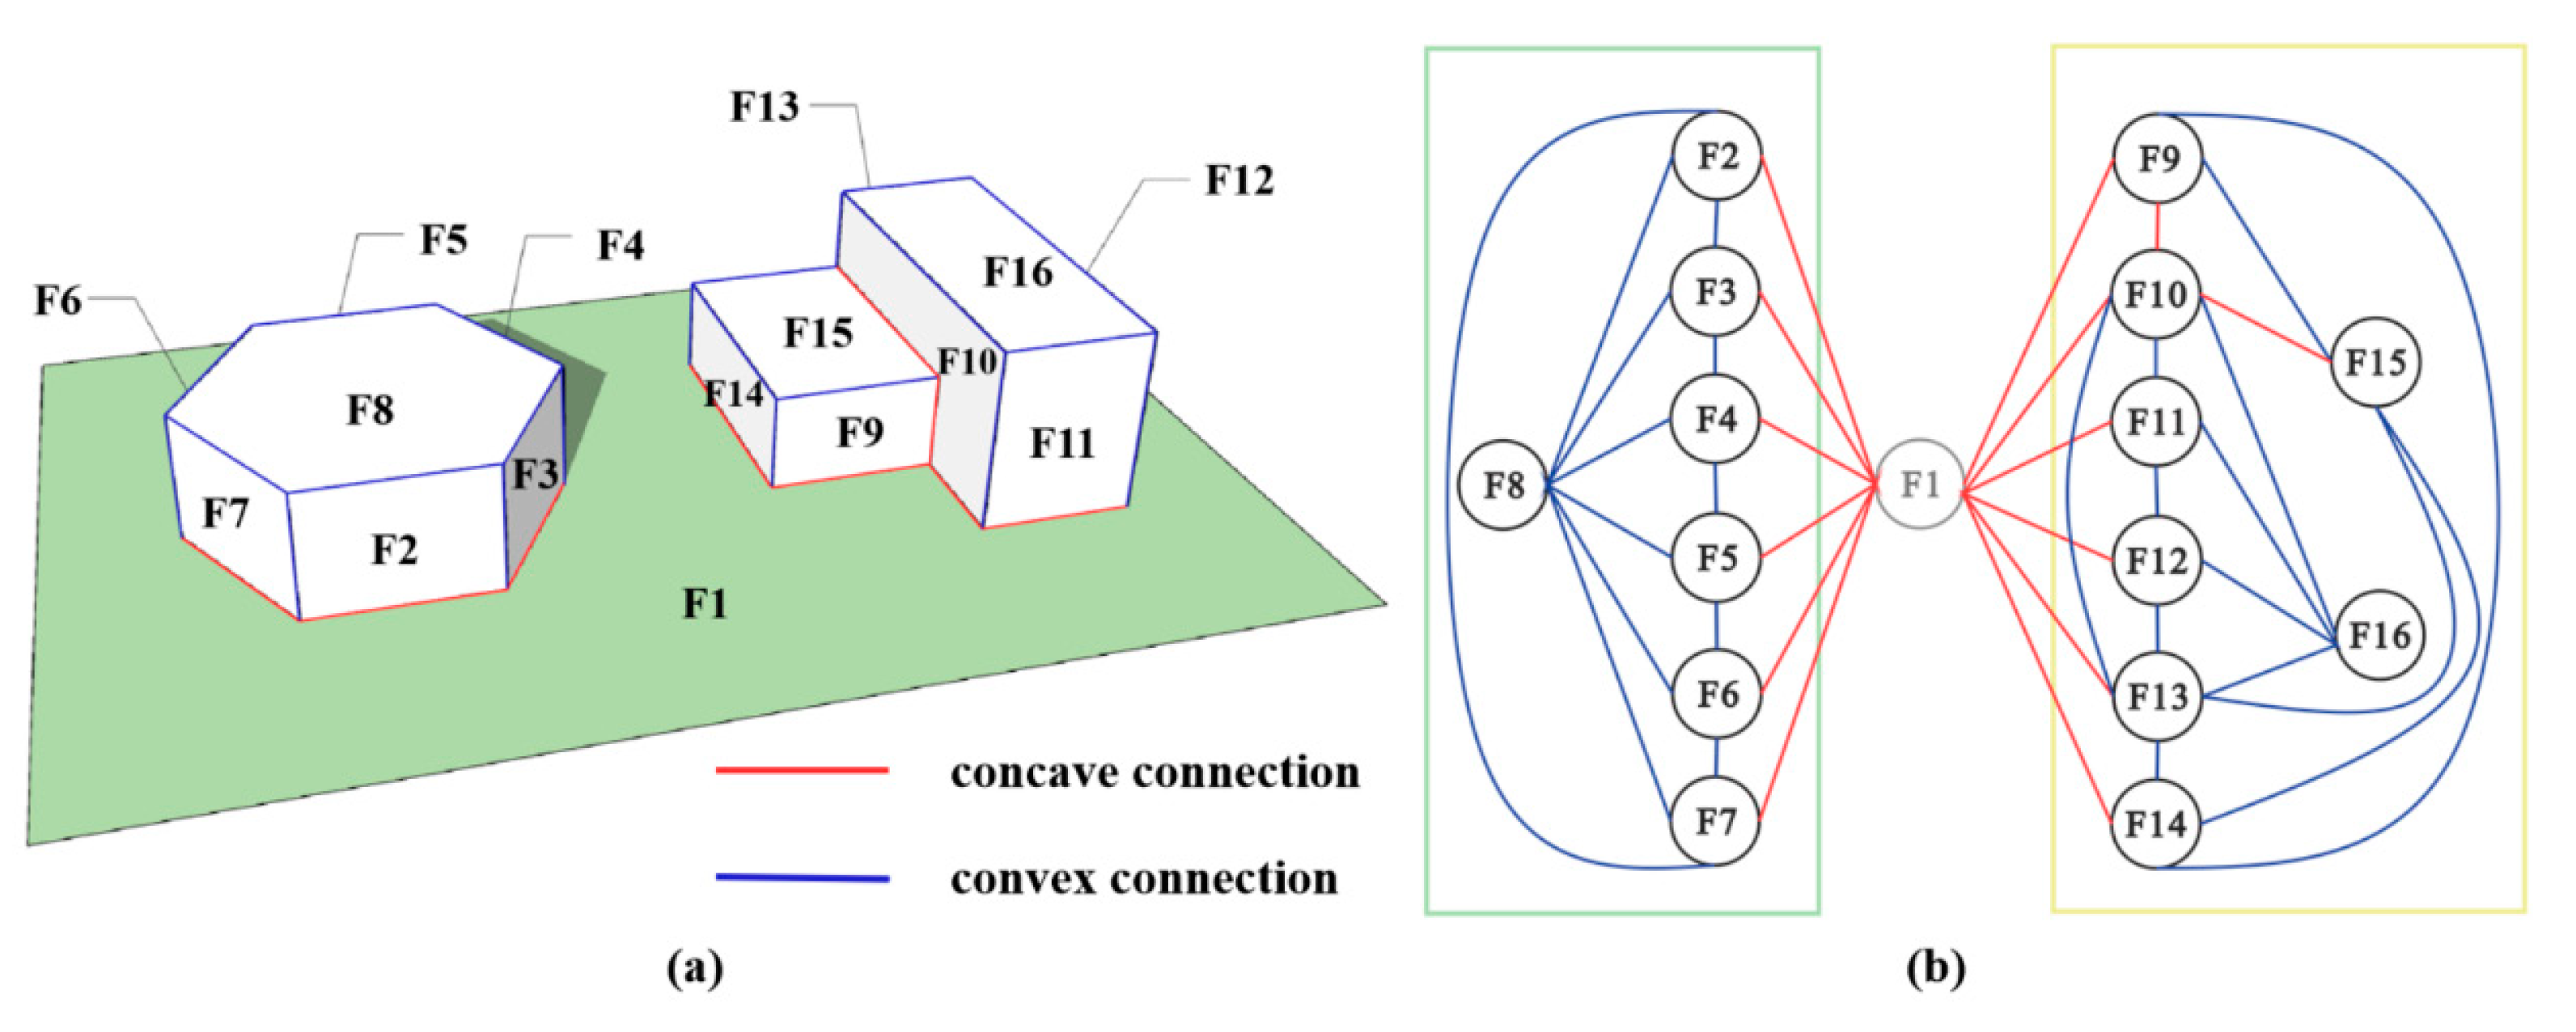
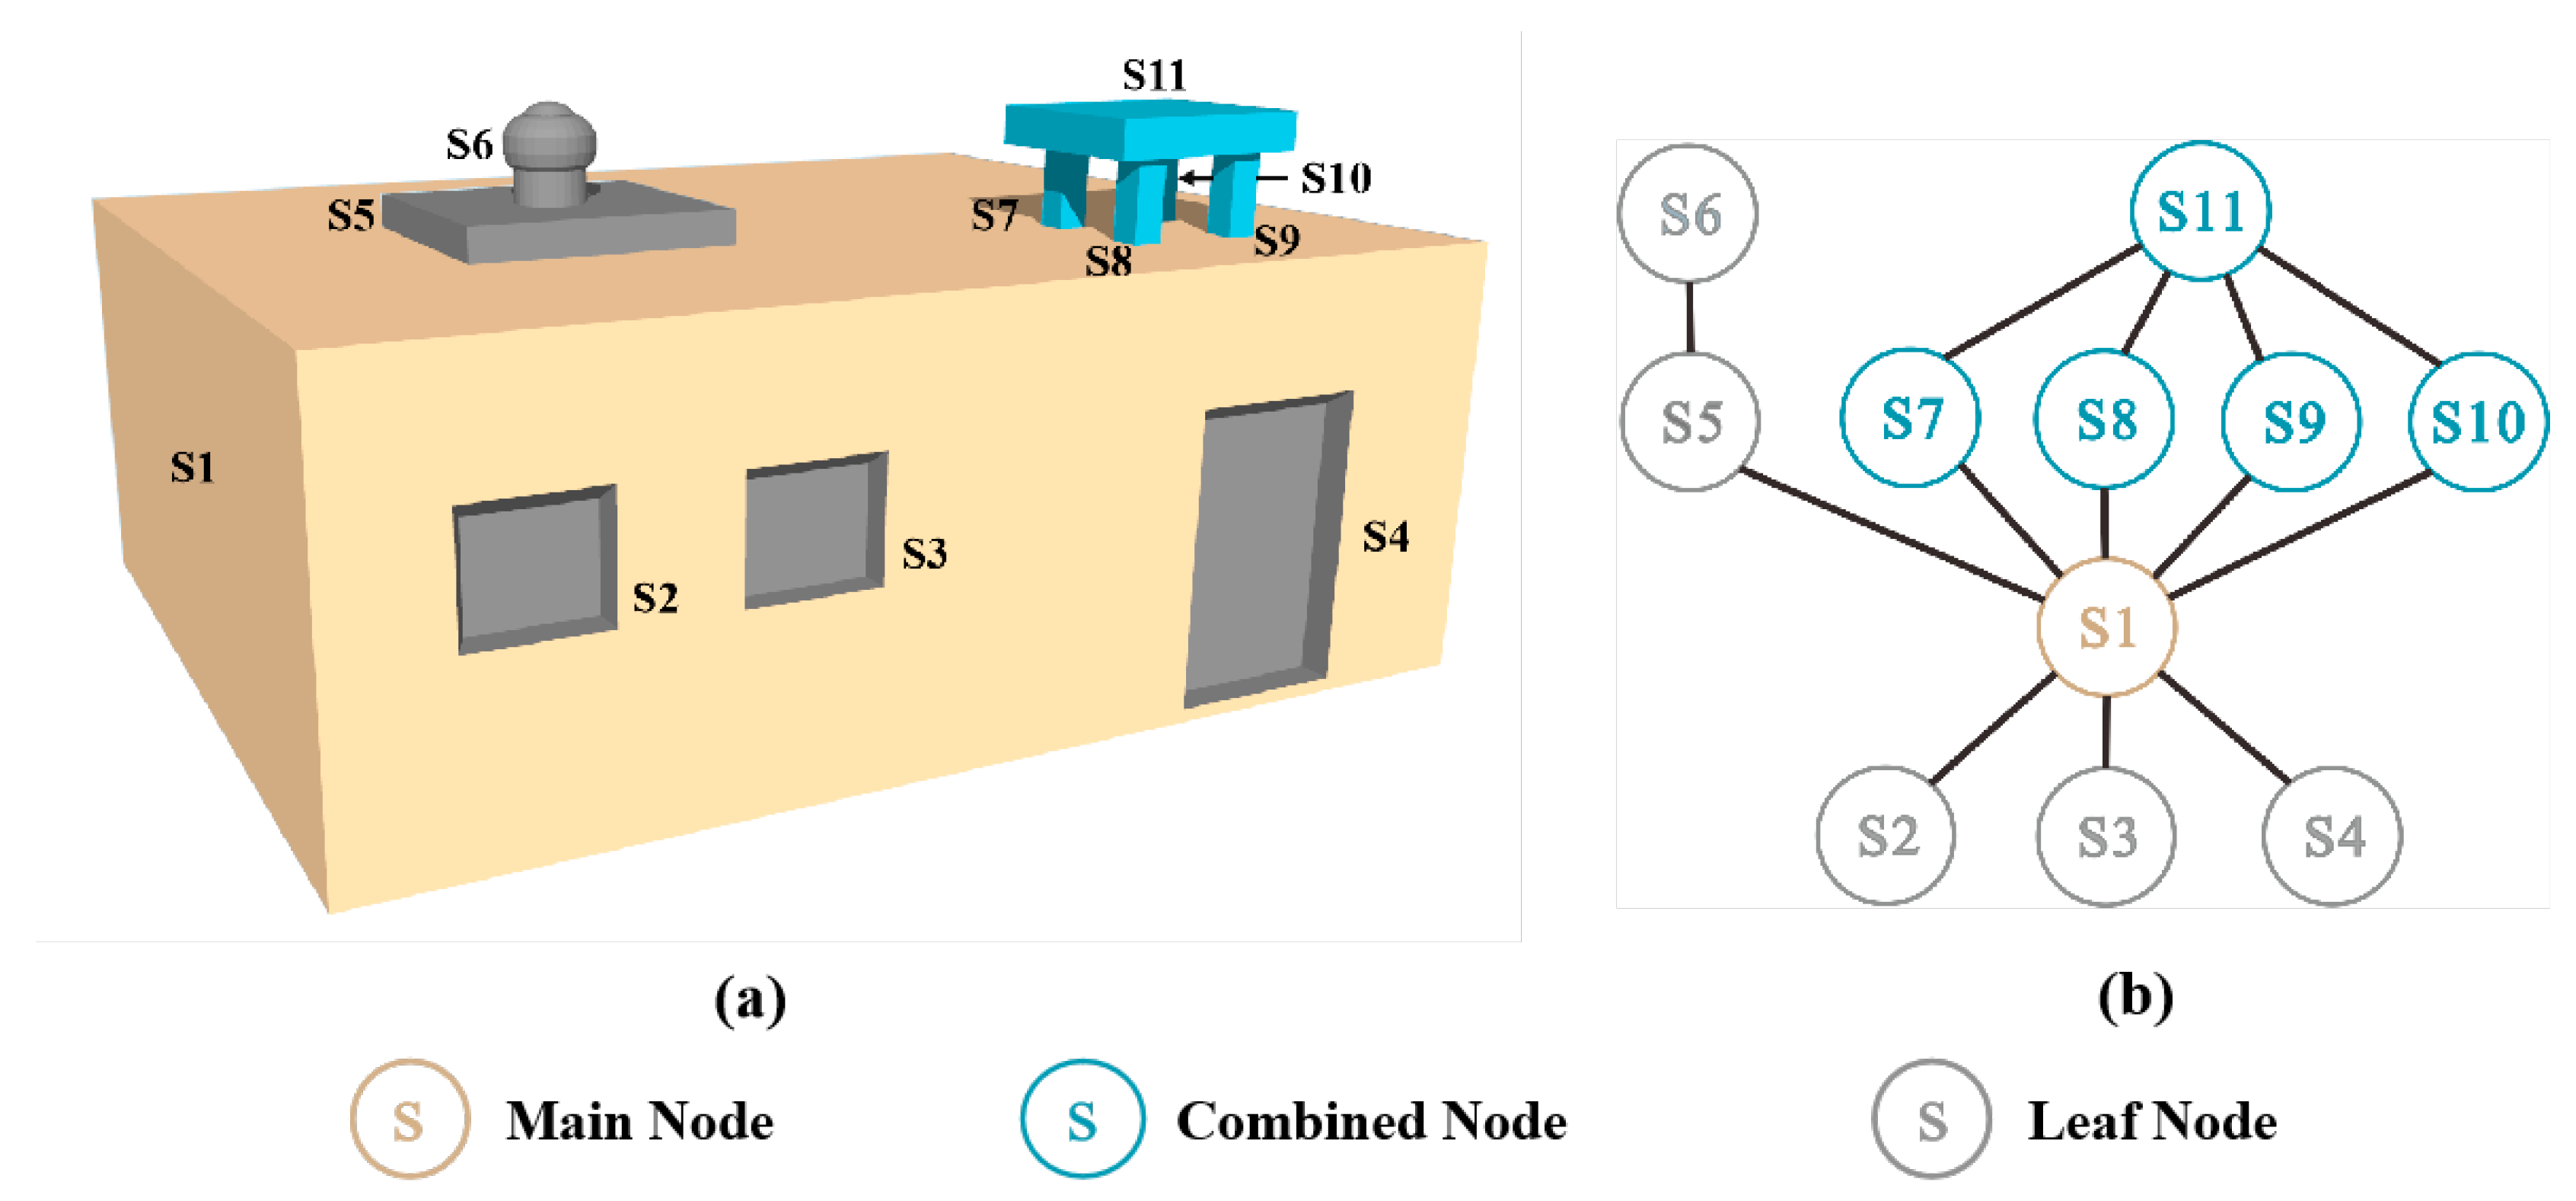
3.2.1. Structural Topology Graph

The building model has been decomposed into structures, but the size of structures is used as the sequence of encoding and transmission, which may break the topological relationship among the structures. For example, a small structure, A , supports a larger structure, B , if structure A was transmitted after structure B , and B was suspended in the air. Therefore, the encoding and transmission sequence of the structure must be reasonably arranged to ensure that the topological relationship of the structures at each resolution is not broken. In addition, some independent components may depend on each other. For example, steps and handrails form a staircase. If only handrails are transmitted, it would be challenging for users to identify the staircase correctly. Therefore, structures need to be further combined to maintain their integrity.
To express the connection relationship of the structure more clearly and combine structures conveniently, we constructed the structural topology graph STG = { N , E } , where N = { main   structure ,   independent   structure ,   attached   structure } , and E is the connection relationship between the structures. The key task of constructing an STG is to judge whether the structures intersect. Owing to many structures of the building models and several triangles inside the structure, it is time-consuming to conduct the intersection test directly. We propose a method for quickly calculating the connection relationships among structures. In addition, this method considers modeling errors, such as independent structures that do not intersect with any structure. The specific steps of the method are as follows:
Step 1: Create the axis-aligned bounding box (AABB) for each structure.
Step 2: Calculate whether AABBs of all structures intersect in pairs. If they intersect, then calculate whether there is a pair of intersecting triangles. If true, then the two structures intersect.
Step 3: Determine whether there is an independent structure that is not connected to any structure. If it exists, we magnify the structure along the center of gravity by 1.1 times, which is expansion [33].
Step 4: Repeat steps 2 and 3 until there is no independent structure that is not connected to any structure in STG.

3.2.2. Transmission Nodes

The transmission node is the smallest unit that requires to be transmitted to complete the refinement of the model. It is composed of a structure or multiple structures. We define four types of transmission nodes based on STG: the main node, the leaf node, the combined node and the hole triangle mesh node.
(1) Main node
The main node is the most basic model and is transmitted at the beginning. This is regarded as the roughest model. It is composed of the main structure obtained in Section 3.1.2, without the attached structure, such as S1 in Figure 6. Notably, we merge all the main structures into one transmission node, referred to as the main node.
(2) Leaf node
The leaf node expresses the semantics separately, such as S2–S4, S5 and S6 in Figure 6. The leaf node can be constructed directly from attached and independent structures, and they are transmitted in sequence. First, the search for a node with only one neighbor in STG is marked as a leaf node. Then, mark the neighbor node as its parent and remove it from STG. This step is repeated until there exist no new leaf nodes.
(3) Combined node
The structures are combined to express semantics, known as combined node. They comprise independent structures or a mixture of independent structures and attached structures, such as staircases, water towers and other complex structures, such as S7, S8, S9, S10 and S11 in Figure 6. These independent structures were transmitted as a whole. To extract combined nodes: first, the main node is marked as a disconnected node to avoid marking the main node as a combined node when traversing the nodes. Subsequently, we traverse the graph using a breadth-first search algorithm, and each connected subgraph is constructed as a combined node, and finally, the neighbor node is recorded as the parent node.
(4) Hole triangle mesh node
The hole triangle mesh node refers to the triangle mesh that fills the hole caused by removing the attached structure. Notably, each hole triangle mesh node is associated with an attached structure, and this node should be transmitted along with the parent node of the attached structure. Suppose there is a hole triangle mesh node, t o h , associated with the attached structure, s f . The transmission node, t , is generated from s f , and the parent node of t is f t . t o h should be transmitted along with f t .
As shown in Figure 7, the main node is composed of the main structure (1:1 or n:1), the leaf node is composed of an independent structure or an attached structure (1:1) and the combined node can be composed of independent structures (n:1) or a mixture of independent structures and attached structures composition.
Figure 8 delineates the extraction results for various transmission nodes. Since the hole triangle nodes are covered by the other nodes, they are not shown in Figure 8.

3.2.3. Node Attributes for Progressive Transmission

In the process of real-time transmission of 3D building models, the transmission node is progressively transmitted to refine the scene. To speed up the selection of nodes with more visual prominence, we add two attributes to the transmission nodes: visual importance and orientation.
(a)
Visual importance
Since the main node and the hole triangle mesh node have their own rules for transmission, only the visual importance of the leaf and combined nodes need to be calculated. Generally, the visual importance of a transmission node is represented by its volume. The larger volume indicates the higher visual importance. For the convenience of calculation, we use the OBB volume of the transmission node as the visual importance. Transmission nodes with higher visual importance give priority to the transmission.
(b)
Orientation visibility
For buildings, the structure is often attached to the surface of the main node. Thus, the orientation of the surface where the structure is attached determines whether the transmission node connected to the surface is visible from a certain viewpoint. If the angle between the direction of the surface and the line-of-sight ranges from 90 ° to 90 ° , we could not see the surface and the transmission node on the surface. We refer to this factor as the orientation visibility of the transmission node. To further reduce the amount of data transmitted, only the visible transmitting nodes were loaded. We define six orientations of transmission nodes: up, down, left, right, front and back.
The main node is visible in all directions. We mark the transmission node directly connected to the main node as the second-level node and calculate the orientation of the second-level node first. The calculation method is as follows: First, obtain the face set, F = { f 1 , f 2 } , where the transmission node, T , intersects with the main node. These face sets are from the results of triangle clustering in Section 3.1.3. Then, calculate the product m of the normal vector n = ( x , y , z ) of face, f 1 , and the unit vector x = ( 1 , 0 , 0 ) of the positive X-axis. If m is greater than d , F is considered to be visible on the positive X-axis. Thus, the right orientation visibility of T is true. Notably, d is the threshold that can be adjusted freely. The smaller d is, the more visible the structure is, and its value in this study is 0.3. Determine the visibility of all faces in set F in six directions, and assign the visible result to T , as well as other transmission nodes connected directly or indirectly to it, as the attribute value of orientation visibility.

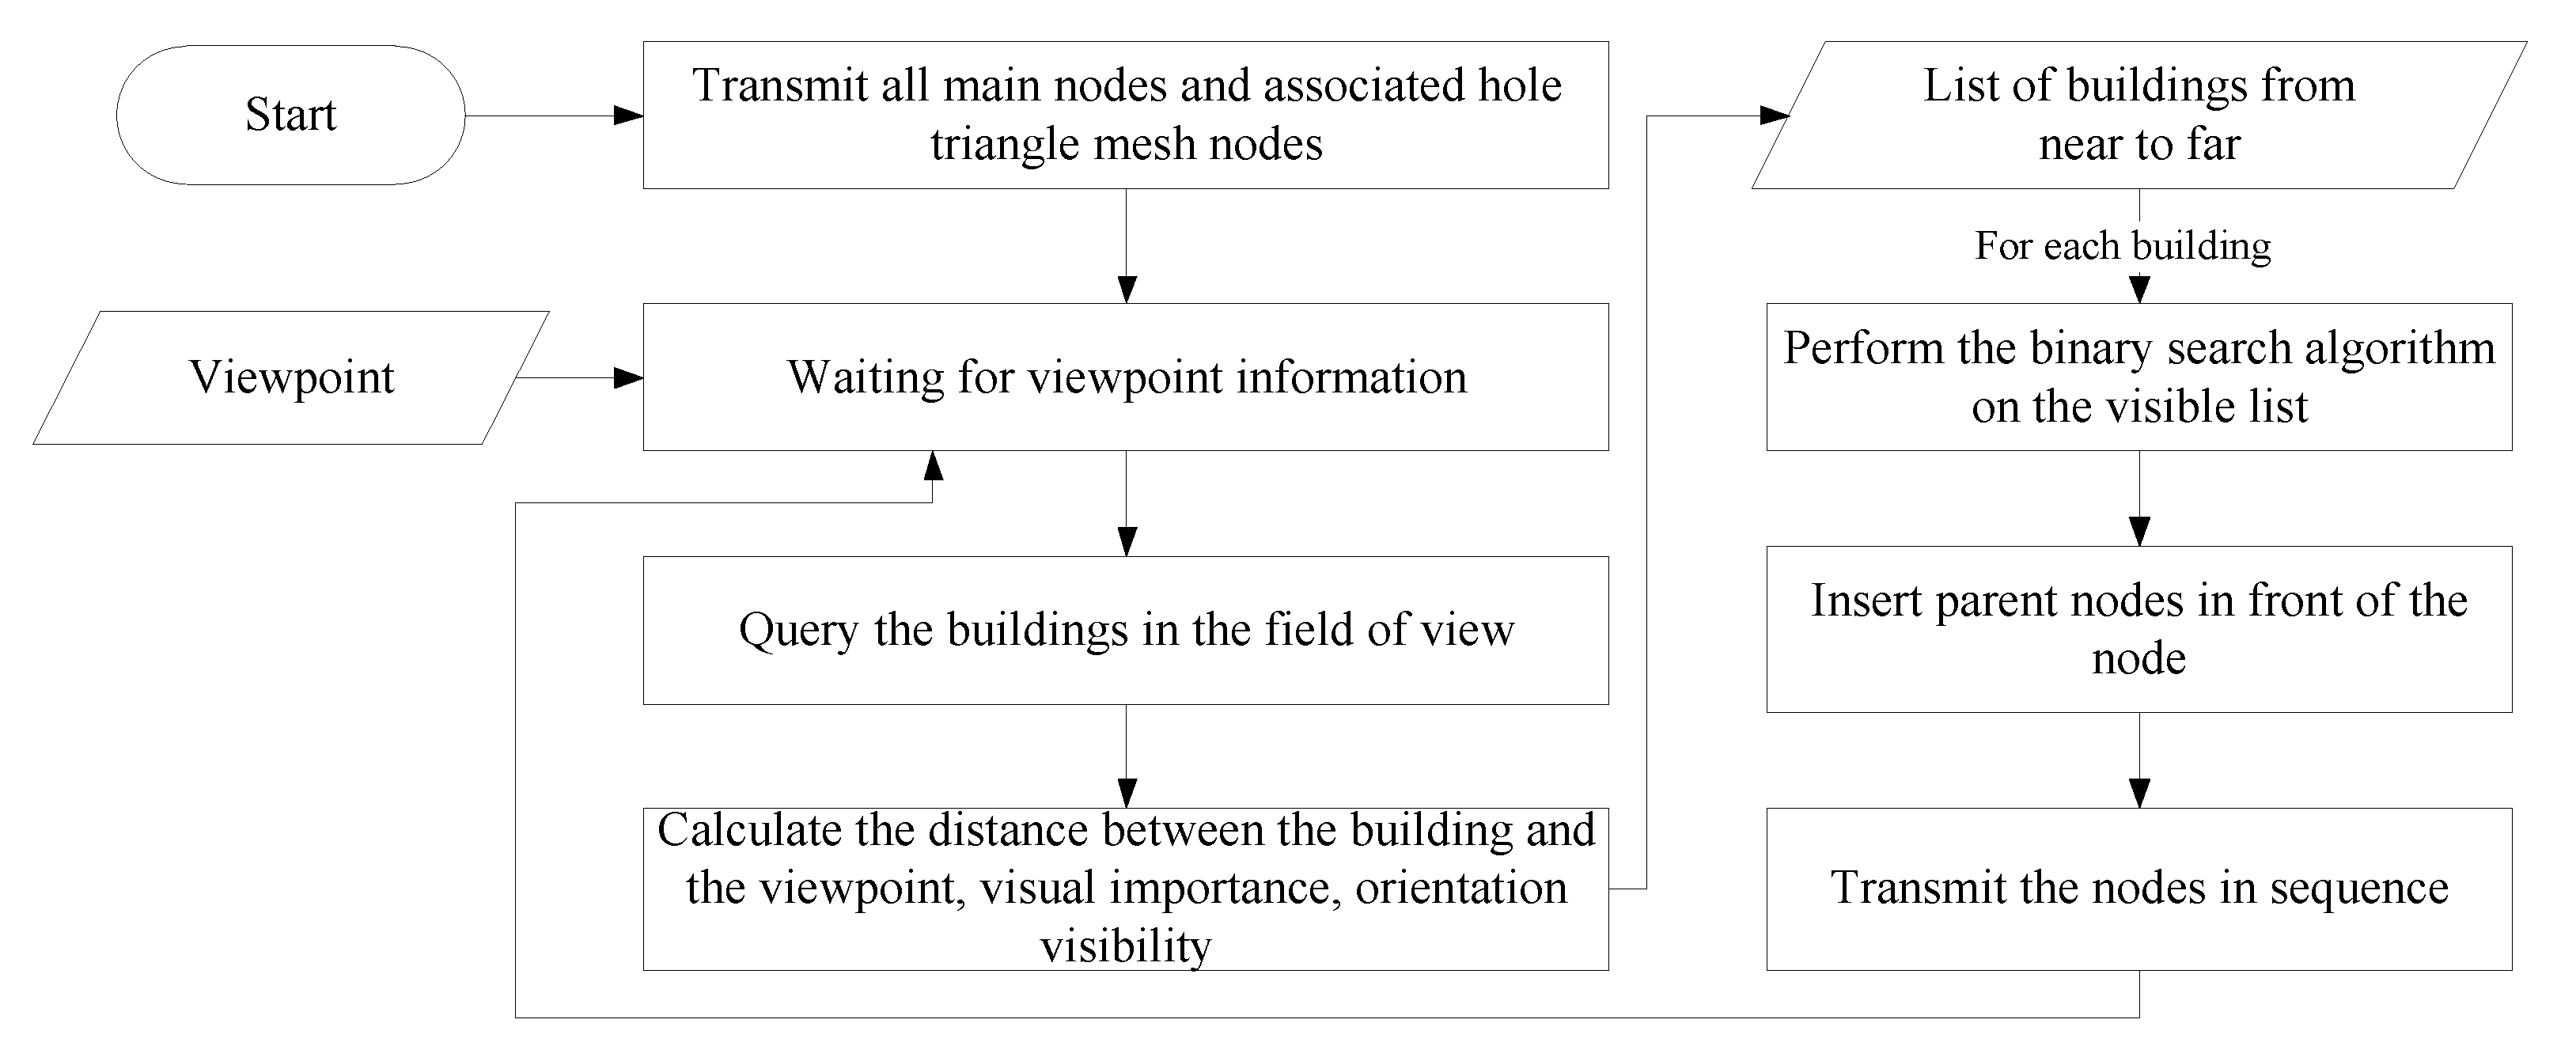
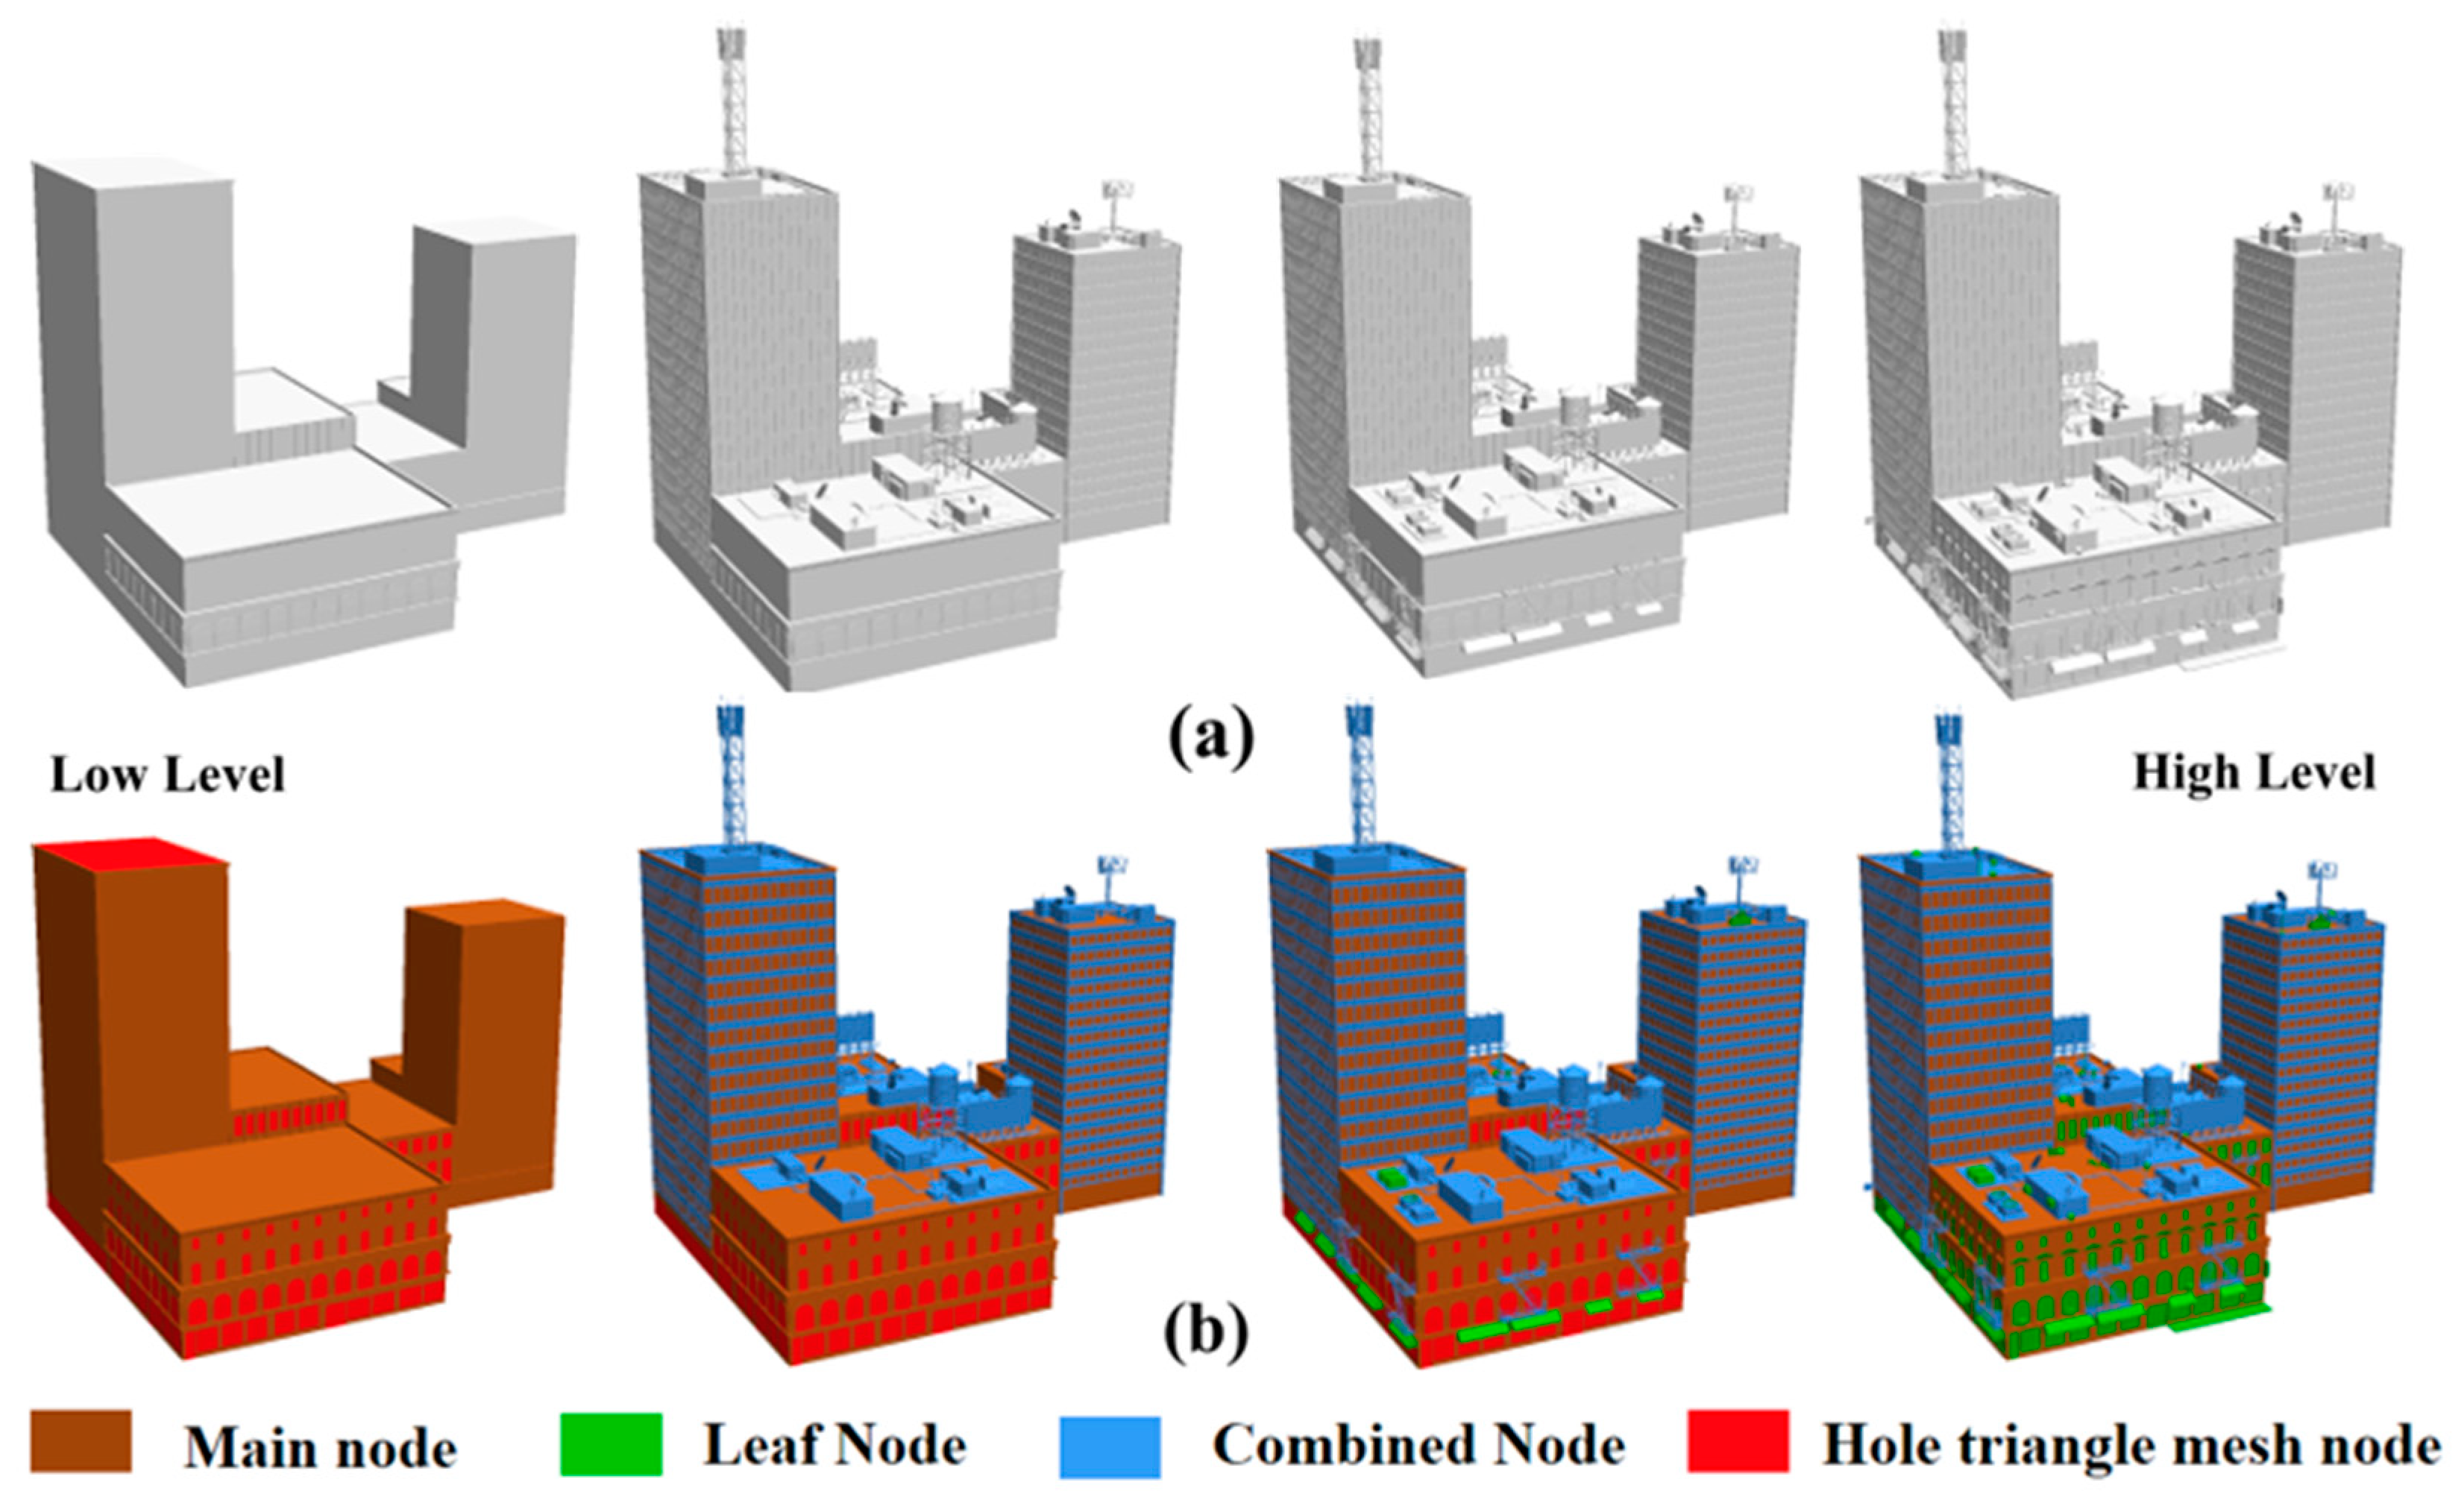
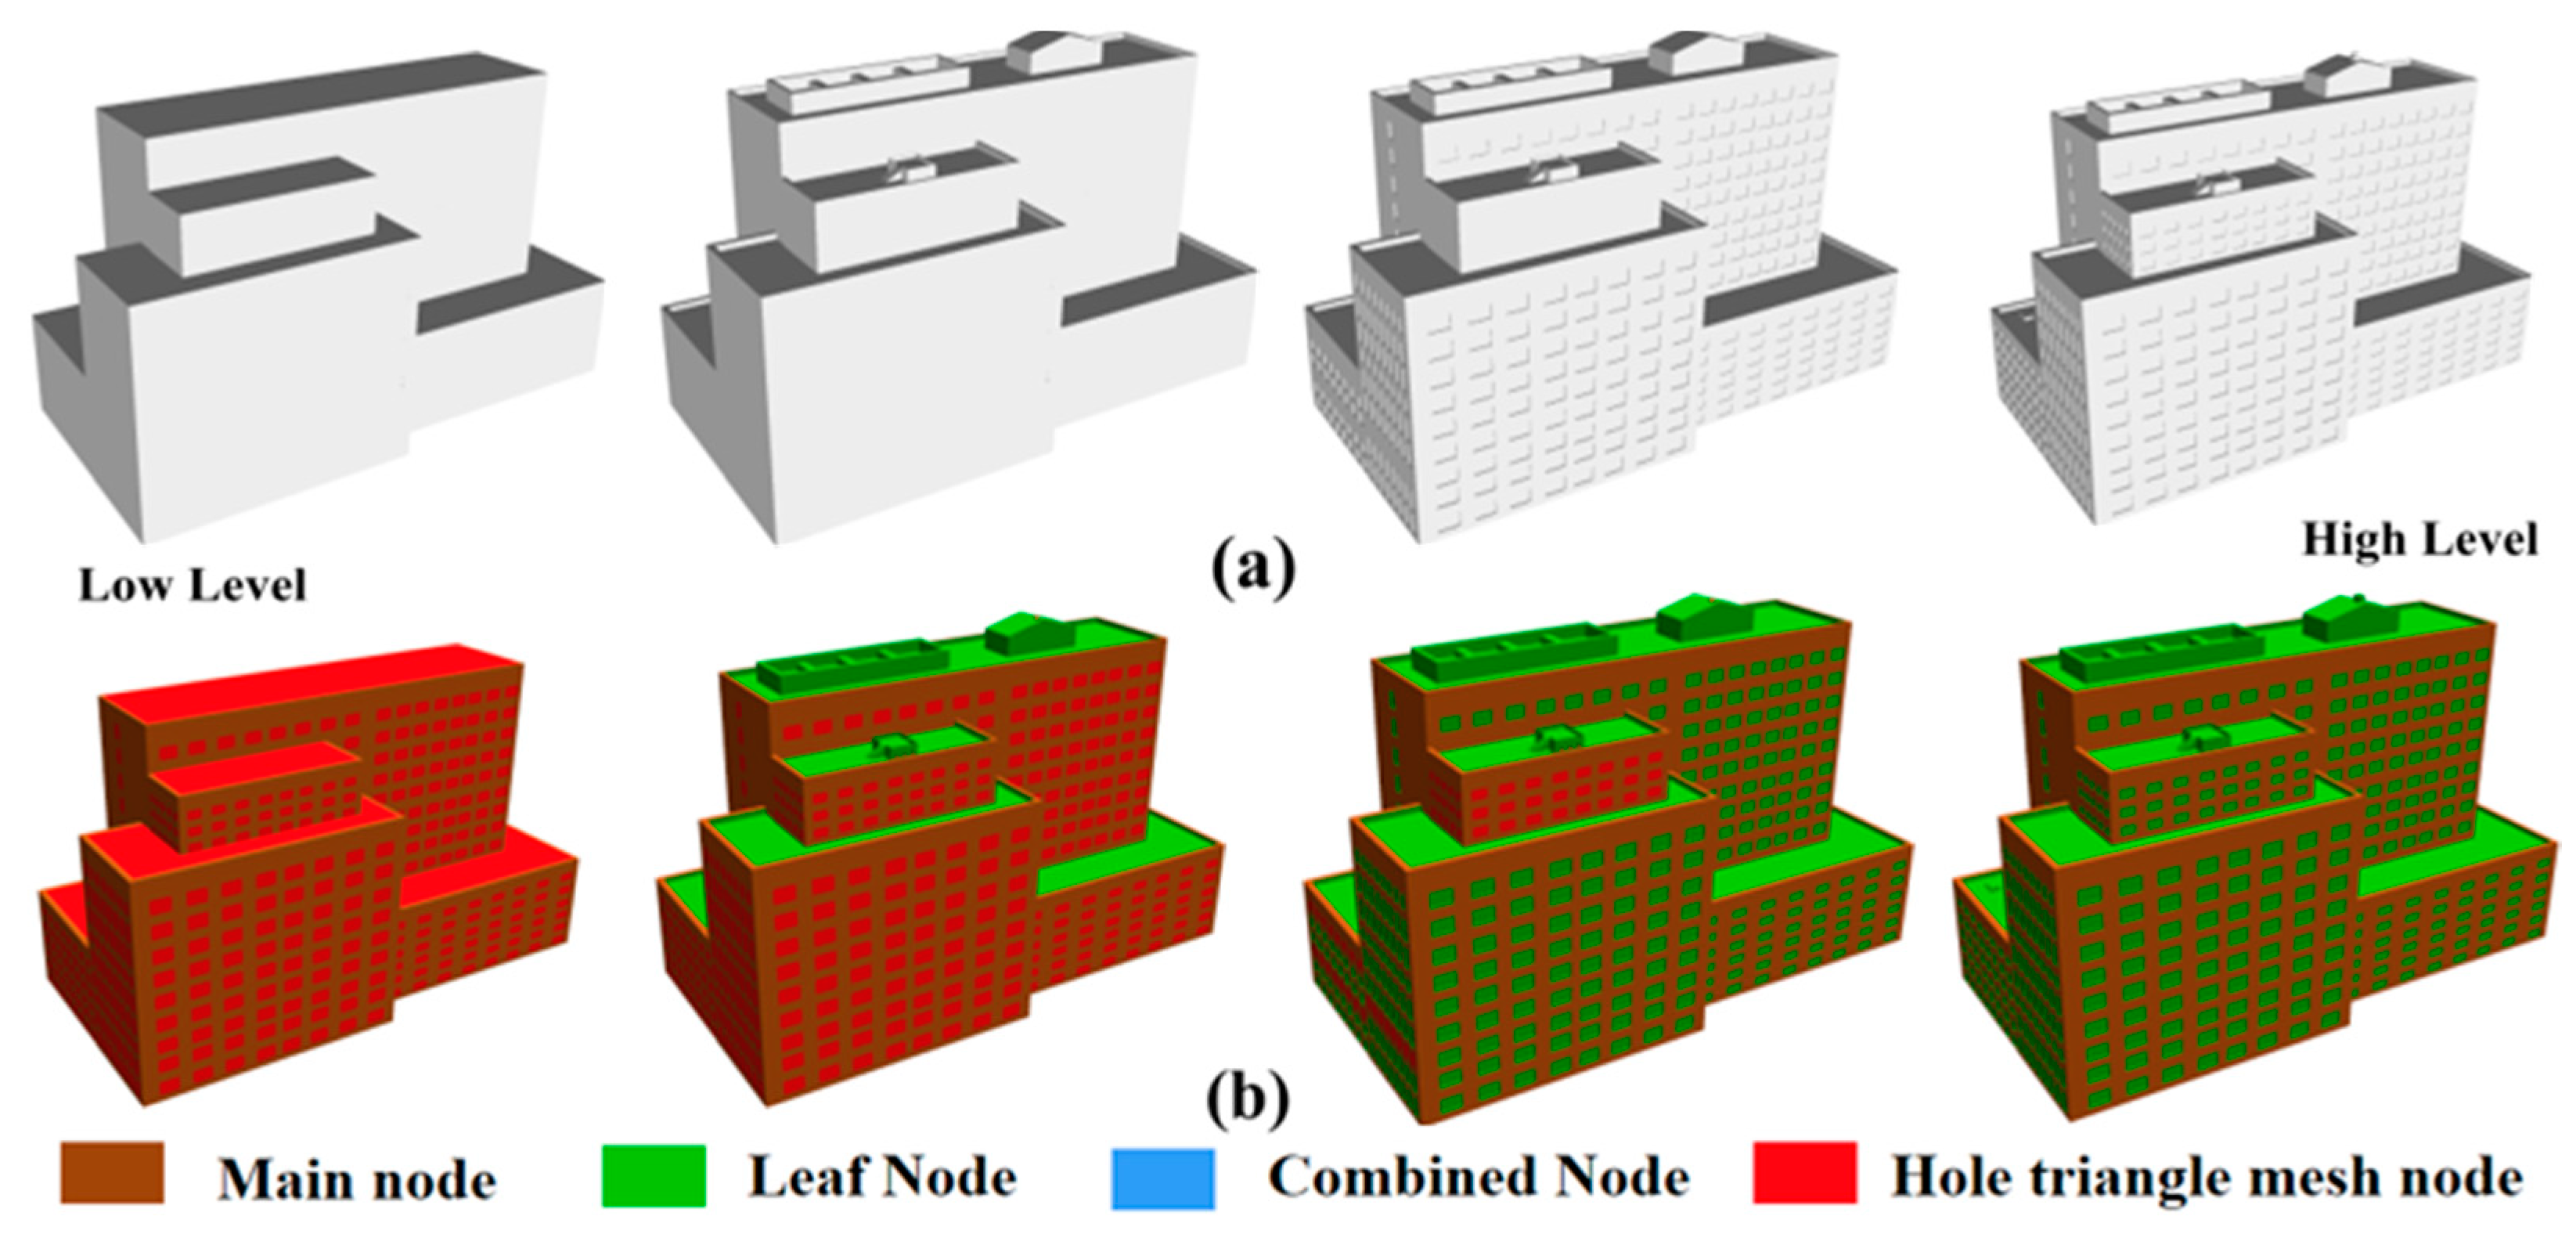
3.3. Real-Time Progressive Transmission

In the real-time transmission stage, viewpoint information is transmitted from the client to the server. From this viewpoint, the server obtains the transmission nodes that need to be loaded in the current scene and transmits them to the client in an orderly manner. Subsequently, the client receives data and renders it to realize progressive refinement of the building structure. In traditional methods, the refinement units of the model are usually vertices and edges, which require additional reconstruction of the triangle mesh. In this study, the proposed method uses the structure as the refinement unit, and data is directly added to the scene, which avoids the reconstruction of the triangle mesh. This is more efficient at runtime.
To speed up the search for nodes that need to be transmitted, we maintain a data structure for each building model on the server, recording the building ID, the center location of the building, the main node, and six lists in order. Each list stores nodes visible in six directions. The nodes in the list are organized in descending order of their visual importance:
Struct Building{
  Unsigned int BuildingID;
  Vector3f Center;
  TransmissionNode MainNode;
  List LeftNodeList;
  List RightNodeList;
  List TopNodeList;
  List BottomNodeList;
  List FrontNodeList;
  List BackNodeList;
}
Struct TransmissionNode{
  Unsigned int NodeID
  List HoleTriangleMeshNodeIDList;
  Float VirualImportance;
  Data * renderData;
}
The process to obtain the expected transmission nodes is shown in Figure 9. When the scene is loaded for the first time, the server transmits the main nodes of all the buildings and their associated hole triangle mesh nodes. When roaming in the scene, the server first performs a spatial query to filter the buildings in the field of view. Then, the distance between the viewpoint and each building model was calculated based on the center position of each building. Calculate the minimum visual importance of the transmission node that needs to be loaded in each building model based on the distance, and the visible orientation of the building model based on the position of the viewpoint relative to the building model. According to the minimum visual importance, the binary search algorithm is used to find the nodes that need to be transmitted from the visible ordered list of each building, and the order of the nodes is organized in descending order of visual importance. If the parent node of a child node has not been transmitted, the parent node is inserted in front of the child node to ensure that the parent node is transmitted before the child node. A hash set is created on the server to save transmission nodes that have been transmitted, thereby avoiding repeated transmissions.
A list of rendering nodes that have been added to the scene is maintained on the client side, known as the transmission node list (TNL). When a new transmission node arrives, if there is a hole triangle mesh node associated with the new node in the TNL, the current triangle hole node is removed.

4. Results

To verify the feasibility of the proposed method, a prototype system was designed. This system includes three parts: preprocessing, server and client. Specifically, the preprocessing part reads the model, extracts the structure, creates the transmission node and stores the transmission node data to a disk file. The server sends the transmission node data dynamically according to the viewpoint information received. The client sends the current viewpoint information, receives the transmission node data sent by the server and adds it to the scene for rendering. The software solution for the test results was developed using Microsoft Visual Studio 2017, the programming language was C++, the client and server programs were both windows console applications and the client used OpenSceneGraph (OSG) as the 3D rendering engine. The operating system was 64-bit Windows10, the processor was Intel Core i7-7700HQ, the graphics card was NVIDIA GeForce 940MX and 16 GB of memory.
The results of this method are discussed in two aspects. First, we chose two different types of classic models to show the structure extraction results of our algorithm. By comparing with traditional algorithms in Model 3, we show the appearance of Model 3 at different simplification levels. Second, we counted the data loading of the algorithm for large-scale urban scenes. The statistical information of the model used in this study was shown in Table 1.

4.1. Progressive Encoding Results

4.1.1. Structure Extraction and Transmission Node Construction Results

To demonstrate the extraction ability of the structure extraction algorithm, the experiment was performed on two models, one with abundant independent structure (Model 1) and the other with abundant attached structure (Model 2). Both models were developed using the 3DS max.
Figure 10 shows the structure extraction and transmission node construction results of Model 1, which is a building in a block in New York City, USA. As shown in Figure 10b, the model has several independent structures, which are small in size and serve as decorative effects. Figure 10d shows the construction results of the transmission node. The building model contains several combined nodes, such as signal towers and billboards.
Figure 11 shows the structure extraction and transmission node construction results of Model 2, which has an abundant attached structure. Figure 11b depicts that the building model has almost no independent structure. Figure 11c shows the extraction results for the attached structure. Simple attached structures are mainly windows, which are the most common structures in modern buildings. Complex modern buildings are almost covered with windows. In addition, some complex attached structures have been extracted, such as the combination of stairs and rooftops. Figure 11d shows that the attached structure is mostly constructed as leaf nodes.
Figure 12a and Figure 13a illustrate that the building model is refined by receiving transmission nodes. In this process, the appearance of the model is not unrealistically deformed. In Figure 12b and Figure 13b, the hole triangle mesh node temporarily replaces the associated node in the low-level building model, maintaining its main appearance. Notably, when the associated node is received, the hole triangle mesh node is replaced by the associated node. The building is refined with structures as a unit, which enhances the user’s understanding of the building design process and design rules. However, directly loading the structure brings visual popping effects to the user. In the future, we consider using simplified nodes to reduce visual popping effects before loading fine nodes.

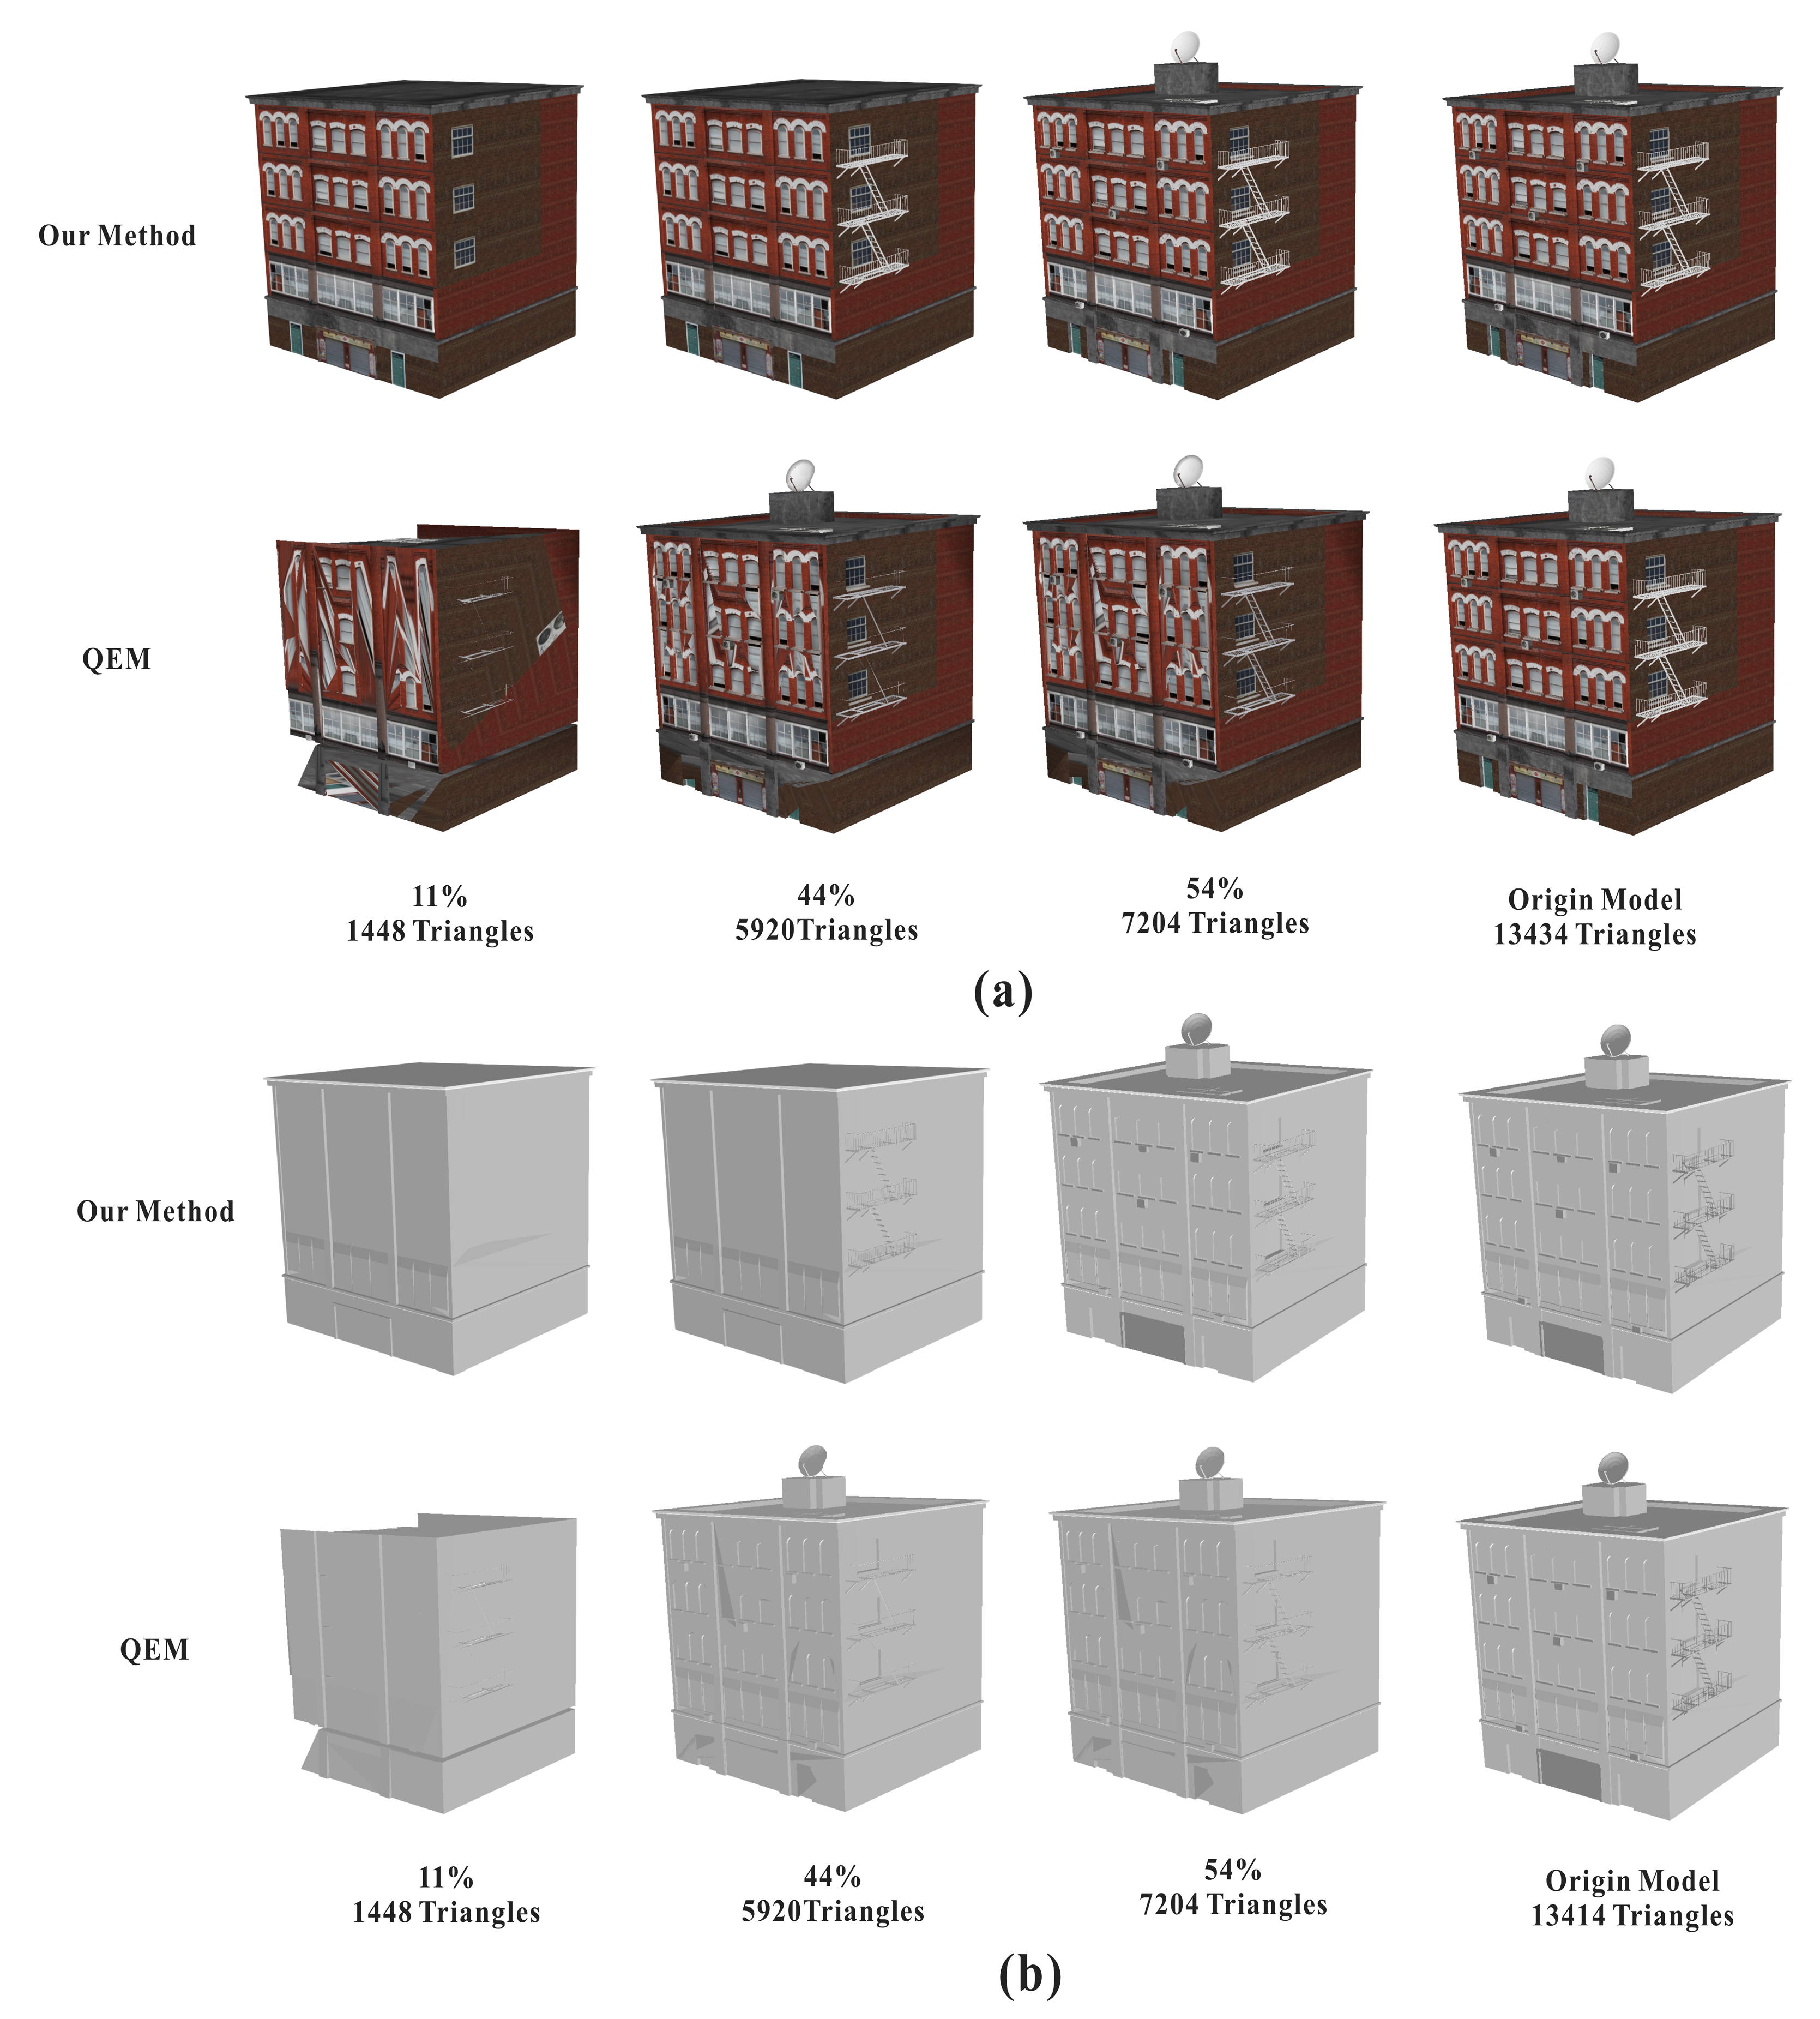
4.1.2. Compared with Traditional Algorithms

Existing progressive encoding algorithms for 3D models are typically based on a simplified operation. As a classic simplification algorithm, QEM is often used to simplify various 3D models and can always achieve satisfactory effects. To compare the effect of the progressive encoding results of the building models, we chose the QEM for comparison.
In Figure 14a, when Model 3 is simplified to 44% by QEM, the stairs are partially simplified. Nevertheless, the proposed method constructs the stairs as a combined node for transmission. When Model 3 is simplified to 11% by QEM, the wall of Model 3 is oversimplified. However, the wall usually occupies a large visual area and has high visual importance. The simplification based on edge collapse makes it challenging to maintain geometric characteristics. For example, it destroys the parallel relationship between window and wall, and simplifies the triangle of the wall to overlapping triangles, causing flicker (Z-fighting problem) [34]. The proposed algorithm avoids over-simplification of main structures, such as walls, using only 54% of data, and all the details of the visible orientation were restored. In the case of a poor network environment, the rough building model cannot be refined for a long time. Since the proposed method can maintain the main appearance under various simplification rates, it will give users a better experience.

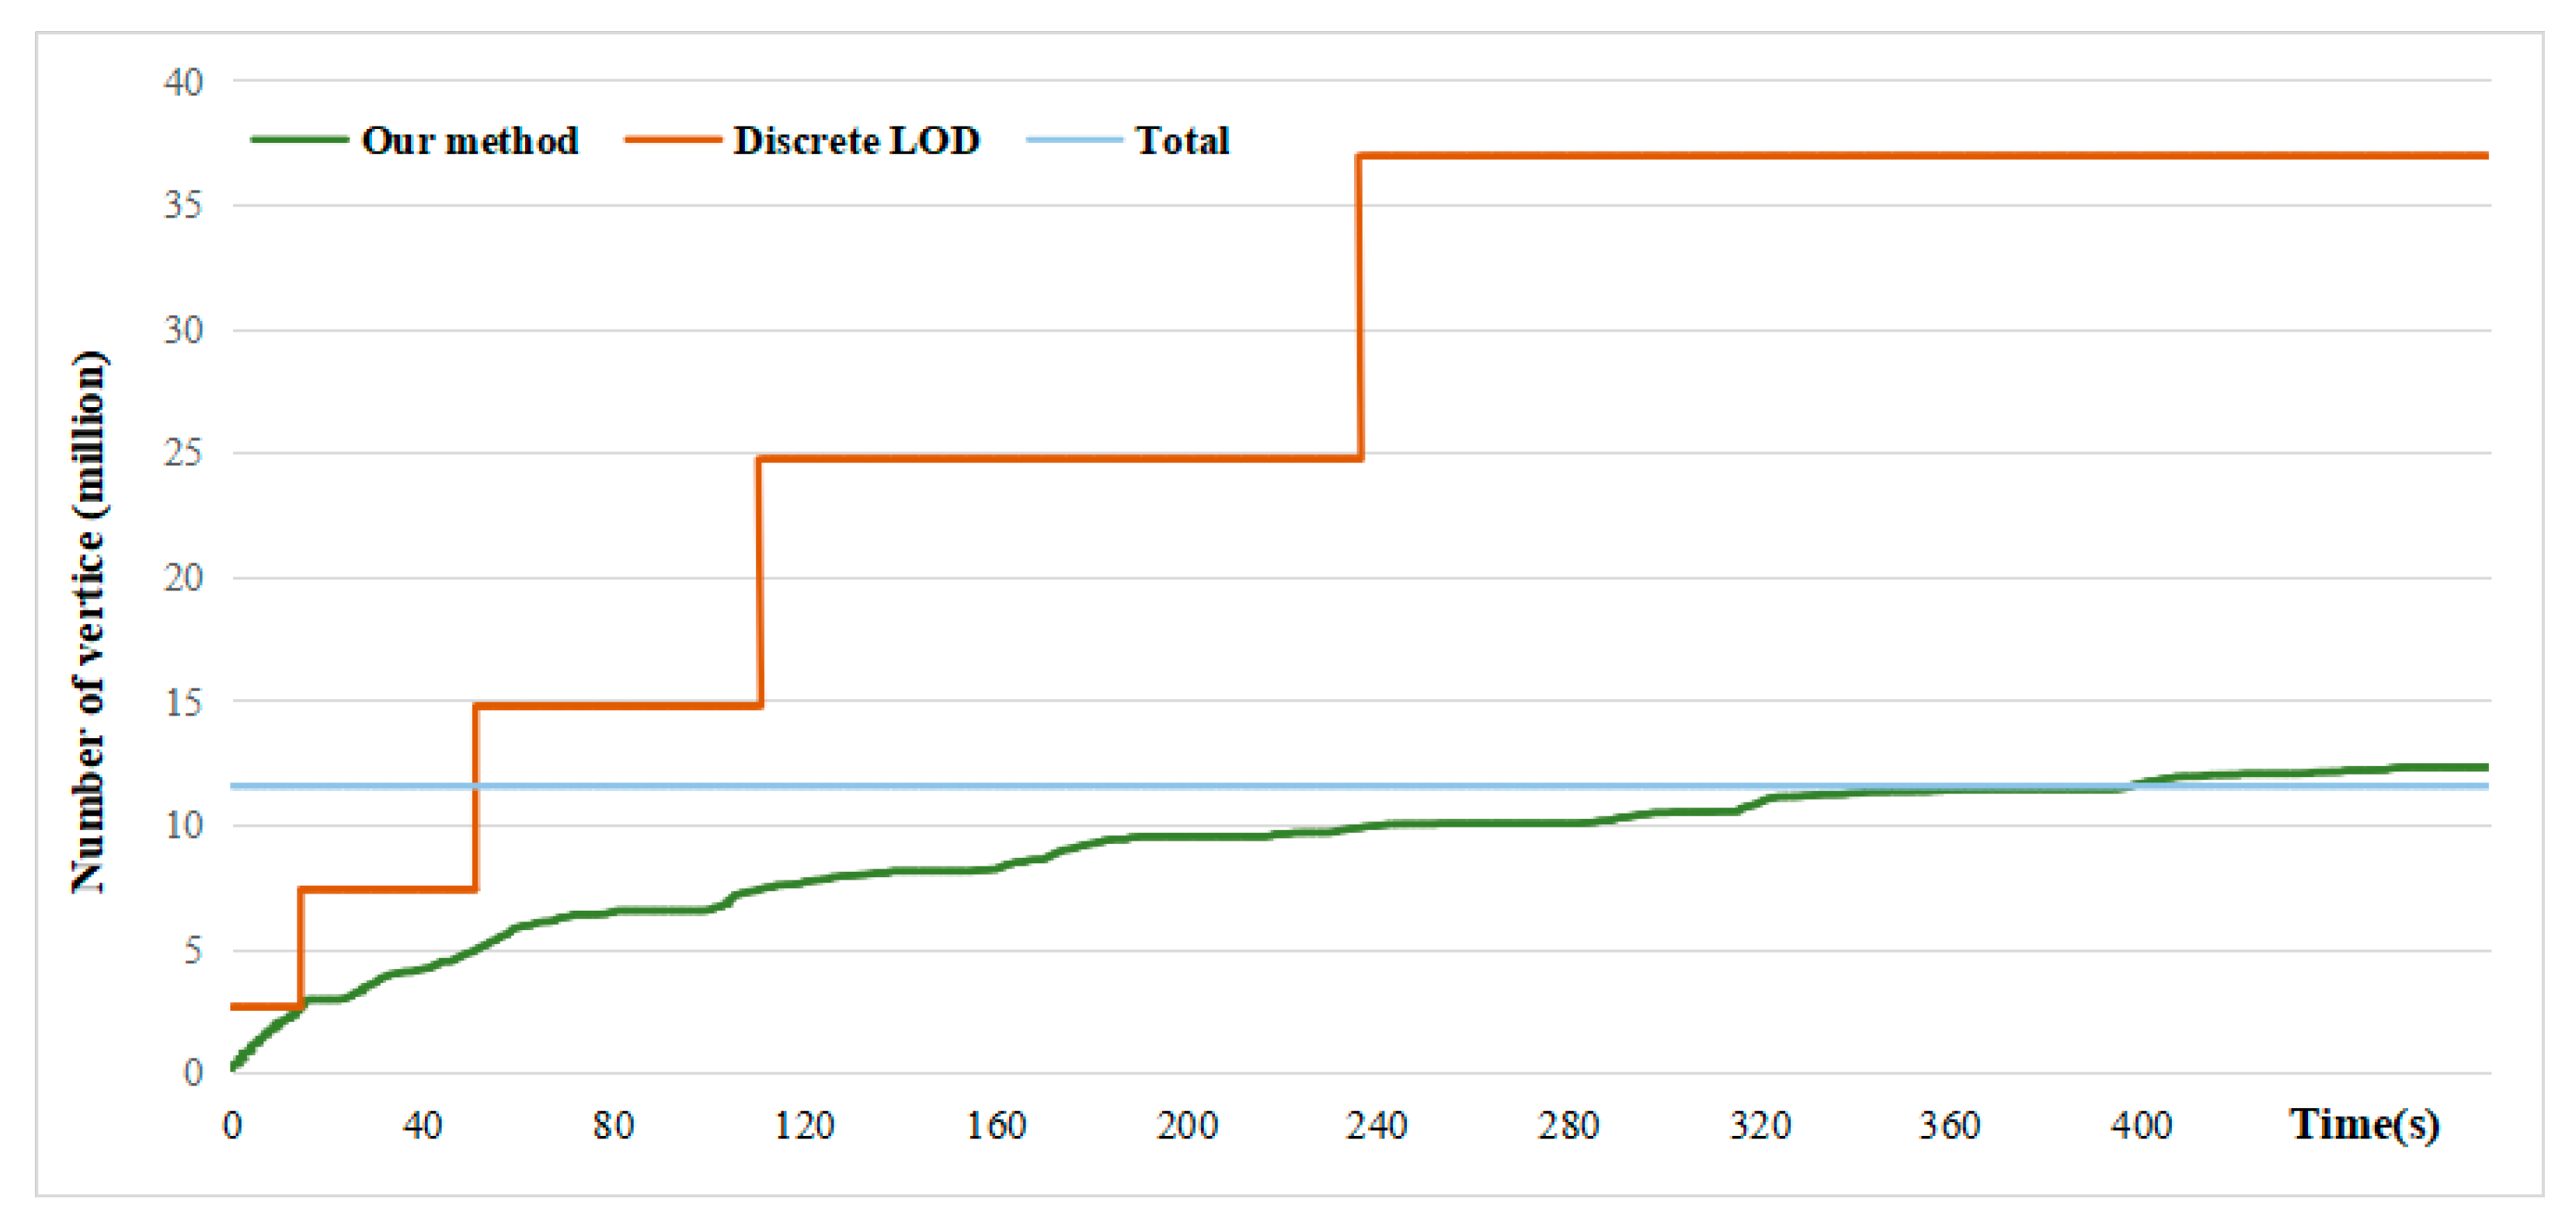
4.2. Transmission Efficiency

In the case of limited network bandwidth, the transmission time of the 3D building models is primarily affected by the total transmitted data. We used the cumulative number of transmitted vertices as an indicator to measure the total transmitted data. When roaming in a city scene, the proposed method and discrete LODs are used to load all scene data, and the number of vertices in the scene is counted in real-time. An urban scene is shown in Figure 15. The total number of buildings was 466, and the total amount of data is shown in Table 1.
As shown in Figure 16, we calculated the number of vertices in a scene using discrete LODs. The simplification rates of the five levels of discrete LOD were 80%, 60%, 40%, 20% and 0%, respectively. Since the models of different levels of discrete LOD are not related, substantial data is repeatedly transmitted. The total amount of data loaded by the proposed algorithm was slightly higher than the total data volume of the model when all the data of the model were loaded. This is because the data of the hole triangle mesh node are redundant. The experiments showed that the redundant data in this scenario accounted for 6.5% of the total data, which had little influence on the transmission.
In the local area network (LAN), we used two metrics to measure the rendering and transmission performance of the system: rendering frame rate and delay time. The rendering frame rate is the number of frames rendered per second. The delay time is the time it takes for a node to be requested until it is added to the scene, including the time for reading, transmitting, receiving and adding to the scene. After receiving the nodes, the client directly adds the nodes to the scene without reconstructing the existing mesh, which is efficient. As shown in Table 2, the average value of the rendering frame rate is 88. Due to the viewpoint-dependent strategy, only visible nodes are transmitted, which reduces the instantaneous transmission load. The average value of the delay time is 38 ms. The experimental results show that the proposed method can browse smoothly in large city scenes.

5. Discussion

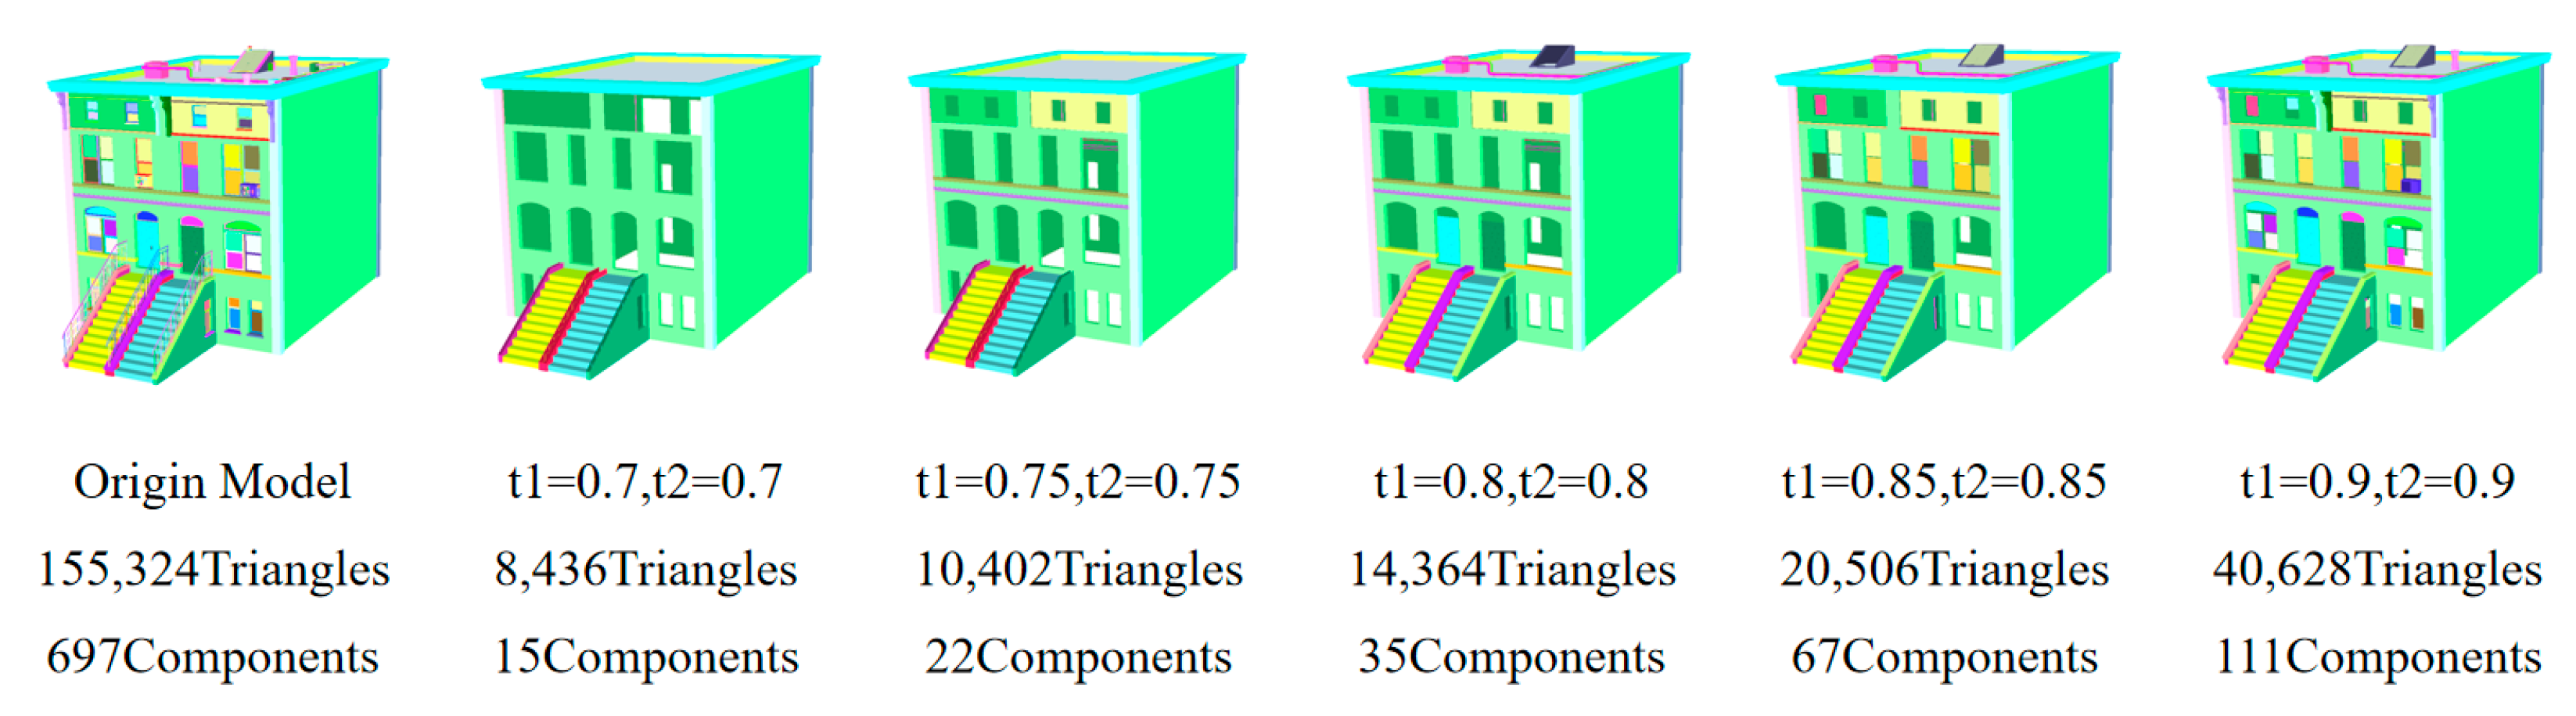
5.1. About the t1 and t2

To extract the main components, t1 and t2 are introduced, as in Section 3.1.2. The t1 and t2 in this study are between 0.8 and 0.95, and each model has its own t1 and t2. As shown in Figure 17, if the t1 and t2 values are too low, some main components may not be extracted, which affects the appearance of the basic mesh. If the t1 and t2 values are too high, the amount of data in the basic mesh will be too large, which leads to slow floading of the basic mesh. To balance the basic mesh data and appearance effect, t1 and t2 should be set reasonably for each building model. In the follow-up work, the feature vector will be constructed by extracting the features of the components of the building, such as volume, surface area, number of adjacent components and the orientation of the building, etc., using artificial intelligence methods, such as support vector machines, and neural network methods to classify building components, so as to obtain main components.

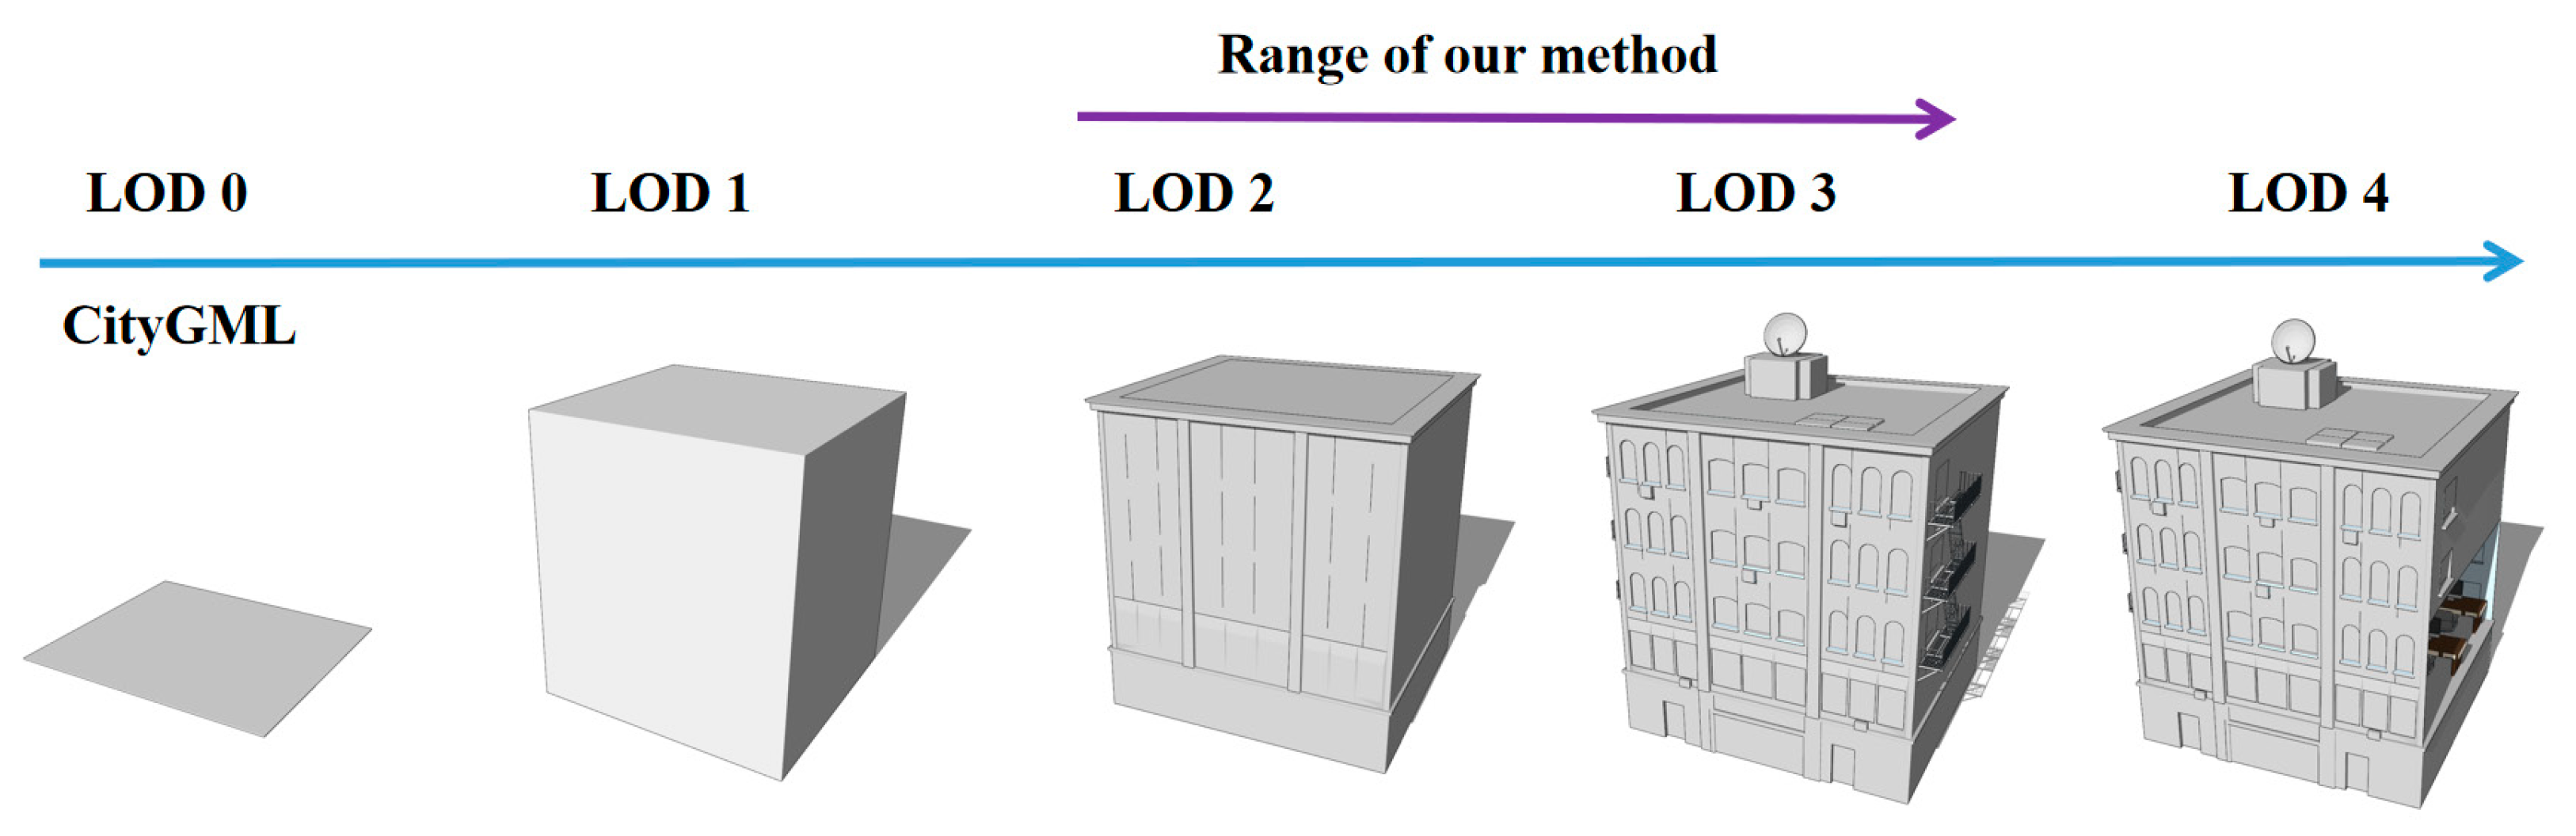
5.2. From our Method to CityGML

The Open Geospatial Consortium (OGC) proposed CityGML [35], which defines five levels of 3D building models, from rough model to fine model, LOD0 to LOD4. As shown in Figure 18, the encoding level of the proposed method is between LOD2 and LOD3. The basic mesh (main node) can be understood as LOD2 retains the roof and borders, and changes to LOD3 by continuously increasing the details of doors and windows. The proposed method provides a new idea for the generation of LOD2 and LOD3.

6. Conclusions

A novel 3D building model encoding method was proposed for progressive transmission. Unlike the traditional algorithm that uses vertices, edges or triangles as encoding units, the proposed method decomposes the 3D building models into three types of structures. In addition, it wraps these structures as the smallest incremental transmission unit, named transmission node, guided by connections among structures. Based on the real-time position of the viewpoint and attributes of the nodes, the expected nodes are dynamically picked up and responded to the client. A series of experiments confirmed that the proposed method could better maintain geometric and topological characteristics while encoding 3D building models, and effectively avoids the structural cognitive ambiguity of the building. While serving for transmission, the real-time network load is significantly reduced.
There are still some limitations in structural recognition—the proposed method may not extract the main structure entirely and accurately from a building with several separately modeled walls. Second, the proposed method could not entirely extract the attached structures embedded in multiple faces. Recently, artificial intelligence methods have been developed rapidly, which have a strong ability of learning and induction. By extracting and constructing the features of the components of the building, artificial intelligence methods, such as the support vector machine method, can classify the building components accurately to obtain the main components. In addition, many successful algorithms, such as neural networks, have been proposed in the field of computer-aided design for identifying the structural characteristics of interaction. Encoding the face relationship of the building and the topological relationship of the geometric structure, constructing and training the artificial neural network model can extract more complex building structures. This is worthy of further investigation.

Author Contributions

Conceptualization, Jiwei Dong; methodology, Jiwei Dong, Junzhong Tan and Jiangfeng She; software, Jiwei Dong and Qiang Zhao; validation Jiwei Dong; visualization, Jiwei Dong, Junzhong Tan and Sirui Li; Writing—original draft, Jiwei Dong; Writing—review and editing, Jiwei Dong, Lixia He and Qiang Zhao; project administration, Jiangfeng She; funding acquisition, Jiangfeng She. All authors have read and agreed to the published version of the manuscript.

Funding

This research was funded by the National Natural Science Foundation of China, grant number 41871293 and grant number 41371365.

Institutional Review Board Statement

Not applicable.

Informed Consent Statement

Not applicable.

Data Availability Statement

The data presented in this paper are openly available at http://0-doi-org.brum.beds.ac.uk/10.5281/zenodo.4736080 (accessed on 4 May 2021).

Acknowledgments

Thanks to the website https://www.cgtrader.com/ (accessed on 14 March 2019) for providing the free building models.

Conflicts of Interest

The authors declare no conflict of interest.

References

  1. Benner, J.; Geiger, A.; Leinemann, K. Flexible generation of semantic 3D building models. In Proceedings of the 1st International Workshop on Next Generation 3D City Models, Bonn, Germany, 21–22 June 2005; pp. 17–22. [Google Scholar]
  2. Cheng, I.; Basu, A.; Pan, Y. Parametric foveation for progressive texture and model transmission. In Proceedings of the Eurographics, Granada, Spain, 1–5 September 2003. [Google Scholar]
  3. Heok, T.K.; Daman, D. A review on level of detail. In Proceedings of the International Conference on Computer Graphics, Imaging and Visualization, 2004: CGIV 2004, Penang, Malaysia, 26–29 July 2004; pp. 70–75. [Google Scholar]
  4. Alliez, P.; Desbrun, M. Progressive compression for lossless transmission of triangle meshes. In Proceedings of the 28th Annual Conference on Computer Graphics and Interactive Techniques, Los Angeles, CA, USA, 12–17 August 2001; pp. 195–202. [Google Scholar]
  5. Bajaj, C.L.; Pascucci, V.; Zhuang, G. Progressive compression and transmission of arbitrary triangular meshes. In Proceedings of the Visualization’99 (Cat. No. 99CB37067), San Francisco, CA, USA, 24–29 October 1999; pp. 307–537. [Google Scholar]
  6. Chen, J.; Li, J.; Li, M. Progressive Visualization of Complex 3D Models Over the Internet. T Gis 2016, 20, 887–902. [Google Scholar] [CrossRef]
  7. Yang, S.; Kim, C.S.; Kuo, C.C.J. A Progressive View-Dependent Technique for Interactive 3-D Mesh Transmission. IEEE Trans. Circuits Syst. Video Technol. 2004, 14, 1249–1264. [Google Scholar] [CrossRef]
  8. Rosenbaum, R.; Schumann, H. Progressive refinement: More than a means to overcome limited bandwidth. In Proceedings of the Visualization and Data Analysis 2009, San Jose, CA, USA, 19–20 January 2009; p. 72430. [Google Scholar]
  9. Hoppe, H. Progressive meshes. In Proceedings of the 23rd Annual Conference on Computer Graphics and Interactive Techniques, New Orleans, LA, USA, 23–28 July 1996; pp. 99–108. [Google Scholar]
  10. Skabek, K.; Ząbik, Ł. Network Transmission of 3D Mesh Data Using Progressive Representation. In Proceedings of the International Conference on Computer Networks, San Francisco, CA, USA, 19–20 December 2009; pp. 325–333. [Google Scholar]
  11. Kada, M. Scale-dependent simplification of 3D building models based on cell decomposition and primitive instancing. In Proceedings of the International Conference on Spatial Information Theory, Melbourne, Australia, 19–23 September 2007; pp. 222–237. [Google Scholar]
  12. Sun, X. Structure Based Multi-resolution Representation Approach for 3D Building Models. In Proceedings of the 2011 19th International Conference on Geoinformatics, Shanghai, China, 24–26 June 2013. [Google Scholar]
  13. Sakurai, H.; Gossard, D.C. Shape Feature Recognition from 3D Solid Models; ASME Computers in Engineering: San Francisco, CA, USA, 1988. [Google Scholar]
  14. Shi, Y.; Deng, Z.; Zhong, J. Recent Research and Prospect on Feature Recognition of Three-dimensional Model. In Proceedings of the 2018 3rd International Conference on Control, Automation and Artificial Intelligence (CAAI 2018), Beijing, China, 26–27 August 2018. [Google Scholar]
  15. Joshi, S.; Chang, T.-C. Graph-based heuristics for recognition of machined features from a 3D solid model. Comput. Aided Design 1988, 20, 58–66. [Google Scholar] [CrossRef]
  16. Gao, S.; Shah, J.J. Automatic recognition of interacting machining features based on minimal condition subgraph. Comput. Aided Des. 1998, 30, 727–739. [Google Scholar] [CrossRef]
  17. Iyer, N.; Jayanti, S.; Lou, K.; Kalyanaraman, Y.; Ramani, K. Three-dimensional shape searching: State-of-the-art review and future trends. Comput. Aided Des. 2005, 37, 509–530. [Google Scholar] [CrossRef]
  18. Jun, Y.T.; Raja, V.H. Extracting geometric attributes directly from scanned data sets for feature recognition. Int. J. Comput. Integr. Manuf. 2002, 15, 50–61. [Google Scholar] [CrossRef]
  19. Shi, Y.; Zhang, Y.; Xia, K.; Harik, R. A Critical Review of Feature Recognition Techniques. Comput.-Aided Design Appl. 2020, 17, 861–899. [Google Scholar] [CrossRef]
  20. Li, Q.Q.; Sun, X.; Yang, B.S.; Jiang, S.B. Geometric structure simplification of 3D building models. ISPRS J. Photogramm 2013, 84, 100–113. [Google Scholar] [CrossRef]
  21. Thiemann, F.; Sester, M. Segmentation of buildings for 3D-generalisation. In Proceedings of the ICA Workshop on generalisation and multiple representation, Leicester, UK, 20–21 August 2004. [Google Scholar]
  22. Ribelles, J.; Heckbert, P.S.; Garland, M.; Stahovich, T.; Srivastava, V. Finding and removing features from polyhedra. In Proceedings of the DETC, Pittsburgh, PA, USA, 9–12 September 2001; pp. 1–10. [Google Scholar]
  23. Kada, M. Automatic generalization of 3D building models. Int. Arch. Photogramm. Remote Sens. Spat. Inf. Sci. 2002, 34, 243–248. [Google Scholar]
  24. Popović, J.; Hoppe, H. Progressive simplicial complexes. In Proceedings of the 24th Annual Conference on Computer Graphics and Interactive Techniques, Los Angeles, CA, USA, 3–8 August 1997; pp. 217–224. [Google Scholar]
  25. Hoppe, H. View-dependent refinement of progressive meshes. In Proceedings of the 24th Annual Conference on Computer Graphics and Interactive Techniques, Los Angeles, CA, USA, 3–8 August 1997; pp. 189–198. [Google Scholar]
  26. Ming, H.B.; Na, L.X. A modified generating algorithm of progressive mesh model based on the importance degree of vertex. In Advanced Materials Research; Trans Tech Publications Ltd.: Stafa-Zürich, Switzerland, 2014; pp. 1623–1626. [Google Scholar]
  27. Garland, M.; Heckbert, P.S. Surface simplification using quadric error metrics. In Proceedings of the 24th Annual Conference on Computer Graphics and Interactive Techniques, Los Angeles, CA, USA, 3–8 August 1997; pp. 209–216. [Google Scholar]
  28. Kada, M. Progressive Transmission of 3D Building Models based on String Grammars and Planar Half-Spaces. ISPRS Ann. Photogramm. Remote Sens. Spat. Inf. Sci. 2014, 2, 9–14. [Google Scholar] [CrossRef] [Green Version]
  29. Sun, X. Multilevel semantic modelling of urban building space based on the geometric characteristics in 3d environment. Int. Arch. Photogramm. Remote Sens. Spatial Inf. Sci. 2018, 42, 4. [Google Scholar] [CrossRef] [Green Version]
  30. She, J.F.; Gu, X.Y.; Tan, J.Z.; Tong, M.; Wang, C.F. An appearance-preserving simplification method for complex 3D building models. Trans. GIS 2019, 23, 275–293. [Google Scholar] [CrossRef]
  31. Gao, S.; Zhao, W.; Lin, H.; Yang, F.; Chen, X. Feature suppression based CAD mesh model simplification. Comput. Aided Des. 2010, 42, 1178–1188. [Google Scholar] [CrossRef]
  32. Du, Z.; Luo, P.; Zhu, X.; Zhang, Y.; Zhu, Y. Texture Optimization Methodology for 3D Building Based on Super Face. Geomat. Inf. Sci. Wuhan Univ. 2014, 39, 1401–1405. [Google Scholar]
  33. Zhao, J.; Zhu, Q.; Du, Z.; Feng, T.; Zhang, Y. Mathematical morphology-based generalization of complex 3D building models incorporating semantic relationships. ISPRS J. Photogramm. Remote Sens. 2012, 68, 95–111. [Google Scholar] [CrossRef]
  34. Pool, J.; Lastra, A.; Singh, M. Energy-precision tradeoffs in mobile graphics processing units. In Proceedings of the 2008 IEEE International Conference on Computer Design, Lake Tahoe, CA, USA, 12–15 October 2008; pp. 60–67. [Google Scholar]
  35. Fan, H.; Meng, L. Automatic derivation of different levels of detail for 3D buildings modeled by CityGML. In Proceedings of the 24th International Cartography Conference, Santiago, Chile, 15–21 November 2009; pp. 15–21. [Google Scholar]
Figure 1. Performance of the building under the transmission of different amounts of data, using the edge as the encoding unit. (a) geometric constraint is broken. (b) topological constraint is broken.
Ijgi 10 00306 g001
Figure 2. Algorithm flowchart.
Ijgi 10 00306 g002
Figure 3. Mesh segmentation results: (a) original 3D building model, and (b) mesh segmentation results. The stairs have rich details and are made up of several components.
Ijgi 10 00306 g003
Figure 4. Face clustering and attached structure extraction: (a) face clustering result of main components, and (b) attached structure extraction result.
Ijgi 10 00306 g004
Figure 5. Extract structure from AAG: (a) Attached structure. The hexagonal prism on the left is a simple attached structure, and the one on the right is a complex attached structure. (b) AAG: The green frame corresponds to the simple attached structure. The yellow frame corresponds to the complex attached structure.
Ijgi 10 00306 g005
Figure 6. Schematic diagram of the transmission node construction. (a) The structure of the building model, and (b) STG. In STG, structures are wrapped as different transmission nodes.
Ijgi 10 00306 g006
Figure 7. All generation paths from structure to transmission node.
Ijgi 10 00306 g007
Figure 8. Results of constructing transmission nodes. (a) Structure extraction results, and (b) construction results of transmission nodes.
Ijgi 10 00306 g008
Figure 9. The flow chart of the server obtaining the transmission node.
Ijgi 10 00306 g009
Figure 10. Structure extraction and transmission node construction results of Model 1. (a) Original model, (b) independent structure extraction results, (c) attached structure extraction results and (d) transmission node construction results.
Ijgi 10 00306 g010
Figure 11. Structure extraction and transmission node construction results of Model 2. (a) Original model, (b) independent structure extraction results, (c) attached structure extraction results and (d) transmission node construction results.
Ijgi 10 00306 g011
Figure 12. Model 1 refines from a low-level model to a high-level model by receiving increments. (a) Geometric structure change of Model 1, and (b) Model 1 receives various transmission nodes.
Ijgi 10 00306 g012
Figure 13. Model 2 refines from a low-level model to a high-level model by receiving increments. (a) Geometric structure change of Model 2, and (b) Model 2 receives various transmission nodes.
Ijgi 10 00306 g013
Figure 14. Comparison between the proposed method and the QEM algorithm on Model 3: (a) texture comparison result, and (b) geometric comparison result.
Ijgi 10 00306 g014
Figure 15. Urban scene.
Ijgi 10 00306 g015
Figure 16. Vertex data volume statistics of the urban scene.
Ijgi 10 00306 g016
Figure 17. The influence of t1 and t2 on the appearance of the building with several separately modeled walls.
Ijgi 10 00306 g017
Figure 18. The range of our method and the LODs of CityGML.
Ijgi 10 00306 g018
Table 1. Model information statistics.
ModelNo. of TrianglesNo. of Independent StructuresNo. of Attached StructuresNo. of
Leaf Nodes
No. of Combined Nodes
Model 1273,708611819728825
Model 214,18367917970
Model 313,434466631747
Urban scene3,938,519232,98038,02751,50312,656
Table 2. Performance statistics.
Frame Rate (fps)Delay Time (ms)
Average8838
Maximum198495
Minimum321
Median7933
Publisher’s Note: MDPI stays neutral with regard to jurisdictional claims in published maps and institutional affiliations.

