Article

Spatiotemporal Patterns of Human Mobility and Its Association with Land Use Types during COVID-19 in New York City

1
Geoinformation and Big Data Research Lab, Department of Geography, University of South Carolina, Columbia, SC 29208, USA
2
Department of Geosciences, University of Arkansas, Fayetteville, AR 72701, USA
*
Author to whom correspondence should be addressed.
ISPRS Int. J. Geo-Inf. 2021, 10(5), 344; https://0-doi-org.brum.beds.ac.uk/10.3390/ijgi10050344
Submission received: 10 April 2021 / Revised: 13 May 2021 / Accepted: 16 May 2021 / Published: 18 May 2021

Abstract

:
The novel coronavirus disease (COVID-19) pandemic has impacted every facet of society. One of the non-pharmacological measures to contain the COVID-19 infection is social distancing. Federal, state, and local governments have placed multiple executive orders for human mobility reduction to slow down the spread of COVID-19. This paper uses geotagged tweets data to reveal the spatiotemporal human mobility patterns during this COVID-19 pandemic in New York City. With New York City open data, human mobility pattern changes were detected by different categories of land use, including residential, parks, transportation facilities, and workplaces. This study further compares human mobility patterns by land use types based on an open social media platform (Twitter) and the human mobility patterns revealed by Google Community Mobility Report cell phone location, indicating that in some applications, open-access social media data can generate similar results to private data. The results of this study can be further used for human mobility analysis and the battle against COVID-19.

1. Introduction

The coronavirus disease 2019 (COVID-19), caused by severe acute respiratory syndrome coronavirus 2 (SARS-CoV-2), was originally detected in Wuhan, China, and rapidly spread worldwide. By 11 June, 2020, more than 7 million cases were confirmed from 216 countries, areas, or territories [1]. By the end of May 2020, 1,782,571 cases and 104,220 deaths were reported in the contiguous United States [2]. Due to its rapid spread and sudden onset of severe symptoms, the World Health Organization (WHO) has declared the COVID-19 outbreak as a Public Health Emergency of International Concern on 30 January 2020, and a pandemic on 11 March 2020. On 12 March 2020, President Trump declared a National Emergency Concerning the COVID-19 outbreak [3].
To combat the spread of COVID-19, unprecedented measures are taken all over the world. One of the most well-known non-pharmacological measures is to keep “social distancing”, including staying at least six feet from other people and no mass gathering [4]. Similar policies of constraining human mobility have been found effective in reducing COVID-19 transmission in China [5,6], South Korea [7], and Italy [8]. In the United States (U.S.), federal, state, and local governments have imposed social distancing measures in March to slow down the spread of COVID-19. Since early March, Governors of multiple states have declared the State of Emergency as more cases were reported and announced public school closures, non-essential business closures, and cancellations of big events. All those social distancing measures have been found to reduce the COVID-19 growth rate [9].
Within the U.S., New York City (NYC) is one of the hardest-hit places at the beginning of the pandemic. Since the first confirmed case on March 3rd, the number of cases has grown rapidly. By 12 June 2020, NYC has 210,538 confirmed cases, which is about one-tenth of the total reported cases in the U.S. [2]. Field hospitals were set up in multiple places, and the USNS Comfort hospital ship arrived in New York Harbor to increase hospital capacity. Governor Cuomo placed the “New York State on PAUSE” executive order that started to be effective on 22 March (hereafter 3/22), which includes strict social distancing measures. However, before the executive order, public schools were closed, and the majority of activities in NYC were suspended.
In responding to the battle of COVID-19, multiple companies have released data about human mobility to the public. For example, Google and Apple, two main companies owning millions of users’ location information, have published their reports on human mobility during the pandemic. However, the mobility reports published by Google and Apple are highly aggregated data, that the raw data are not accessible to the public. On the other hand, social media platforms with open data policies and location-enabled posts have been found effective data sources for human mobility research [10]. This study aims to explore human mobility patterns during the COVID-19 pandemic in NYC with open social media data (Twitter). In addition, this study identifies changes in human mobility patterns spatially and temporally for different land use types based on NYC open data. Specifically, this study addresses the following three questions:
  • What are the spatiotemporal human mobility patterns revealed by Twitter data at the tax lot level?
  • How do human mobility patterns change by different land use types?
  • How are the change patterns detected by Twitter different or similar to the change patterns detected by Google Community Mobility Report?
This paper contributes to the efforts of battling COVID-19 by using big data to reveal human mobility patterns during this pandemic. In addition, this paper bridges the gaps of using open data to detect human mobility changes by different land use types and comparing human mobility patterns revealed by different data sources.

2. Background

2.1. Social Media for Human Mobility in Epidemiological Studies

With the increasing prevalence of geo-enabled social media platforms, an increasing number of people have used social media, such as Facebook and Twitter, as communication tools and information sources [11]. Due to its prevalence, social media data have been used for epidemiological studies. Existing studies have found that social media data are useful in identifying infectious disease outbreaks [12,13], analyzing sentimental reactions and responses [14,15], assessing risks [16], and understanding disease dynamics [17,18]. Before the COVID-19 pandemic, social media data have been used for multiple infectious diseases including Ebola [19,20], Zika [21,22], H1N1 [23,24], dengue [25,26,27], and seasonal influenza [28,29].
Geotagged social media data showed their potential in helping analyze and predict the spread of infectious diseases by deriving human mobility patterns from the data. For example, Albinati et al. generated a prediction model for dengue using Twitter data [25]. Kraemer et al. derived human mobility patterns from Twitter and analyzed spatiotemporal transmission variation of dengue in Lahore, Pakistan [27]. Taking a different approach, Ramadona et al. developed a dynamic mobility-weighted incidence index to analyze the spread of dengue in Yogyakarta, Indonesia [26]. Lai et al. found that mobility patterns retrieved from cellphones are valuable to assess health-related risks for travelers [30]. Barlacchi et al. studied relationships between characteristics of human mobility patterns and whether or not influenza-like symptoms exist [31]. Souza proposed spatial scan statistic methods to identify infection risks from Twitter [32].

2.2. Big Data for Human Mobility in Response to COVID-19

During the COVID-19 pandemic, big data have contributed to fighting against COVID-19 from multiple perspectives [33,34,35,36,37,38]. In the early stage, studies have contributed to understanding the spatiotemporal distribution patterns and spread patterns of COVID-19 confirmed cases in different countries, including China [39,40], Iran [41,42], Italy [43], and South Korea [7]. Due to the high infectious rate and long incubation period, movement tracking and contact tracing were among the key methods applied to constraint the spread of COVID-19 [40,44].
This is usually achieved with mobile phone-based location information [45,46]. Studies have utilized mobile phone location data to detect human mobility changes in China [47], Spain [48], South Korea [49], the U.S. [50,51,52,53,54,55,56,57], and Brazil [58], to name a few. With more countries imposing “stay-at-home” and “keep-social-distancing” policies, big mobility data have been used to analyze the effectiveness of social and political efforts that focus on reducing human movement. For example, how different places responded to reducing-mobility-related orders in the U.S. were analyzed at the state level [59] and county level [51] with mobile phone data. The effectiveness of interventions in different countries was examined with mobility data [30,50,60]. At the individual level, changes in travel behavior have been detected, including transportation mode choice, trip destinations, trip distances, and durations [40,61,62].
Although social media data have been widely used for human mobility studies, limited studies regarding social media and human mobility under this COVID-19 pandemic are found [59,63,64,65]. Existing COVID-19 and social media studies focus more on information propagation [66,67,68,69,70] and text-based analysis of specific topics [71,72,73,74].

3. Study Area and Data

3.1. New York City

NYC includes five boroughs, with each borough being a county in New York State: Bronx (Bronx County), Brooklyn (Kings County), Manhattan (New York County), Queens (Queens County), and Staten Island (Richmond County).
The NYC Department of City Planning published extensive land use and related geographic feature data at the parcel level called PLUTO (Primary Land Use Tax Lot Output) [75]. PLUTO data include 857,205 parcels in total.
In PLUTO, all the parcels of NYC are categorized into one of these 11 land use types: one- and two-family buildings, multi-family walk-up buildings, multi-family elevator buildings, mixed residential and commercial buildings, commercial and office buildings, industrial and manufacturing, transportation and utility, public facilities and institutions, open space and outdoor recreation, parking facilities, and vacant land.

3.2. Google Community Mobility Report

Google published a mobility report for COVID-19 by comparing changes in the daily number of visitors to the baseline. The baseline is composited of seven values, one for each day of the week, and the value is the median value from a 5-week period (3 January to 6 February 2020, hereafter 1/3 and 2/6). The Google Community Mobility Report includes changes for the following six categories of places: retail and recreation, grocery and pharmacy, parks, transit stations, workplaces, and residential. Changes reported in the Google Community Mobility Report are calculated as change percentages compared to the baseline. For the United States, the Google Community Mobility Report is available at the state- and county-level, if enough data are available [76].

3.3. Twitter Data

Geotagged tweets were collected from 1/3, to 30 May 2020 (hereafter 5/30), using the Twitter Stream Application Programming Interface (API). Although Twitter API only allows access to about 1% of all publicly available tweets [77], a total number of 9,459,952 geotagged tweets from 209,775 users were collected from NYC during this 5-month period. All the streamed tweets are stored on a high-performance computing cluster. Queries for this study were conducted with Apache Impala and Apache Hive. Following the change calculation method in the Google Community Mobility Report, tweets collected between 1/3 and 2/6 were used for baseline calculation. Later tweets were used for mobility change calculation.

4. Methodology

4.1. Twitter Data Processing

We collected a total of 1,750,385 tweets between 1/3 and 2/6, 2020, for baseline calculation, and a total of 5,335,313 tweets were collected between 16 February (hereafter 2/16) and 5/30 for human mobility pattern examination. For all the tweets we collected, we first separate them into daily datasets based on posted time so that one dataset only contains tweets posted during one specific day. In the second step, we map each tweet based on the associated geotag as a point. If the associated geotag is coordinates, this tweet is directly located to the coordinates. If the geotag type is a place, for example, Central Park, this tweet is located to the centroid of central park. Tweets that cannot be mapped into tax-lot polygons were eliminated in this step. After this mapping step, 1,649,520 tweets remain for baseline calculation, and 5,162,468 tweets remain for human mobility pattern examination. In the next step, we count how many users have tweeted from each tax lot for each day. In other words, only one user is counted into the given lot, regardless of the number of tweets one user posted from the same location.

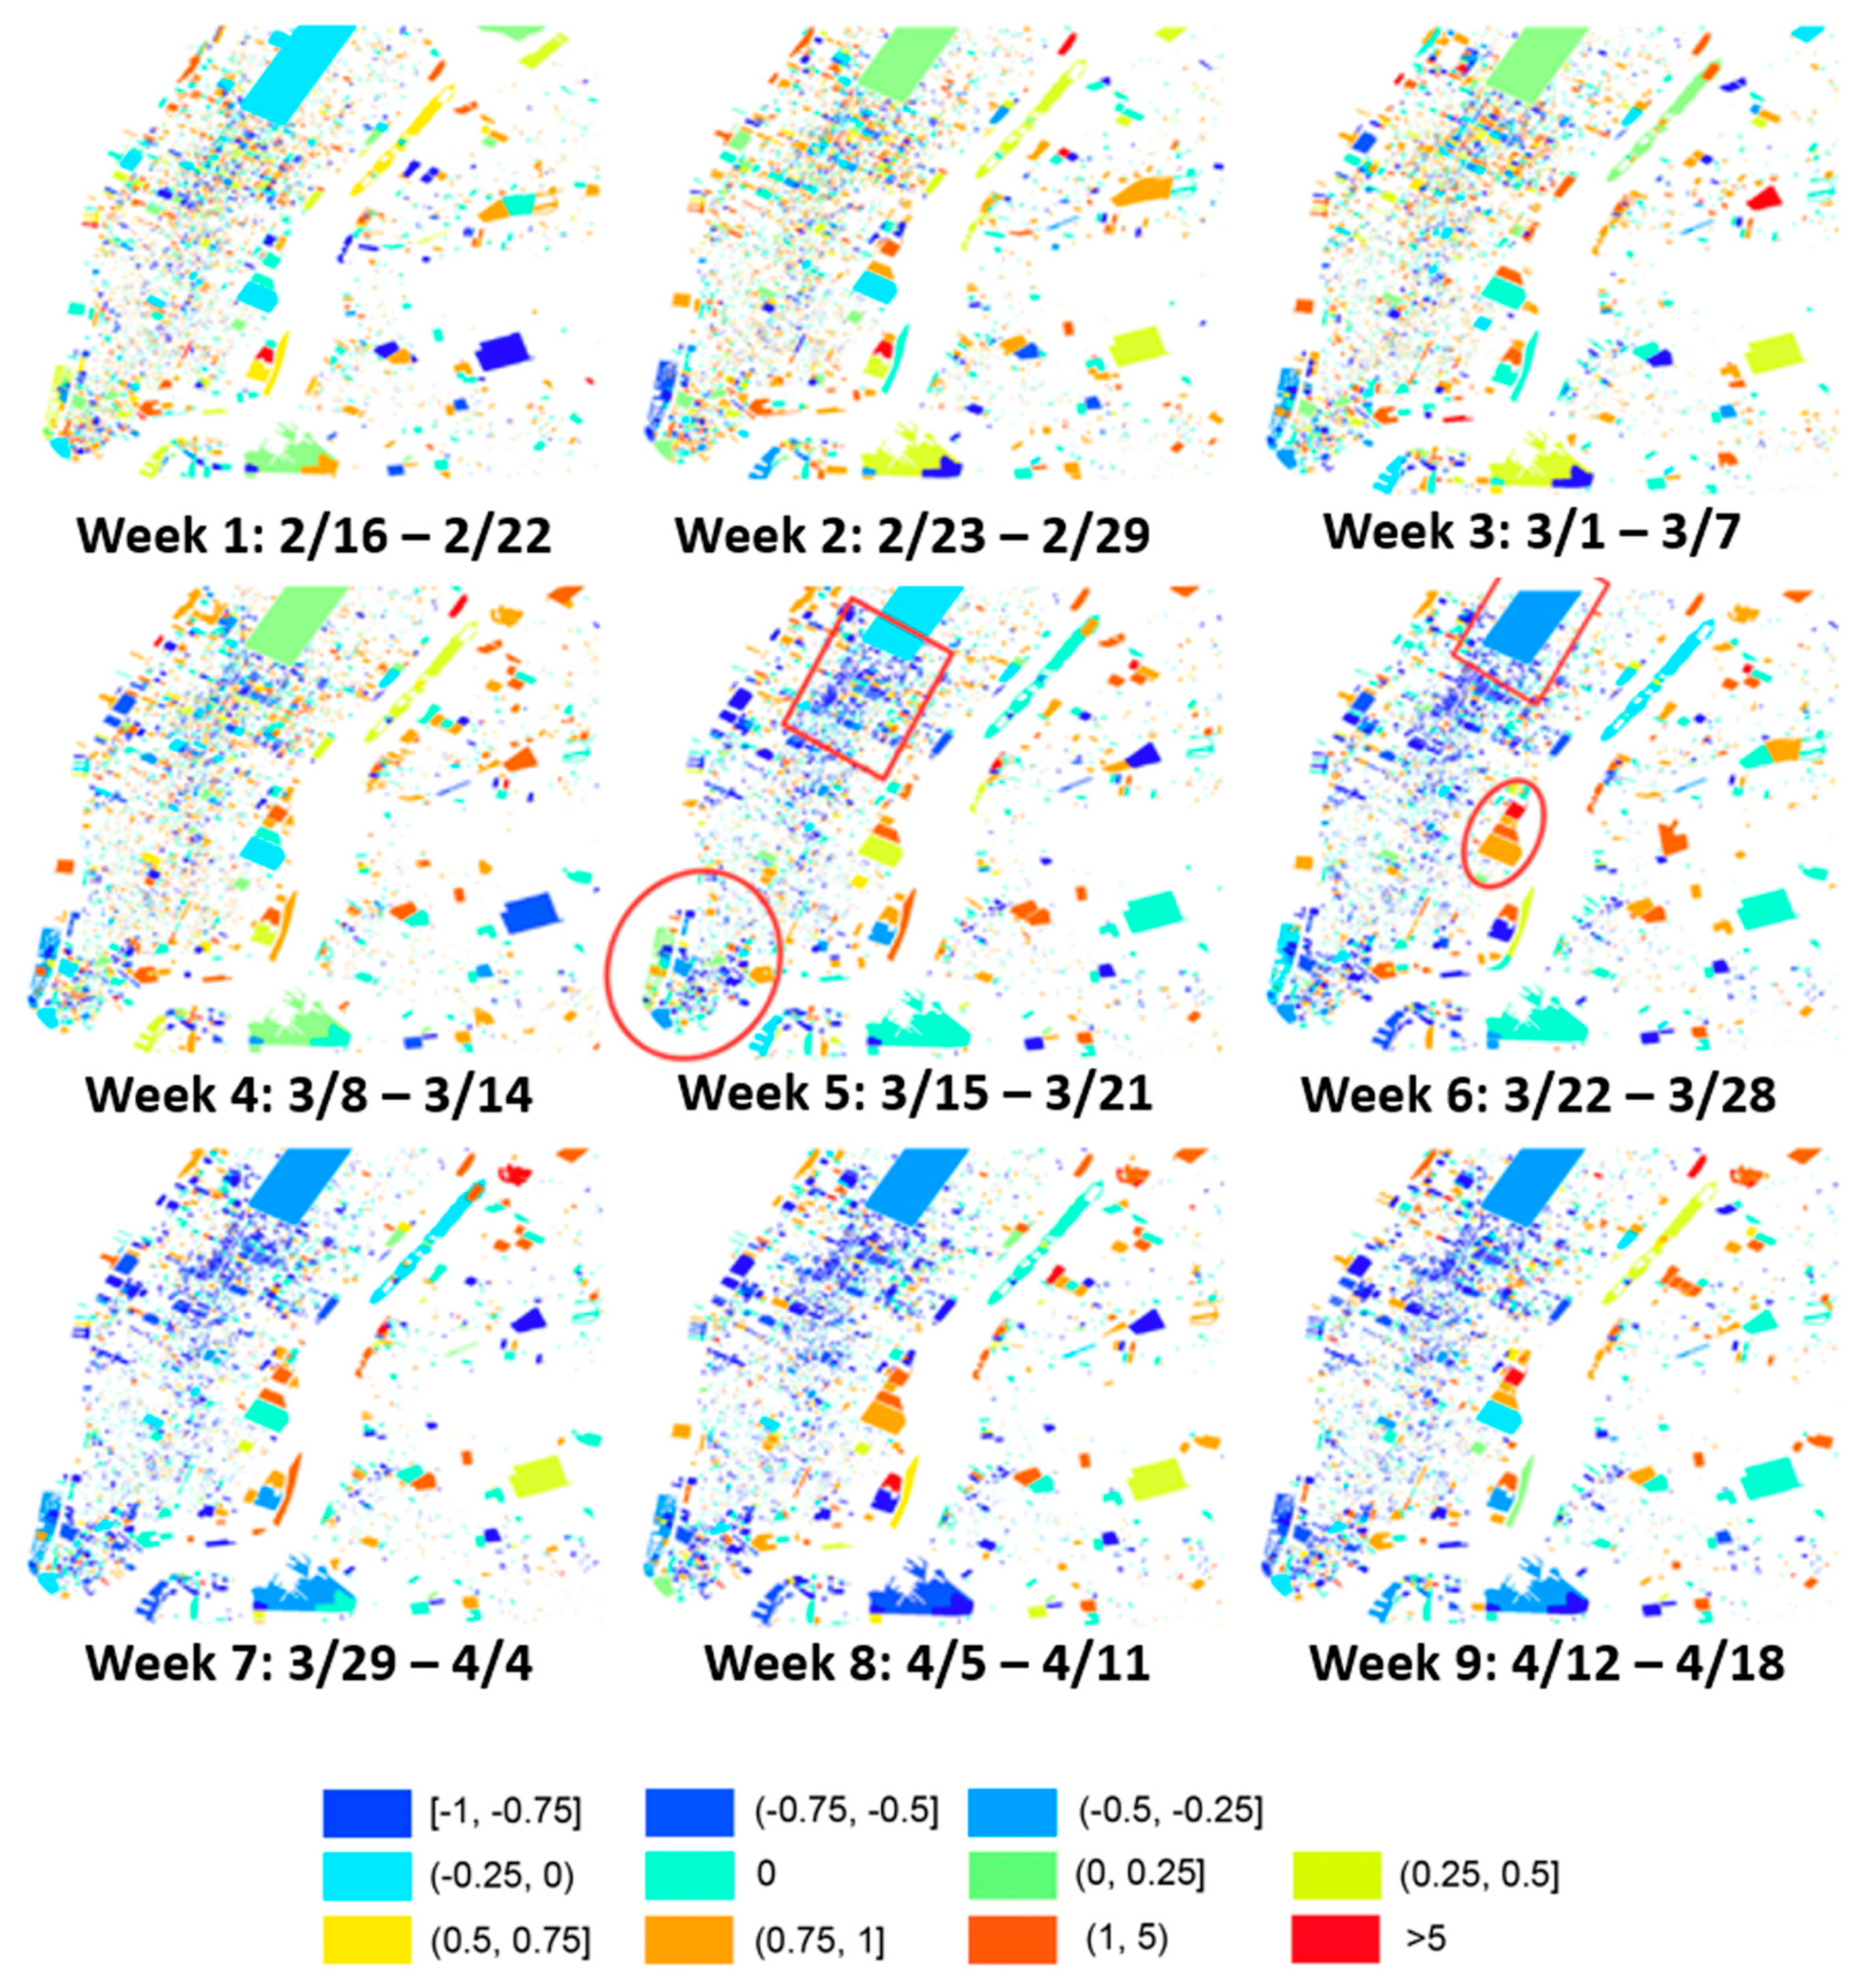
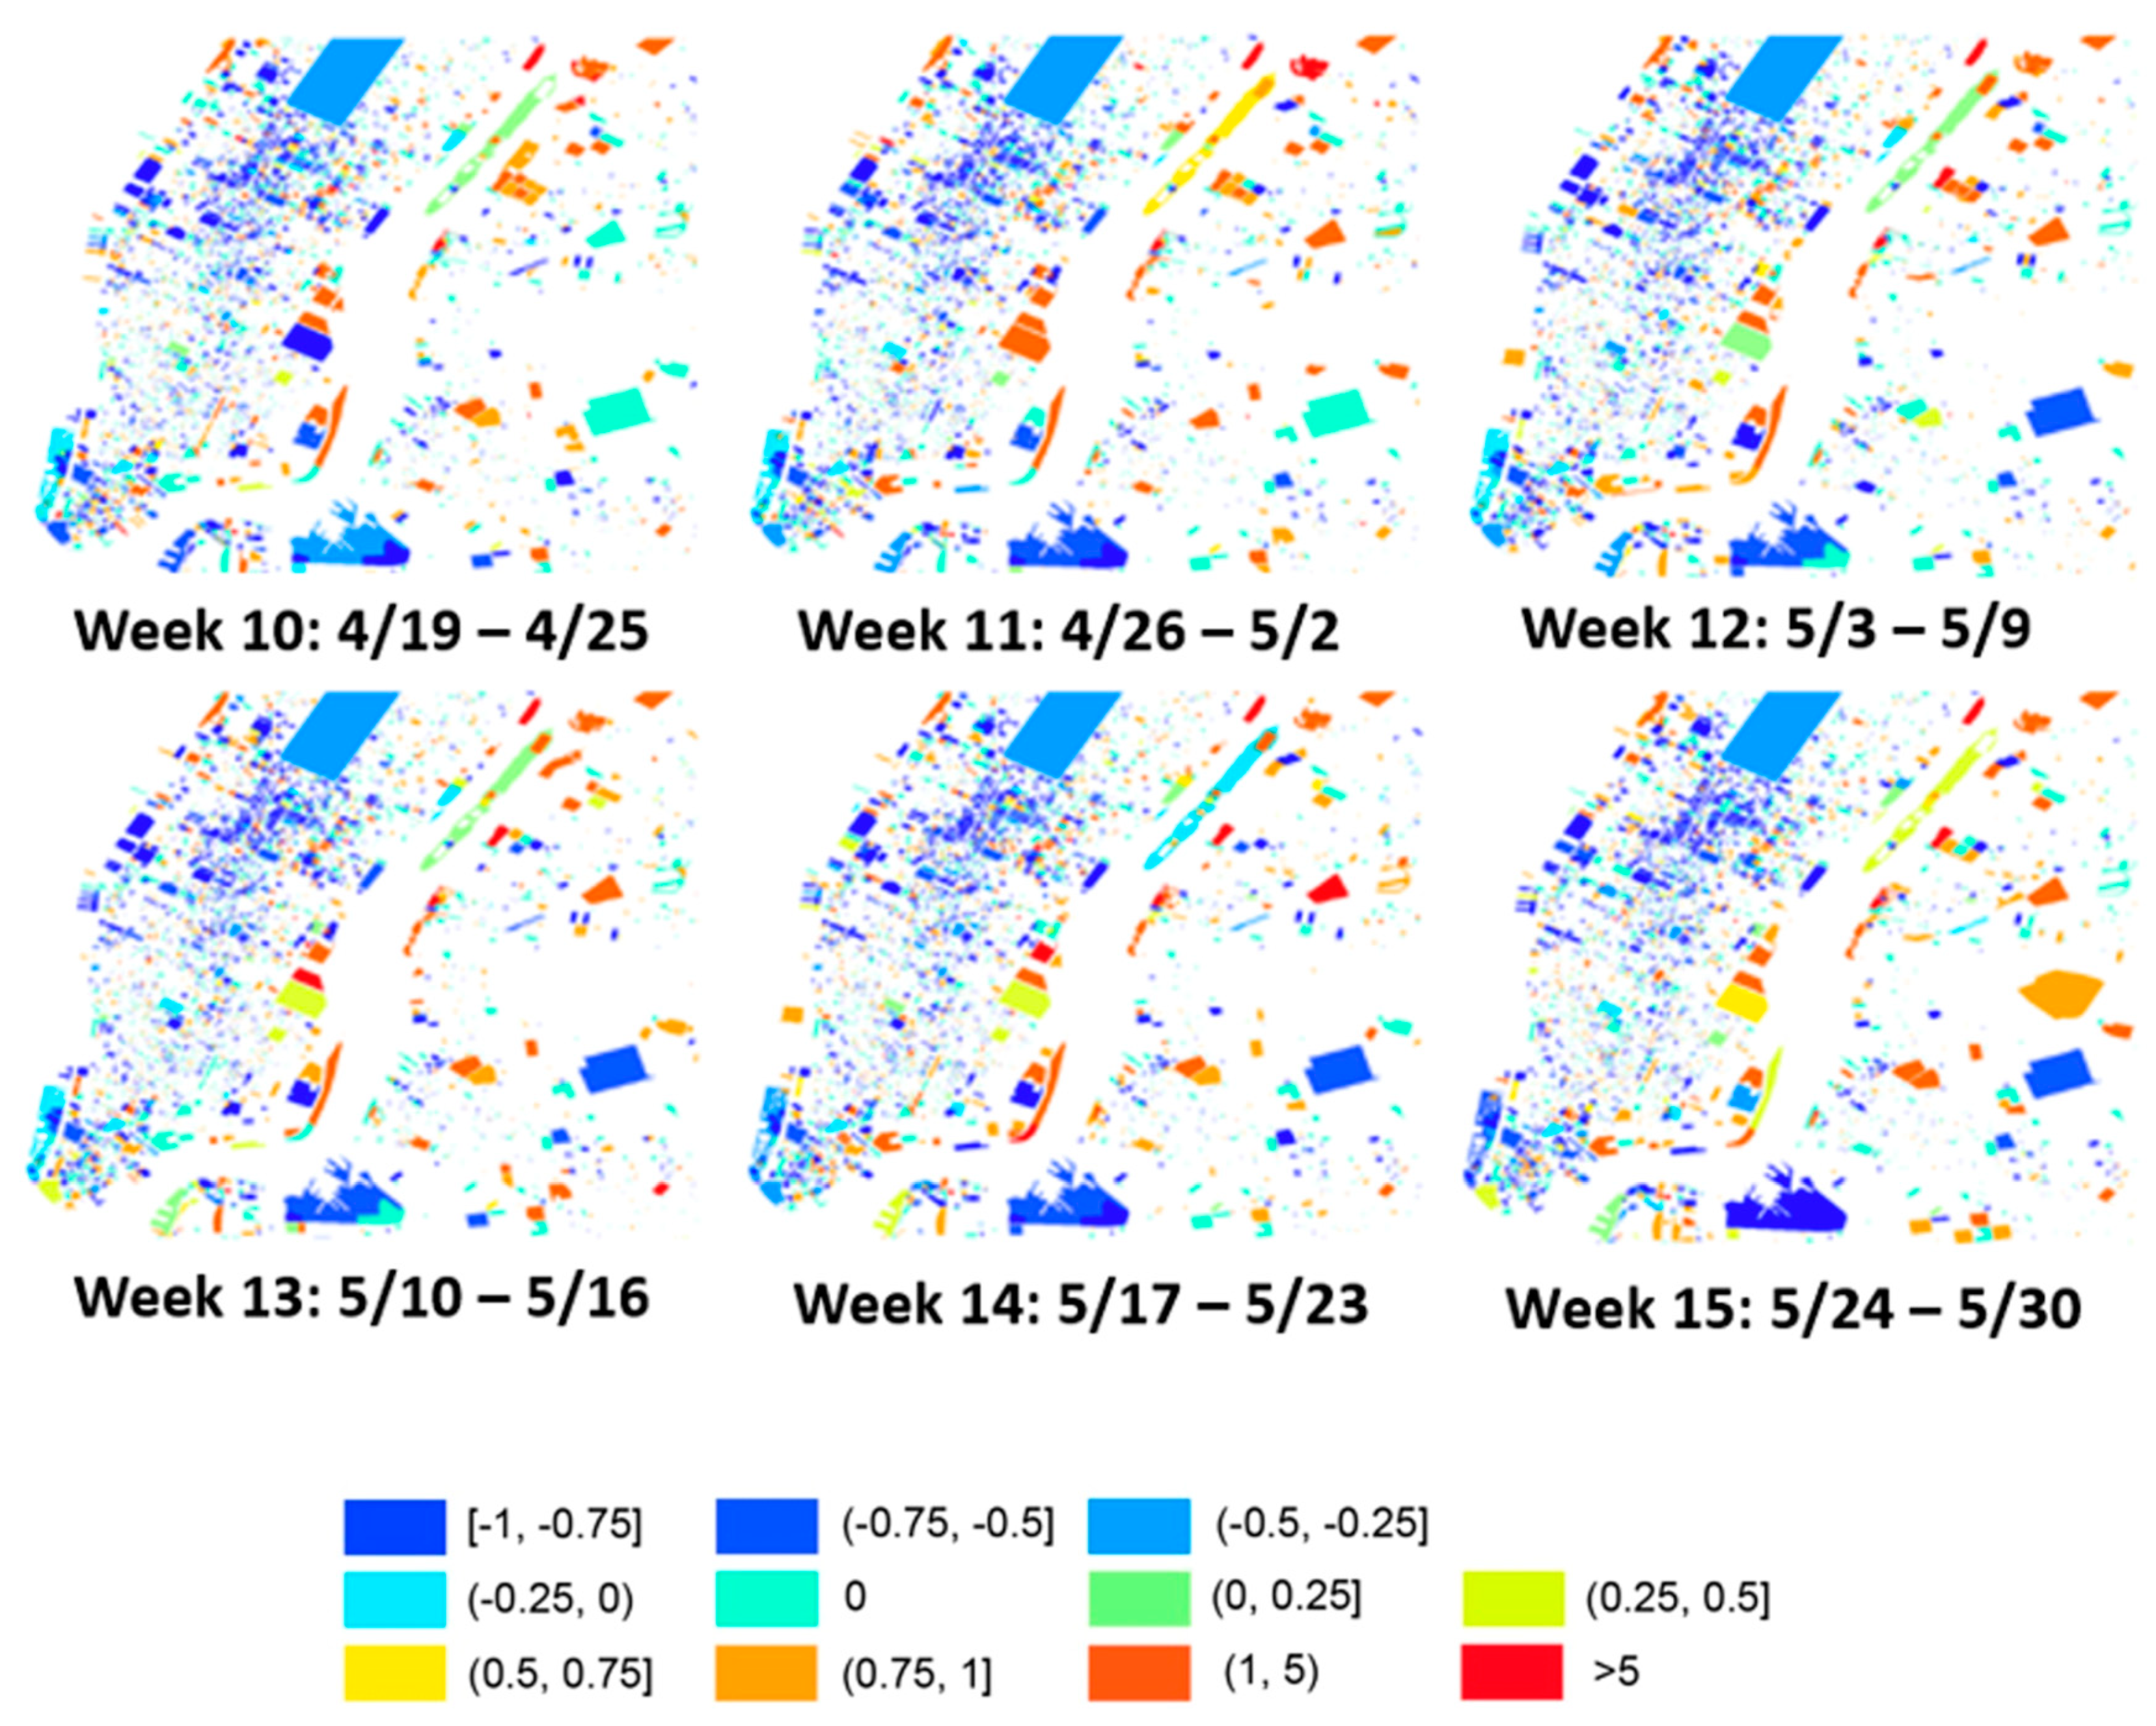
4.2. Spatial Patterns of Human Mobility Changes

PLUTO data for NYC has delineated each polygon for each tax unit with one of the 11 land use types listed in Section 3.1. Spatial mobility pattern changes are calculated for each tax unit.
The baseline used for change calculation is a 5-week period, from 1/3 to 2/6, which is the same as the Google Community Mobility Report. For each land unit, the total number of Twitter users per week is summarized. The baseline value for each land unit is the median of the five weeks’ weekly user amount.
For each polygon, the weekly Twitter user number was summarized for each week between 2/16 and 5/30. The percentage of human mobility change of a given polygon is calculated as Equation (1):
c h a n g e   p e r c e n t a g e = o b s e r v e d   v a l u e b a s e l i n e b a s e l i n e × 100 % ,     i f   b a s e l i n e 0       100 %   ,                                               i f   b a s e l i n e = 0 .

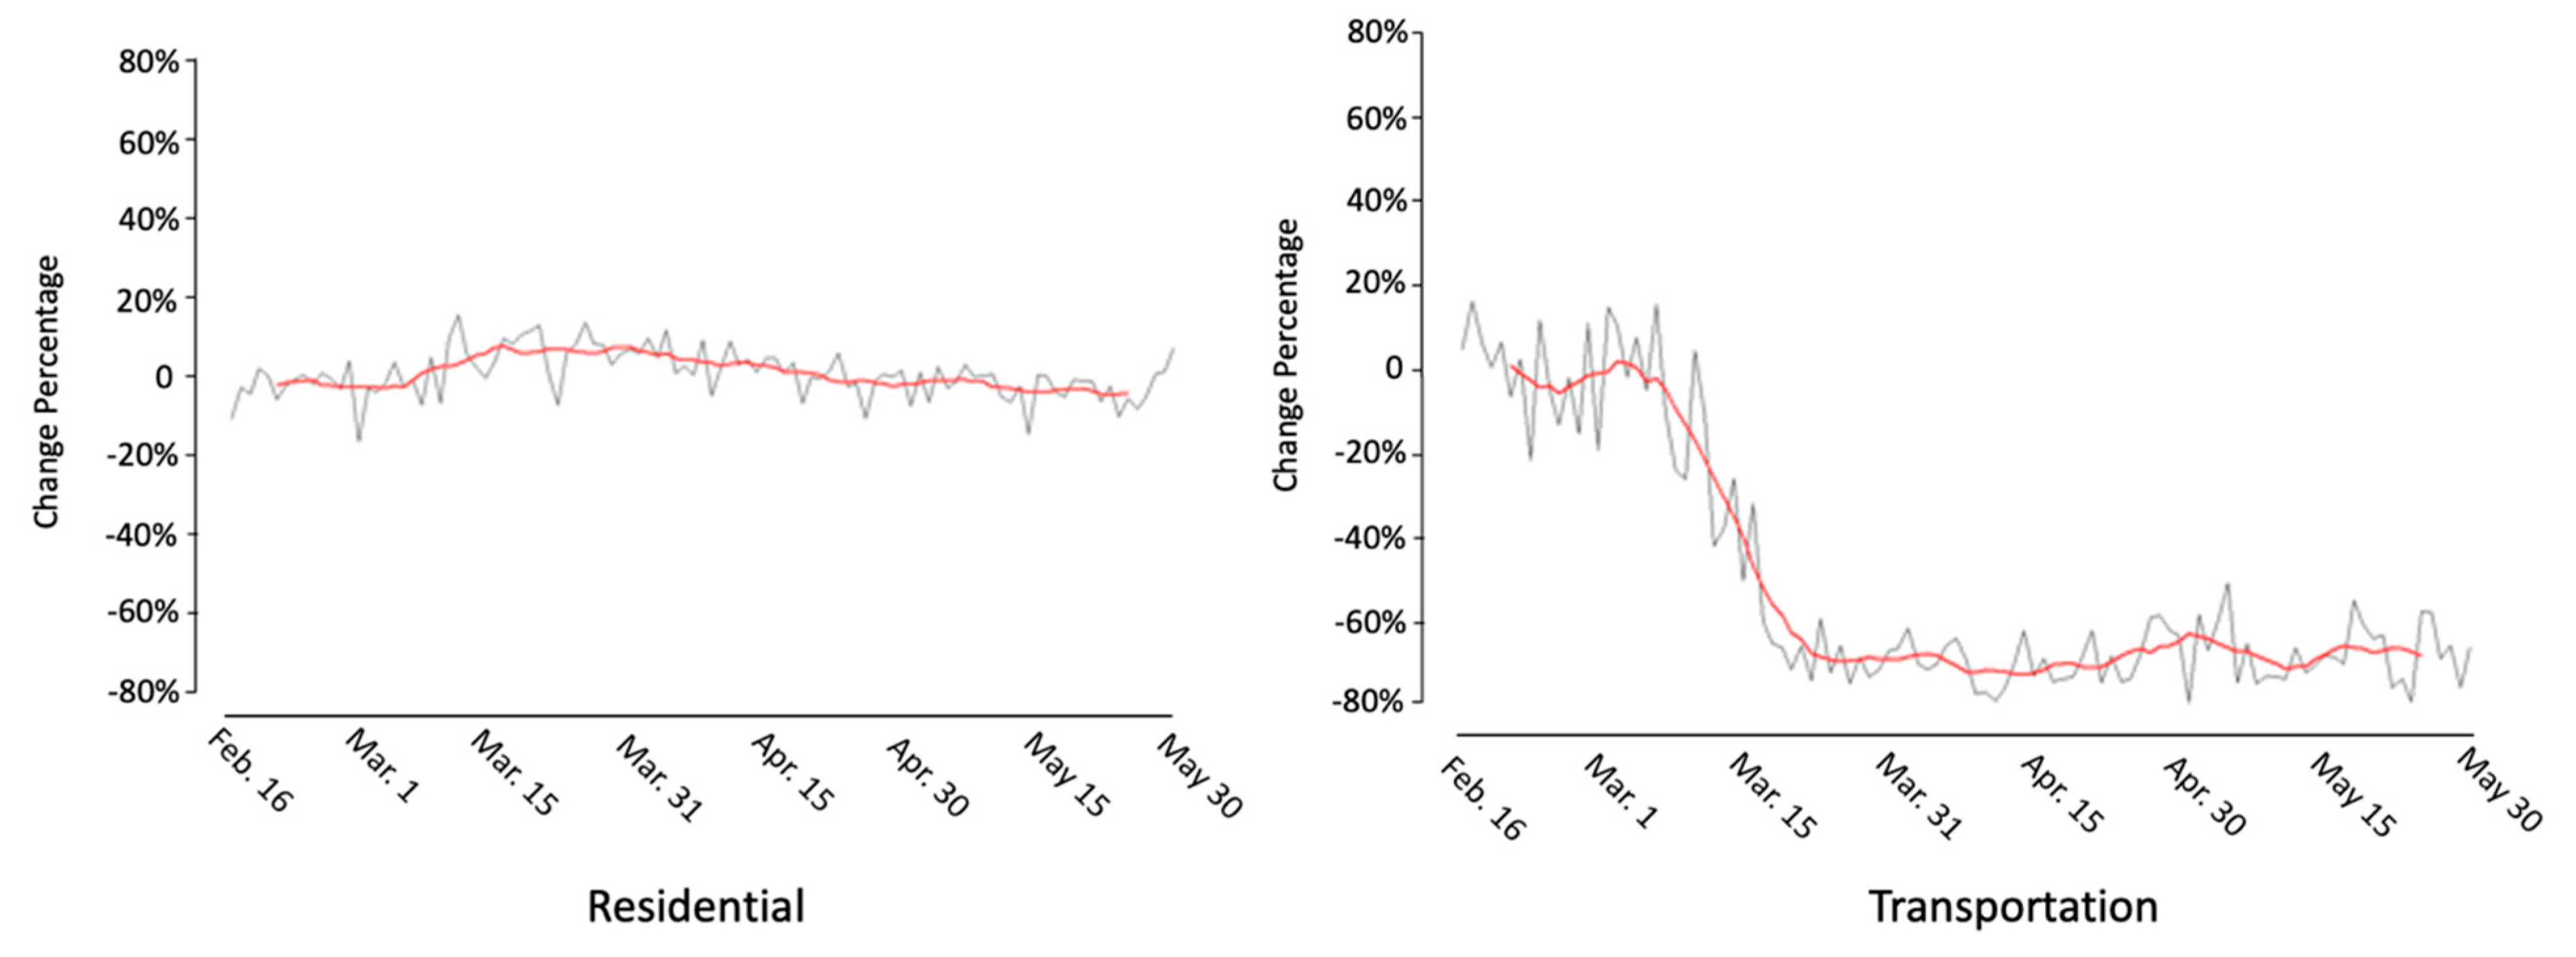
4.3. Daily Mobility Pattern Change by Land Use Type

The baseline for the daily Twitter-based human mobility change pattern is matrix B, pairing land use type and day of the week. An element b i j in the baseline matrix B is the baseline value for land use type i on j th day of the week. For each week of the 5-week baseline time, a matrix W is constructed, where each element w i j represents the number of Twitter users in land type i on j th day of this specific week. Therefore, we built 5 matrices for the 5-week baseline time, denoting as W1, W2, …, W5. The baseline value b i j is the element-wise median of W1, W2, …, W5.
Twitter-based human mobility change patterns were calculated on a daily basis from 2/16 to 5/30. For each day between this time period, we first used n i j as the observed number of Twitter users in land type i on the j th day of that week. Then, the daily change percentage is calculated as follows:
c h a n g e   p e r c e n t a g e = n i j b i j b i j × 100 % .
This change percentage calculation method can avoid fluctuations during the week, such as human mobility pattern changes between weekdays and weekends.
Daily change patterns are presented as trend lines, where the y-axis is the change percentage, and the x-axis is the date.

5. Results

5.1. Spatial Human Mobility Patterns Based on Twitter Data

Figure 1 and Figure 2 show the human mobility patterns change detected using Twitter data at the parcel level. Figure 1 shows changes from week 1 to week 9, and Figure 2 shows changes from week 10 to week 15. From a spatial perspective, the decrease in the number of Twitter users can be observed as early as in the week of 15 March 2020 (hereafter 3/15, Week 5), which is the week before the city-wide executive order. From the Monday of week 5, most commercial and office buildings in Midtown Manhattan (dark blue polygons within the red rectangle in week 5) have seen more than a 75% decrease in the number of Twitter users compared to January. Such reduction indicates the spontaneous actions of work-from-home from many companies. Downtown Manhattan (red circle in the figure of week 5), including the Soho District, Wall Street, World Trade Center, and the ferry to Statue of Liberty, has always been a popular destination of tourism. As the World Trade Center and Statue of Liberty suspended their tourism-related activities on 3/14 and 3/16, the number of Twitter users decreased more than 50% at One World Trade Center and the Battery Park, which is where the ferry to the Statue of Liberty departs. After the stay-at-home executive order was placed on 3/22, the majority of non-residential buildings in Downtown Manhattan show more than a 75% reduction in the number of Twitter users. In addition, Central Park (red rectangle in the figure of week 6) had seen more than a 50% decrease in the number of Twitter users after the issue of the executive order, suggesting that the attraction of this largest park in New York City has been dampened during the pandemic. The weekly number of Twitter users in Central Park remained at a similar level until the end of May. Contrasting to the general decreasing trend, hospitals (red circle in the figure of week 6) saw a significant increase in the number of Twitter users since week 6 (3/22), when the number of COVID-19 cases in NYC started to rise [2].

5.2. Temporal Changes by Land Use Type
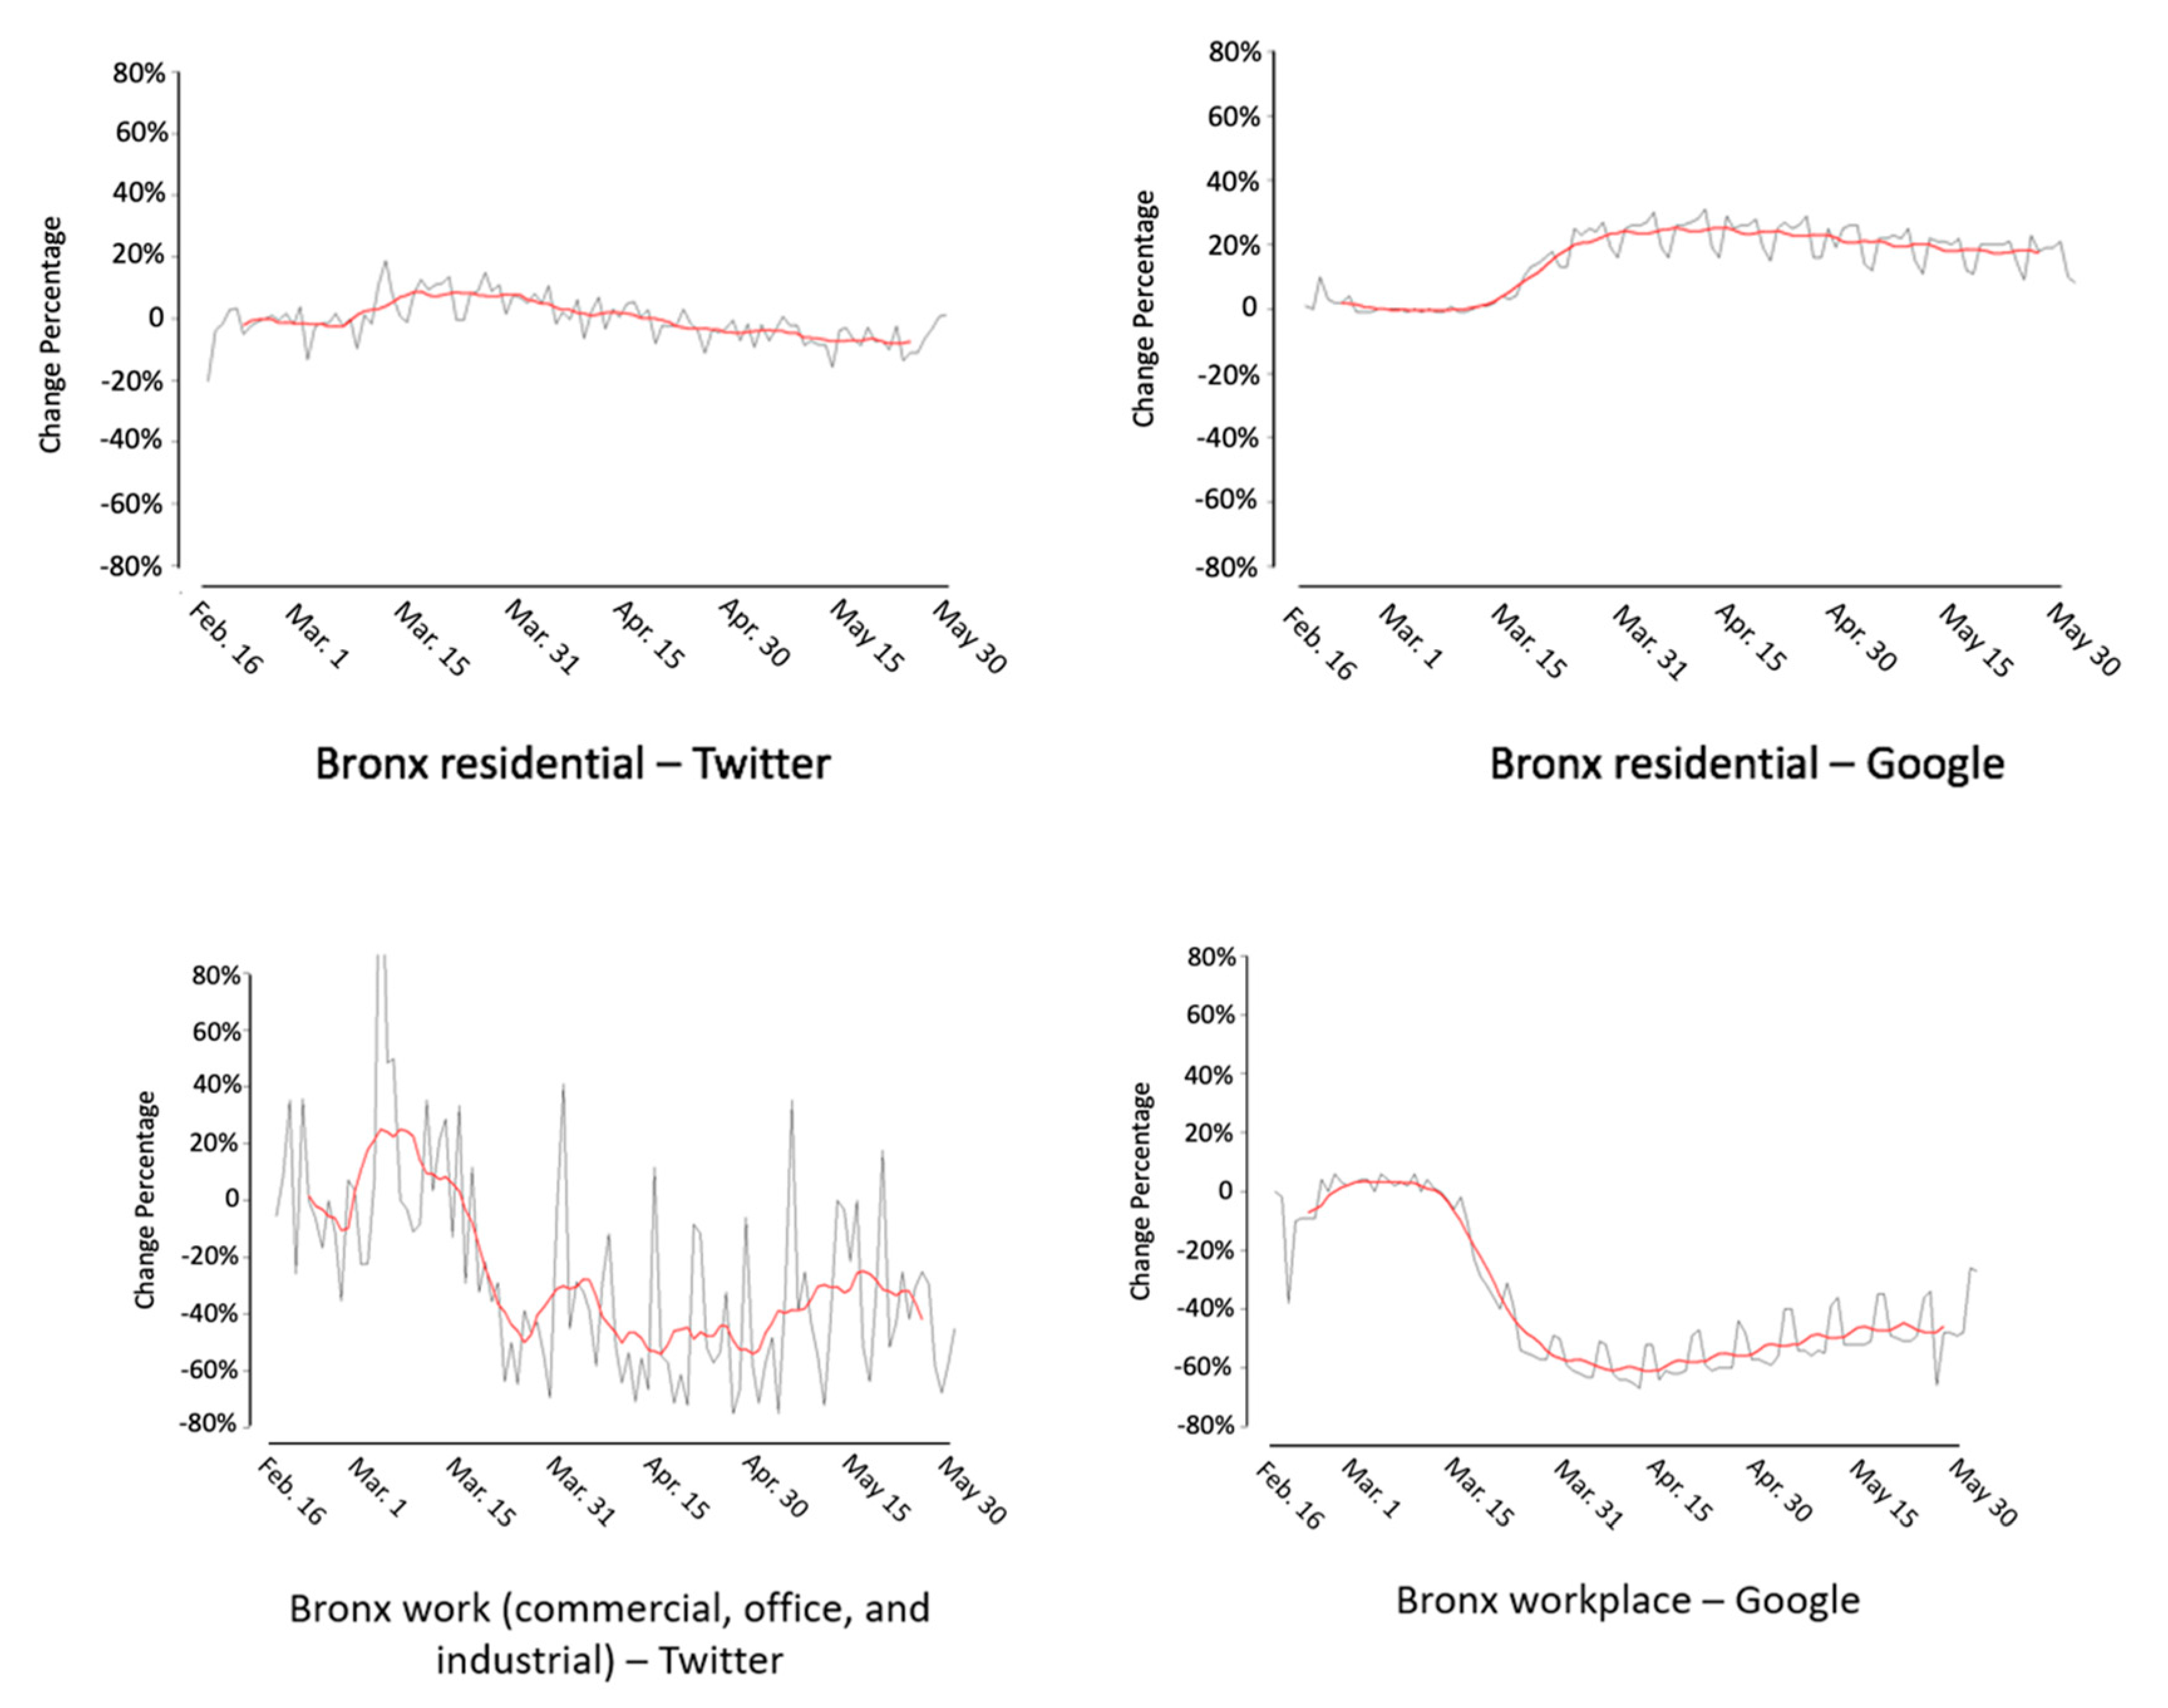
Figure 3 shows the daily change for the six land use types. The black line shows the original change pattern, and the red line is the smoothed trend with Gaussian smoothing.
Transportation-related lands show a significant decrease in the number of people—about a 70% decrease in mid-March. This result is expected, as people are encouraged to avoid unnecessary trips and stay at home. Commercial and office buildings are also found to have a noticeable decrease: about 60% in mid-March. Similarly, public facilities and institutions also observe about a 40–50% percent decrease in the number of Twitter users. Park and outdoor recreation areas for the whole of NYC indicate a slight decrease from mid-March. In April, about 40% fewer Twitter users are observed in park and outdoor recreation areas, comparing to the baseline.
Twitter-based human mobility patterns show no obvious increase in the residential area for NYC. This shows one limitation of using Twitter data for this type of human mobility capturing study. We can only count the number of distinct Twitter users from a location. The length of time spent at home remains unknown. Therefore, for those users who regularly tweet from home before the pandemic, this number does not change.
The following sections describe human mobility changes for Bronx County, Kings County (Brooklyn Borough), Queens County, and New York County (Manhattan Borough) in detail. In addition, similarities and differences comparing human mobility change patterns from Twitter and Google are discussed. Richmond County (Staten Island Borough) is not further discussed, as it does not have enough data for a valid comparison.

5.2.1. Bronx County

Bronx County only has enough Twitter users for two land use types: residential and workplace. Figure 4 shows the comparison between Twitter-based human mobility pattern change and change generated with Google-based human mobility data.
In Twitter-based human mobility pattern, the residential area shows no obvious increase, while Google shows a 20% increase in residential areas. As mentioned before, Google’s human mobility change for the residential area is based on time spent; therefore, a larger increase from Google is found. Both Twitter- and Google-based human mobility patterns find about a 60% decrease in the workplace in Bronx. However, the Twitter-based mobility pattern shows more dramatic day-to-day changes. Another major difference between these two trends is that Google shows notable weekday–weekend patterns.

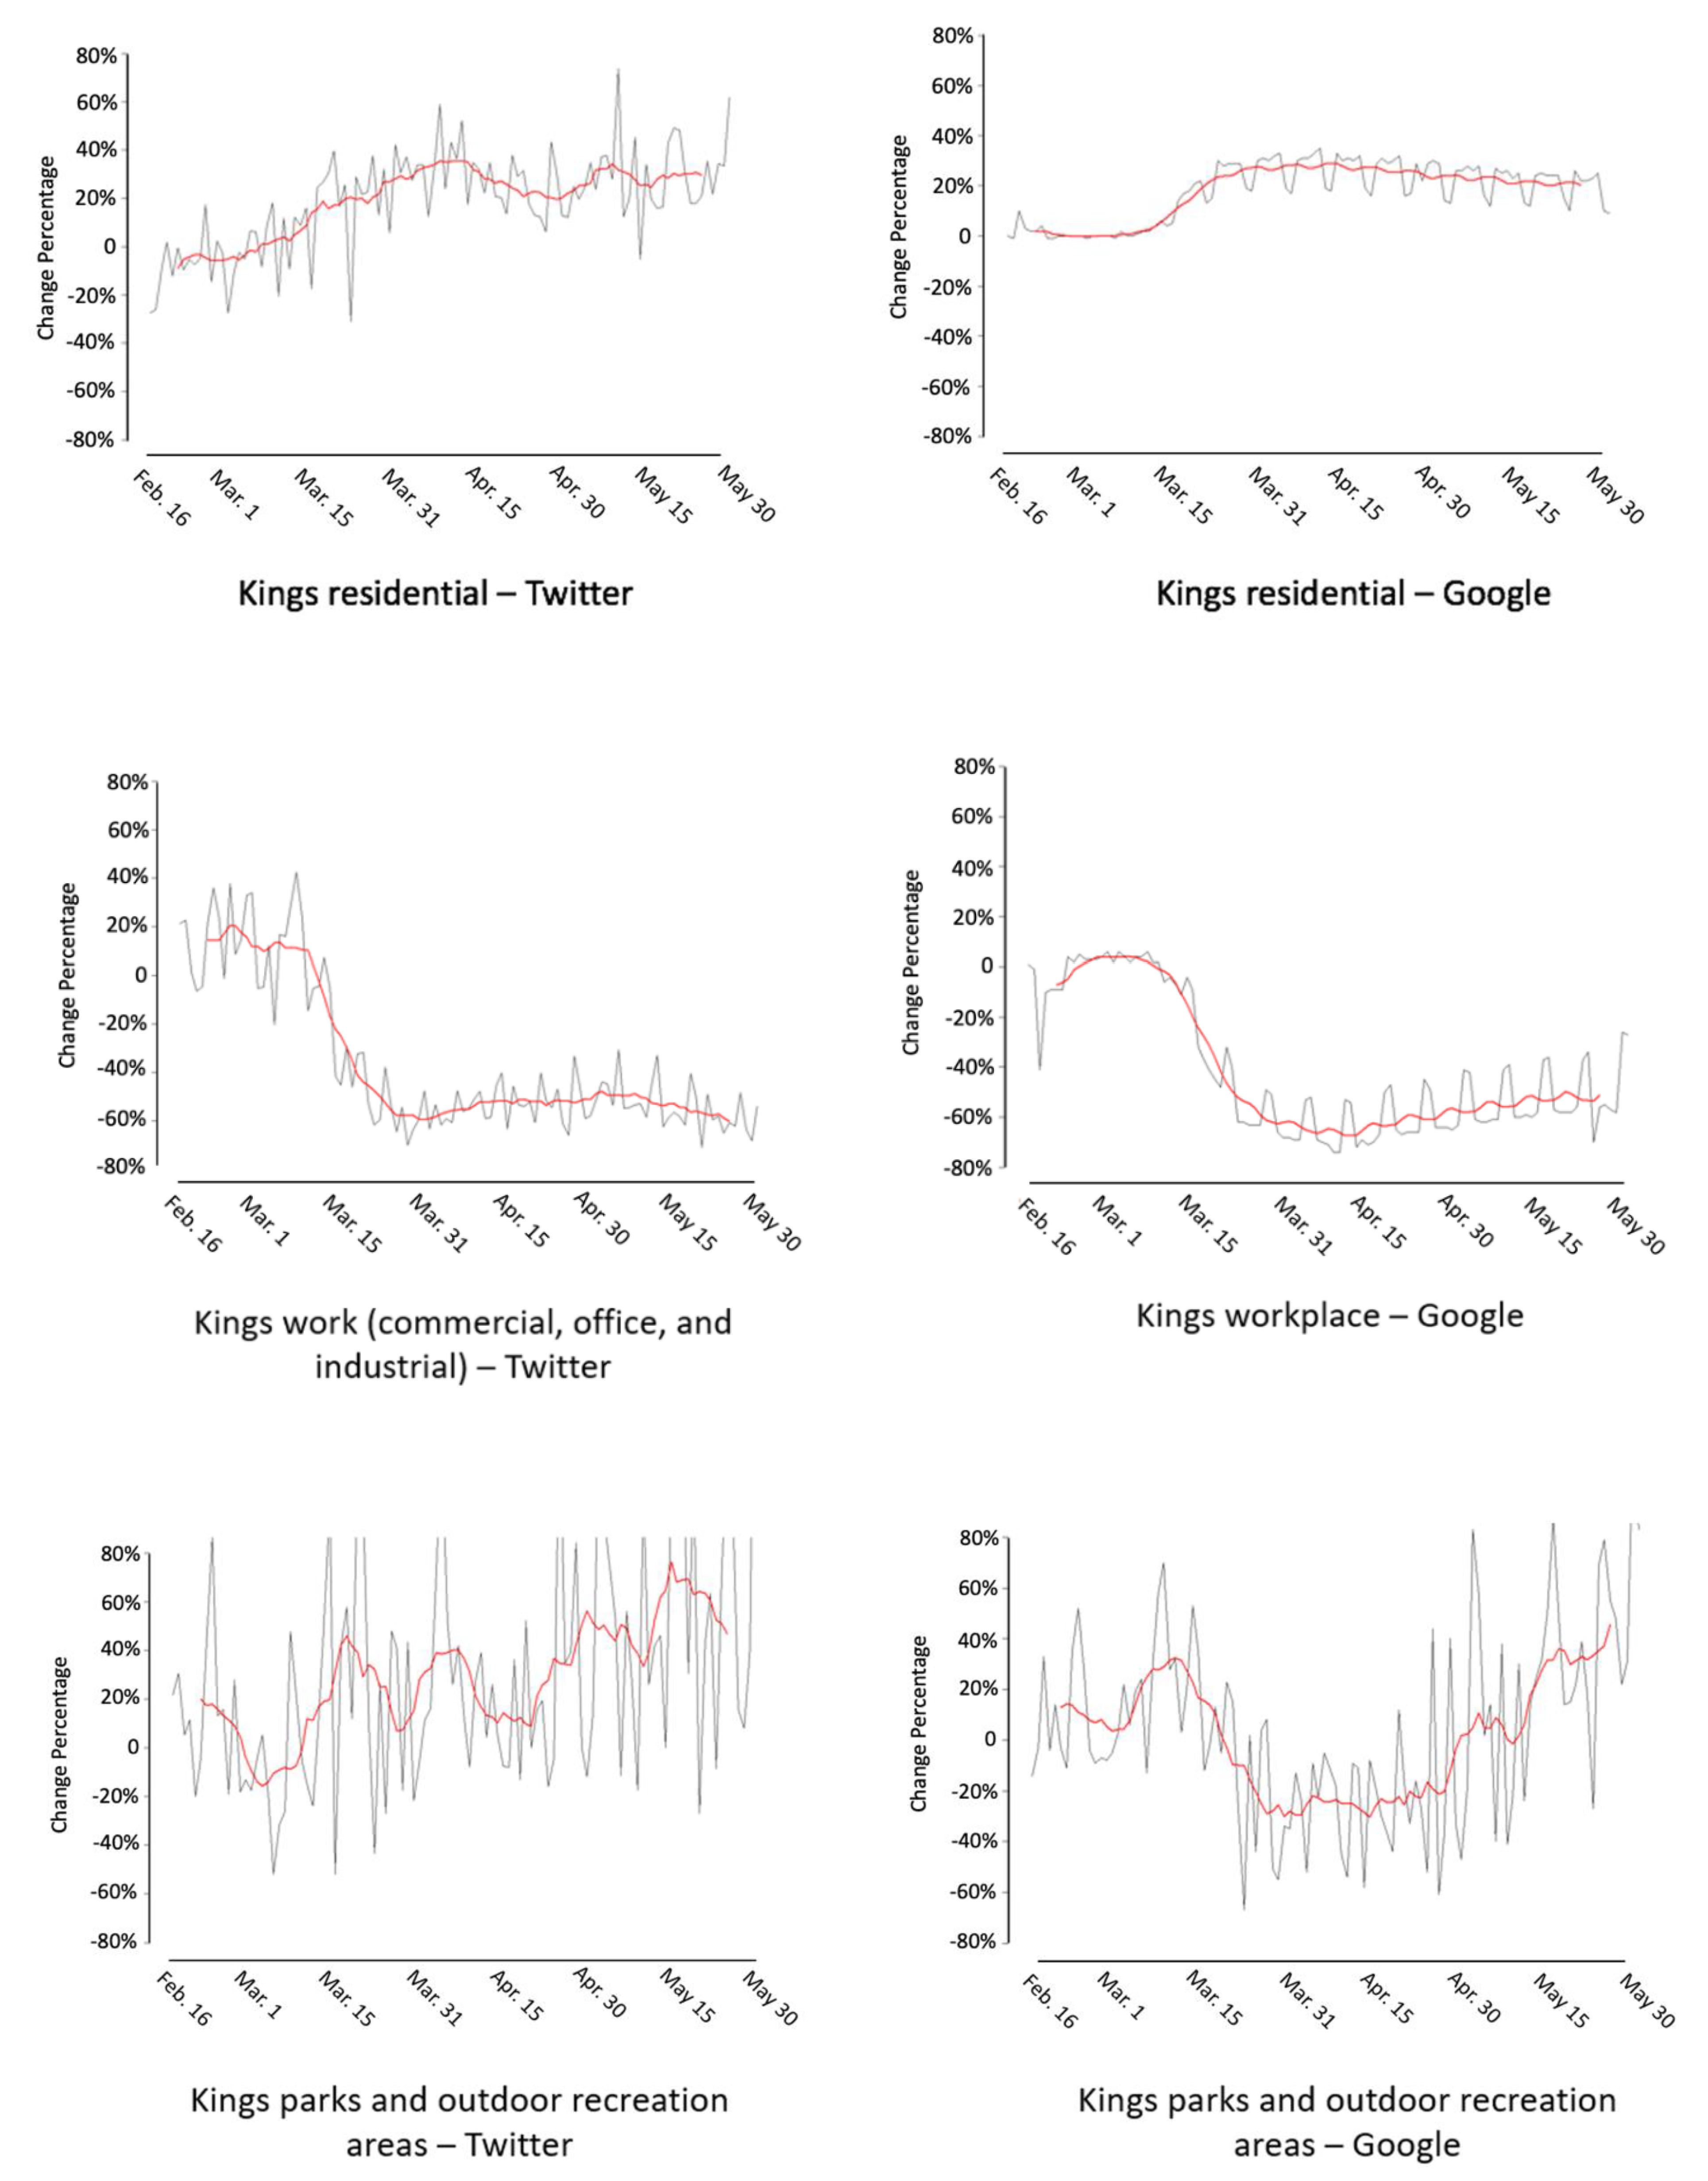
5.2.2. Kings County (Brooklyn Borough)

Twitter-based human mobility patterns are generated and compared with Google-based human mobility change for Kings County in the following three land use types: residential, workplace, and park. Figure 5 shows the comparison for the three types.
We found a 20% increase in the number of Twitter users in Kings County for residential areas, which is similar to Google Community Report. However, Twitter-based human mobility presents a larger day-to-day change, and this change is unstable. Google found that people spent about 20% more times in residential places, and weekly regularity is also found. Both Twitter- and Google-based human mobility patterns found about a 60% decrease in the number of people for the workplace in Kings County, and a drop starting around 3/15 was detected in both data. However, Google also identified weekday–weekend regularity, which is not detected using Twitter data. The human mobility patterns for parks and outdoor recreational areas in Kings County are quite different between Google and Twitter. Google shows an obvious drop around 3/15, and the number of visitors started to increase in late April and keeps increasing in May. The Twitter-based human mobility pattern shows an unstable pattern evidenced by the large day-to-day difference. In addition, the number of Twitter users identified in parks and outdoor recreation areas is above baseline for 71 days, even when the stay-at-home order was in place in late March and April.

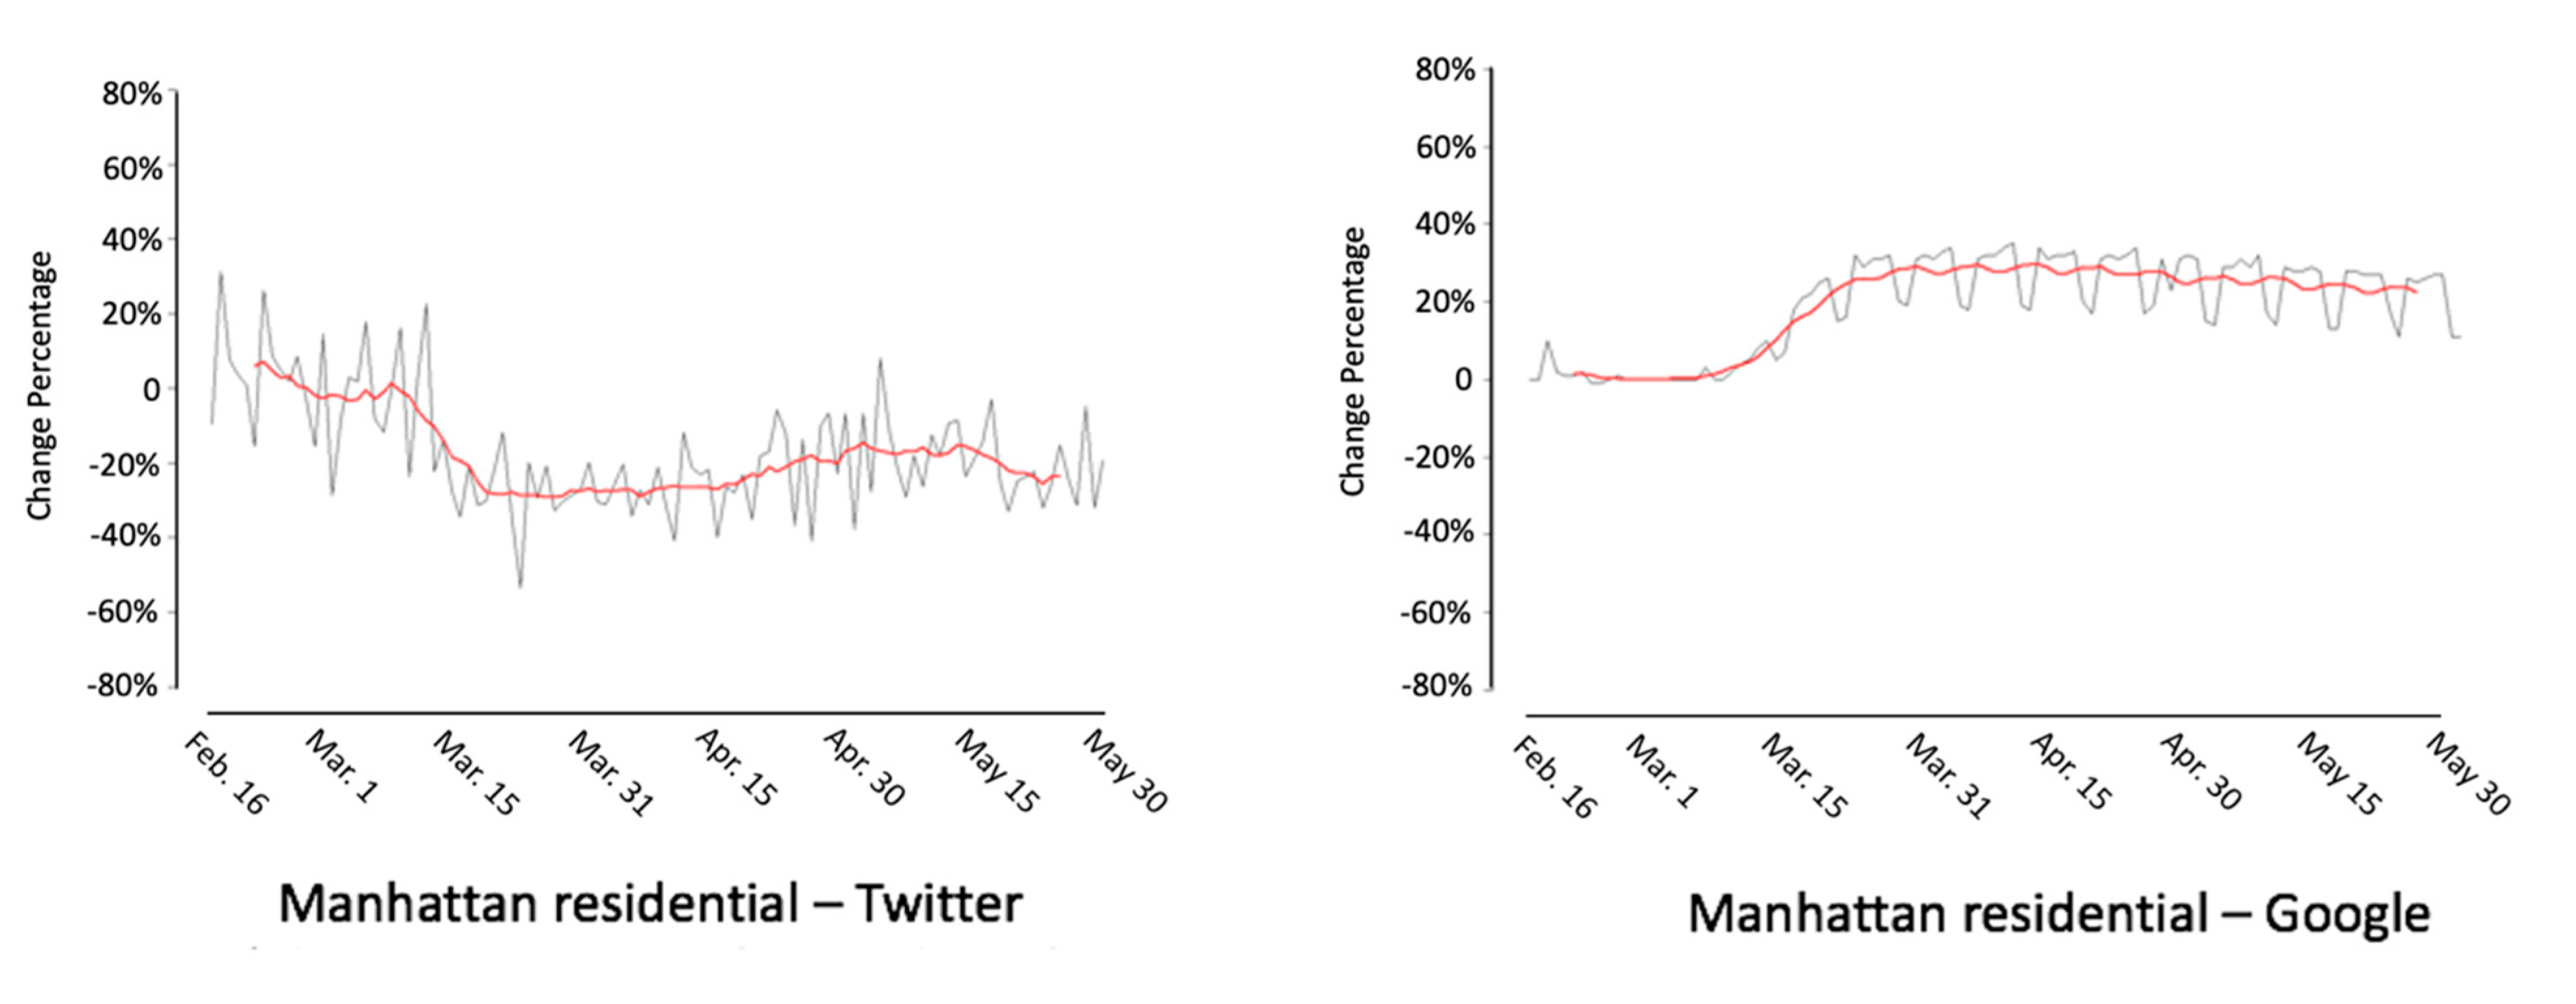
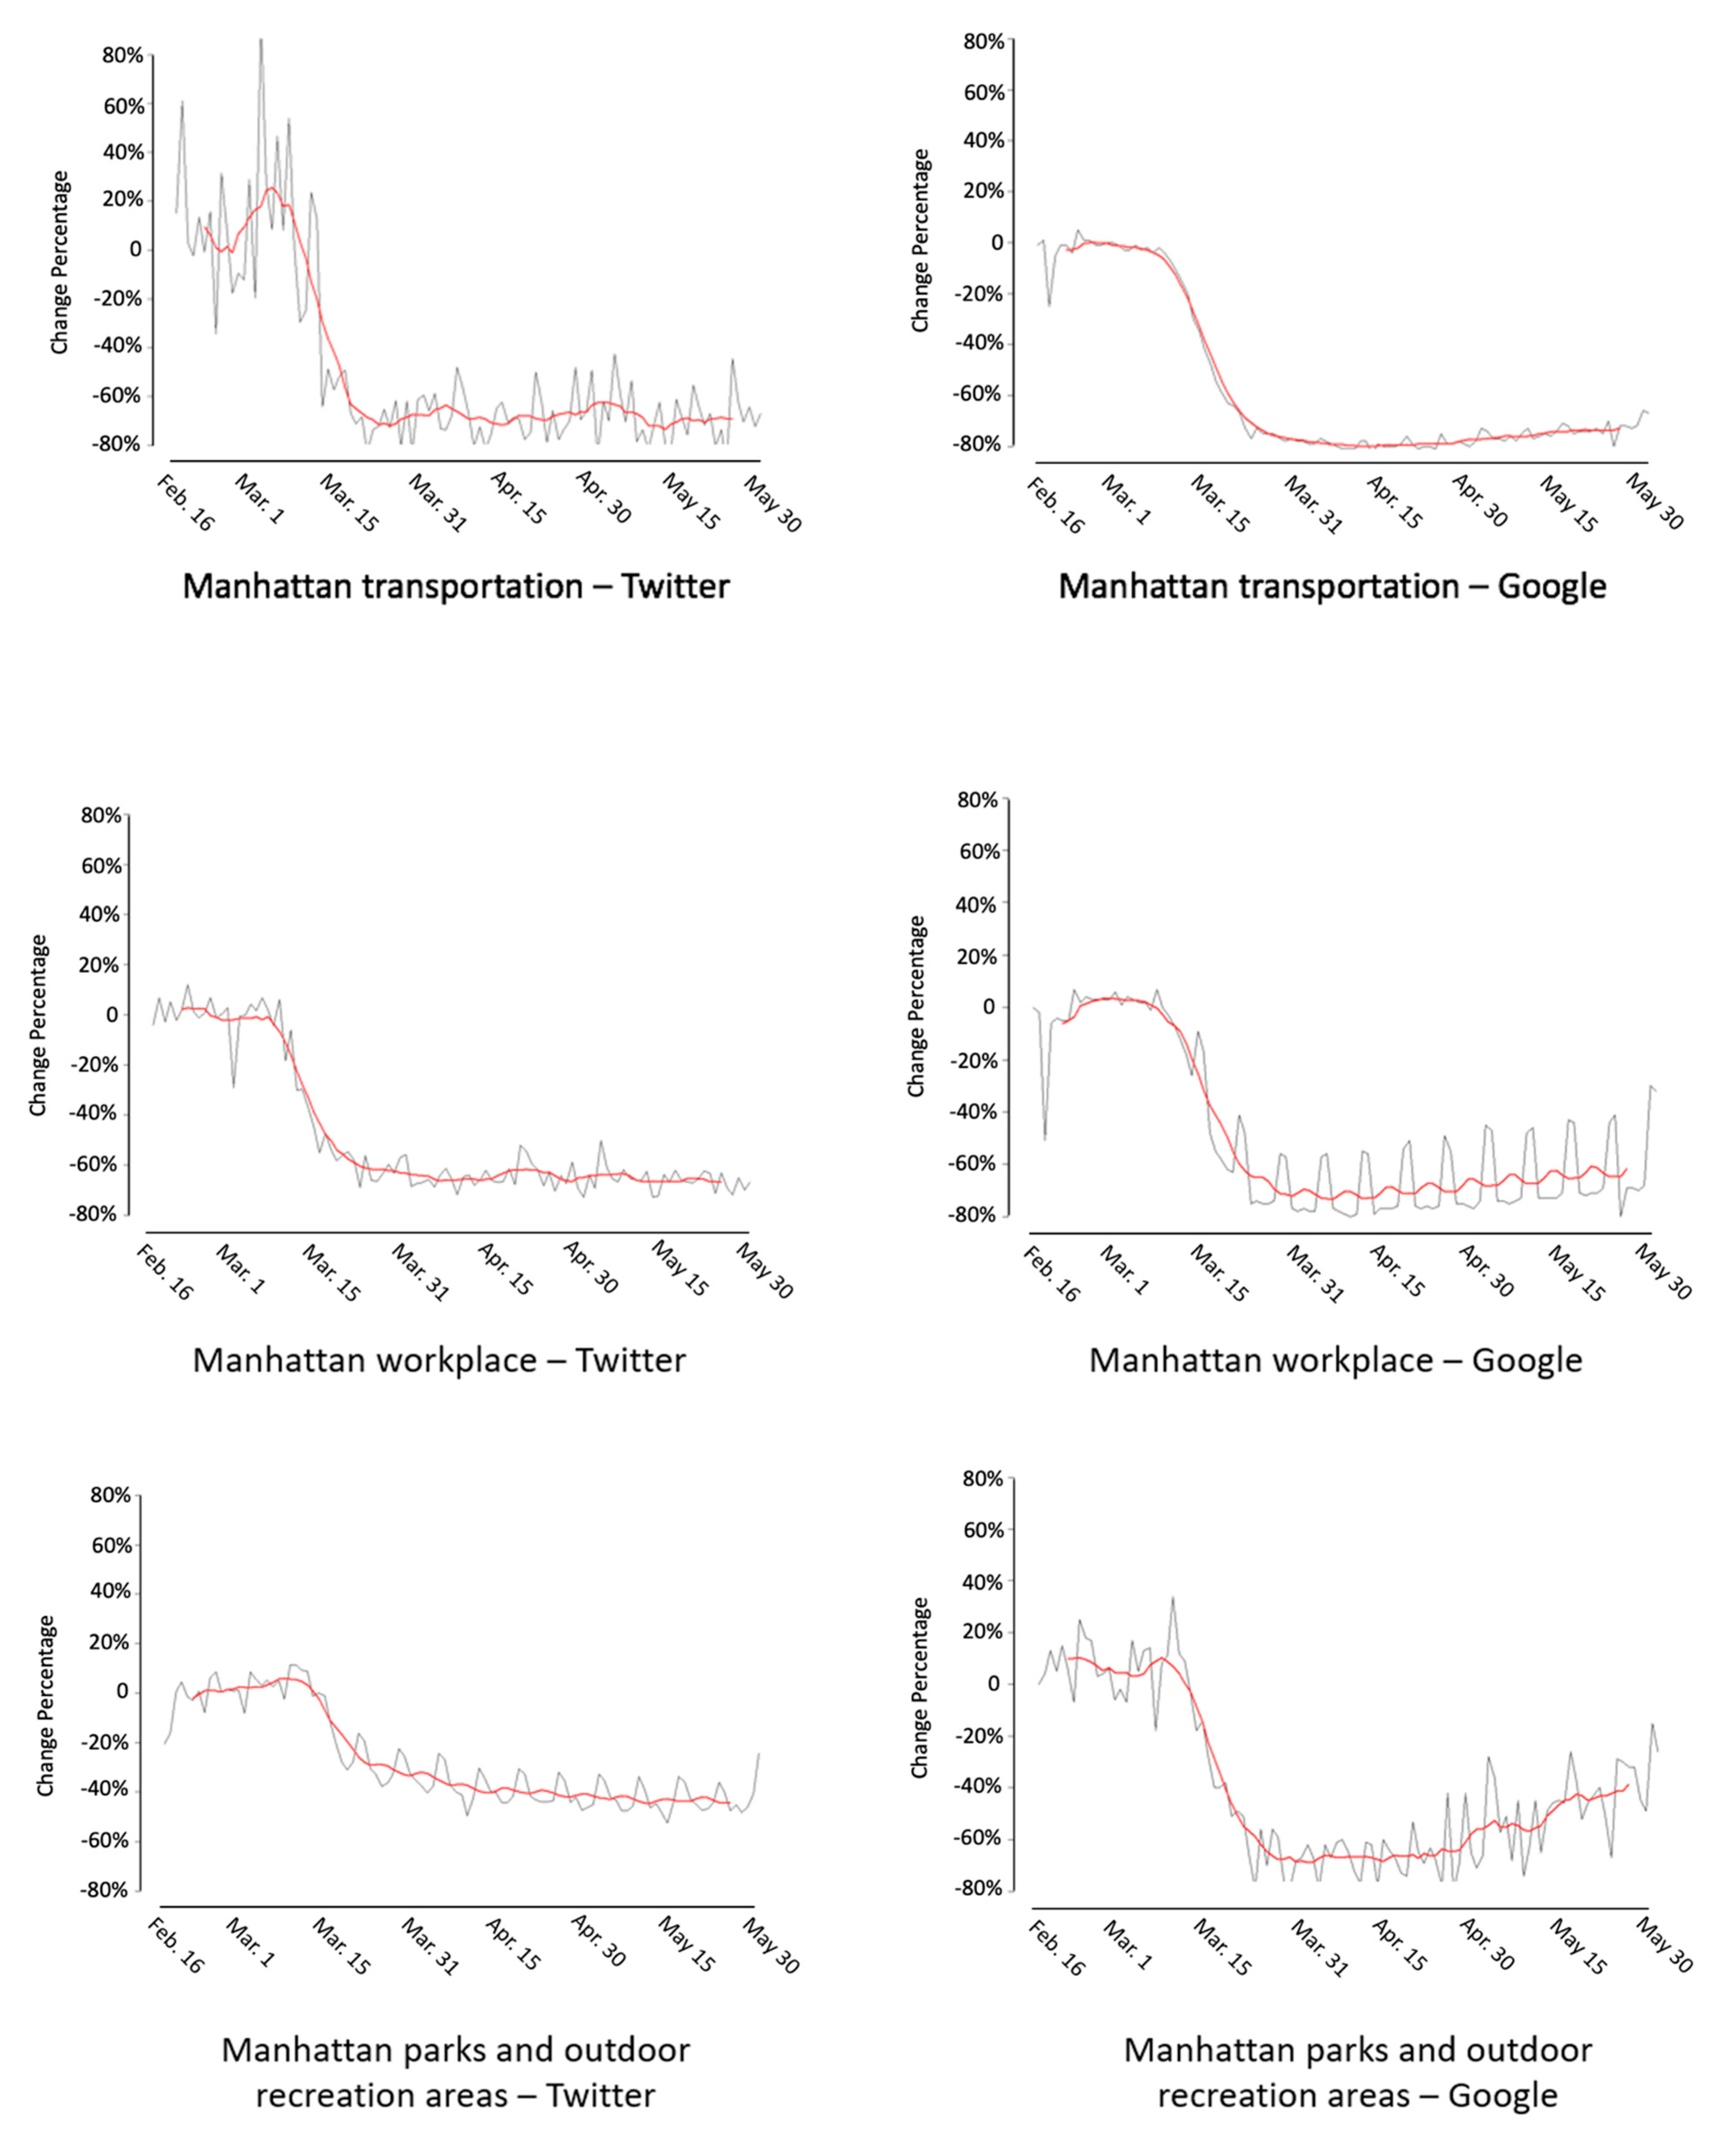
5.2.3. New York County (Manhattan Borough)

New York County shows a decrease in the number of Twitter users in all categories (Figure 6). Noticeably, the total number of Twitter users in New York County has decreased by 30–40%. This is likely to be caused by the significantly decreasing tourism in NYC in general. The number of Twitter users for the residential area in New York County shows a 30% decrease, which is consistent with the number of Twitter users decreasing for the whole of New York County. Transportation-related lands show similar decreasing patterns. Both Twitter-based and Google-based human mobility patterns show a 70–80% decrease in visitors to transportation-related lands. The decrease of the number of Twitter users in transportation-related lands started in early March, which is earlier than the main drop that appeared in Google (mid-March). The workplace in New York County presents an obvious decrease in both Twitter-based and Google-based human mobility patterns. Twitter-based human mobility shows a 60% decrease, and Google shows a 70% decrease. One major difference is that the Google-based pattern shows obvious weekday–weekend regularity. Regarding parks and outdoor recreation lands, both Twitter-based and Google-based human mobility patterns identify the drop in the number of visitors around mid-March. However, the Google-based pattern shows a larger drop: about 70% until late April. Visitor numbers starting to increase in May were also found by the Google-based pattern. The Twitter-based human mobility pattern shows about a 40% decrease since mid-March. Unlike the Google-based pattern, no increase in May was found in the Twitter-based pattern.

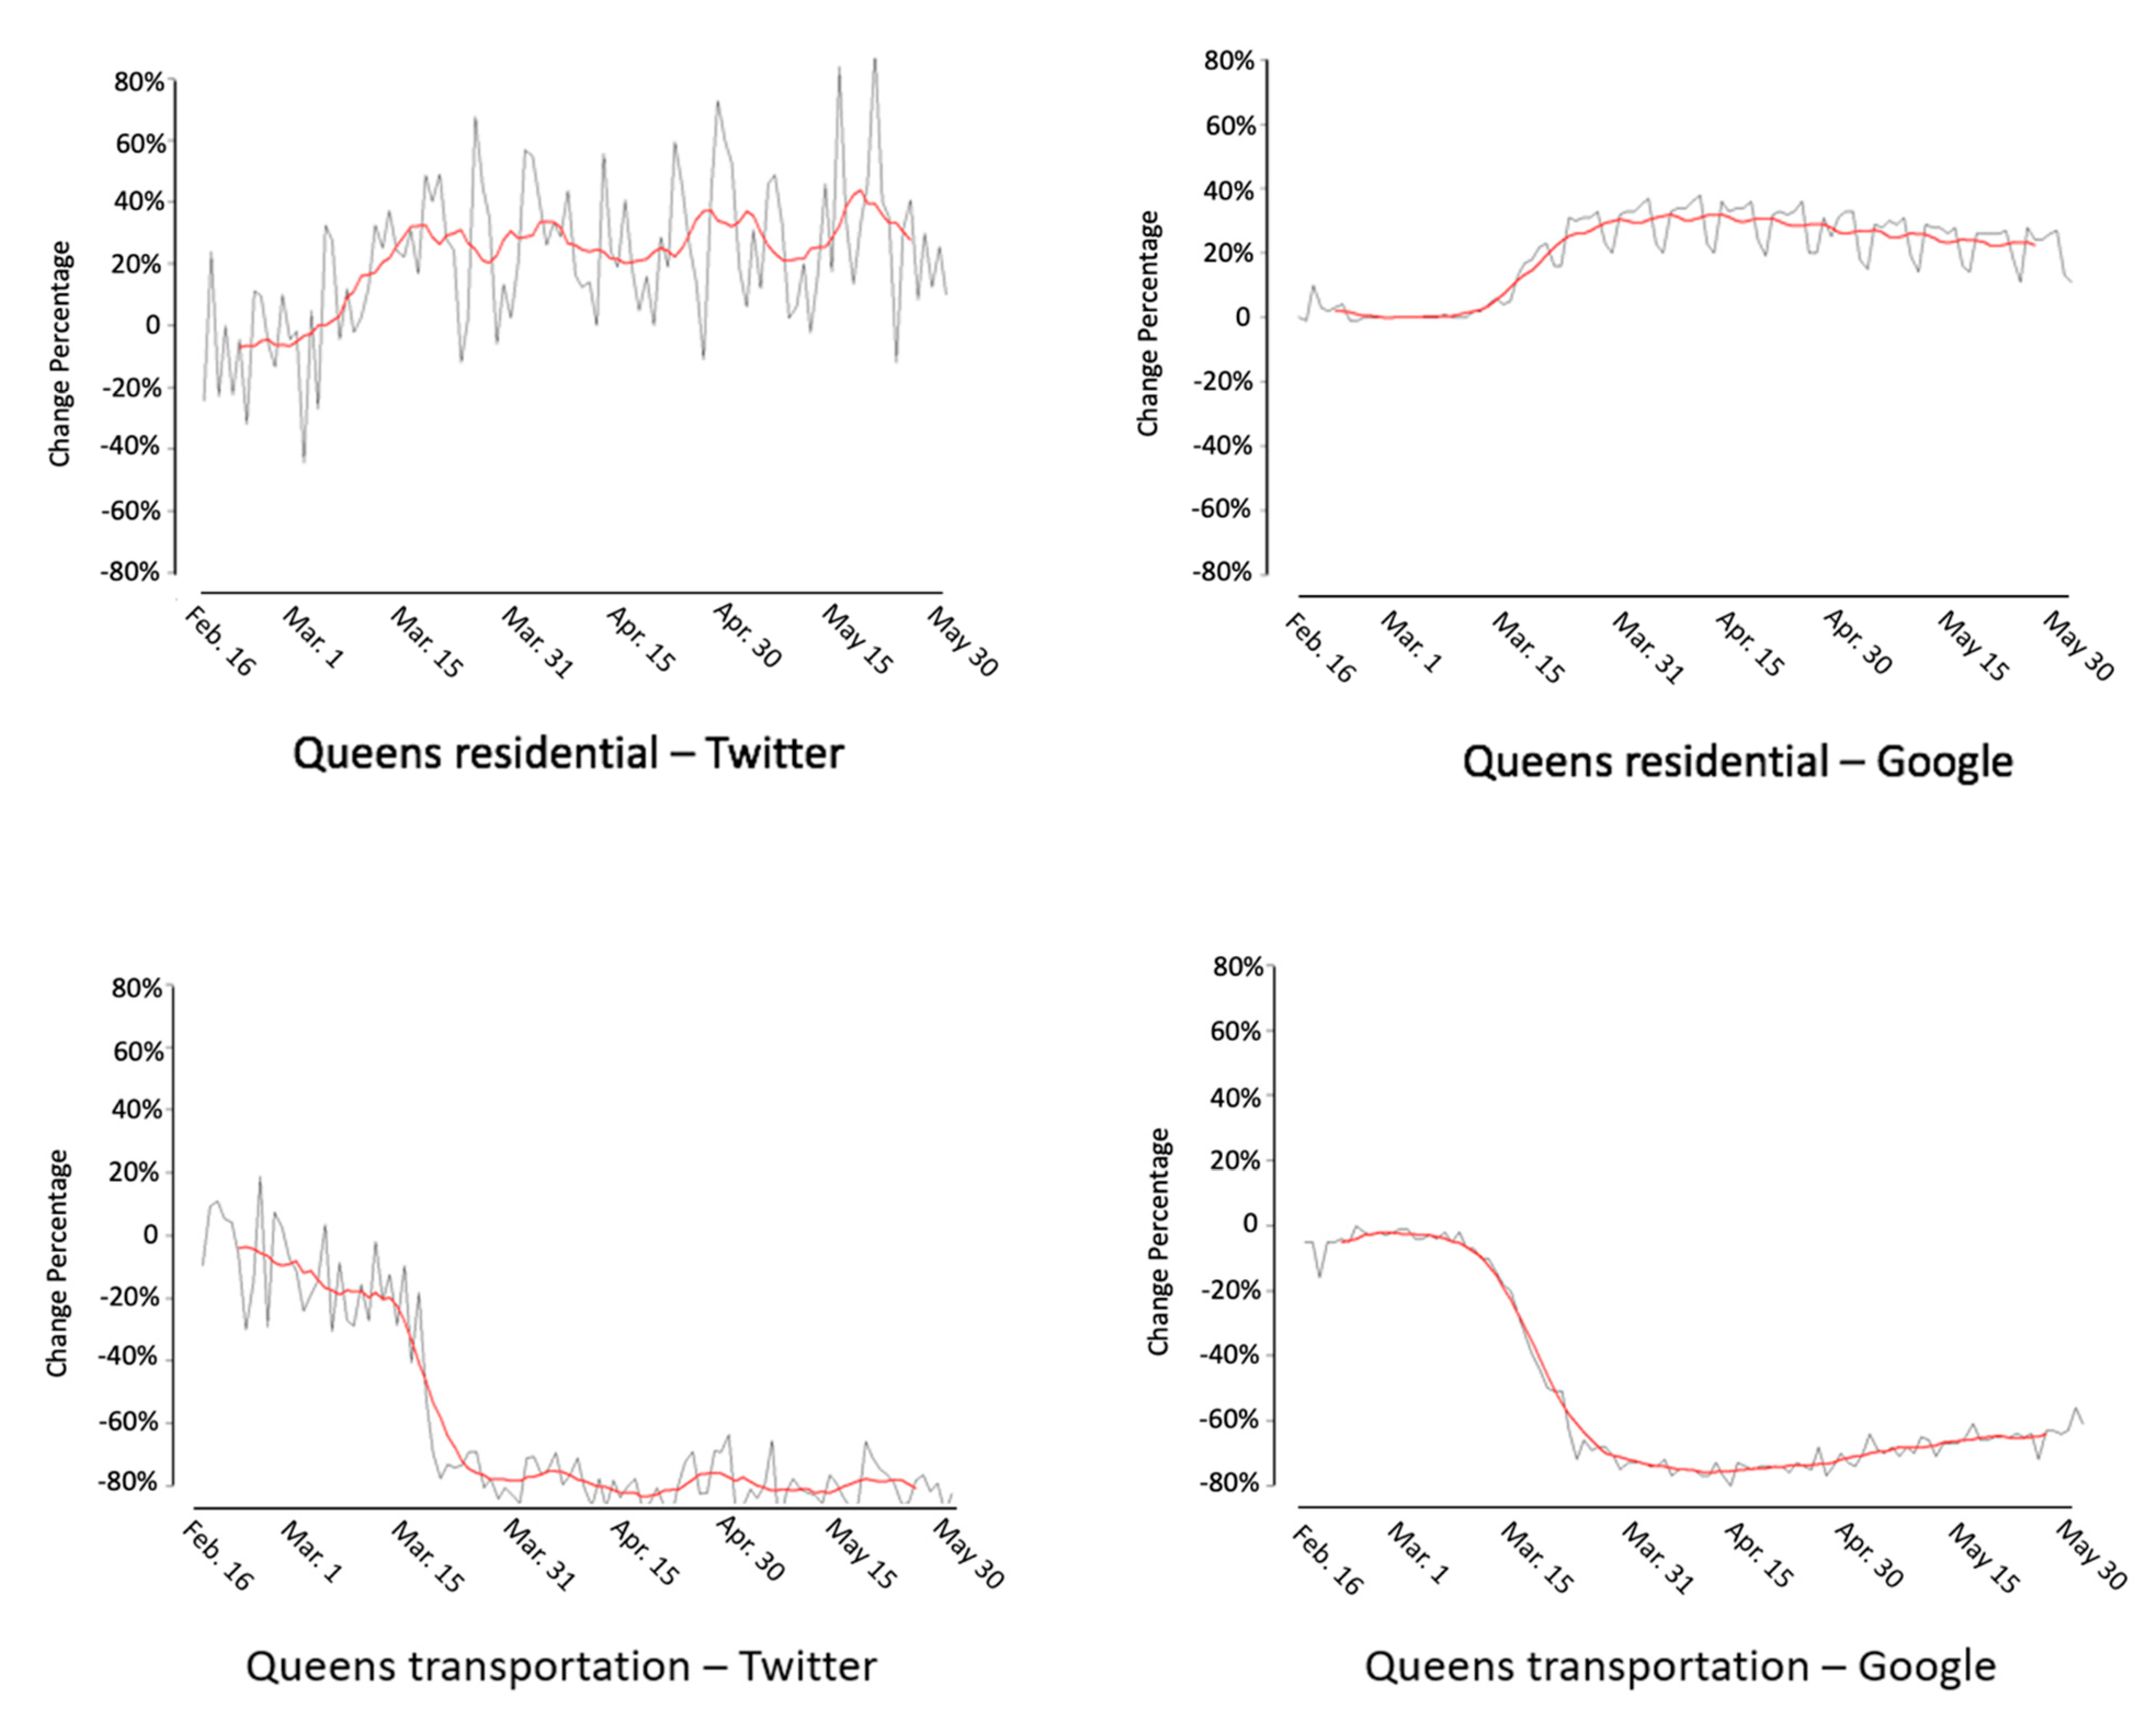
5.2.4. Queens County

Although Twitter- and Google-based human mobility patterns use different methods to calculate human mobility changes, both patterns show a 20% increase for residential lands in Queens County (Figure 7). Similar to all residential lands, Google can identify weekday–weekend differences, while Twitter-based human mobility patterns cannot. Regarding transportation-related lands, both Twitter- and Google-based human mobility patterns show a significant drop in the number of visitors around 3/15. However, the Twitter-based human mobility pattern shows a larger decrease: about 80%. On the other hand, the Google-based pattern finds a 70% decrease, and the number of visitors started to increase in May, which is not identified by the Twitter-based human mobility pattern.

6. Discussion

6.1. Comparison of Mobility Patterns Derived from Google and Twitter

This study compares human mobility patterns during the COVID-19 pandemic using two different data sources: cell phone (Google) and Twitter. Human mobility patterns and changes of those patterns are different mainly because of the different data collection methods with these two data sources. The Google Community Mobility Report is generated using the Location History feature with Google Accounts. According to Google, if a user turns on Location History in their Google Account, and this user is signed into his/her Google Account on his/her mobile device, the location history is saved to Google. In other words, even if a user does not actively report location by posting or checking in with any Google products, Google is able to get this user’s location if this user has Location History turned on. With a large number of users who turned on Location History at the Google Account-level for the convenience provided by Google products, Google has access to continuous individual-level location, which enables Google to analyze human mobility patterns at a more detailed and continuous level.
On the other hand, Twitter-based human mobility data collection relies on Twitter users’ activities completely. Individual-level location records are based on tweeting frequency and decisions about location sharing of each tweet for each individual user. Therefore, Twitter-based human mobility patterns can be viewed as discrete patterns. Comparing to human mobility data collected by Google, Twitter-based human mobility data fail to tell how long a user spends at a given location.
Mobility patterns in residential for Google Community Mobility Report and Twitter-based human mobility are calculated differently, which provides quite different results. The Google Community Mobility Report calculates changes in the length of time spent in residential land, while Twitter-based human mobility calculates changes in the number of Twitter users. Therefore, the Google Community Mobility Report found increases in users on residential land for the four counties in NYC. Differently, Twitter-based human mobility indicates decreases in users on residential land in New York County (Manhattan). One reasonable guess is that residential Manhattan had a decrease in the number of visitors from outside of Manhattan, and those visitors contributed to a large portion of the tweets posted from the Manhattan residential area as they visit friends in Manhattan. Since the Google Community Mobility Report calculates changes for time length, longer time spent at residential land was found.
Workplace shows weekly cycles in the Google Community Mobility Report, but not in Twitter-based human mobility patterns. Interestingly, the Google Community Mobility Report shows more people visiting workplaces during the weekends. Such weekend peaks are found in Bronx County, Kings County, and New York County. However, Twitter-based workplace mobility patterns do not present such weekly cycles. Instead, the Twitter-based workplace mobility pattern in New York County shows fewer fluctuations after the lockdown.
In Queens County and New York County, human mobility patterns in transportation show similar trends with Google- and Twitter-based human mobility patterns, although Google presents a smoother change than the Twitter-based human mobility pattern change. This is caused by the different number of sampled users. Since the Twitter-based human mobility pattern calculates changes with a smaller sample than the changes calculated in the Google Community Mobility Report, the resulting change percentage is larger in Twitter-based human mobility. From this perspective, Google-based mobility patterns present changes in routine travel patterns such as commuting, while Twitter-based human mobility patterns are more sensitive to irregular patterns such as special events.
As demonstrated in this case, Twitter-based and cell phone-based data show different perspectives of human mobility patterns and changes of such patterns. Each data source shows specific perspectives of activity and human interaction with the land use types. Future research should consider more about data fusion to present multifaceted human mobility patterns and to capture a wider spectrum of the population.

6.2. Limitations

Although Twitter-based human mobility data provide fast and robust results for mobility pattern change detection, we realize that limitations exist in Twitter-based human mobility data. First is the issue of representativeness. Twitter, the same as all other social media platforms, only can attract a small portion of the total population. Furthermore, not all Twitter users post tweets with geotags to a resolution that can be valid for this study. Existing studies have recognized this problem and have examined for population biases with Twitter users [78,79,80]. Unfortunately, no solutions have been found so far. Comparing to Twitter users, Google has a larger number of users as sampled for mobility pattern changes. However, Google Location History requires additional action to be turned on. Similar to Twitter-based human mobility data collection, cell phone-based data are limited to users of certain companies, which is also affected by issues of representativeness [81,82].
The second limitation of this study is the baseline calculation method. In this study, the baseline is calculated with a 5-week period data (1/3–2/6), which follows the Google Community Mobility Report. However, human mobility patterns during this time can be affected by seasonal tourism, especially considering NYC as an internationally famous tourism destination. For a better human mobility analysis, baseline calculation should consider the annual cycle of human mobility. For instance, human mobility data from last year March to May should also be included for baseline calculation.

6.3. Future Research

Despite the limitations, compared to most cell phone-based mobility data, the value of Twitter-based (or more generally social media-based) human mobility data lies in that they provide multi-dimensional information rather than only the changes in the location of individuals. Despite not being used in this study, tweets posted in NYC can be analyzed with text-based methods to retrieve information such as increasing situational awareness, allocation of medical needs, and reporting problems or change of services [65,83]. Such analysis can help us better understand human mobility dynamics during the pandemic, such as why people are still going to parks regardless of the stay-at-home executive order. In addition, with self-description and other information provided by each individual Twitter user, further analysis can be conducted, including how COVID-19 impacts different demographic and socioeconomic groups
Secondly, Twitter data provide more flexibility in spatiotemporal resolution. Human mobility data provided by Google Mobility Report are at the county and state level. No finer resolution such as tract-level mobility patterns can be retrieved from those data. Therefore, the spatial variance within a county cannot be captured. On the other hand, Twitter data can be aggregated to different spatial resolutions, which is a better fit for different research applications. Temporally, Twitter data allow individual-level mobility analysis, such as trajectory analysis and trip prediction. With long-term Twitter-based mobility data, more sophisticated change detection methods, such as time series, can be applied to better capture abnormality in human mobility.

7. Conclusions

This study explores the change of human mobility patterns in New York City using Twitter data. With the open access NYC detailed land use data, this study analyzes changes of Twitter user number of different land use types of NYC during the COVID-19 pandemic. This study also compares Twitter-based human mobility pattern changes with the Google Community Mobility Report at the county (borough) level of NYC. Comparing Twitter-based human mobility patterns and the Google Community Mobility Report, a major difference exists in residential lands, since Google Location History is able to record the length of time each individual spent at a location, which cannot be achieved with Twitter data. On the other hand, Twitter-based human mobility and the Google Community Mobility Report show similar results in changes at workplaces and transportation-related land use, such as subway stations and airports.
Human mobility data have played key roles in understanding and combating the COVID-19 pandemic. However, data accessibility placed limitations in scientific research, as many human mobility data are provided and protected by commercial companies whose raw data are not released to the general public. As an initial effort to bridge this gap, this study provides a comparison between the effectiveness of identifying human mobility changes using social media data (Twitter) and cell phone data (Google) during the COVID-19 pandemic in NYC. The results of this study show that in some applications, open-access social media data (Twitter) can generate similar results to private data (Google), and thus, under some situations, social media data are capable of substituting private data to facilitate real-time human mobility monitoring. In addition, the results of this study can be used to develop platforms for infectious diseases monitoring and further analysis of different characteristics of human mobility patterns during the COVID-19 pandemic.

Author Contributions

Conceptualization, Yuqin Jiang, Xiao Huang and Zhenlong Li; methodology, Yuqin Jiang; analysis, Yuqin Jiang, Xiao Huang and Zhenlong Li; investigation, Yuqin Jiang; data curation, Yuqin Jiang and Zhenlong Li; writing—original draft preparation, Yuqin Jiang; writing—review and editing, Xiao Huang and Zhenlong Li; visualization, Yuqin Jiang; supervision, Zhenlong Li; project administration, Zhenlong Li; funding acquisition, Zhenlong Li. All authors have read and agreed to the published version of the manuscript.

Funding

The research is supported by NSF (2028791) and the University of South Carolina ASPIRE program (135400-20-54176). The funders had no role in study design, data collection and analysis, decision to publish, or preparation of the manuscript.

Informed Consent Statement

Not applicable.

Data Availability Statement

Twitter data were downloaded using Twitter Streaming API.

Acknowledgments

We thank the anonymous reviewers for their helpful comments.

Conflicts of Interest

The authors declare no conflict of interest. The funders had no role in the design of the study; in the collection, analyses, or interpretation of data; in the writing of the manuscript, or in the decision to publish the results.

References

  1. WHO Coronavirus Disease (COVID-19) Dashboard | WHO Coronavirus Disease (COVID-19) Dashboard. Available online: https://covid19.who.int/table (accessed on 28 September 2020).
  2. Calgary, O. United States COVID-19 Cases and Deaths by State over Time | Data | Centers for Disease Control and Prevention. Available online: https://data.cdc.gov/Case-Surveillance/United-States-COVID-19-Cases-and-Deaths-by-State-o/9mfq-cb36 (accessed on 27 September 2020).
  3. Proclamation on Declaring a National Emergency Concerning the Novel Coronavirus Disease (COVID-19) Outbreak. Available online: https://www.whitehouse.gov/presidential-actions/proclamation-declaring-national-emergency-concerning-novel-coronavirus-disease-covid-19-outbreak/ (accessed on 28 September 2020).
  4. CDC Coronavirus Disease 2019 (COVID-19). Available online: https://www.cdc.gov/coronavirus/2019-ncov/prevent-getting-sick/social-distancing.html (accessed on 28 September 2020).
  5. Kraemer, M.U.; Yang, C.-H.; Gutierrez, B.; Wu, C.-H.; Klein, B.; Pigott, D.M.; Du Plessis, L.; Faria, N.R.; Li, R.; Hanage, W.P. The Effect of Human Mobility and Control Measures on the COVID-19 Epidemic in China. Science 2020, 368, 493–497. [Google Scholar] [CrossRef] [Green Version]
  6. Maier, B.F.; Brockmann, D. Effective Containment Explains Subexponential Growth in Recent Confirmed COVID-19 Cases in China. Science 2020, 368, 742–746. [Google Scholar] [CrossRef] [PubMed] [Green Version]
  7. Shim, E.; Tariq, A.; Choi, W.; Lee, Y.; Chowell, G. Transmission Potential and Severity of COVID-19 in South Korea. Int. J. Infect. Dis. 2020, 93, 339–344. [Google Scholar] [CrossRef]
  8. Gatto, M.; Bertuzzo, E.; Mari, L.; Miccoli, S.; Carraro, L.; Casagrandi, R.; Rinaldo, A. Spread and Dynamics of the COVID-19 Epidemic in Italy: Effects of Emergency Containment Measures. Proc. Natl. Acad. Sci. USA 2020, 117, 10484–10491. [Google Scholar] [CrossRef] [PubMed] [Green Version]
  9. Courtemanche, C.; Garuccio, J.; Le, A.; Pinkston, J.; Yelowitz, A. Strong Social Distancing Measures in The United States Reduced The COVID-19 Growth Rate: Study Evaluates the Impact of Social Distancing Measures on the Growth Rate of Confirmed COVID-19 Cases across the United States. Health Aff. 2020, 39, 1237–1246. [Google Scholar] [CrossRef] [PubMed]
  10. Pan, B.; Zheng, Y.; Wilkie, D.; Shahabi, C. Crowd Sensing of Traffic Anomalies Based on Human Mobility and Social Media. In Proceedings of the 21st ACM International Conference on Advances in Geographical Information Systems, Orlando, FL, USA, November 2013; Association for Computing Machinery: New York, NY, USA, 2013; pp. 344–353. [Google Scholar]
  11. Nawaz, M.S.; Bilal, M.; Lali, M.I.; Ul Mustafa, R.; Aslam, W.; Jajja, S. Effectiveness of Social Media Data in Healthcare Communication. J. Med. Imaging Health Inform. 2017, 7, 1365–1371. [Google Scholar] [CrossRef]
  12. Charles-Smith, L.E.; Reynolds, T.L.; Cameron, M.A.; Conway, M.; Lau, E.H.; Olsen, J.M.; Pavlin, J.A.; Shigematsu, M.; Streichert, L.C.; Suda, K.J. Using Social Media for Actionable Disease Surveillance and Outbreak Management: A Systematic Literature Review. PLoS ONE 2015, 10, e0139701. [Google Scholar] [CrossRef] [Green Version]
  13. Tang, L.; Bie, B.; Park, S.-E.; Zhi, D. Social Media and Outbreaks of Emerging Infectious Diseases: A Systematic Review of Literature. Am. J. Infect. Control 2018, 46, 962–972. [Google Scholar] [CrossRef] [PubMed]
  14. Lwin, M.O.; Lu, J.; Sheldenkar, A.; Schulz, P.J.; Shin, W.; Gupta, R.; Yang, Y. Global Sentiments Surrounding the COVID-19 Pandemic on Twitter: Analysis of Twitter Trends. JMIR Public Health Surveill. 2020, 6, e19447. [Google Scholar] [CrossRef]
  15. Zhu, B.; Zheng, X.; Liu, H.; Li, J.; Wang, P. Analysis of Spatiotemporal Characteristics of Big Data on Social Media Sentiment with COVID-19 Epidemic Topics. Chaos Solitons Fractals 2020, 140, 110123. [Google Scholar] [CrossRef]
  16. Liao, C.-M.; You, S.-H. Assessing Risk Perception and Behavioral Responses to Influenza Epidemics: Linking Information Theory to Probabilistic Risk Modeling. Stoch. Environ. Res. Risk Assess. 2014, 28, 189–200. [Google Scholar] [CrossRef]
  17. Bansal, S.; Chowell, G.; Simonsen, L.; Vespignani, A.; Viboud, C. Big Data for Infectious Disease Surveillance and Modeling. J. Infect. Dis. 2016, 214, S375–S379. [Google Scholar] [CrossRef] [PubMed]
  18. Ye, X.; Li, S.; Yang, X.; Qin, C. Use of Social Media for the Detection and Analysis of Infectious Diseases in China. ISPRS Int. J. Geo-Inf. 2016, 5, 156. [Google Scholar] [CrossRef] [Green Version]
  19. Lazard, A.J.; Scheinfeld, E.; Bernhardt, J.M.; Wilcox, G.B.; Suran, M. Detecting Themes of Public Concern: A Text Mining Analysis of the Centers for Disease Control and Prevention’s Ebola Live Twitter Chat. Am. J. Infect. Control 2015, 43, 1109–1111. [Google Scholar] [CrossRef]
  20. Fung, I.C.-H.; Duke, C.H.; Finch, K.C.; Snook, K.R.; Tseng, P.-L.; Hernandez, A.C.; Gambhir, M.; Fu, K.-W.; Tse, Z.T.H. Ebola Virus Disease and Social Media: A Systematic Review. Am. J. Infect. Control 2016, 44, 1660–1671. [Google Scholar] [CrossRef]
  21. Fu, K.-W.; Liang, H.; Saroha, N.; Tse, Z.T.H.; Ip, P.; Fung, I.C.-H. How People React to Zika Virus Outbreaks on Twitter? A Computational Content Analysis. Am. J. Infect. Control 2016, 44, 1700–1702. [Google Scholar] [CrossRef] [PubMed]
  22. Stefanidis, A.; Vraga, E.; Lamprianidis, G.; Radzikowski, J.; Delamater, P.L.; Jacobsen, K.H.; Pfoser, D.; Croitoru, A.; Crooks, A. Zika in Twitter: Temporal Variations of Locations, Actors, and Concepts. JMIR Public Health Surveill. 2017, 3, e22. [Google Scholar] [CrossRef] [PubMed]
  23. Chew, C.; Eysenbach, G. Pandemics in the Age of Twitter: Content Analysis of Tweets during the 2009 H1N1 Outbreak. PLoS ONE 2010, 5, e14118. [Google Scholar] [CrossRef] [PubMed]
  24. Signorini, A.; Segre, A.M.; Polgreen, P.M. The Use of Twitter to Track Levels of Disease Activity and Public Concern in the US during the Influenza A H1N1 Pandemic. PLoS ONE 2011, 6, e19467. [Google Scholar] [CrossRef] [Green Version]
  25. Albinati, J.; Meira, W., Jr.; Pappa, G.L.; Teixeira, M.; Marques-Toledo, C. Enhancement of Epidemiological Models for Dengue Fever Based on Twitter Data; Association for Computing Machinery: New York, NY, USA, 2017; pp. 109–118. [Google Scholar]
  26. Ramadona, A.L.; Tozan, Y.; Lazuardi, L.; Rocklöv, J. A Combination of Incidence Data and Mobility Proxies from Social Media Predicts the Intra-Urban Spread of Dengue in Yogyakarta, Indonesia. PLoS Negl. Trop. Dis. 2019, 13, e0007298. [Google Scholar] [CrossRef] [PubMed]
  27. Kraemer, M.U.; Bisanzio, D.; Reiner, R.; Zakar, R.; Hawkins, J.B.; Freifeld, C.C.; Smith, D.L.; Hay, S.I.; Brownstein, J.S.; Perkins, T.A. Inferences about Spatiotemporal Variation in Dengue Virus Transmission Are Sensitive to Assumptions about Human Mobility: A Case Study Using Geolocated Tweets from Lahore, Pakistan. EPJ Data Sci. 2018, 7, 16. [Google Scholar] [CrossRef] [PubMed] [Green Version]
  28. Broniatowski, D.A.; Paul, M.J.; Dredze, M. National and Local Influenza Surveillance through Twitter: An Analysis of the 2012-2013 Influenza Epidemic. PLoS ONE 2013, 8, e83672. [Google Scholar] [CrossRef] [PubMed] [Green Version]
  29. Allen, C.; Tsou, M.-H.; Aslam, A.; Nagel, A.; Gawron, J.-M. Applying GIS and Machine Learning Methods to Twitter Data for Multiscale Surveillance of Influenza. PLoS ONE 2016, 11, e0157734. [Google Scholar] [CrossRef] [PubMed]
  30. Lai, S.; Ruktanonchai, N.W.; Zhou, L.; Prosper, O.; Luo, W.; Floyd, J.R.; Wesolowski, A.; Santillana, M.; Zhang, C.; Du, X. Effect of Non-Pharmaceutical Interventions for Containing the COVID-19 Outbreak in China. medRxiv 2020. [Google Scholar] [CrossRef] [Green Version]
  31. Barlacchi, G.; Perentis, C.; Mehrotra, A.; Musolesi, M.; Lepri, B. Are You Getting Sick? Predicting Influenza-like Symptoms Using Human Mobility Behaviors. EPJ Data Sci. 2017, 6, 27. [Google Scholar] [CrossRef] [PubMed] [Green Version]
  32. Souza, R.C.; Assunção, R.M.; Neill, D.B.; Meira, W., Jr. Detecting Spatial Clusters of Disease Infection Risk Using Sparsely Sampled Social Media Mobility Patterns. In Proceedings of the 27th ACM SIGSPATIAL International Conference on Advances in Geographic Information Systems, Chicago, IL, USA, 5–8 November 2019; pp. 359–368. [Google Scholar]
  33. Franch-Pardo, I.; Napoletano, B.M.; Rosete-Verges, F.; Billa, L. Spatial Analysis and GIS in the Study of COVID-19. A Review. Sci. Total Environ. 2020, 739, 140033. [Google Scholar] [CrossRef]
  34. Yang, C.; Sha, D.; Liu, Q.; Li, Y.; Lan, H.; Guan, W.W.; Hu, T.; Li, Z.; Zhang, Z.; Thompson, J.H. Taking the Pulse of COVID-19: A Spatiotemporal Perspective. Int. J. Digit. Earth 2020, 1–26. [Google Scholar] [CrossRef]
  35. Zhou, C.; Su, F.; Pei, T.; Zhang, A.; Du, Y.; Luo, B.; Cao, Z.; Wang, J.; Yuan, W.; Zhu, Y. COVID-19: Challenges to GIS with Big Data. Geogr. Sustain. 2020, 1, 77–87. [Google Scholar] [CrossRef]
  36. Bragazzi, N.L.; Dai, H.; Damiani, G.; Behzadifar, M.; Martini, M.; Wu, J. How Big Data and Artificial Intelligence Can Help Better Manage the COVID-19 Pandemic. Int. J. Environ. Res. Public Health 2020, 17, 3176. [Google Scholar] [CrossRef]
  37. Gasser, U.; Ienca, M.; Scheibner, J.; Sleigh, J.; Vayena, E. Digital Tools against COVID-19: Framing the Ethical Challenges and How to Address Them. arXiv 2020, arXiv:2004.10236. [Google Scholar]
  38. Li, Z.; Huang, X.; Hu, T.; Ning, H.; Ye, X.; Li, X. ODT FLOW: A Scalable Platform for Extracting, Analyzing, and Sharing Multi-Source Multi-Scale Human Mobility. arXiv 2021, arXiv:2104.05040. [Google Scholar]
  39. Guan, W.; Ni, Z.; Hu, Y.; Liang, W.; Ou, C.; He, J.; Liu, L.; Shan, H.; Lei, C.; Hui, D.S. Clinical Characteristics of Coronavirus Disease 2019 in China. N. Engl. J. Med. 2020, 382, 1708–1720. [Google Scholar] [CrossRef]
  40. Huang, J.; Wang, H.; Fan, M.; Zhuo, A.; Sun, Y.; Li, Y. Understanding the Impact of the COVID-19 Pandemic on Transportation-Related Behaviors with Human Mobility Data. In Proceedings of the 26th ACM SIGKDD International Conference on Knowledge Discovery & Data Mining, CA, USA, July 2020; pp. 3443–3450. Available online: https://0-dl-acm-org.brum.beds.ac.uk/doi/10.1145/3394486.3412856 (accessed on 28 September 2020).
  41. Arab-Mazar, Z.; Sah, R.; Rabaan, A.A.; Dhama, K.; Rodriguez-Morales, A.J. Mapping the Incidence of the COVID-19 Hotspot in Iran–Implications for Travellers. Travel Med. Infect. Dis. 2020, 34, 101630. [Google Scholar] [CrossRef] [PubMed]
  42. Ahmadi, M.; Sharifi, A.; Dorosti, S.; Ghoushchi, S.J.; Ghanbari, N. Investigation of Effective Climatology Parameters on COVID-19 Outbreak in Iran. Sci. Total Environ. 2020, 729, 138705. [Google Scholar] [CrossRef] [PubMed]
  43. Giuliani, D.; Dickson, M.M.; Espa, G.; Santi, F. Modelling and Predicting the Spatio-Temporal Spread of Coronavirus Disease 2019 (COVID-19) in Italy. BMC Infect. Dis. 2020, 20, 700. [Google Scholar] [CrossRef] [Green Version]
  44. Grantz, K.H.; Meredith, H.R.; Cummings, D.A.; Metcalf, C.J.E.; Grenfell, B.T.; Giles, J.R.; Mehta, S.; Solomon, S.; Labrique, A.; Kishore, N. The Use of Mobile Phone Data to Inform Analysis of COVID-19 Pandemic Epidemiology. Nat. Commun. 2020, 11, 4961. [Google Scholar] [CrossRef] [PubMed]
  45. Keeling, M.J.; Hollingsworth, T.D.; Read, J.M. The Efficacy of Contact Tracing for the Containment of the 2019 Novel Coronavirus (COVID-19). medRxiv 2020. [Google Scholar] [CrossRef] [PubMed]
  46. Cho, H.; Ippolito, D.; Yu, Y.W. Contact Tracing Mobile Apps for COVID-19: Privacy Considerations and Related Trade-Offs. arXiv 2020, arXiv:2003.11511. [Google Scholar]
  47. Zhou, Y.; Xu, R.; Hu, D.; Yue, Y.; Li, Q.; Xia, J. Effects of Human Mobility Restrictions on the Spread of COVID-19 in Shenzhen, China: A Modelling Study Using Mobile Phone Data. Lancet Digit. Health 2020, 2, e417–e424. [Google Scholar] [CrossRef]
  48. Cecilia, J.M.; Cano, J.-C.; Hernández-Orallo, E.; Calafate, C.T.; Manzoni, P. Mobile Crowdsensing Approaches to Address the COVID-19 Pandemic in Spain. IET Smart Cities 2020, 2, 58–63. [Google Scholar] [CrossRef]
  49. Lee, D.; Lee, J. Testing on the Move South Korea’s Rapid Response to the COVID-19 Pandemic. Transp. Res. Interdiscip. Perspect. 2020, 5, 100111. [Google Scholar] [CrossRef]
  50. Gao, S.; Rao, J.; Kang, Y.; Liang, Y.; Kruse, J.; Doepfer, D.; Sethi, A.K.; Reyes, J.F.M.; Patz, J.; Yandell, B.S. Mobile Phone Location Data Reveal the Effect and Geographic Variation of Social Distancing on the Spread of the COVID-19 Epidemic. arXiv 2020, arXiv:2004.11430. [Google Scholar]
  51. Gao, S.; Rao, J.; Kang, Y.; Liang, Y.; Kruse, J. Mapping County-Level Mobility Pattern Changes in the United States in Response to COVID-19. SIGSPATIAL Spec. 2020, 12, 16–26. [Google Scholar] [CrossRef]
  52. Jeffrey, B.; Walters, C.E.; Ainslie, K.E.; Eales, O.; Ciavarella, C.; Bhatia, S.; Hayes, S.; Baguelin, M.; Boonyasiri, A.; Brazeau, N.F. Anonymised and Aggregated Crowd Level Mobility Data from Mobile Phones Suggests That Initial Compliance with COVID-19 Social Distancing Interventions Was High and Geographically Consistent across the UK. Wellcome Open Res. 2020, 5, 170. [Google Scholar] [CrossRef] [PubMed]
  53. Huang, X.; Lu, J.; Gao, S.; Wang, S.; Liu, Z.; Wei, H. Staying at Home Is a Privilege: Evidence from Fine-Grained Mobile Phone Location Data in the U.S. during the COVID-19 Pandemic. Ann. Am. Assoc. Geogr. 2021. [Google Scholar] [CrossRef]
  54. Huang, X.; Li, Z.; Lu, J.; Wang, S.; Wei, H.; Chen, B. Time-Series Clustering for Home Dwell Time during COVID-19: What Can We Learn from It? ISPRS Int. J. Geo-Inf. 2020, 9, 675. [Google Scholar] [CrossRef]
  55. Kang, Y.; Gao, S.; Liang, Y.; Li, M.; Rao, J.; Kruse, J. Multiscale Dynamic Human Mobility Flow Dataset in the US during the COVID-19 Epidemic. Sci. Data 2020, 7, 390. [Google Scholar] [CrossRef]
  56. Gao, S.; Rao, J.; Kang, Y.; Liang, Y.; Kruse, J.; Dopfer, D.; Sethi, A.K.; Reyes, J.F.M.; Yandell, B.S.; Patz, J.A. Association of Mobile Phone Location Data Indications of Travel and Stay-at-Home Mandates with Covid-19 Infection Rates in the Us. JAMA Netw. Open 2020, 3, e2020485. [Google Scholar] [CrossRef]
  57. Kogan, N.E.; Clemente, L.; Liautaud, P.; Kaashoek, J.; Link, N.B.; Nguyen, A.T.; Lu, F.S.; Huybers, P.; Resch, B.; Havas, C. An Early Warning Approach to Monitor COVID-19 Activity with Multiple Digital Traces in near Real Time. Sci. Adv. 2021, 7, eabd6989. [Google Scholar] [CrossRef] [PubMed]
  58. Queiroz, L.; Ferraz, A.; Melo, J.L.; Barboza, G.; Urbanski, A.H.; Nicolau, A.; Oliva, S.; Nakaya, H. Large-Scale Assessment of Human Mobility during COVID-19 Outbreak. 2020. Available online: https://osf.io/nqxrd/ (accessed on 28 September 2020).
  59. Huang, X.; Li, Z.; Jiang, Y.; Li, X.; Porter, D. Twitter, Human Mobility, and COVID-19. arXiv 2020, arXiv:2007.01100. [Google Scholar]
  60. Cotti, C.D.; Engelhardt, B.; Foster, J.; Nesson, E.T.; Niekamp, P.S. The Relationship between In-Person Voting, Consolidated Polling Locations, and Absentee Voting on Covid-19: Evidence from the Wisconsin Primary; National Bureau of Economic Research: Cambridge, MA, USA, 2020. [Google Scholar]
  61. Ghader, S.; Zhao, J.; Lee, M.; Zhou, W.; Zhao, G.; Zhang, L. Observed Mobility Behavior Data Reveal Social Distancing Inertia. arXiv 2020, arXiv:2004.14748. [Google Scholar]
  62. Zhao, J.; Lee, M.; Ghader, S.; Younes, H.; Darzi, A.; Xiong, C.; Zhang, L. Quarantine Fatigue: First-Ever Decrease in Social Distancing Measures after the COVID-19 Pandemic Outbreak before Reopening United States. arXiv 2020, arXiv:2006.03716. [Google Scholar]
  63. Bisanzio, D.; Kraemer, M.U.; Bogoch, I.I.; Brewer, T.; Brownstein, J.S.; Reithinger, R. Use of Twitter Social Media Activity as a Proxy for Human Mobility to Predict the Spatiotemporal Spread of COVID-19 at Global Scale. Geospat. Health 2020, 15. [Google Scholar] [CrossRef]
  64. Porcher, S.; Renault, T. Social Distancing Beliefs and Human Mobility: Evidence from Twitter. arXiv 2020, arXiv:2008.04826. [Google Scholar]
  65. Huang, X.; Li, Z.; Jiang, Y.; Ye, X.; Deng, C.; Zhang, J.; Li, X. The Characteristics of Multi-Source Mobility Datasets and How They Reveal the Luxury Nature of Social Distancing in the US during the COVID-19 Pandemic. medRxiv 2020. [Google Scholar] [CrossRef]
  66. Li, L.; Zhang, Q.; Wang, X.; Zhang, J.; Wang, T.; Gao, T.-L.; Duan, W.; Tsoi, K.K.; Wang, F.-Y. Characterizing the Propagation of Situational Information in Social Media during Covid-19 Epidemic: A Case Study on Weibo. IEEE Trans. Comput. Soc. Syst. 2020, 7, 556–562. [Google Scholar] [CrossRef]
  67. Cinelli, M.; Quattrociocchi, W.; Galeazzi, A.; Valensise, C.M.; Brugnoli, E.; Schmidt, A.L.; Zola, P.; Zollo, F.; Scala, A. The Covid-19 Social Media Infodemic. Sci. Rep. 2020, 10, 16598. [Google Scholar] [CrossRef]
  68. Depoux, A.; Martin, S.; Karafillakis, E.; Preet, R.; Wilder-Smith, A.; Larson, H. The Pandemic of Social Media Panic Travels Faster than the COVID-19 Outbreak. J. Travel Med. 2020, 27, taaa031. [Google Scholar] [CrossRef] [PubMed] [Green Version]
  69. Bridgman, A.; Merkley, E.; Loewen, P.J.; Owen, T.; Ruths, D.; Teichmann, L.; Zhilin, O. The Causes and Consequences of COVID-19 Misperceptions: Understanding the Role of News and Social Media. Harv. Kennedy Sch. Misinform. Rev. 2020, 1. [Google Scholar] [CrossRef]
  70. Kouzy, R.; Abi Jaoude, J.; Kraitem, A.; El Alam, M.B.; Karam, B.; Adib, E.; Zarka, J.; Traboulsi, C.; Akl, E.W.; Baddour, K. Coronavirus Goes Viral: Quantifying the COVID-19 Misinformation Epidemic on Twitter. Cureus 2020, 12, e7255. [Google Scholar] [CrossRef] [PubMed] [Green Version]
  71. Gao, J.; Zheng, P.; Jia, Y.; Chen, H.; Mao, Y.; Chen, S.; Wang, Y.; Fu, H.; Dai, J. Mental Health Problems and Social Media Exposure during COVID-19 Outbreak. PLoS ONE 2020, 15, e0231924. [Google Scholar] [CrossRef]
  72. Wahbeh, A.; Nasralah, T.; Al-Ramahi, M.; El-Gayar, O. Mining Physicians’ Opinions on Social Media to Obtain Insights into COVID-19: Mixed Methods Analysis. JMIR Public Health Surveill. 2020, 6, e19276. [Google Scholar] [CrossRef]
  73. Li, D.; Chaudhary, H.; Zhang, Z. Modeling Spatiotemporal Pattern of Depressive Symptoms Caused by COVID-19 Using Social Media Data Mining. Int. J. Environ. Res. Public Health 2020, 17, 4988. [Google Scholar] [CrossRef] [PubMed]
  74. Koh, J.X.; Liew, T.M. How Loneliness Is Talked about in Social Media during COVID-19 Pandemic: Text Mining of 4,492 Twitter Feeds. J. Psychiatr. Res. 2020. [Google Scholar] [CrossRef] [PubMed]
  75. New York City Department of City Planning PLUTO DATA DICTIONARY September 2020 (20v6). Available online: http://www.nyc.gov/html/dcp/html/bytes/applbyte.shtml (accessed on 28 September 2020).
  76. Google LLC. COVID-19 Community Mobility Report. Available online: https://www.google.com/covid19/mobility?hl=en. (accessed on 2 December 2020).
  77. Pfeffer, J.; Mayer, K.; Morstatter, F. Tampering with Twitter’s Sample API. EPJ Data Sci. 2018, 7, 50. [Google Scholar] [CrossRef] [Green Version]
  78. Jiang, Y.; Li, Z.; Ye, X. Understanding Demographic and Socioeconomic Biases of Geotagged Twitter Users at the County Level. Cartogr. Geogr. Inf. Sci. 2019, 46, 228–242. [Google Scholar] [CrossRef]
  79. Malik, M.M.; Lamba, H.; Nakos, C.; Pfeffer, J. Population Bias in Geotagged Tweets. People 2015, 1, 3–759. [Google Scholar]
  80. Hecht, B.J.; Stephens, M. A Tale of Cities: Urban Biases in Volunteered Geographic Information. ICWSM 2014, 14, 197–205. [Google Scholar]
  81. Zhao, Z.; Shaw, S.-L.; Xu, Y.; Lu, F.; Chen, J.; Yin, L. Understanding the Bias of Call Detail Records in Human Mobility Research. Int. J. Geogr. Inf. Sci. 2016, 30, 1738–1762. [Google Scholar] [CrossRef]
  82. Wesolowski, A.; Eagle, N.; Noor, A.M.; Snow, R.W.; Buckee, C.O. The Impact of Biases in Mobile Phone Ownership on Estimates of Human Mobility. J. R. Soc. Interface 2013, 10, 20120986. [Google Scholar] [CrossRef]
  83. Hooper, M.W.; Nápoles, A.M.; Pérez-Stable, E.J. COVID-19 and Racial/Ethnic Disparities. JAMA 2020, 323, 2466–2467. [Google Scholar] [CrossRef] [PubMed]
Figure 1. Human mobility changing patterns at parcel-level in week 1–week 9.
Ijgi 10 00344 g001
Figure 2. Human mobility changing patterns at parcel-level in weeks 10–15.
Ijgi 10 00344 g002
Figure 3. Mobility changing patterns for six land use types based on Twitter data.
Ijgi 10 00344 g003aIjgi 10 00344 g003b
Figure 4. Twitter- and Google-based human mobility changing patterns in Bronx County.
Ijgi 10 00344 g004
Figure 5. Twitter- and Google-based human mobility changing patterns in Kings County.
Ijgi 10 00344 g005
Figure 6. Twitter- and Google-based human mobility changing patterns in New York County.
Ijgi 10 00344 g006aIjgi 10 00344 g006b
Figure 7. Twitter- and Google-based human mobility changing patterns in Queens County.
Ijgi 10 00344 g007
Publisher’s Note: MDPI stays neutral with regard to jurisdictional claims in published maps and institutional affiliations.

