
Public Bike Trip Purpose Inference Using Point-of-Interest Data


1
Department of Civil and Environmental Engineering, Seoul National University, Seoul 08826, Korea
2
Social Eco Tech Institute, Konkuk University, Seoul 05029, Korea
*
Author to whom correspondence should be addressed.
ISPRS Int. J. Geo-Inf. 2021, 10(5), 352; https://0-doi-org.brum.beds.ac.uk/10.3390/ijgi10050352
Submission received: 5 March 2021
/
Revised: 26 April 2021
/
Accepted: 16 May 2021
/
Published: 20 May 2021
(This article belongs to the Special Issue Geodata Science and Spatial Analysis in Urban Studies)
Abstract
:Public bike-sharing is eco-friendly, connects excellently with other transportation modes, and provides a means of mobility that is highly suitable in the current era of climate change. This study proposes a methodology for inferring the bike trip purpose based on bike-share and point-of-interest (POI) data. Because the purpose of a trip involves decision-making, its inference necessitates an understanding of the spatiotemporal complexity of human activities. Thus, the spatiotemporal features affecting bike trips were selected from the bike-share data, and the land uses at the origin and destination of the trips were extracted from the POI data. During POI type embedding, the data were augmented considering the geographical distance between the POIs and the number of bike rentals at each bike station. We further developed a ground truth data construction method that uses temporal mobile and POI data. The inference model was built using machine learning and applied to experiments involving bike stations in Seocho-gu, Seoul, Korea. The experimental results revealed that optimal performance was achieved with the use of decision tree algorithms, as demonstrated by a 78.95% overall accuracy and 66.43% F1-score. The proposed method contributes to a better understanding of the causes of movement within cities.
1. Introduction
Although the sharing economy is accelerating worldwide, there is a limit to the expansion of vehicle sharing owing to transportation and environmental issues in crowded cities. Accordingly, bike-sharing, which reduces vehicle emissions and improves urban mobility, is an attractive alternative [1]. Currently, more than 2000 cities operate bike-sharing systems, which provide users with a flexible tool for making short-distance trips and interchanging between different modes of transport [2]. Bike-sharing is a significant transportation mode because it is often located at the start and end stages of trip chains [3,4,5]. Free-floating car-sharing, which has experienced remarkable growth in European and American urban markets, is a system that allows users to freely rent shared vehicles through smartphones at participating public parking lots [6,7]. In this context, bike-sharing enables users to connect between their departure points and the beginning parking lots and between the end parking lots and their destinations. This expands the service of vehicle sharing, with an increase in bike-sharing leading to an increase in the use of shared vehicles, as well as other public transportation modes. The scenario offers an effective countermeasure against urban traffic congestion. Non-motorized trips (walking and cycling) account for the finer-scale “capillary” flow in cities, revealing the full nature of urban transportation flows [3,8]. Many studies have analyzed bike-share movement patterns to better understand the urban dynamics [1,3,9], while others have focused on examining the variability of land use [10,11]. Zhao et al. [10] used bike-share data as the main basis for identifying land use characteristics.
The present study focused on the “why” of traffic, rather than simply analyzing bike-share movement patterns, which is more relevant to the “where” of traffic. The latter only addresses urban mobility, whereas the former enables inferences on the purposes of the trips and determination of the causes of urban movement [12]. Nevertheless, the reason for a phenomenon and its result is more meaningful to decision-making, rather than a mere observation of the phenomenon. For example, rather than simply observing many cars in a specific area after 6 p.m. (movement pattern analysis), it is more significant to understand the cause of the observation, namely, the rush-hour movement of people from their work to dwelling places (trip purpose inference). This enables drivers to make the decision to avoid roads leading to residential areas at that time.
Traffic purpose inference is essential for understanding traffic behavior for traffic planning, investment decision-making, and estimating traffic demand [13]. However, among studies related to traffic characteristics, trip purpose prediction has received considerably less attention [14,15,16]. Traffic history data are required for trip purpose prediction; however, there are only a few accurate data containing information on human decision-making. Thus, traditional trip purpose inference analyses rely on direct user surveys [1]. User-direct surveys for traffic purposes contain accurate ground truth data and are, therefore, suitable datasets for applying inference algorithms. However, there are limited targets and cost-related limitations.
Nguyen et al. [17] reviewed 25 studies in terms of trip purpose imputation, and classified them into two broad fields, namely, transportation science (TS) and human geography (HG). They indicated that researchers will always find themselves in these two situations in the real world. In other words, researchers would analyze a post-collected dataset or design a survey to create an enhanced inference model. Therefore, it is emphasized that accurate targeting of research domains is crucial. TS-related studies focus on the methods of deriving objects from GPS data, whereas HG-related studies focus on semantic enrichment for GPS trajectories. The latter case focuses on obtaining general knowledge on the mobility and whereabouts of activities, rather than accurate methodologies [17].
For GPS information collected via onboard devices that do not contain ground truth data, various studies have utilized a fusion of survey data (such as household travel survey data), point-of-interest (POI) data, and social media data for trip purpose inference [13,14,18]. However, these make for only a small percentage of related works, and research on the prediction of the purpose of bike-related travel remains insufficient [2]. Bao et al. [1] and Xing et al. [2] inferred bike trip purpose using POI data, considering that trip purpose is correlated with land use at the destination [18,19,20]. However, these studies did not consider the effect of mixed land use in urban areas. Bao et al. [1] classified the trip purposes by clustering based on only a simple frequency count of the POI type near the bike stations. Xing et al. [2] augmented the context of the origin and destination of bike use through POI data but did not consider the specific trip purpose for an integrated location such as a shopping mall. However, the increasing occurrence of mixed land use in urban areas and integrated POIs such as buildings needs to be considered [21,22].
Therefore, the present study aims to solve the problem of mixed land use in the context of origin–destination, which is key to trip purpose inference, using POI embedding technology. POI is a useful tool for defining the meaning of a place. However, owing to the hierarchy of POI types, many factors are overlooked, resulting in information loss [23]. For example, apartments and parks are perceived as completely unrelated POIs because of their different categories, but residential areas and urban parks are generally located very close to each other. Recently, research has been conducted on the meaning of a POI considering its spatial correlations [23,24,25]. This may involve the application of word-embedding technology to the natural language processing domain [26], as has been used to classify urban functional areas [25,27]. As urban functional areas are strongly correlated with the internal socioeconomic activities in spaces, they are not easy to identify from pure remote-sensing images [21]. Therefore, POI data are used as a complementary measure, but the limitation of the hierarchy of POI types requires the use of embedding technology to define the POI type. Consequently, in the present study, POI types customized for bike trips were used, with POI type embedding conducted based on the bike trip purpose. This provides a solution to the urban mixed land use problem.
This work differs from the TS-related existing trip purpose inference studies focusing on the accuracy of the methodology. It is different in that it focuses on obtaining general knowledge on bike mobility and the whereabouts of activities by applying meaning-enhancing processes reflecting the real world. To evaluate the proposed method, we also create ground truth data using mobile data and POI data. The contributions of this work to the field and the society are as follows. First, this work proposes a methodology to apply POI embedding techniques to bike trip purpose inference. POI embedding technology is an application of technology in the field of natural language processing (NLP); in the field of spatial analysis, it has only been used for urban functional area classification [25,27] and POI recommendation [26]. To the best of our knowledge, this study is the first to adopt POI embedding techniques for trip purpose inference. Second, personal mobility, as well as existing transportation modes such as buses and taxis, has recently been rapidly increasing worldwide. Given this scenario, the proposed methodology can be customized according to the corresponding mode when inferring the trip purpose for personal mobility. Third, the travel data of personal mobility, including those of shared bicycles, allow us to know the fine flow of personal movement in cities that cannot be observed from the movement patterns of buses or subways. Thus, applying the proposed inference methodology to real-world data for analyzing the trip purpose would lead to a better understanding of the causes of personal movement within cities.
The remainder of this paper is organized as follows. Section 2 reviews previous studies related to trip purpose inference and POI embedding. Section 3 presents the proposed methodology for inferring the bike trip purpose. In Section 4, we describe a bike trip purpose inference experiment conducted using 87 bike stations in Seocho-gu, Seoul. Finally, Section 5 presents the conclusions and limitations of the study and future research directions.
2. Related Works
2.1. Studies on Trip Purpose Inference
Among traffic-related studies, trip purpose has received relatively less attention [14,15,16]. This is because of the spatial-temporal complexity of human activities required for predicting trip purpose [13,28]. Studies on the inference of trip purpose can be classified according to the main modes of travel. The most studied aspect focuses on the trips of human beings without specifying the transportation mode. In this case, the trip purpose is mostly predicted based on surveys, with the development of related technologies enabling extensive research, including the addition of GPS data that provide the travel routes [15,29]. In addition, the analysis of complex space and time data has become more sophisticated through the fusion of heterogeneous data such as social media data (e.g., tweets) and POI data (e.g., Google API) [14,29,30]. However, predicting the trip purpose only through direct traveler surveys has severely limited the existing research.
Studies have also been conducted on trip purpose inference with respect to the transportation mode. The most studied aspect in this case is the public transportation mode, such as subways, with diversification achieved with the development of smart cards. However, only a few of these studies focused on predicting the trip purpose because a smart card does not include “travel purpose,” which requires decision-making by the traveler. Alsger et al. [18] addressed this issue by inferring the trip purpose through the collection of household travel survey (HTS) data. Rule-based modeling was applied to the HTS data, which were obtained through traveler surveys, and the trip purpose was inferred based on the spatial, temporal, and frequency attributes.
In bike-related studies, the analysis of the traditional sharing patterns or travel purposes is often based on traveler satisfaction surveys [13,14,29,31,32,33]. More recently, the increasing abundance of bike-share data has been used to infer the trip purpose. In particular, trip purpose is highly related to land use at the destination. Thus, with the increasing sophistication of POI data, many researchers have attempted to carry out a spatiotemporal analysis of the fusion of bike-share data and POI data. Bao et al. [1] analyzed bike-share travel patterns and trip purpose using Citi Bike data in New York, USA. Through k-means clustering, they classified the bike stations based on the surrounding POI data and developed a bike travel pattern model using the latent Dirichlet allocation (LDA) method. However, the study had some limitations, such as the clustering of the bike trip purposes using only the simple frequencies of the POI types around the destination. Xing et al. [2] used Mobike data and dockless bike-share data for Shanghai, China, and similar to Bao et al. [1], they combined bike-share data and POI data to analyze the user travel patterns and purposes. In particular, they enriched the trip origin and destination contexts by extracting information on the configurations of nearby POIs. This is different from the approach of Bao et al. [1], who considered only the frequencies of the POI types. However, only the POI type and bike point were used to construct the context, and data that changed over time were excluded. Additionally, the method is limited by its inability to consider integrated POI such as shopping malls.
Chen et al. [34] predicted the trip purpose for taxi users. The study was significant because a large amount of trip character data was integrated into one vector value, and embedding was used to infer the trip purpose. The utilized taxi trajectory data and POI data were generated in New York City, USA. To elaborate on the contexts of the taxi origin and destination, popularity, uniqueness, and distance to the POI were considered through time information and Foursquare check-in data. Three contexts (time, origin, and destination) of the taxi trip were constructed and deep-embedded through an autoencoder. Finally, the taxi trip purpose was extracted by clustering the embedded values.
The foregoing review reveals that traditional studies related to trip purpose inference have mainly employed GPS-based surveys of human trips. However, some recent trip purpose inference works have utilized big data acquired by smart cards or public bike-share services. Nevertheless, it remains difficult to measure the inference model accuracy if the dataset is not based on a traveler survey. Most of these previous studies attempted to infer the trip purpose from trip history data and POI data, but it was not easy to generate ground truth data. Therefore, when big data are used, they are combined with survey data, or the results obtained by the inference models are clustered and labeled for appropriate traffic purposes.
Table 1 compares different studies related to trip purpose inference conducted over the last three years, from which the recent trends can be observed. Unlike the existing studies, this study proposes a methodology to infer bike trip purposes, with the aim of acquiring general knowledge on bicycle mobility and activity sites. Further, this study evaluates the proposed method by generating ground truth data using mobile data and POI data.
2.2. Studies Related to POI Embedding
With the development of technologies such as Word2vec for vectorizing information that is difficult to quantify in natural languages, studies are being actively conducted to quantify information in various fields [26,35,36,37]. Yan et al. [24] developed the Place2vec model, which is used for POI type embedding and takes into account the geographical distance and popularity of the POI, for quantifying POI information distributed over a geospatial space. Place2vec differs from previous methods, which do not consider internal spatial correlations and only use the POI frequency to determine the functional type of the region of interest [25].
Yao et al. [27] and Zhai et al. [25] proceeded further in measuring the similarity and relevance of place types. These studies attempted to extract land use from the results of POI embedding. Zhai et al. [25] simplified the results obtained by Yan et al. [24] and used them for data augmentation based on only the distance between POIs. The functional type of the urban area was extracted from the embedding results. In addition, for the accurate identification of the extraction results, the annotation of each region was supported by mobile phone data and truck origin–destination (OD) data.
Liu et al. [38] and Liu et al. [23] subdivided POI types to avoid loss of information due to hierarchy. For example, Liu et al. [23] specified 488 POI types and observed a correlation between pharmacies, convenience stores, and barbershops. These POI types are usually located close to each other, but the hierarchy of these POI types may obscure their correlation. In addition to subdividing the POI type, different correlations may also be paired when making tuples. For example, Jin et al. [39] embedded the store types instead of POI types and augmented the data by constructing pairs of the type of store and items sold by the store.
Table 2 compares different studies on POI embedding. In most studies, the type of POI was defined through data augmentation based on the distance of the POI in the geospatial space. The k-nearest or a buffer was used to generate tuples between the POIs, and Word2vec skip-gram was mainly used for embedding. The present study followed the flow of these previous studies with respect to tuple composition and the use of Word2vec, but a novel POI embedding method was used to extract the land use specific to a bike trip. The POI types were classified according to the bike trip purpose with reference to related studies. In particular, the POI types related to bike leisure were separately classified to avoid information loss due to the hierarchy of POI types. We believe this methodology is beneficial because POI embedding can be customized to suit the mode of transportation when inferring personal mobility trip purposes in the future.
3. Methods
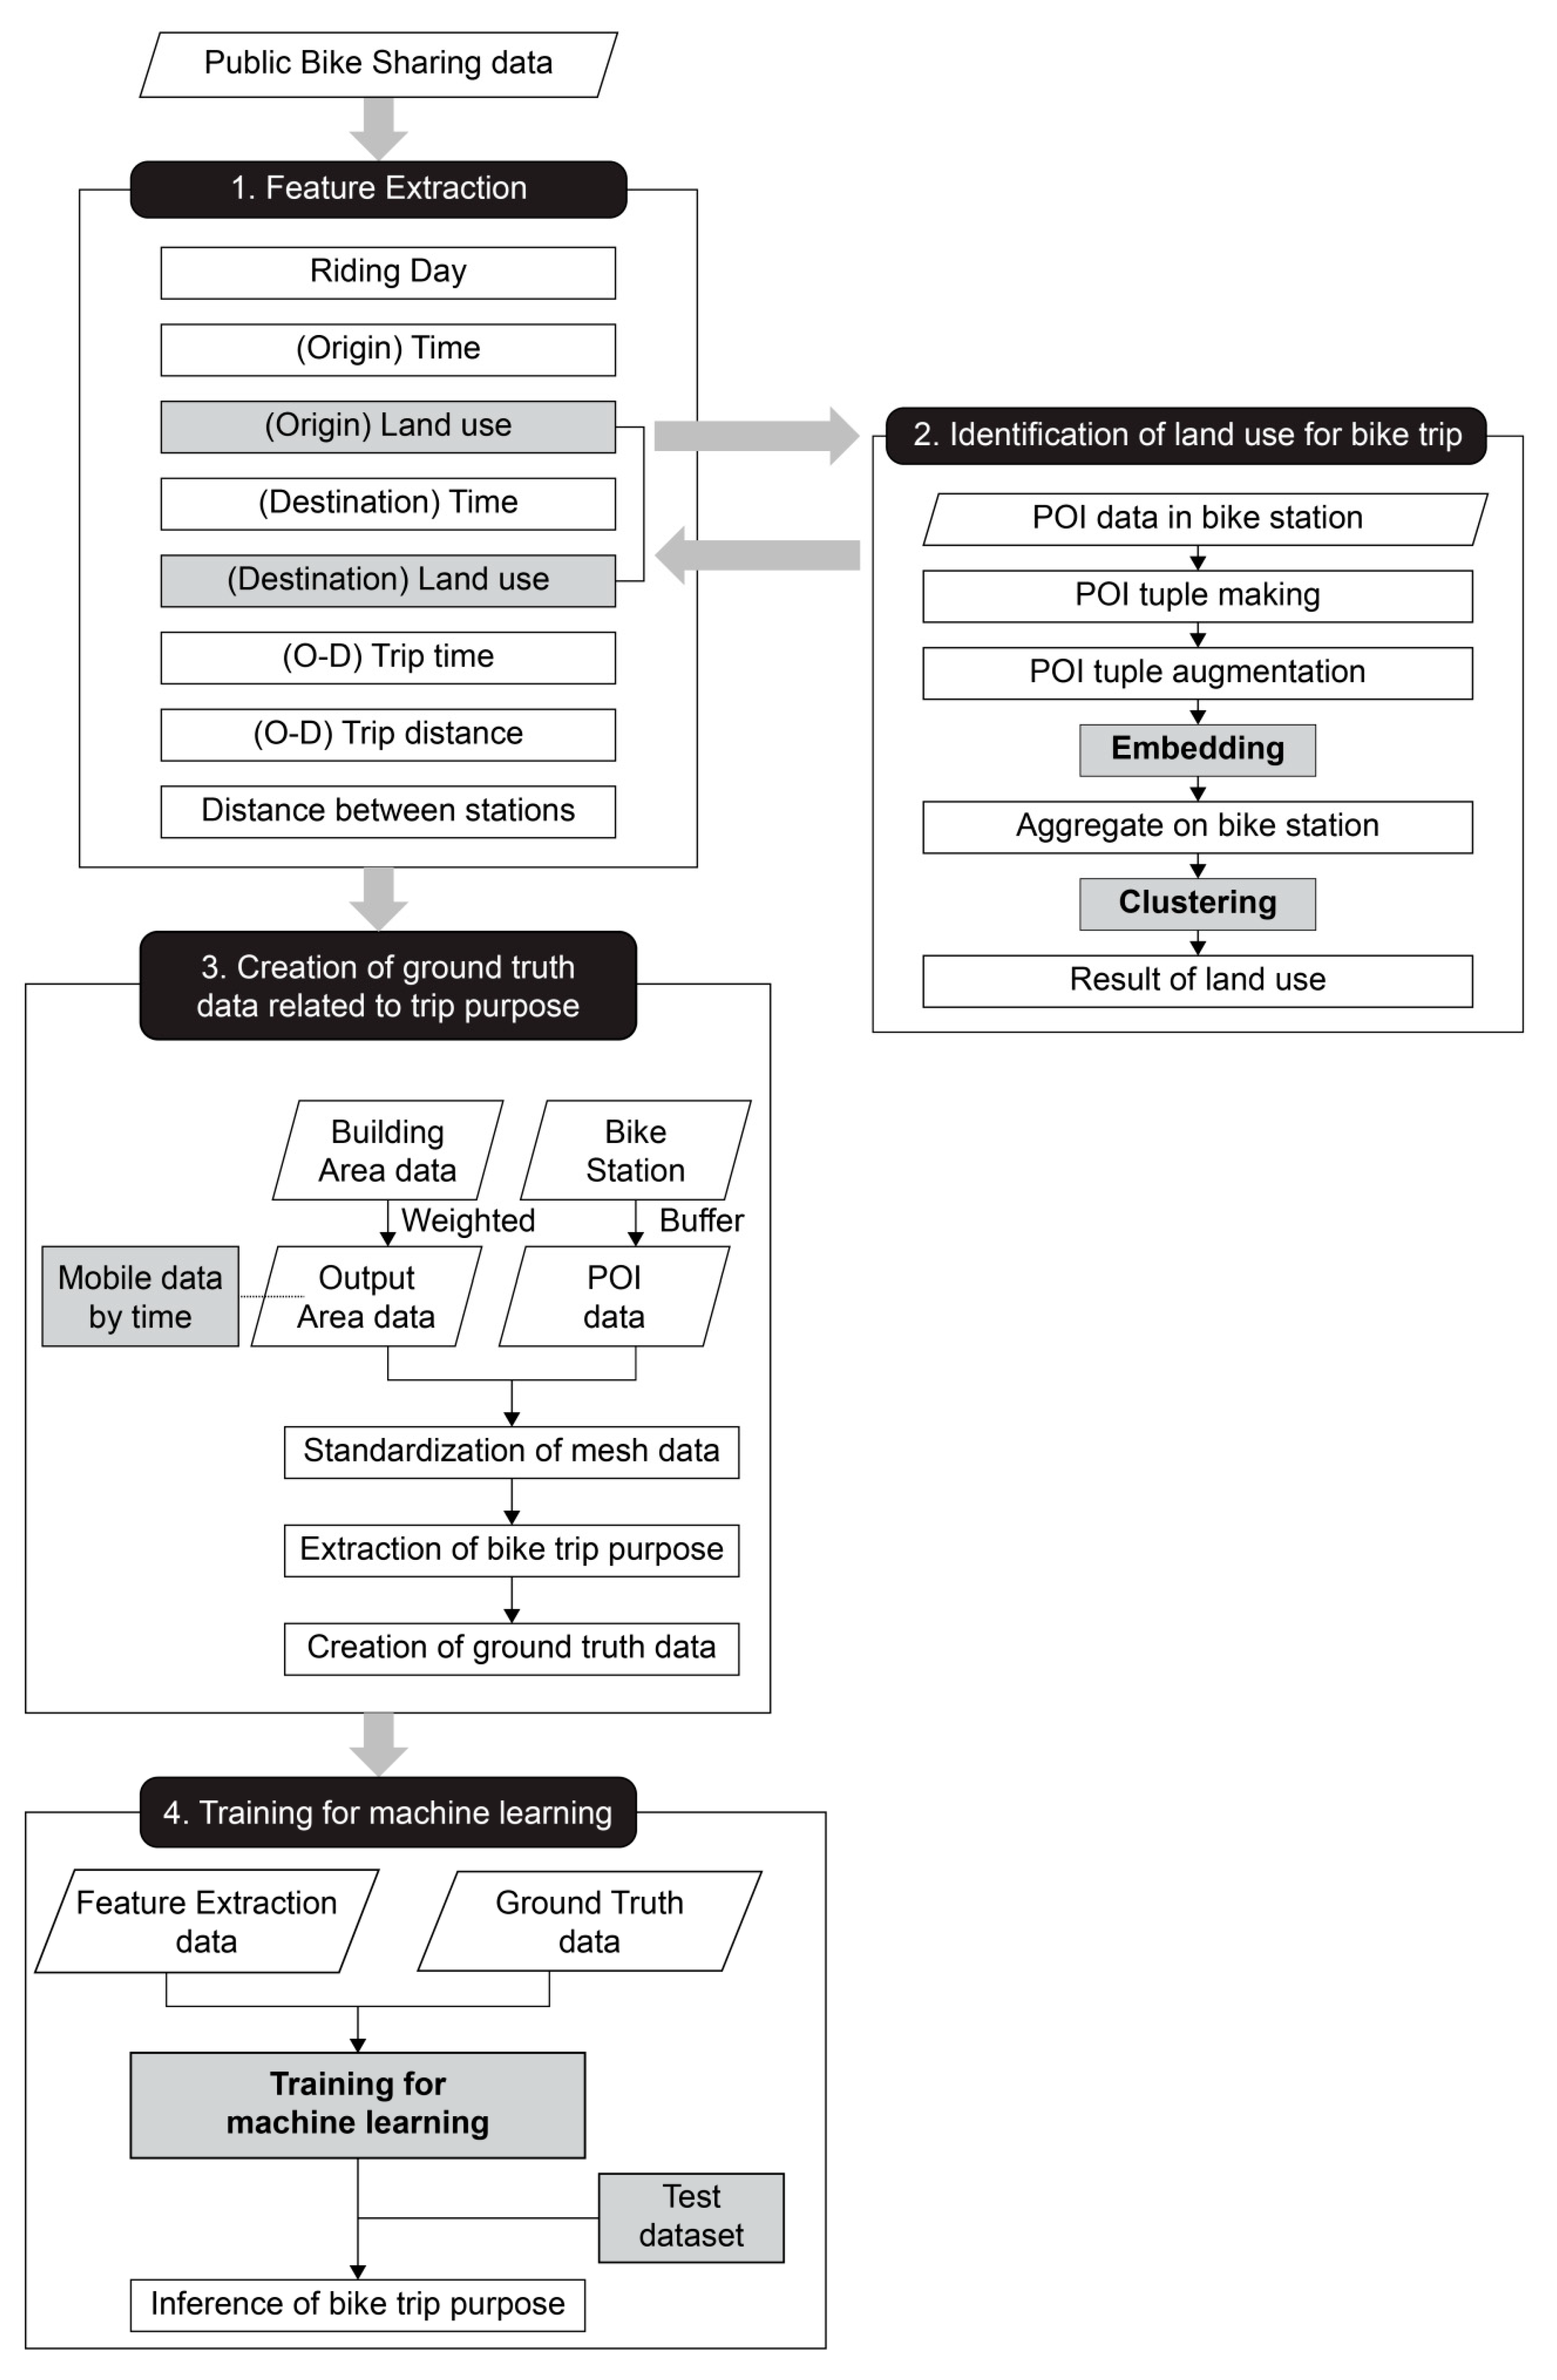
We developed a method for inferring the purpose of public bike trips based on bike-share data and POI data. The method involves extracting the features that affect the trip purpose from the data and using them for machine learning to infer the final trip purpose. When selecting the utilized features, the land use information at the bike trip starting and end points were determined by embedding and clustering the POI data for the area around the bike station. In addition, to establish the ground truth data for determining the trip purpose, we standardized the mobility data for each time period in a mesh form and extracted it together with the POI data. The overall method is illustrated in Figure 1.
3.1. Feature Extraction for Inference of Trip Purpose
Unlike travel demand forecasting, which is influenced by various factors such as weather and the floating population, the trip purpose can be broadly divided into time and space information. The time of a bike ride and the land uses at the departure point and the destination significantly reflect the trip purpose. Chen et al. [34] created three contexts for time, origin, and destination and used embedding to infer the purpose of a taxi trip. Alsger et al. [18] inferred trip purpose with the aid of a smart card, using the destination land use, start time, and activity duration as the important attributes.
In the present study, the features that influence public bike trip purposes are the riding day, departure time, departure point land use, arrival time, destination land use, trip time, trip distance, and distance between bike stations. The riding day was considered to be the rental date given the improbability of the use of a rented public bike for more than 24 h. The riding day was denoted by 1 for a workday and 0 for a non-workday. The departure and arrival times ranged between 0 and 23, with only time zone information used and minute and second details ignored. To consider the time and spatial factors of the entire trip, the trip time and trip distance were separately inputted. The distance between the departure and arrival stations was considered an important feature owing to the characteristics of bikes used for leisure purposes such as park riding. For example, in the case of a leisure trip, even if the total trip time or distance was long, the departure and destination stations may be the same.
When the above-mentioned features are constructed using bike-share data, POI data for the areas around the stations should be used for land use extraction at the departure point and destination. Considering the distance between public bike stations and the population density of Seoul City, the search radius for each station was set to 250 m, as in previous studies [1,40]. For accurate inference, the POIs were classified into customized types by categorizing based on the purposes of the bike trips. The classification of the purpose of the trips used in previous studies is presented in Table 3.
In this study, eight bike trip purpose categories were considered, namely, home, work, education, transit, dining, shopping and service, leisure, and bike leisure. The classification was performed by referring to Bao et al. [1], who used bikes as the main object, with “work” added. In addition, POIs in parks and amusement parks specific to bike traffic were identified as “bike leisure.” Further, POIs related to “bike leisure” within the search radius were compared with everything within 1000 m of the bike station instead of the standard 250 m. The identification of the land use using POI data for areas around the bike stations is discussed in the next subsection.
3.2. Identification of Land Use in Bike Trips
3.2.1. POI Type Embedding Related to Bike Trip Purpose
Studies on the embedding of POI types have been conducted in various fields over the last three years, beginning with the work of Yan et al. [23,24,25,38]. In the present study, we developed a POI embedding method specifically for bike trips. The POI type was classified by considering the purpose of the bike trip, while the geographical distance between the POIs and the number of bike rentals per station were used to augment the POI tuples for embedding.
The embedding of the POI type to infer the bike trip purpose was essentially word embedding, which is used to give meaning to a word by considering the location of the central word and the context words. This method applies the concept of word embedding to a POI or place. Figure 2 compares the window size-based Word2vec and the concept of POI type embedding. Because word embedding (skip-gram) is based on window size, if the window size is 1, as shown in Figure 2, training is performed by selecting “quick” and “for” as the context words of the center word “brown.” This method is used to predict context words based on a center word. Conversely, POI type embedding utilizes the location of the POI. If the POI is located within 100 m of the central POI, “apartment,” it is recognized as the context POI (e.g., supermarket, pharmacy, or park), and a tuple is produced.
We developed a POI type embedding method specifically for bike trips based on Yan et al. [24]. A skip-gram model for predicting context words from the center word obtained by Word2vec models was utilized, and the difference between the trained probability and the actual probability was measured by cross-entropy. The model is expressed as follows.
where is the learned probability distribution, y is the actual probability distribution, c is the type index, and is the probability of occurrence of m POIs (), given by Equation (2).
where is the center POI. When the naïve Bayes assumption is applied in calculating the probability, is always 1.
Finally, by converting the score into probability using the softmax function, the POI type can be expressed as a vector. The objective function is given by,
where denotes the context place-type vectors, denotes the center-place-type vectors, and is the cardinality of the POI type.
To give the correct meaning to a POI type located in a geospatial space, Yan et al. [24] proposed augmentation of the number of appearances of the training tuple () by a factor β. They presented three concepts: (1) naïve spatial context, (2) simple augmented spatial context incorporating the idea of the popularity and distance to a place, and (3) spatial context augmented by information-theoretic, distance lagged (ITDL).
The simple augmented spatial context methodology was modified to suit the research purpose. It was specifically used to augment the popularity of the individual POIs by Yelp data check-in. This was because the number of check-ins represents the relative popularity or dominance of the POI. Thus, factor β can be defined as in Equation (4) below, where is the total number of check-ins to POI . In this study, instead of the Yelp check-in data used by Yan et al. [24], we augmented POI tuples by allocating the number of rentals at each bike station among the POIs within the set radius of the station according to their respective distances. For example, if there were 100 bike check-in data at station A, they would be evenly distributed among all nearby POIs; however, their quotas would be proportional to their respective distances from the station.
This was followed by augmentation based on the distance of the POIs. The basic principle of POI type embedding was applied, i.e., the shorter the distance, the deeper the relationship between the POIs. The distance-related factor β is defined as follows.
where |L| is the total number of POIs, is the distance between POI and POI , and α is the inverse distance factor, which was set to 1 in this study. We applied the distance augmenting factor used by Yan et al. [24]. Factor β, which comprehensively represents the popularity of a POI based on the concept of distance, was defined as follows.
Based on the method suggested by Yan et al. [24], the proposed POI type embedding method for bike trip purpose inference is as follows. First, a tuple is formed for POIs located within a radius of 250 m of the bike station (1000 m in the case of the POIs related to bike leisure). The created tuple is augmented using an augmenting factor β that considers the popularity and distance between the POIs. Figure 3 shows the configuration of all the tuples around the bike stations and their augmentation. As indicated in the table on the right of Figure 3, if k is 3 during the configuration of the k-nearest function, the tuples would be formed by grouping the set of three POIs closest to each POI, and all POIs in the bike station would be included. In this case, because the distance between tuples is shorter and there is an increase in the number of rentals, the augmentation can be performed using factor β, as suggested by Yan et al. [24]. The numbers in parentheses below the POIs in Figure 3 are the values obtained by distributing the total number of bike rentals (assumed to be 1000 times here) among the POIs proportional to their respective distances from the station. This indicates that the POIs closer to the bike stations are more popular. In addition, because the number of rentals varies between bike stations (for example, the number of bicycle rentals at stop A may be 1000, whereas that at stop B may be 50), this method can be applied differently among the stations. The tuples created in this way were trained using TensorFlow, with the number of embedding dimensions set to 70 and applied as in previous studies.
3.2.2. Extracting the Land Use at Each Station
The method for extracting the land use at each bike station based on the value obtained by embedding the POI type is based on the methods presented by Zhai et al. [25] and Yao et al. [27]. First, the POI type embedding values of each station are combined into one using Equation (7), where is the vector value of the kth POI type at the bike station, and N is the total number of POIs at all the bike stations.
Based on the extracted values, the clustering is performed for the bike stations, with the k-means algorithm used to extract the land use at the stations. The embedding values of the individual bike stations consisting of high-dimensional vectors are grouped for similar land use types by the clustering analysis. The k value, which is the number of clusters in the k-means algorithm, must be determined in advance as an elbow or silhouette value. The process is expressed by Equation (8). In this study, because the final output is not an accurate land use value, the land use value was not specified using additional indicators as in previous studies. Instead, the clustering results were applied as variables of the land use features at the origin and destination to infer the bike trip purpose.
3.3. Creation of Ground Truth Data Related to Trip Purpose
3.3.1. Standardization of Mesh Data
Because the ground truth data for the trip purpose reflect the decision-making of the travelers, they are not easy to obtain. In some previous studies, the data were collected by a traveler survey [13,14,29]. Nevertheless, with the advent of various types of traffic-related data based on GPS, big data that do not reflect ground truth data have emerged. Nguyen et al. [17] classified studies that infer trip purpose using these types of data, such as HG-related studies. In HG-related traffic-purpose inference studies, ground truth data are optional because common sense or travel patterns from previous surveys are sufficient for validation [17]. Furthermore, rather than focusing on precision at individual levels, they aim to semantically enrich the trajectory and discover general patterns of activity. Because annotation activities with approximations are allowed, most HG-related studies infer trip purpose results with unsupervised learning, such as clustering results without accurate ground truth data [1,2,34].
However, this study proposes a technique to generate ground truth data to evaluate the accuracy of our methodology in a realistic manner—this technique involves quantifying the bike trip purpose at a common-sense-level when a bicycle user gets off at a specific time and place. It is meaningful because HG-related research aims to obtain general knowledge on mobility and the whereabouts of activities. South Korea has a 95% smartphone ownership rate [41]; thus, we utilize mobile aggregated data from the perspective of service population or living population, which differs from the resident population. Thus, ground truth data of trip purpose for anonymous bike-sharing is created based on the assumption that most people would have made specific choices when they were at a particular place and time. Therefore, it reflects the real world, though not the complete ground truth data.
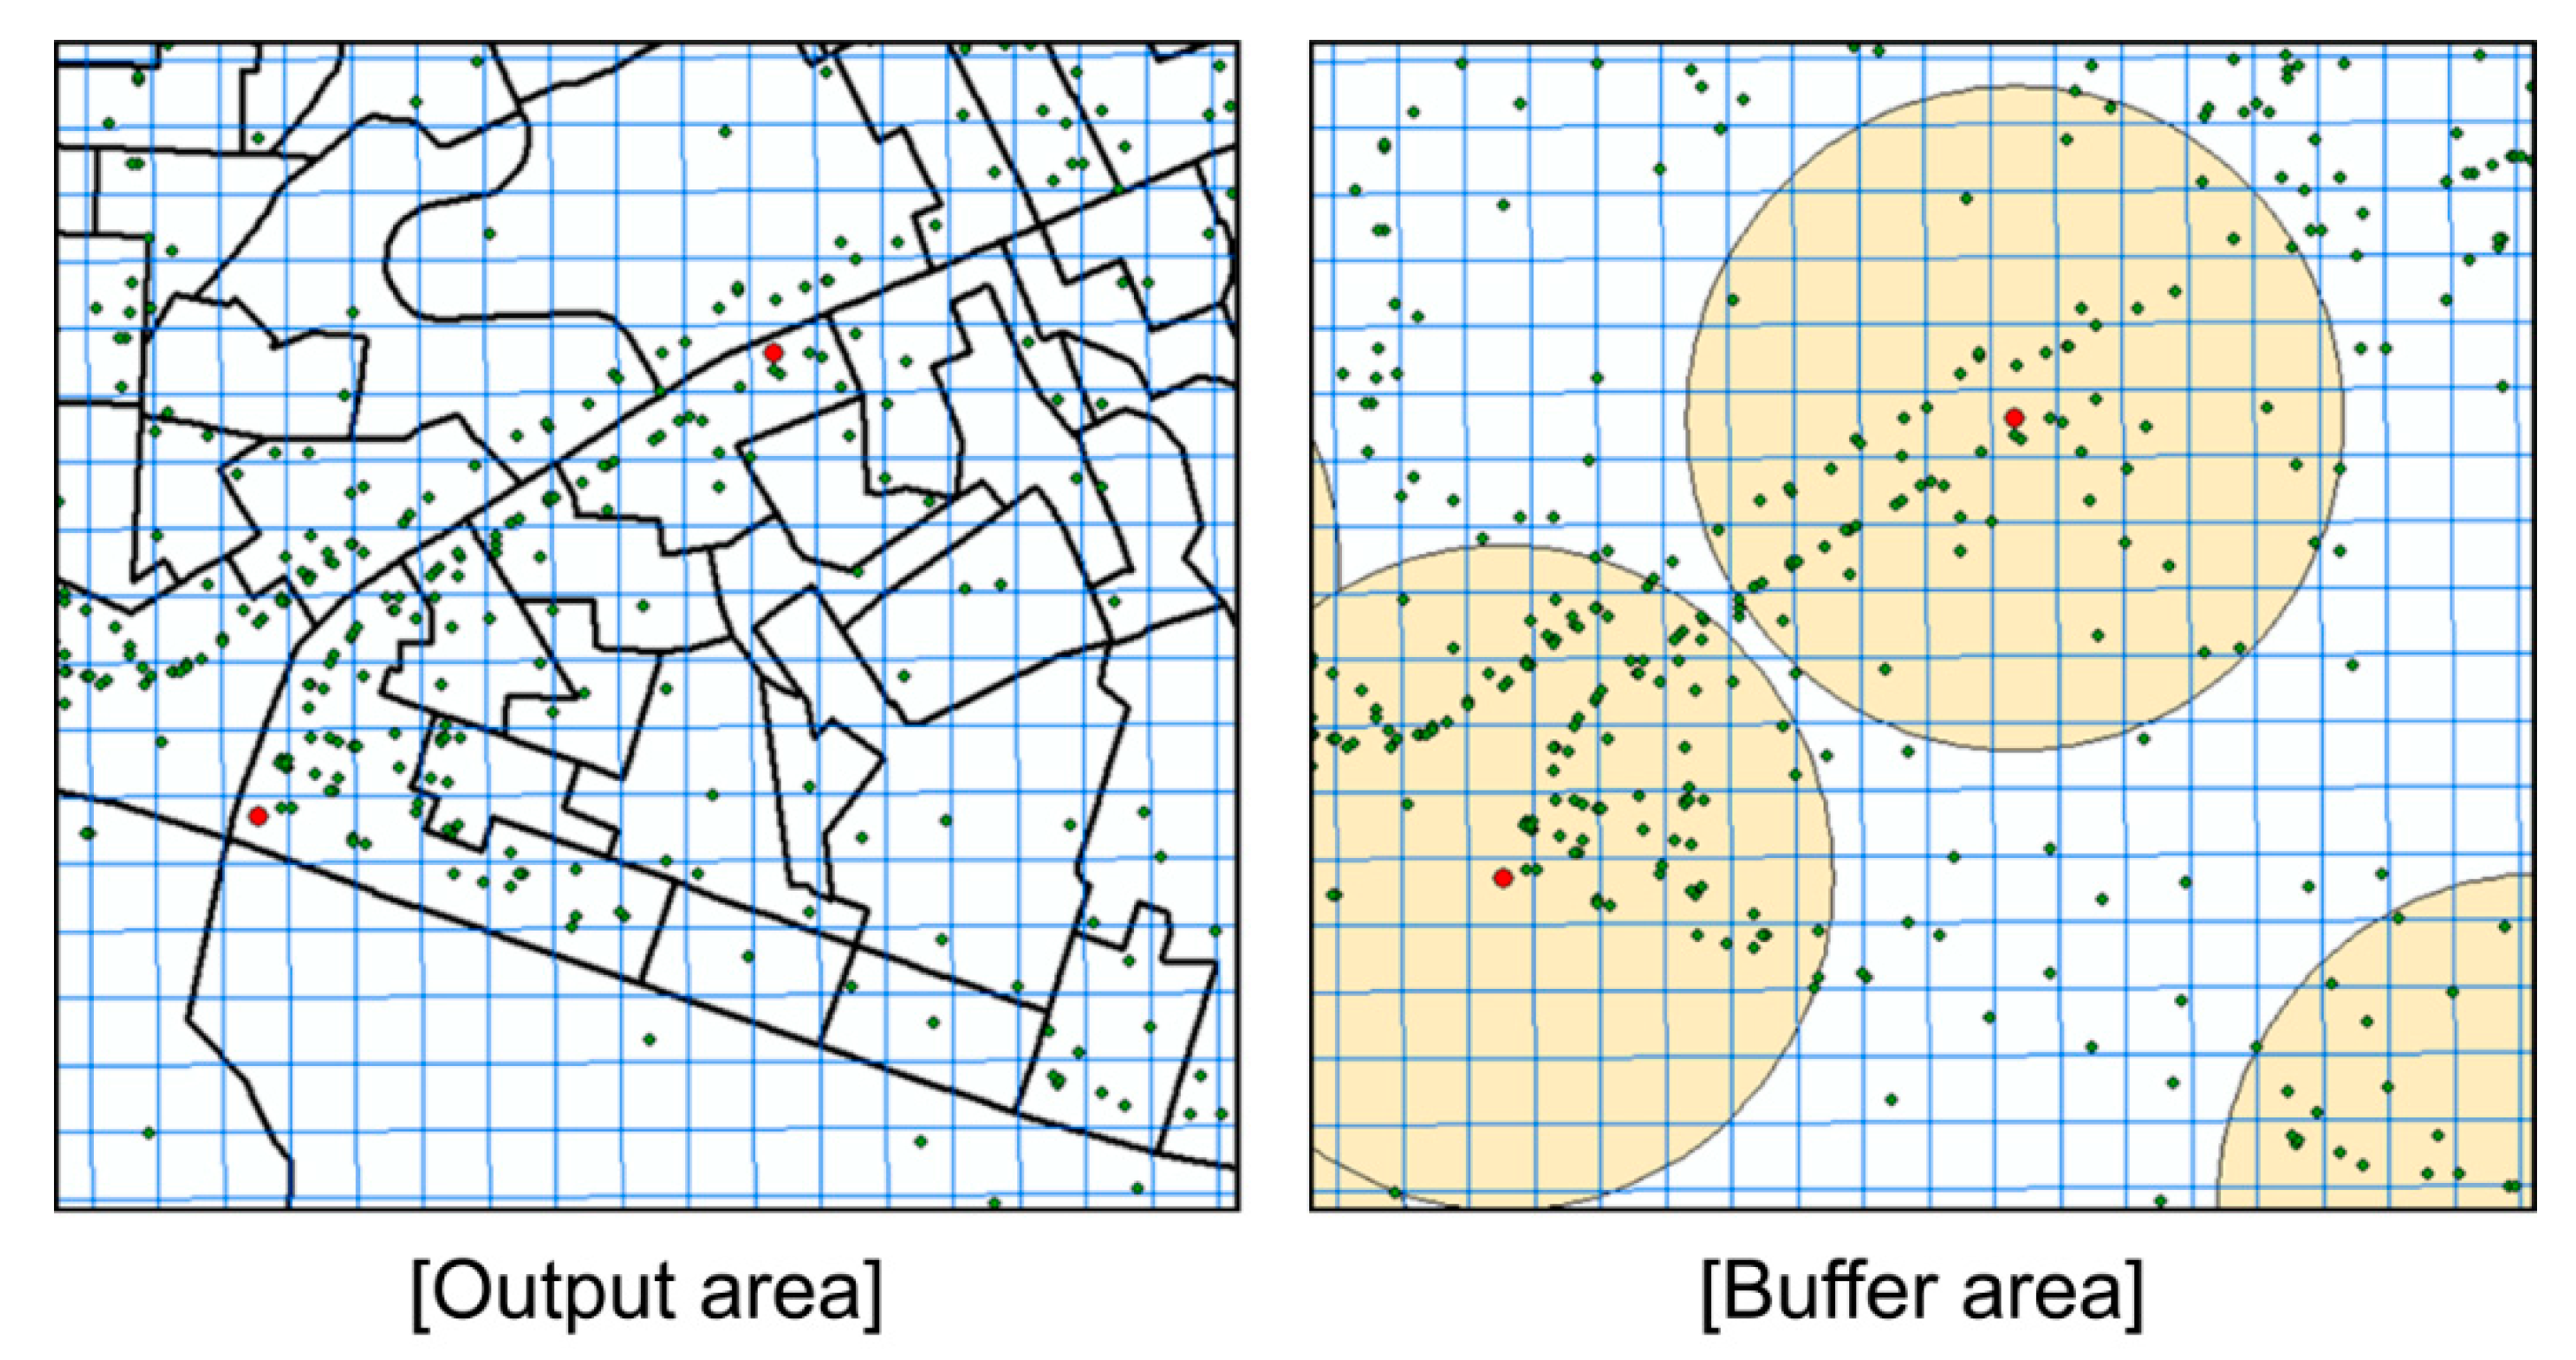
From this perspective, this study utilizes mobile data and POI data to generate ground truth data for bike trip purposes. This required standardization of the available spatial information. The utilized real-time mobile data consisted of the population data provided by Seoul City. The unit of the spatial information was the output area, which is the minimum statistical counting area built to consider the population size (optimum of 500 people), socioeconomic homogeneity (housing type, land price), and land shape based on a basic statistical zone [42]. Accordingly, the National Statistical Office in Korea aggregates and serves census data in small area units (output area) that are smaller than the administrative units. As shown in Figure 4, the standardized unit was unified as mesh data (50 × 50 m) to match the spatial unit of the mobile data that can be used to determine the floating population with respect to time. The data were applied in a buffer zone that included POIs within 250 m of each bike station.
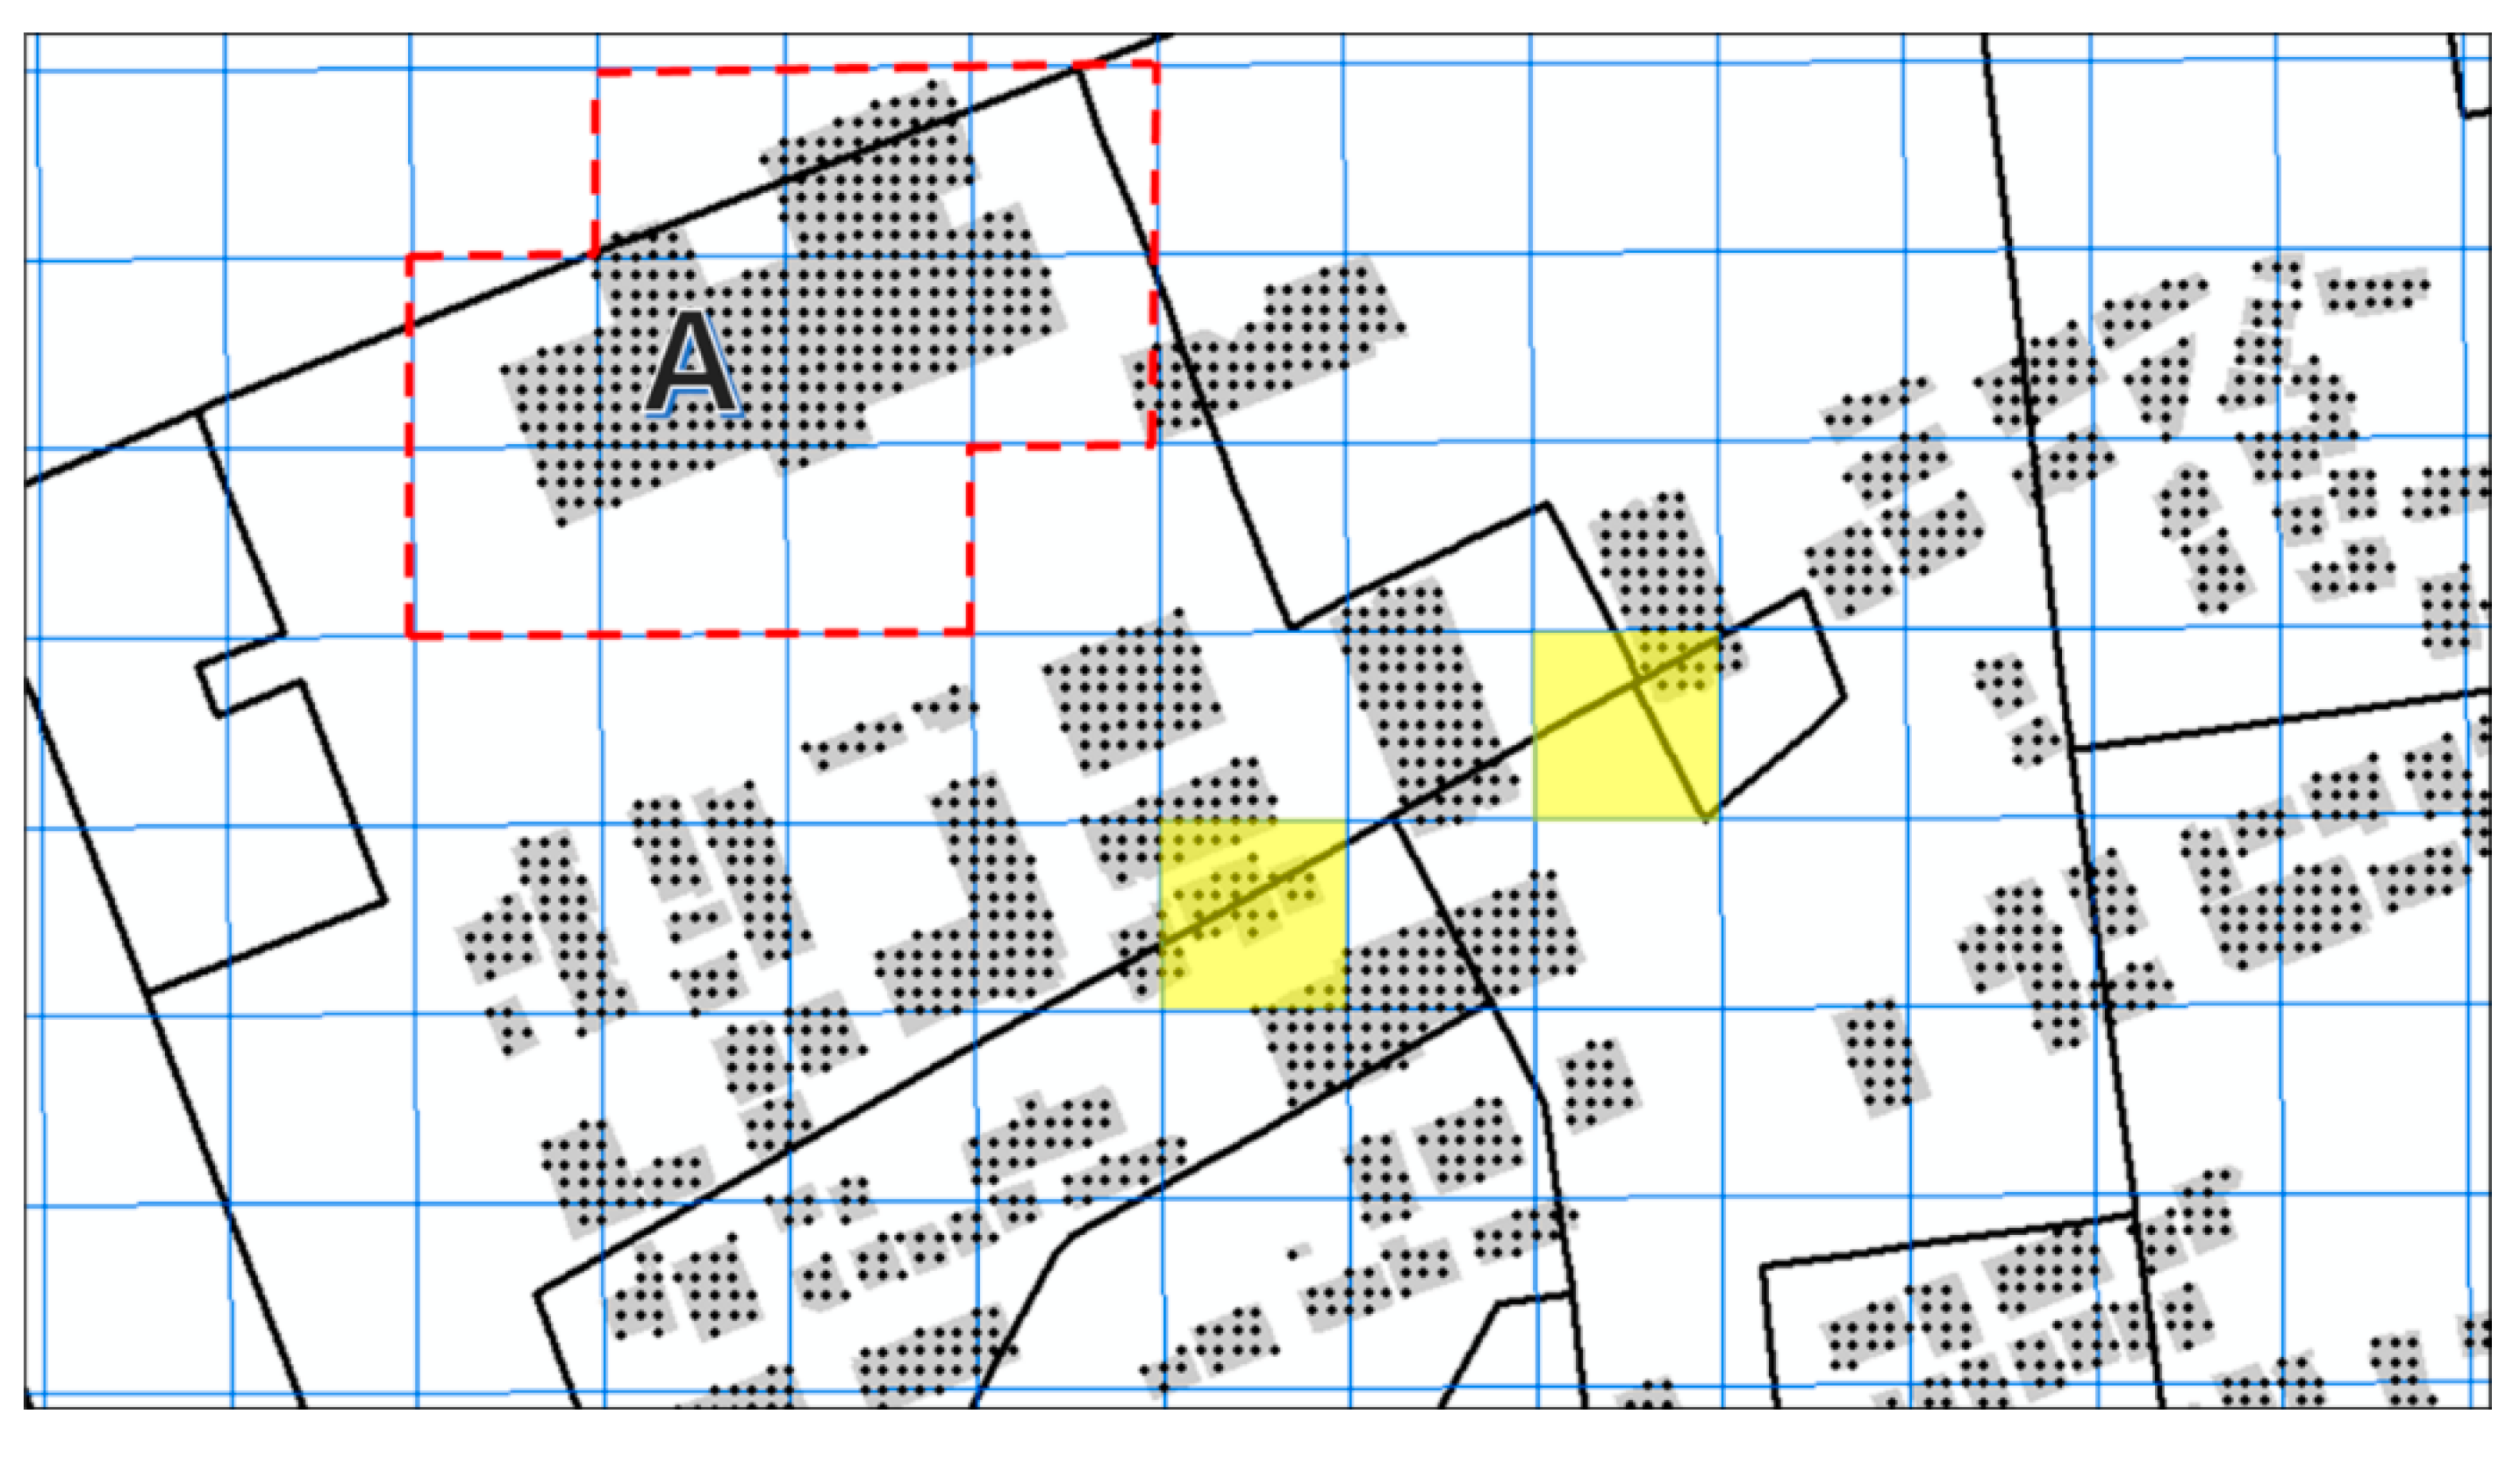
To standardize the output area unit into mesh data, the mesh weights were determined using the building floor area data. These data were used to consider the area where the actual population lives in the geospatial space. In Figure 5, the mesh data (standardized unit), building floor area data, and output area data are presented in the same space. First, the points were arranged at intervals of 5 m in the building polygon, and the building floor area was then equally divided at each point to obtain their attribute values. For example, building A, which is represented in Figure 5, has a building floor area of 1000; if the number of points is 100, each point would weigh 10. If this value is distributed in a mesh, each grid surrounding building A (marked by red dashed lines) would have a different weight. The next step is the determination of the output areas to which the numbered mesh points belong. This step is used to match a mesh area and an output area based on points.
In most cases, the range of the output area is wider than the mesh; thus, the former can be calculated by dividing the output areas into the mesh. However, similar to those in the center of Figure 5 (marked in yellow), a mesh may contain multiple output areas, and the unit must, therefore, be standardized based on the value of the point. In this way, the mobile data for each time period constructed in the output area units can be standardized in the mesh units.
3.3.2. Extraction of Bike Trip Purpose
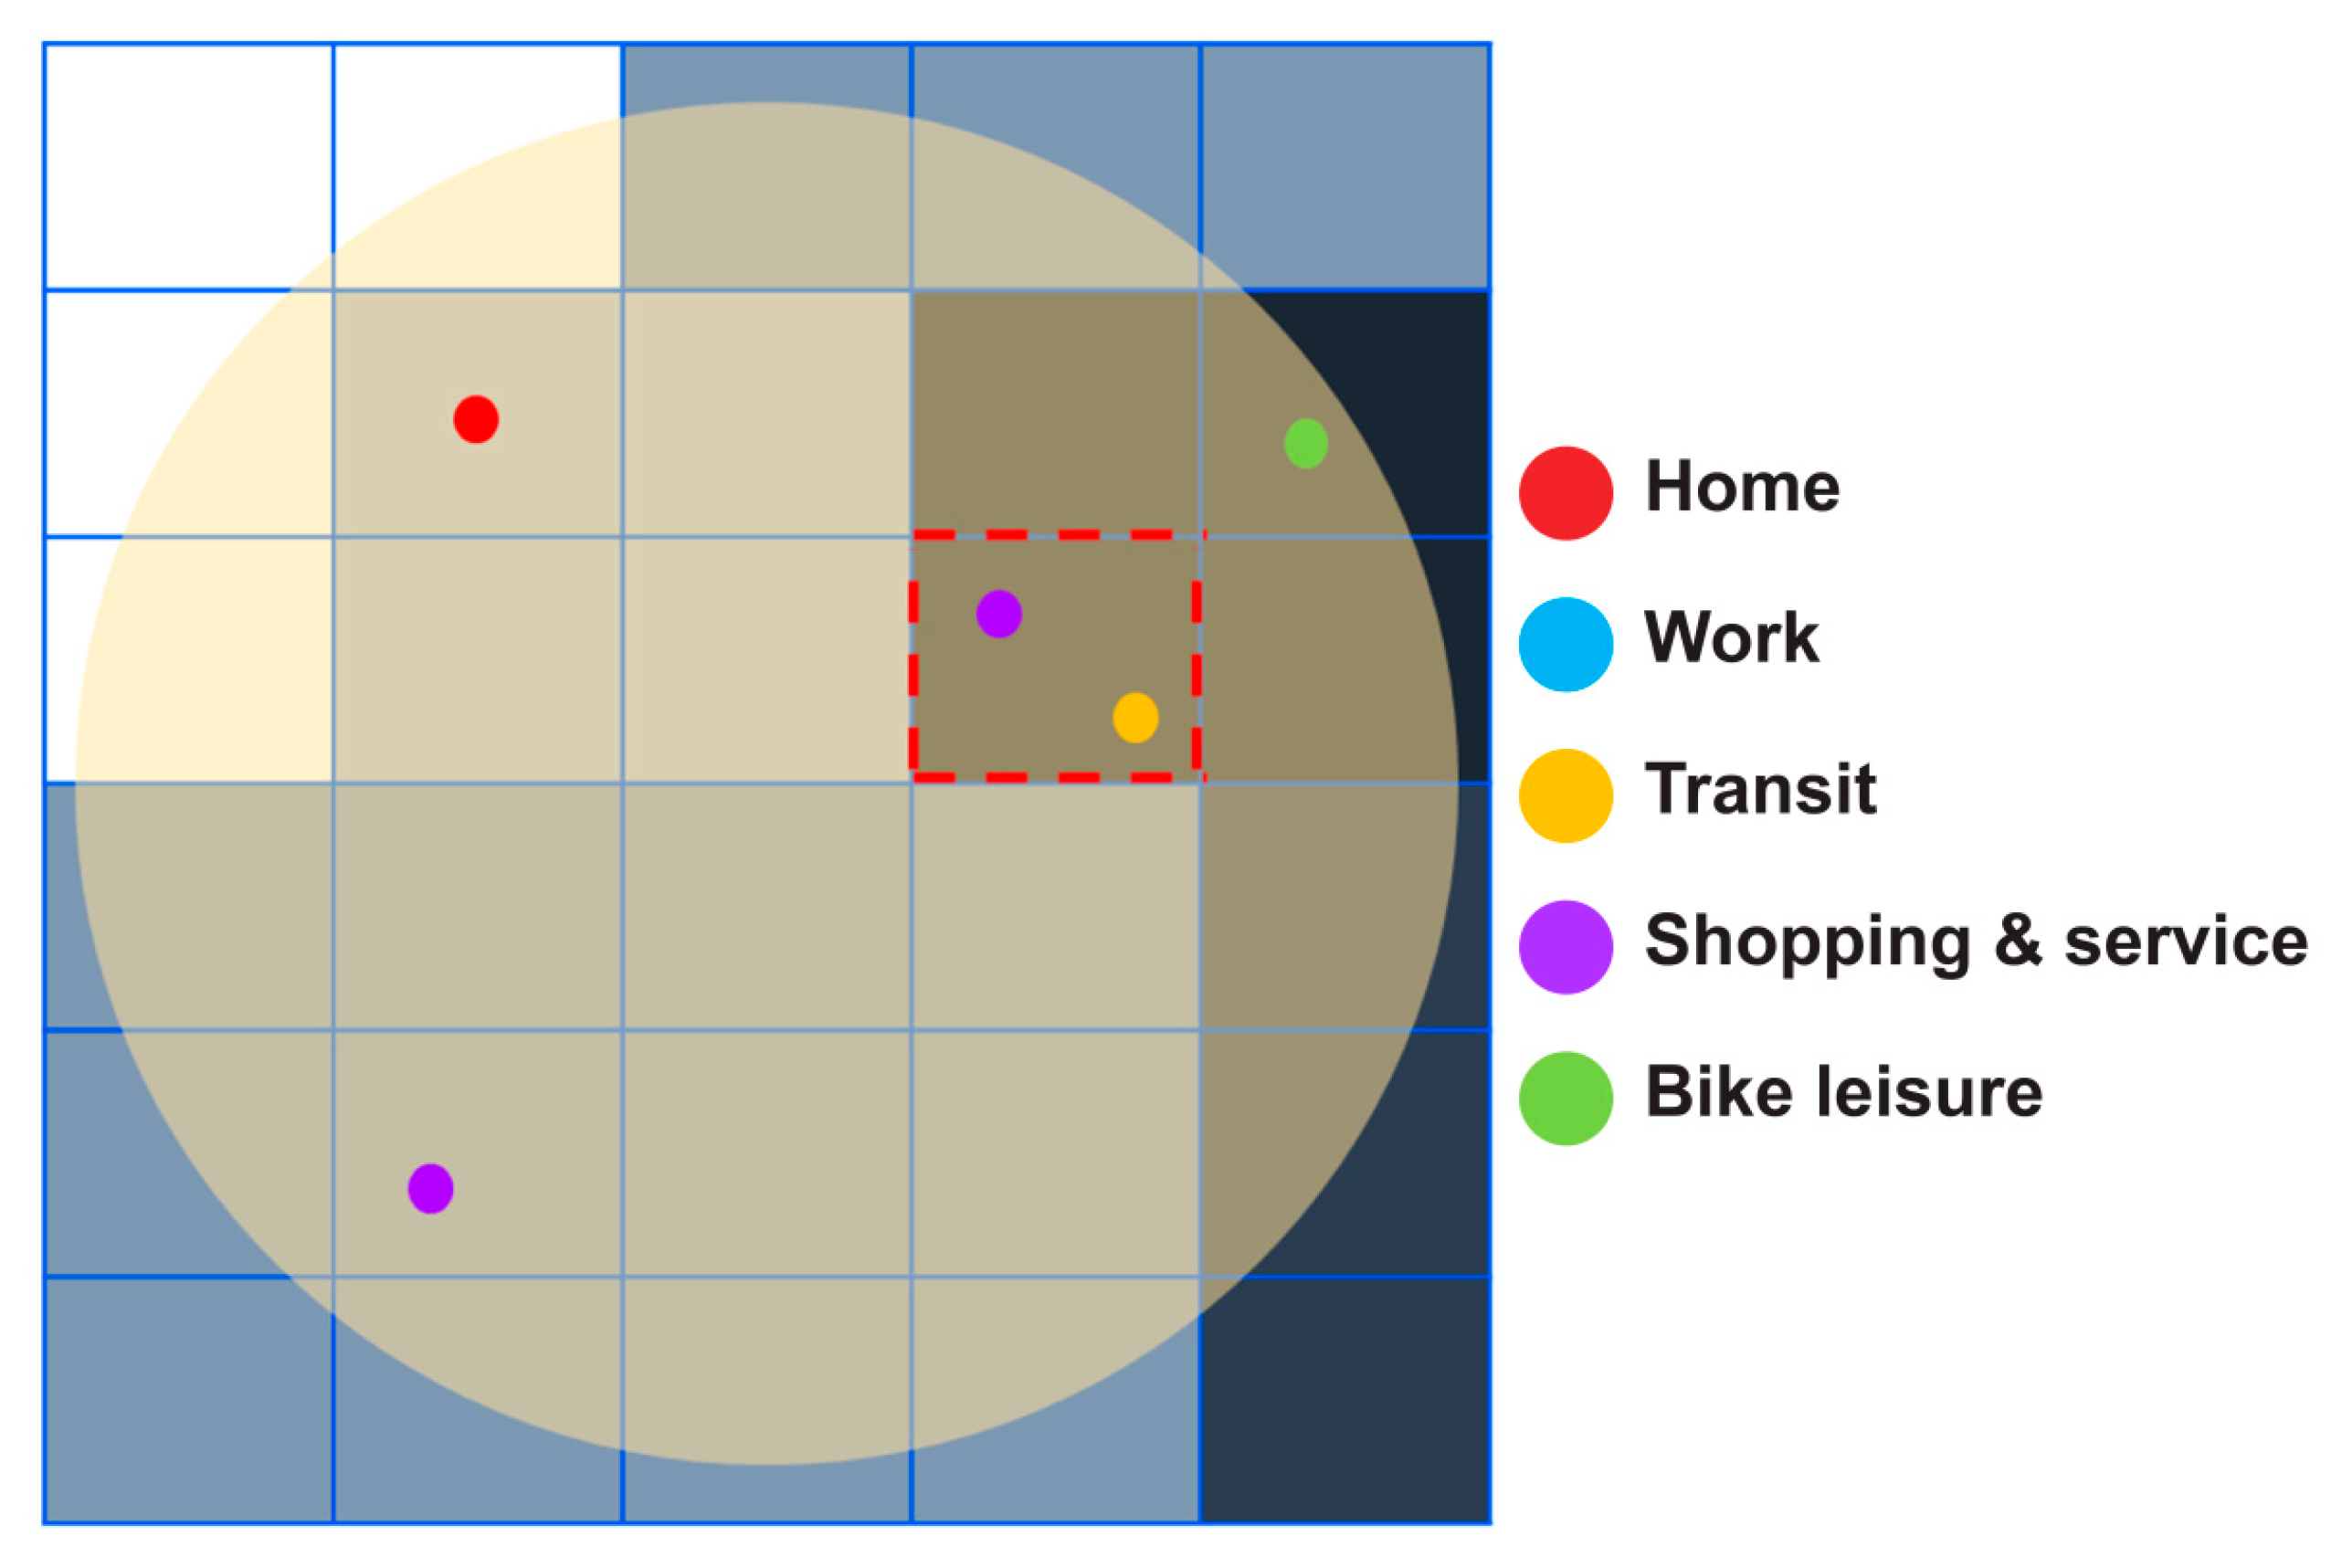
The method for inferring the bike trip purpose using mobile data standardized in mesh units and POI data around the bike stations is as follows. First, the 250 m-radius buffer zone of the bike station is standardized in mesh units. As shown in Figure 6, the floating population inferred from mobile data is assigned to each mesh; the darker the mesh, the higher the assigned floating population. The calculation is performed by dividing the floating population among the POI data of each mesh. For example, the mesh area in Figure 6 marked by the red dashed lines has two POIs related to shopping and service and transit, and the floating population within this grid is assigned to each of these POI types. In other words, the POIs have values allocated from the floating population, and when these are combined for each bike station, the type with the largest value can be inferred as the bike trip purpose for that station. Accordingly, it can be inferred that the bike trip purpose for the station in Figure 6 is shopping and service. As the mobile data were built in a time zone, this method enables the construction of a large amount of ground truth data.
3.4. Training for Machine Learning
When traffic data are established, there are three types of methods for using the data for trip purpose inference, namely, rule-based, statistical, and machine learning and neural network methods [14,15]. Rule-based methods are the most traditionally employed, with the representative utilized rules being heuristic, land-use-and-purpose matching tables, and closest-POI matching. Statistical methods are used to calculate the probability of each trip purpose with integration of the respondent’s personal information or location information using a multinomial logit model or distance-based probability calculation. Machine learning and neural network methods are more suitable for larger amounts of data and are used to build sophisticated and computationally intensive classification and pattern recognition models. Recent studies tend to use statistical or machine learning (and neural network) methods [14].
The trip purpose inference in this study utilized a machine learning model, which enabled the building of a more sophisticated model compared to the use of the rule-based or statistical methods. This is because the possibility of supervised learning through the construction of ground truth data uses more abundant data than that obtained by travel surveys. Owing to the need for a classification model for the multiple classes of the purpose of public bike trips, we implemented the learning using decision tree and random forest models, which have been shown to perform relatively well [14,16,20,43,44,45,46].
Decision tree algorithms are useful for supervised learning as analytical tools for classifying data into different groups and making predictions through decision rules represented in a tree structure. The key to training decision trees is learning in a way that minimizes classification impurity, which is measured using indexes such as the Gini index and entropy. The advantage of decision tree algorithms is their ability to interpret their results. The generated decision tree segmentation criteria indicate which attributes are used as classification criteria and what the criteria values are.
Random forest is an ensemble method that aggregates predictions using multiple decision tree models. Multiple training data are generated to build the individual decision trees for each dataset and to randomly select variables for constructing a decision tree model. Random forest has the advantage of enabling the rapid building of a model, and even when the data size of the base model is large, a vast decision tree model can be built without the need for data distribution. Accordingly, random forest does not provide information about the significance of individual variables, as in the case of linear or logistic regression models but indirectly determines the importance of the variables, for example, through out-of-bag estimations [47].
The results of training by machine learning are evaluated using the confusion matrix in Table 4. Two evaluation metrics were used to assess the performance of the model, namely, accuracy and F1-score, based on Equations (9) and (10), respectively. The accuracy can most intuitively represent the model’s performance, while the F1-score is a useful performance metric when the classification of the data is unbalanced.
4. Experiments and Results
4.1. Data
The experimental area was in Seocho-gu, located on the south side of the Han River that runs through the center of Seoul, Republic of Korea. Seocho-gu has a convenient transportation system and is a representative business district in Seoul, along with Gangnam-gu. The specific experimental area is a well-developed residential area adjacent to natural environments, such as the Han River and the Yangjae Citizen’s Forest, resulting in a high use rate of public bikes compared with other local government areas in Seoul. The experiment period was 1–30 June 2019. The total number of bike stations in Seocho-gu was 87.
The utilized bike-share data consisted of public data available from the Seoul Open Data Plaza (http://data.seoul.go.kr, accessed on 4 March 2021). The data included the number of bikes, rental date and time, rental location number, rental location name, number of rental docks, return date and time, return location number, return location name, number of return docks, usage time, and distance traveled. Overall, there were 132,788 datum units.
The utilized POI data were obtained from commercial maps that are currently used on the Korean market for the CNS. The data were used to check the land use around the bike stations. In total, 19,358 POI datum units for Seocho-gu were used. The original POI types in the data were modified to fit the purpose of this study, i.e., inference of bike trip purpose. The modified POI types are presented in Table 5. POIs within 250 m of a bike station were selected for the determination of land use, with the exception of the cases of bike leisure, for which a radius of 1000 m was used.
The mobile data used to produce the ground truth data were also public data obtained from the Seoul Open Data Plaza (http://data.seoul.go.kr, accessed on 4 March 2021). For this purpose, the number of people within a specific space unit at a specific time on a specific day was estimated based on KT mobile phone signals captured from 6000 base stations across Seoul. This method is useful for identifying the floating population, not the residential population, because the population of the output area, which is the smallest statistical unit, corresponds to the time zone.
4.2. Extracted Land Use at Bike Stations by POI Type Embedding
The POI types associated with eight bike trip purposes were embedded based on the work of Yan et al. [24] through the application of the popularity and distance concepts. In the configuration of the POI tuples, the k value of the k-nearest function was set to 10, resulting in groups of the 10 closest POIs per POI. The tuples were augmented using the parameter presented by Yan et al. [24], and the popularity of a POI was calculated based on the number of bike rentals at the station to which the POI belongs. The final number of POI tuples obtained by the data augmentation was 323,184. The POI type embedding experiments were conducted in Python 3.7.7 and TensorFlow 2.0.0. The number of embedding dimensions was set to 70 and the number of iterations to 20,000. The embedding values according to POI type calculated through training are presented in Table 6.
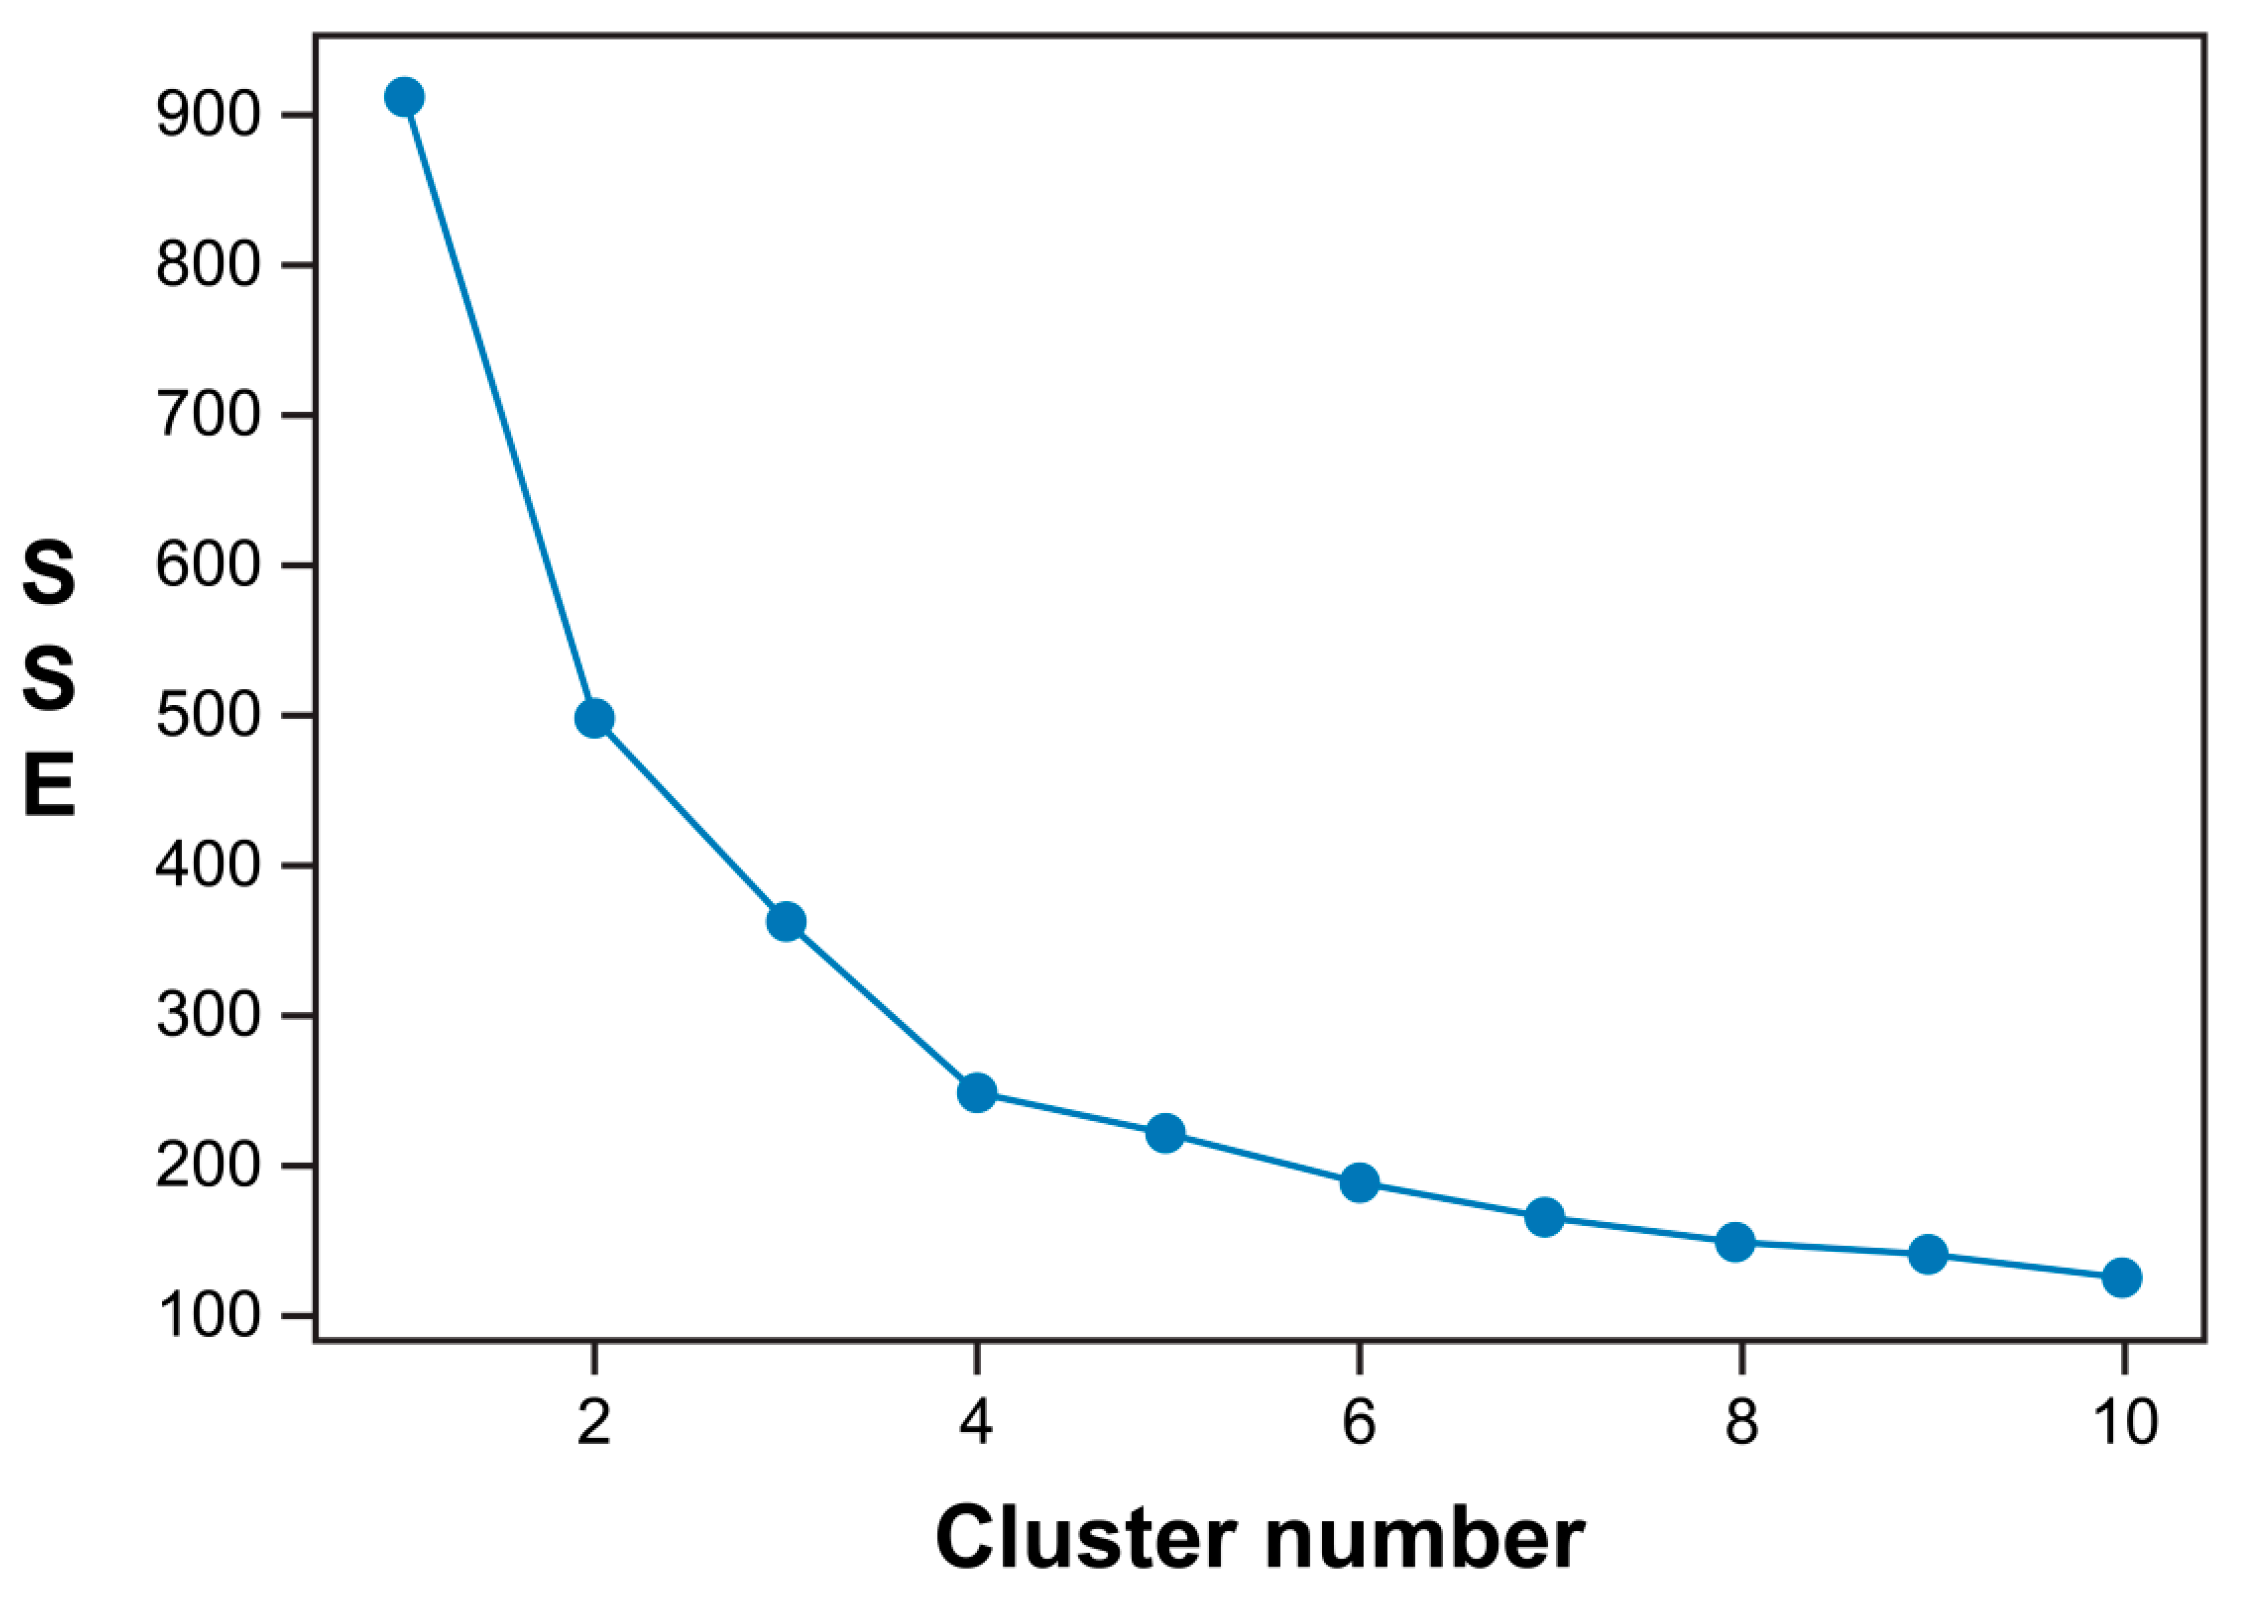
The calculated POI type embedding values were aggregated for each bike station, and k-means clustering analysis was then performed. Because k-means clustering is used to determine the center of the cluster to minimize the sum of squares error (SSE), the optimal value of Cluster k is determined by the elbow technique by checking the SSE. In the present experiments, the SSE was at the minimum value for k = 4, as shown in Figure 7.
The final clustering results are shown in Figure 8. To visualize the geospatial elements of the experimental area, a layer provided by OpenStreetMap (http://www.openstreetmap.org, accessed on 4 March 2021) was used as a background map. A simple POI type analysis of the clustered results was conducted. Cluster 1 was found to be the center of work, transportation, and shopping, while Cluster 2 was an area with a relatively high amount of bike-related leisure facilities such as nearby forests, playgrounds, and parks. Cluster 3 was observed to be a residential area where schools and academies were dominant, and Cluster 4 an area with few and relatively insignificant POIs.
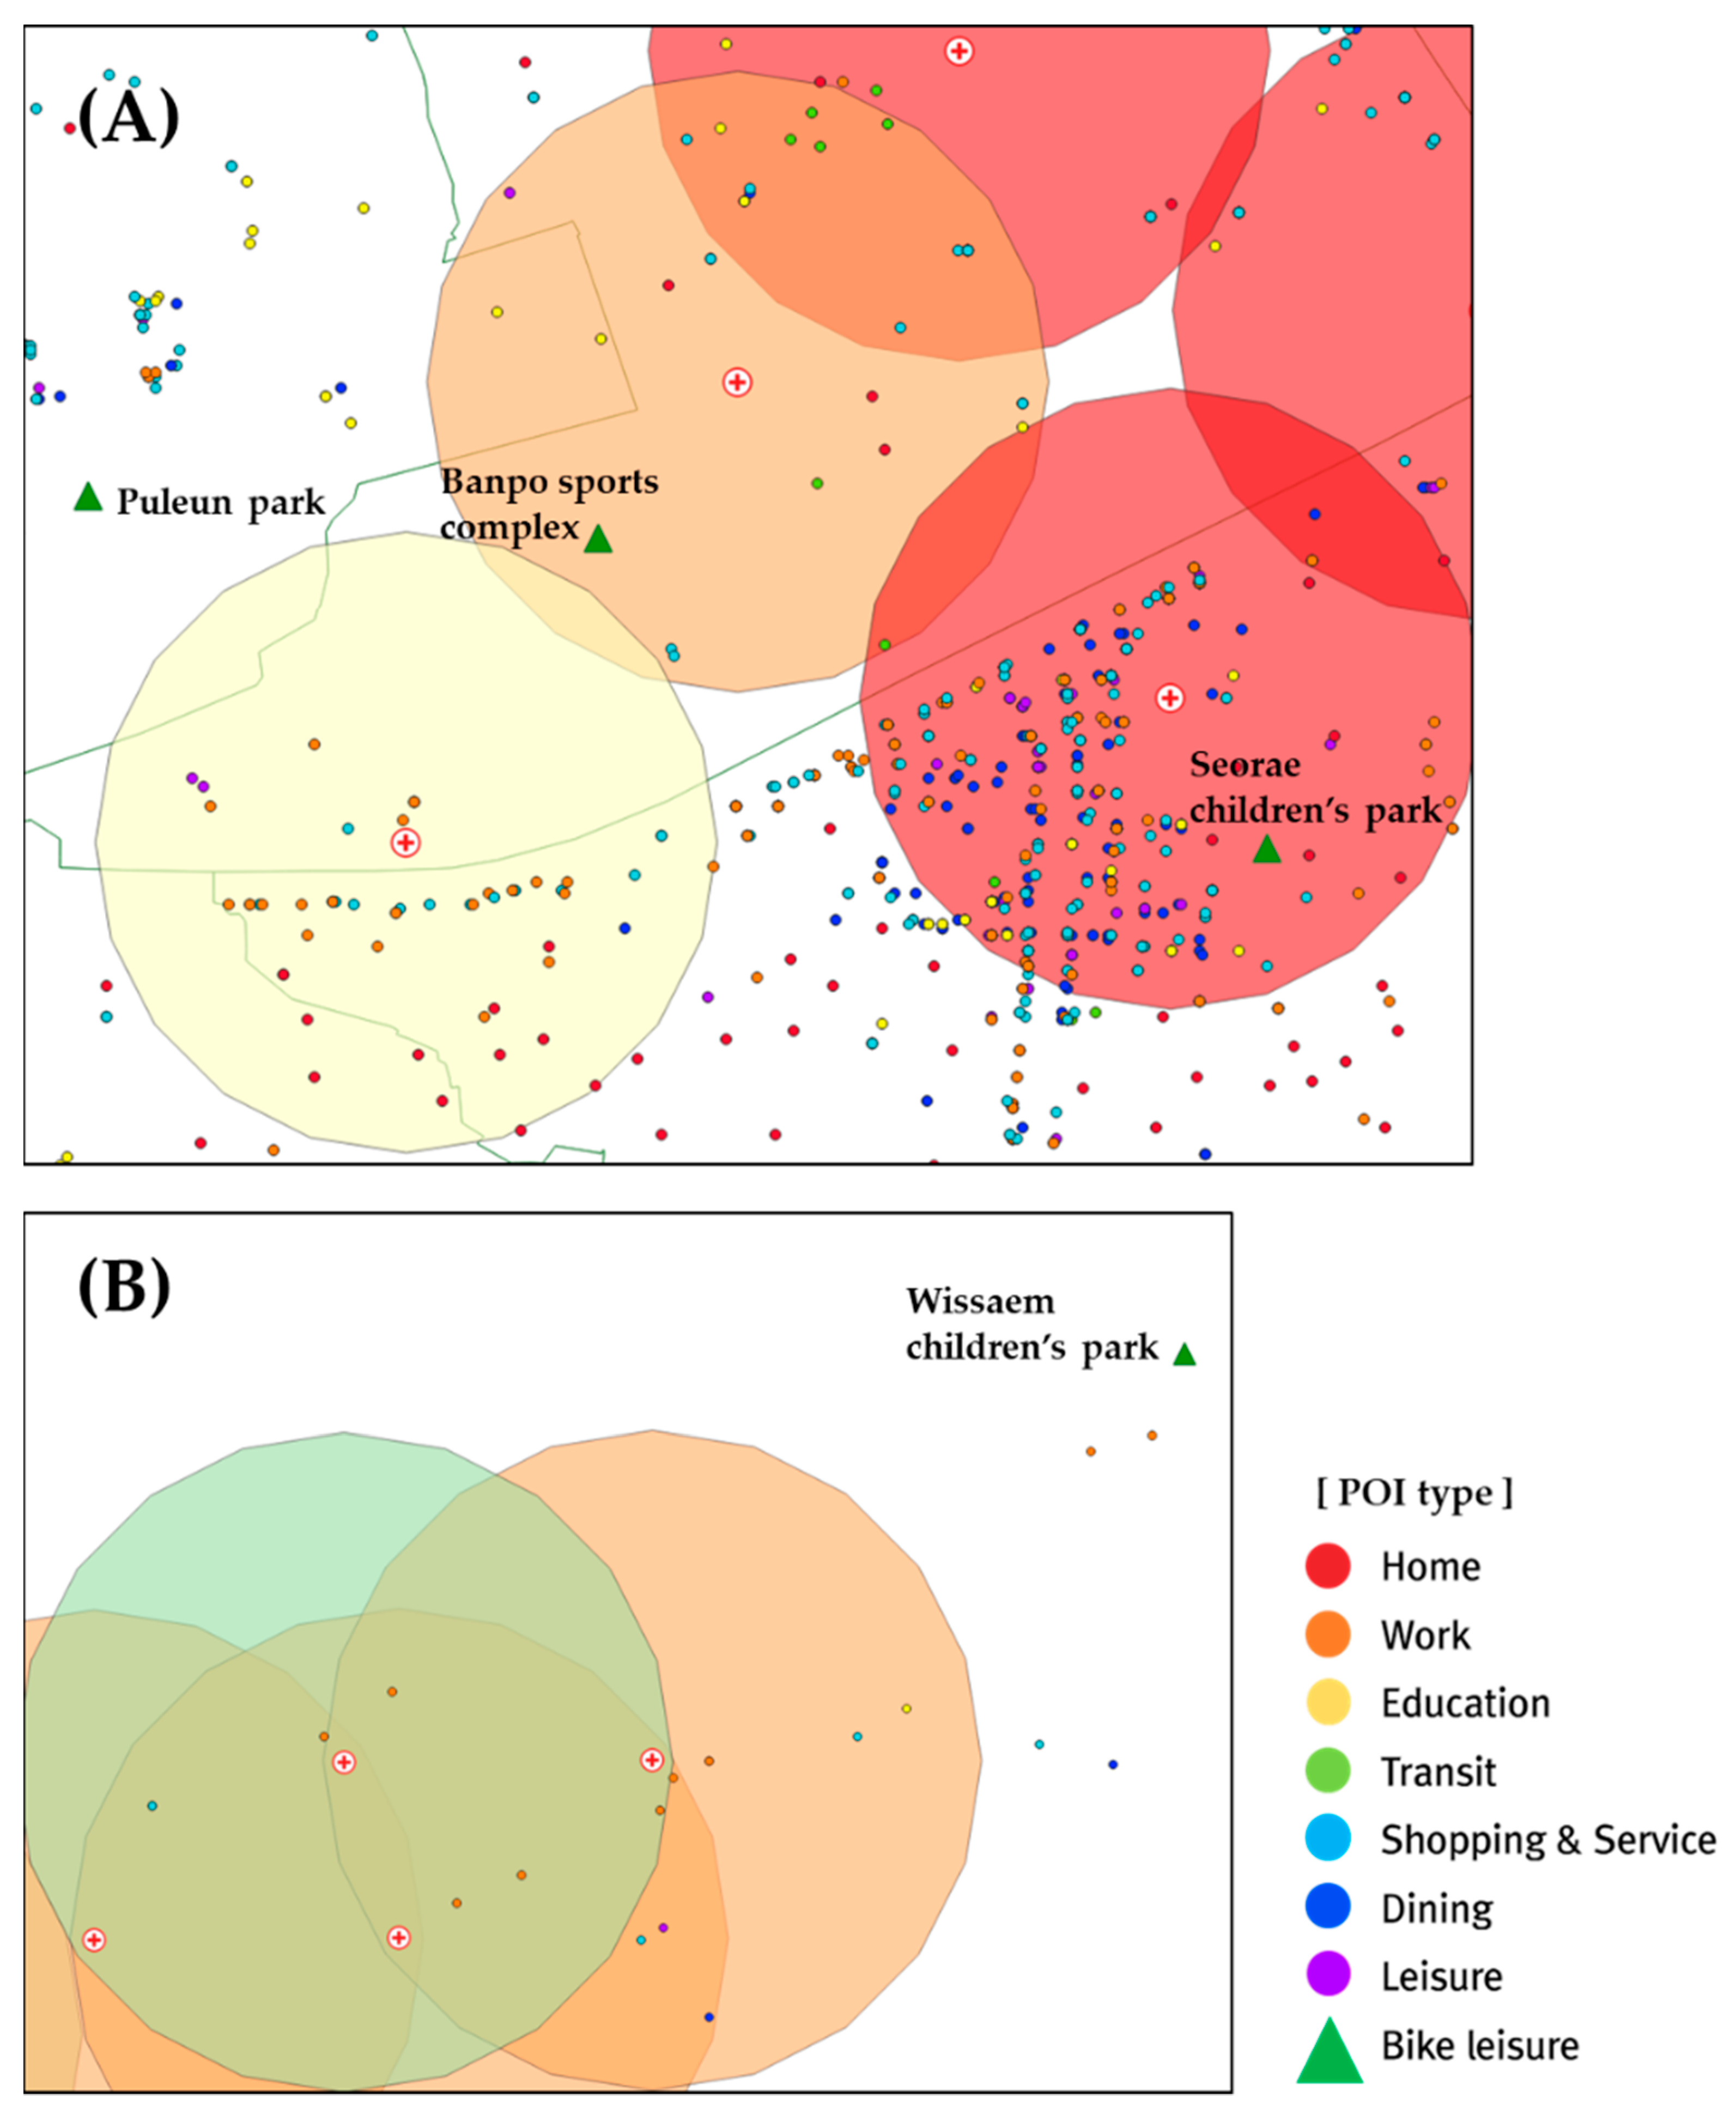
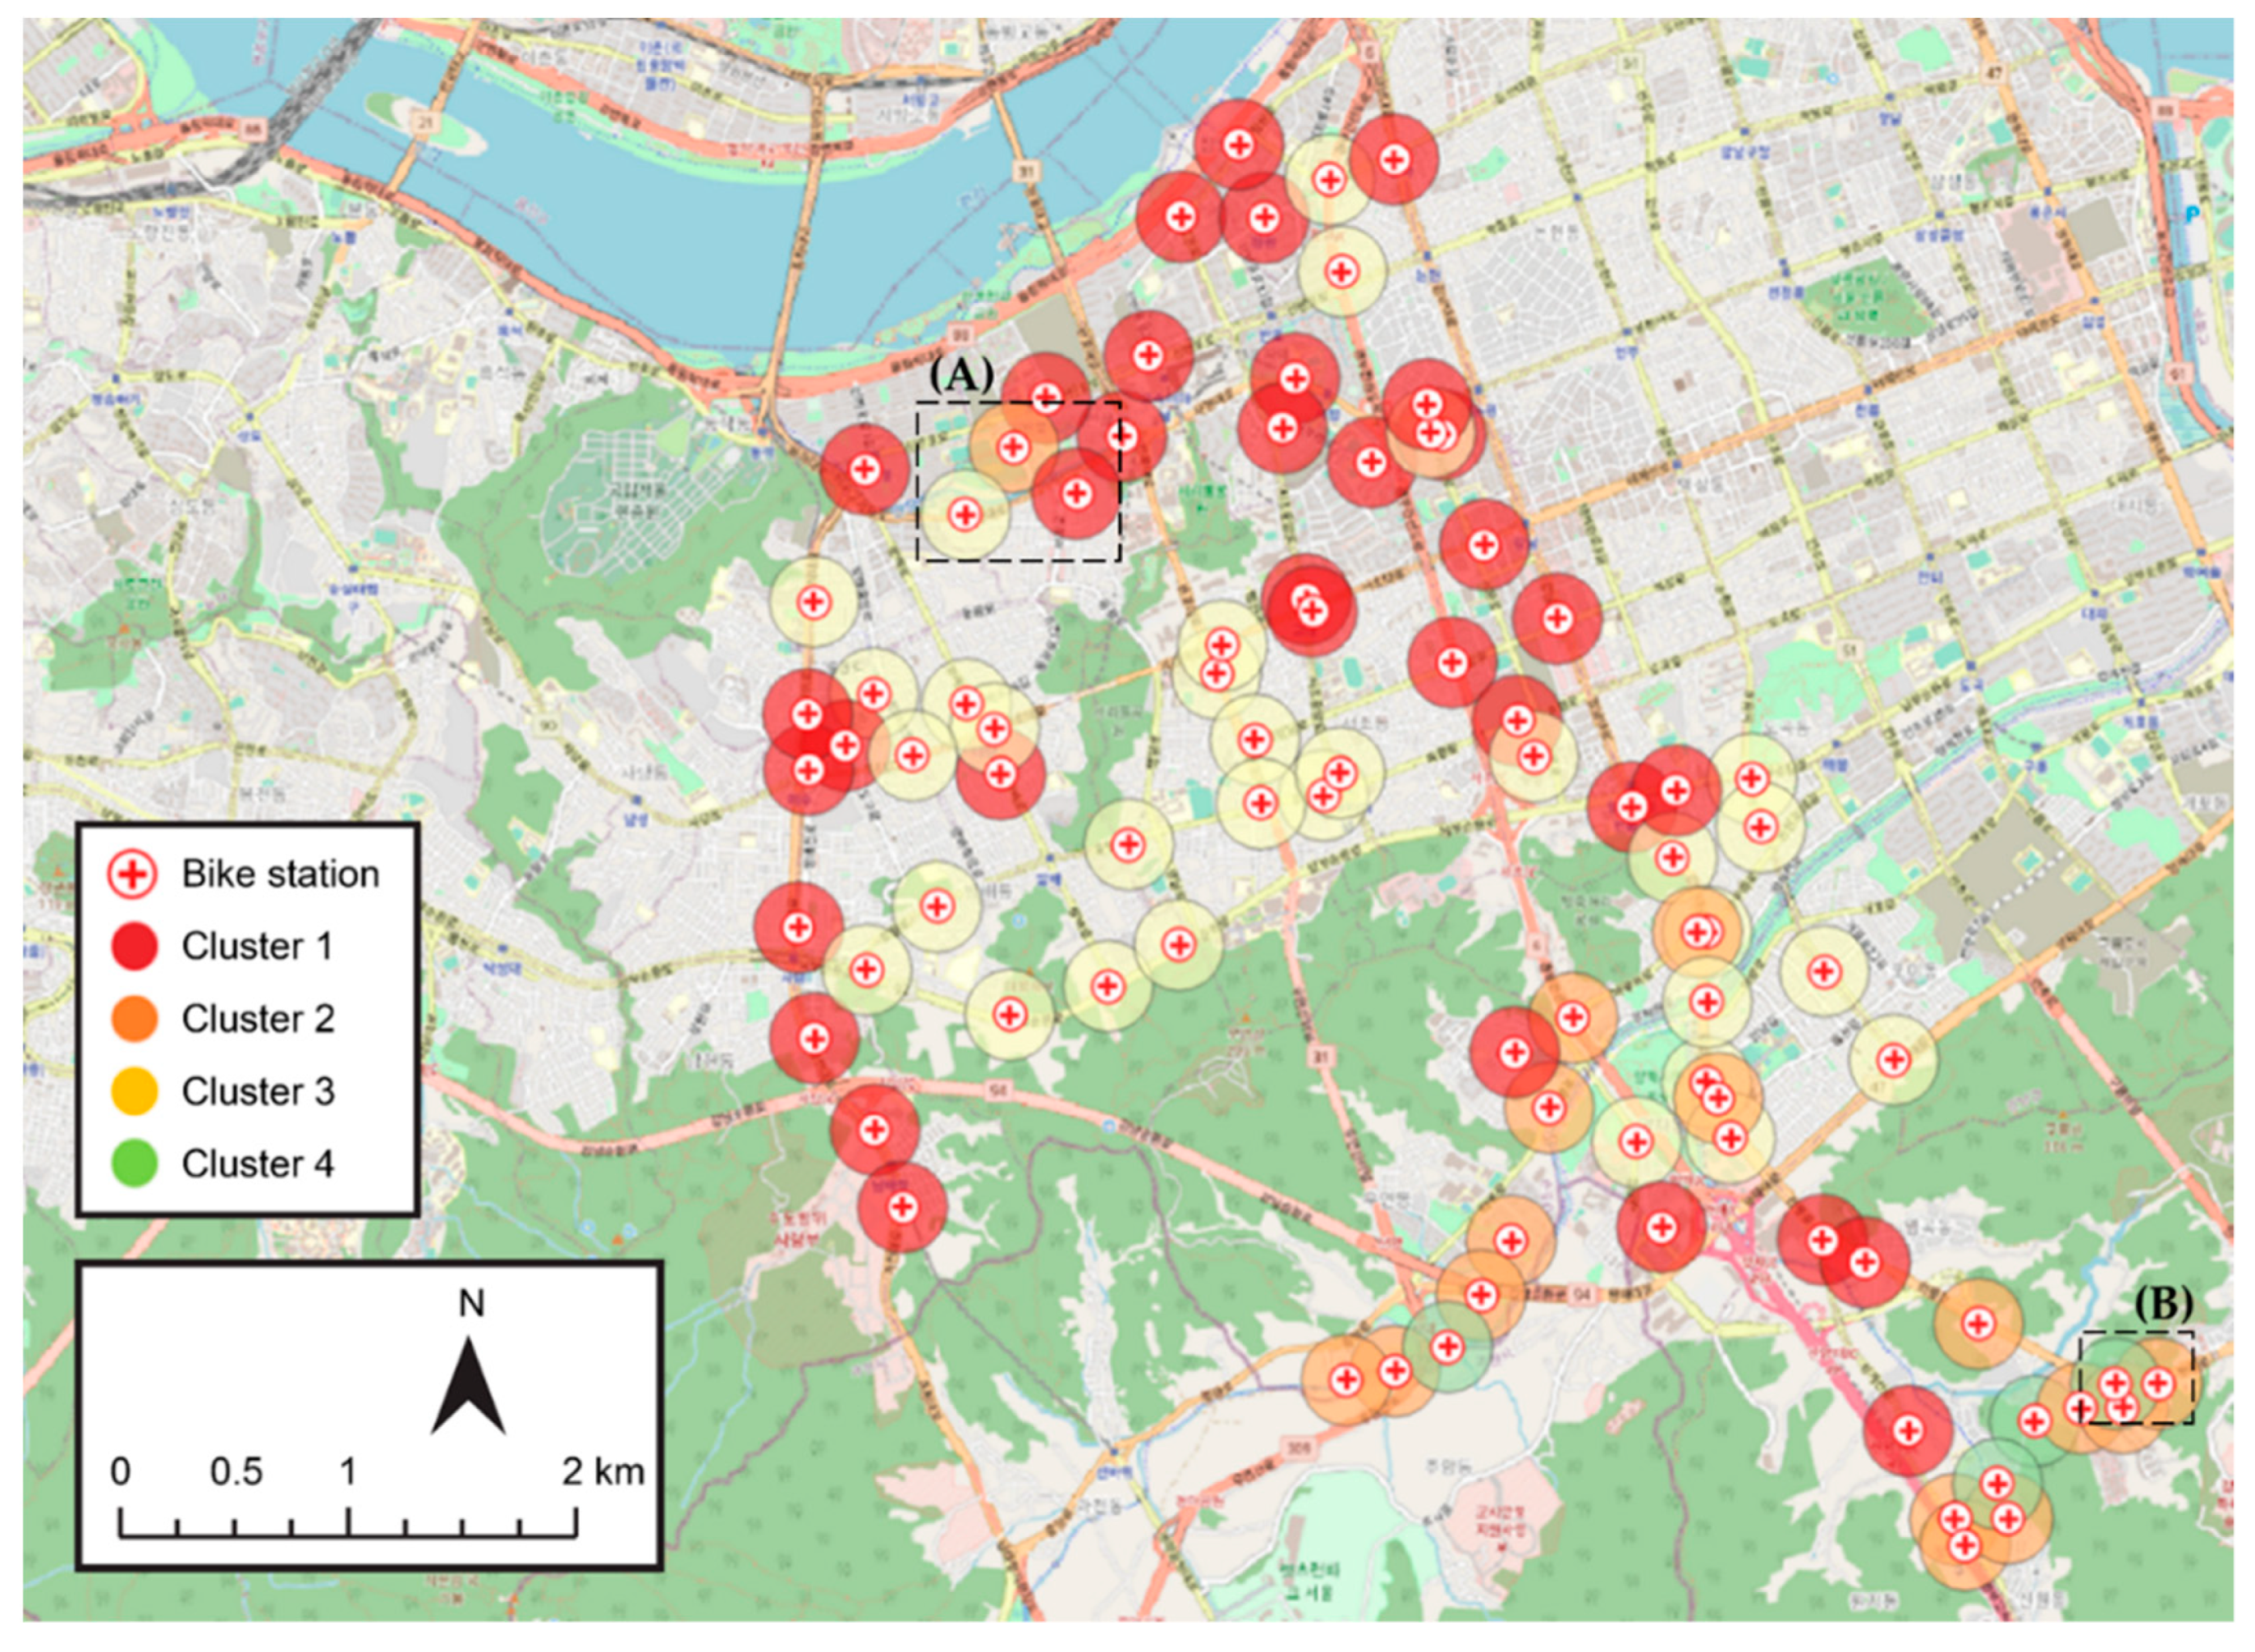
To verify the distribution of POIs in the significant clusters, the regions A and B in Figure 8 are magnified and shown in Figure 9. Because region A is dense with clusters 1, 2, and 3, features can be compared for each cluster. Cluster 1 (marked in red) is the center of work, transportation, and shopping, with various POIs concentrated along the road. Cluster 2 (marked in orange) contains relatively fewer POIs but is highly influenced by POIs related to bike leisure, such as parks and playgrounds. Bike leisure POIs are designed to have an influence range of 1000 m from the center of a bike station; thus, the POIs outside the buffer range are also in the ambit of this cluster. Consequently, not only the Banpo sports complex in Cluster 2 but also Puleun park and Seorae children’s park are in the ambit of Cluster 2. Cluster 3 (marked in yellow) is a residential area where residential POIs are identified at the bottom of the figure. Region B is located in the foothills of a mountain and thus contains relatively fewer POIs. Cluster 4 (marked in green) reflects greenfield characteristics, and Cluster 2 is influenced by the Wissaem children’s park outside the buffer range, similar to region A. This confirms that our POI-type embedding design is well customized for bike trips when configuring clusters.
This methodology would improve the study results if applied to the results of existing works. Only type information is used in POI embedding in this study; however, information about the size or open time of POI can also be used [48]. The influence of a bike leisure POI, such as a park that affects bicycle traffic, may vary depending on its size. We used a buffer of 250 m to design a range that currently affects bike stations—this would present more realistic embedding results if a network distance is used or a service area is applied [24]. The results could be more easily interpreted if additional data are utilized to validate the current clustering results. Zhai et al. [25] extracted urban functional regions using POI embedding and verified the extraction results using truck OD data to interpret the clustered results.
4.3. Results of Public Bike Trip Purpose Inference
The final dataset consisted of features related to bike trip purpose obtained from bike-share data and land use features calculated by POI type embedding. There was a total of eight features, as shown in Table 7. The ground truth data were obtained using the trip purpose values calculated from mobile data and POI data. Among the features, the land use values of the trip origin and destination calculated by POI type embedding were applied to the clustering values derived, as discussed in the previous section. Thereafter, one-hot encoding was performed because of the categorical nature of the data. Of the utilized 132,788 bike-share datum units for Seocho-gu, Seoul, for the month of June 2019, those for 1–20 June were classified as training data, and those for 21–30 June as test data for the experiment.
The decision tree and random forest algorithms were employed for bike trip inference. We performed k-fold cross-validation, in which the data were repeatedly divided to train multiple models and measure the generalization performance. Decision tree and random forest require hyperparameter tuning for critical variables and were used to select the optimal hyperparameters with a high predictive performance using Python’s GridSearchCV module of Scikit-learn.
The experimental results showed that the optimal performance (accuracy criterion) measured by machine learning was 78.95% for decision tree and 74.08% for random forest. The decision tree model also exhibited better performance in terms of the F1-score, i.e., 66.43%, as determined by the confusion matrix. The experimental results for different bike trips are presented in Table 8, from which an accurate prediction can be observed, especially for shopping and service, work, and transit. An education purpose for a bike trip is relatively less predictable, attributable to the relatively large number of shopping and service POIs in Seocho-gu. In addition, the POI characteristics for shopping and service are combined with those for various other POI types, as the shopping and service POIs are not located alone, similarly impacting other trip purposes. This issue can be resolved by disaggregating the classification of the POI types.
Furthermore, to improve the overall accuracy, applying deep learning algorithms may be an alternative, wherein bike-user characteristics (e.g., gender, age) can be added as features. Among the studies related to trip purpose inference, studies using deep learning have exhibited higher accuracy [13,29]. Because deep learning works well for big data, it is required to build data by increasing the spatial and temporal scope of the study, as well as features that affect the trip purpose. Furthermore, entire datasets must be built by combining various user-generated data, such as review data built by real bike users.
5. Discussion and Conclusions
This paper proposed a methodology for inferring the purpose of bike trips from historical data on shared bikes. Investigations of bike-sharing facilitate a more detailed look at urban mobility, especially the first and last miles of public transportation. Decision-making on various urban issues can, therefore, be supported by inferring the purpose of bike trips. An essential factor in trip purpose inference is the land use of destinations [18,19,20]. Based on this fact, this study resolved the urban mixed land-use problem by applying the POI embedding technology. The bike trip date, departure time, arrival time, total time, total trip distance, and distance between stations were adopted as relevant features from bike-share data. POI data were used to extract the land uses at the origin and destination, which significantly reflect the trip purpose. POIs within a radius of 250 m from the bike stations (1000 m for bike leisure-related POIs) were used to extract the land use through POI type embedding, a methodology developed by Yan et al. [24], with the POI types redefined for the present interest in bike trips. The geographical distance of the POIs and the number of bike rentals at each station were considered as tuple augmentation factors for the POI type embedding. However, if there were hundreds of POIs for each bike station, the POI-type information alone could not capture the biker preferences for visiting the area. Therefore, the number of bike rentals at each station was distributed to obtain popularity information for each POI. We also developed a method for utilizing the temporal mobile data and POI data for the extraction of ground truth data for bike trip purposes. The mobile data for each time zone obtained in the output area units and the POI data obtained in the buffer units around the bike stations were standardized as mesh data for the generation of the ground truth data.
The experiments of this study considered 87 bike stations in Seocho-gu, Seoul. The study period was 1–31 June 2019, and in total, 132,788 public bike-share datum units were utilized. Decision tree and random forest were used for machine learning for bike trip purpose inference, with the hyperparameters adjusted for optimal performance. The land uses at the bike stations deduced by POI type embedding were divided into four clusters, with decision tree exhibiting better performance, having an accuracy of 78.95% and an F1-score of 66.43%.
Results from POI type embedding revealed relatively well the origin and destination land use for bike trips proposed in this study. A single bike station contains 70–100 POIs on average in a buffer zone of 250 m; however, clusters about these mixed land uses were classified well in this study. In particular, as for bike leisure POI, which affects bike trips, the influence range from the center of a bicycle station was set to 1000 m, and the cluster results (Figure 9) showed that the details are well-reflected. Furthermore, the trip purpose inference results obtained through machine learning indicated that relatively accurate predictions are made for all eight traffic purposes (Table 8). In previous studies related to trip purpose inference, accuracies of 60–90% were only achieved through the use of survey data. This study is of significance as the first step toward using machine learning on spatial data—not survey data—for trip purpose inference.
The results of this study can be helpful not only for bicycles but also for the recent increase in personal mobility trip purpose inference. The bike-specific POI embedding technique proposed in this study can be customized according to the corresponding mobility and used for its trip purpose inference. This study offers a good resource for policymakers for decision-making on urban issues, affording a means of making bike trip purpose inferences using only publicly available bike-share data and POI data. Inferring trip purposes using the methodology proposed in this study and analyzing its patterns will lead to a better understanding of the causes of personal movement within cities.
This study differs from the related works on trip purpose inference using survey data in that it focuses on obtaining general knowledge on bike mobility and the whereabouts of activities by applying meaning-enhancing processes reflecting the real world rather than improving the accuracy of inference from a traffic-engineering perspective. For semantic enhancement of bike-sharing data, land use at origin and destination was extracted using the POI embedding technology. Further, this study evaluated the proposed method by generating ground truth data using mobile data and POI data to infer bike trip purpose at a common-sense level.
However, this study has a limitation that the proposed method for ground truth data generation utilizes aggregated data and not the data at the disaggregated level. Nevertheless, this reflects the difficulty of the travel survey of individuals from a realistic perspective. We believe that this study’s results are meaningful in terms of human geography, which aims to semantically enrich and discover general patterns of mobility rather than focusing on precision at individual levels. Additionally, a problem exists that individual characteristics of bicycle users could not be considered when selecting features for trip purpose inference. Because the level of data provided only presents information about the origin, and not the entire OD data, to protect users’ privacy.
From the methodological perspective, we limited the POI type to eight during POI embedding and used only type information for data augmentation. This limitation can be addressed by segmenting the POI type and redesigning the algorithm to allow for data augmentation using various information such as the size or open time of POI during POI embedding. In addition, the results can be verified by converging various data such as social media and mobile data to strengthen the meaning of the extracted cluster. Deep learning algorithms that have been proven to deliver relatively good inference results can be utilized to improve the accuracy of trip purpose inference. Because deep learning yields good results only for large datasets, the spatial and temporal range of the experimental sites must be improved. Alternatively, methods to increase the number of features that affect the trip purpose can be considered, including users’ personal information combined with various user-generated data, such as the review data built by actual bicycle users.
Author Contributions
Conceptualization, Jiwon Lee, Jiyoung Kim, and Kiyun Yu; Methodology, Jiwon Lee and Jiyoung Kim; Software, Jiwon Lee;Validation, Jiwon Lee and Jiyoung Kim; Investigation, Jiwon Lee; Writing (Original Draft), Jiwon Lee; Writing (Review and Editing), Jiwon Lee, Jiyoung Kim and Kiyun Yu; Visualization, Jiwon Lee; Supervision, Jiyoung Kim; Project Administration, Kiyun Yu. All authors have read and agreed to the published version of the manuscript.
Funding
This research was supported by the Basic Science Research Program through the National Research Foundation of Korea (NRF), funded by the Ministry of Education (No. 2020R1I1A1A01075 363).
Informed Consent Statement
Not applicable.
Data Availability Statement
The data presented in this study are available on request from the corresponding author.
Conflicts of Interest
The authors declare no conflict of interest.
References
- Bao, J.; Xu, C.; Liu, P.; Wang, W. Exploring Bikesharing Travel Patterns and Trip Purposes Using Smart Card Data and Online Point of Interests. Netw. Spat. Econ. 2017, 17, 1231–1253. [Google Scholar] [CrossRef]
- Xing, Y.; Wang, K.; Lu, J.J. Exploring travel patterns and trip purposes of dockless bike-sharing by analyzing massive bike-sharing data in Shanghai, China. J. Transp. Geogr. 2020, 87, 102787. [Google Scholar] [CrossRef]
- Yang, Y.; Heppenstall, A.; Turner, A.; Comber, A. A spatiotemporal and graph-based analysis of dockless bike sharing patterns to understand urban flows over the last mile. Comput. Environ. Urban. Syst. 2019, 77, 101361. [Google Scholar] [CrossRef]
- Fishman, E. Bikeshare: A Review of Recent Literature. Transp. Rev. 2016, 36, 92–113. [Google Scholar] [CrossRef]
- Saberi, M.; Ghamami, M.; Gu, Y.; Shojaei, M.H.; Fishman, E. Understanding the impacts of a public transit disruption on bicycle sharing mobility patterns: A case of Tube strike in London. J. Transp. Geogr. 2018, 66, 154–166. [Google Scholar] [CrossRef]
- Guirao, B.; Ampudia, M.; Molina, R.; García-Valdecasas, J. Student behaviour towards Free-Floating Carsharing: First evidences of the experience in Madrid. Transp. Res. Procedia 2018, 33, 243–250. [Google Scholar] [CrossRef]
- Le Vine, S.; Polak, J. The impact of free-floating carsharing on car ownership: Early-stage findings from London. Transp. Policy 2019, 75, 119–127. [Google Scholar] [CrossRef]
- Xu, Y.; Chen, D.; Zhang, X.; Tu, W.; Chen, Y.; Shen, Y.; Ratti, C. Unravel the landscape and pulses of cycling activities from a dockless bike-sharing system. Comput. Environ. Urban. Syst. 2019, 75, 184–203. [Google Scholar] [CrossRef]
- Ai, Y.; Li, Z.; Gan, M.; Zhang, Y.; Yu, D.; Chen, W.; Ju, Y. A deep learning approach on short-term spatiotemporal distribution forecasting of dockless bike-sharing system. Neural Comput. Appl. 2018, 31, 1665–1677. [Google Scholar] [CrossRef]
- Zhao, J.; Fan, W.; Zhai, X. Identification of land-use characteristics using bicycle sharing data: A deep learning approach. J. Transp. Geogr. 2020, 82, 102562. [Google Scholar] [CrossRef]
- Osama, A.; Sayed, T.; Bigazzi, A.Y. Models for estimating zone-level bike kilometers traveled using bike network, land use, and road facility variables. Transp. Res. Part A Policy Pr. 2017, 96, 14–28. [Google Scholar] [CrossRef]
- Yang, Y.; Heppenstall, A.; Turner, A.; Comber, A. Who, Where, Why and When? Using Smart Card and Social Media Data to Understand Urban Mobility. ISPRS Int. J. Geo-Inform. 2019, 8, 271. [Google Scholar] [CrossRef] [Green Version]
- Cui, Y.; Meng, C.; He, Q.; Gao, J. Forecasting current and next trip purpose with social media data and Google Places. Transp. Res. Part C Emerg. Technol. 2018, 97, 159–174. [Google Scholar] [CrossRef]
- Ermagun, A.; Fan, Y.; Wolfson, J.; Adomavicius, G.; Das, K. Real-time trip purpose prediction using online location-based search and discovery services. Transp. Res. Part C Emerg. Technol. 2017, 77, 96–112. [Google Scholar] [CrossRef]
- Gong, L.; Morikawa, T.; Yamamoto, T.; Sato, H. Deriving Personal Trip Data from GPS Data: A Literature Review on the Existing Methodologies. Procedia Soc. Behav. Sci. 2014, 138, 557–565. [Google Scholar] [CrossRef] [Green Version]
- Montini, L.; Rieser-Schüssler, N.; Horni, A.; Axhausen, K.W. Trip Purpose Identification from GPS Tracks. Transp. Res. Rec. J. Transp. Res. Board 2014, 2405, 16–23. [Google Scholar] [CrossRef]
- Nguyen, M.H.; Armoogum, J.; Madre, J.-L.; Garcia, C. Reviewing trip purpose imputation in GPS-based travel surveys. J. Traffic Transp. Eng. 2020, 7, 395–412. [Google Scholar] [CrossRef]
- Alsger, A.; Tavassoli, A.; Mesbah, M.; Ferreira, L.; Hickman, M. Public transport trip purpose inference using smart card fare data. Transp. Res. Part C Emerg. Technol. 2018, 87, 123–137. [Google Scholar] [CrossRef]
- Bohte, W.; Maat, K. Deriving and validating trip purposes and travel modes for multi-day GPS-based travel surveys: A large-scale application in the Netherlands. Transp. Res. Part C Emerg. Technol. 2009, 17, 285–297. [Google Scholar] [CrossRef]
- Deng, Z.; Ji, M. Deriving Rules for Trip Purpose Identification from GPS Travel Survey Data and Land Use Data: A Machine Learning Approach. In Proceedings of the Seventh International Conference on Traffic and Transportation Studies (ICTTS) 2010, Kunming, China, 3–5 August 2010. [Google Scholar]
- Zhang, X.; Sun, Y.; Zheng, A.; Wang, Y. A New Approach to Refining Land Use Types: Predicting Point-of-Interest Categories Using Weibo Check-in Data. ISPRS Int. J. Geo-Inform. 2020, 9, 124. [Google Scholar] [CrossRef] [Green Version]
- Long, Y.; Liu, X. Featured Graphic. How Mixed is Beijing, China? A Visual Exploration of Mixed Land Use. Environ. Plan. A Econ. Space 2013, 45, 2797–2798. [Google Scholar] [CrossRef]
- Liu, K.; Yin, L.; Lu, F.; Mou, N. Visualizing and exploring POI configurations of urban regions on POI-type semantic space. Cities 2020, 99, 102610. [Google Scholar] [CrossRef]
- Yan, B.; Janowicz, K.; Mai, G.; Gao, S. From itdl to place2vec: Reasoning about place type similarity and relatedness by learning embeddings from augmented spatial contexts. In Proceedings of the 25th ACM SIGSPATIAL International Conference on Advances in Geographic Information Systems, Redondo Beach, CA, USA, 7–10 November 2017. [Google Scholar]
- Zhai, W.; Bai, X.; Shi, Y.; Han, Y.; Peng, Z.-R.; Gu, C. Beyond Word2vec: An approach for urban functional region extraction and identification by combining Place2vec and POIs. Comput. Environ. Urban. Syst. 2019, 74, 1–12. [Google Scholar] [CrossRef]
- Feng, S.; Cong, G.; An, B.; Chee, Y.M. Poi2vec: Geographical latent representation for predicting future visitors. In Proceedings of the Thirty-First AAAI Conference on Artificial Intelligence, San Francisco, CA, USA, 4–9 February 2017. [Google Scholar]
- Yao, Y.; Li, X.; Liu, X.; Liu, P.; Liang, Z.; Zhang, J.; Mai, K. Sensing spatial distribution of urban land use by integrating points-of-interest and Google Word2Vec model. Int. J. Geogr. Inf. Sci. 2017, 31, 825–848. [Google Scholar] [CrossRef]
- Chen, C.; Jiao, S.; Zhang, S.; Liu, W.; Feng, L.; Wang, Y. TripImputor: Real-Time Imputing Taxi Trip Purpose Leveraging Multi-Sourced Urban Data. IEEE Trans. Intell. Transp. Syst. 2018, 19, 3292–3304. [Google Scholar] [CrossRef]
- Meng, C.; Cui, Y.; He, Q.; Su, L.; Gao, J. Travel purpose inference with GPS trajectories, POIs, and geo-tagged social media data. In Proceedings of the 2017 IEEE International Conference on Big Data, Boston, MA, USA, 11–14 December 2017. [Google Scholar]
- Zhang, Z.; He, Q.; Zhu, S. Potentials of using social media to infer the longitudinal travel behavior: A sequential model-based clustering method. Transp. Res. Part C Emerg. Technol. 2017, 85, 396–414. [Google Scholar] [CrossRef]
- Buck, D.; Buehler, R.; Happ, P.; Rawls, B.; Chung, P.; Borecki, N. Are bikeshare users different from regular cyclists? A first look at short-term users, annual members, and area cyclists in the Washington, DC, region. Transp. Res. Record 2013, 2387, 112–119. [Google Scholar] [CrossRef]
- Fishman, E.; Washington, S.; Haworth, N.; Watson, A. Factors influencing bike share membership: An analysis of Melbourne and Brisbane. Transp. Res. Part A Policy Pract. 2015, 71, 17–30. [Google Scholar] [CrossRef] [Green Version]
- Campbell, A.A.; Cherry, C.R.; Ryerson, M.S.; Yang, X. Factors influencing the choice of shared bicycles and shared electric bikes in Beijing. Transp. Res. Part C Emerg. Technol. 2016, 67, 399–414. [Google Scholar] [CrossRef] [Green Version]
- Chen, C.; Liao, C.; Xie, X.; Wang, Y.; Zhao, J. Trip2Vec: A deep embedding approach for clustering and profiling taxi trip purposes. Pers. Ubiquitous Comput. 2018, 23, 53–66. [Google Scholar] [CrossRef]
- Gao, S.; Yan, B. Place2Vec: Visualizing and Reasoning About Place Type Similarity and Relatedness by Learning Context Embeddings. In Proceedings of the Adjunct Proceedings of the 14th International Conference on Location Based Services, Zurich, Switzerland, 15–17 January 2018. [Google Scholar]
- Liu, K.; Gao, S.; Qiu, P.; Liu, X.; Yan, B.; Lu, F. Road2Vec: Measuring Traffic Interactions in Urban Road System from Massive Travel Routes. ISPRS Int. J. Geo-Inform. 2017, 6, 321. [Google Scholar] [CrossRef] [Green Version]
- Crivellari, A.; Beinat, E. From Motion Activity to Geo-Embeddings: Generating and Exploring Vector Representations of Locations, Traces and Visitors through Large-Scale Mobility Data. ISPRS Int. J. Geo-Inform. 2019, 8, 134. [Google Scholar] [CrossRef] [Green Version]
- Liu, X.; Andris, C.; Rahimi, S. Place niche and its regional variability: Measuring spatial context patterns for points of interest with representation learning. Comput. Environ. Urban. Syst. 2019, 75, 146–160. [Google Scholar] [CrossRef]
- Jin, J.; Xiao, Z.; Qiu, Q.; Fang, J. A Geohash Based Place2vec Model. In Proceedings of the IGARSS 2019—2019 IEEE International Geoscience and Remote Sensing Symposium, Yokohama, Japan, 28 July–2 August 2019. [Google Scholar]
- Faghih-Imani, A.; Eluru, N. Incorporating the impact of spatio-temporal interactions on bicycle sharing system demand: A case study of New York CitiBike system. J. Transp. Geogr. 2016, 54, 218–227. [Google Scholar] [CrossRef]
- Pewresearch. Available online: https://www.pewresearch.org/global/2019/02/05/smartphone-ownership-is-growing-rapidly-around-the-world-but-not-always-equally (accessed on 15 April 2021).
- KOSTAT. Available online: http://sgis.kostat.go.kr (accessed on 15 April 2021).
- Wu, J.; Jiang, C.; Houston, D.; Baker, D.; Delfino, R. Automated time activity classification based on global positioning system (GPS) tracking data. Environ. Health 2011, 10, 101. [Google Scholar] [CrossRef] [PubMed] [Green Version]
- Lu, Y.; Liu, Y. Pervasive location acquisition technologies: Opportunities and challenges for geospatial studies. Comput. Environ. Urban. Syst. 2012, 36, 105–108. [Google Scholar] [CrossRef]
- Kim, Y.; Pereira, F.C.; Zhao, F.; Ghorpade, A.; Zegras, P.C.; Ben-Akiva, M. Activity recognition for a smartphone and web based travel survey. arXiv 2015, arXiv:1502.03634 2015. [Google Scholar]
- Oliveira, M.G.S.; Vovsha, P.; Wolf, J.; Mitchell, M. Evaluation of Two Methods for Identifying Trip Purpose in GPS-Based Household Travel Surveys. Transp. Res. Rec. J. Transp. Res. Board 2014, 2405, 33–41. [Google Scholar] [CrossRef]
- Diaz-Uriarte, R.; De Andrés, S.A. Gene selection and classification of microarray data using random forest. BMC Bioinform. 2006, 7, 3. [Google Scholar] [CrossRef] [Green Version]
- Gong, L.; Liu, X.; Wu, L.; Liu, Y. Inferring trip purposes and uncovering travel patterns from taxi trajectory data. Cartogr. Geogr. Inf. Sci. 2016, 43, 103–114. [Google Scholar] [CrossRef]
Figure 1.
Flow chart of the proposed bike trip purpose inference method.

Figure 2.
Word embedding vs. POI type embedding.
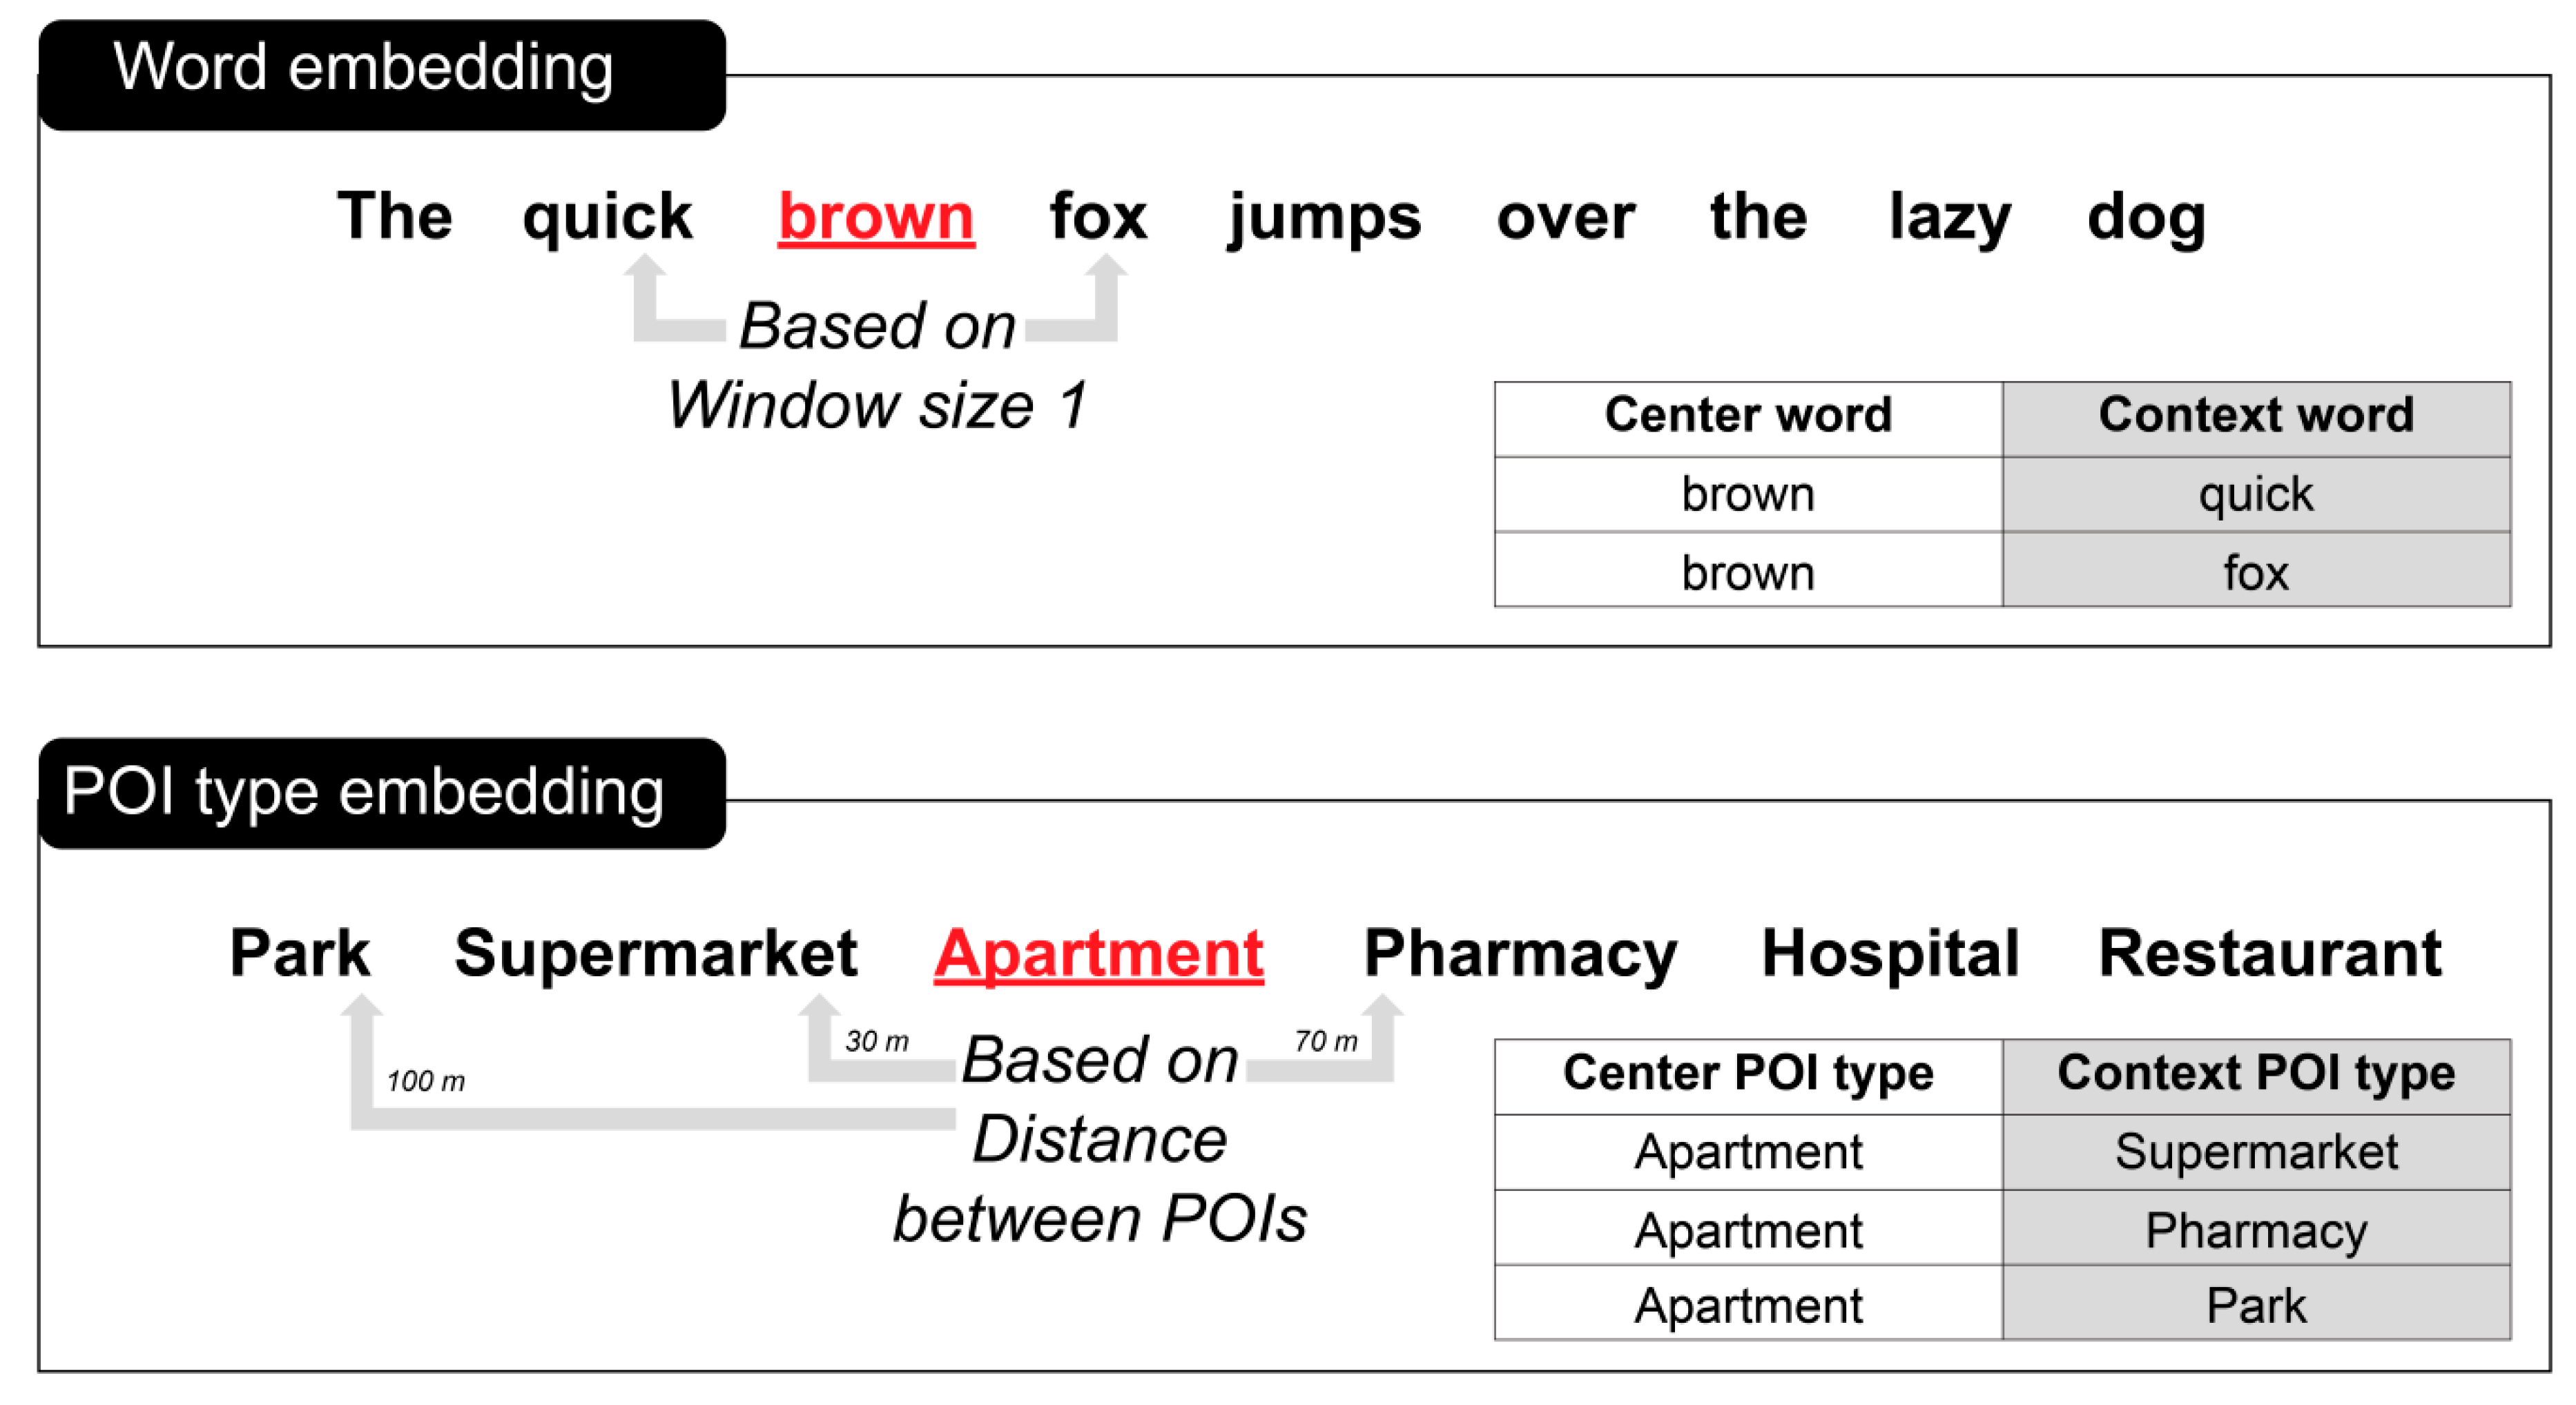
Figure 3.
Composition of a POI tuple pair at a bike station.
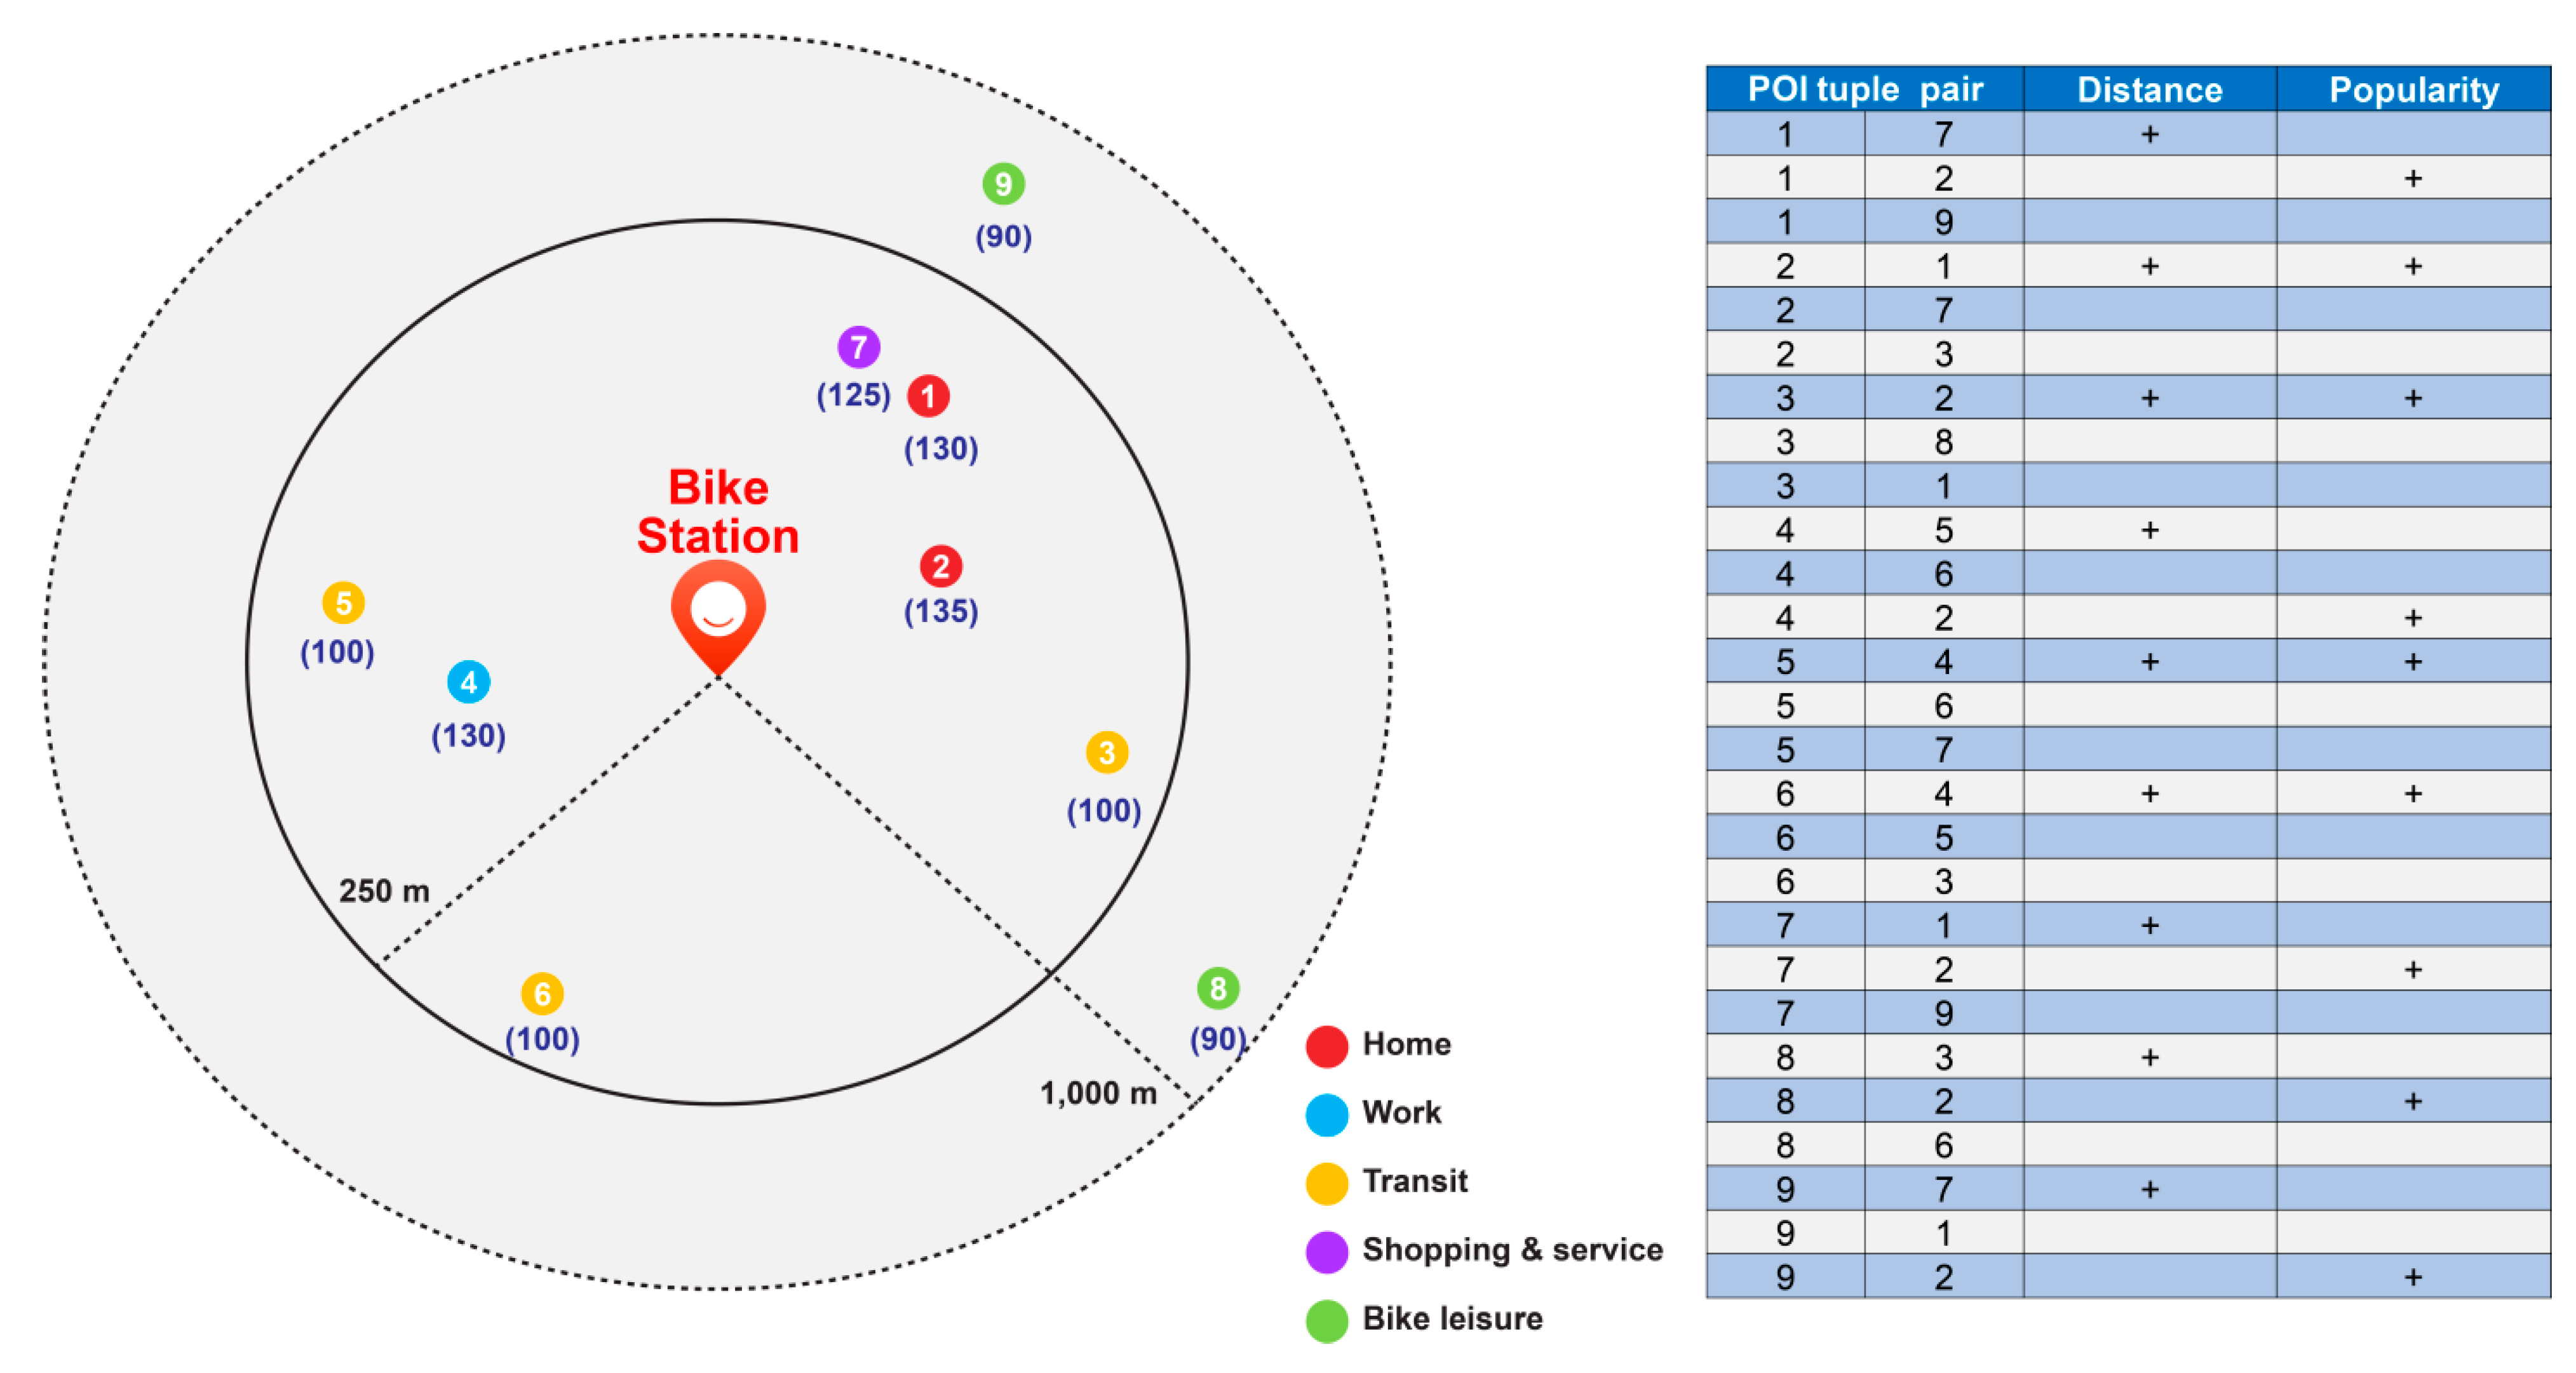
Figure 4.
Standardization of different space units into mesh data.

Figure 5.
Standardization method using building floor area data.

Figure 6.
Method for extracting the bike trip purpose using mobile data and POI data.

Figure 7.
Results of the elbow technique for determining the optimal number of clusters.

Figure 8.
Results of the final clustering.

Figure 9.
Visualization of POI distributions within a cluster.

Table 1.
Previous studies related to trip purpose inference.
| Author | Object (Transportation Mode) | Data | Method | Accuracy(%) | Ground Truth | Research Domain 5 |
|---|---|---|---|---|---|---|
| Ermagun et al. [14] | People | TBI 1 survey, POI data | Random forest | 64.17 | TBI survey | |
| Meng et al. [29] | People | CHTS 2 survey, POI data, Social media (Twitter) | Dynamic Bayesian network | 87.8 | CHTS survey | TS 6 |
| Bao et al. [1] | Bikes | Smart card data, POI data | k-means, LDA | - | - | |
| Cui et al. [13] | People | CHTS survey, POI data, Social media (Twitter) | Bayesian neural network | 90.52 | CHTS survey | TS |
| Alsger et al. [17] | Public transports (subways, buses) | HTS 3 survey, OD 4 survey, Smart card data, land use data, etc. | Rule-based methods | 78 | HTS survey | |
| Chen et al. [34] | Taxis | Taxi GPS data, POI data | Auto encoder, k-means | - | - | HG 7 |
| Xing et al. [2] | Bikes | Mobike data, POI data | k-means++ | - | - |
1 TBI: Travel Behavior Inventory; 2 CHTS: California Household Travel Survey; 3 HTS: Household Travel Survey; 4 OD: origin–destination; 5 research domain: categorized by Nguyen et al. [17]; 6 TS: transportation science; 7 HG: human geography.
Table 2.
Previous studies related to POI embedding.
| Author | Data | Number of POI Types | Method of Spatial Context Augmentation | Embedding Method | Embedding Dimension |
|---|---|---|---|---|---|
| Yan et al. [24] | Yelp POI data | 22 | ITDL 1 | Skip-gram | 70 |
| Yao et al. [27] | Baidu Maps POI data | 419 | Distance | CBOW 2 | 200 |
| Zhai et al. [25] | Baidu Maps POI data | 22 | Distance | Skip-gram | 70 |
| Liu et al. [39] | Yelp POI data | 842 | Distance | Skip-gram | - |
| Jin et al. [40] | YIWUGOU Shop data | - | Shop and product | Skip-gram | - |
| Liu et al. [23] | Gaode Maps POI data | 488 | Distance | Skip-gram | 100 |
1 ITDL: information-theoretic, distance lagged; 2 CBOW: continuous bag of words.
Table 3.
Trip purpose classifications in previous studies and the present study.
| Author | Object (Transportation Mode) | Trip Purpose Classes | Number of Classes |
|---|---|---|---|
| Ermagun et al. [14] | People | Education, shopping, social recreation and community, eating out, personal business | 5 |
| Meng et al. [29] | People | Education, shopping, eating out, recreation, personal, transportation | 6 |
| Bao et al. [1] | Bike | Home, eating, leisure, shopping, transport, education | 6 |
| Alsger et al. [17] | Public transport | Work, education, shopping, recreation, home | 5 |
| Chen et al. [34] | Taxi | Dining, recreation, work, homing, others | 5 |
| Zhao et al. [10] | Bike | (Land use) residence, work, consumption, transit | 4 |
| This study | Bike | Home, work, education, transit, dining, shopping and service, leisure, bike leisure | 8 |
Table 4.
Confusion matrix.
| Actual Class | |||
|---|---|---|---|
| 0 | 1 | ||
| Predicted class | 0 | True negative (TN) | False negative (FN) |
| 1 | False positive (FP) | True positive (TP) | |
Table 5.
Reorganized POI type for inference of bike trip purpose.
| Bike Trip Purpose | POI Type | Location Radius |
|---|---|---|
| Home | Apartment, row house | 250 m |
| Work | Police station, industrial complex corporation, financial institution, company, embassy, town office, broadcasting station, court prosecutor’s office, foreign mission | 250 m |
| Education | University, library, cultural center, museum, school, academy, kindergarten | 250 m |
| Transit | Airport, bus stop, parking lot, subway station, railway station, taxi stop, terminal | 250 m |
| Shopping and service | Other facility, facility in the complex, large shopping mall, shopping center, bookstore, repair shop, gas station | 250 m |
| Dining | Restaurant, cafe | 250 m |
| Leisure | Stadium, golf course, church, fishing ground, cemetery, cultural property, mountain, lodging facility, movie theater, wedding hall, hot spring, temple, river, port, beach, rest area | 250 m |
| Bike leisure | Parks, amusement parks, leisure sports | 1000 m |
Table 6.
Embedding values according to POI type.
| POI Type | Embedding Values (70 Dimensions) |
|---|---|
| Home | 1.4437118, −0.49141836, 0.37585074, 1.2514722, ……, −0.008957267, 0.43792307 |
| Work | −0.4497794, 1.2613311, −1.0206449, −0.18877816, ………, 2.1714773, 1.7034453 |
| Education | 2.1038136, −1.1537447, 1.9189929, −0.13579279, …………, −1.3273395, 1.3194451 |
| Transit | 0.7793237, 1.3215489, 1.6597316, 1.5443871, …………, 0.22104016, −0.8933525 |
| Shopping and service | 1.4498143, 1.2004231, 0.3364074, −0.8220532, …………, −0.13508117, 0.29791373 |
| Dining | 0.75449663, 0.02276361, −1.2446628, −2.0252762, ………, 1.1871392, −0.5045676 |
| Leisure | −0.22978044, 1.8953556, 0.82838845, −0.100471795, ……, 1.3570645, −1.5268697 |
| Bike leisure | 1.2568898, −0.005698264, 0.6222984, 0.88474447, ……, −1.7393752, −0.40834773 |
Table 7.
Feature selection for bike trip purpose inference.
| Division | Feature Name | Data Representation |
|---|---|---|
| Feature 1 | Riding day | 1 (workday), 0 (non-workday) |
| Feature 2 | Time zone of origin | 0, 1, 2, 3, ……, 23 |
| Feature 3 | Land use at origin | 1, 2, 3, 4 |
| Feature 4 | Time zone of destination | 0, 1, 2, 3, ……, 23 |
| Feature 5 | Land use at destination | 1, 2, 3, 4 |
| Feature 6 | Trip time between origin and destination | (ex) 2 h |
| Feature 7 | Trip distance between origin and destination | (ex) 20,000 m |
| Feature 8 | POI distance between origin and destination | (ex) 0 m |
Table 8.
Confusion matrix for statistical evaluation.
| Actual Class | |||||||||
|---|---|---|---|---|---|---|---|---|---|
| Target | H | W | E | T | S | D | L | BL | Total |
| Home | 3016 | 286 | 14 | 100 | 722 | 54 | 214 | 42 | 4448 |
| Work | 240 | 7008 | 36 | 224 | 968 | 232 | 8 | 20 | 8736 |
| Education | 24 | 36 | 284 | 14 | 276 | 30 | 16 | - | 680 |
| Transit | 82 | 276 | 14 | 1686 | 248 | 20 | 2 | 26 | 2354 |
| Shopping and service | 634 | 1004 | 238 | 178 | 21,182 | 892 | 342 | 86 | 24,556 |
| Dining | 70 | 282 | 54 | 24 | 1042 | 2250 | 20 | - | 3742 |
| Leisure | 154 | 6 | 2 | - | 272 | 32 | 794 | - | 1260 |
| Bike Leisure | 68 | 22 | - | 12 | 64 | - | - | 240 | 406 |
| Total | 4288 | 8920 | 642 | 2238 | 24,774 | 3510 | 1396 | 414 | 46,182 |
NB: The notations in the column headings correspond to the bike trip purposes in each column, in the same order.
Publisher’s Note: MDPI stays neutral with regard to jurisdictional claims in published maps and institutional affiliations. |
© 2021 by the authors. Licensee MDPI, Basel, Switzerland. This article is an open access article distributed under the terms and conditions of the Creative Commons Attribution (CC BY) license (https://creativecommons.org/licenses/by/4.0/).
Share and Cite
MDPI and ACS Style
Lee, J.; Yu, K.; Kim, J. Public Bike Trip Purpose Inference Using Point-of-Interest Data. ISPRS Int. J. Geo-Inf. 2021, 10, 352. https://0-doi-org.brum.beds.ac.uk/10.3390/ijgi10050352
AMA Style
Lee J, Yu K, Kim J. Public Bike Trip Purpose Inference Using Point-of-Interest Data. ISPRS International Journal of Geo-Information. 2021; 10(5):352. https://0-doi-org.brum.beds.ac.uk/10.3390/ijgi10050352
Chicago/Turabian StyleLee, Jiwon, Kiyun Yu, and Jiyoung Kim. 2021. "Public Bike Trip Purpose Inference Using Point-of-Interest Data" ISPRS International Journal of Geo-Information 10, no. 5: 352. https://0-doi-org.brum.beds.ac.uk/10.3390/ijgi10050352
Note that from the first issue of 2016, this journal uses article numbers instead of page numbers. See further details here.