Article

Using Geographically Weighted Regression to Study the Seasonal Influence of Potential Risk Factors on the Incidence of HFMD on the Chinese Mainland

1
School of Earth Sciences, Zhejiang University, 38 Zheda Road, Hangzhou 310027, China
2
Zhejiang Provincial Key Laboratory of Geographic Information Science, 148 Tianmushan Road, Hangzhou 310028, China
3
Center of Agricultural and Rural Development, School of Public Affairs, Zhejiang University, Hangzhou 310058, China
*
Author to whom correspondence should be addressed.
ISPRS Int. J. Geo-Inf. 2021, 10(7), 448; https://0-doi-org.brum.beds.ac.uk/10.3390/ijgi10070448
Submission received: 30 March 2021 / Revised: 9 June 2021 / Accepted: 25 June 2021 / Published: 30 June 2021
(This article belongs to the Special Issue Geo-Information Applications in Active Mobility and Health in Cities)

Abstract

:
Hand, foot, and mouth disease (HFMD) is an epidemic infectious disease in China. Its incidence is affected by a variety of natural environmental and socioeconomic factors, and its transmission has strong seasonal and spatial heterogeneity. To quantify the spatial relationship between the incidence of HFMD (I-HFMD) and eight potential risk factors (temperature, humidity, precipitation, wind speed, air pressure, altitude, child population density, and per capita GDP) on the Chinese mainland, we established a geographically weighted regression (GWR) model to analyze their impacts in different seasons and provinces. The GWR model successfully describes the spatial changes of the influence of potential risks, and shows greatly improved estimation performance compared with the ordinary linear regression (OLR) method. Our findings help to understand the seasonally and spatially relevant effects of natural environmental and socioeconomic factors on the I-HFMD, and can provide information to be used to develop effective prevention strategies against HFMD at different locations and in different seasons.

1. Introduction

Hand, foot, and mouth disease (HFMD) is a common infectious disease that is usually found in children under 5 years old. This disease is caused by viruses, such as Human enterovirus 71 (EV71) and Coxsackie virus A16 strain (CoxA16), and can result in symptoms in the hand, mouth, or foot, including fever, blisters, and ulcers [1]. In most cases, the disease is mild and self-limiting, but severe neurological symptoms, such as meningitis, encephalitis, poliomyelitis (such as paralysis), and pulmonary edema may occur, especially in patients aged 5 or under [2]. Surveillance data from 2008 to 2017 show that the incidence of HFMD (I-HFMD) was considerably high and that the high-risk areas were mainly in central, southern, and eastern China [3]. A large number of epidemiological studies on HFMD have been carried out in provinces with a high I-HFMD, such as Guangdong [4,5,6], Sichuan [7], Henan [8,9], and Shandong [10].
Many studies have indicated that the I-HFMD is strongly related to socioeconomic factors and natural environmental factors, such as temperature [1,11,12,13,14], precipitation [1,5,15,16], humidity [13,14,15,16,17], altitude [18], wind speed [1,19], air pressure [20], child population density [21,22] and per capita GDP [23,24,25,26]. Quantifying the influence of potential risk factors on the I-HFMD is conducive to the prevention and treatment of the disease. Most studies of HFMD have used exploratory data analysis methods to analyze the spatial distribution of HFMD in the form of graphs and tables, or classical data models to predict HFMD and estimate its potential risk factors, for which the model types mainly include dynamic models [27,28,29], linear regression models [5,14], seasonal moving average models [24,30], and Bayes networks [24].
Current studies have generally used datasets derived from disease surveillance systems with spatiotemporal information. As the classical data model cannot effectively mine the geographical information in the HFMD monitoring data, some spatial statistical methods, such as the geographically weighted regression (GWR) model [21,22,31], have also been applied to study HFMD. However, these studies have mainly focused on a single dimension of time and space, rather than attempting a combined analysis on a large scale and in the long term. Furthermore, studies in China have mainly focused on a particular city or province and have usually adopted a time span of a single season or year.
Few studies have investigated the spatial and temporal effects of the I-HFMD across the entire Chinese mainland over the long term. Because the spread of HFMD in China can be quite large in scale and significantly seasonal over the long term, studying HFMD in a local area (e.g., a city or a province) over a short period (e.g., a season or a year) can reflect some local-level laws but not the spatiotemporal changes and their mechanisms across the entire Chinese mainland. In addition, due to the complex landform and vast area of the Chinese mainland, managing the spatiotemporal heterogeneity in this region is quite difficult and needs further investigation. Therefore, it is of great importance to study HFMD at the scale of the whole Chinese mainland, as this can capture more accurate and useful information on which to base suggestions for restraining the spread of HFMD in China. In this study, the spatial association between the I-HFMD and socioeconomic and natural environmental factors was therefore investigated to explore the potential spatiotemporal non-stationary characteristics of the hypothetical relationship between these factors and the I-HFMD in the Chinese mainland.
This study had three main objectives: (1) study the spatial and seasonal relationship between the I-HFMD and potential influencing factors based on monthly average data for 11 years in the Chinese mainland with 31 provinces; (2) construct the GWR model to estimate the I-HFMD in the Chinese mainland and compare its performance with the ordinary linear regression (OLR) model; and (3) analyze local heterogeneity and put forward appropriate measures to limit the I-HFMD in each season. Our article is organized as follows. In the second section, we describe the study area and dataset and introduce the methods of the spatial autocorrelation test and the GWR model. Section 3 and Section 4 describe the results of the GR model for I-HFMD estimation and analyze the seasonal characteristics of the influence of each potential risk factor. Finally, we draw conclusions and summarize the paper in Section 5.

2. Materials and Methods

2.1. Research Region and Data

The study area used in this study was the Chinese mainland, including 31 provinces (except Hong Kong, Macau, and Taiwan). The spatial measured unit was the provincial administrative unit, and the time span was from 2007 to 2017 with a time resolution of 1 month. The I-HFMD data were the monthly incidence data for each province, collected by the Chinese Center for Disease Control, Prevention and Health. The collected I-HFMD data were divided into four seasons with each season including 31 provinces and 36 months with more than 1000 records. The distribution of the cumulative incidence rate from 2007 to 2017 in each season for the 31 provinces of the Chinese mainland is shown in Figure 1. Northwestern, northeastern, northern and central China had a significantly low I-HFMD in the four seasons, whereas the I-HFMD in southwestern and southern China was relatively high. Furthermore, the I-HFMD of Guangxi, Hainan and Guangdong provinces were always among the highest in the country.
Many studies have shown that socioeconomic and natural environmental factors significantly affect the I-HFMD. This study analyzed six natural environmental factors and two socioeconomic factors as potential influences. The natural environmental factors were temperature (TEMP), precipitation (PREC), humidity (HU), altitude (ALT), wind speed (WS), and air pressure (AP). The socioeconomic factors were child population density (CHD) and per capita GDP (mGDP). The sources and details of the experimental data are shown in Table 1.
The values of TEMP, PREC, HU, AP, and WS were derived from the Chinese regional surface meteorological element-driven dataset of the China Qinghai-Tibet Plateau Scientific Data Center [32,33]. This dataset is based on the international Princeton reanalysis data, Global Land Data Assimilation System (GLDAS) data, Global Energy and Water Exchanges-Surface Radiation Budget (GEWEX-SRB) radiation data and Tropical Rainfall Measuring Mission (TRMM) precipitation data. It merges the conventional meteorological observation data of the China Meteorological Administration. The original data come from meteorological bureau observation data, reanalysis data, and remote sensing data. The values of non-physical range have been removed using ANU-Spline statistical interpolation. The accuracy of this dataset is between the meteorological bureau observation data and satellite remote sensing data, which is better than the international reanalysis data [32,33]. The obtained data were the monthly averages for China. We used the vector data at the province level in China to calculate the average values in the raster range of each province for the six environmental factors. ETOPO1 is a 1 arc-minute global relief model of Earth’s surface that integrates land topography and ocean bathymetry. ALT was calculated from the ETOPO1 data for each province. Data for the two socioeconomic variables (i.e., CHD and mGDP) were extracted from national statistical yearbooks and are accurate to the provincial administrative unit level.

2.2. Research Framework

The research framework of this study was as follows. First, we analyzed the correlation and multicollinearity of the potential risk factors. Second, we adopted Moran’s index to evaluate the spatial autocorrelation in the I-HFMD dataset. Third, we used the GWR model to study the spatial and seasonal heterogeneity of the relationship between the I-HFMD and potential risk factors. During the analysis, it was found that the independent and dependent variables had extreme values, which may have negative effects on the regression models, leaving the results susceptible to deviations. The five variables of PREC, ALT, CHD, mGDP and I-HFMD were therefore logarithmically transformed to reduce the influence of extreme values. Fourth, we optimized the bandwidth parameter of the GWR model and evaluated its accuracy. Fifth, we compared the performance of the GWR model with that of the OLR model in each season to evaluate its applicability and superiority. Sixth, we conducted statistical significance test of the GWR model to examine whether the spatially varying coefficients of the GWR model were statistically significant, and then analyze the influence characteristics of various factors on the I-HFMD over space in each season, providing an explanation and understanding of the spatial pattern and relationship between the I-HFMD and climate change, economic development, and changes in the child population on the Chinese mainland.

2.3. Methods

2.3.1. Correlation Analysis and Multicollinearity Test

The Pearson correlation test was used to explore the correlation of potential risks with the I-HFMD. This analysis was carried out in SPSS v.20 using the bilateral significance test. The Pearson correlation coefficient between two variables is defined as the quotient of the covariance and standard deviation, as follows:
ρ X , Y = c o v X , Y σ X σ Y = E X μ X Y μ Y σ X σ Y ,
where E X μ X Y μ Y is the covariance of X and Y, σ X ,   σ Y are the standard deviation of X, Y.
As the multicollinearity of independent variables will seriously affect the experimental results of regression models [34], the variance inflation factor (VIF) was used to measure the severity of multicollinearity in the regression models. The VIF value represents the quotient of the variance in a model with multiple terms by the variance of a model with one term alone, and is expressed as follows:
VIF = 1 1 R i 2 ,  
where R i is the multi-correlation coefficient of X i with others variable X j ( i j ).

2.3.2. Spatial Autocorrelation Test

To explore the spatial aggregation effect of HFMD, Moran’s index was adopted to evaluate the spatial autocorrelation in the I-HFMD dataset [35]. The Moran’s index value, along with the z-score and p-value, helps to evaluate the significance of the index, and is expressed as follows:
I = n S 0 i = 1 n j = 1 n w ij x i x ¯ x j x ¯ i = 1 n x i x ¯ 2 ,
          S 0 = i = 1 n j = 1 n w i j ,
where x i and x j are the attribute values of features i and j, x ¯ is the average of n cells’ attribute values; w i j is the spatial weight matrix.

2.3.3. Geographically Weighted Regression

The GWR model, extending from the OLR model, was used to study the relationship between potential risk factors and the I-HFMD. OLR is a traditional method of estimating global regression coefficients and does not change the coefficients by geographic location. The regression formula of the classic OLR model is expressed as follows:
I H F M D i = β 0 + k = 1 p β k x i k + ε i       i = 1 , 2 , , n ,
where y i and x i 1 , x i 2 , x i 3 , , x i p are the dependent variable and independent variables, respectively; β 0 , β 1 , β 2 , , β p are the regressive coefficients; and ε i is the error term. GWR extends OLR by allowing local estimates across space, and the form used in this study is the same as in [36,37,38]:
I H F M D i = β i 0 + β i 1 × H U i + β i 2 × T E M P i + β i 3 × P R E C i + β i 4 × W S i + β i 5 × A P i + β i 6 × A L T i + β i 7 × C H D i + β i 8 × m G D P i + ε i i = 1 , 2 , , n ,
where β i k denotes the series coefficients of point i . GWR captures the local effects through the spatially varying coefficients β i , calculated as follows:
β ^ i = ( X T W i X ) 1 X T W i I H F M D i ,
where W i is an n × n geographical weighting matrix with the diagonal elements representing non-stationary weights. A certain weight kernel of GWR should be specified to calculate the weight matrix. The widely used fixed Gaussian and adaptive bi-square weighting functions were adopted in our experiments. In addition, GWR was used with the corrected Akaike information criterion (AICc) value as its performance criterion to achieve the best model and was implemented in MATLAB 2013a. Two types of GWR model were tested in this study, as defined in Table 2, and their performance were compared with the OLR model for each season to evaluate the applicability.
It is usually necessary to examine whether the GWR results have significant spatial non-stationarity through diagnostic analysis. A F1-test based on the extremely approximate distribution of the residual square sums proposed by Leung [39] and Wu [40] was adopted to test the significance of the spatial non-stationarity in the GWR results.
Moreover, the local R 2 , which indicates how well the local regression model fits the I-HFMD, was used to represent the local fitting accuracy and was computed as follows [36]:
R i 2 = T S S w R S S w / T S S w ,
where T S S w is the geographically weighted total sum of squares, and R S S w is the geographically weighted residual sum of squares.

2.3.4. Model Evaluation

The following indices were used to evaluate model performance: determination coefficient ( R 2 ), root mean square error ( RMSE ), mean absolute error ( MAE ), mean absolute percentage error ( MAPE ), and AICc. The formula for each indicator is as follows [36,37,41]:
R 2 = 1 i = 1 n ( y i y ^ i ) 2 i = 1 n ( y i y ¯ i ) 2   ,
RMSE = i = 1 n ( y i y ^ i ) 2 n ,
MAE = i = 1 n y i y ^ i n ,  
MAPE = 1 n i = 1 n | y i y ^ i y i | × 100 % ,
AICc = n log e ( σ ^ 2 ) + n log e ( 2 π ) + n ( n + t r S n 2 t r S ) ,
where y ¯ represents the average of the observed values and σ ^ 2 is the mean square error of the model.

3. Results

3.1. Correlation Analysis and Multicollinearity Test

The results of the correlation analysis and significance test for each potential risk factor in the four seasons are shown in Table 3. All potential risk factors were significantly correlated with the I-HFMD in each season. Specifically, HU, TEMP, PREC, AP, CHD, and mGDP were positively related to the I-HFMD, whereas ALT was negatively related to the I-HFMD in each season. Notably, WS was positively related to the I-HFMD in spring and winter but negatively related to the I-HFMD in summer and autumn, suggesting significant temporal non-stationarity in the association between WS and the I-HFMD. In addition, CHD had the strongest correlation with the I-HFMD in spring (0.421), summer (0.420), and autumn (0.416), whereas mGDP had the strongest correlation with the I-HFMD in winter (0.402). Multicollinearity among all potential risk variables was tested using VIF values, as shown in Table 4. All VIF values were less than 10, suggesting that the eight potential risks did not show multicollinearity. Therefore, the subsequent regression analysis selected all potential risks as explanatory variables.

3.2. Diagnosis of Spatial Autocorrelation of the I-HFMD

To investigate the spatial autocorrelation of the I-HFMD, the global Moran’s index of the I-HFMD for each season was calculated by ArcGIS. Moran’s index was 0.89 (p < 0.01) in spring, −0.50 (p < 0.01) in summer, 0.32 (p < 0.01) in autumn, and 0.79 (p < 0.01) in winter, which indicates that the I-HFMD was spatially positively clustered in spring, autumn and winter but spatially negatively clustered in summer. In addition, Moran’s index of the I-HFMD for each season was statistically significant, indicating that there was strong spatial autocorrelation in the incidence rate. Thus, spatial regression models were likely to be needed to determine the relationship between the I-HFMD and potential risk factors.

3.3. Model Performance of OLR and GWR

Table 5 shows the model performance of OLR and GWR for I-HFMD estimation in the four seasons. GWR-AFG and GWR-AAB showed great improvements over the traditional global regression for all statistical indicators, benefiting from its consideration of spatial heterogeneity. The p-values of the F1 test also showed significant spatial non-stationarity in the estimated relationship. In addition, the estimation accuracy of the GWR model with adaptive bi-square kernel (GWR-AAB) was better than that of the GWR model with fixed Gaussian kernel (GWR-AFG) in spring, summer, and winter, but worse than that of GWR-AFG in autumn. This suggests that the adaptive kernel is more suitable than the fixed kernel to characterize the spatially non-stationary relationship between the I-HFMD and the eight potential risk factors, which is most likely a reflection of the complex landform and vast area of the Chinese mainland.
The better of the two GWR models was chosen in each season for analysis. The estimation accuracy (R2) for the four seasons increased from 60.01% with OLR to 75.47% with GWR-AAB in spring, from 29.09% with OLR to 68.95% with GWR-AAB in summer, from 39.35% with OLR to 76.29% with GWR-AFG in autumn, and from 56.46% with OLR to 78.04% with GWR-AAB in winter. Regarding other evaluation indices, the RMSE, MAE, MAPE, and AICc values of the GWR model were also considerably lower than those of the OLR model in each season.
For the statistically significant seasonal GWR model, the local R 2 values at the provincial level are shown in Figure 2. In Figure 2, the local R 2 values are distributed in the range 0.23–0.70, and winter and spring show higher local accuracy than summer and autumn. The distributions of local R 2 vary over time and space, which demonstrates the comprehensive statistical effect and fit accuracy of the influential risks on the I-HFMD. Most of the provinces of mainland China show robust estimation performance, indicating the well-fitted properties of the GWR model.

3.4. Statistical Significance Test of the GWR Model

The t-test, which indicates whether the spatially varying coefficients of the GWR model were statistically significant, was used to evaluate whether the influence of the potential risk factors on the I-HFMD was significant in each province [36,39]. According to the t-test table, an absolute value of the t-test of over 1.96 is statistically significant. The pass rate proposed by Hong [21], which was defined as the ratio between the number of statistically significant provinces and the total number of provinces, was adopted in our analysis. We calculated the pass rate of all potential risks in the four seasons and the results are shown in Table 6. If the pass rate is zero, it obviously suggests no statistical significance. According to previous studies, the pass rate was considered to be statistically significant if it was more than 35% [21,40]. Of the potential risks, mGDP had the highest pass rate, ranging from 48.4% to 100% in the four seasons. The pass rates of AP and ALT were over 40% in all seasons. The pass rates of HU and TEMP were not statistically significant in summer and autumn, and that of PREC was not statistically significant in spring and autumn. Furthermore, the pass rate of WS was not statistically significant in spring and that of CHD was not statistically significant in summer. Of the four seasons, summer had the lowest statistical significance with an average of 35.2%, whereas winter had the highest statistical significance with an average of 56.9%.

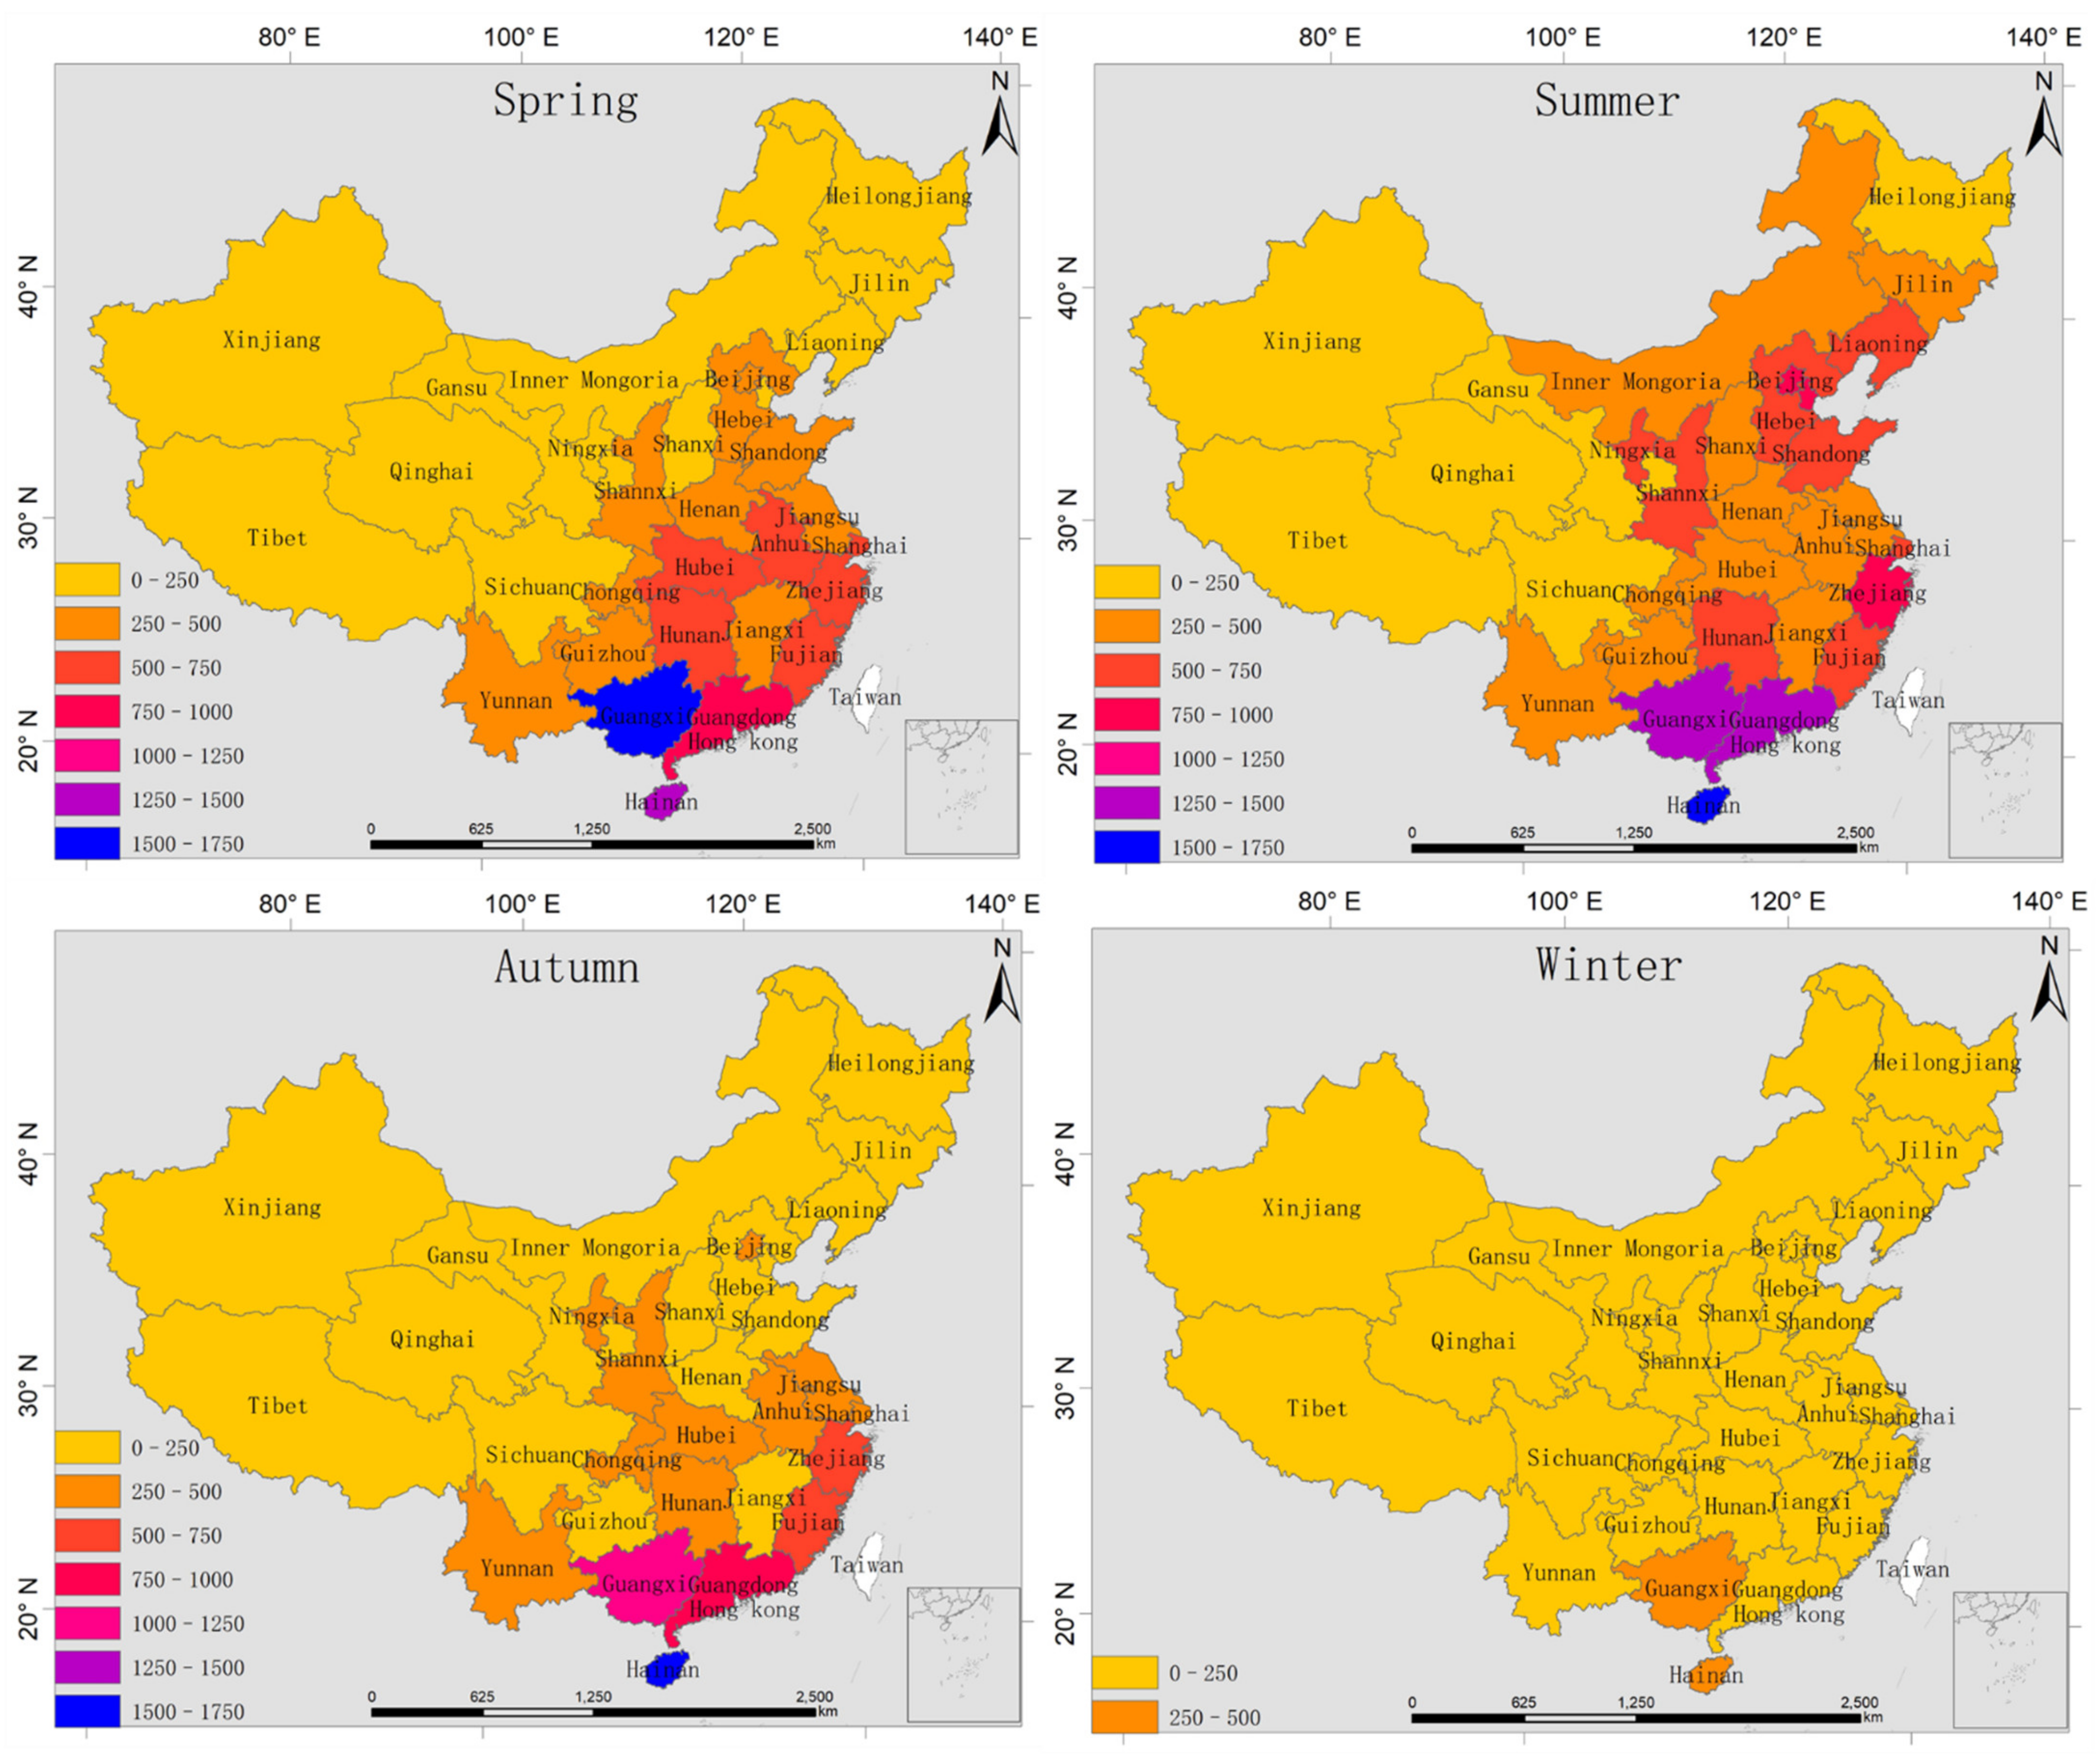
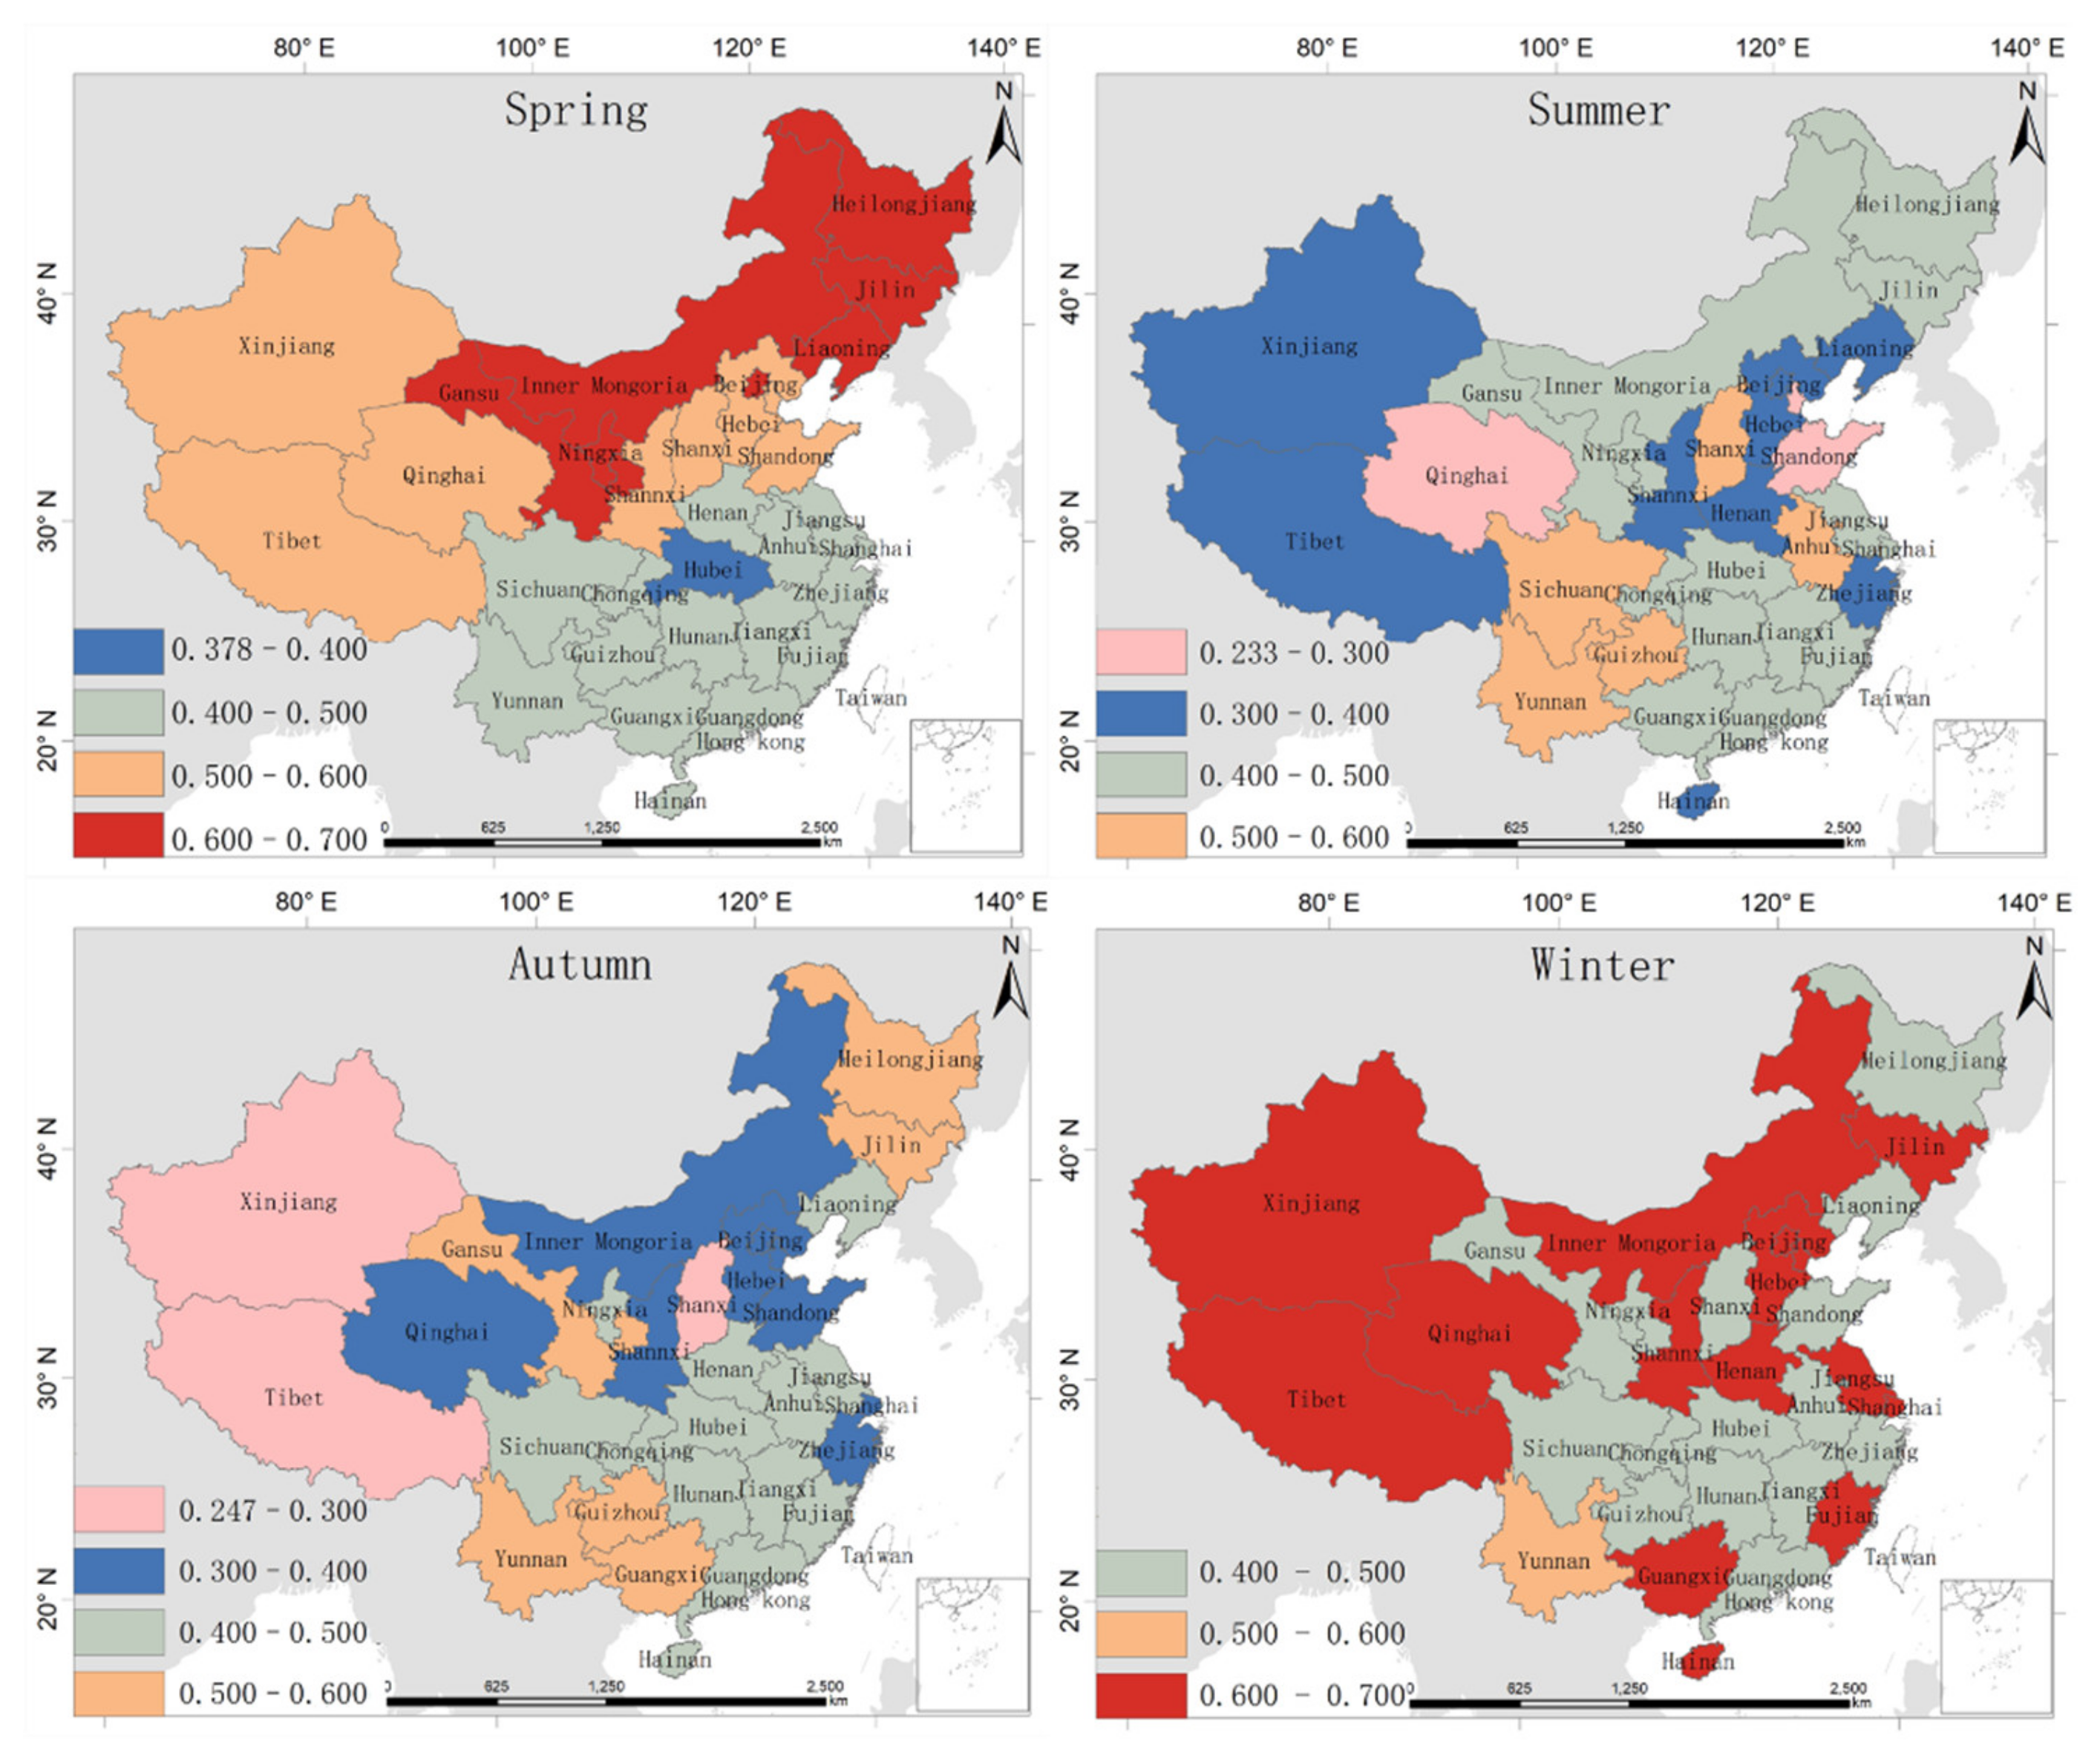
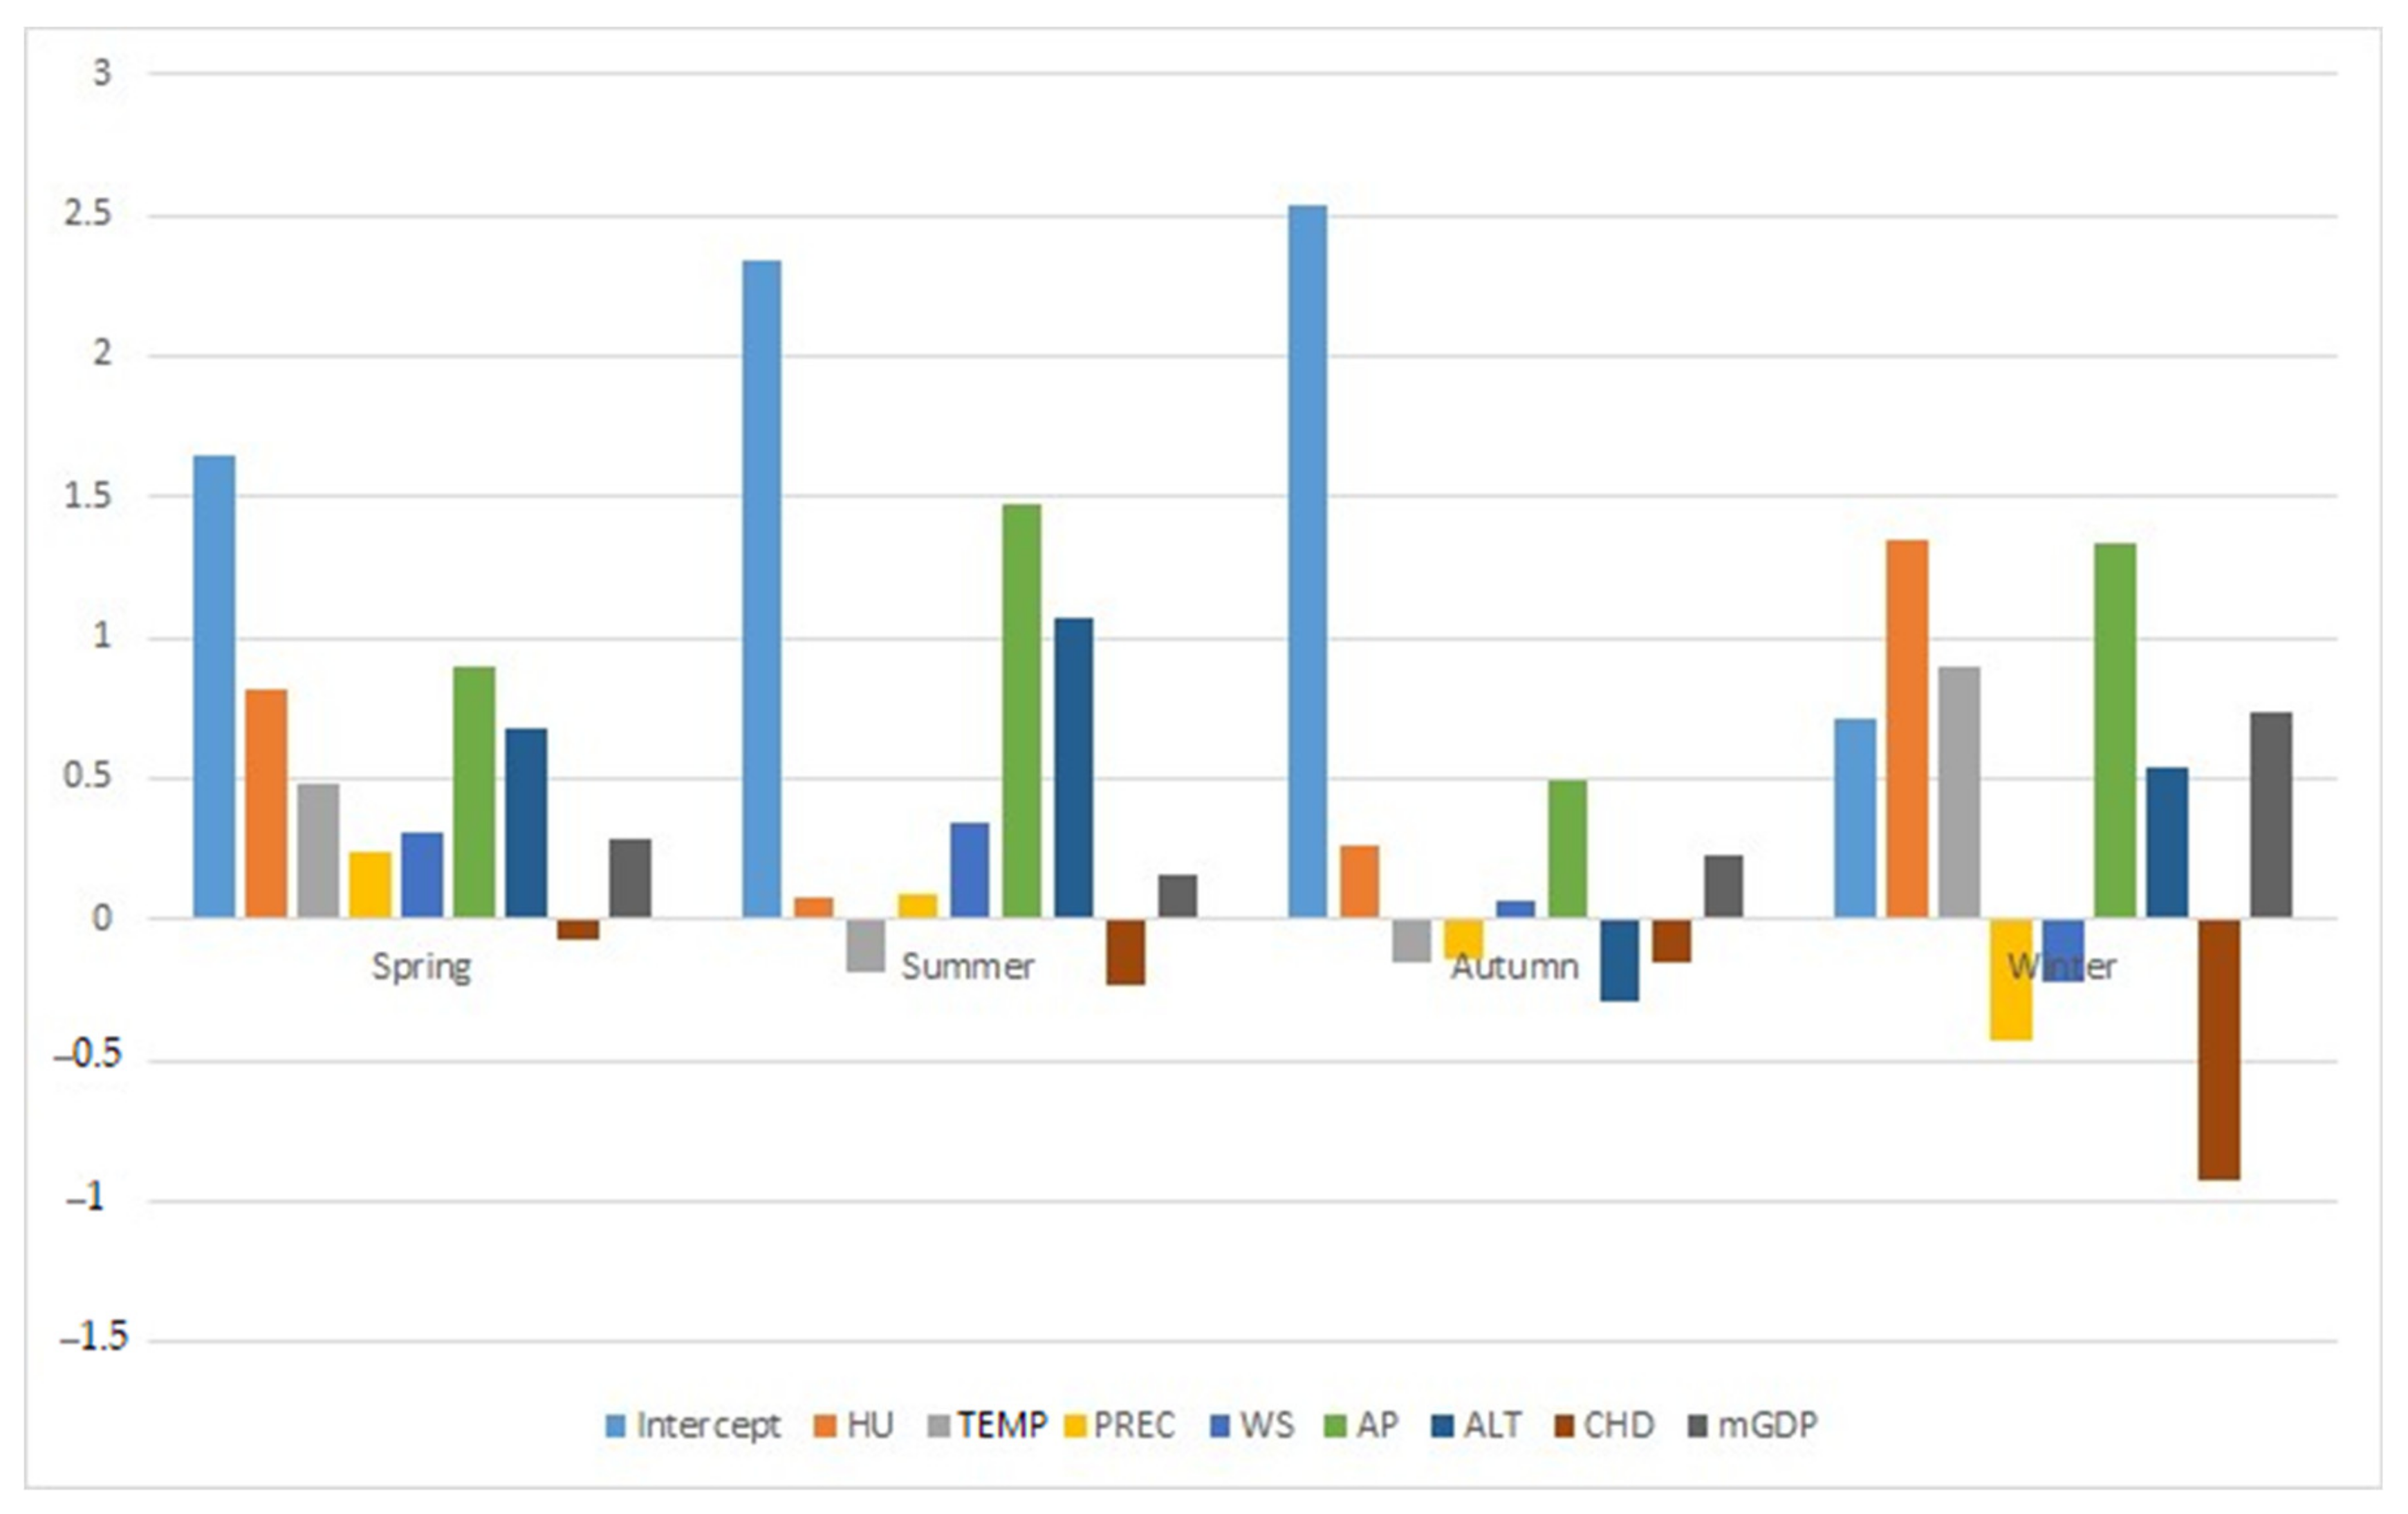
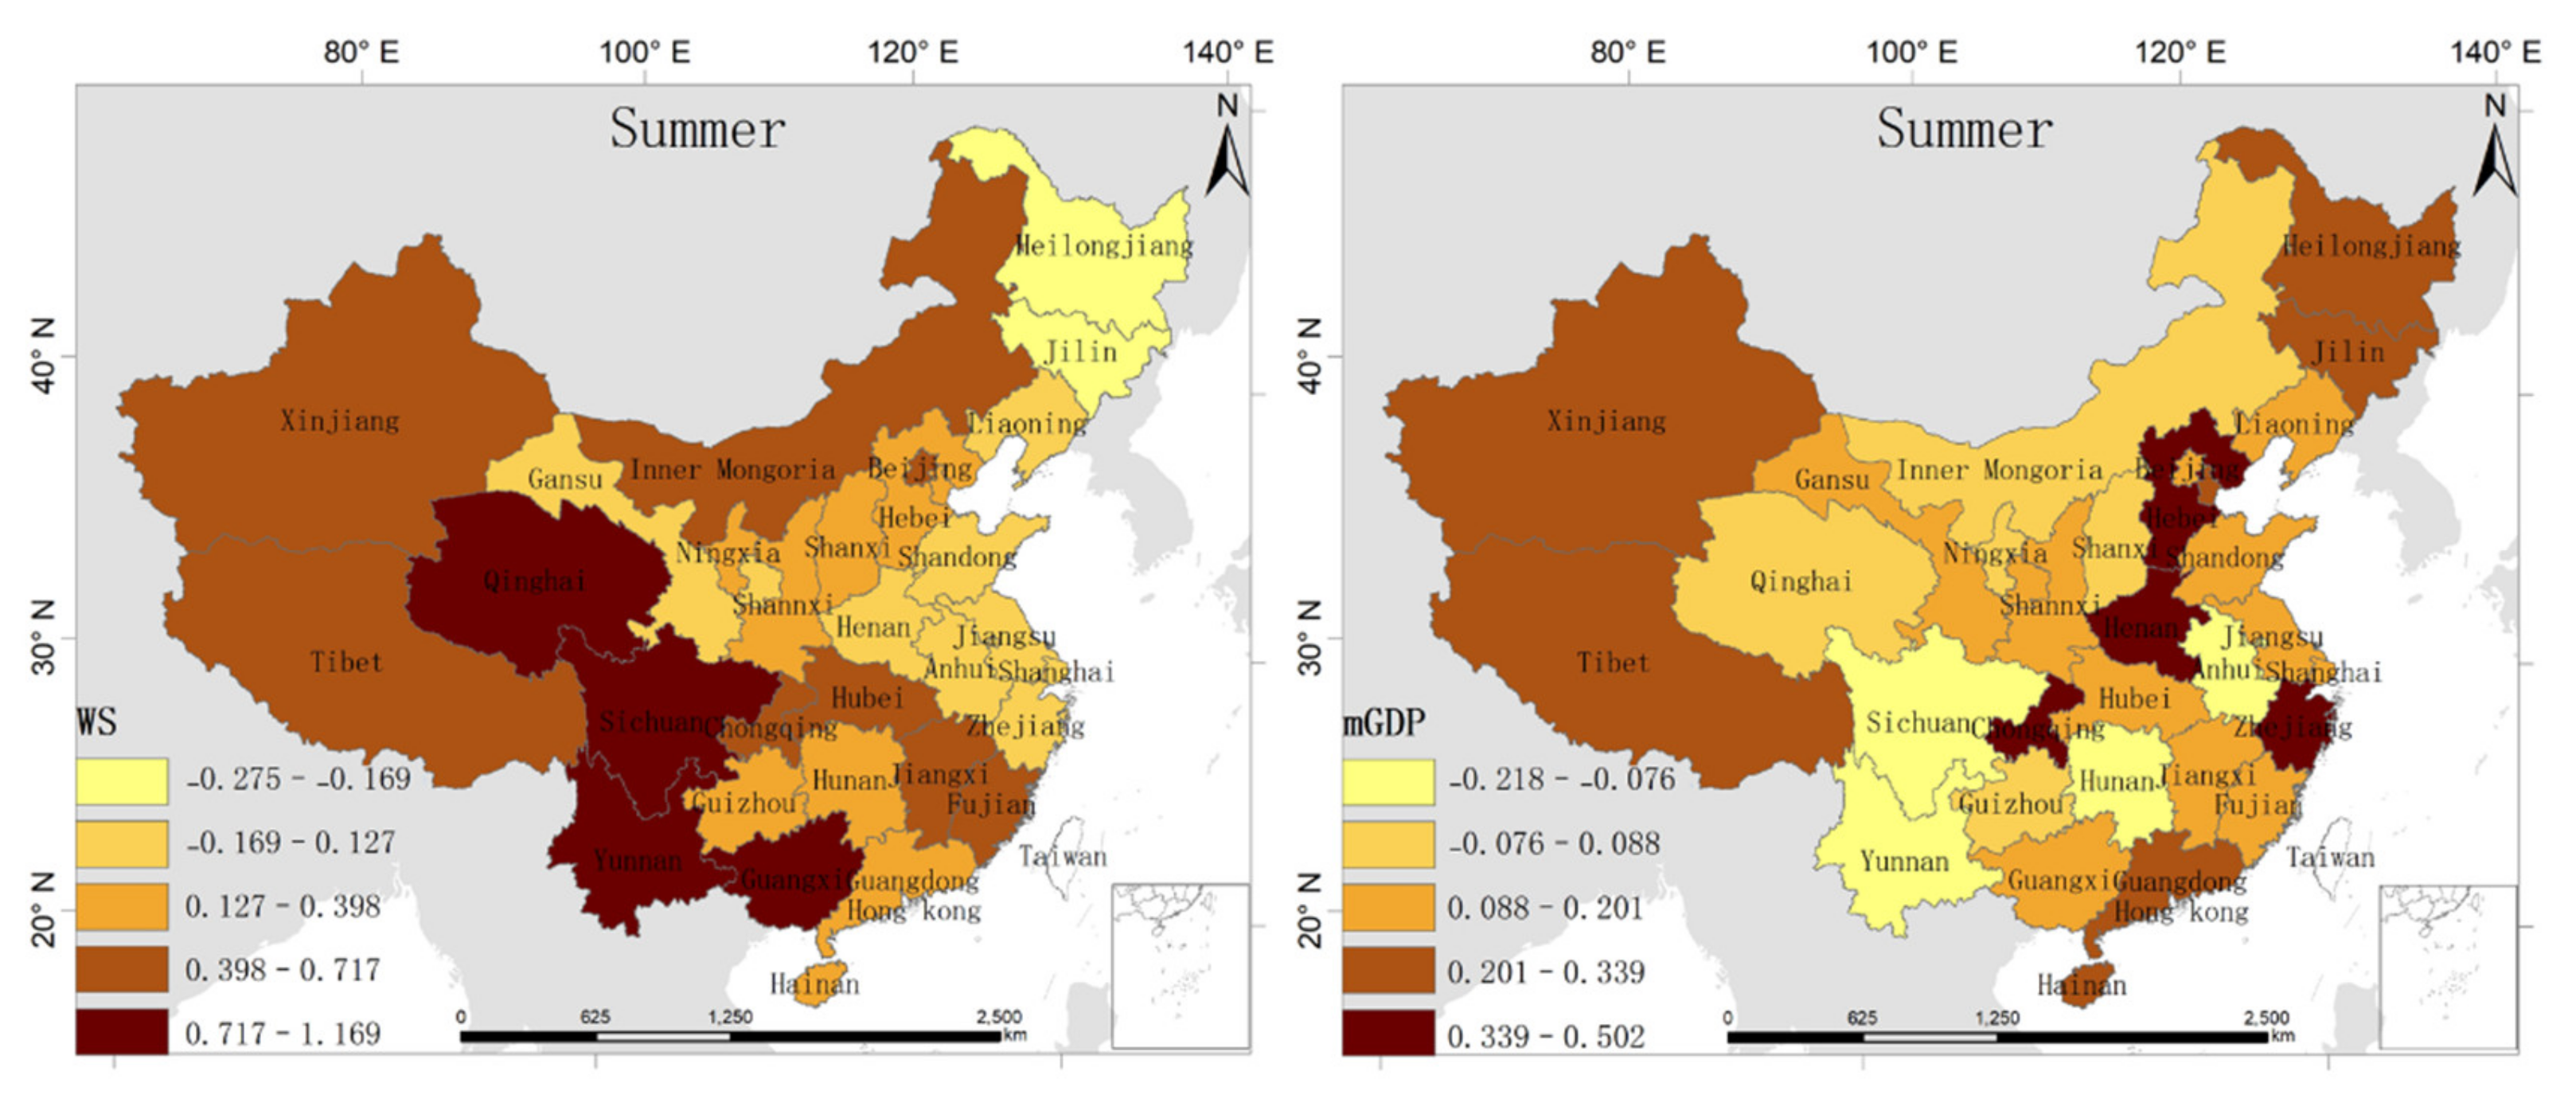
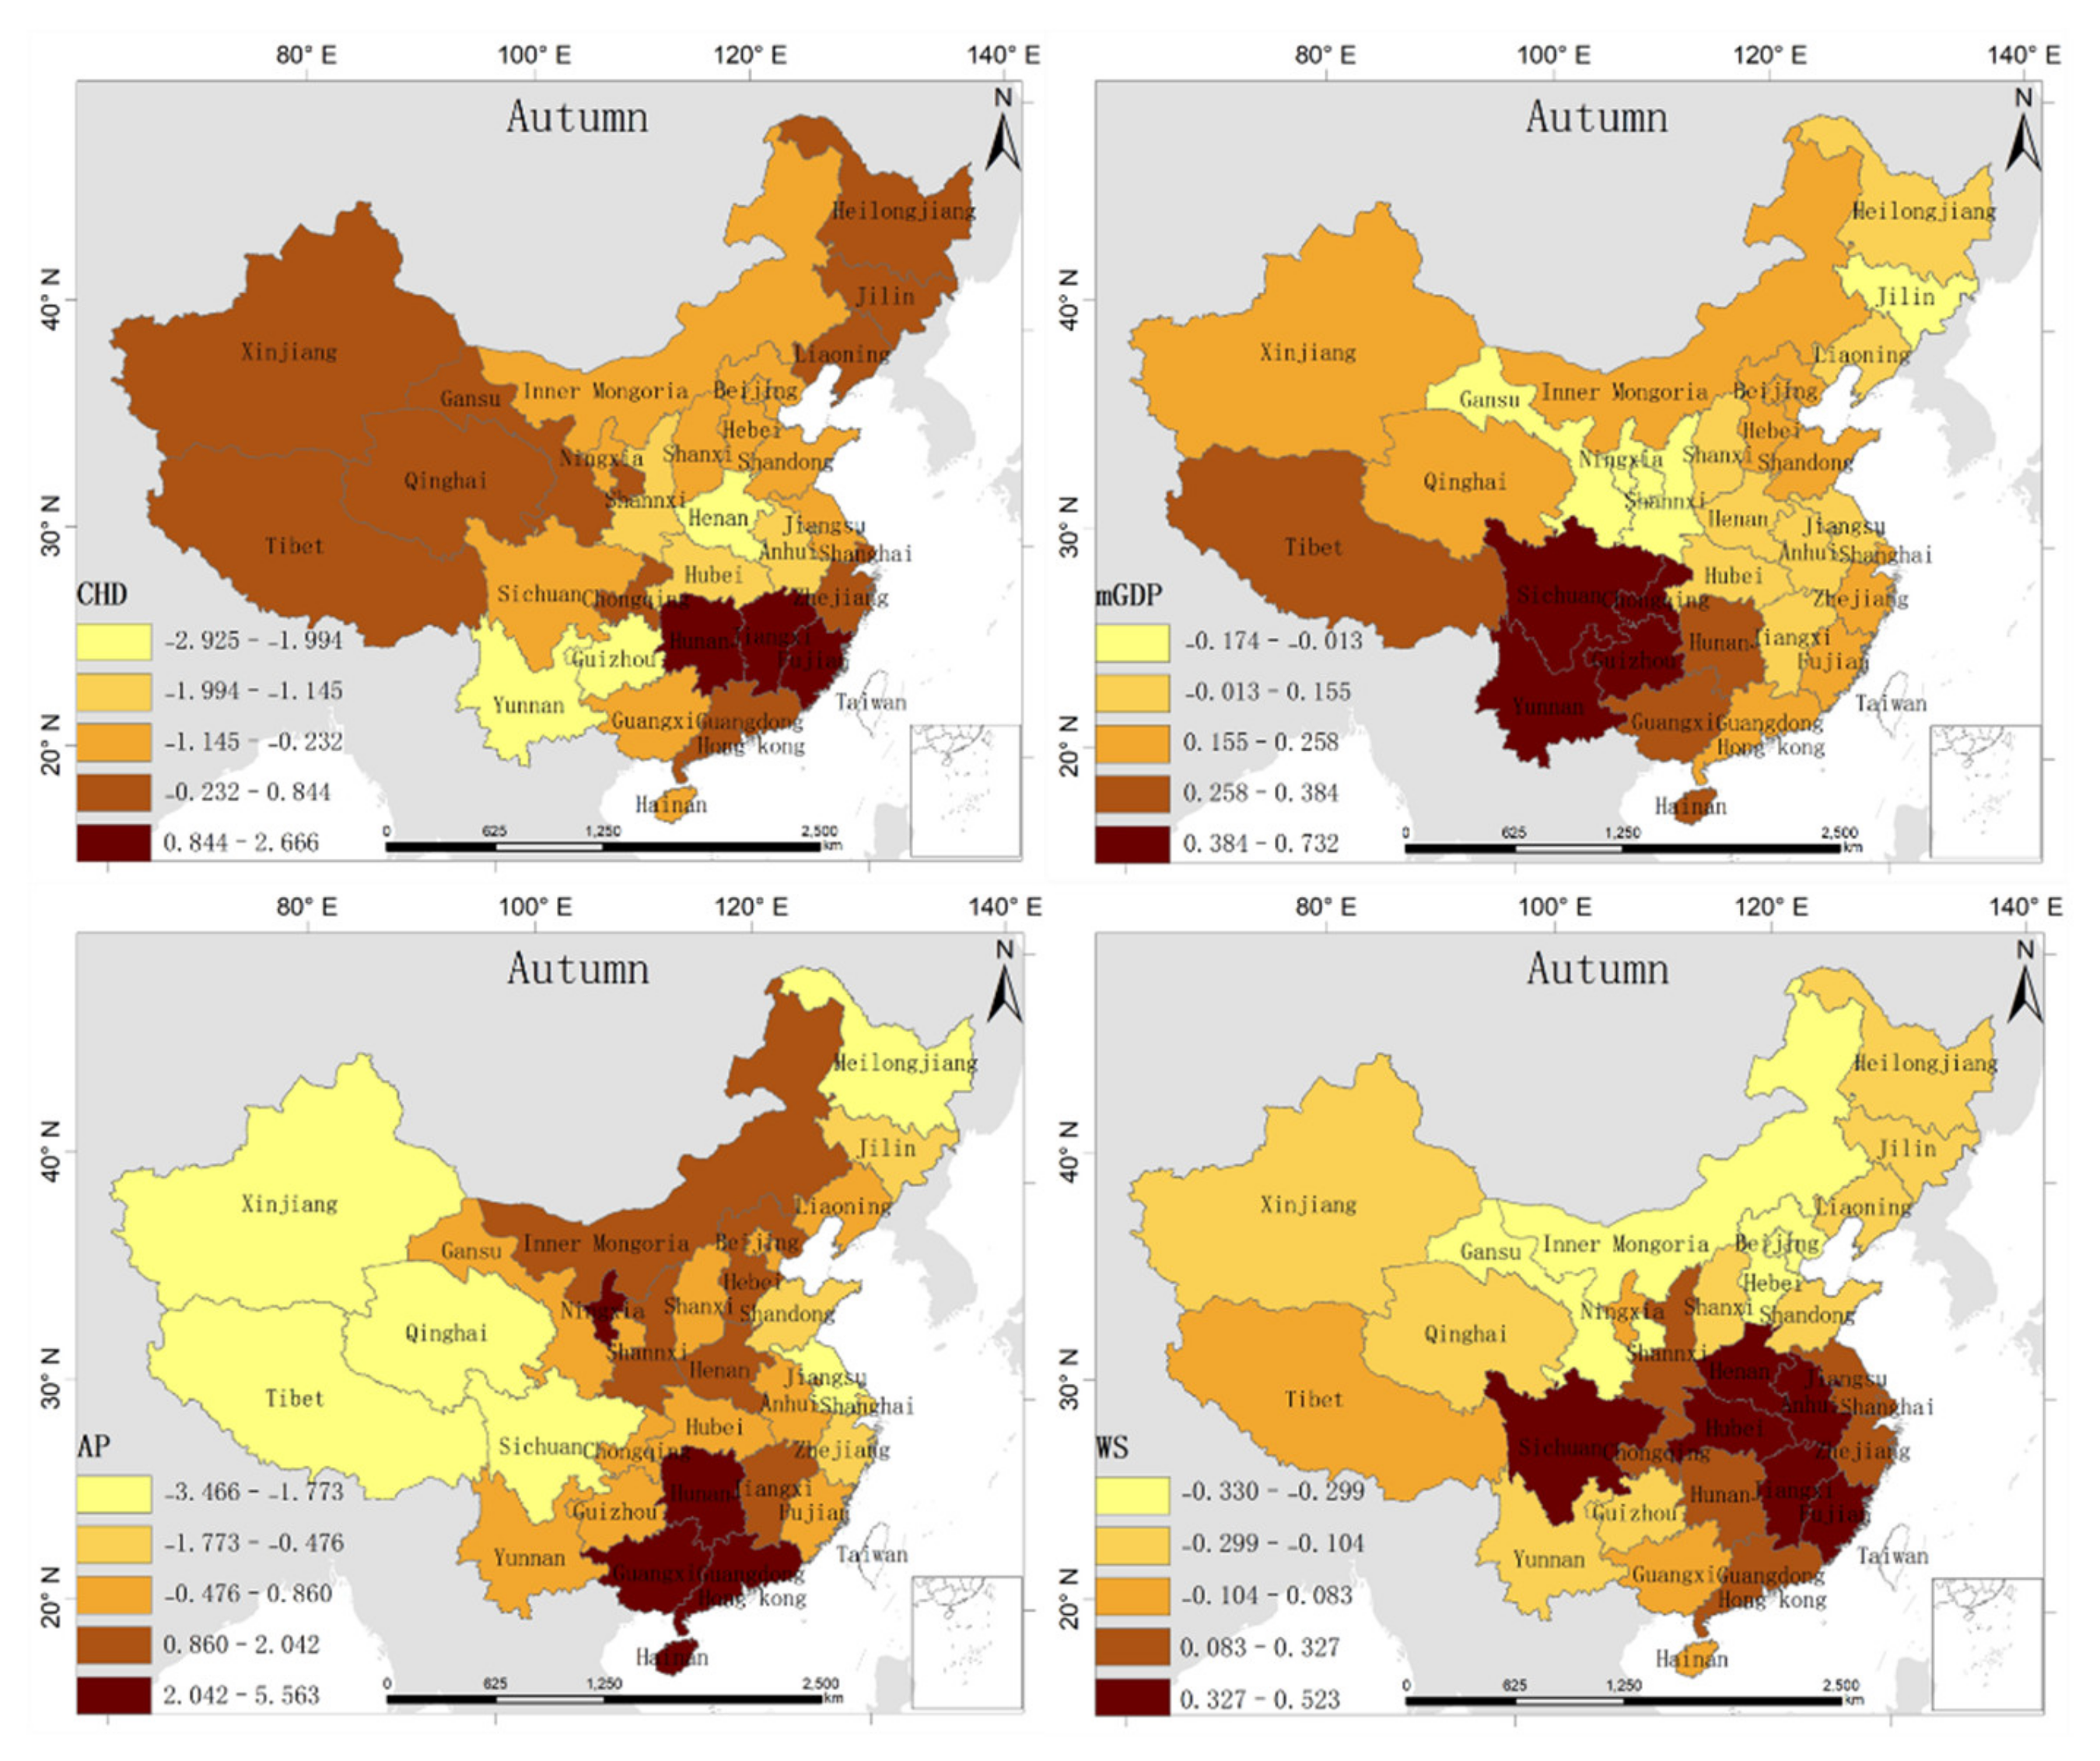
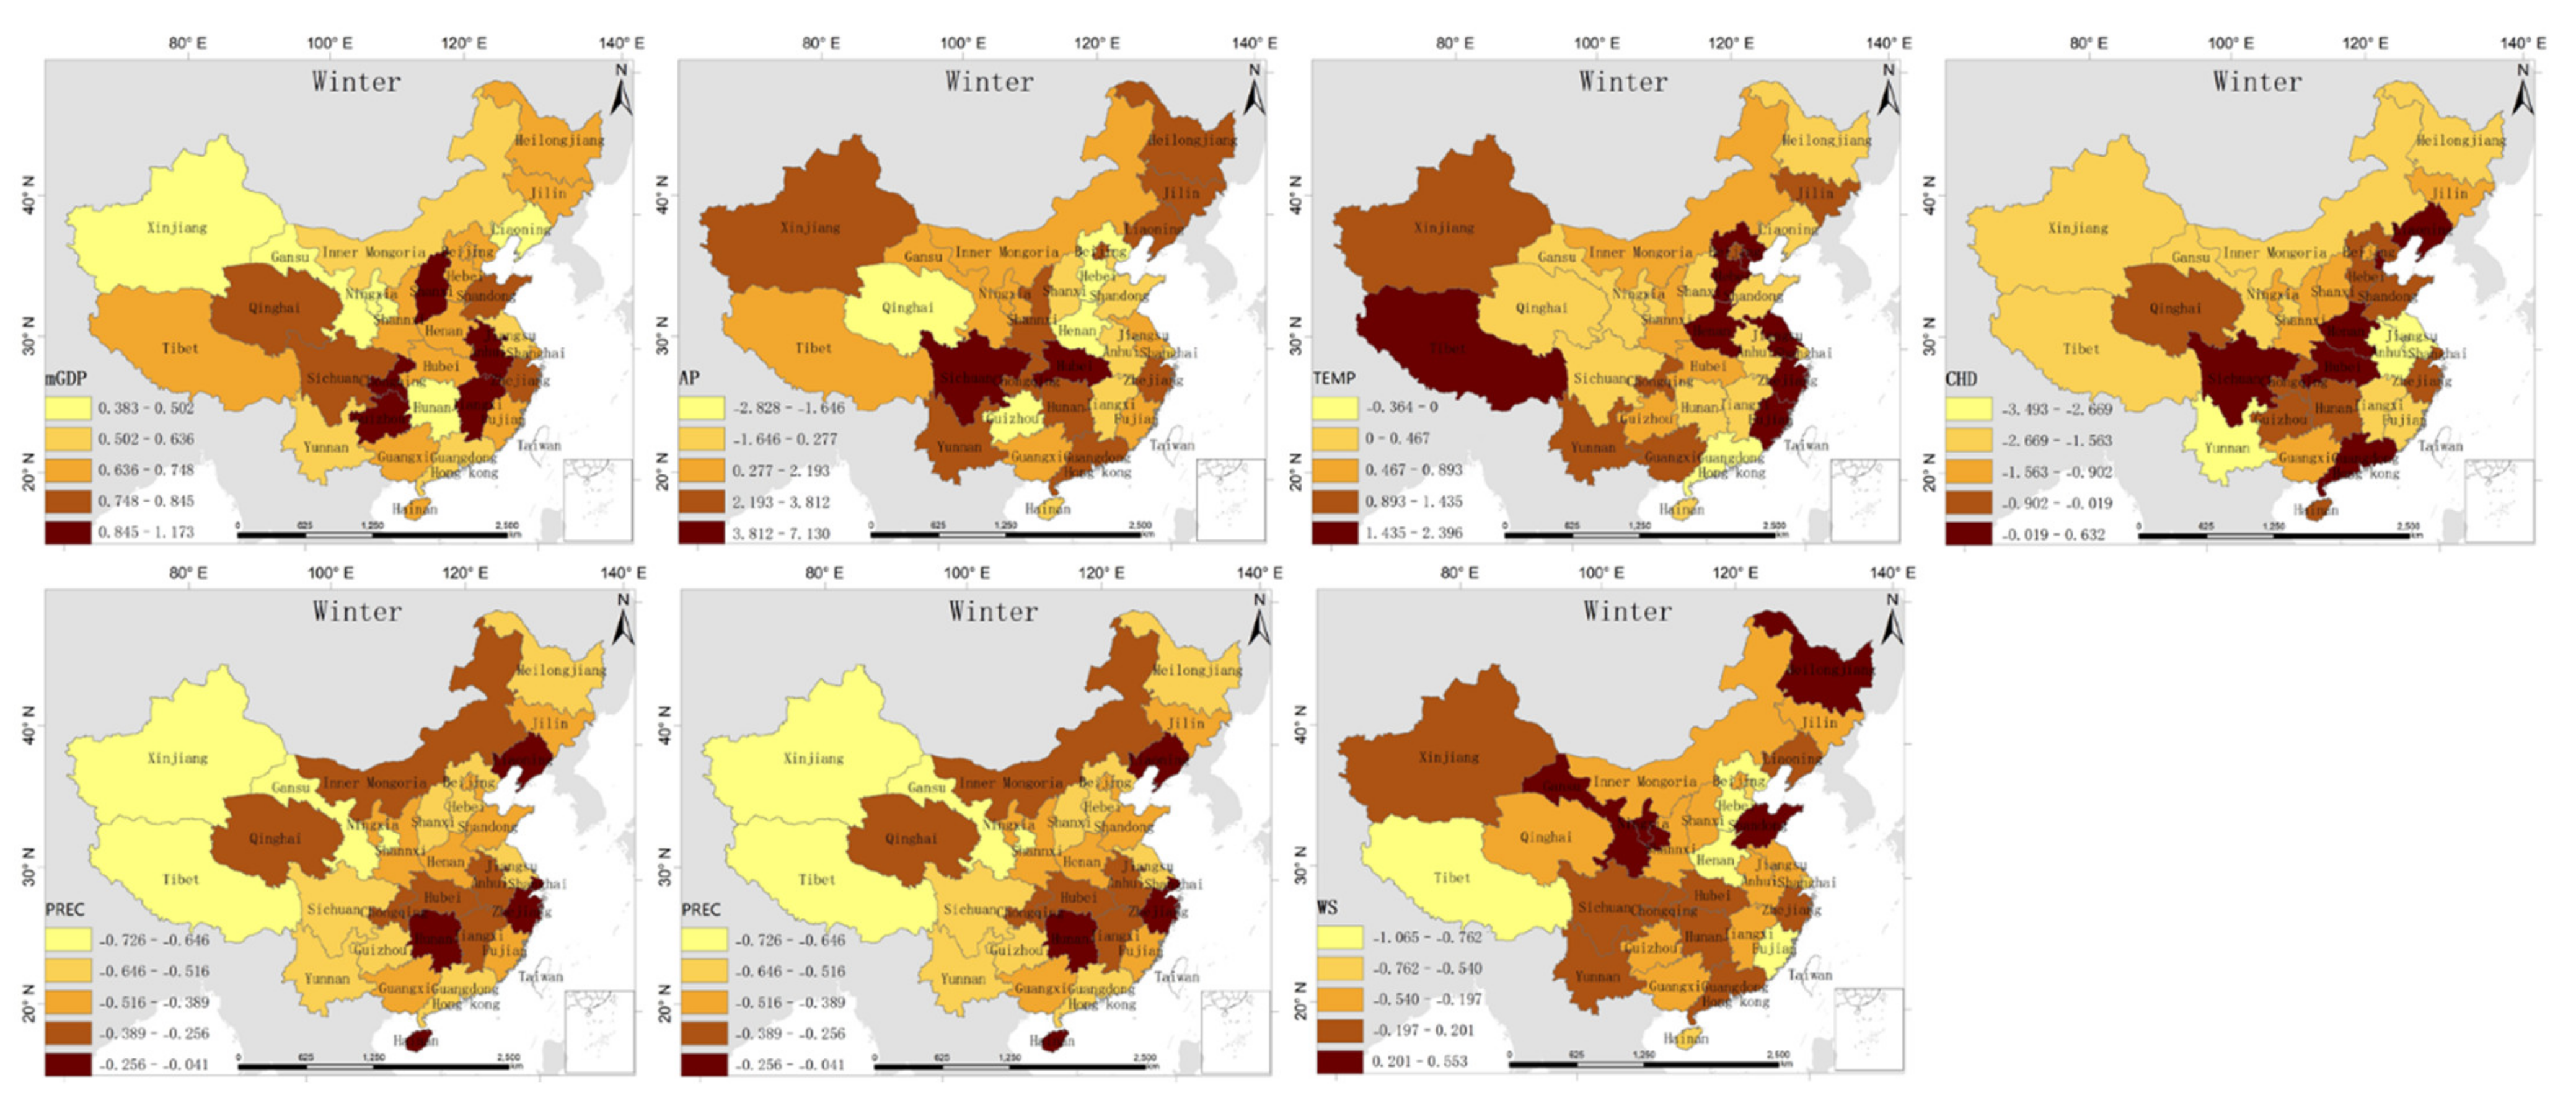
3.5. Seasonal and Spatial Variations of the Relationship between Potential Risk Factors and the I-HFMD

The spatially varying coefficients of the potential risks generated by the GWR model in each season of each province from 2007 to 2017 were averaged to study the overall seasonal variations of their influence on the I-HFMD, as shown in Figure 3. In spring, HU, TEMP, WS, AP, ALT, and mGDP had positive effects on the I-HFMD, which suggests that these variables can promote the incidence of HFMD. CHD had a negative effect on the I-HFMD in spring, suggesting that it can inhibit the incidence of HFMD. PREC had a positive effect on the I-HFMD, but it was not statistically significant (22.6% in Table 6). In summer, PREC, WS, AP, and mGDP had positive influences on the I-HFMD and HU, TEMP, CHD, and ALT had no statistically significant relationship with the I-HFMD. In autumn, WS, AP, and mGDP had positive influences on the I-HFMD, whereas CHD had a negative influence on the I-HFMD. ALT, HU, TEMP, and PREC had no statistically significant relationship with the I-HFMD in autumn (see Table 6). In winter, HU, TEMP AP, and mGDP had positive effects on the I-HFMD, whereas PREC, WS, and CHD had negative effects on the I-HFMD. ALT had no statistically significant relationship with the I-HFMD in winter (34.1% in Table 6).
Based on the results of the GWR model, we further investigated the seasonal relationship between natural environmental factors, socioeconomic factors, and the I-HFMD in different provinces and analyzed the spatiotemporal heterogeneity of each potential risk factor. The spatial distributions of the coefficients of the potential risk factors are shown in Figure 4, Figure 5, Figure 6 and Figure 7.
In spring, mGDP had the greatest influence on the I-HFMD in the southwestern and southeastern regions with a high I-HFMD, as shown in Figure 4. AP showed obvious spatial heterogeneity with inhibitory effects in northeastern, southwestern, and northwestern China but positive effects in the southeastern and northern regions. Furthermore, AP was positively associated with the I-HFMD in higher AP provinces but negatively associated with the I-HFMD in lower AP provinces. The influence of ALT also showed spatial non-stationarity, with an inhibitory effect in northeastern, southwestern, and northwestern China but a positive effect in northern, central, southern, and eastern China. Furthermore, ALT played an inhibitory role in high-altitude provinces and a positive role in low-altitude provinces. The more mountainous high-altitude provinces might isolate people, hampering the spread of HFMD. HU had a positive effect in all provinces and a higher coefficient in provinces with higher incidence. TEMP had a positive impact in about 70% of the provinces, mostly those with low incidence.
In summer, WS had a statistically significant influence on the I-HFMD in most provinces. WS had a positive effect mainly in northeastern and eastern China, accelerating the spread of HFMD in Inner Mongolia [21]. In addition, mGDP had a positive effect on the I-HFMD in most provinces in summer, which may to some extent be due to high mGDP reflecting more economic activity and social contact and therefore a greater spread of HFMD.
In autumn, CHD had a negative effect in the high-risk provinces in northern, central, and southern China and mGDP had a positive effect in most provinces across the Chinese mainland. AP had a positive effect on the I-HFMD in northern and eastern China, with relatively high AP values compared to other parts of China. This indicates that high AP in autumn can promote the spread of HFMD. WS had a positive effect in 80.6% of the provinces, including Hainan, Guangxi, Guangdong, Fujian, and Shanghai.
In winter, mGDP had a positive effect on the I-HFMD in all provinces. AP positively influenced the I-HFMD in 75% of the provinces and had a positive effect in areas at high risk of HFMD, which may be due to AP being higher in winter than in other seasons; this is consistent with previous studies that have shown that high AP contributes to the spread of HFMD viruses [21]. PREC had a negative effect in all provinces, which may be because low precipitation inhibits the reproduction of HFMD viruses. HU had a positive effect in 90% of the provinces due to relatively moderate HU in winter promoting the reproduction of HFMD viruses. Except for Guangdong province, TEMP had a positive effect on the I-HFMD in other provinces because outdoor activities are inhibited in winter and children can easily transmit the virus to their younger siblings or neighbors indoors [21]. CHD inhibited the I-HFMD in most provinces, and more significantly in high-risk provinces such as Hainan, Guangxi, Yunnan, and Shanghai. WS promoted the I-HFMD in 77% of the provinces.

4. Discussion

In this study, we established a GWR model to quantify the spatial relationship between the I-HFMD and eight socioeconomic and natural environmental factors on the Chinese mainland and then analyzed their impacts in different seasons and provinces. The GWR model successfully described the spatial changes in the influence of potential risks and showed a great improvement in model performance compared with the global regression method. Socioeconomic factors and natural environmental factors were found to be potential contributors to the I-HFMD in most parts of the Chinese mainland. In addition, the intensity and direction of influence between these factors and the I-HFMD were significantly spatially non-stationary at the local geographical level.
The finding that meteorological factors had significant influences on the I-HFMD is consistent with previous studies [1,2,4,6,8,16,17,21,22,24,25,29,38,42,43,44,45]. However, the exact mechanism of the association between meteorological parameters and the I-HFMD is still not clear. It is generally assumed that meteorological parameters influence its incidence rate by affecting HFMD transmission [1]. As for each potential risk factor, we found that HU had a positive correlation with the I-HFMD in spring and winter, which is similar to Wang’s finding that HU was positively related to the I-HFMD in Hong Kong and was the most influential factor [44]. In contrast, HU had no statistically significant effect in summer and autumn, when HU is generally higher than in other seasons. Other studies have also been unable to establish a general pattern in relation to higher HU [5,15,16].
TEMP showed influences similar to HU, being generally positively correlated with the I-HFMD in spring and winter but having no statistically significant effect in summer and autumn. There are two potential reasons for the complex association between TEMP and the I-HFMD: (1) there is virological evidence for the temperature-sensitive nature of enteroviruses and other human enteric viruses [12,13], and (2) more outdoor activities in moderately warmer weather increase close contact between individuals and thus increase HFMD transmission [1]. The studies by Xu et al. [14] in Beijing and Huang et al. [45] in Guangzhou found similar patterns. Furthermore, PREC was positively related to the I-HFMD in summer and negatively related to the I-HFMD in winter, and had no statistically significant effect in spring and autumn. However, studies have found that higher PREC was positively associated with the I-HFMD, including studies in Singapore [46], Hong Kong [44], and mainland China [2,3,17,18,22,47,48]. A possible reason is that PREC in China is highest in summer and lowest in winter.
WS was generally positively correlated with the I-HFMD [1]. However, although WS was positively associated with the I-HFMD in spring, summer, and autumn, it was negatively associated with the I-HFMD in winter, mainly because WS is higher in winter than in other seasons. Suya Yi [19] came to similar conclusions with WS generally positively correlated with the I-HFMD in Beijing but showing a negative correlation with the I-HFMD as it increased. AP was found to typically present spatial non-stationarity in all seasons, with AP being positively related to the I-HFMD in higher AP provinces and negatively related to the I-HFMD in lower AP provinces. This conclusion is the opposite to that of a study at the local scale, which revealed a 6.8% drop in cases of HFMD for every 1 hPa increase in AP in Guangdong [4]. ALT positively affected the I-HFMD in spring and had no statistically significant effect in other seasons. This may be due to ALT usually playing a special and indirect role in the influence of I-HFMD: for example, Xiong Xiao found that ALT may have modification effects on the TEMP–HFMD relationship in a multi-city study on the Chinese mainland [18].
In our study, we also took two socioeconomic factors into account to analyze their impacts in different seasons and provinces. CHD had a negative correlation with the I-HFMD in spring, autumn, and winter and no statistically significant effect in summer. There is no consensus in the literature over the influence of CHD on the I-HFMD. Studies have found that the strength [22] and direction of the association between CHD and the I-HFMD have obvious spatial non-stationarity at the local geographical level. In some areas, CHD was not significantly related to the I-HFMD, whereas in other areas, it was positively related to the I-HFMD or had an inverse association with the I-HFMD of a different strength. In addition, mGDP was found to have a positive correlation with the I-HFMD in all seasons, which is similar to a previous finding that mGDP was positively associated with disease incidence [23]. Gou also found that mGDP and CHD had a significant effect on HFMD transmission [24]. Moreover, urban and urban–rural border areas with a much higher mGDP value have been found to be at high risk of occurrence of HFMD due to the frequent migration of people to these areas [25,26].

5. Conclusions

A correct understanding of the spatial relationship between natural environmental and socioeconomic factors and the I-HFMD is important for health care workers to formulate reasonable epidemic prevention and control measures. This study provides a new perspective to explore the main spatiotemporal patterns and potential risk factors of HFMD, using the GWR model to study the seasonal influence characteristics of potential risk factors on the I-HFMD at a large geospatial range and over a long period. Based on the results of the GWR model, we provide an explanation and understanding of the spatial pattern and relationships between the I-HFMD and climate change, economic development and changes in the child population in the Chinese mainland. The findings of this study may help predict the risk of HFMD in children in different seasons and regions based on climatic, economic and demographic information in China.
However, there are some limitations to this study. First, medical resources, such as the number of doctors and hospital beds per capita, may have a significant impact on the risk of HFMD. We did not analyze this effect as we do not currently have suitable medical resource data. Second, the combined effects of the two environmental factors were not analyzed in this study. Studies have shown that different combinations of climatic factors may produce different types of climate, thus affecting the infection and spread of HFMD. These considerations should be addressed in future studies. Despite these limitations, we believe that our findings can help to understand the seasonal and spatially relevant effects of socioeconomic and natural environmental factors on the I-HFMD, which is conducive to developing effective prevention strategies for different locations and different seasons.

Author Contributions

Jingtao Sun was involved in the design of the study, interpretation of data, drafted the major revisions, and performed the experiments; Sensen Wu contributed to the study design and algorithm improvement; Zhen Yan drafted part of the manuscript; Yadong Li conceived the experiments and improved the manuscript; Cheng Yan improved the manuscript; Zhenhong Du was involved in the data acquisition and analyses of the data and experiments; and Feng Zhang was involved in the revision of the manuscript. Renyi Liu improved the manuscript; All authors have read and agreed to the published version of the manuscript.

Funding

This work was supported by the National Natural Science Foundation of China [No. 41922043, No. 41871287, No. 42001323], National Key Research and Development Program of China [No. 2018YFB0505000].

Institutional Review Board Statement

Not applicable.

Informed Consent Statement

Not applicable.

Data Availability Statement

The data, models, and code that support the findings of this study are available from the corresponding author upon reasonable request.

Acknowledgments

The authors would like to thank the support from our university and laboratory and thank all anonymous reviewers for their constructive comments that improved the paper.

Conflicts of Interest

The authors declare no conflict of interest.

References

  1. Li, L.; Qiu, W.; Xu, C.; Wang, J. A spatiotemporal mixed model to assess the influence of environmental and socioeconomic factors on the incidence of hand, foot and mouth disease. BMC Public Health 2018, 18, 274. [Google Scholar] [CrossRef] [PubMed] [Green Version]
  2. Ji, T.; Han, T.; Tan, X.; Zhu, S.; Yan, D.; Yang, Q.; Song, Y.; Cui, A.; Zhang, Y.; Mao, N. Surveillance, epidemiology, and pathogen spectrum of hand, foot, and mouth disease in mainland of China from 2008 to 2017. Biosaf. Health 2019, 1, 32–40. [Google Scholar] [CrossRef]
  3. Zhuang, D.; Hu, W.; Ren, H.; Ai, W.; Xu, X. The influences of temperature on spatiotemporal trends of hand-foot-and-mouth disease in mainland China. Int. J. Environ. Health Res. 2014, 24, 1–10. [Google Scholar] [CrossRef] [PubMed]
  4. Du, Z.; Lawrence, W.R.; Zhang, W.; Zhang, D.; Yu, S.; Hao, Y. Interactions between climate factors and air pollution on daily HFMD cases: A time series study in Guangdong, China. Sci. Total Environ. 2019, 656, 1358–1364. [Google Scholar] [CrossRef] [PubMed]
  5. Zhang, Z.; Xie, X.; Chen, X.; Li, Y.; Lu, Y.; Mei, S.; Liao, Y.; Lin, H. Short-term effects of meteorological factors on hand, foot and mouth disease among children in Shenzhen, China: Non-linearity, threshold and interaction. Sci. Total Environ. 2016, 539, 576–582. [Google Scholar] [CrossRef]
  6. Guo, C.; Yang, J.; Guo, Y.; Ou, Q.; Shen, S.; Ou, C.; Liu, Q. Short-term effects of meteorological factors on pediatric hand, foot, and mouth disease in Guangdong, China: A multi-city time-series analysis. BMC Infect. Dis. 2016, 16, 524. [Google Scholar] [CrossRef] [Green Version]
  7. Liao, J.; Qin, Z.; Zuo, Z.; Yu, S.; Zhang, J. Spatial-temporal mapping of hand foot and mouth disease and the long-term effects associated with climate and socio-economic variables in Sichuan Province, China from 2009 to 2013. Sci. Total Environ. 2016, 563, 152–159. [Google Scholar] [CrossRef]
  8. Xu, C.; Zhang, X.; Xiao, G. Spatiotemporal decomposition and risk determinants of hand, foot and mouth disease in Henan, China. Sci. Total Environ. 2019, 657, 509–516. [Google Scholar] [CrossRef]
  9. Huang, X.; Wei, H.; Wu, S.; Du, Y.; Liu, L.; Su, J.; Xu, Y.; Wang, H.; Li, X.; Wang, Y. Epidemiological and etiological characteristics of hand, foot and mouth disease in Henan, China, 2008–2013. Sci. Rep. 2015, 5, 1–9. [Google Scholar] [CrossRef] [Green Version]
  10. Kou, Z.; Jia, J.; Liu, X.; Luo, T.; Xin, X.; Gong, J.; Zhang, J.; Sun, D.; Jiang, F.; Gao, R. Epidemiological characteristics and spatial-temporal clusters of hand, foot, and mouth disease in Qingdao City, China, 2013-2018. PLoS ONE 2020, 15, e233914. [Google Scholar] [CrossRef]
  11. Kulldorff, M.; Heffernan, R.; Hartman, J.; Assunçao, R.; Mostashari, F. A space–time permutation scan statistic for disease outbreak detection. PLoS Med. 2005, 2, e59. [Google Scholar] [CrossRef] [PubMed] [Green Version]
  12. Kung, Y.; Huang, S.; Kuo, P.; Kiang, D.; Ho, M.; Liu, C.; Yu, C.; Su, I.; Wang, J. Introduction of a strong temperature-sensitive phenotype into enterovirus 71 by altering an amino acid of virus 3D polymerase. Virology 2010, 396, 1–9. [Google Scholar] [CrossRef] [Green Version]
  13. Rzeżutka, A.; Cook, N. Survival of human enteric viruses in the environment and food. FEMS Microbiol. Rev. 2004, 28, 441–453. [Google Scholar] [CrossRef] [Green Version]
  14. Xu, M.; Yu, W.; Tong, S.; Jia, L.; Liang, F.; Pan, X. Non-linear association between exposure to ambient temperature and children’s hand-foot-and-mouth disease in Beijing, China. PLoS ONE 2015, 10, e126171. [Google Scholar] [CrossRef] [Green Version]
  15. Lin, H.; Zou, H.; Wang, Q.; Liu, C.; Lang, L.; Hou, X.; Li, Z. Short-term effect of El Nino-Southern Oscillation on pediatric hand, foot and mouth disease in Shenzhen, China. PLoS ONE 2013, 8, e65585. [Google Scholar] [CrossRef]
  16. Nguyen, H.X.; Chu, C.; Nguyen, H.L.T.; Nguyen, H.T.; Do, C.M.; Rutherford, S.; Phung, D. Temporal and spatial analysis of hand, foot, and mouth disease in relation to climate factors: A study in the Mekong Delta region, Vietnam. Sci. Total Environ. 2017, 581, 766–772. [Google Scholar] [CrossRef] [Green Version]
  17. Bo, Z.; Ma, Y.; Chang, Z.; Zhang, T.; Liu, F.; Zhao, X.; Long, L.; Yi, X.; Xiao, X.; Li, Z. The spatial heterogeneity of the associations between relative humidity and pediatric hand, foot and mouth disease: Evidence from a nation-wide multicity study from mainland China. Sci. Total Environ. 2020, 707, 136103. [Google Scholar] [CrossRef]
  18. Xiao, X.; Gasparrini, A.; Huang, J.; Liao, Q.; Liu, F.; Yin, F.; Yu, H.; Li, X. The exposure-response relationship between temperature and childhood hand, foot and mouth disease: A multicity study from mainland China. Environ. Int. 2017, 100, 102–109. [Google Scholar] [CrossRef]
  19. Yi, S.; Wang, H.; Yang, S.; Xie, L.; Gao, Y.; Ma, C. Spatial and Temporal Characteristics of Hand-Foot-and-Mouth Disease and Its Response to Climate Factors in the Ili River Valley Region of China. Int. J. Environ. Res. Public Health 2021, 18, 1954. [Google Scholar] [CrossRef]
  20. Maes, M.; Meyer, F.D. Relationships of climatic data to immune and hematologic variables in normal human. Neuroendocrinol. Lett. 2000, 21, 127–136. [Google Scholar]
  21. Hong, Z.; Hao, H.; Li, C.; Du, W.; Wei, L.; Wang, H. Exploration of potential risks of hand, foot, and mouth disease in Inner Mongolia Autonomous Region, China using geographically weighted regression model. Sci. Rep. 2018, 8, 1–10. [Google Scholar] [CrossRef] [PubMed]
  22. Hu, M.; Li, Z.; Wang, J.; Jia, L.; Liao, Y.; Lai, S.; Guo, Y.; Zhao, D.; Yang, W. Determinants of the incidence of hand, foot and mouth disease in China using geographically weighted regression models. PLoS ONE 2012, 7, e38978. [Google Scholar] [CrossRef] [PubMed]
  23. Xu, C. Spatio-temporal pattern and risk factor analysis of hand, foot and mouth disease associated with under-five morbidity in the Beijing–Tianjin–Hebei region of China. Int. J. Environ. Res. Public Health 2017, 14, 416. [Google Scholar] [CrossRef] [PubMed] [Green Version]
  24. Gou, F.; Liu, X.; Ren, X.; Liu, D.; Liu, H.; Wei, K.; Yang, X.; Cheng, Y.; Zheng, Y.; Jiang, X. Socio-ecological factors and hand, foot and mouth disease in dry climate regions: A Bayesian spatial approach in Gansu, China. Int. J. Biometeorol. 2017, 61, 137–147. [Google Scholar] [CrossRef]
  25. Wang, J.; Guo, Y.; Christakos, G.; Yang, W.; Liao, Y.; Zhong-Jie, L.I.; Xiao-Zhou, L.I.; Lai, S.; Chen, H. Hand, foot and mouth disease: Spatiotemporal transmission and climate. Int. J. Health Geogr. 2011, 10, 1–10. [Google Scholar] [CrossRef] [Green Version]
  26. Fang, L.; Wang, L.; de Vlas, S.J.; Liang, S.; Tong, S.; Li, Y.; Li, Y.; Qian, Q.; Yang, H.; Zhou, M. Distribution and risk factors of 2009 pandemic influenza A (H1N1) in mainland China. Am. J. Epidemiol. 2012, 175, 890–897. [Google Scholar] [CrossRef] [Green Version]
  27. Liu, J. Threshold dynamics for a HFMD epidemic model with periodic transmission rate. Nonlinear Dynam. 2011, 64, 89–95. [Google Scholar] [CrossRef]
  28. Lai, C.; Jiang, D.; Wu, H.; Chen, H. A dynamic model for the outbreaks of hand, foot, and mouth disease in Taiwan. Epidemiol. Infection 2016, 144, 1500–1511. [Google Scholar] [CrossRef] [Green Version]
  29. Liu, W.; Ji, H.; Shan, J.; Bao, J.; Sun, Y.; Li, J.; Bao, C.; Tang, F.; Yang, K.; Bergquist, R. Spatiotemporal dynamics of hand-foot-mouth disease and its relationship with meteorological factors in Jiangsu Province, China. PLoS ONE 2015, 10, e131311. [Google Scholar] [CrossRef] [Green Version]
  30. Yu, L.; Zhou, L.; Tan, L.; Jiang, H.; Wang, Y.; Wei, S.; Nie, S. Application of a new hybrid model with seasonal auto-regressive integrated moving average (ARIMA) and nonlinear auto-regressive neural network (NARNN) in forecasting incidence cases of HFMD in Shenzhen, China. PLOS ONE 2017, 9, e98241. [Google Scholar] [CrossRef] [Green Version]
  31. Hu, B.; Qiu, W.; Xu, C.; Wang, J. Integration of a Kalman filter in the geographically weighted regression for modeling the transmission of hand, foot and mouth disease. BMC Public Health 2020, 20, 479. [Google Scholar] [CrossRef] [Green Version]
  32. Yang, K.; He, J.; Tang, W.; Qin, J.; Cheng, C.C. On downward shortwave and longwave radiations over high altitude regions: Observation and modeling in the Tibetan Plateau. Agr. For. Meteorol. 2010, 150, 38–46. [Google Scholar] [CrossRef]
  33. He, J.; Yang, K.; Tang, W.; Lu, H.; Qin, J.; Chen, Y.; Li, X. The first high-resolution meteorological forcing dataset for land process studies over China. Sci. Data 2020, 7, 1–11. [Google Scholar] [CrossRef] [Green Version]
  34. Wheeler, D.; Tiefelsdorf, M. Multicollinearity and correlation among local regression coefficients in geographically weighted regression. J. Geogr. Syst. 2005, 7, 161–187. [Google Scholar] [CrossRef]
  35. Elliott, P.; Wartenberg, D. Spatial epidemiology: Current approaches and future challenges. Environ. Health Persp. 2004, 112, 998–1006. [Google Scholar] [CrossRef]
  36. Fotheringham, A.S.; Brunsdon, C.; Charlton, M. Geographically Weighted Regression: The Analysis of Spatially Varying Relationships; John Wiley & Sons: Hoboken, NJ, USA, 2003. [Google Scholar]
  37. Brunsdon, C.; Fotheringham, S.; Charlton, M. Geographically weighted regression. Journal of the Royal Statistical Society: Series D. Statistician 1998, 47, 431–443. [Google Scholar]
  38. Onozuka, D.; Hashizume, M. The influence of temperature and humidity on the incidence of hand, foot, and mouth disease in Japan. Sci. Total Environ. 2011, 410, 119–125. [Google Scholar] [CrossRef]
  39. Leung, Y.; Mei, C.; Zhang, W. Statistical tests for spatial nonstationarity based on the geographically weighted regression model. Environ. Plann. A 2000, 32, 9–32. [Google Scholar] [CrossRef]
  40. Wu, S. The theory and method of geographically and temporally neural network weighted regression. Ph.D. Thesis, Zhejiang University, Hangzhou, China, 2018. (In Chinese). [Google Scholar]
  41. Brunsdon, C.; Fotheringham, A.S.; Charlton, M.E. Geographically weighted regression: A method for exploring spatial nonstationarity. Geogr. Anal. 1996, 28, 281–298. [Google Scholar] [CrossRef]
  42. Zheng, S.; Wang, M.; Wang, S.; Shang, K.; Hu, L.; Dong, J. Effect of meteorological conditions on occurrence of hand, foot and mouth disease in Wuwei City, Northwestern China. In Proceedings of the 2011 4th International Conference on Biomedical Engineering and Informatics (BMEI), Shanghai, China, 15–17 October 2011; pp. 1893–1895. [Google Scholar]
  43. Dong, W.; Yang, P.; Liao, H.; Wang, X.; Wang, Q. The effects of weather factors on hand, foot and mouth disease in Beijing. Sci. Rep. 2016, 6, 1–9. [Google Scholar] [CrossRef] [Green Version]
  44. Wang, P.; Goggins, W.B.; Chan, E.Y. Hand, foot and mouth disease in Hong Kong: A time-series analysis on its relationship with weather. PLoS ONE 2016, 11, e161006. [Google Scholar] [CrossRef] [PubMed] [Green Version]
  45. Huang, Y.; Deng, T.; Yu, S.; Gu, J.; Huang, C.; Xiao, G.; Hao, Y. Effect of meteorological variables on the incidence of hand, foot, and mouth disease in children: A time-series analysis in Guangzhou, China. BMC Infect. Dis. 2013, 13, 134. [Google Scholar] [CrossRef] [PubMed] [Green Version]
  46. World Health Organization. Using Climate to Predict Infectious Disease Epidemics; WHO: Geneva, Switzerland, 2005. [Google Scholar]
  47. Wang, C.; Li, X.; Zhang, Y.; Xu, Q.; Huang, F.; Cao, K.; Tao, L.; Guo, J.; Gao, Q.; Wang, W.; et al. Spatiotemporal Cluster Patterns of Hand, Foot, and Mouth Disease at the County Level in Mainland China, 2008–2012. PLoS ONE 2016, 11, e0147532. [Google Scholar] [CrossRef] [PubMed] [Green Version]
  48. Huang, J.; Wang, J.; Bo, Y.; Xu, C.; Hu, M.; Huang, D. Identification of health risks of hand, foot and mouth disease in China using the geographical detector technique. Int. J. Environ. Res. Public Health 2014, 11, 3407–3423. [Google Scholar]
Figure 1. The seasonal distribution of cumulative incidence of hand, foot, and mouth disease (I-HFMD) on the Chinese mainland.
Ijgi 10 00448 g001
Figure 2. Local R 2 distributions of the GWR model in each season.
Ijgi 10 00448 g002
Figure 3. Average coefficients of the potential risk factors in the four seasons.
Ijgi 10 00448 g003
Figure 4. The spatial variations of the coefficients of the GWR model in spring.
Ijgi 10 00448 g004
Figure 5. The spatial variations of the coefficients of the GWR model in summer.
Ijgi 10 00448 g005
Figure 6. The spatial variations of the coefficients of the GWR model in autumn.
Ijgi 10 00448 g006
Figure 7. The spatial variations of the coefficients of the GWR model in winter.
Ijgi 10 00448 g007
Table 1. Sources and details of potential risk factors and I-HFMD data.
VariablesData TypeVariables NameTime ResolutionSpace ResolutionData SourceUnits
Incidence of HFMDStatistical yearbookI-HFMDMonthly mean-Public Health
Science Data Center
1/100,000
TemperatureRemote sensing TEMPMonthly mean1 kmNational Tibetan
Plateau Data Center
Celsius
Amount of precipitationRemote sensing PRECMonthly mean1 kmNational Tibetan
Plateau Data Center
milliliter
Specific humidityRemote sensing HUMonthly mean1 kmNational Tibetan
Plateau Data Center
g/kg
Air pressureRemote sensing APMonthly mean1 kmNational Tibetan
Plateau Data Center
kPa
Wind speedRemote sensing WSMonthly mean1 kmNational Tibetan
Plateau Data Center
m/s
AltitudeRemote sensing ALTAll years0.1°NOAA
ETOPO1 Global Relief Model
m
Children population densityStatistical yearbook CHDSeasonal average-National Bureau of
Statistics of China
Person/km2
Real GDP per capitaStatistical yearbook mGDPSeasonal
average
-National Bureau of
Statistics of China
Yuan/Person
Table 2. The definition of GWR-AAB and GWR-AFG.
Model NameBandwidth Optimization CriteriaKernel Function
TypeStructure
GWR-AFGAICcFixedGaussian
GWR-AABAICcAdaptiveBi-square
Table 3. Pearson correlations between the I-HFMD and eight potential risk factors for each season.
IndependentHUTEMPPRECWSAPALTCHDmGDP
Dependent
I-HFMD in Spring0.124 **0.187 **0.254 **−0.233 **0.244 **−0.202 **0.421 **0.238 **
I-HFMD in Summer0.239 **0.228 **0.166 **0.152 *0.133 **−0.328 **0.420 **0.297 **
I-HFMD in Autumn0.289 **0.183 **0.228 **0.233 *0.178 **−0.292 **0.416 **0.299 **
I-HFMD in Winter0.285 **0.378 **0.148 **−0.168 **0.234 **−0.206 **0.359 **0.402 **
** Stands for significance at the 1% level. * Stands for significance at the 5% level.
Table 4. VIF values of multicollinearity testing of potential risks for each season.
IndependentHUTEMPPRECWSAPALTCHDmGDP
Dependent
I-HFMD in Spring6.0455.6812.5472.6233.9273.8915.0361.229
I-HFMD in Summer4.6828.0554.2242.1081.5804.7195.3361.235
I-HFMD in Autumn9.3199.6002.3771.7024.1133.4314.9141.277
I-HFMD in Winter7.9369.8051.9651.5804.1503.5235.9591.218
Table 5. Model performance of OLR and GWR for I-HFMD estimation in the four seasons.
Model R 2 RMSEMAEMAPEAICcF1p-Value of F1Bandwidth
OLR in Spring60.10%1.0960.79227.812837.6---
GWR-AFG in Spring73.61%0.8920.61420.052598.30.720.0137,0839.6
GWR-AAB in Spring 75.47%0.8560.59619.542584.10.690.01295.3
OLR in Summer29.09%0.8510.6565.072285.6---
GWR-AFG in Summer62.94%0.6150.4763.211928.40.600.0127,6411.9
GWR-AAB in Summer68.95%0.5630.4292.901902.50.540.01146.5
OLR in Autumn39.35%0.8410.66010.062267.5---
GWR-AFG in Autumn76.29%0.5230.3935.191690.70.460.0126,1822.0
GWR-AAB in Autumn74.31%0.5470.4165.771702.80.480.01262.2
OLR in Winter56.46%1.2730.95247.152979.6---
GWR-AFG in Winter76.77%0.9300.68833.932664.30.620.0130,0018.8
GWR-AAB in Winter78.04%0.9040.67433.212640.20.600.01279.2
Table 6. The t-test pass rate of the potential risk factors in the four seasons.
SeasonInterceptHUTEMPPRECWSAPALTCHDmGDP
Spring70.9%41.9%38.3%22.6%35.3%61.2%58.1%41.9%64.5%
Summer41.9%32.3%3.2%38.7%45.2%41.9%31.9%22.6%48.4%
Autumn87.10%22.6%25.8%22.6%48.4%54.8%31.9%67.7%64.5%
Winter54.8%54.8%45.1%58.1%51.6%58.1%34.1%45.1%100%
Publisher’s Note: MDPI stays neutral with regard to jurisdictional claims in published maps and institutional affiliations.

