
Spatial Distribution Assessment of Terrorist Attack Types Based on I-MLKNN Model


1
Beijing Key Laboratory of Big Data Technology for Food Safety, Beijing Technology and Business University, Beijing 100048, China
2
Key Laboratory of Resources Utilization and Environmental Remediation, Institute of Geographic Sciences and Natural Resources Research, Chinese Academy of Sciences, Beijing 100101, China
3
State Grid Information & Telecommunication Group Co., Ltd., Beijing 102211, China
*
Author to whom correspondence should be addressed.
†
These authors contributed equally to this work.
ISPRS Int. J. Geo-Inf. 2021, 10(8), 547; https://0-doi-org.brum.beds.ac.uk/10.3390/ijgi10080547
Submission received: 29 June 2021
/
Revised: 30 July 2021
/
Accepted: 9 August 2021
/
Published: 13 August 2021
(This article belongs to the Special Issue Geovisualization and Social Media)
Abstract
:Terrorist attacks are harmful to lives and property and seriously affect the stability of the international community and economic development. Exploring the regularity of terrorist attacks and building a model for assessing the risk of terrorist attacks (a kind of public safety risk, and it means the possibility of a terrorist attack) are of great significance to the security and stability of the international community and to global anti-terrorism. We propose a fusion of Inverse Distance Weighting (IDW) and a Multi-label k-Nearest Neighbor (I-MLKNN)-based assessment model for terrorist attacks, which is in a grid-scale and considers 17 factors of socio-economic and natural environments, and applied the I-MLKNN assessment model to assess the risk of terrorist attacks in Southeast Asia. The results show the I-MLKNN multi-label classification algorithm is proven to be an ideal tool for the assessment of the spatial distribution of terrorist attacks, and it can assess the risk of different types of terrorist attacks, thus revealing the law of distribution of different types of terrorist attacks. The terrorist attack risk assessment results indicate that Armed Attacks, Bombing/Explosions and Facility/Infrastructure Attacks in Southeast Asia are high-risk terrorist attack events, and the southernmost part of Thailand and the Philippines are high-risk terrorist attack areas for terrorism. We do not only provide a reference for incorporating spatial features in multi-label classification algorithms, but also provide a theoretical basis for decision-makers involved in terrorist attacks, which is meaningful to the implementation of the international counter-terrorism strategy.
1. Introduction
Terrorism is one of the most important threats in today’s society. Terrorist attacks are harmful to lives and properties and seriously affect the stability and economic development of the international community [1].
Terrorism research is an important area in the study of international relations, and a large number of researchers have made great efforts to find a solution to the threat of terrorism. The research focuses on the following two aspects: (1) Using statistical methods to explore the impact factors of terrorist attacks. Findley et al. took the data on transnational and domestic terrorist incidents from 1970 to 1997 and designed a statistical analysis program for terrorism data to reveal the relationship between terrorist attacks and whether the state has an independent judiciary [2]. Scheffran showed that there are multiple connections and feedback between climate systems, natural resources, human security and social stability [3]. Perliger et al. argued that groups with full ideology tend to unite when threatened by strong outsiders, thus creating terrorist attacks. The theory was tested using the case of Jewish terrorism in Israel between 1948 and 2006 [4]. (2) Research on terrorism assessment using techniques such as machine learning and deep learning. Ding et al. used Neural Network (NN), Support Vector Machine (SVM), and Random Forest (RF) machine learning models to assess the risk of terrorist attacks worldwide, using historical data from 1970 to 2015. The results showed that the RF model works best. The model predicts the location of possible terrorist incidents in 2015, with a success rate of 96.6% [5]. Raghavan et al. used the Hidden Markov Model to build a model for a terrorist organization’s activity and detected sudden spurts and downfalls in this profile [6]. Scharpf et al. used a power-law distribution based on observations to predict extreme massacres ex post and ex ante [7]. However, the abovementioned studies on terrorist attacks did not adequately consider the multi-source characteristics that affect terrorism, and most of the studies were conducted on national and regional scales. The research generally focuses on the casualties of terrorist attacks, and research on the types of terrorist attacks is relatively lacking.
The terrorist attack is a kind of very complex social event, which is driven by many factors [8,9,10]. The Global Terrorism Database (GTD) is provided by the National Consortium for the Study of Terrorism and Response to Terrorism (START) at the University of Maryland [11]. According to the GTD, currently the types of terrorist attacks are divided into eight categories, including Assassination, Armed Assault, Bombing/Explosion, Hijacking, Hostage Taking (Barricade Incident), Hostage Taking (Kidnapping), Facility/Infrastructure Attack and Unarmed Assault. The details of the attack information are as follows [12,13,14].
- (1)
- Assassination: An act whose primary objective is to kill one or more specific and prominent individuals.
- (2)
- Armed Assault: An attack whose primary objective is to cause physical harm or death directly to human beings by use of a firearm, incendiary, or sharp instrument (knife, etc.).
- (3)
- Bombing/Explosion: An attack where the primary effects are caused by an energetically unstable material undergoing rapid decomposition and releasing a pressure wave that causes physical damage to the surrounding environment.
- (4)
- Hijacking: An act whose primary objective is to take control of a vehicle for the purpose of diverting it to an unprogrammed destination, forcing the release of prisoners, or some other political objective.
- (5)
- Hostage Taking (Barricade Incident): An act whose primary objective is to take control of hostages for the purpose of achieving a political objective through concessions or through the disruption of normal operations.
- (6)
- Hostage Taking (Kidnapping): An act whose primary objective is to take control of hostages for the purpose of achieving a political objective through concessions or through the disruption of normal operations.
- (7)
- Facility/Infrastructure Attack: An act, excluding the use of an explosive, whose primary objective is to cause damage to a nonhuman target.
- (8)
- Unarmed Assault: An attack whose primary objective is to cause physical harm or death directly to human beings by any means other than explosive, firearm, incendiary, or sharp instrument (knife, etc.).
These are assessed by the types of terrorist attacks that occurred in the same location and are used to predict the types of terrorism where no attack occurred. This involves a typical multi-label classification problem [15].
Currently, there are two main solutions to the multi-label classification problem. (1) Problem conversion: The method refers to converting the multi-label classification problem into a traditional single-label one. Multi-label data are converted into single-label data during training and then learned using a single-label classification algorithm [16]. Among them, the Binary Relevance (BR) algorithm assumes that the tags are independent of each other and learn one-to-one for each tag [17]. The Label Power-set (LP) algorithm combines the labels that each sample may have into a new label, and then classifies the new label data [18]. (2) Algorithm adaptation: This method refers to the improvement of the single-label classification algorithm to adapt to the multi-label classification problem [19]. Typical algorithms include a multi-label k-nearest neighbor algorithm (MLKNN) that improves the two-class K nearest neighbor algorithm [20] and a modified Rank-SVM algorithm for the two-class SVM algorithm [21]. In recent years, multi-label classification has attracted the attention of many scholars, and is widely used in image annotation, text classification, video annotation and other fields [22,23,24]. However, the existing methods pay less attention to the risk of different types of terrorist attacks.
Different types of terrorist attacks require different anti-terrorism programs, so the type of terrorist attack seriously affects the development of anti-terrorism defense systems and strategies. To make an accurate assessment of terrorist attack types, we propose the I-MLKNN algorithm and select Southeast Asia as the research area. In this paper, MLKNN is applied to achieve the multi-label classification of terrorist attacks, but it cannot analyze the spatial characteristics of data. Therefore, we introduce spatial thoughts into the MLKNN algorithm. Spatial spillovers are a main interest in regional science, involving exogenous variables at one location having impacts on the dependent variable at both the targeted and neighboring locations [25,26]. Many researchers have considered the spatial influence of adjacent elements for spatial spillover effects [27,28]. Thus, in order to accommodate for spatial effects, we propose to consider the influence of the grid in which terrorist attacks occurred on other grids for the spatial spillover effect in our study. The inverse distance weighting method is one of the most commonly used models in spatial analysis, which takes the distance between the interpolation points and the sample points as the weight for the weighted average [29]. By referring to the inverse distance weighting expression, we improve MLKNN with the inverse distance weighting method to obtain an efficient algorithm, namely I-MLKNN. Combining a machine learning model (MLKNN) with an empirical model can enhance the interpretability of the results [30,31]. On the one hand, this paper improves the existing multi-label classification algorithm. On the other hand, it can effectively evaluate the risk of different types of terrorist attacks and reveal the patterns between the types of terrorist attacks, thus providing support for relevant decision-makers.
2. Area and Data Processing
2.1. Area
Southeast Asia (SEA) consists of the Indo-China Peninsula and the Malay Archipelago. There are 11 countries in Southeast Asia, including Vietnam, Laos, Cambodia, Thailand, Myanmar, Malaysia, Singapore, Indonesia, Brunei, the Philippines, and East Timor, and it has an area of approximately 4.57 × 10⁶ km2. Southeast Asia is one of the most dynamic and potential-laden areas of economic development in the world. In the future of the new world’s politics and economic structure, Southeast Asia’s political and economic roles and strategic position will become more important [32]. In addition, Southeast Asia is not only a key node in the “Belt and Road”, but also a frequented area of terrorist attacks. The stability of the security environment in Southeast Asia is one of the important prerequisites for international peace and development. Therefore, constructing a model for assessing terrorist attacks and analyzing the security situation in Southeast Asia is of great practical significance for the formulation and implementation of international security strategies.
2.2. Data Processing
We use the basic data of terrorist attacks and multi-source heterogeneous data in such areas as society, nature, and the economy to build a database of different types of terrorist attacks and impact factors. Since they are structured data with location information, to conduct subsequent spatial modeling, these data need to be spatialized. At the same time, due to the multi-source heterogeneity of the data on the impact factors of terrorist attacks, it is necessary to conduct standard grid processing to ensure a unified spatial scale. This will not only facilitate the expression of regional terrorism’s influential factor distribution laws, but also realize the construction and expression of its data spatial model. The gridding divides the non-overlapping polygons in geospatial time and spatial units (0.1° × 0.1°). Each polygon is a spatial unit, and the statistical unit information can be conveniently expressed through the grid. The gridded terrorist attack impact factor data can not only reflect reality more intuitively and more realistically, but also provide a unified spatial benchmark for fusion [33].
The data on the types of terrorist attacks in Southeast Asia were spatially processed, and the multi-class impact factor data were collected on socio-economic and natural resource characteristics and then networked. This study uses the basic data of terrorist attacks and multi-source heterogeneous data such as social, natural and economic data to build a database of basic data and influence characteristics of terrorist attacks. Terrorist attack data include the longitude, latitude, type, casualties and other attributes of all terrorist attacks in Southeast Asia from 1970 to 2019. Based on the geo-environment system theory and experts′ prior knowledge, the influencing factors of terrorist attacks mainly include a variety of data collected from the social economy and natural resources, which are shown in Table 1 [34,35]. We selected the most typical 17 factors related to terrorist attacks as the influencing factors of terrorist attacks [36]. Socio-economic data include ethnic diversity, main drug regions, population density, nighttime lights, accommodation outlets, catering outlets, transportation sites, religious places, political places, etc. Natural resource data include average precipitation, average temperature and terrain, the distance to the major navigable lake, the distance to the ice-free ocean, the distance to the major navigable rivers and other data, which can affect the situation of terrorist attacks to a certain extent [37]. The sources of the impact factor data are shown in Table 1. To unify the scale, the impact factor data are normalized. We used GIS software and the Python programming language for data processing, including ArcMap 10.3 (available online: http://pro.arcgis.com/ (accessed on 20 June 2021)) and Python 3.6 (available online: https://www.python.org/ (accessed on 20 June 2021)).
2.2.1. Grid Spatialization
In order to model and analyze the multi-source heterogeneous terrorist attack data on a unified spatial scale, we carried out standard grid spatial processing. At the same time, the feature extraction of terrorist attacks was completed to provide a data foundation for subsequent model construction.
The data on terrorist attacks and impact factors were pre-processed, and some singular data (e.g., the value of each influence factor is 0, individual feature data missing) were removed. We selected appropriate methods to deal with missing values according to different data characteristics. For continuous data, such as temperature and precipitation, we filled the missing value with the average values of other regions. For discrete data such as population density, we set the missing value as 0. The data were filtered and matched with geocoding, and the final data on the types of terrorist attacks and the impact factors were obtained through data correction. All data were visualized and modeled on a uniform scale to complete the spatialization of the data on a standard grid. We conducted a standard grid spatialization (0.1° × 0.1°) on 17 types of impact factor data collected from the socioeconomic and natural resource characteristics and the types of terrorist attacks in Southeast Asia, forming 36,978 standardized grids. The specific steps are as follows:
- (1)
- Based on the GTD, the locations of terrorist attacks in Southeast Asia as well as the numbers of casualties were collected, and this information was converted into raster data, selecting a grid of 0.1° × 0.1° resolution. The number of individual terrorist attack types in each grid was determined statistically.
- (2)
- The raster data for five factors can be obtained by G-Econ 4.0 (a dataset of world economic activity): the distance to major navigable lake (km), the distance to major navigable river (km), the distance to ice-free ocean (km), the average precipitation (mm/a), and the average temperature (°C); ArcMap 10.3 was used to sample the abovementioned raster data into a 0.1° × 0.1° grid.
- (3)
- Ethnic diversity is based on the GeoEPR (National Relations Dataset); the main drug area is based on the World Drug Report and the national administrative border; nighttime lighting is based on the Earth Observation Organization; and population density and topography are based on NASA’s Earth Observatory. We used ArcMap 10.3 to sample the abovementioned data into a 0.1° × 0.1° grid.
- (4)
- With respect to points of interest (POIs), we used the Google Places API to obtain POI data on Southeast Asia and then used ArcMap 10.3 to sample them into a 0.1° × 0.1° grid.
2.2.2. Normalization
The impact data on terrorist attacks have different dimensions and orders of magnitude. If such data are processed directly, the smaller-scale indicators may be ignored, and the accuracy of the evaluation results may be reduced.
Since the features of terrorist attacks have different units, to unify the scales to avoid differences between different units, the multiple impact factors are normalized, and the normalization formula is as shown in Equation (1).
where Xi is the original value of the i-th feature of the terrorist attack, is the normalized value of the i-th feature, and are the minimum and maximum of the i-th feature of the terrorist attack, and n is the number of data points for the feature.
3. Methods
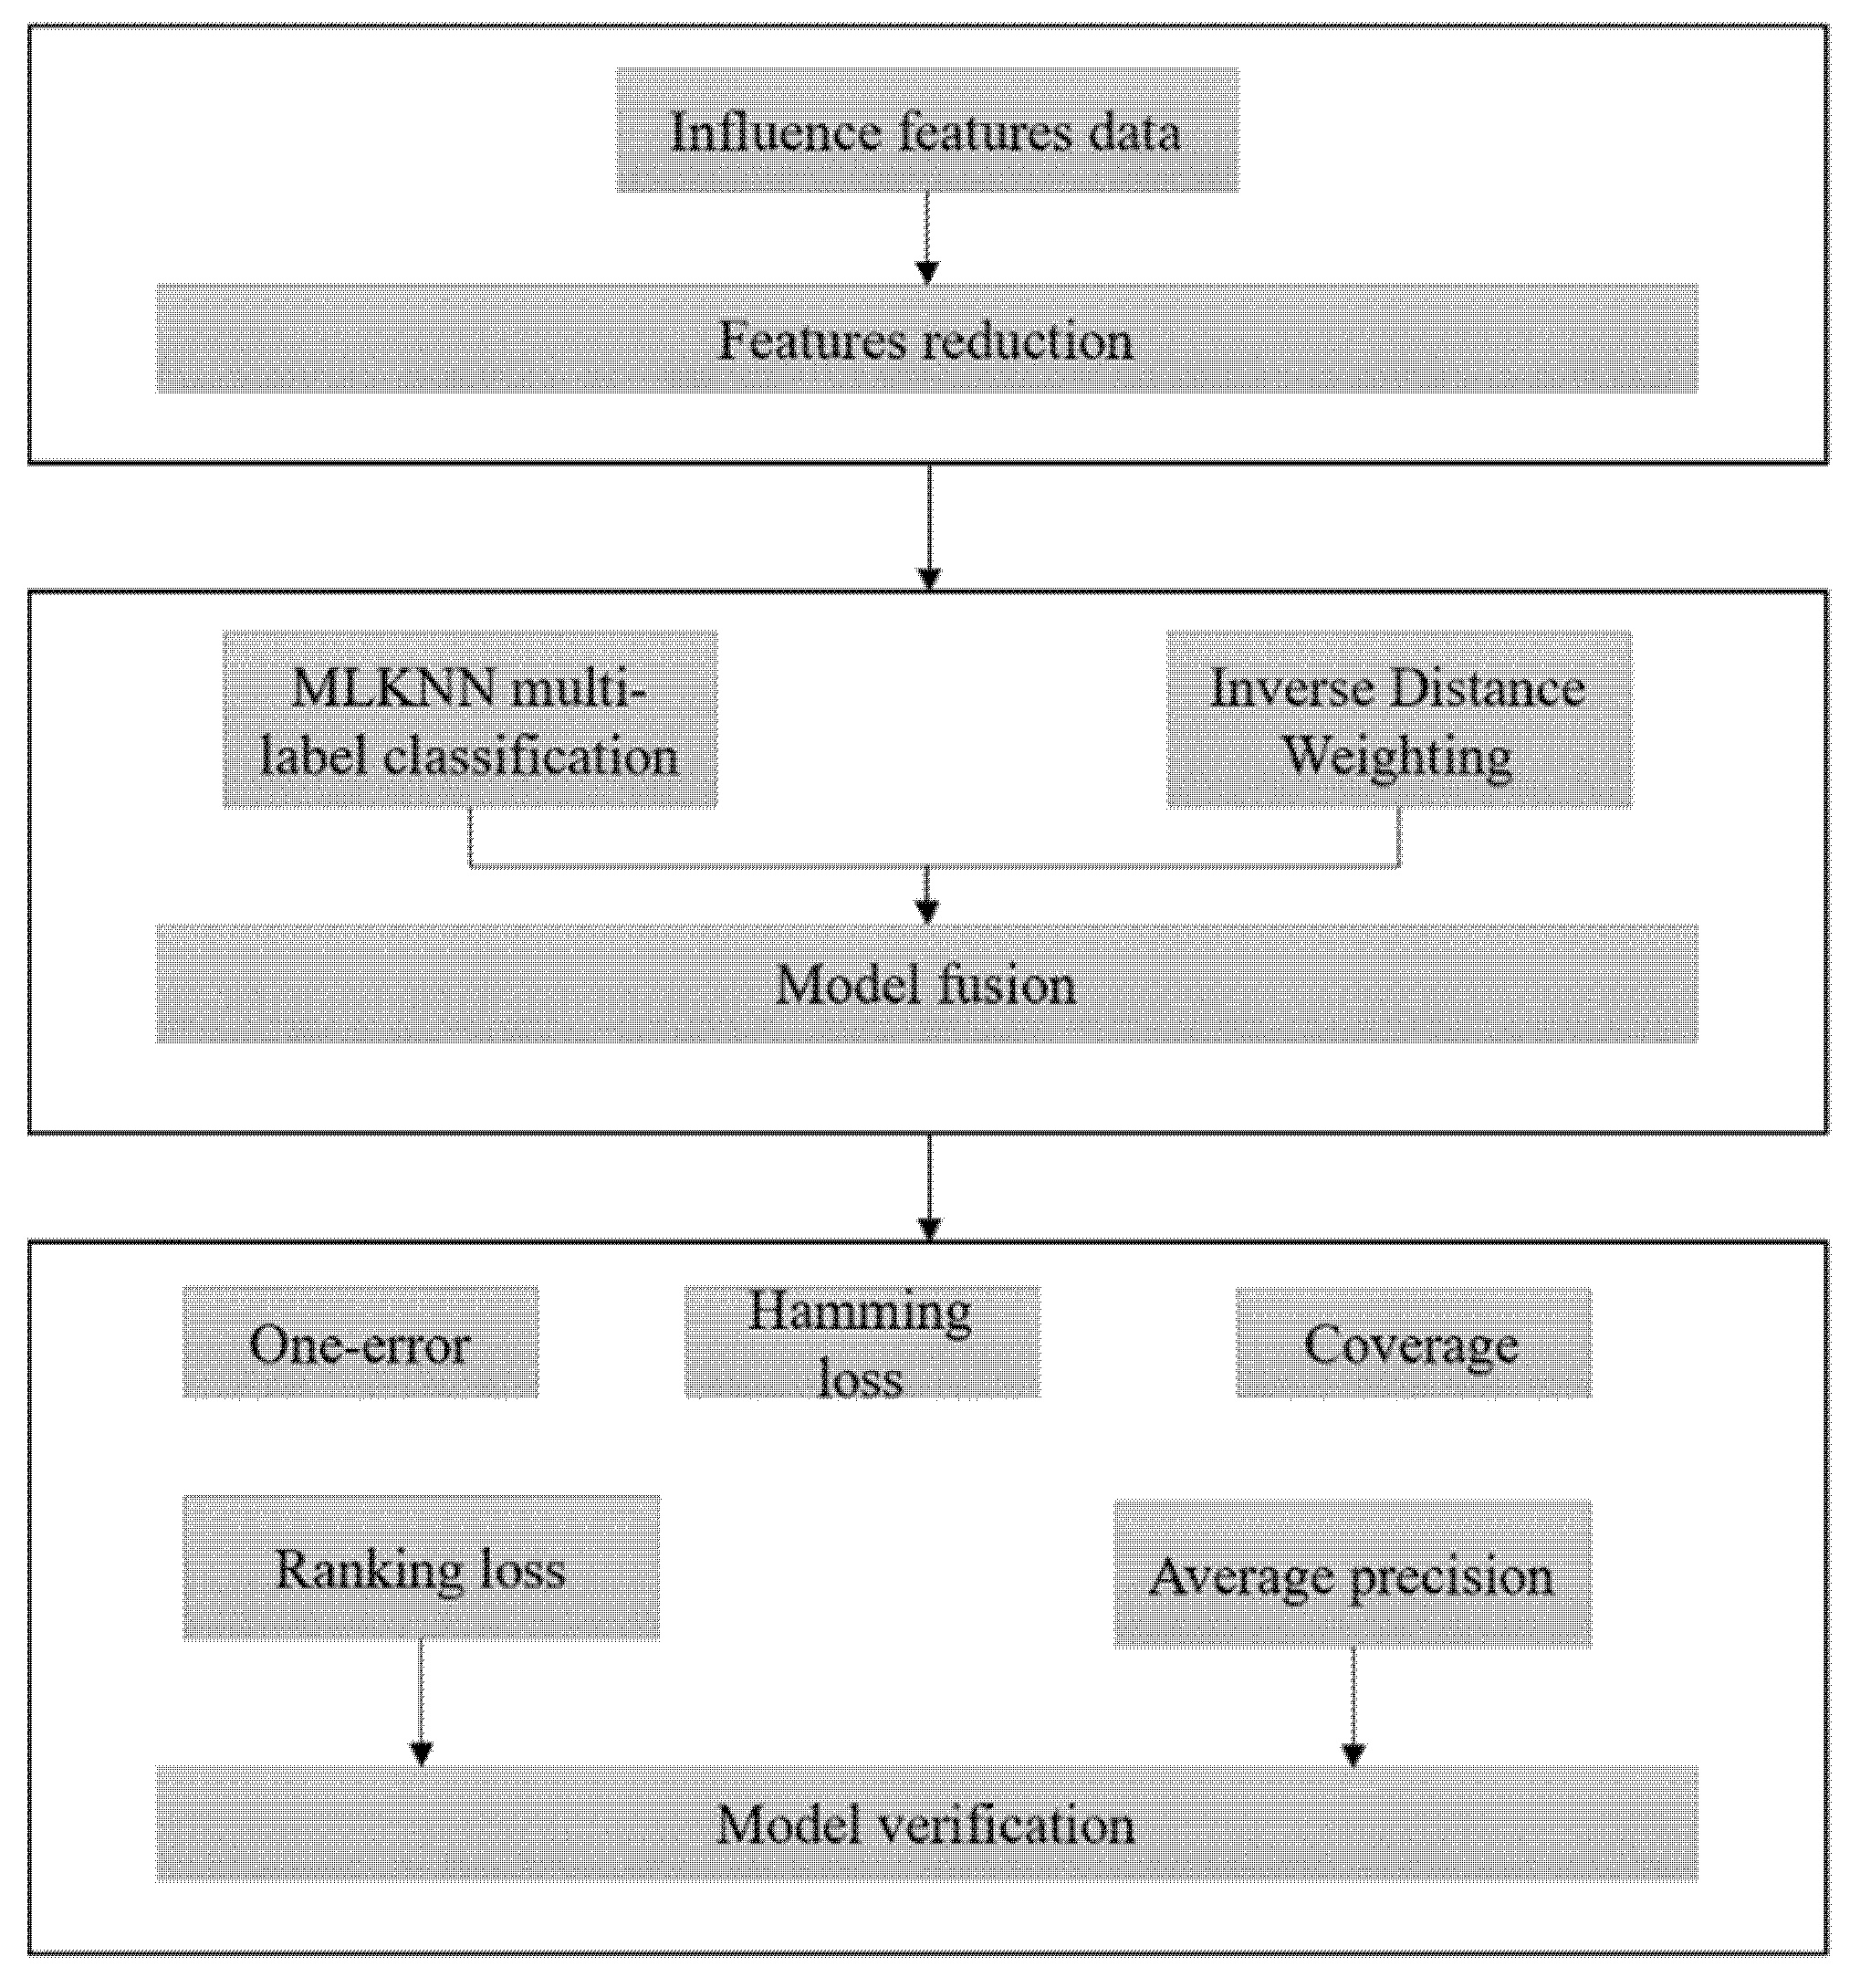
The framework of our method is shown in Figure 1. The locations and types of terrorist attacks were assessed using the machine learning method, which means that we used the locations and types of terrorist attacks that already occurred to predict the locations and types of future possible attacks. First, to remove the redundant features and noise data, we used the Locally Linear Embedding (LLE) algorithm to reduce the dimensionality of the features and calculate the correlation between the features before and after the dimension reduction through the Maximal Information Coefficient (MIC). Next, we comprehensively analyzed the impact factors and fused the MLKNN multi-label classification algorithm with the improved inverse distance weighting method from the grid-scale to construct a terrorist attack type assessment model. Finally, the validity of the model was tested.
3.1. Feature Dimension Reduction
To eliminate redundant features and noise data in the impact factors and improve the performance of the model, we reduced the dimensions of the impact factors of terrorist attacks. Dimensionality reduction is an effective algorithm for eliminating noise data and extracting useful information. To determine the best method to effectively reduce the dimension of the features while retaining the main information of the features as much as possible, scholars conducted a series of research studies and proposed a number of algorithms, such as the Genetic Algorithm (GA) and Principal Component Analysis (PCA). The GA is a search algorithm inspired by evolutionary biology, which effectively crosses the large solution space. However, the GA may increase the complexity of experiments [38]. PCA is an unsupervised algorithm that can linearly group the original features. However, the new principal component cannot be interpreted, and the threshold for accumulating interpretability variance must be adjusted manually [39]. As a typical representative of the nonlinear dimensionality reduction algorithm, LLE [40] can keep the original topological structure of the reduced data and learn any dimensional local linear low dimensional manifold with higher efficiency [41]. In order to reduce the dimension of data efficiently and keep the original topological structure after dimension reduction, we used LLE. At the same time, to ensure good interpretability of the reduced-dimensional data, the MIC was used to analyze the correlation between the reduced-dimensional features and the original 17 impact factors to explore the relationship between the features of dimensionality reduction.
3.1.1. LLE Algorithm
The basic concept of LLE is to transform the global nonlinear relationship into a local linear relationship and maintain the local geometric features of the data. In essence, LLE maps neighbors on a manifold to neighbors on a low-dimensional space. The advantages of this algorithm are high efficiency, few parameters and easy implementation [42,43].
- (1)
- Algorithm principle
Input: Sample set , the nearest neighbor k, dimensionality reduction d.
Output: Low dimensional sample set matrix D′.
For the sample , we calculate the distance between one sample and the other n-1 samples, and select the nearest k points as the nearest neighbors of the sample . k is a predetermined value, and the distance calculation generally adopts the Euclidean distance.
For the sample , the local covariance matrix [44] is calculated using Equation (2).
Let denote the corresponding weight coefficient vector, where is a vector with k dimensions of all 1 [45]. The can be calculated by Equation (3).
The local reconstruction weight matrix W consists of , and the output of the sample is calculated by W and its neighbors. Next, the matrix can be calculated by Equation (4), and the eigenvector corresponding to the first d + 1 eigenvalues of the matrix M is . The matrix formed by the second eigenvector to the (d + 1)th eigenvector is the output low-dimensional sample set matrix .
- (2)
- Intrinsic Dimension
The dimension reduction d is a key parameter. If the dimension of the reduction is too high, the output is susceptible to redundant features and noise data. If the dimension of the reduction is too low, the intrinsic features of the sampled data cannot be effectively extracted, and the information contained in the original data is not retained. The d in this paper can be calculated, and the calculated dimension is called the intrinsic dimension. We use the eigenvalue method to calculate the intrinsic dimension [46,47]. The outputs of the intrinsic dimension after reduction include the main information of the sample. Generally, the value of k should be greater than the intrinsic dimension d of the sample. The formula for calculating the intrinsic dimension is as Equation (5).
In the equation, d is the intrinsic dimension, k is the number of nearest neighbors, m is the number of samples, and 0.95 is the threshold value set according to the eigenvalue method [48]. is the eigenvalue of , and it is sorted from large values to small values. The intrinsic dimension of each sample needs to be calculated, and the intrinsic dimension of the sample dataset is determined by voting [48].
3.1.2. Relevance Analysis
We use the MIC to explore the influence of dimensionality reduction on feature correlation [49]. When there are enough statistical samples, the MIC can capture a wide range of relationships and explore the characteristics of dimensionality reduction.
The MIC is developed on the basis of mutual information, and it is suitable for exploring the potential relationship between the pairs of variables in the dataset, which is fair and extensive. The MIC is calculated using Equation (6).
where X and Y represent variables, n represents the size of the sample, i × j < B (n) represents the dividing dimension limit of the grid G, G represents the variable pair divided into i × j grids, and represents the characteristic matrix of X and Y [50]. In this paper, B(n) = , and 0 ≤ MIC ≤ 1.
3.2. I-MLKNN
MLKNN is an effective machine learning algorithm, which can not only evaluate the multi types of terrorist attacks, but also improve the accuracy of classification. However, it cannot solve the problem of the spatial distance between assessment types. The inverse distance weighting method can effectively evaluate the spatial impact of terrorist attack events on each other. Therefore, combining the machine learning model MLKNN with the empirical model can enable comprehensive consideration of the various types of terrorist attacks and the spatial distance between them.
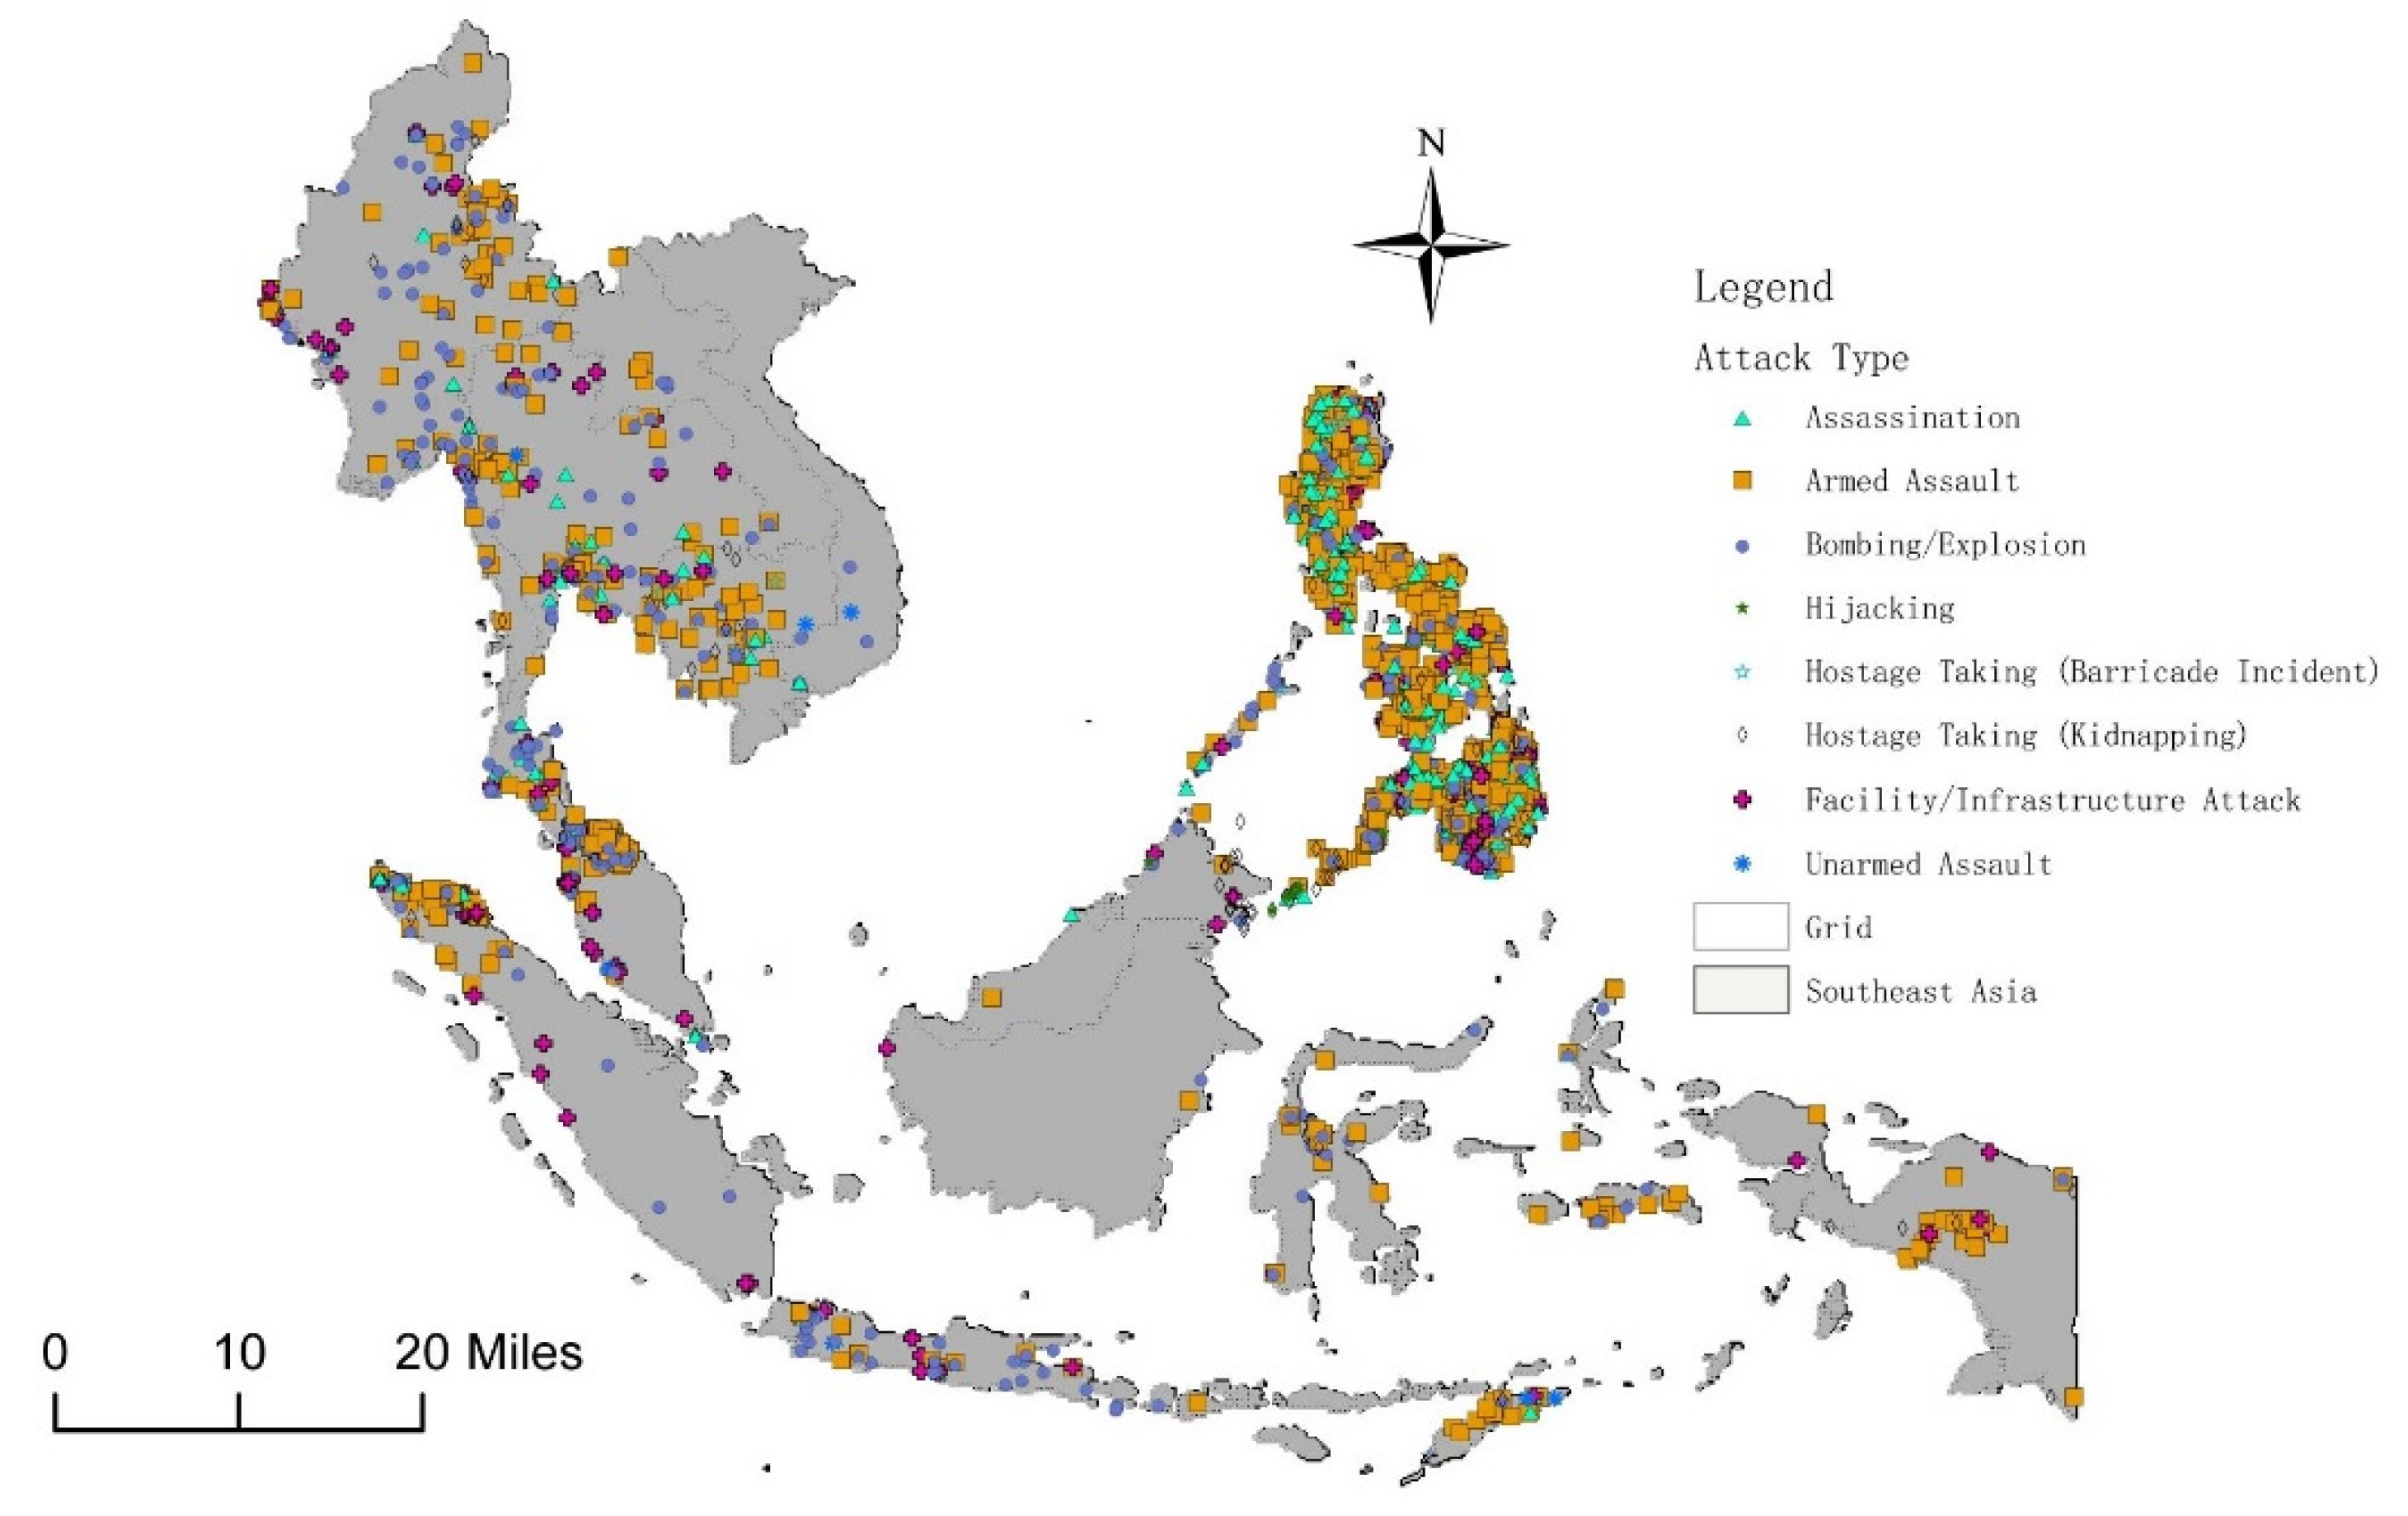
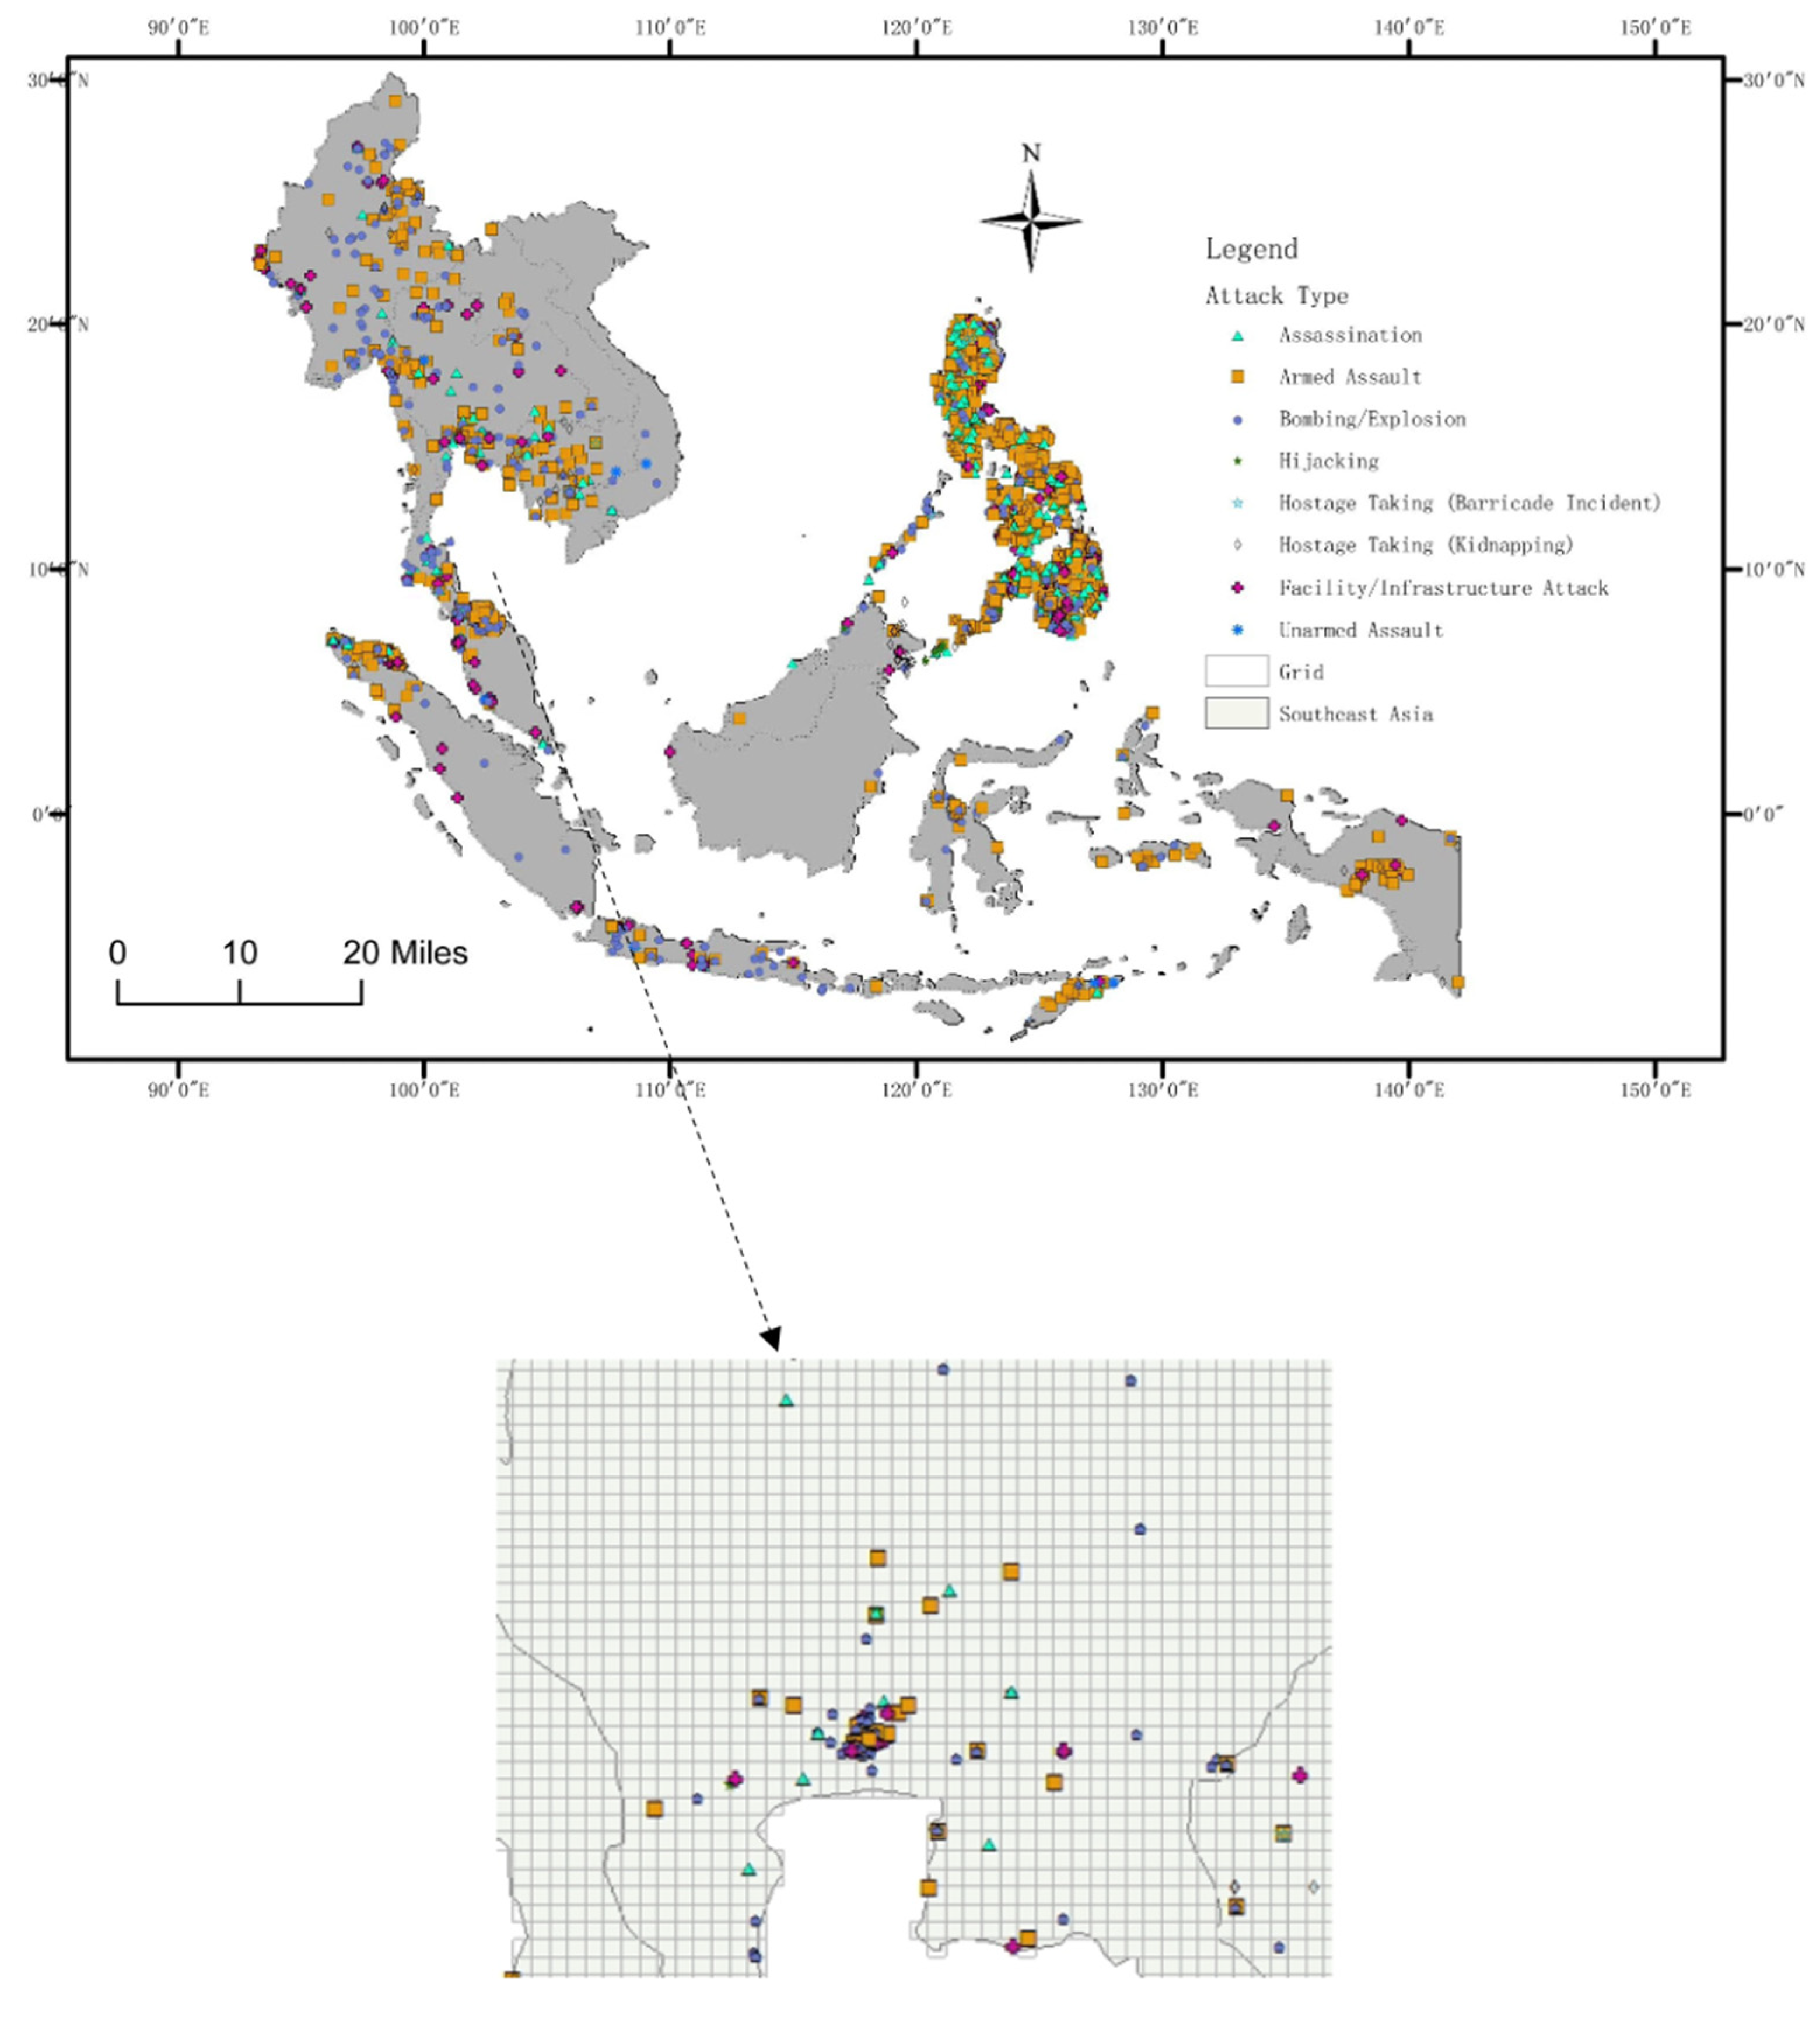
The spatial grid data for terrorist attack types in Southeast Asia are shown in Figure 2. In Figure 2, the points with different shapes represent different types of terrorist attacks. There are many terrorist attacks, mainly concentrated in the southernmost part of the Indo-China Peninsula and the Philippines (Figure 2). As shown in Figure 3, there may be one or more types of terrorist attacks on each grid. Meanwhile, the proposed method is to predict the distribution of different types of terrorism that may occur in a grid without terrorist attacks, which is defined as the multi-label classification problem in machine learning. A multi-label classification problem is one in which the same sample can have multiple labels or be divided into multiple categories [22,23,24,51,52]. The impact factors of each grid in this paper are the features of each sample, and the type of attack that occurs on each grid is equivalent to the label of each sample. According to the features of terrorist attack types, the MLKNN multi-label classification algorithm is used to obtain the probability of occurrence of 8 types of terrorist attacks in each grid. Considering that the types of attacks on each grid will be affected by the types of attacks on the surrounding grids, we use the inverse distance weighting method to obtain the average influence of each type of terrorism on the surrounding grid. The results of the two models are combined to complete the assessment of types of terrorist attacks.
3.2.1. MLKNN
The MLKNN algorithm is modified based on the KNN algorithm and uses the K-nearest neighbor classification criterion. After obtaining the k nearest neighbors of the sample, the label information contained in the neighbor samples is counted, and the label set of the test sample is predicted by maximizing the posterior probability. Let denote the datasets and denote the corresponding labels. The known test sample is x, and its corresponding set of labels is y, with . represents the label set vector of sample x. For each label, if x has label l, then ; otherwise, . Let denote the set of k nearest neighbors of the test sample x in the training set, and let denote the number of samples of the neighbor set that have the label l. indicates the event that the sample x contains label l, and indicates the event that the sample x does not contain label l. denotes the event in which j samples of the k-nearest neighbor of sample x contain the label l.
The classification function of the MLKNN algorithm based on the Bayesian probability formula is as follows.
Equation (7) determines whether sample x contains the label l. For each label l, its corresponding prior probability can be calculated from Equation (8).
where s is a smoothing parameter, generally s is 1, m is the number of training sample sets, and is the number of samples containing the label l in the training set.
The posterior probability can be calculated using Equations (9) and (10).
where represents the number of samples in which the label l is shared by itself and j of the k nearest neighbors, and represents the number of samples for which the label l does not apply, but j of the k nearest neighbors of the sample are the label [20,53].
We calculate the probability of terrorist attack type l in grid x by Equation (11):
where P(l) represents the probability of terrorist attack type l on the grid x, indicates the event that the grid x has had the terrorist attack type l, indicates the event that the grid x has not had the terrorist attack type l, and indicates the event that there are j grids in the neighbor set of grid x that have had the terrorist attack type l.
3.2.2. Inverse Distance Weighting
The type of terrorist attack occurring in one grid will be affected by the type of terrorist attack occurring in adjacent grids. The IDW method is based on the concept of Tobler’s first law (Geography first law) in 1970. Its idea is that everything is related to everything else, but near things are more related than distant things [54]. At the same time, the IDW method has been regarded as one of the standard spatial analysis procedures in geographic information science [55,56]. It is relatively fast and easy to compute, and straightforward to interpret [57]. Inverse distance weighting is good at explaining the influence of distance on the interaction between things. Therefore, we reference the expression of the inverse distance weighting method and propose a model that applies to the types of terrorist attacks.
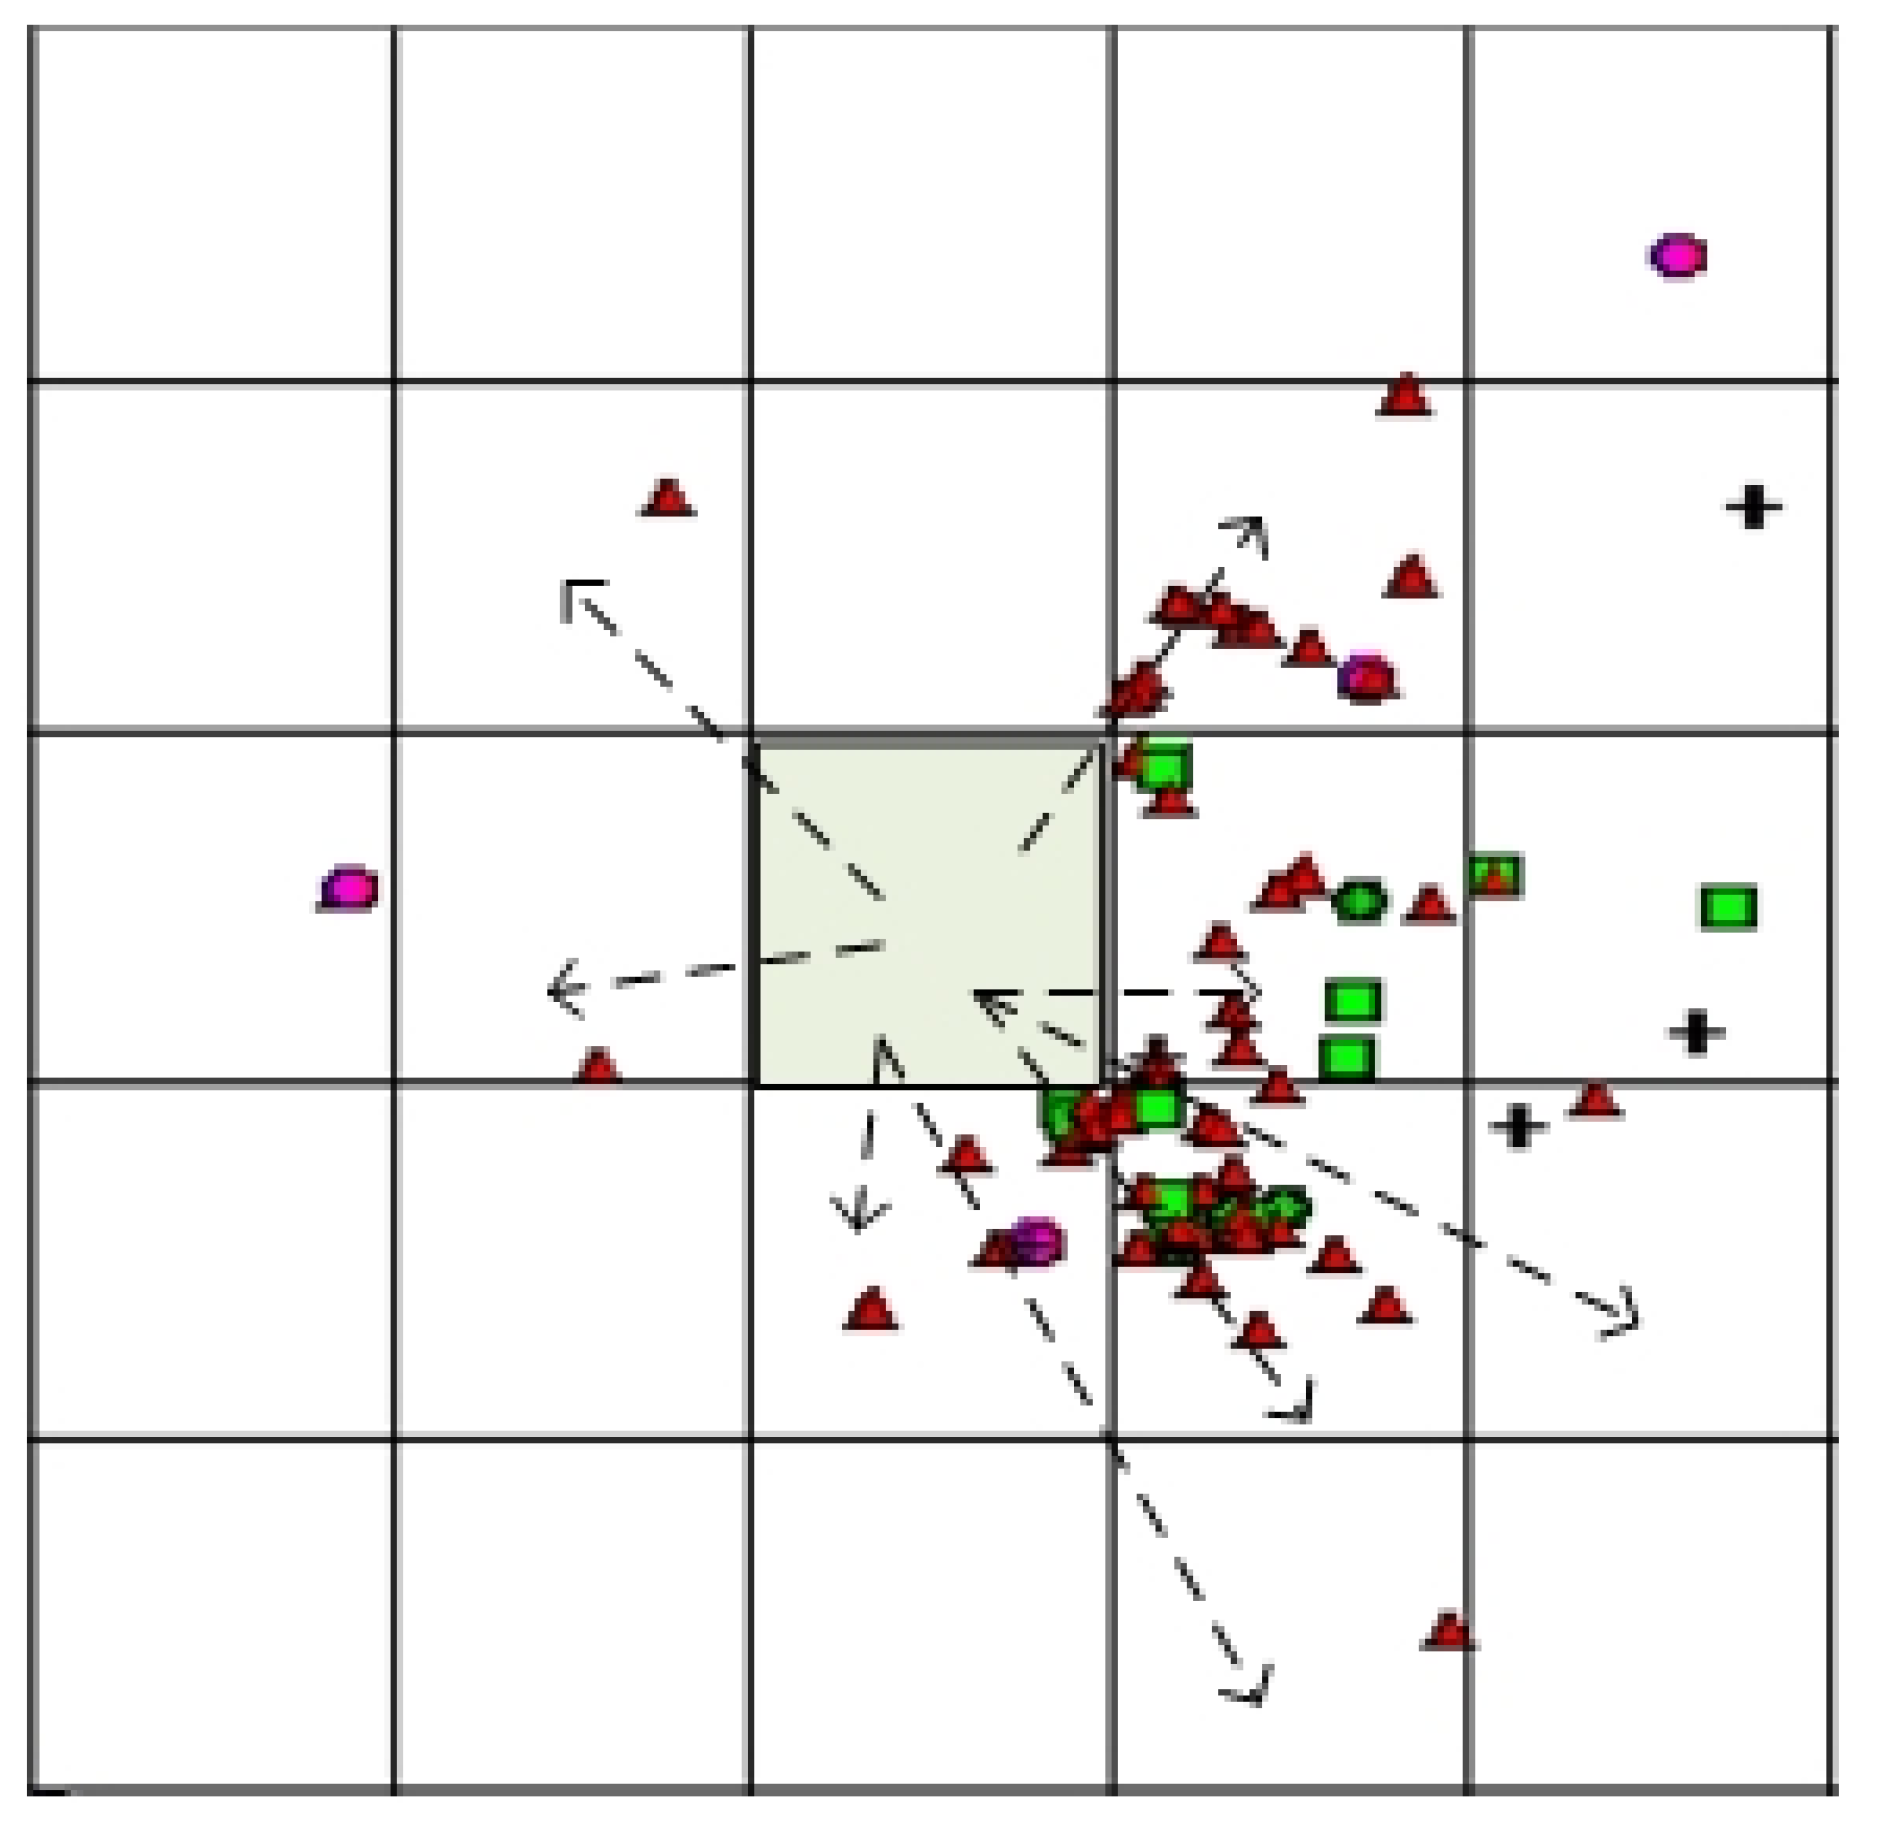
where indicates that the weighting of grid i is affected by grid j, is the distance between grid i and grid j, and b is the distance friction coefficient. In this paper, b was set as 2. Additionally, n is the number of grids in which the terrorist attack type l has occurred [58]. The impact of grid i on the types of terrorist attacks of its neighbors is shown in Figure 4, where “△” represents the terrorist attack type l. The possibility of a terrorist attack of type l on grid i is affected by the average influence of the surrounding grids, which can be calculated by Equation (13).
where indicates that the probability of a terrorist attack of type l on grid i is affected by the average influence of the surrounding grids, represents the number of terrorist attacks of type l that occurred on grid j, and n is the number of grids in which the terrorist attack type l has occurred [58].
3.2.3. I-MLKNN
The probability that each type of terrorist attack occurred on the grid x obtained by using the MLKNN model and the average influence of each type of attack on the grid x obtained by using inverse distance weightings are fused by certain rules. Then, the probability of each type of terrorist attack occurring on each grid is calculated. The fusion rules refer to F1-Score. F1-Score is a measure of the classification problem. Many machine learning competitions with multi-classification problems often take F1-Score as the final evaluation method. It is the harmonic average of the accuracy rate and recall rate, with a maximum of 1 and a minimum of 0. Therefore, we set the fusion rules by referring to the classification and measurement index of F1-Score [59]. The fusion rule is shown in Equation (14).
This equation is the weighted harmonic average of the MLKNN model and the inverse distance weighting method. The F value indicates the possibility of each type of terrorist attack on grid x; indicates the probability of the occurrence of eight types of terrorist attacks on grid x based on the impact factors; indicates that the type of terrorism on grid x is affected by the surrounding grids; and ranges from 0.5 to 3, which indicates the weight ratio of P and G in the fusion rule, and the smaller the value is, the larger the proportion of G.
3.3. Verification Analysis
In this paper, the Hamming loss, One-error, Coverage, Ranking loss and Average precision multi-label classification algorithm evaluation indexes were used to evaluate the effectiveness of the terrorist attack assessment model.
To train and validate the performance of the assessment model, we used a ten-fold cross-validation method. The dataset is divided into 10 parts, and 9 of them are taken as training data and one is used as test data for verification. We performed 10 ten-fold cross-validations and averaged them as an evaluation of the accuracy of the model. For test sets , the following metrics were used to evaluate model performance.
The Hamming loss examines the misclassification of a sample on a single label. This means the label belonging to the sample does not appear in the label set of the sample, and the label that does not belong to the sample appears in the label set of the sample.
where represents the difference in the symmetry between the two sets, and represents the size of the set returned.
The One-error index indicates the case where the label at the top of the sequence does not belong to the sample in the sorted sequence of the label set owned by the sample.
The Coverage index indicates the depth of the search required to cover the labels owned by the sample in the sorted sequence of label sets.
The Ranking loss index indicates the occurrence of an incorrect sort in the sorted sequence of label sets owned by the sample.
where represents the complement of in set Y.
The Average precision index indicates that in the sorted sequence of label sets owned by the sample, the label that precedes the label owned by the sample still belongs to the set of labels owned by the sample.
For the Hamming loss, One-error, Coverage, and Ranking loss evaluation indexes, the smaller the value is, the better the model performance; for the Average precision evaluation index, the larger the value is, the better the model performance.
4. Experimental Result
4.1. Reduced-Dimensional Data Correlation Analysis
In this paper, the data from the 17 factors affecting the types of terrorist attacks are used to calculate the intrinsic dimension according to Equation (5), and the intrinsic dimension is six. The feature is then reduced to six dimensions using the LLE algorithm. To reach good interpretability for the reduced dimensional data, we use the MIC to explore the correlation between the data, and the correlations between the features before and after the dimension reduction are shown in Table 2. It can be seen that factors 1 and 2 represent spatial locations and major drug areas, and their correlations are greater than 0.5; factor 3 has a greater correlation with the distance to the main navigation lake and the main drug areas; factor 4 and the location of the terrorist attack (longitude) and the distance to the main navigation lake are more closely related, and both correlate greater than 0.6; factor 5 is mainly related to the location of the terrorist attack (latitude and longitude), ethnic diversity, and the distance to the major navigable river; and factor 6 is mainly associated with the location of the terrorist attack (latitude), the distance to ice-free oceans, and ethnic diversity. Through the dimension reduction process, redundant features can be removed and similar features can be merged, thus making the established terrorist attack assessment model more precise [60,61].
4.2. I-MLKNN Parameter Analysis
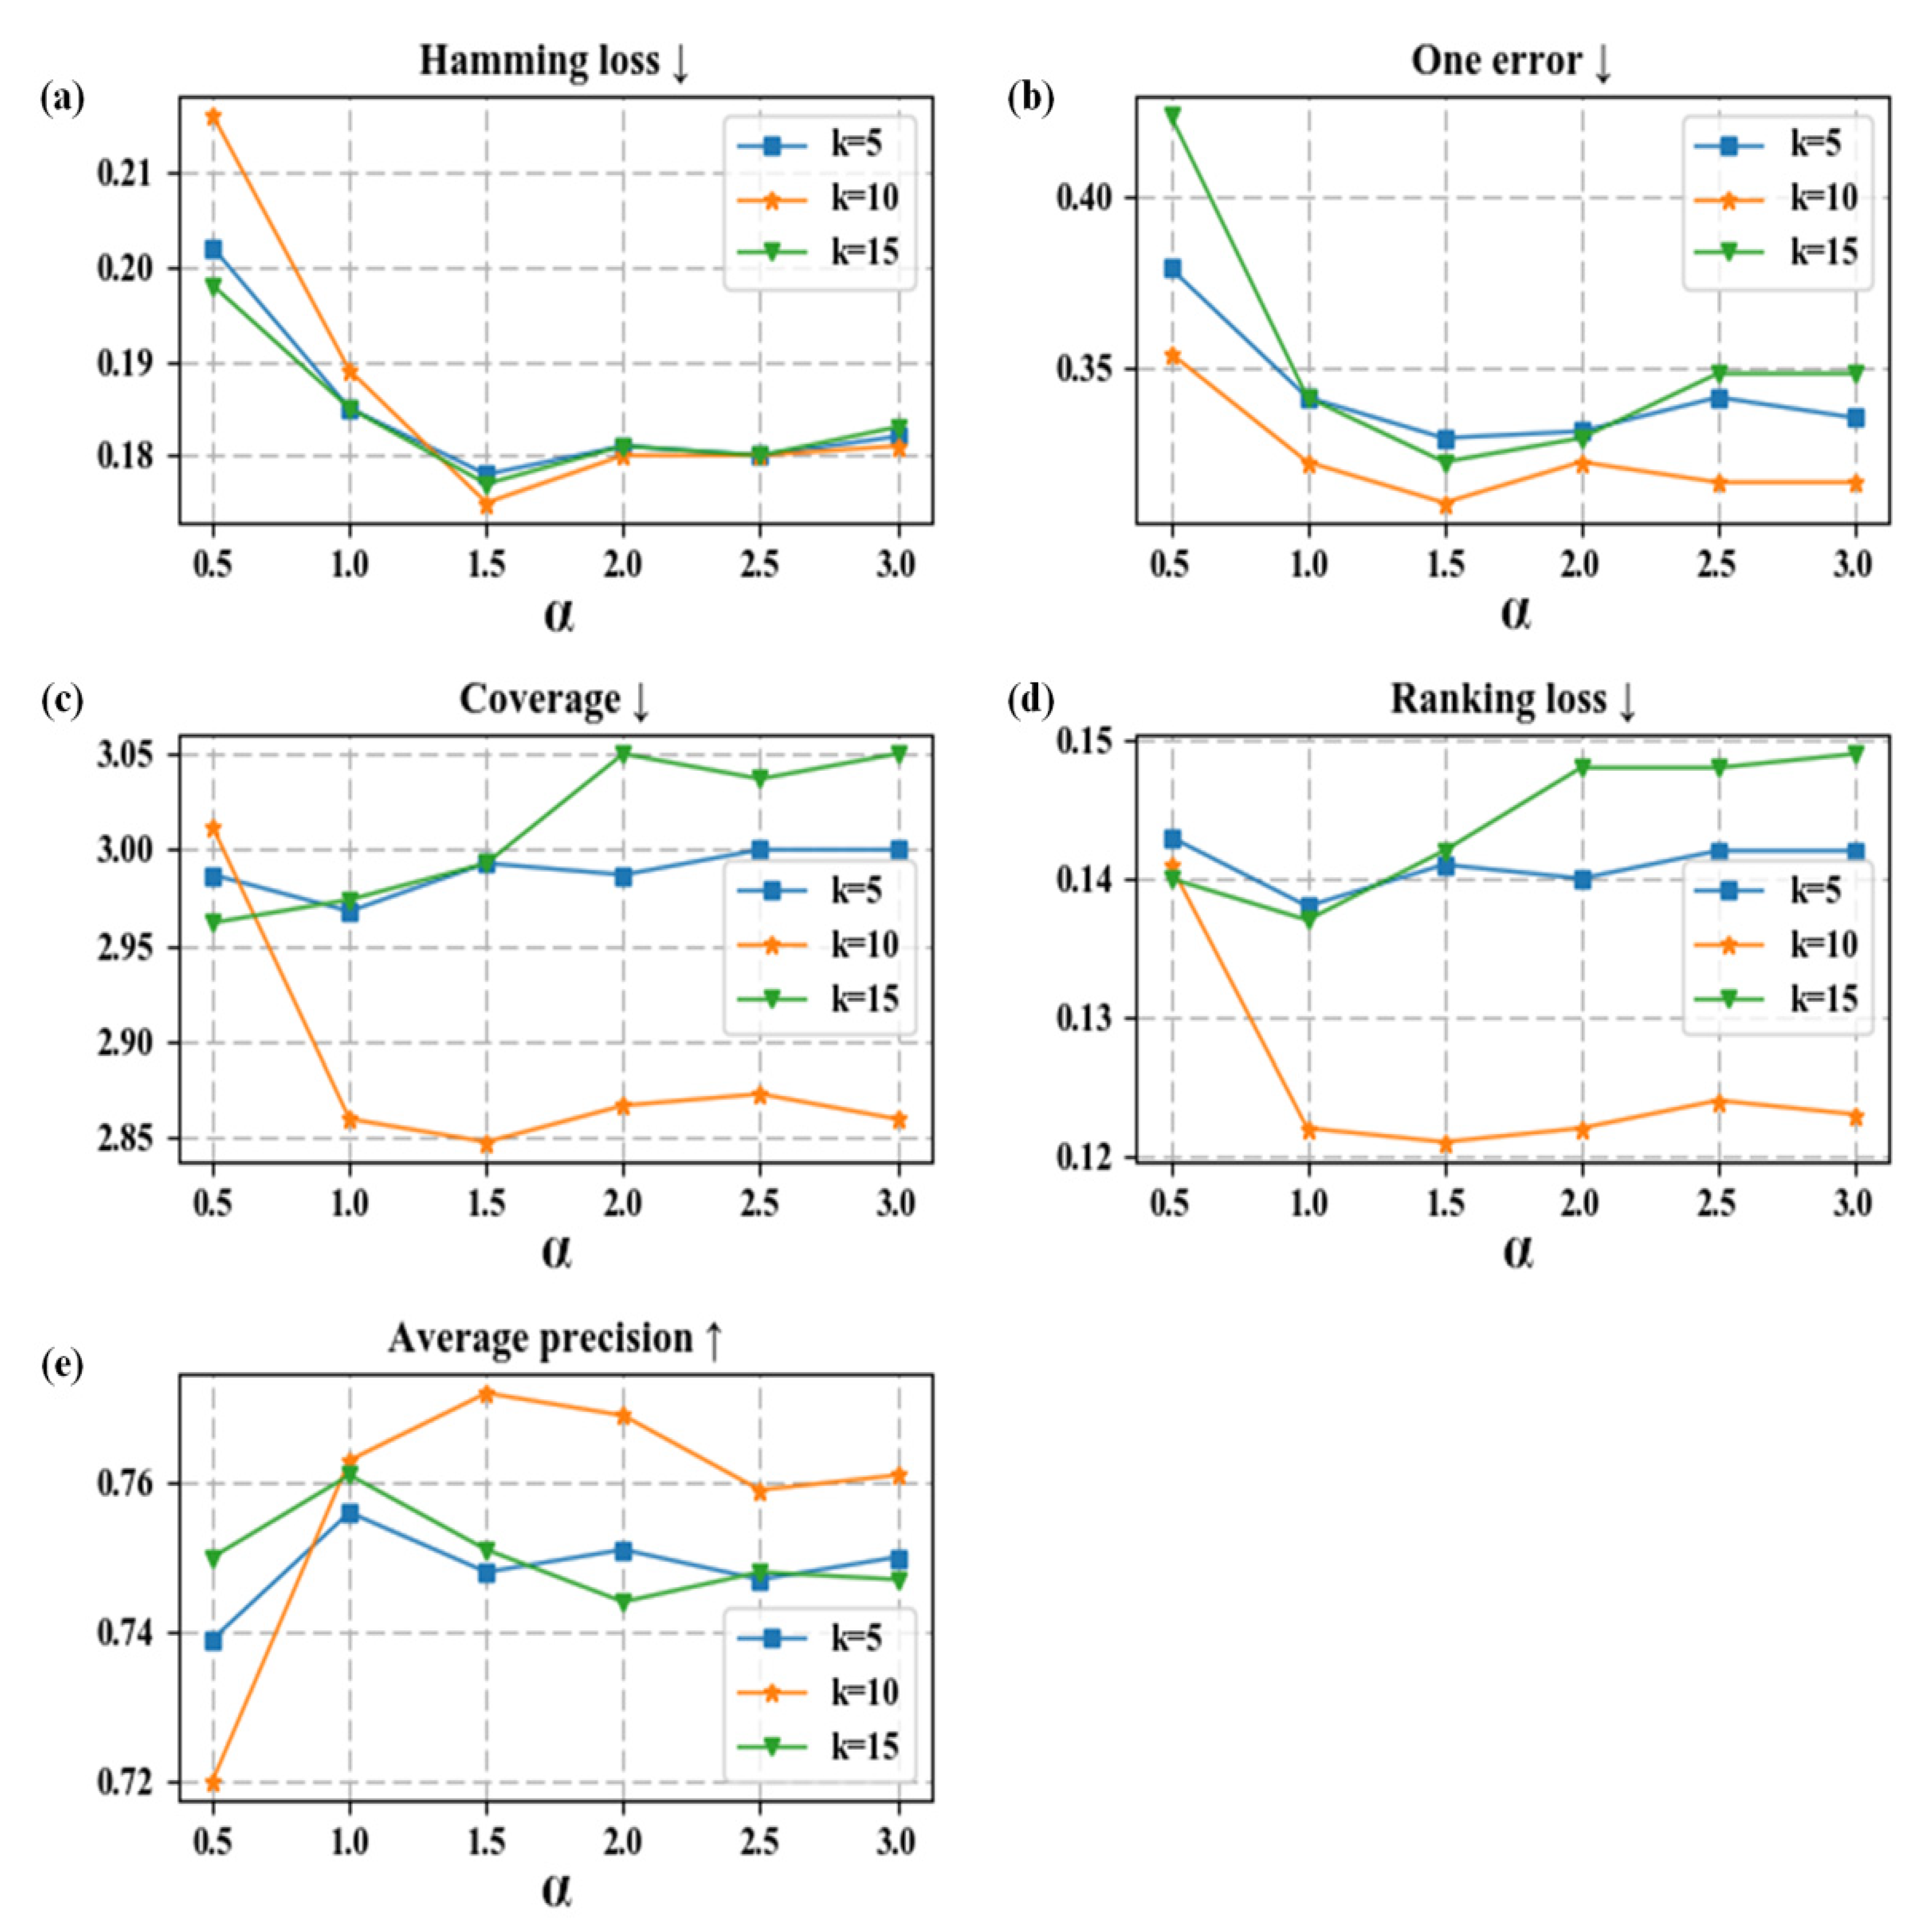
I-MLKNN has two parameters, and k. represents the weight of the MLKNN and the inverse distance weighting in I-MLKNN, and the smaller the is, the larger the proportion of the inverse distance weighting; k represents the nearest neighbor of MLKNN in I-MLKNN. The five evaluation proxy values of I-MLKNN under different parameters are shown in Figure 5. For the Hamming loss, One-error, Coverage, and Ranking loss evaluation indexes, the smaller the value is, the better the model performance; for the Average precision evaluation index, the larger the value is, the better the model performance. In this paper, the range is 0.5 to 3, and k is 5 to 15 for model verification. As increases, the values of the Hamming loss, One-error, Coverage, and Ranking loss indexes decrease first and then increase, and the Average precision index increases first and then decreases. The values of the five evaluation proxies are optimal at the same time when and k = 10. Therefore, the choice of is 1.5 and k = 10 to complete the assessment of the types of terrorist attacks.
4.3. Comparison and Evaluation of Different Algorithms
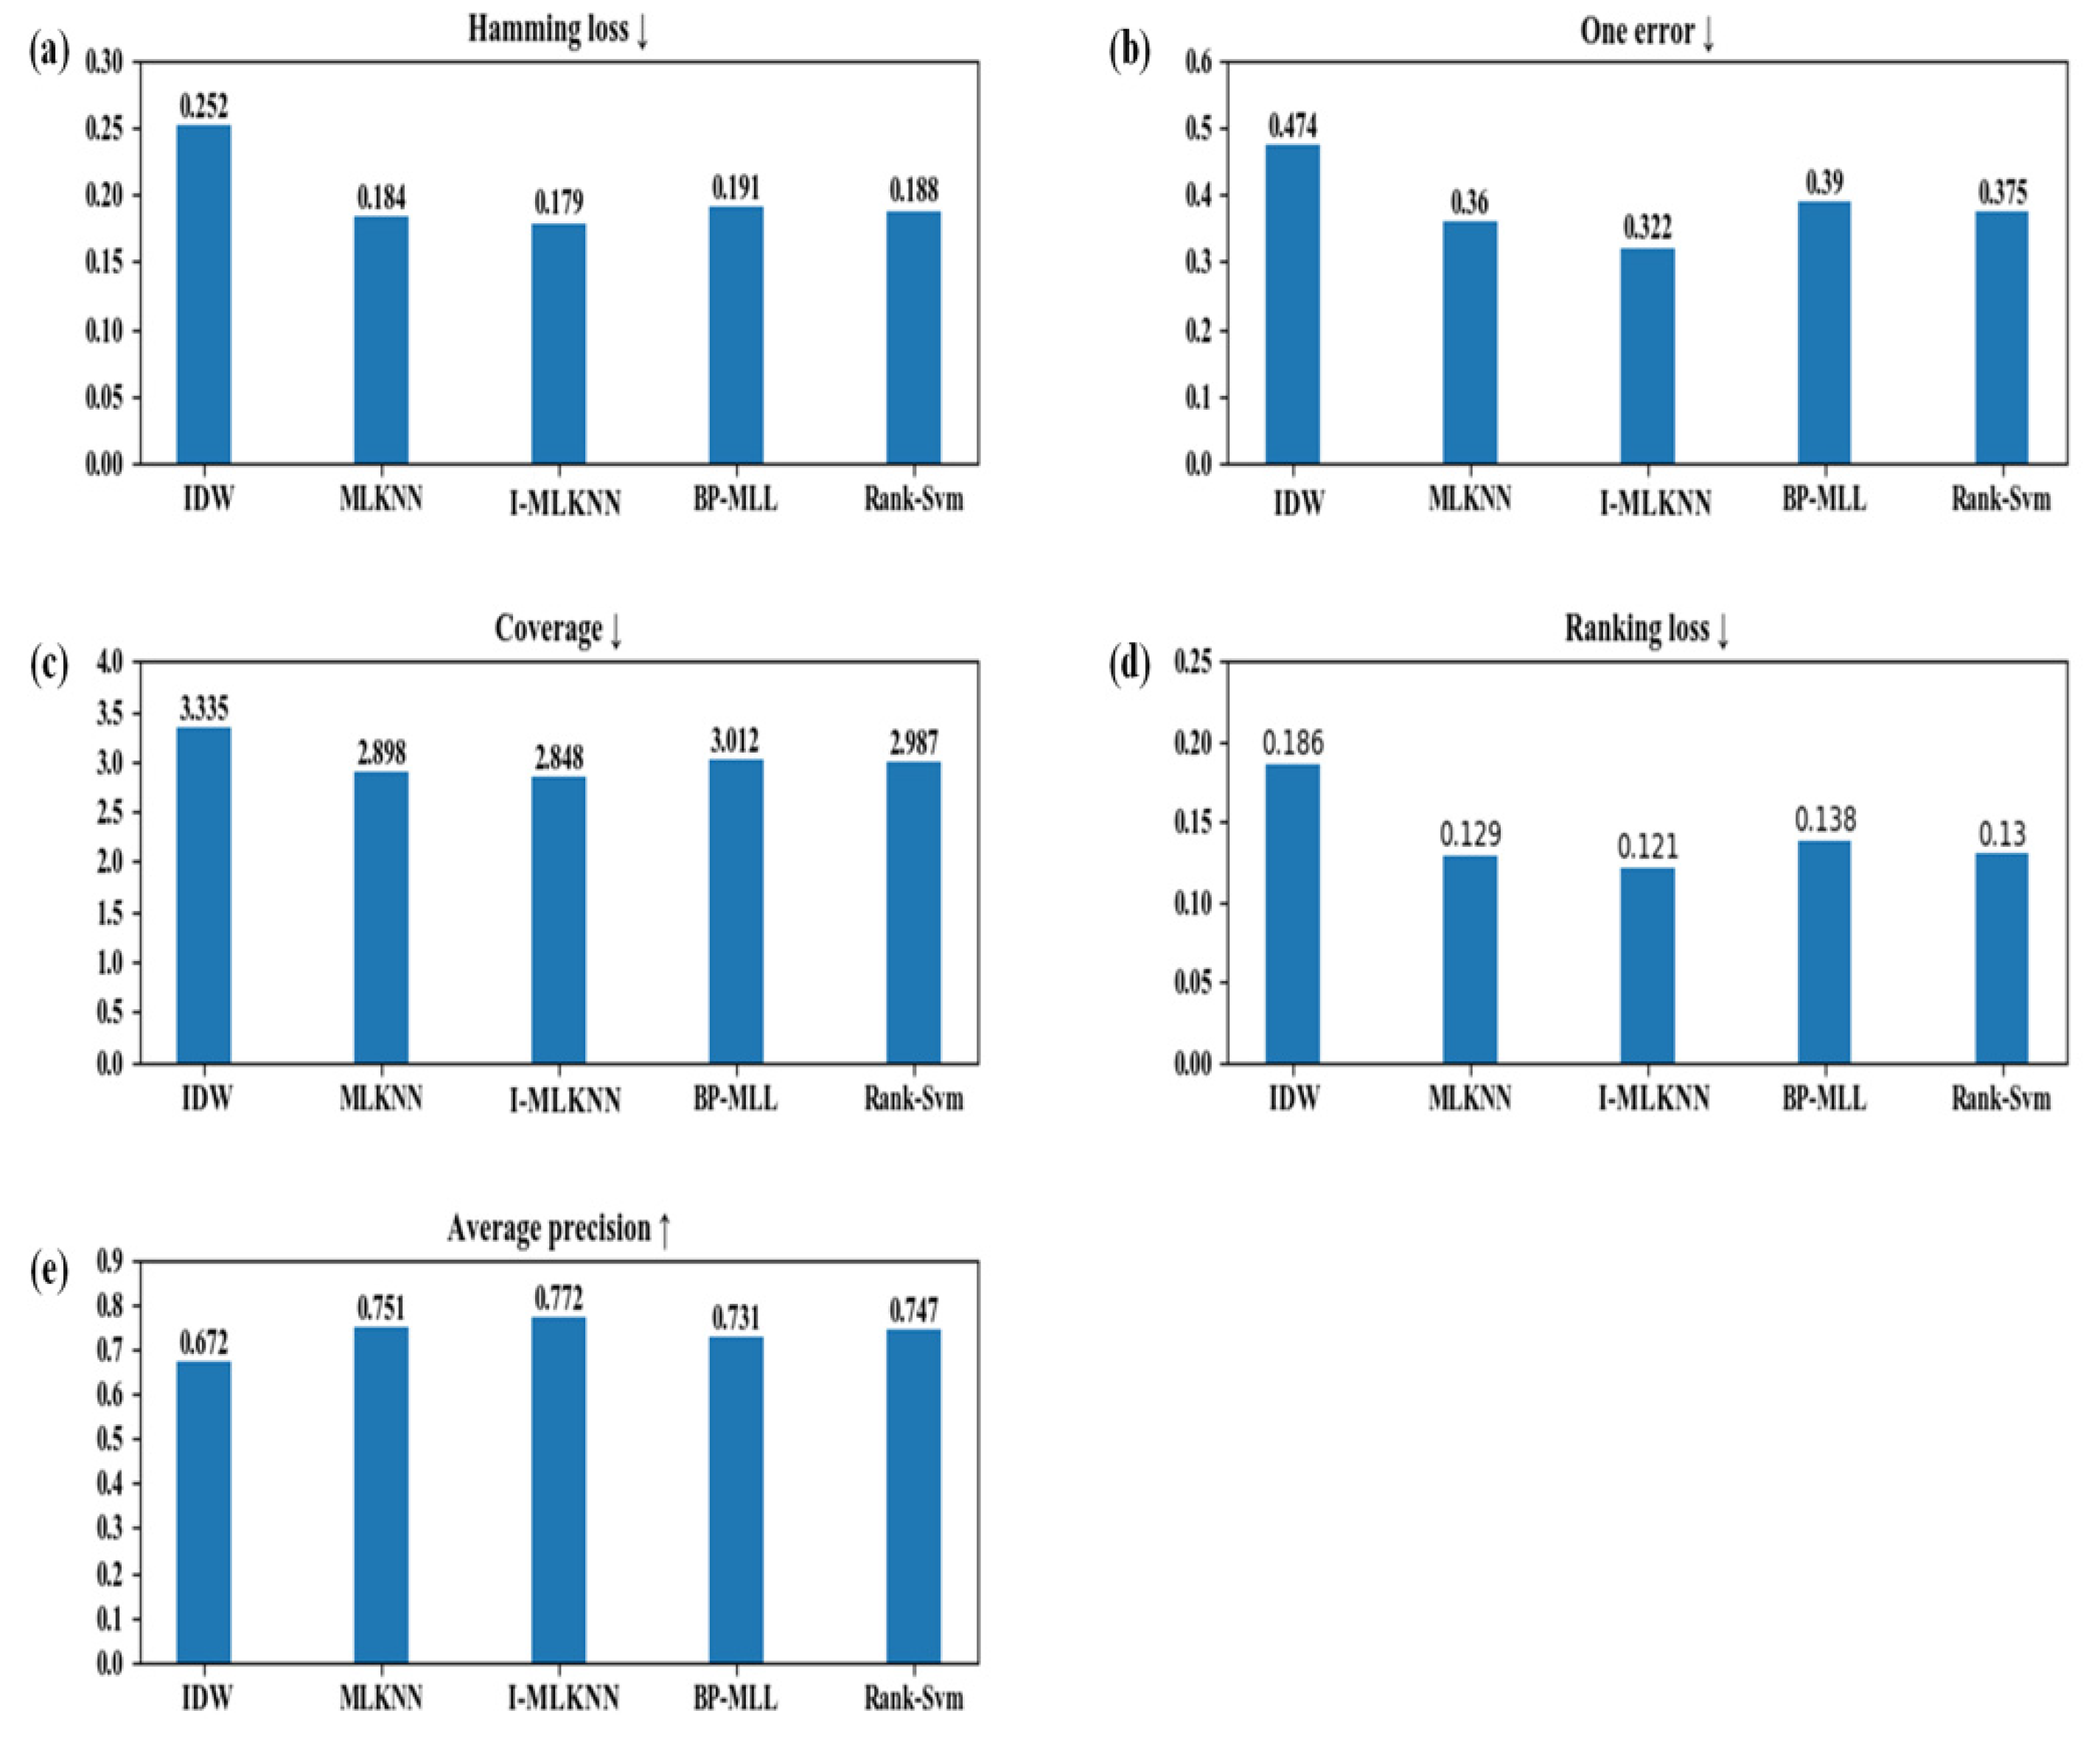
The I-MLKNN algorithm was compared with other multi-label classification algorithms, namely IDW, MLKNN, BP-MLL, and Rank-SVM. The results are shown in Figure 6. From Figure 6, we can conclude that the evaluation proxies of I-MLKNN are better than those of the MLKNN and the inverse distance weighting method alone, and they are better than the values of the other two multi-label classification algorithms Rank-SVM and BP-MLL. This further confirms the scientific nature and accuracy of the I-MLKNN-based assessment method for the types of terrorist attacks.
4.4. Risk Analysis of Terrorist Attacks
In this paper, we use the I-MLKNN algorithm to evaluate the spatial distribution of different types of terrorist attacks in Southeast Asia on a grid scale, and the probability of different types of terrorist attacks on each grid is obtained (as shown in Figure 7). In Figure 7, the darker the color is, the less likely an attack is to occur in the area, and a lighter color indicates a higher risk of this type of terrorist attack. Then, we use the Analytical Hierarchy Process (AHP) method to evaluate the occurrence of eight types of terrorist attacks. Then, we comprehensively calculate the probability of all types of terrorist attacks in each grid [62], which is the probability of a terrorist attack, to analyze the risk of terrorist attacks in Southeast Asia and assess the security situation.
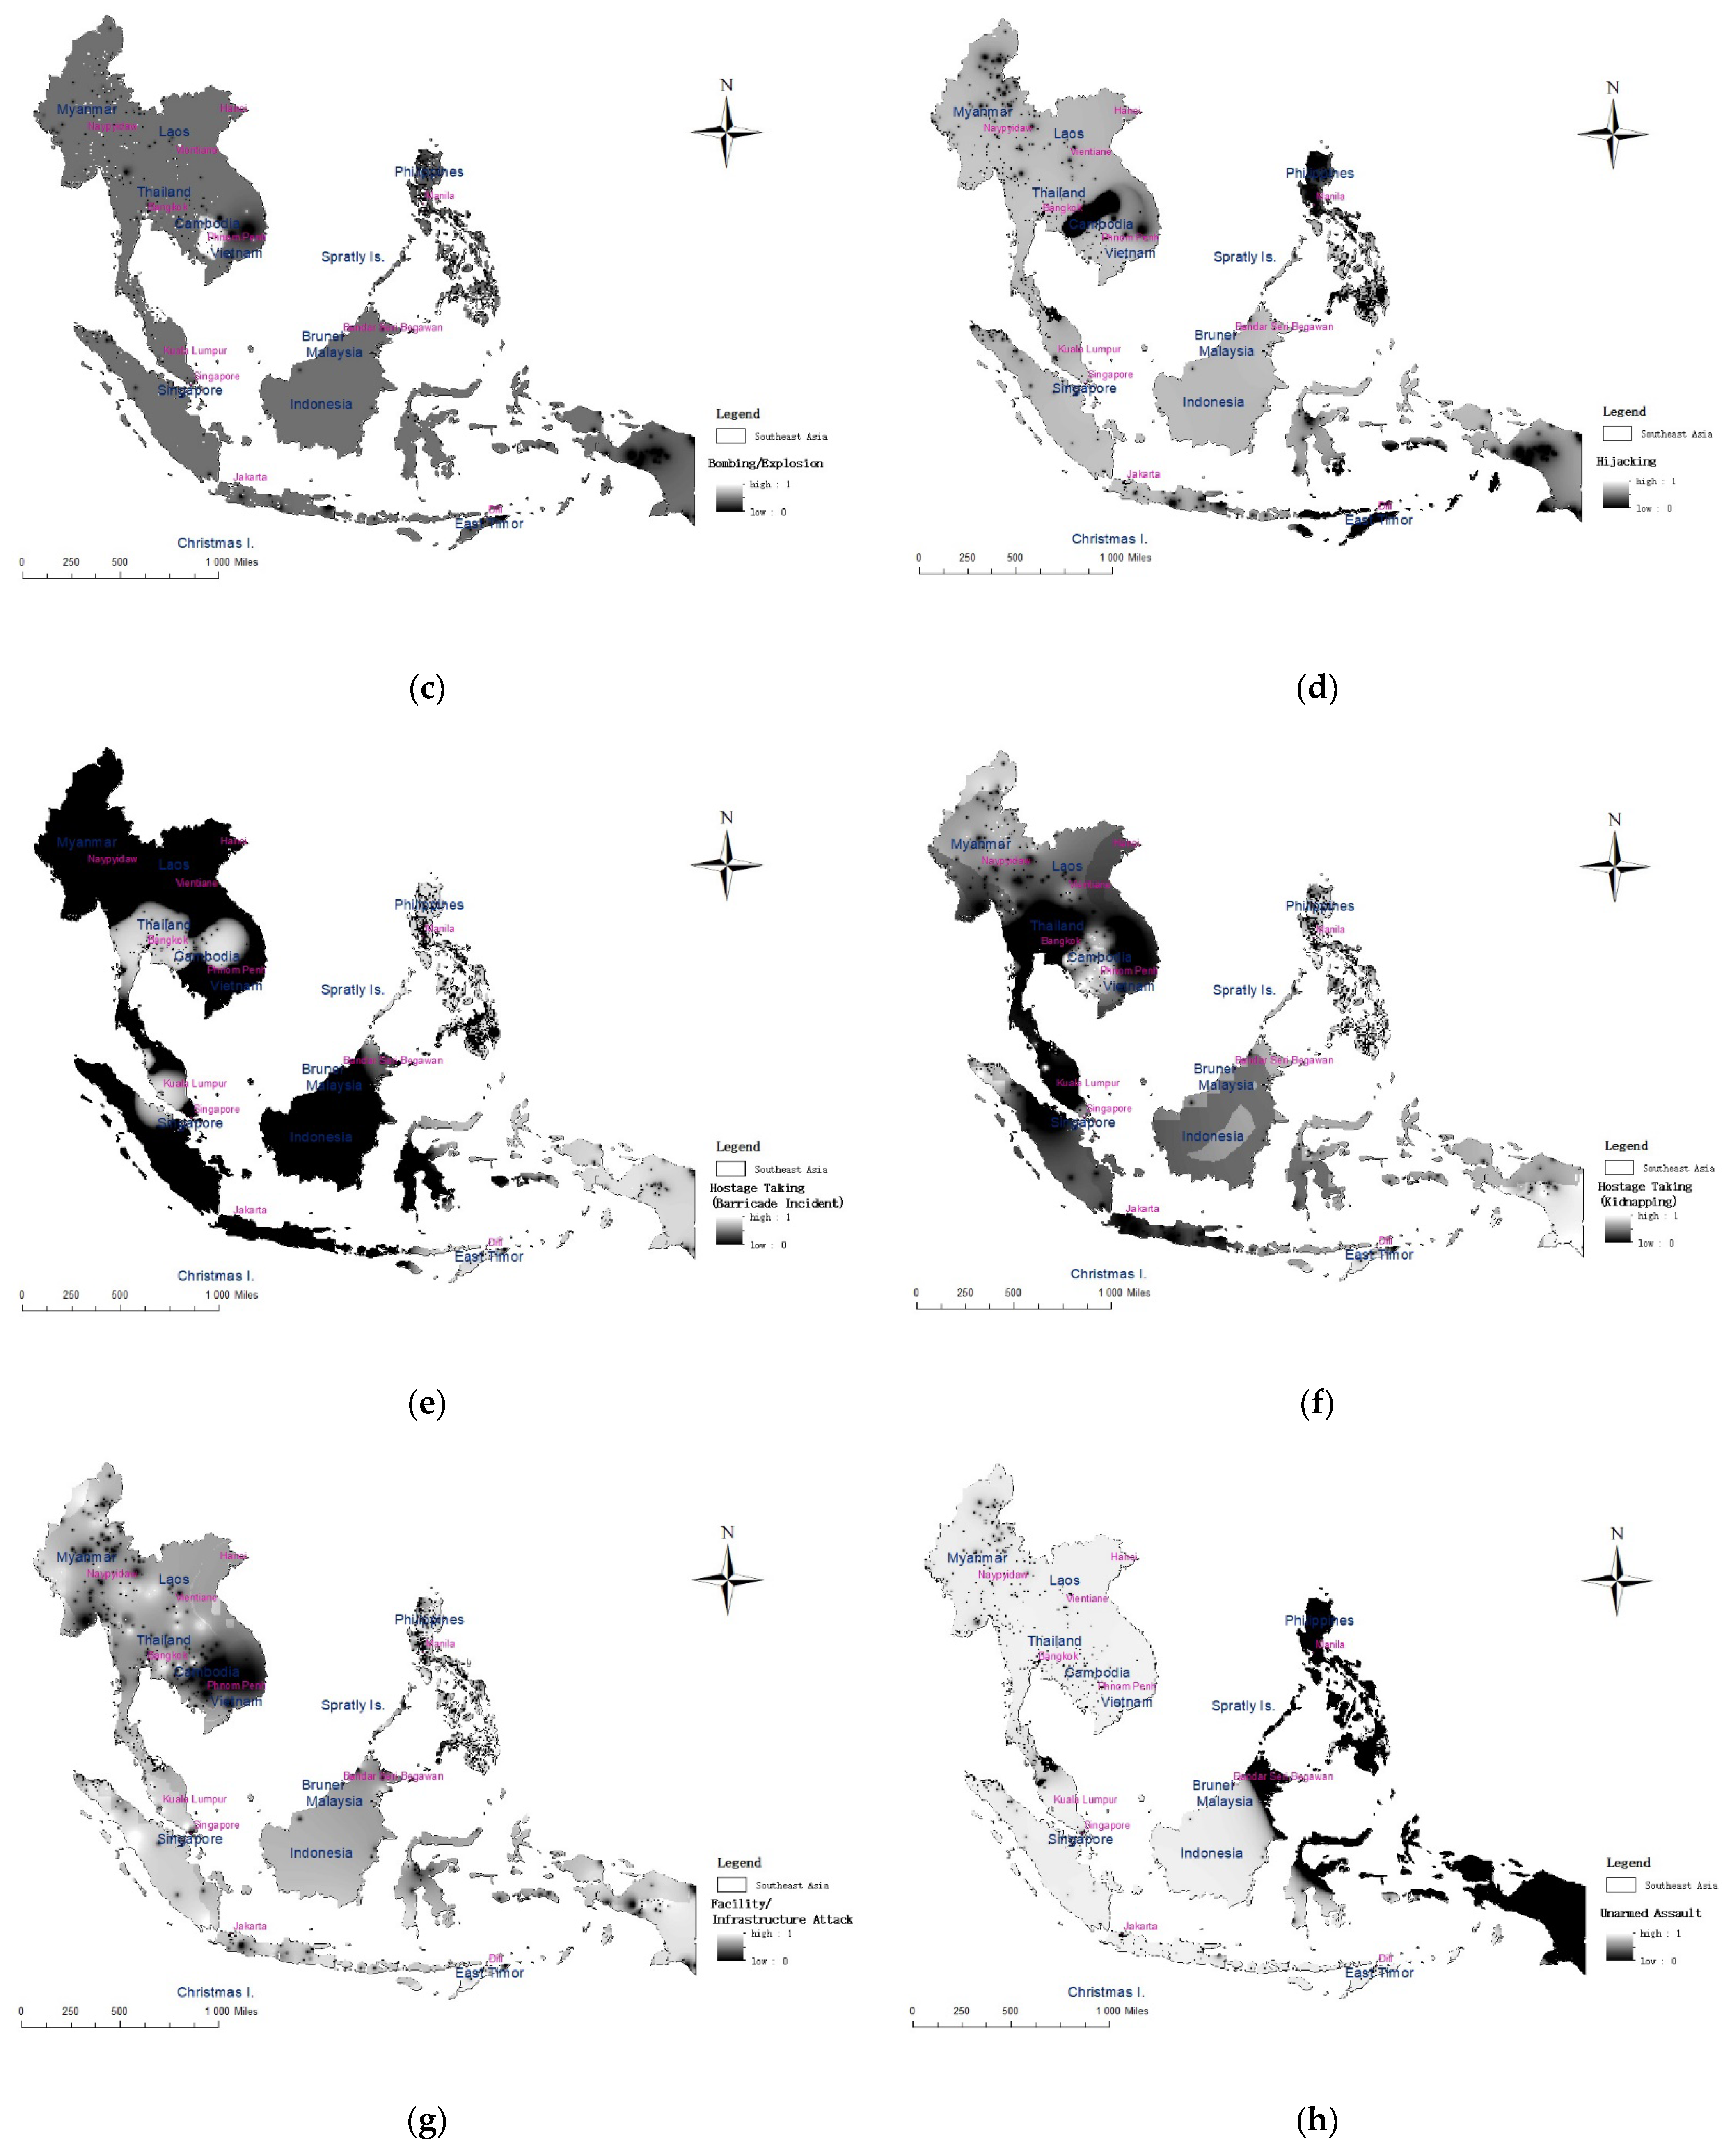
Figure 7a–h show the spatial risk assessment results in Southeast Asia for the eight types of terrorism: Assassination, Armed Assault, Bombing/Explosion, Hijacking, Hostage Taking (Barricade Incident), Hostage Taking (Kidnapping), Facility/Infrastructure Attack and Unarmed Assault. Figure 7a shows the risk of Assassination. It can be seen that the risk of Assassination in Southeast Asia is generally concentrated and multi-centered. The southernmost part of Thailand and the Philippines are high-value areas with a high risk of Assassination. The conflicts between religions and ethnic groups in these regions are serious and constitute the soil for the roots of extremism. Figure 7b is the risk map for Armed Assault. It can be seen that the high-risk areas of armed attacks are widely distributed. The high concentration areas are mainly in the southernmost part of Thailand, the Philippines, and coastal areas. These areas have long had an imbalance in political and economic development [63]. Ethnic and religious conflicts in these areas are also serious and likely to lead to the breeding of terrorism, such as the 6·2 Manila Hotel Attack, for which the Islamic State extremist organization claimed responsibility [64]. Figure 7c is a risk map of the Bombing/Explosion terrorist attacks. It can be seen that the high-risk areas of this event are concentrated, and the overall distribution is multi-centered. The high-value areas are mainly in southeastern Cambodia, Thailand, and the southern Philippines, such as the August 17 bomb attack in Bangkok, Thailand, killing 20 people [65]. The incident occurred in the heart of Bangkok’s business district, clearly targeting foreigners and damaging the Thai economy and tourism. Figure 7d shows the risk map of Hijacking terrorist attacks. It can be seen from the figure that most of Southeast Asia is a low-risk area. Figure 7e is a risk map of Hostage Taking (Barricade Incident) events. It can be seen that most of the areas are low risk, but the border areas of Thailand, Cambodia and Laos are riskier than the other areas. Figure 7f is a risk map of Hostage Taking (Kidnapping) incidents. Western Cambodia, the westernmost and easternmost parts of Indonesia, and the Philippines are higher risk areas; these areas have serious religious conflicts and are prone to terrorism [66]. Figure 7g is a risk map of a Facility/Infrastructure Attack events. It can be seen that the high-value areas of these incidents are mainly concentrated in the coastal areas of Thailand and the southern Philippines; these areas have serious religious conflicts and are therefore prone to terrorism [67]. Figure 7h shows the risk map of Unarmed Assault (involving chemical, biological or radiological weapons). It can be seen that almost all of Southeast Asia is a low-risk area.
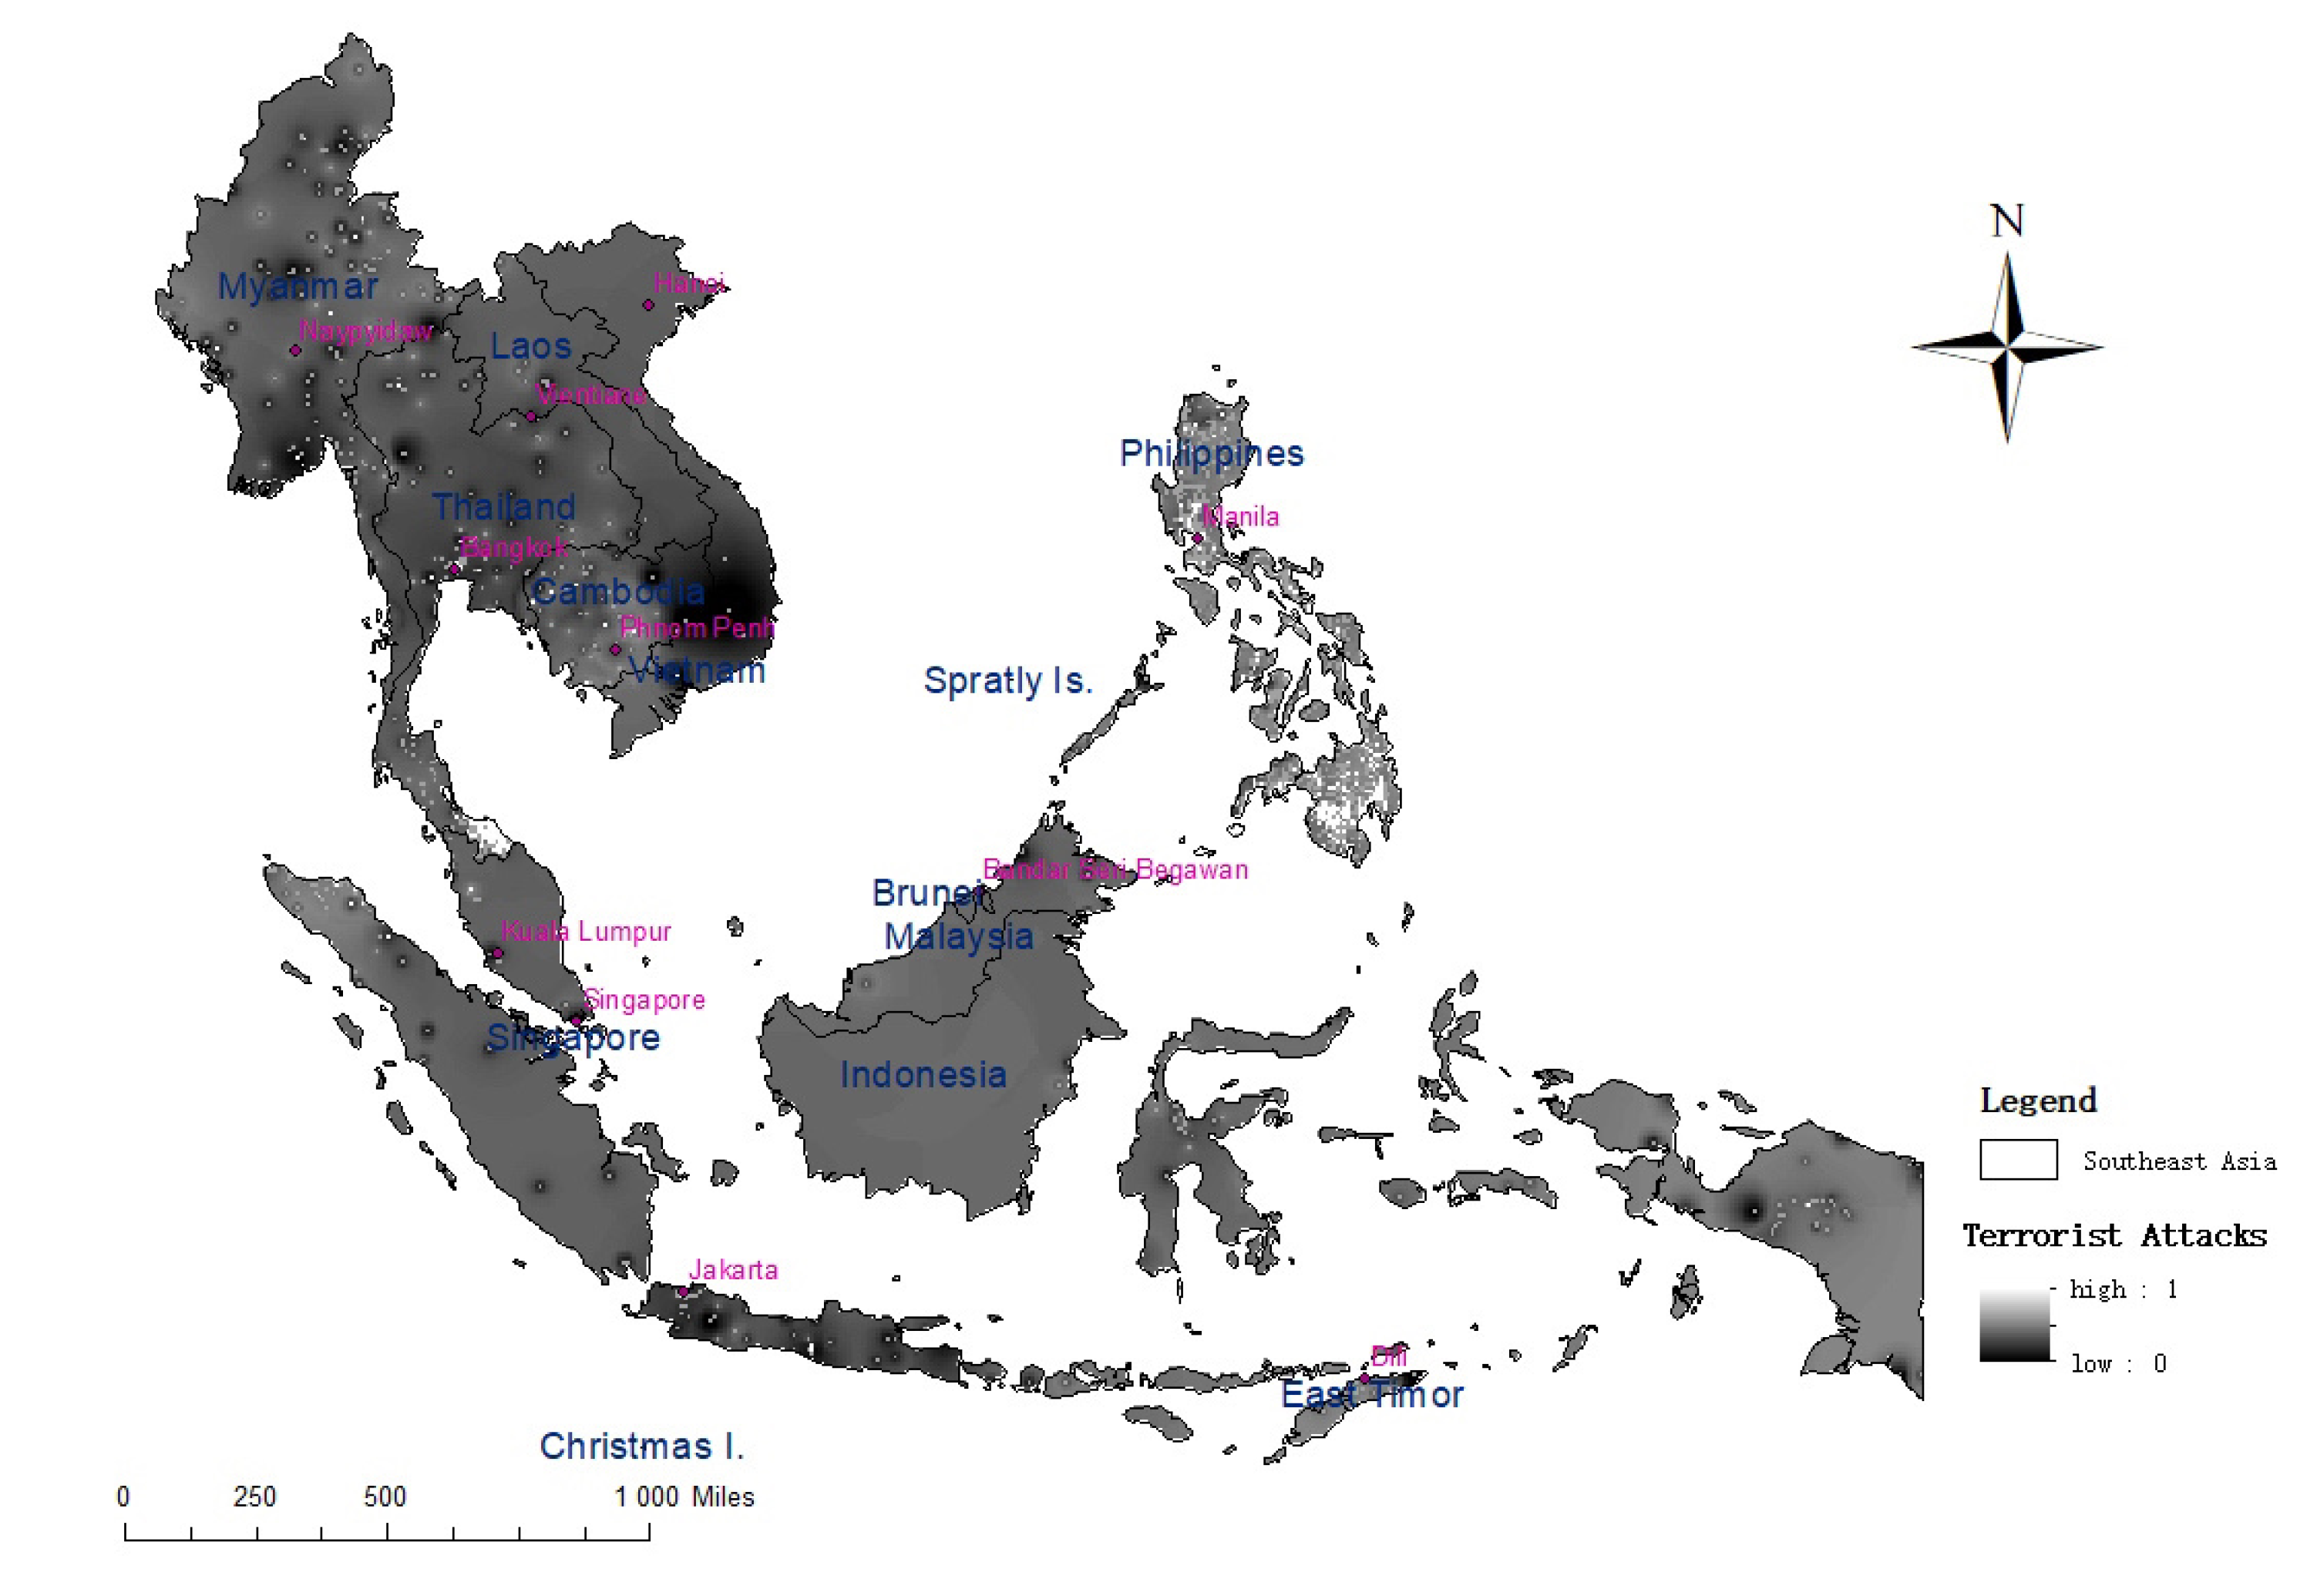
Finally, we analyze the risk of the eight types of terrorist attacks and analyze the risk of all types of terrorist attacks on each grid, in other words, the probability of terrorist attacks on each grid, as shown in Figure 8. From Figure 8, we can see that national borders and coastal areas are high-risk areas for terrorist attacks. These regions have long experienced a political and economic development imbalance, which, along with serious ethnic and religious conflicts, is likely to lead to the breeding of terrorism. The development of some regions in some countries showed a clear marginalization trend; the right of people to participate in the administration of state affairs was not effectively guaranteed, and the government’s excessive control over religious institutions and corruption caused a strong dissatisfaction among the domestic people. In addition, many Southeast Asian countries have unbalanced economic development, especially the development of certain regions, ethnic groups and groups, which makes the gap between the rich and the poor prominent, leading to the desperate feelings of some ethnic groups, who thus resort to violent acts such as terrorist activities.
5. Conclusions
In this paper, the dimension reduction algorithm LLE was used to reduce the dimensions of the features of the types of terrorist attacks, and the correlation between the features before and after the dimension reduction was obtained by the MIC. The MLKNN multi-label classification algorithm was then integrated with the inverse distance weighting method in a grid scale, and this model comprehensively considered the multi-source factors that affect the types of terrorist attacks and integrated the geographical influence of terrorism in surrounding areas. Finally, an assessment of the types of terrorist attacks was conducted. At the same time, we applied the I-MLKNN model to the field of terrorist attack type assessment for the first time. In terms of impact factors, we collected 17 types of influence data, including ethnic diversity, major drug areas, population density, nighttime lighting, and POI to support the establishment and improvement of terrorist attack type assessment models. This model can effectively solve problems such as the assessment of terrorist attacks and provide support to relevant decision-makers.
The results of the study indicate that Armed Attacks, Bombing/Explosions and Facility/Infrastructure Attacks in Southeast Asia are high-risk events. A comprehensive analysis of the risk of all types of terrorist attacks shows that the southernmost part of Thailand and the Philippines are high-risk areas for terrorism. In fact, these areas have experienced terrorist attacks in recent years [68]. The Philippines’ national separatist organizations are becoming increasingly religious and extremist, and the activities of other extremist organizations have increased [69]. The penetration of the “Islamic State” in Southeast Asian organizations indicates that this area will become a major battlefield for the international fight against terrorism. In addition, the results indicate that some coastal areas and border areas are at risk for terrorist attacks; thus, the next step in anti-terrorism should be to pay more attention to these areas.
We used the I-MLKNN model to study the types of terrorist attacks on a grid scale, combined with the attribute data of latitude and longitude and the types of terrorist attacks in the GTD database. Our data included the longitude and latitude, type, casualties and other attributes of all terrorist attacks in Southeast Asia from 1970 to 2019. The amount of data in each individual year was too small to support the complete analysis of the time series, and the prediction results were not precise enough. Therefore, we integrated all the data from 1970 to 2019, enriched the sample size, and explored and assessed the risk of different types of terrorist attacks on a spatial scale, with better accuracy. However, there remain some shortcomings in the proposed I-MLKNN model. In a further study, we will consider temporal factors and the research on spatial autocorrelation. Moreover, research on the GTD database should take the obscure attributes of the target into account, such as the use of weapons, terrorist organizations and other hidden information which could be implied for more detail.
Author Contributions
Conceptualization, Xun Zhang; Data curation, Xiaolan Xie; Funding acquisition, Xun Zhang and Mengmeng Hao; Investigation, Xun Zhang; Methodology, Min Jin; Project administration, Xun Zhang; Software, Min Jin; Supervision, Mengmeng Hao; Validation, Ruifang Zhao; Visualization, Xiaolan Xie; Writing—original draft, Ruifang Zhao and Xiaolan Xie; Writing—review and editing, Xun Zhang. All authors have read and agreed to the published version of the manuscript.
Funding
This research was funded by the National Natural Science Foundation of China (grant number 42001238); the Support Project of High-level Teachers in Beijing Municipal Universities in the Period of 13th Five-year Plan (grant number CIT&TCD201904037); the R&D Program of Beijing Municipal Education Commission (grant number KM202010011012); the Postgraduate Research Capacity Improvement Program from Beijing Technology and Business University in 2021.
Acknowledgments
We would like to acknowledge the Beijing Key Laboratory of Big Data Technology for Food Safety and Key Laboratory of Resources Utilization and Environmental Remediation for providing a search grant to conduct this work. We express gratitude to the editors for the editing assistance. Lastly, we would like to thank the reviewers for their valuable comments and suggestions on our paper.
Conflicts of Interest
The authors declare no conflict of interest.
References
- Beck, U. The terrorist threat: World risk society revisited. Theor. Cult. Soc. 2002, 19, 39–55. [Google Scholar] [CrossRef]
- Findley, M.G.; Young, J.K. Terrorism, democracy, and credible commitments. Int. Stud. Quart. 2011, 55, 357–378. [Google Scholar] [CrossRef]
- Scheffran, J.; Brzoska, M.; Kominek, J.; Link, P.; Schilling, J. Climate change and violent conflict. Science 2012, 336, 869–871. [Google Scholar] [CrossRef]
- Perliger, A.; Pedahzur, A. Counter cultures, group dynamics and religious terrorism. Polit. Stud. London. 2016, 64, 297–314. [Google Scholar] [CrossRef]
- Ding, F.; Ge, Q.; Jiang, D.; Fu, J.; Hao, M. Understanding the dynamics of terrorism events with multiple-discipline datasets and machine learning approach. PLoS ONE 2017, 12, e0179057. [Google Scholar] [CrossRef] [Green Version]
- Raghavan, V.; Galstyan, A.; Tartakovsky, A.G. Hidden Markov models for the activity profile of terrorist groups. Ann. Appl. Stat. 2013, 7, 2402–2430. [Google Scholar] [CrossRef] [Green Version]
- Scharpf, A.; Schneider, G.; Nöh, A.; Clauset, A. Forecasting the risk of extreme massacres in Syria. Eur. Rev. Int. Stud. 2014, 1, 50–68. [Google Scholar] [CrossRef] [Green Version]
- Hsiang, S.M.; Burke, M.; Miguel, E. Quantifying the influence of climate on human conflict. Science 2013, 341, 1212. [Google Scholar] [CrossRef] [PubMed] [Green Version]
- Von Uexkull, N.; Croicu, M.; Fjelde, H.; Buhaug, H. Civil conflict sensitivity to growing-season drought. Proc. Natl. Acad. Sci. USA 2016, 113, 12391–12396. [Google Scholar] [CrossRef] [PubMed] [Green Version]
- Cederman, L.E.; Weidmann, N.B. Predicting armed conflict: Time to adjust our expectations? Science 2017, 355, 474–476. [Google Scholar] [CrossRef] [Green Version]
- Singer, G.; Golan, M. Identification of subgroups of terror attacks with shared characteristics for the purpose of preventing mass-casualty attacks: A data-mining approach. Crime Sci. 2019, 8, 1–11. [Google Scholar] [CrossRef]
- Tian, R.; Zeng, Q.; Zhu, S.; Lau, J.; Chandra, S.; Ertsey, R.; Chen, X. Albumin-chaperoned cyanine dye yields superbright NIR-II fluorophore with enhanced pharmacokinetics. Sci. Adv. 2019, 5, eaaw0672. [Google Scholar] [CrossRef] [PubMed] [Green Version]
- Li, Z.; Li, X.; Dong, C.; Guo, F.; Zhang, F.; Zhang, Q. Quantitative analysis of global terrorist attacks based on the global terrorism database. Sustainability 2021, 13, 7598. [Google Scholar] [CrossRef]
- Huamaní, E.L.; Alicia, A.M.; Roman-Gonzalez, A. Machine learning techniques to visualize and predict terrorist attacks worldwide using the global terrorism database. Mach. Learn. 2020, 11. [Google Scholar] [CrossRef]
- Boutell, M.R.; Luo, J.; Shen, X.; Brown, C.M. Learning multi-label scene classification. Pattern Recogn. 2004, 37, 1757–1771. [Google Scholar] [CrossRef] [Green Version]
- Read, J.; Pfahringer, B.; Holmes, G.; Frank, E. Classifier chains for multi-label classification. Mach. Learn. 2011, 85, 333–359. [Google Scholar] [CrossRef] [Green Version]
- Godbole, S.; Sarawagi, S. Discriminative Methods for Multi-Labeled Classification/Pacific-Asia Conference on Knowledge Discovery and Data Mining; Springer: Berlin/Heidelberg, Germany, 2004; pp. 22–30. [Google Scholar]
- Tsoumakas, G.; Katakis, I.; Vlahavas, I. Random k-labelsets for multilabel classification. IEEE Trans. Knowl. Data Eng. 2010, 23, 1079–1089. [Google Scholar] [CrossRef]
- Zhang, M.L.; Zhou, Z.H. A review on multi-label learning algorithms. IEEE Trans. Knowl. Data Eng. 2013, 26, 1819–1837. [Google Scholar] [CrossRef]
- Zhang, M.L.; Zhou, Z.H. ML-KNN: A lazy learning approach to multi-label learning. Pattern Recogn. 2007, 40, 2038–2048. [Google Scholar] [CrossRef] [Green Version]
- Jin, J.; Cai, X.; Lai, G.; Lin, X. GPU-accelerated parallel algorithms for linear rank SVM. J. Supercomput. 2015, 71, 4141–4171. [Google Scholar] [CrossRef]
- Pereira, R.B.; Plastino, A.; Zadrozny, B.; Merschmann, L.H. Categorizing feature selection methods for multi-label classification. Artif. Intell. Rev. 2018, 49, 57–78. [Google Scholar] [CrossRef]
- Lee, J.; Kim, H.; Kim, N.R.; Lee, J.H. An approach for multi-label classification by directed acyclic graph with label correlation maximization. Inf. Sci. 2016, 351, 101–114. [Google Scholar] [CrossRef]
- Wan, S.; Duan, Y.; Zou, Q. HPSLPred: An ensemble multi-label classifier for human protein subcellular location prediction with imbalanced source. Proteomics 2017, 17, 1700262. [Google Scholar] [CrossRef] [PubMed]
- Vega, S.H.; Elhorst, J.P. On spatial econometric models, spillover effects, and W. In Proceedings of the 53rd ERSA Congress, Regional Integration: Europe, the Mediterranean and the World Economy, Palermo, Italy, 27–31 August 2013. [Google Scholar]
- Narayanamoorthy, S.; Paleti, R.; Bhat, C.R. On accommodating spatial dependence in bicycle and pedestrian injury counts by severity level. Transp. Res. B Meth. 2013, 55, 245–264. [Google Scholar] [CrossRef] [Green Version]
- LaScala, E.A.; Gerber, D.; Gruenewald, P.J. Demographic and environmental correlates of pedestrian injury collisions: A spatial analysis. Accid. Anal. Prev. 2000, 32, 651–658. [Google Scholar] [CrossRef]
- Quddus, M.A. Modelling area-wide count outcomes with spatial correlation and heterogeneity: An analysis of London crash data. Accid. Anal. Prev. 2008, 40, 1486–1497. [Google Scholar] [CrossRef] [Green Version]
- Lu, G.Y.; Wong, D.W. An adaptive inverse-distance weighting spatial interpolation technique. Comput. Geosci. 2008, 34, 1044–1055. [Google Scholar] [CrossRef]
- Gahegan, M. Fourth paradigm GIScience? Prospects for automated discovery and explanation from data. Int. J. Geogr. Inf. Sci. 2020, 34, 1–21. [Google Scholar] [CrossRef] [Green Version]
- Li, W. GeoAI: Where machine learning and big data converge in GIScience. J. Spat. Inf. Sci. 2020, 2020, 71–77. [Google Scholar] [CrossRef]
- Thompson, E.; Craig, A. Lockard, Southeast Asia in world history. Singap. J. Trop. Geogr. 2011, 32, 399–400. [Google Scholar] [CrossRef]
- Lin, Y.L.; Yen, M.F.; Yu, L.C. Grid-based crime prediction using geographical features. ISPRS Int. J. Geoinf. 2018, 7, 298. [Google Scholar] [CrossRef] [Green Version]
- Medina, R.M.; Siebeneck, L.K.; Hepner, G.F. A geographic information systems (GIS) analysis of spatiotemporal patterns of terrorist incidents in Iraq 2004–2009. Stud. Confl. Terror. 2011, 34, 862–882. [Google Scholar] [CrossRef]
- Ma, T.; Zhou, C.; Pei, T.; Haynie, S.; Fan, J. Quantitative estimation of urbanization dynamics using time series of DMSP/OLS nighttime light data: A comparative case study from China’s cities. Remote Sens. Environ. 2012, 124, 99–107. [Google Scholar] [CrossRef]
- Hao, M.; Jiang, D.; Ding, F.; Fu, J.; Chen, S. Simulating spatio-temporal patterns of terrorism incidents on the indochina peninsula with GIS and the random forest method. ISPRS Int. J. Geoinf. 2019, 8, 133. [Google Scholar] [CrossRef] [Green Version]
- Zhang, X.; Jin, M.; Fu, J.; Hao, M.; Yu, C.; Xie, X. On the risk assessment of terrorist attacks coupled with multi-source factors. ISPRS Int. J. Geoinf. 2018, 7, 354. [Google Scholar] [CrossRef] [Green Version]
- Whitley, D. A genetic algorithm tutorial. Stat. Comput. 1994, 4, 65–85. [Google Scholar] [CrossRef]
- Abdi, H.; Williams, L.J. Principal component analysis. Wires. Comput. Mol. Sci. 2010, 2, 433–459. [Google Scholar] [CrossRef]
- Donoho, D.L.; Grimes, C. Hessian eigenmaps: Locally linear embedding techniques for high-dimensional data. Proc. Natl. Acad. Sci. USA 2003, 100, 5591–5596. [Google Scholar] [CrossRef] [PubMed] [Green Version]
- Roweis, S.T.; Saul, L.K. Nonlinear dimensionality reduction by locally linear embedding. Science 2000, 5500, 2323–2326. [Google Scholar] [CrossRef] [PubMed] [Green Version]
- Karbauskaitė, R.; Dzemyda, G.; Marcinkevičius, V. Dependence of locally linear embedding on the regularization parameter. Top 2010, 18, 354–376. [Google Scholar] [CrossRef]
- Chang, H.; Yeung, D.Y. Robust locally linear embedding. Pattern Recogn. 2006, 39, 1053–1065. [Google Scholar] [CrossRef]
- Fang, L.; He, N.; Li, S.; Plaza, A.J.; Plaza, J. A new spatial-spectral feature extraction method for hyperspectral images using local covariance matrix representation. IEEE. Trans. Geosci. Remote Sens. 2018, 56, 3534–3546. [Google Scholar] [CrossRef]
- Lichtenstein, W. A system of quadrics describing the orbit of the highest weight vector. Proc. Am. Math. Soc. 1982, 84, 605–608. [Google Scholar] [CrossRef]
- Camastra, F.; Vinciarelli, A. Estimating the intrinsic dimension of data with a fractal-based method. IEEE Trans. Pattern Anal. Mach. Intell. 2002, 24, 1404–1407. [Google Scholar] [CrossRef]
- Fukunaga, K.; Olsen, D.R. An algorithm for finding intrinsic dimensionality of data. IEEE Trans. Comput. 1971, 100, 176–183. [Google Scholar] [CrossRef]
- Li, H.; Xie, Z.; Xiang, Y.; Wu, M. A multi-class learning algorithm using LLE dimensionality reduction and bayesian classification. Syst. Eng. Electron. 2009, 31, 1467–1472. [Google Scholar]
- Reshef, D.; Reshef, Y.; Mitzenmacher, M.; Sabeti, P. Equitability analysis of the maximal information coefficient, with comparisons. arXiv 2013, arXiv:1301.6314. [Google Scholar]
- Sun, G.; Song, Z.; Liu, J.; Zhu, S.; He, Y.J. Feature selection method based on maximum information coefficient and approximate Markov blanket. Zidonghua Xuebao 2009, 43, 795–805. [Google Scholar]
- Szymański, P.; Kajdanowicz, T.; Kersting, K. How is a data-driven approach better than random choice in label space division for multi-label classification? Entropy 2016, 18, 282. [Google Scholar] [CrossRef] [Green Version]
- Zhang, M.L.; Zhou, Z.H. Multilabel neural networks with applications to functional genomics and text categorization. IEEE Trans. Knowl. Data Eng. 2006, 18, 1338–1351. [Google Scholar] [CrossRef] [Green Version]
- Vluymans, S.; Cornelis, C.; Herrera, F.; Saeys, Y. Multi-label classification using a fuzzy rough neighborhood consensus. Inf. Sci. 2018, 433, 96–114. [Google Scholar] [CrossRef]
- Miller, H.J. Tobler’s first law and spatial analysis. Ann. Assoc. Am. Geogr. 2004, 94, 284–289. [Google Scholar] [CrossRef]
- Bracken, I.; Martin, D. The generation of spatial population distributions from census centroid data. Environ. Plan. A Econ. Space 1989, 21, 537–543. [Google Scholar] [CrossRef]
- Longley, P.A.; Goodchild, M.F.; Maguire, D.J.; Rhind, D.W. Geographic Information Systems and Science; Wiley: Hoboken, NJ, USA, 2005. [Google Scholar]
- Mei, G.; Xu, L.; Xu, N. Accelerating adaptive inverse distance weighting interpolation algorithm on a graphics processing unit. R. Soc. Open Sci. 2017, 4, 170436. [Google Scholar] [CrossRef] [Green Version]
- Wang, L.; Fan, H.; Wang, Y. Site selection of retail shops based on spatial accessibility and hybrid BP neural network. ISPRS Int. J. Geoinf. 2018, 7, 202. [Google Scholar] [CrossRef] [Green Version]
- Fujino, A.; Isozaki, H.; Suzuki, J. Multi-label text categorization with model combination based on f1-score maximization. In Proceedings of the 3rd International Joint Conference on Natural Language Processing, Hyderabad, India, 7–12 January 2008; Volume 2. [Google Scholar]
- Kotsiantis, S.B.; Kanellopoulos, D.; Pintelas, P.E. Data preprocessing for supervised leaning. Int. J. Comput. Sci. 2006, 1, 111–117. [Google Scholar]
- Kambhatla, N.; Leen, T.K. Dimension reduction by local principal component analysis. Neural Comput. 1997, 9, 1493–1516. [Google Scholar] [CrossRef]
- Al-Harbi, K.M.A.S. Application of the AHP in project management. Int. J. Proj. Manag. 2001, 19, 19–27. [Google Scholar] [CrossRef]
- Hutchcroft, P. After the fall: Prospects for political and institutional reform in post-crisis Thailand and the Philippines. Gov. Oppos. 1999, 34, 473–497. [Google Scholar] [CrossRef]
- Wattana, S. Islam, radicalism, and violence in Southern Thailand: Berjihad di Patani and the 28 April 2004 attacks. Crit. Asian Stud. 2006, 38, 119–144. [Google Scholar] [CrossRef]
- Ciorciari, J.D.; Weiss, J.C. Nationalist protests, government responses, and the risk of escalation in interstate disputes. Secur. Stud. 2016, 25, 546–583. [Google Scholar] [CrossRef]
- Kanas, A.; Scheepers, P.; Sterkens, C. Positive and negative contact and attitudes towards the religious out-group: Testing the contact hypothesis in conflict and non-conflict regions of Indonesia and the Philippines. Soc. Sci. Res. 2017, 63, 95–110. [Google Scholar] [CrossRef] [Green Version]
- De Juan, A. The role of intra-religious conflicts in intrastate wars. Terror. Political Violence 2015, 27, 762–780. [Google Scholar] [CrossRef] [Green Version]
- White, G.; Porter, M.D.; Mazerolle, L. Terrorism risk, resilience and volatility: A comparison of terrorism patterns in three Southeast Asian countries. J. Quant. Criminol. 2013, 29, 295–320. [Google Scholar] [CrossRef]
- Abanes, M.S.; Scheepers, P.L.; Sterkens, C. Ethno-religious groups, identification, trust and social distance in the ethno-religiously stratified Philippines. Res. Soc. Stratif. Mobil. 2014, 37, 61–75. [Google Scholar] [CrossRef]
Figure 1.
Framework of the proposed method for assessing the types of terrorist attacks.

Figure 2.
Types of different terrorist attacks in Southeast Asia.

Figure 3.
Gridded terrorist attacks.

Figure 4.
Schematic diagram of the method of influence of terrorist attacks.

Figure 5.
I-MLKNN results of different parameters. (a) Hamming loss; (b) One-error; (c) Coverage; (d) Ranking loss; (e) Average precision.
Figure 5.
I-MLKNN results of different parameters. (a) Hamming loss; (b) One-error; (c) Coverage; (d) Ranking loss; (e) Average precision.

Figure 6.
Comparison of different algorithm evaluation results. (a) Hamming loss; (b) One-error; (c) Coverage; (d) Ranking loss; (e) Average precision.
Figure 6.
Comparison of different algorithm evaluation results. (a) Hamming loss; (b) One-error; (c) Coverage; (d) Ranking loss; (e) Average precision.

Figure 7.
Risk assessment results of eight types of terrorist attacks in Southeast Asia. (a) Assassination; (b) Armed Assault; (c) Bombing/Explosion; (d) Hijacking; (e) Hostage Taking (Barricade Incident); (f) Hostage Taking (Kidnapping); (g) Facility/Infrastructure Attack; (h) Unarmed Assault.
Figure 7.
Risk assessment results of eight types of terrorist attacks in Southeast Asia. (a) Assassination; (b) Armed Assault; (c) Bombing/Explosion; (d) Hijacking; (e) Hostage Taking (Barricade Incident); (f) Hostage Taking (Kidnapping); (g) Facility/Infrastructure Attack; (h) Unarmed Assault.


Figure 8.
Results of the terrorist attack risk assessment.


Table 1.
Impact factor data.
| Type of Data | Source | Publisher | |
|---|---|---|---|
| Location of the terrorist attack (latitude, longitude) | Global Terrorism Database (GTD), 1970–2019 | START, University of Maryland (available online: https://www.start.umd.edu/gtd/ (accessed on 20 June 2021)) | |
| Distance to major navigable lake | G-Econ 4.0, 2011 | Yale University (available online: http://gecon.yale.edu/ (accessed on 20 June 2021)) | |
| Distance to major navigable river | |||
| Distance to ice-free ocean | |||
| Average precipitation | |||
| Average temperature | |||
| Ethnic diversity | GeoEPR, the Ethnic Power Relations dataset, 2014 | Center for Comparative and International Studies (CIS), International Conflict Research (available online: http://www.icr.ethz.ch/data (accessed on 20 June 2021)) | |
| Major drug regions | World drug report, 2021 | Division for Policy Analysis and Public Affairs, United Nations Office on Drugs and Crime (available online: http://www.unvienna.org/unov/en/unodc.html (accessed on 20 June 2021)) | |
| Nighttime lights | Nighttime Lights of the World, 2019 | The Earth Observation Group, NOAA (available online: http://ngdc.noaa.gov/eog/index.html (accessed on 20 June 2021)) | |
| Population density | Population density of the World, 2015 | NASA’s Earth Observatory (available online: http://neo.sci.gsfc.nasa.gov/ (accessed on 20 June 2021)) | |
| Topography | Digital elevation model (DEM), 2011 | ||
| POI | Transportation site | Google Places API, 2021 | Google (available online: https://developers.google.cn/places/web-service/intro (accessed on 20 June 2021)) |
| Religious places | |||
| Political places | |||
| Catering outlets | |||
| Accommodation outlets | |||
Table 2.
Factor correlation before and after dimensionality reduction.
| Type of Data | Factor1 | Factor2 | Factor3 | Factor4 | Factor5 | Factor6 |
|---|---|---|---|---|---|---|
| Location of the terrorist attack (latitude) | 0.420 | 0.469 | 0.422 | 0.401 | 0.356 | 0.422 |
| Location of the terrorist attack (longitude) | 0.671 | 0.690 | 0.405 | 0.606 | 0.378 | 0.337 |
| Distance to major navigable lake | 0.556 | 0.567 | 0.530 | 0.411 | 0.262 | 0.355 |
| Distance to major navigable river | 0.587 | 0.598 | 0.455 | 0.635 | 0.399 | 0.384 |
| Distance to ice-free ocean | 0.673 | 0.697 | 0.490 | 0.487 | 0.262 | 0.408 |
| Average precipitation | 0.427 | 0.478 | 0.388 | 0.345 | 0.295 | 0.266 |
| Average temperature | 0.426 | 0.445 | 0.357 | 0.363 | 0.209 | 0.294 |
| Ethnic diversity | 0.325 | 0.351 | 0.382 | 0.486 | 0.430 | 0.452 |
| Major drug regions | 0.750 | 0.750 | 0.750 | 0.432 | 0.209 | 0.239 |
| Nighttime lights | 0.331 | 0.385 | 0.353 | 0.339 | 0.350 | 0.252 |
| Population density | 0.234 | 0.275 | 0.210 | 0.244 | 0.182 | 0.223 |
| Topography | 0.191 | 0.227 | 0.222 | 0.225 | 0.174 | 0.199 |
| Transportation site | 0.211 | 0.253 | 0.227 | 0.205 | 0.234 | 0.196 |
| Religious places | 0.246 | 0.268 | 0.185 | 0.252 | 0.234 | 0.167 |
| Political places | 0.354 | 0.355 | 0.315 | 0.265 | 0.250 | 0.269 |
| Catering outlets | 0.366 | 0.380 | 0.303 | 0.317 | 0.306 | 0.275 |
| Accommodation outlets | 0.238 | 0.262 | 0.231 | 0.222 | 0.274 | 0.208 |
Publisher’s Note: MDPI stays neutral with regard to jurisdictional claims in published maps and institutional affiliations. |
© 2021 by the authors. Licensee MDPI, Basel, Switzerland. This article is an open access article distributed under the terms and conditions of the Creative Commons Attribution (CC BY) license (https://creativecommons.org/licenses/by/4.0/).
Share and Cite
MDPI and ACS Style
Zhao, R.; Xie, X.; Zhang, X.; Jin, M.; Hao, M. Spatial Distribution Assessment of Terrorist Attack Types Based on I-MLKNN Model. ISPRS Int. J. Geo-Inf. 2021, 10, 547. https://0-doi-org.brum.beds.ac.uk/10.3390/ijgi10080547
AMA Style
Zhao R, Xie X, Zhang X, Jin M, Hao M. Spatial Distribution Assessment of Terrorist Attack Types Based on I-MLKNN Model. ISPRS International Journal of Geo-Information. 2021; 10(8):547. https://0-doi-org.brum.beds.ac.uk/10.3390/ijgi10080547
Chicago/Turabian StyleZhao, Ruifang, Xiaolan Xie, Xun Zhang, Min Jin, and Mengmeng Hao. 2021. "Spatial Distribution Assessment of Terrorist Attack Types Based on I-MLKNN Model" ISPRS International Journal of Geo-Information 10, no. 8: 547. https://0-doi-org.brum.beds.ac.uk/10.3390/ijgi10080547
Note that from the first issue of 2016, this journal uses article numbers instead of page numbers. See further details here.