
Map Design and Usability of a Simplified Topographic 2D Map on the Smartphone in Landscape and Portrait Orientations

 ,
,  , ,
, , 
Abstract
:1. Introduction
2. Aim and Questions
- How to design a simplified 2D topographic map for gameplay with the opportunity to move on the roads/paths for smartphones?
- How can one obtain data on the player’s movement on the smartphone display with landscape and portrait orientations?
- What statistical analyses and mapping techniques can be applied to present the properties of moving around on the 2D map in landscape and portrait orientation?
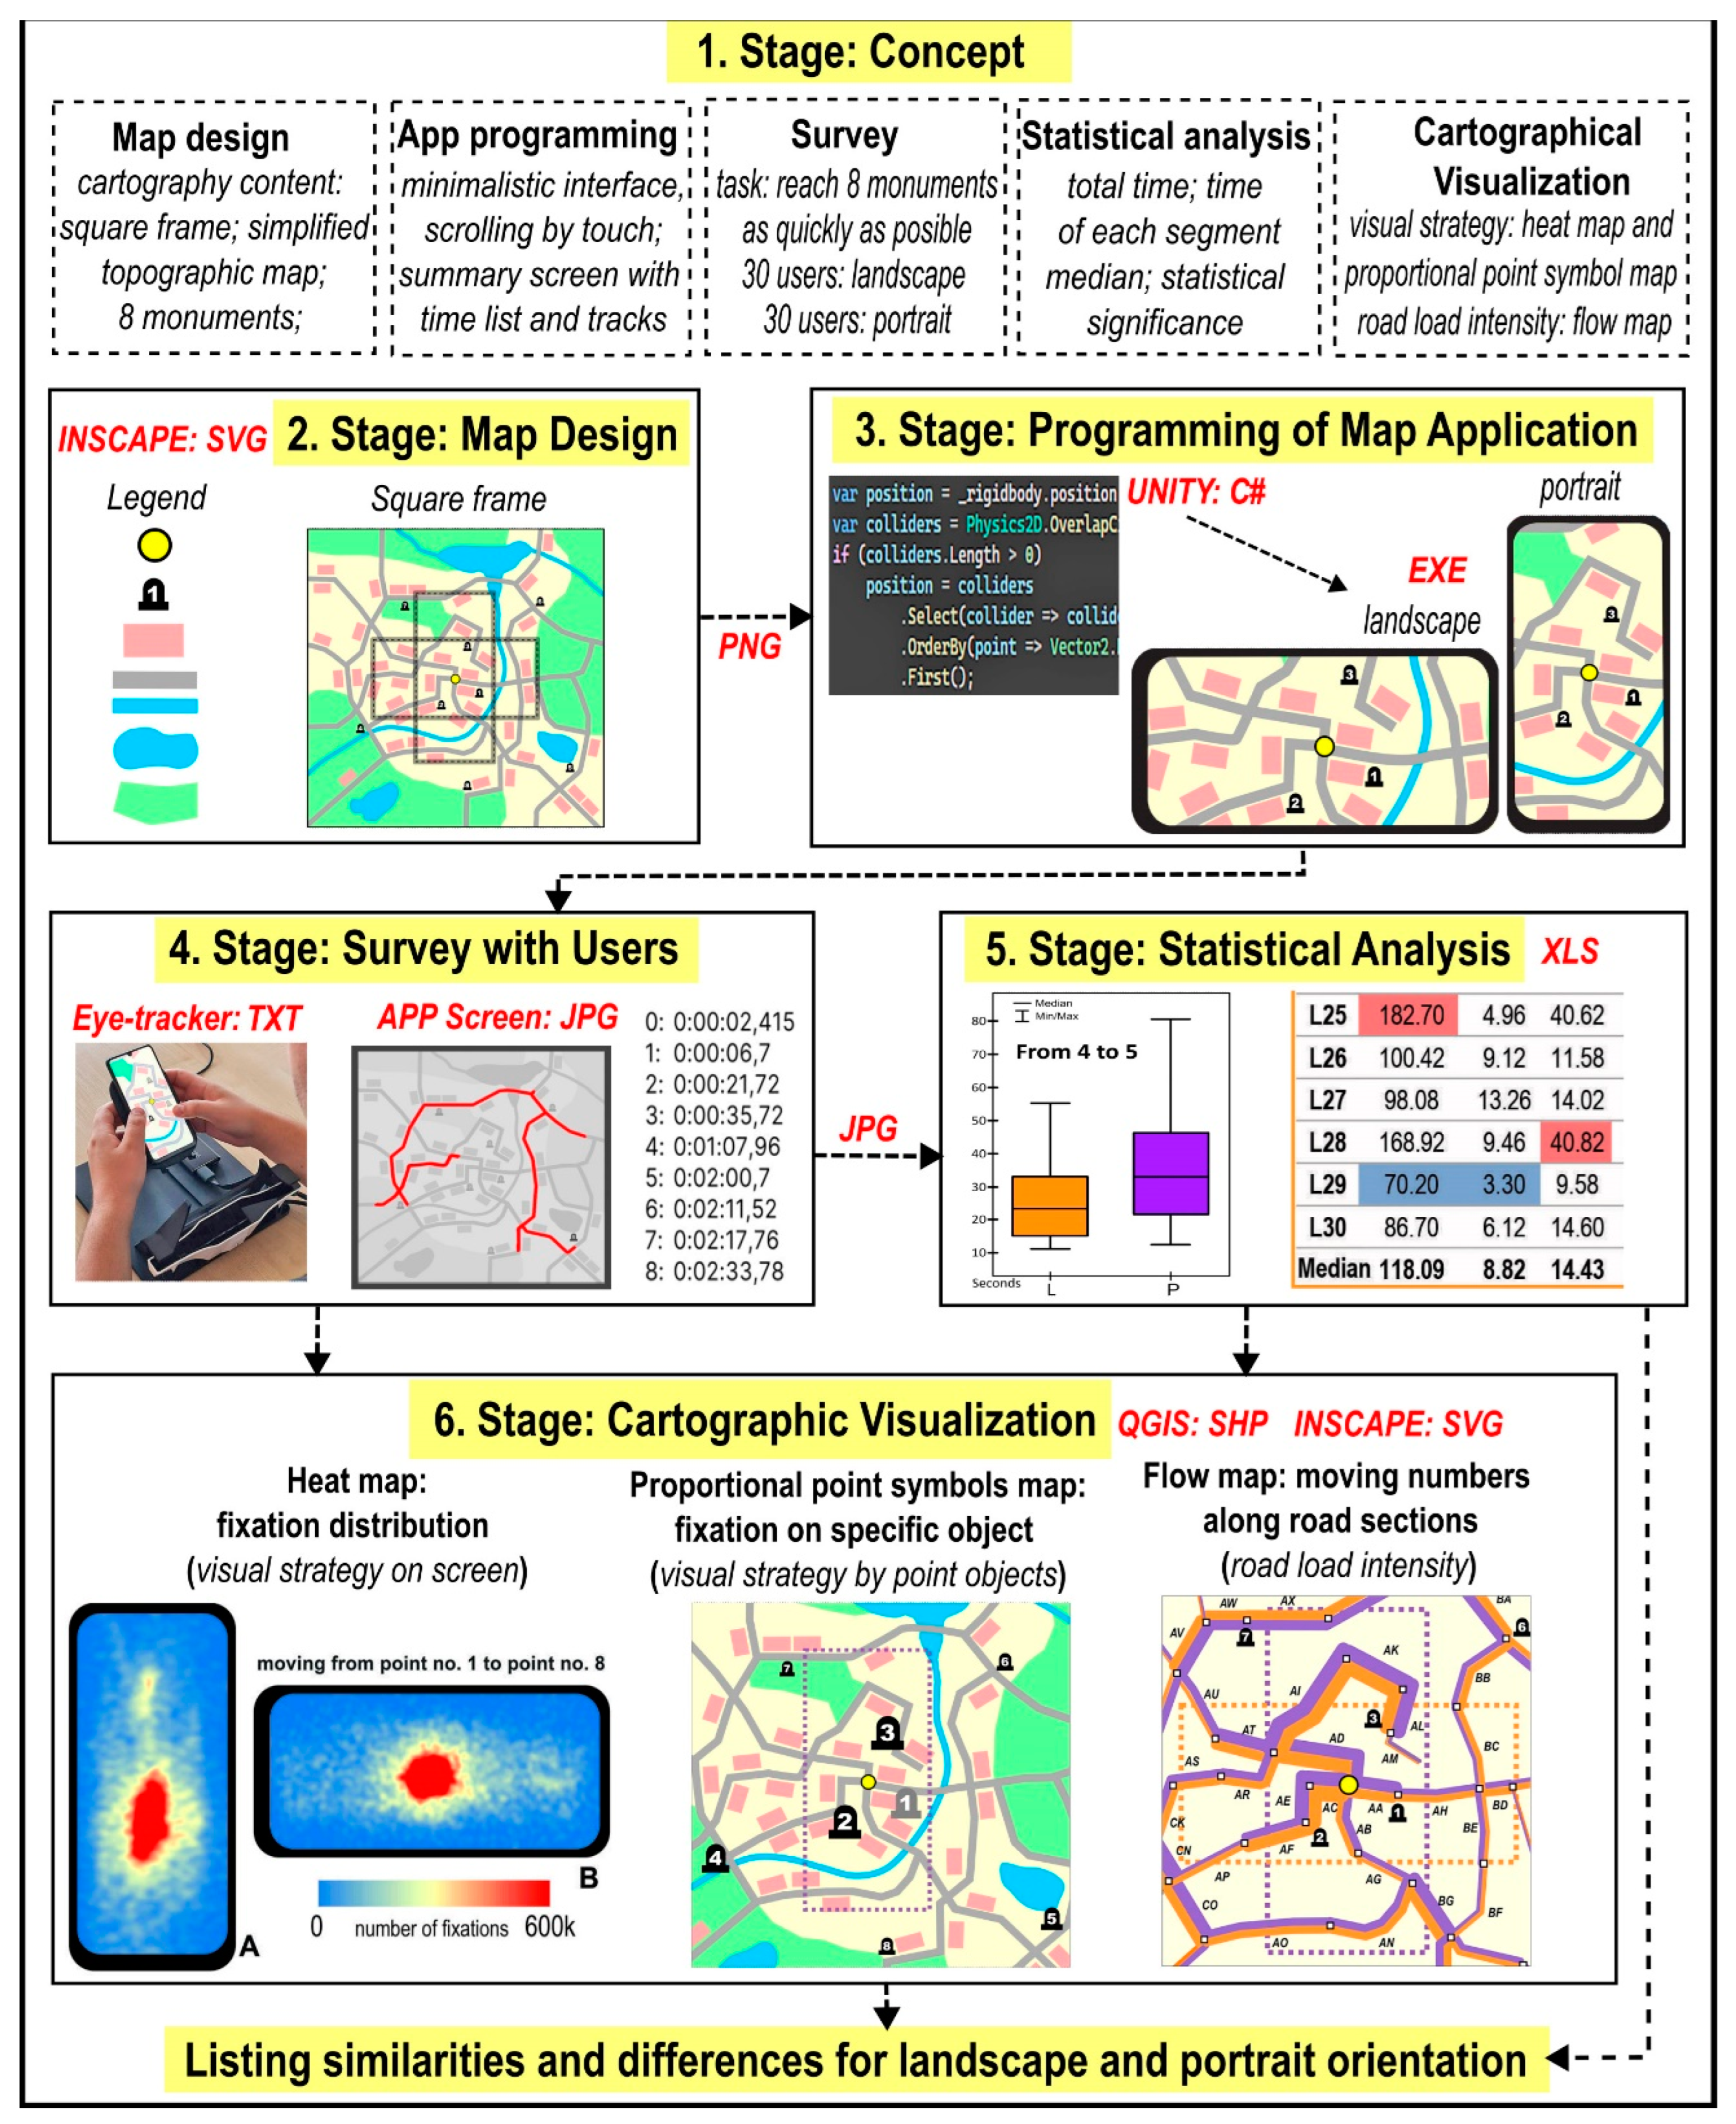
3. Materials and Methods
- to establish the basic conceptual assumptions (Section 3.1);
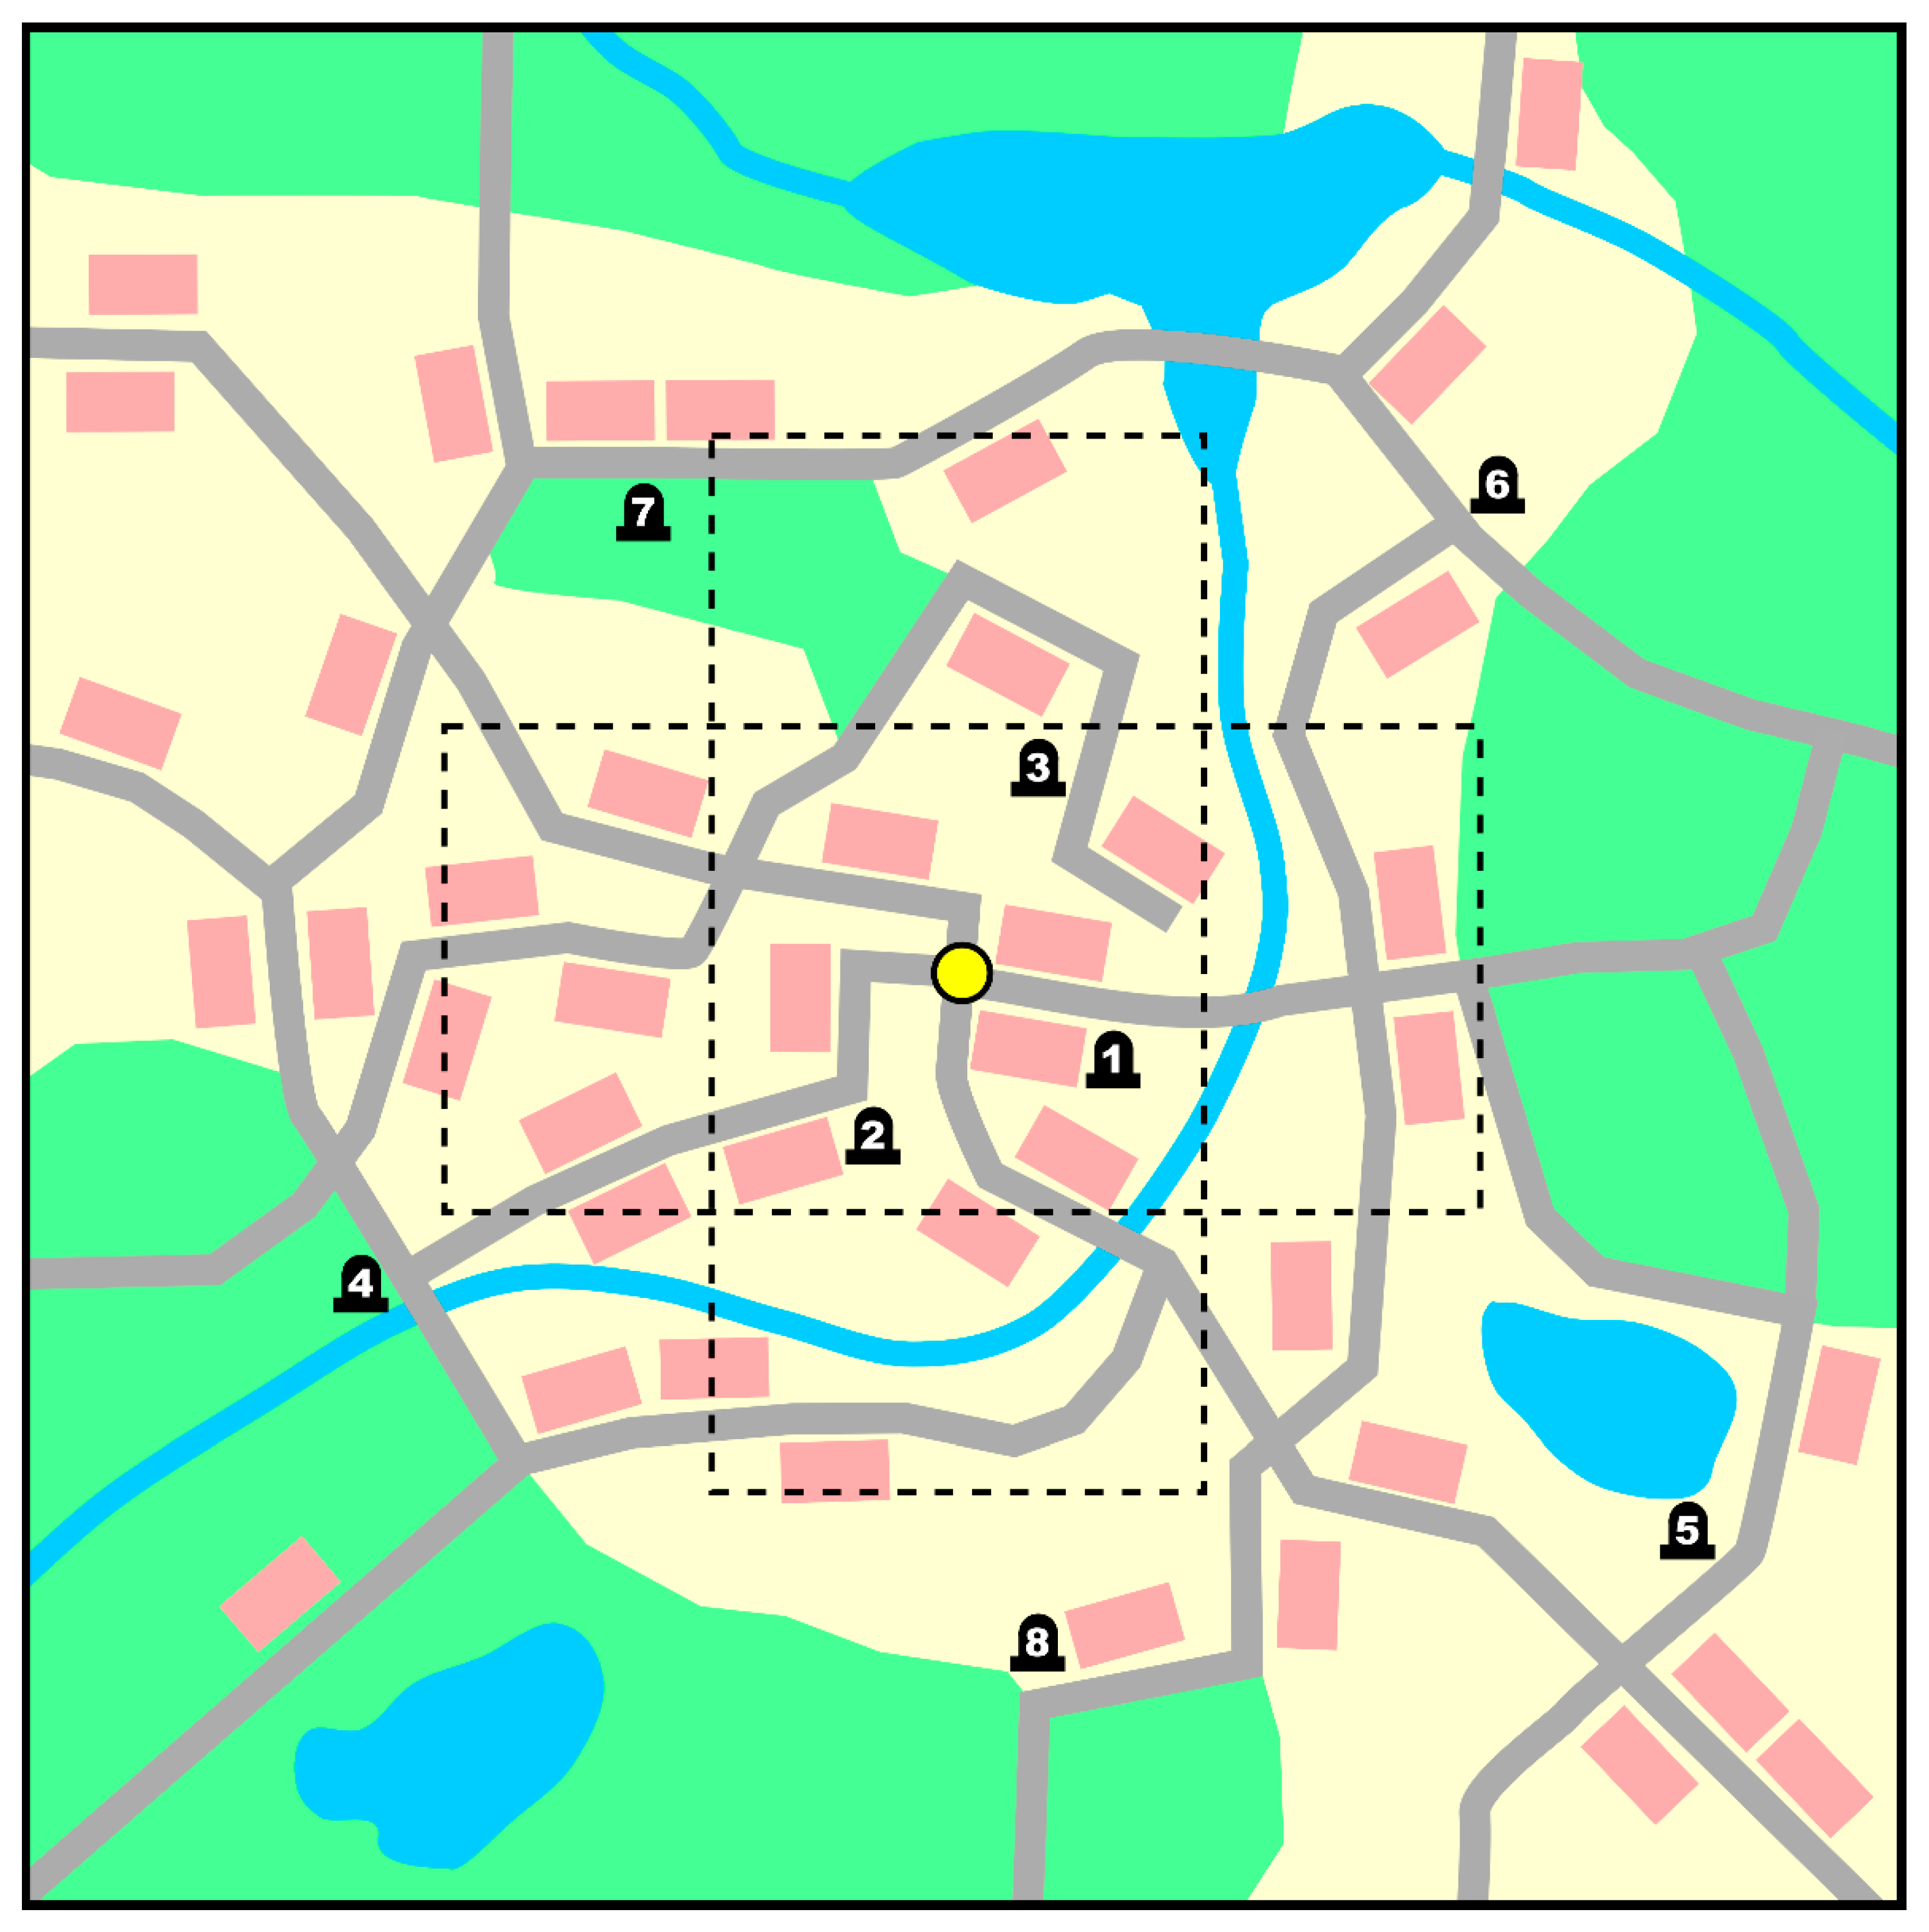
- to create a 2D map for smartphones with landscape and portrait orientations (Section 3.2, Figure 2);
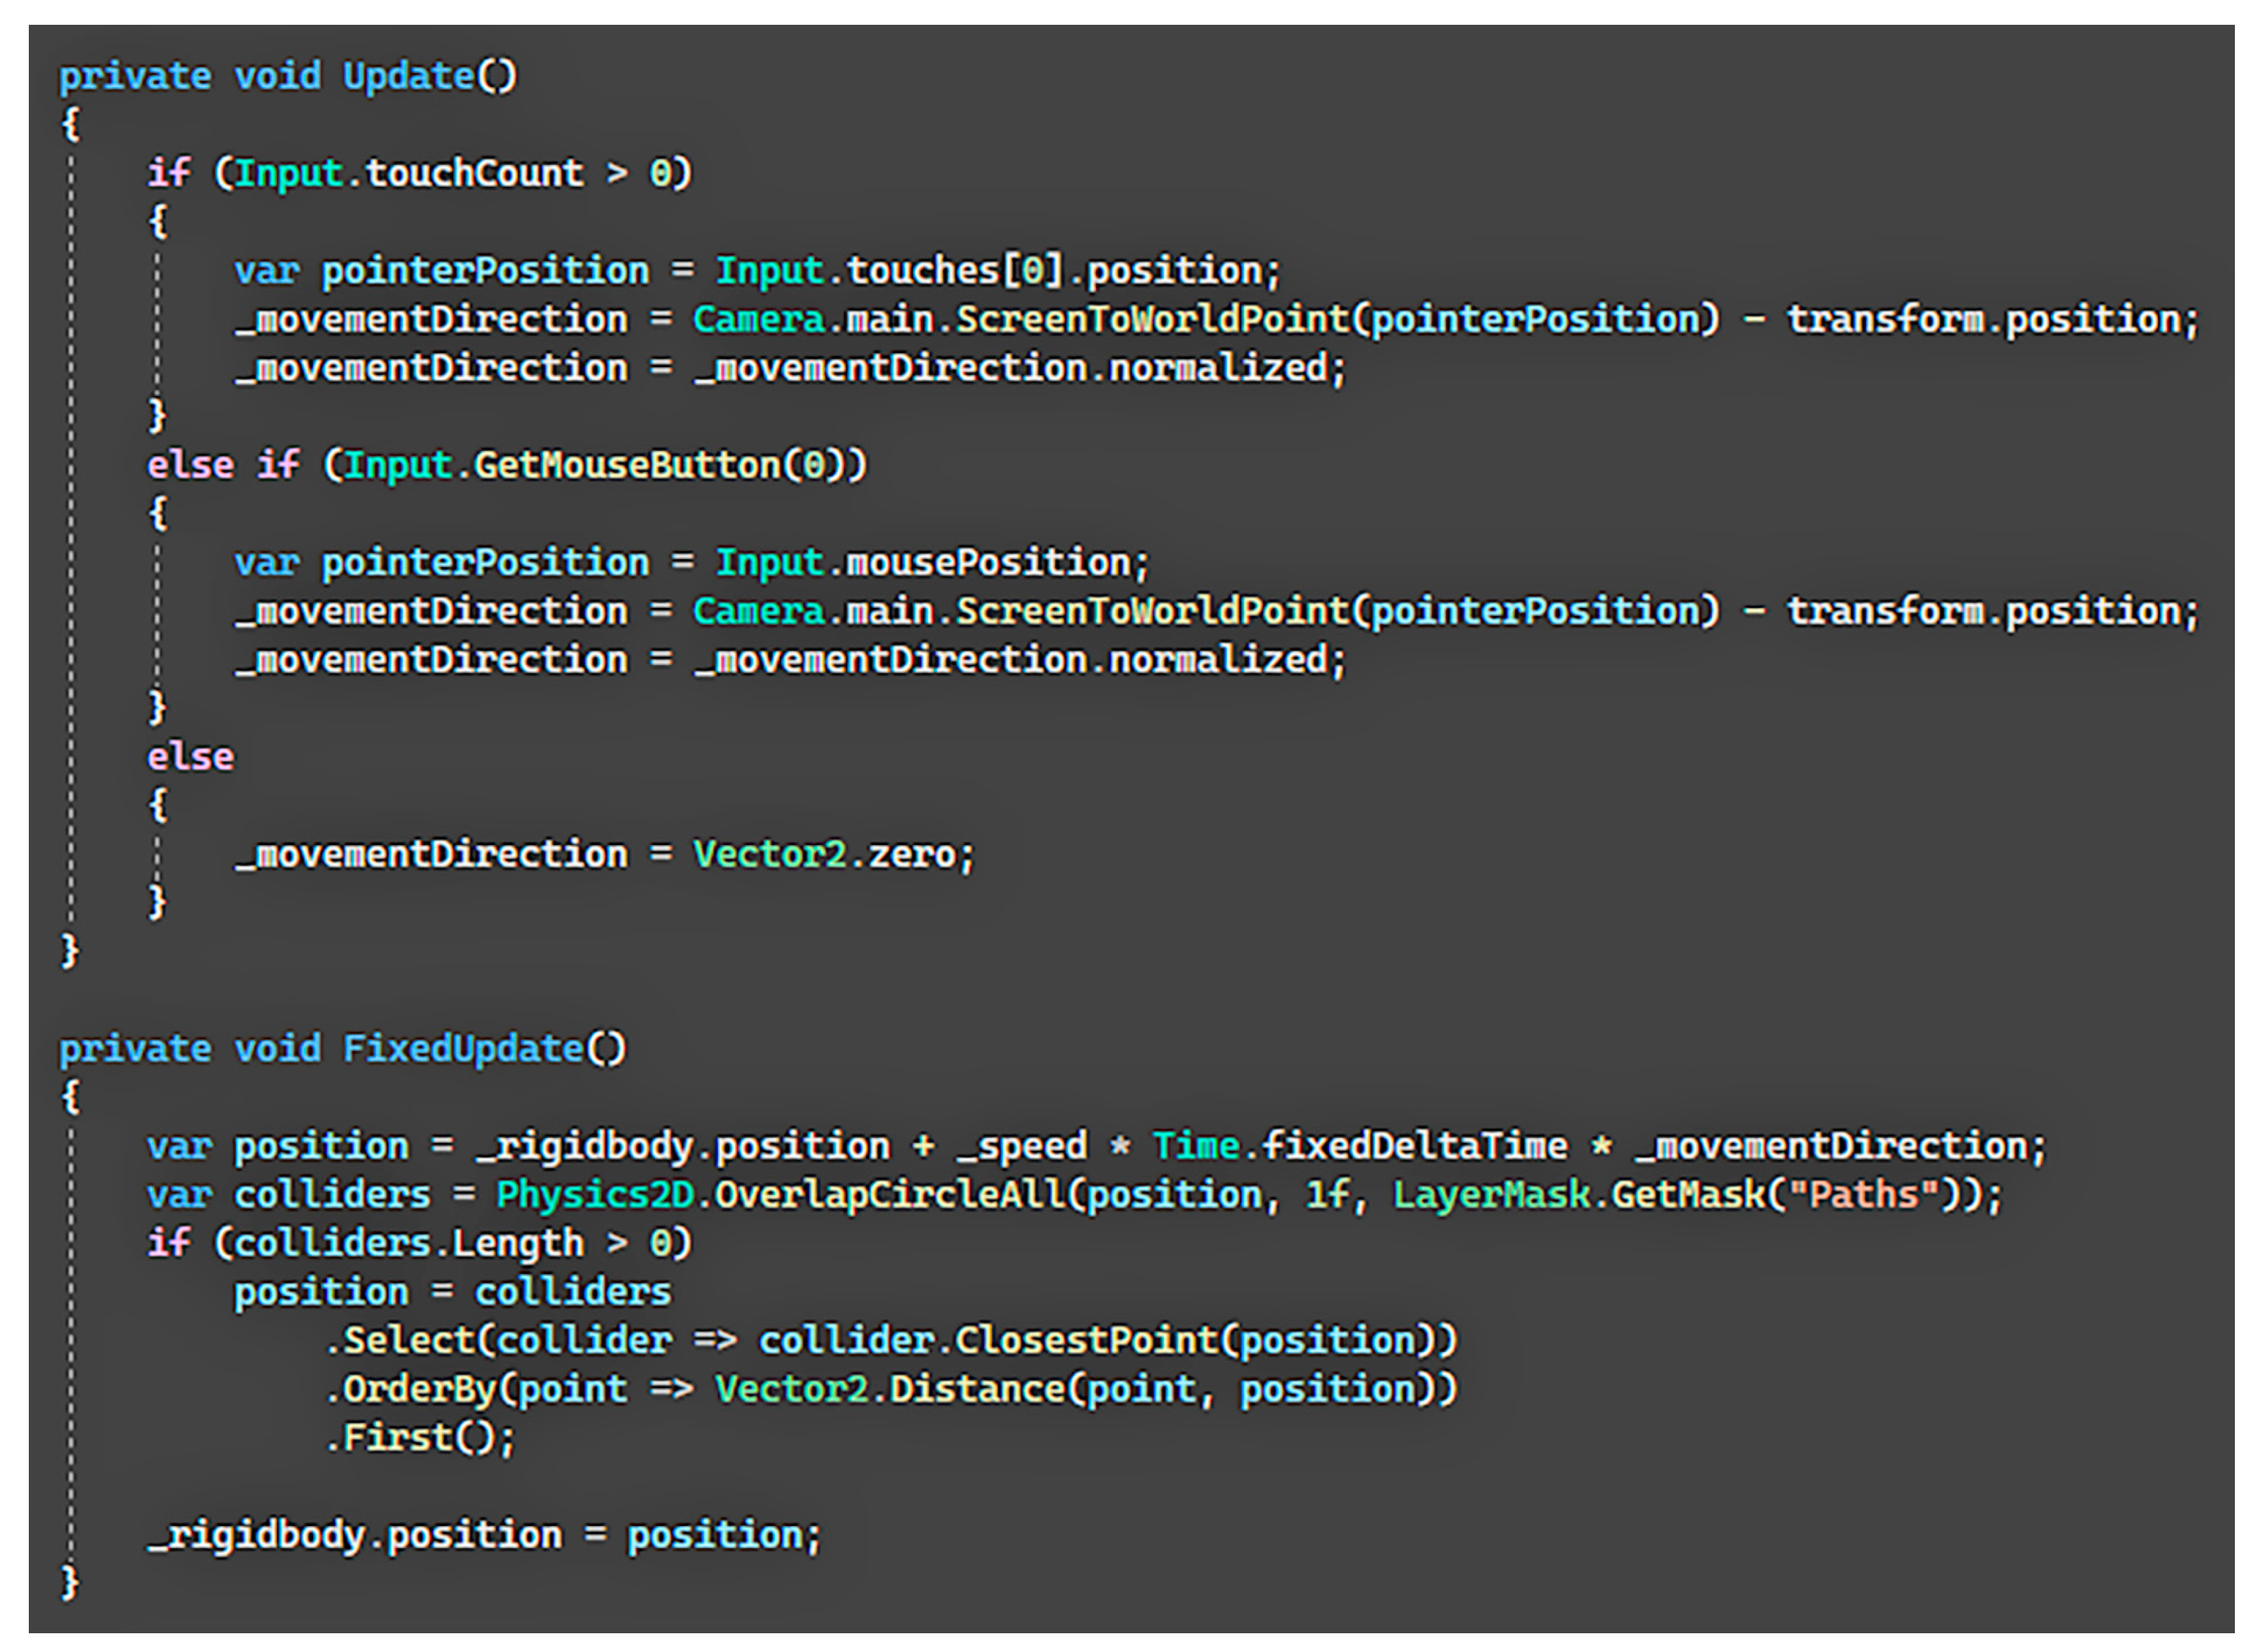
- to create a map application with gameplay elements (Section 3.3, Figure 3);
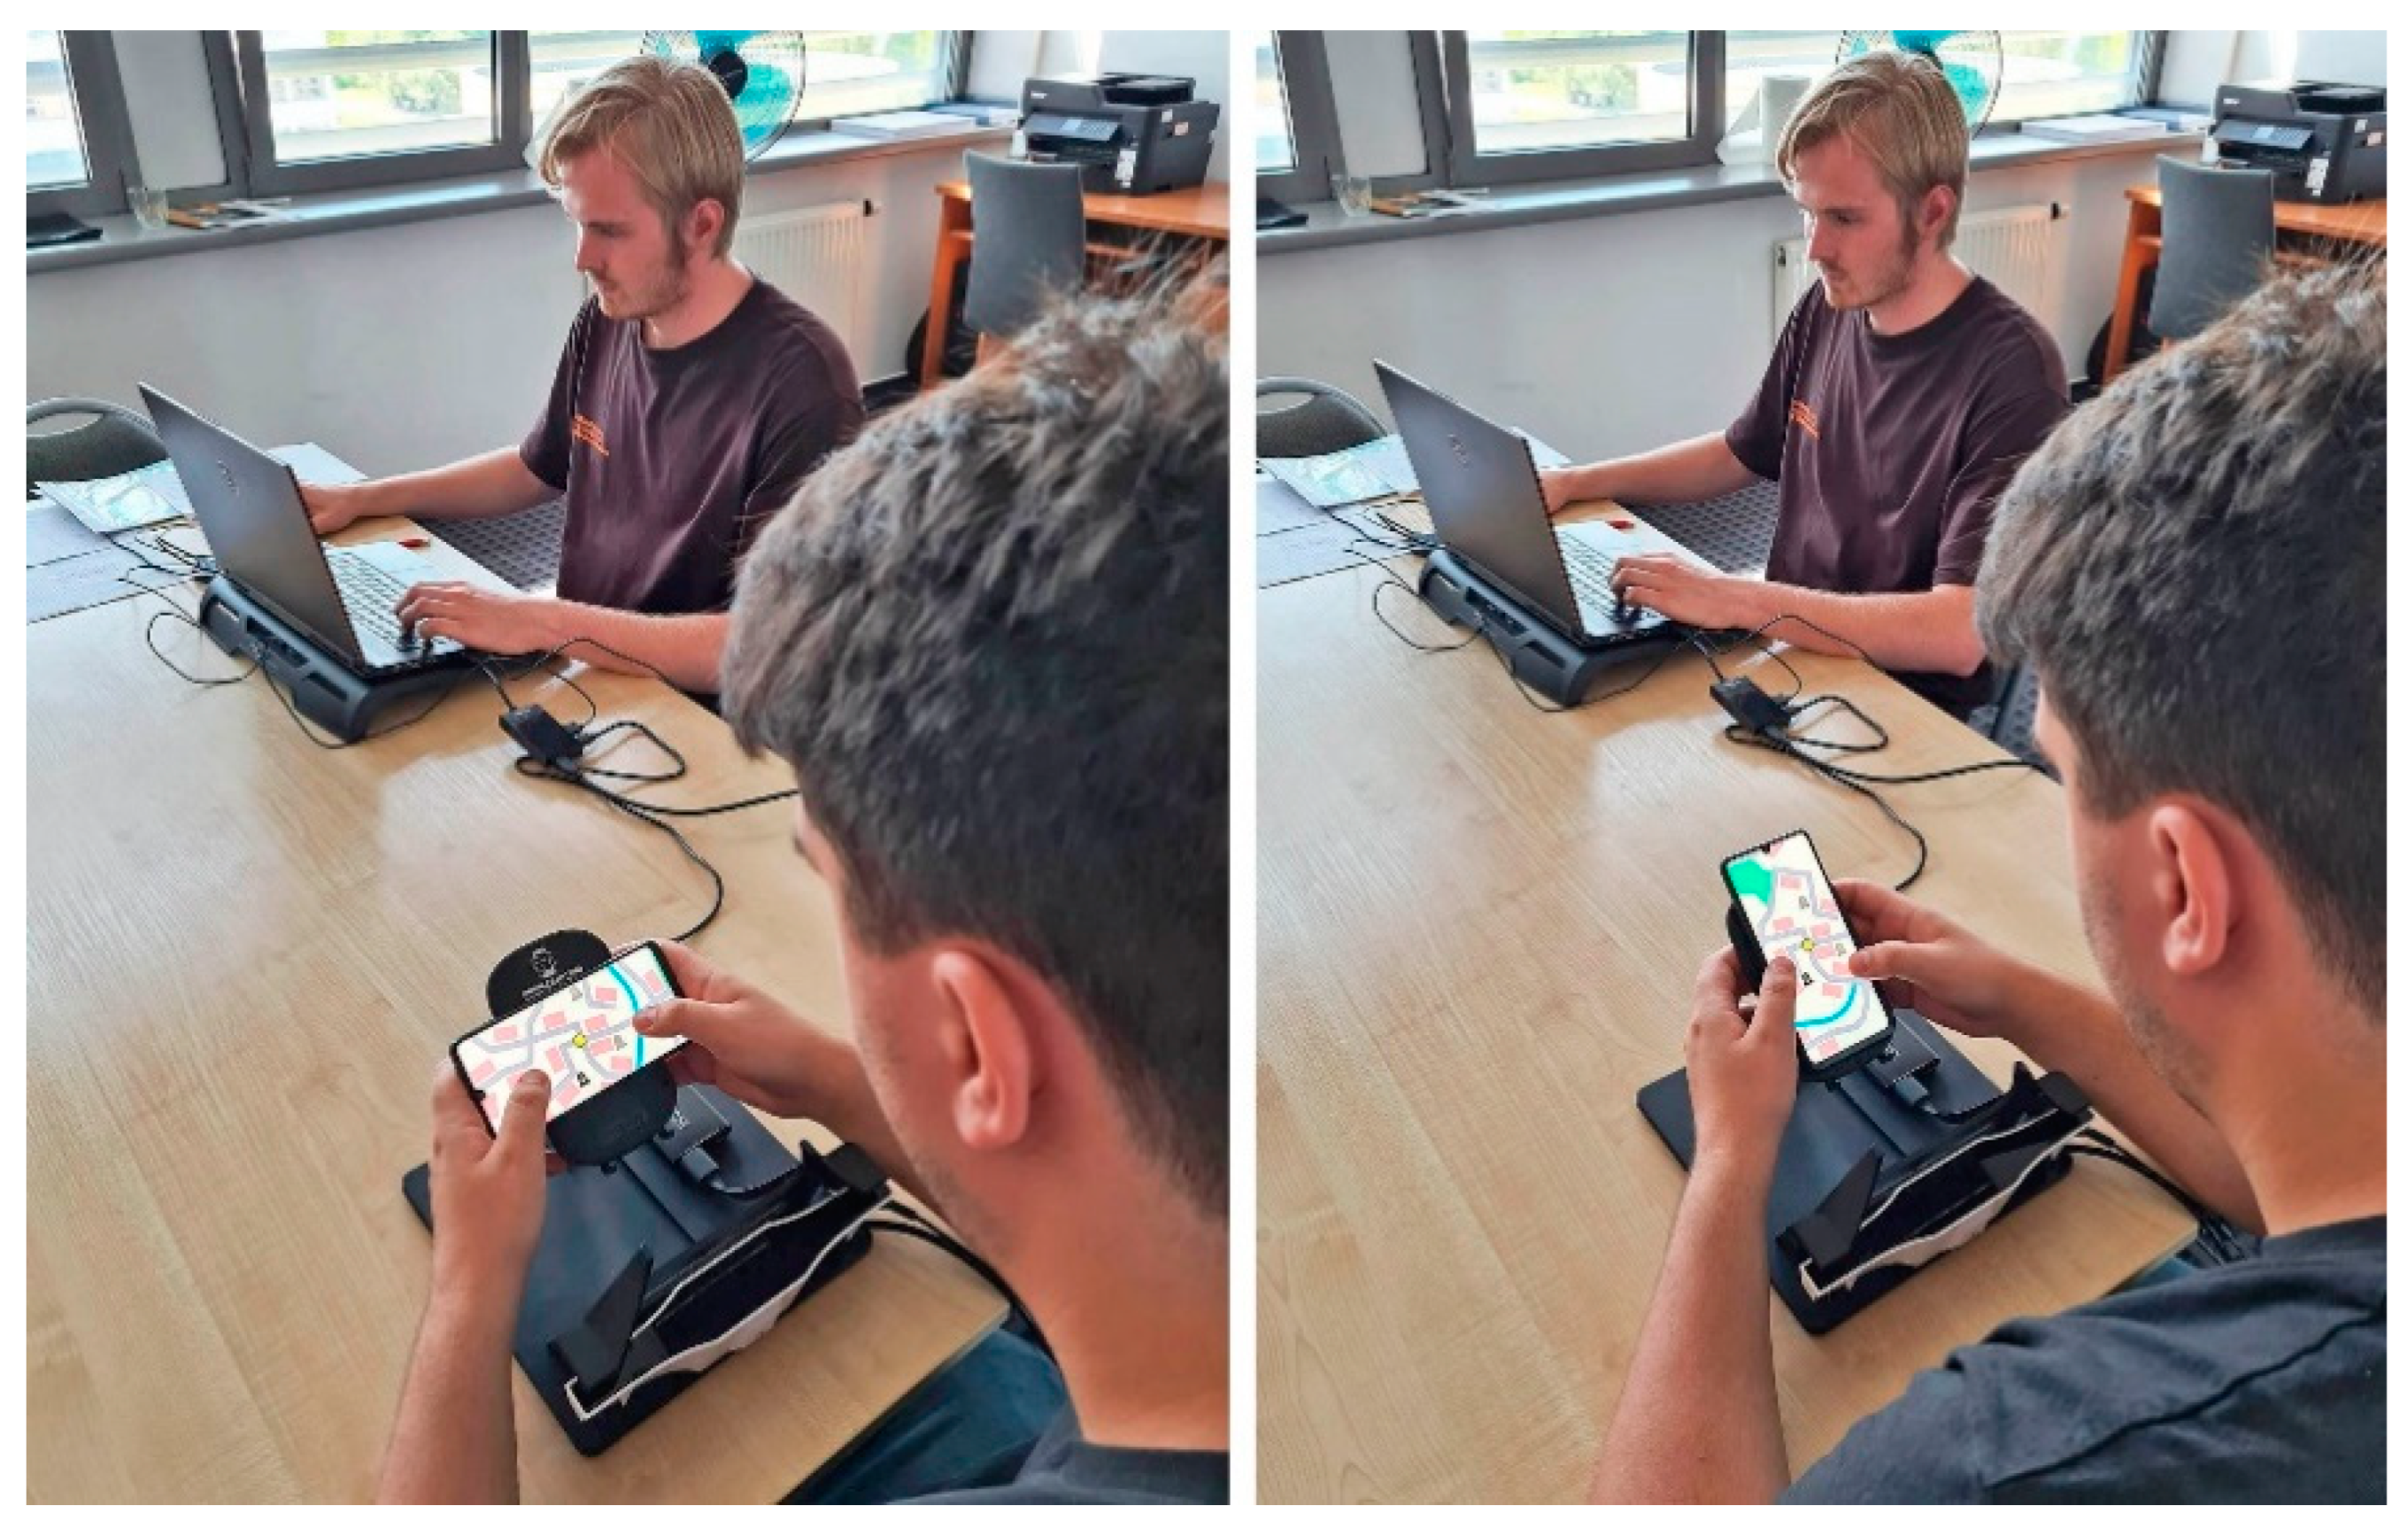
- to prepare and carry out surveys among map users on smartphones in landscape and portrait orientations (Section 3.4; Figure 4, Figure 5 and Figure 6);
3.1. Concept
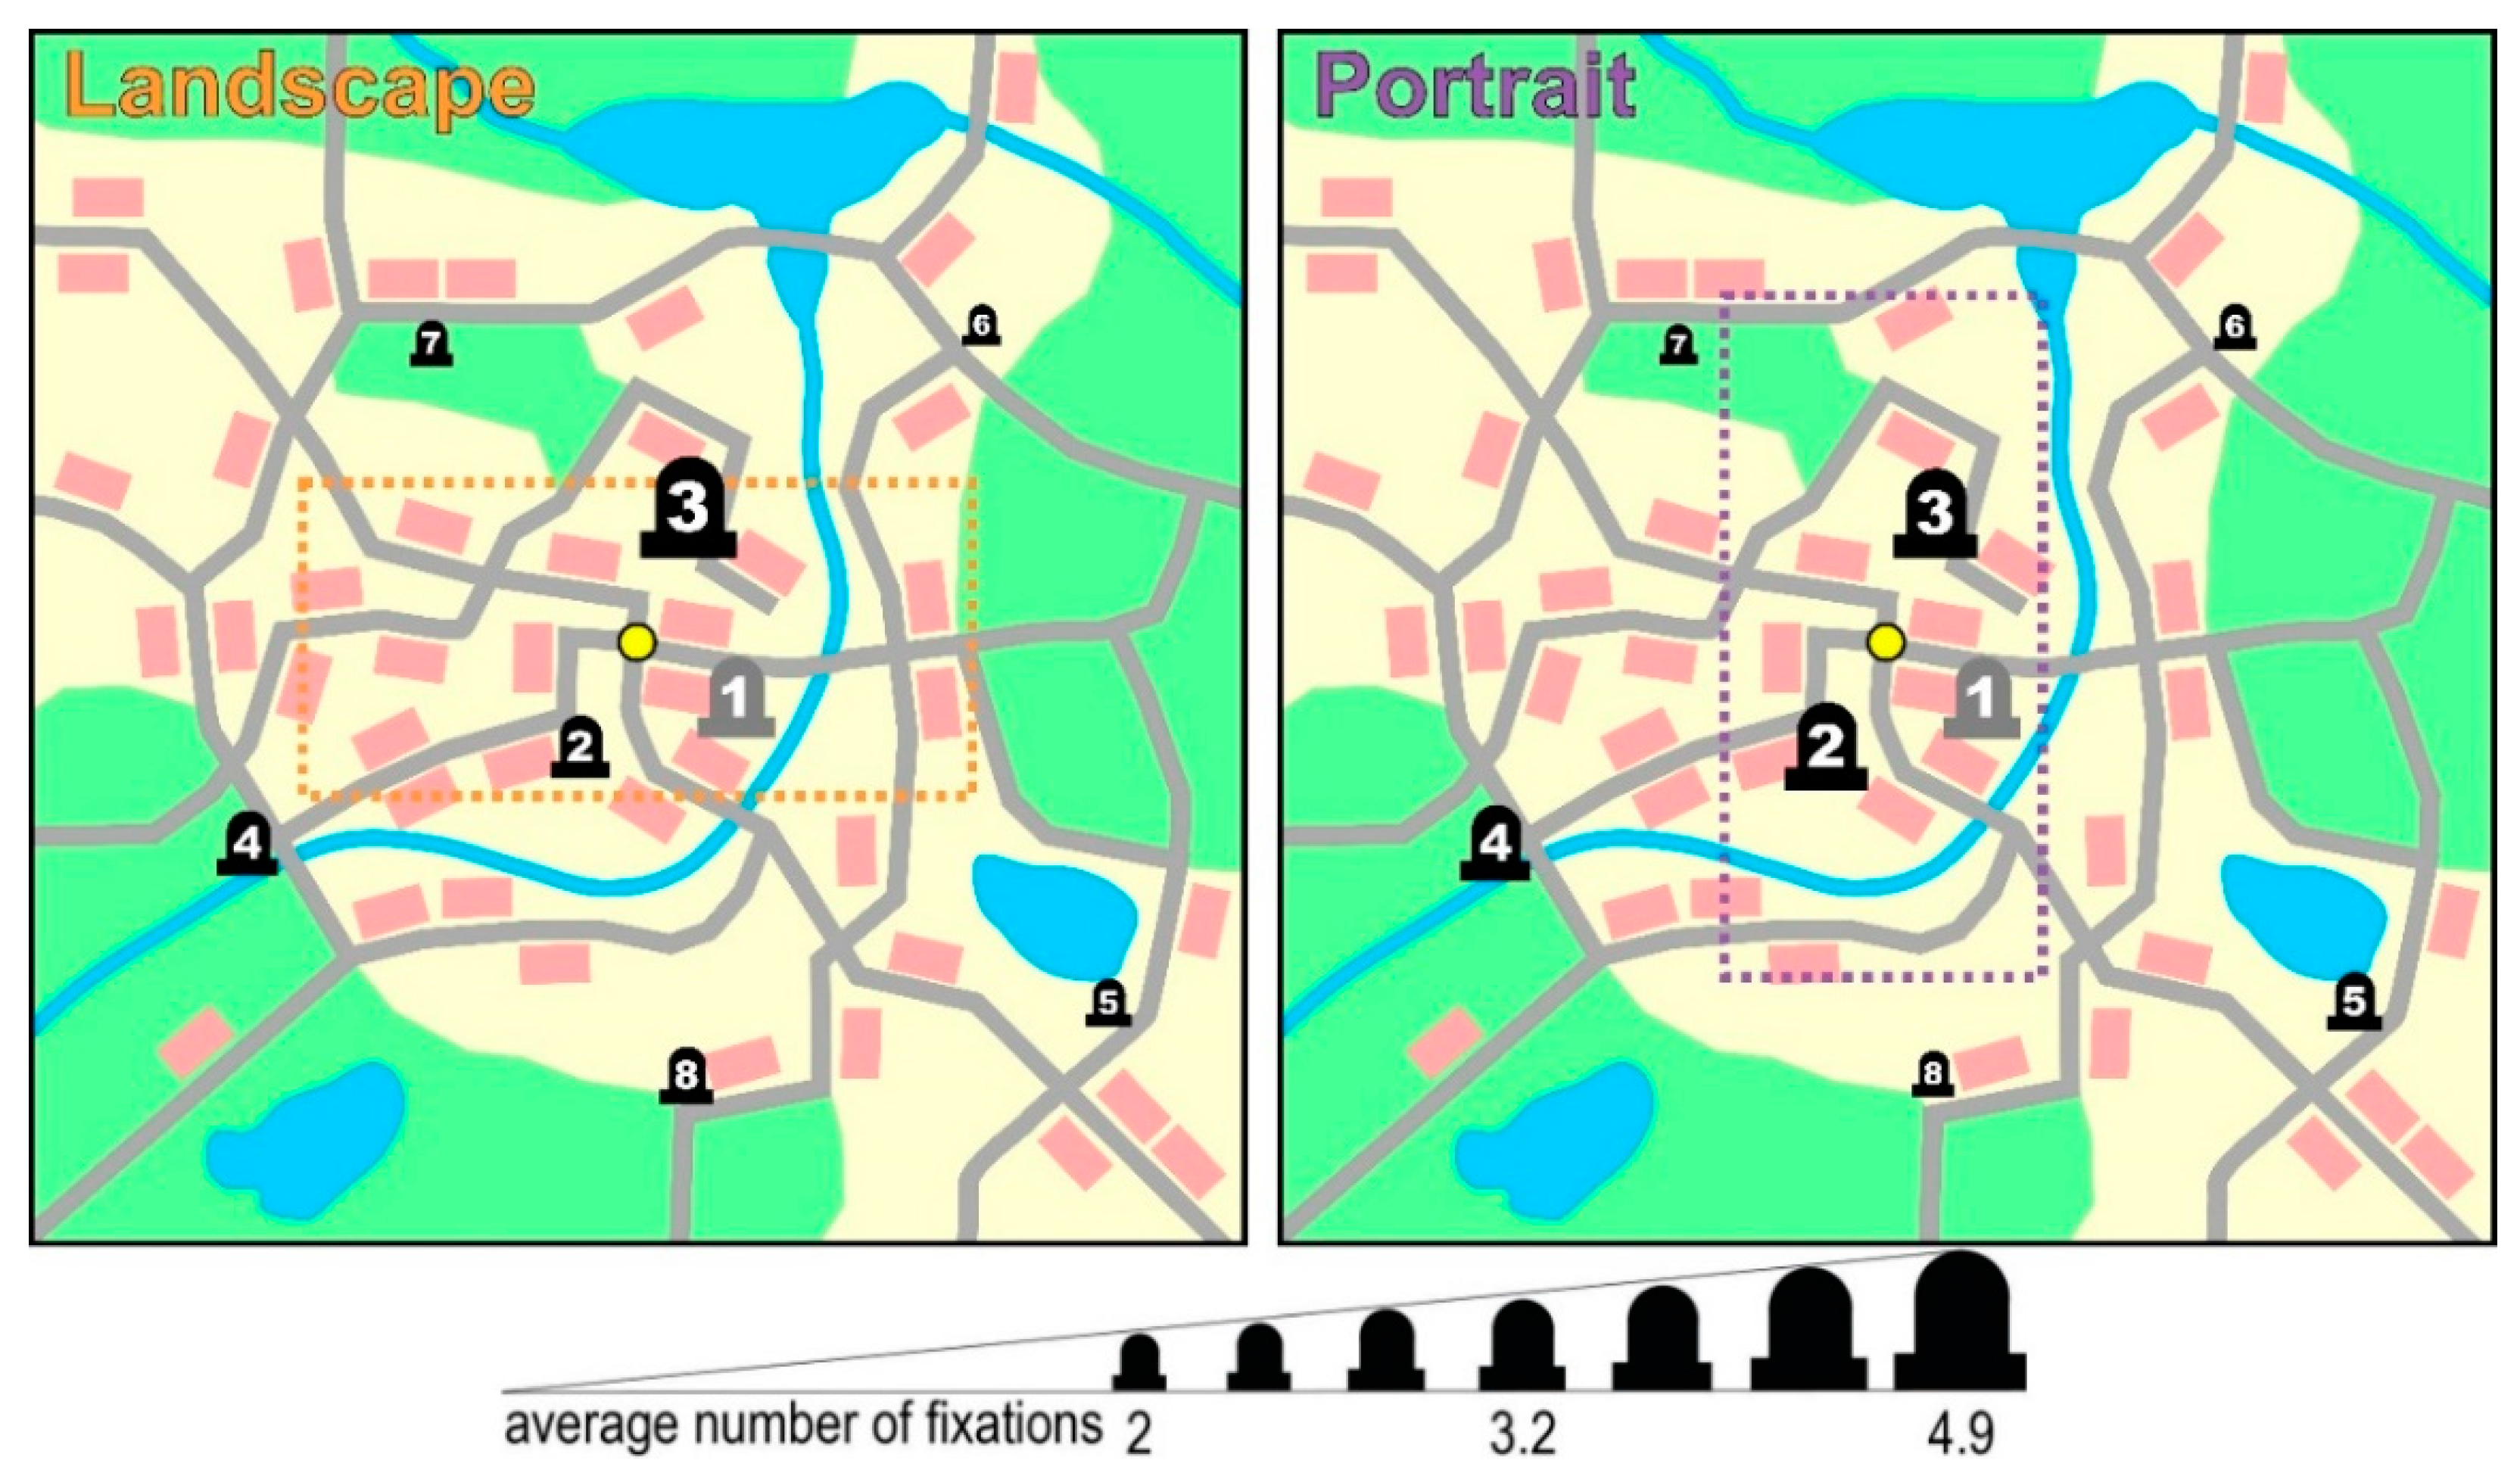
- Map design: the whole map area is closed in the square, centralization of the two 16:9 ratio viewing with landscape and portrait orientation, simplified content of the topographic map, eight stone numbered monuments (see Figure 2);
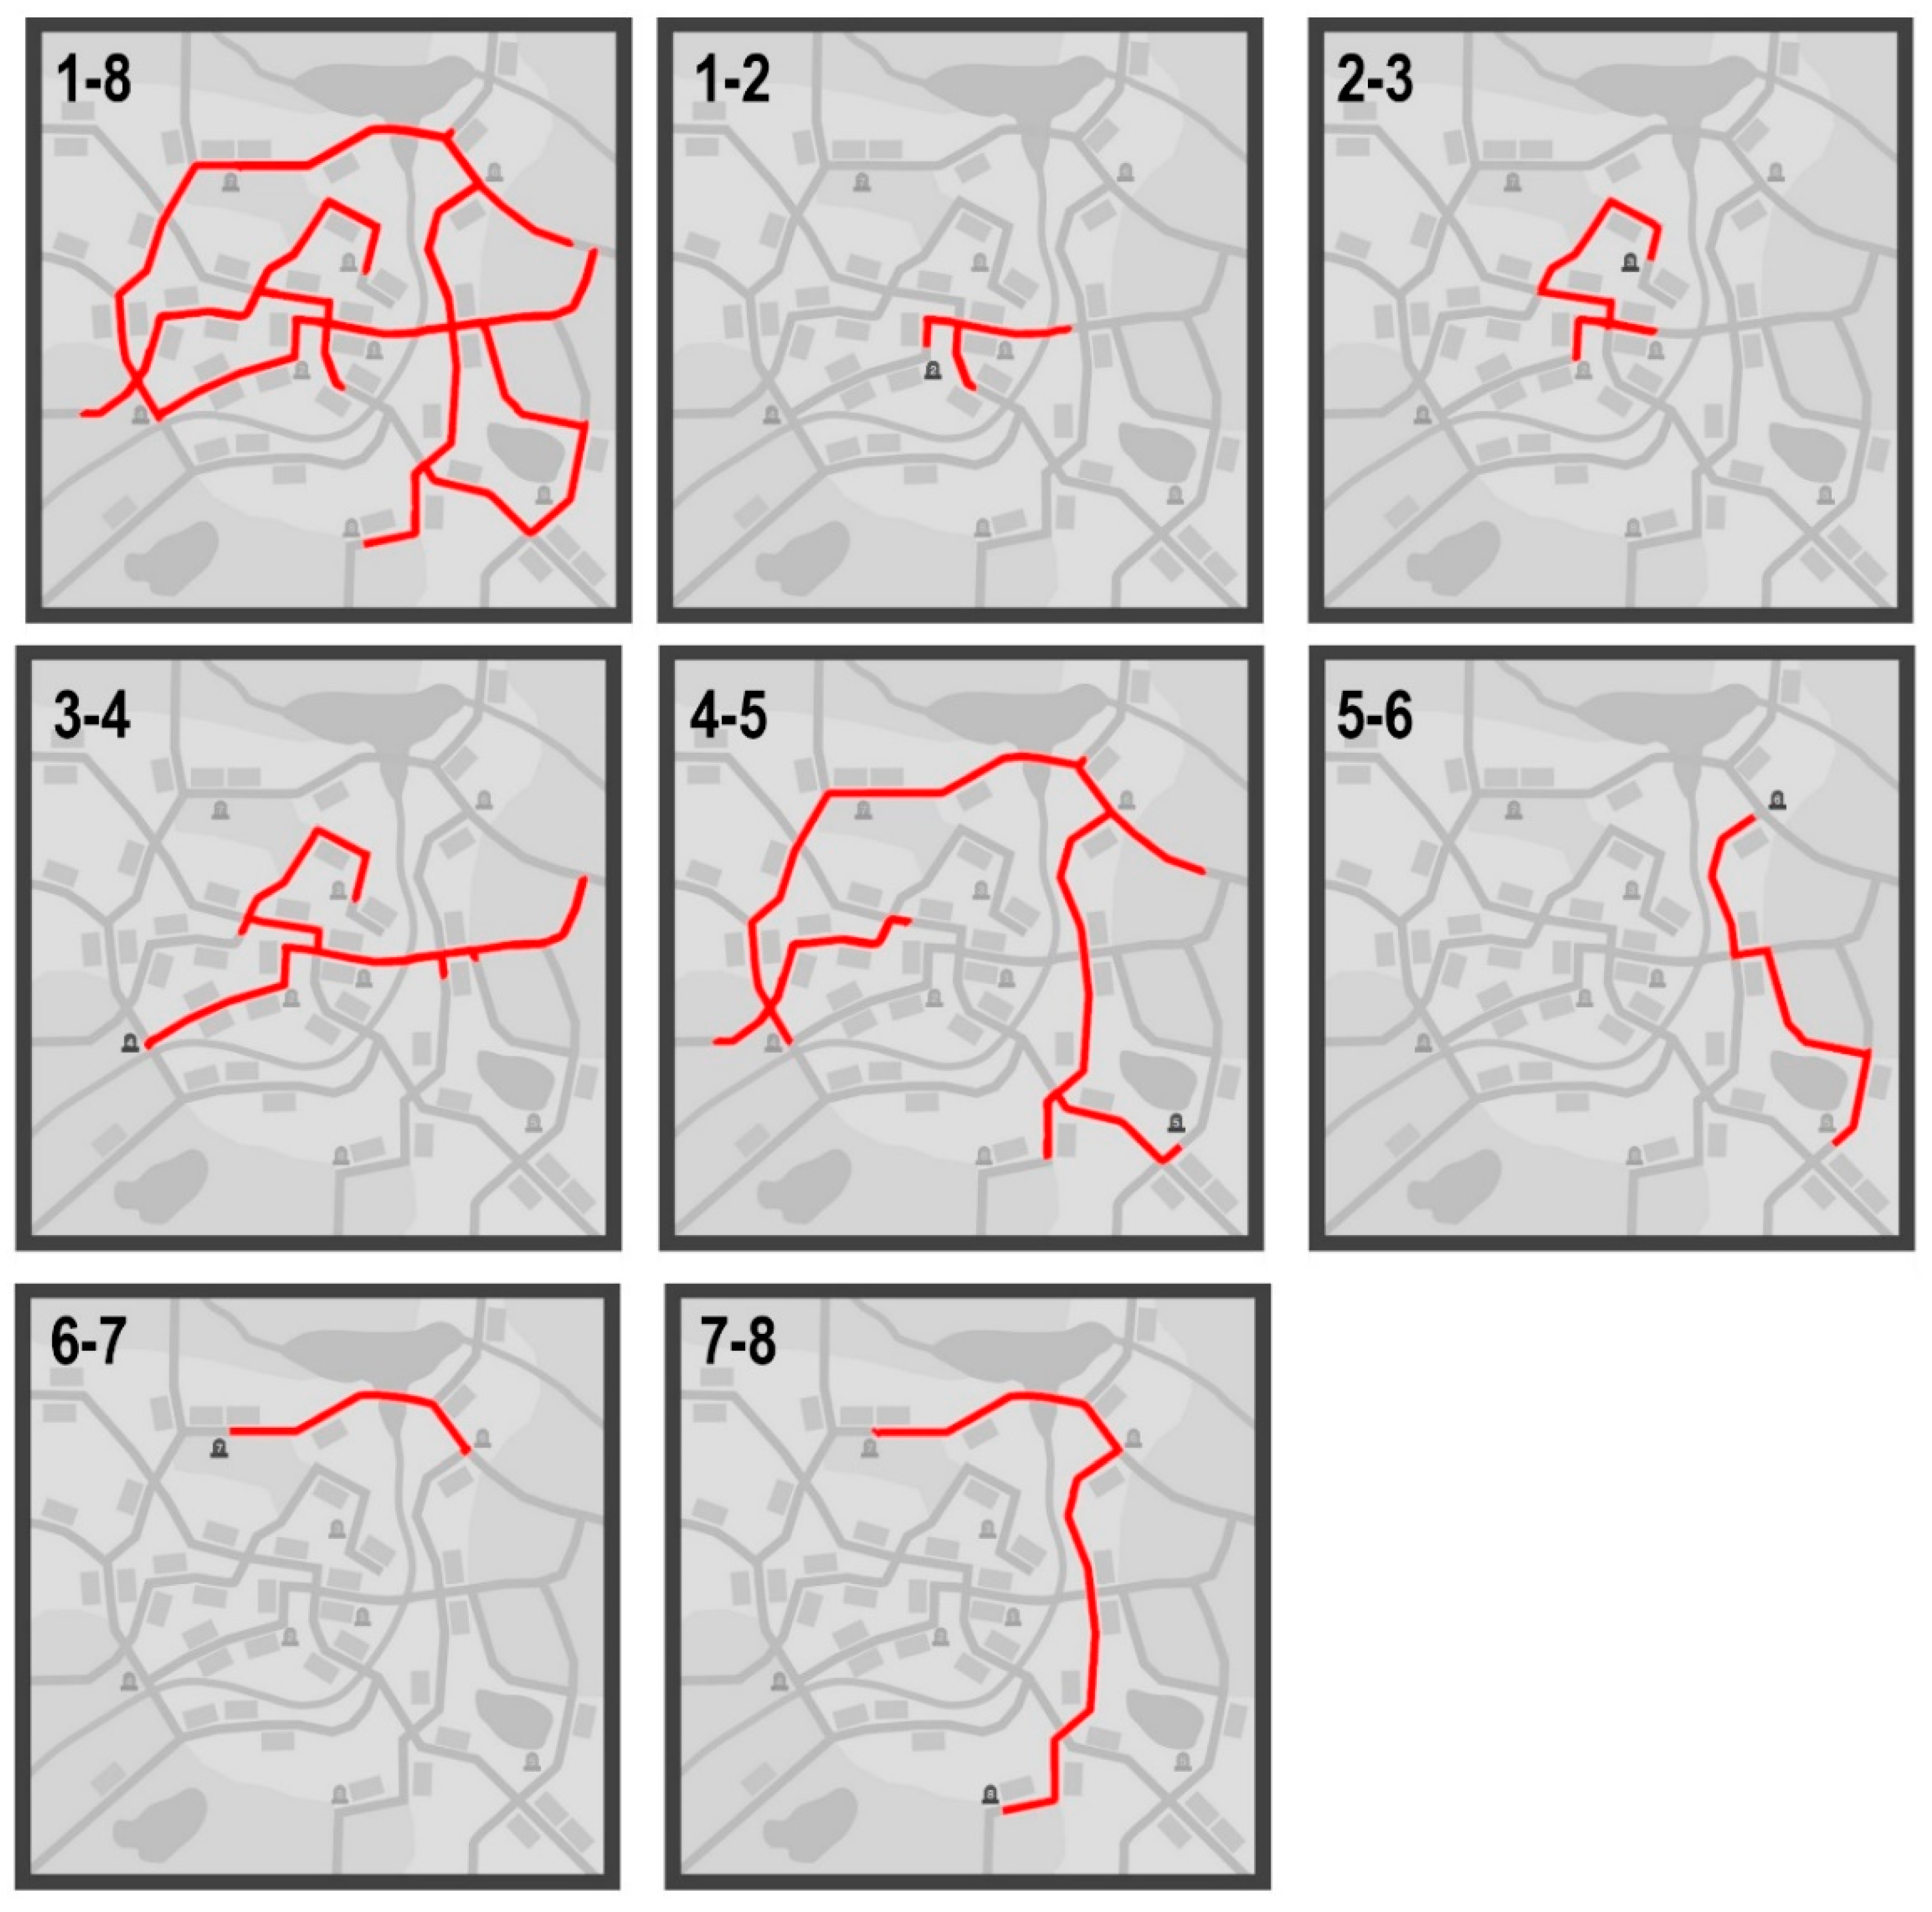
- App programming: moving around the roads, a user-symbol in the center of the display, minimalistic interface (no buttons, no joysticks), scrolling around the map by touch, eight consecutively seized stone monuments, summarizing data after each walk in the form of an image with a path and sometimes for each segment of the path;
- Respondents: 60 users, aged 19–24, from a homogenous group of Adam Mickiewicz University Poznan students, participating in the game voluntarily, without any financial gratification;
- Survey: each participant receives the same task instructions, which are to move on the map using roads only to reach each of the eight stone monuments as quickly as possible; 30 participants do the task on the smartphone in the landscape orientation, and 30 participants in the portrait orientation;
- Software and equipment: graphic and cartographic software (Inkscape, Photoshop, QGIS); game engine (Unity), programming language (C#); survey (smartphone 16 × 9; eye-tracker Gazepoint GP3 HD, Gazepoint Control, laptop MSI);
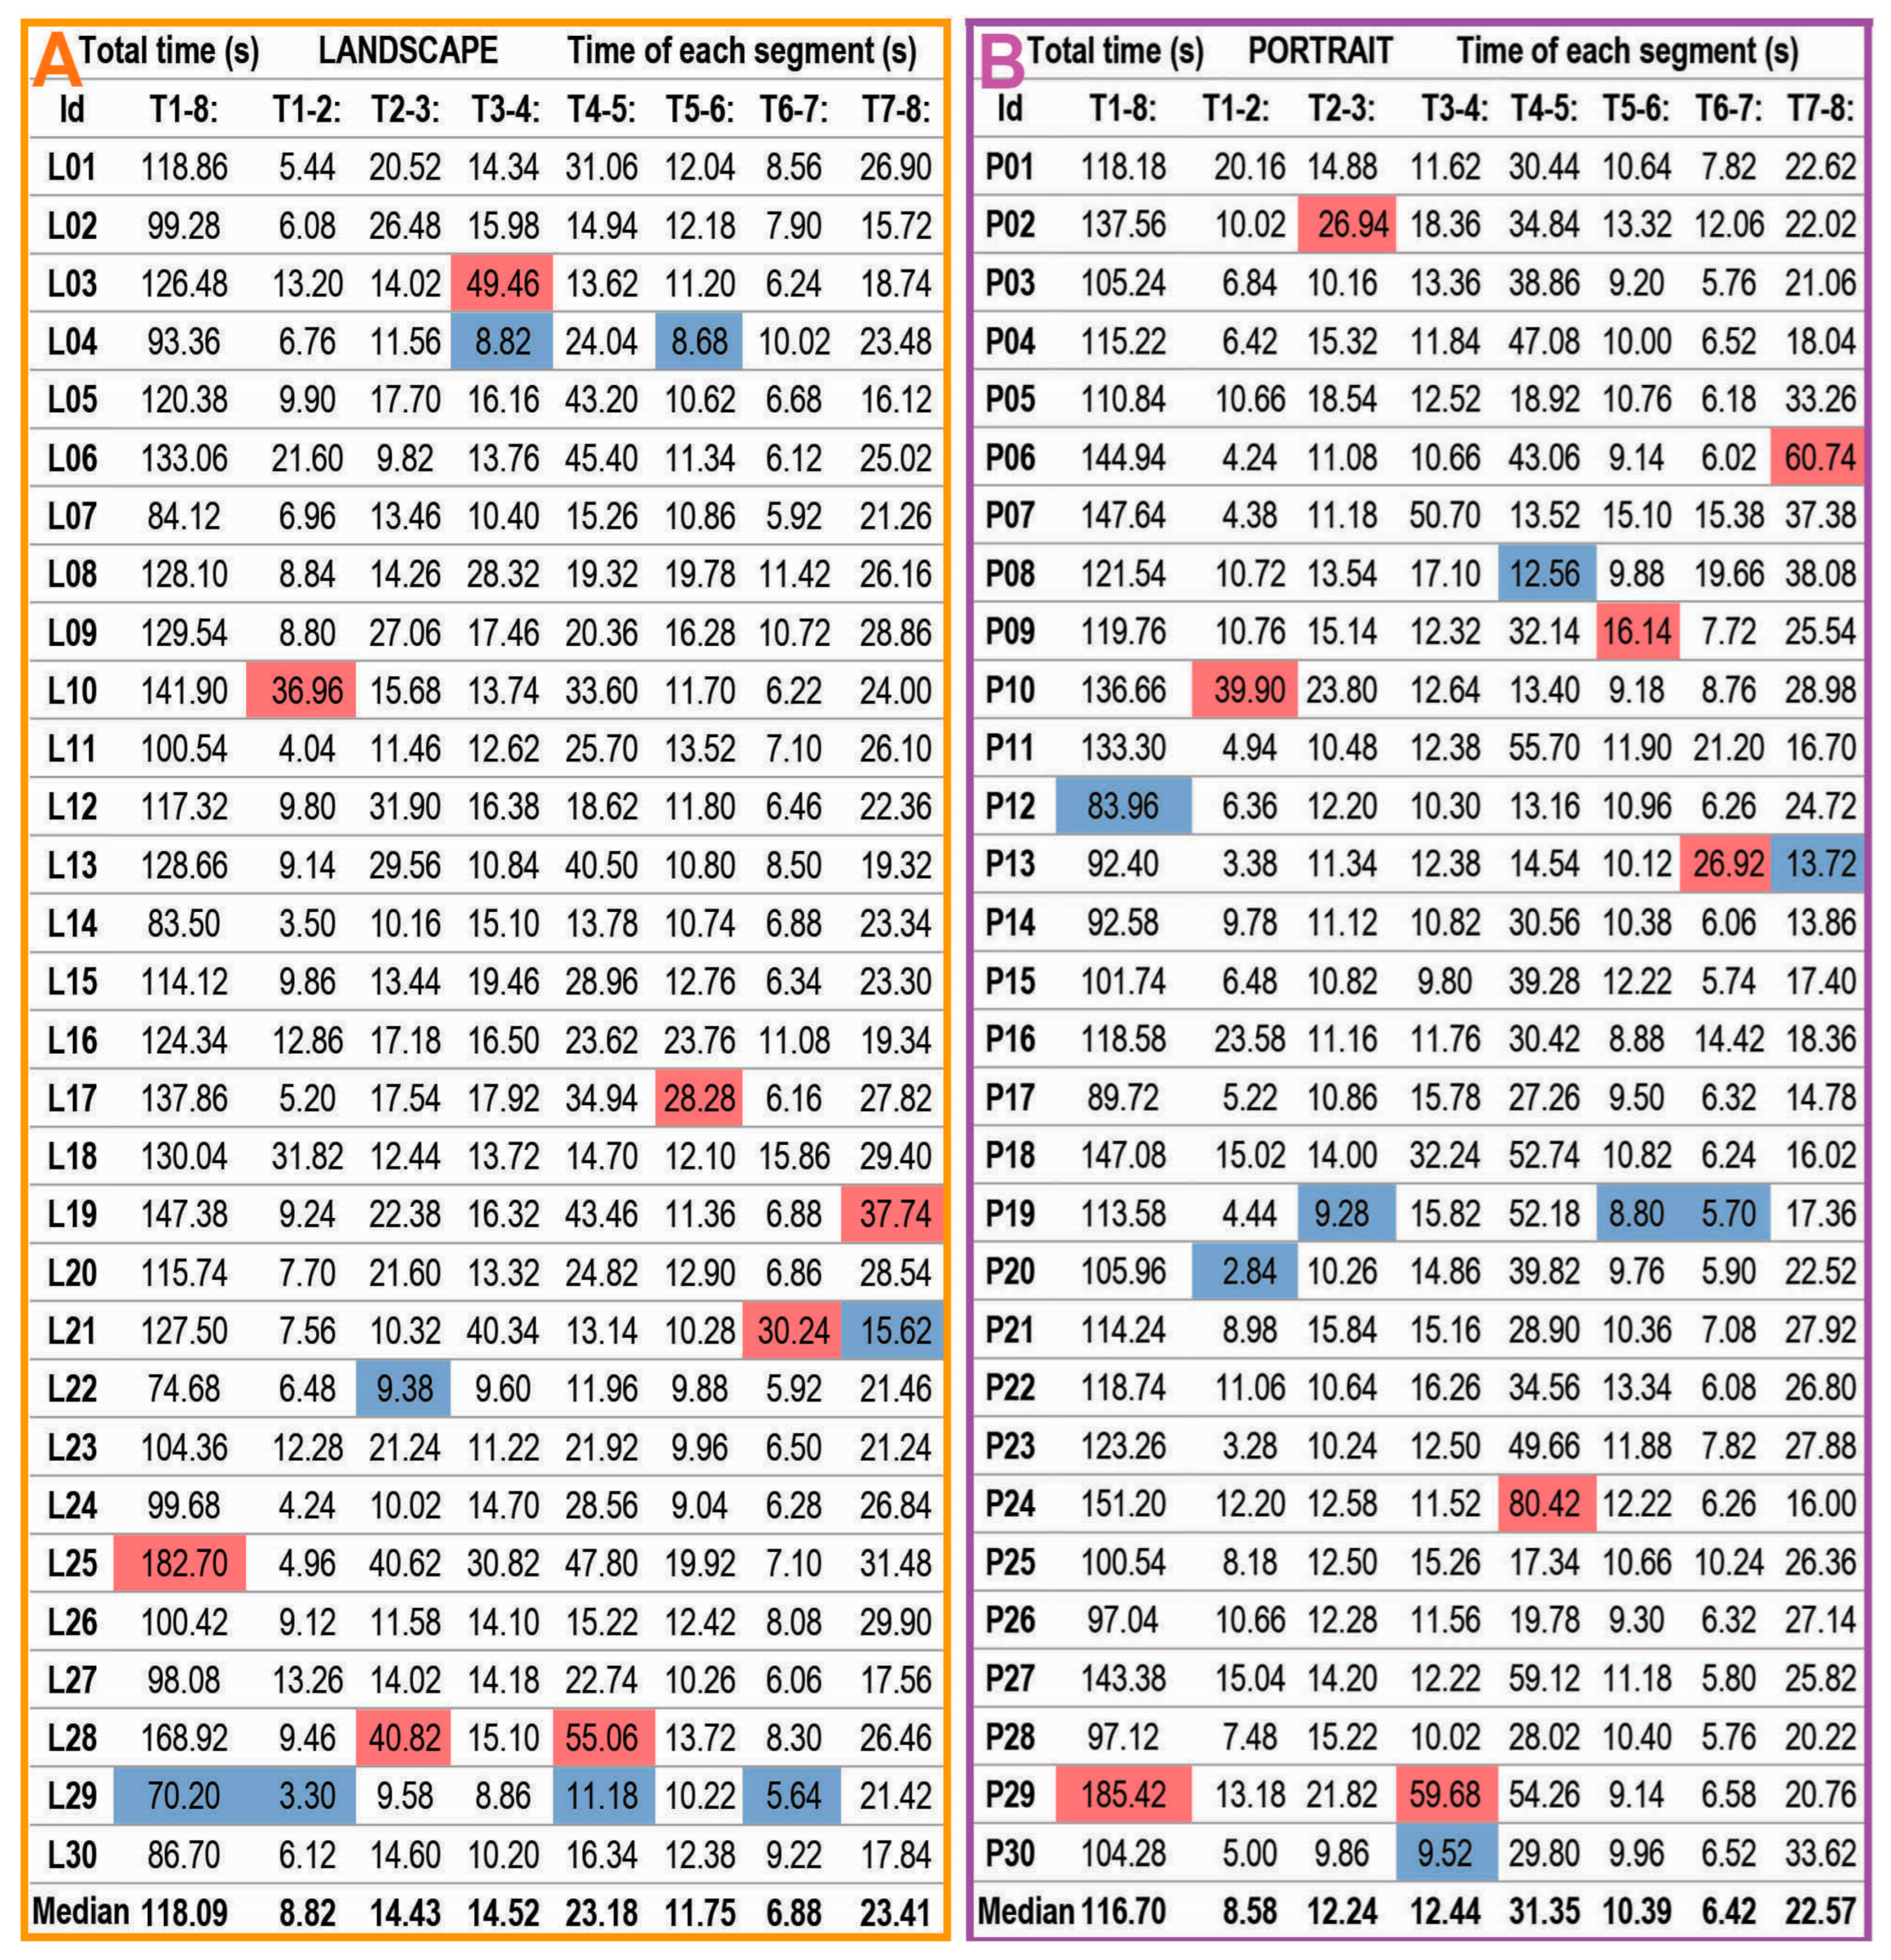
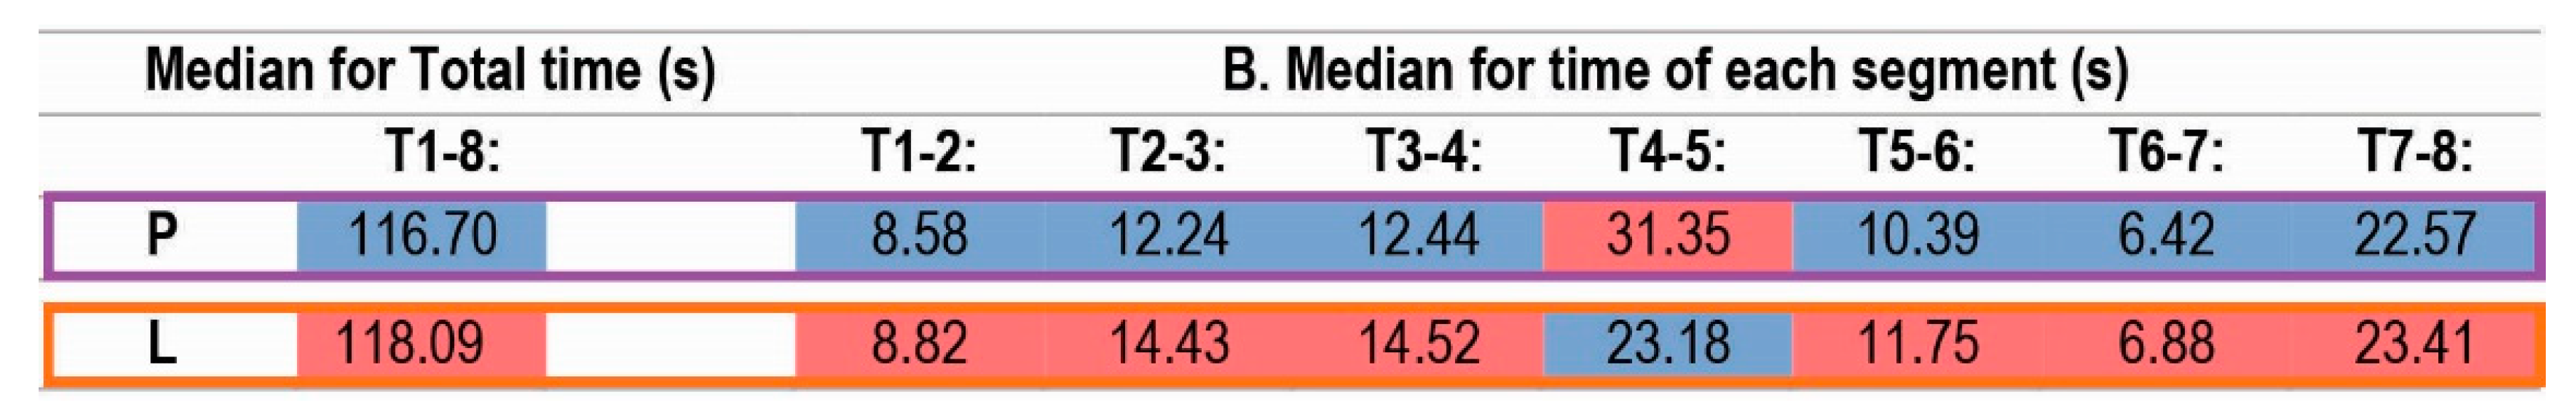
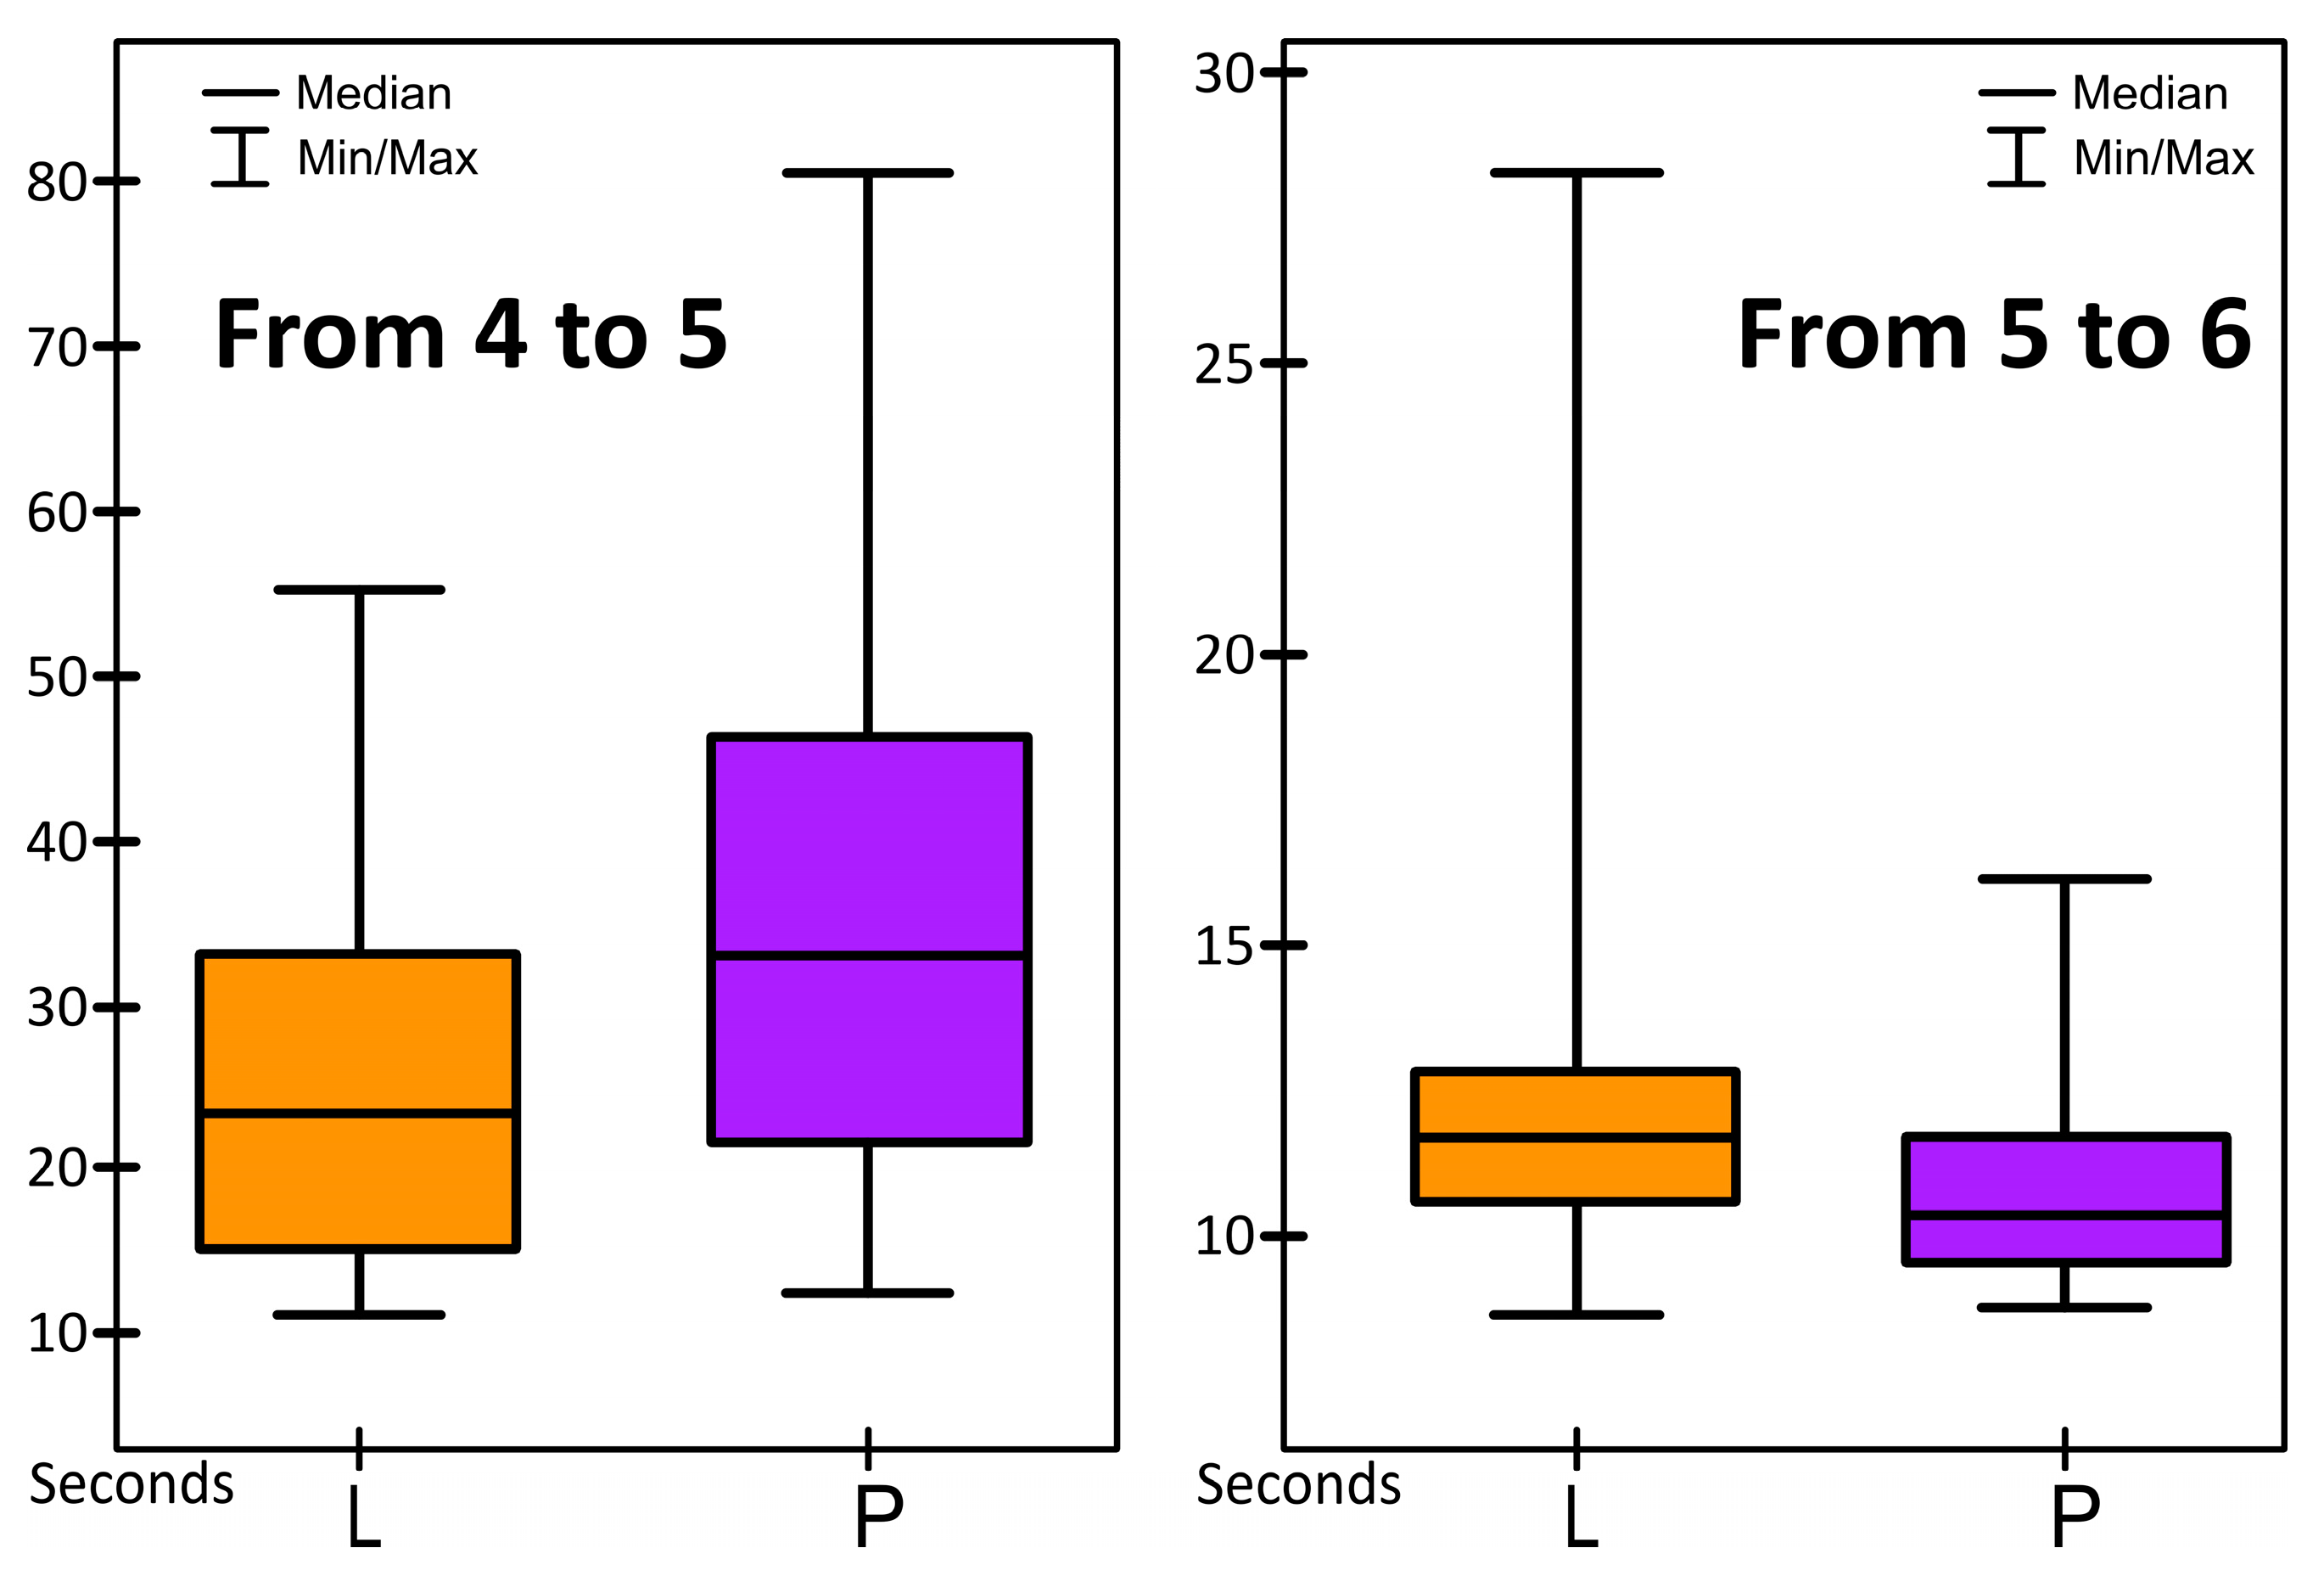
- Statistical analysis: total time of gameplay, median, statistical significance;
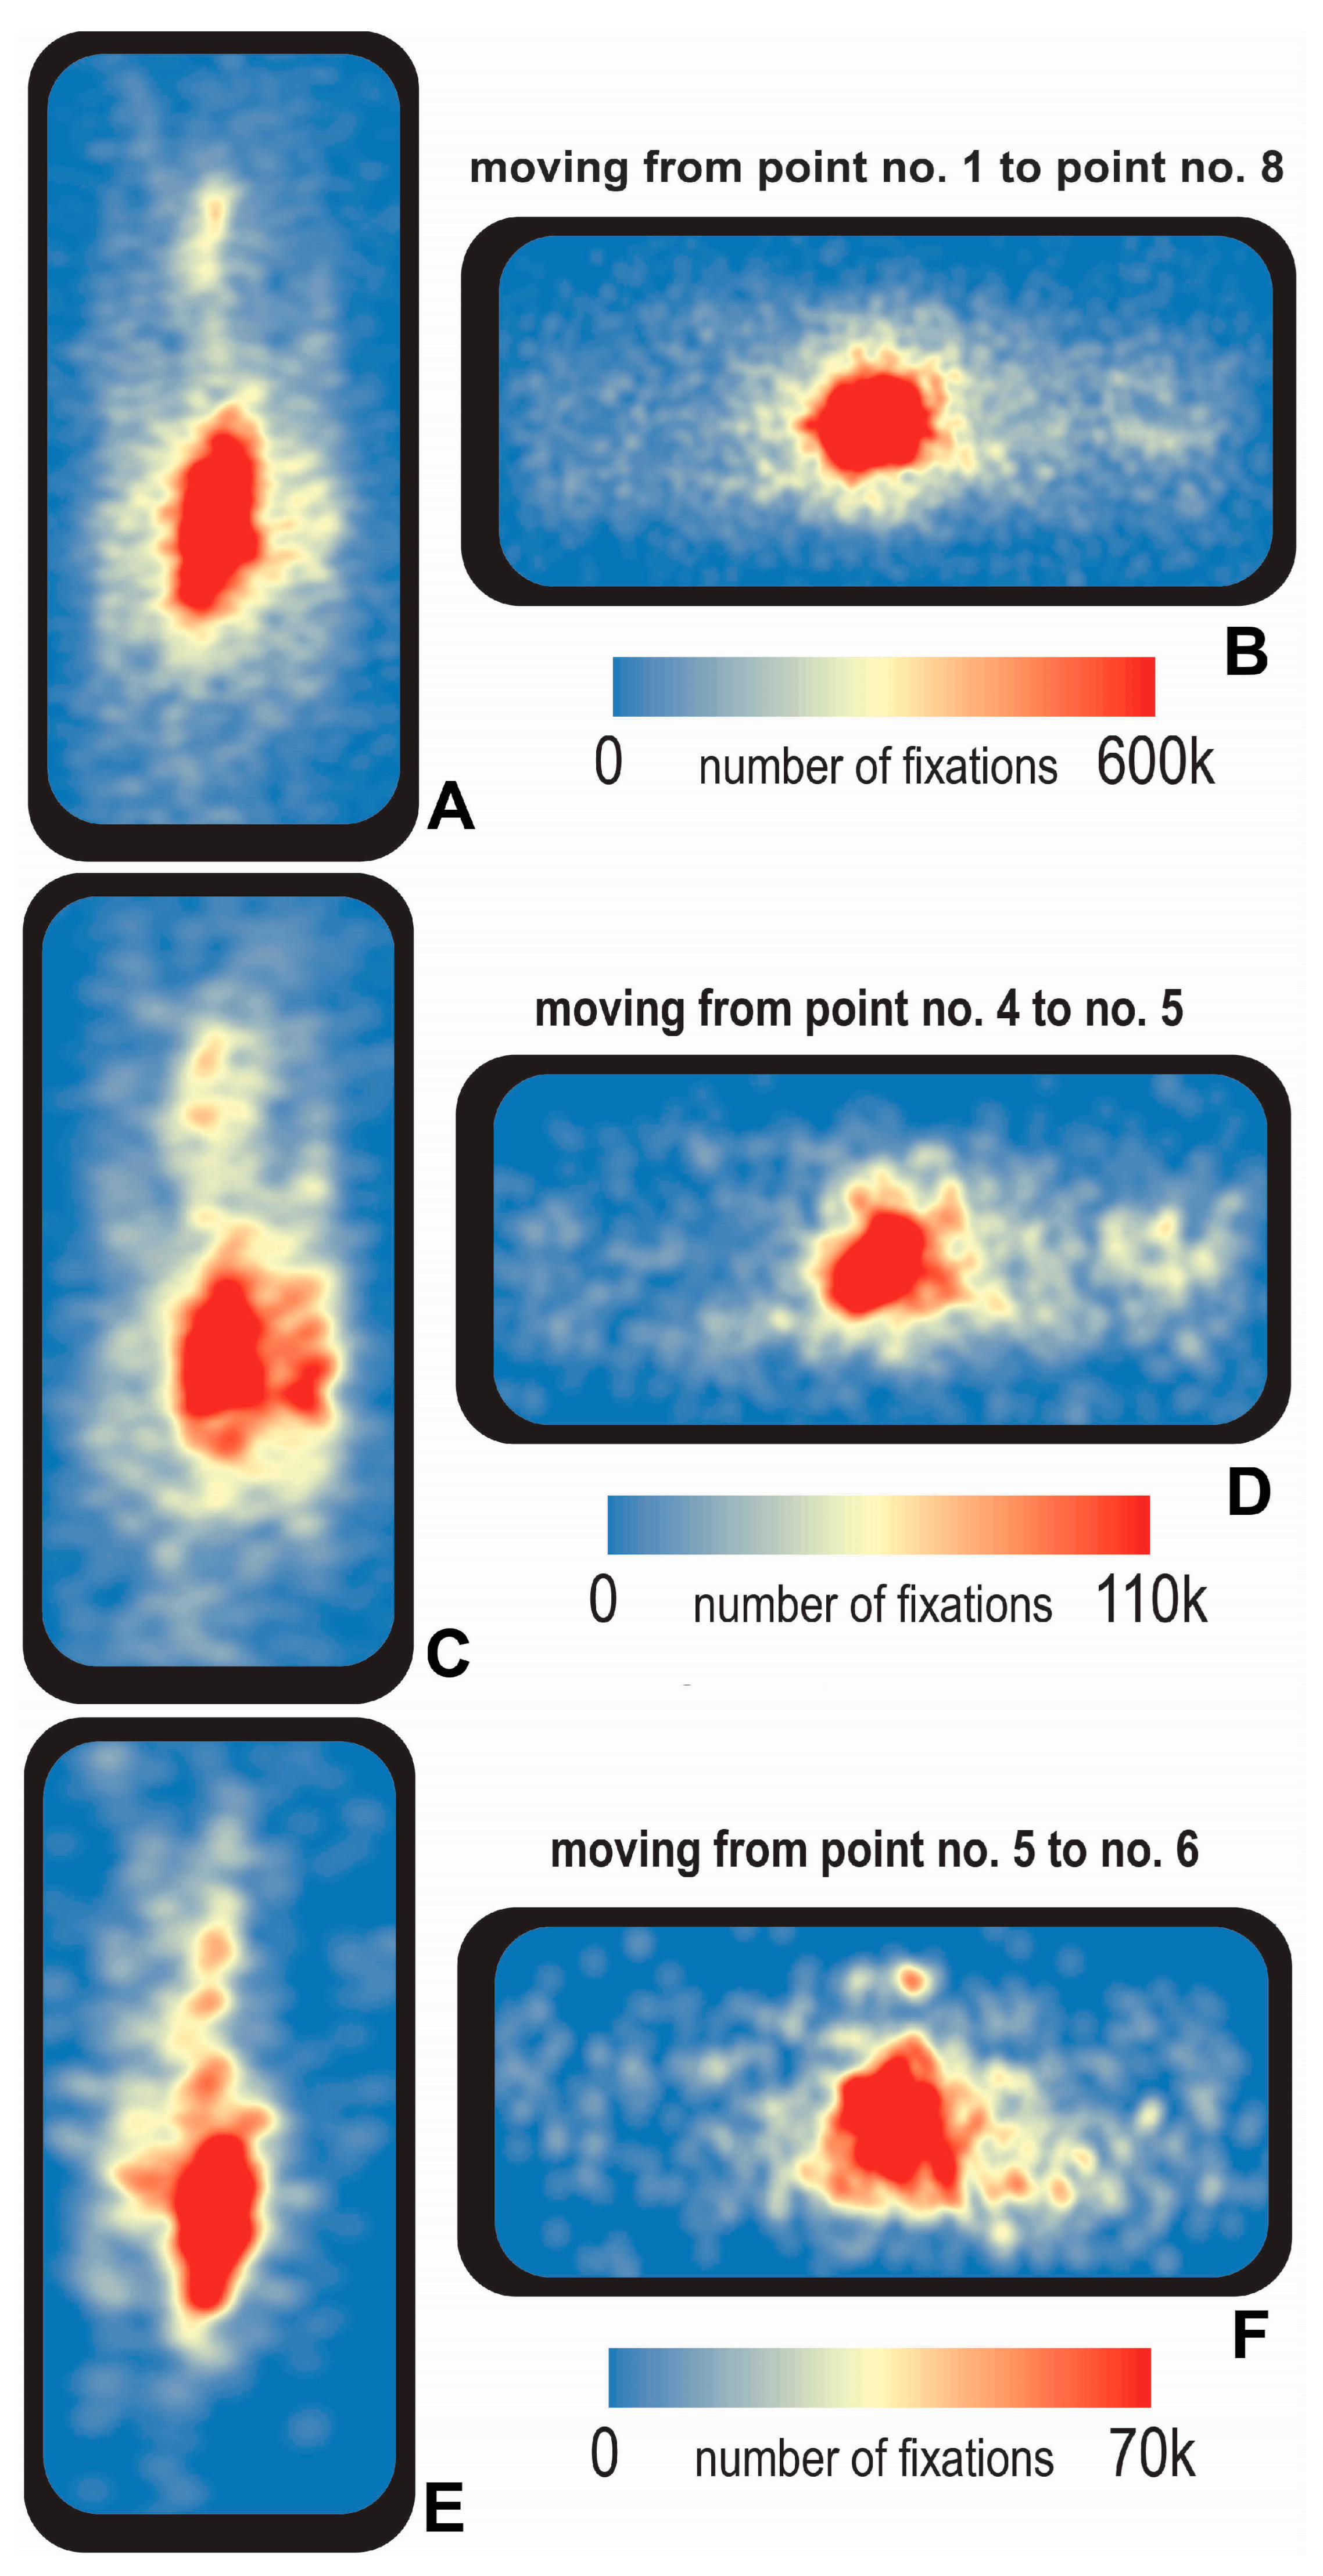
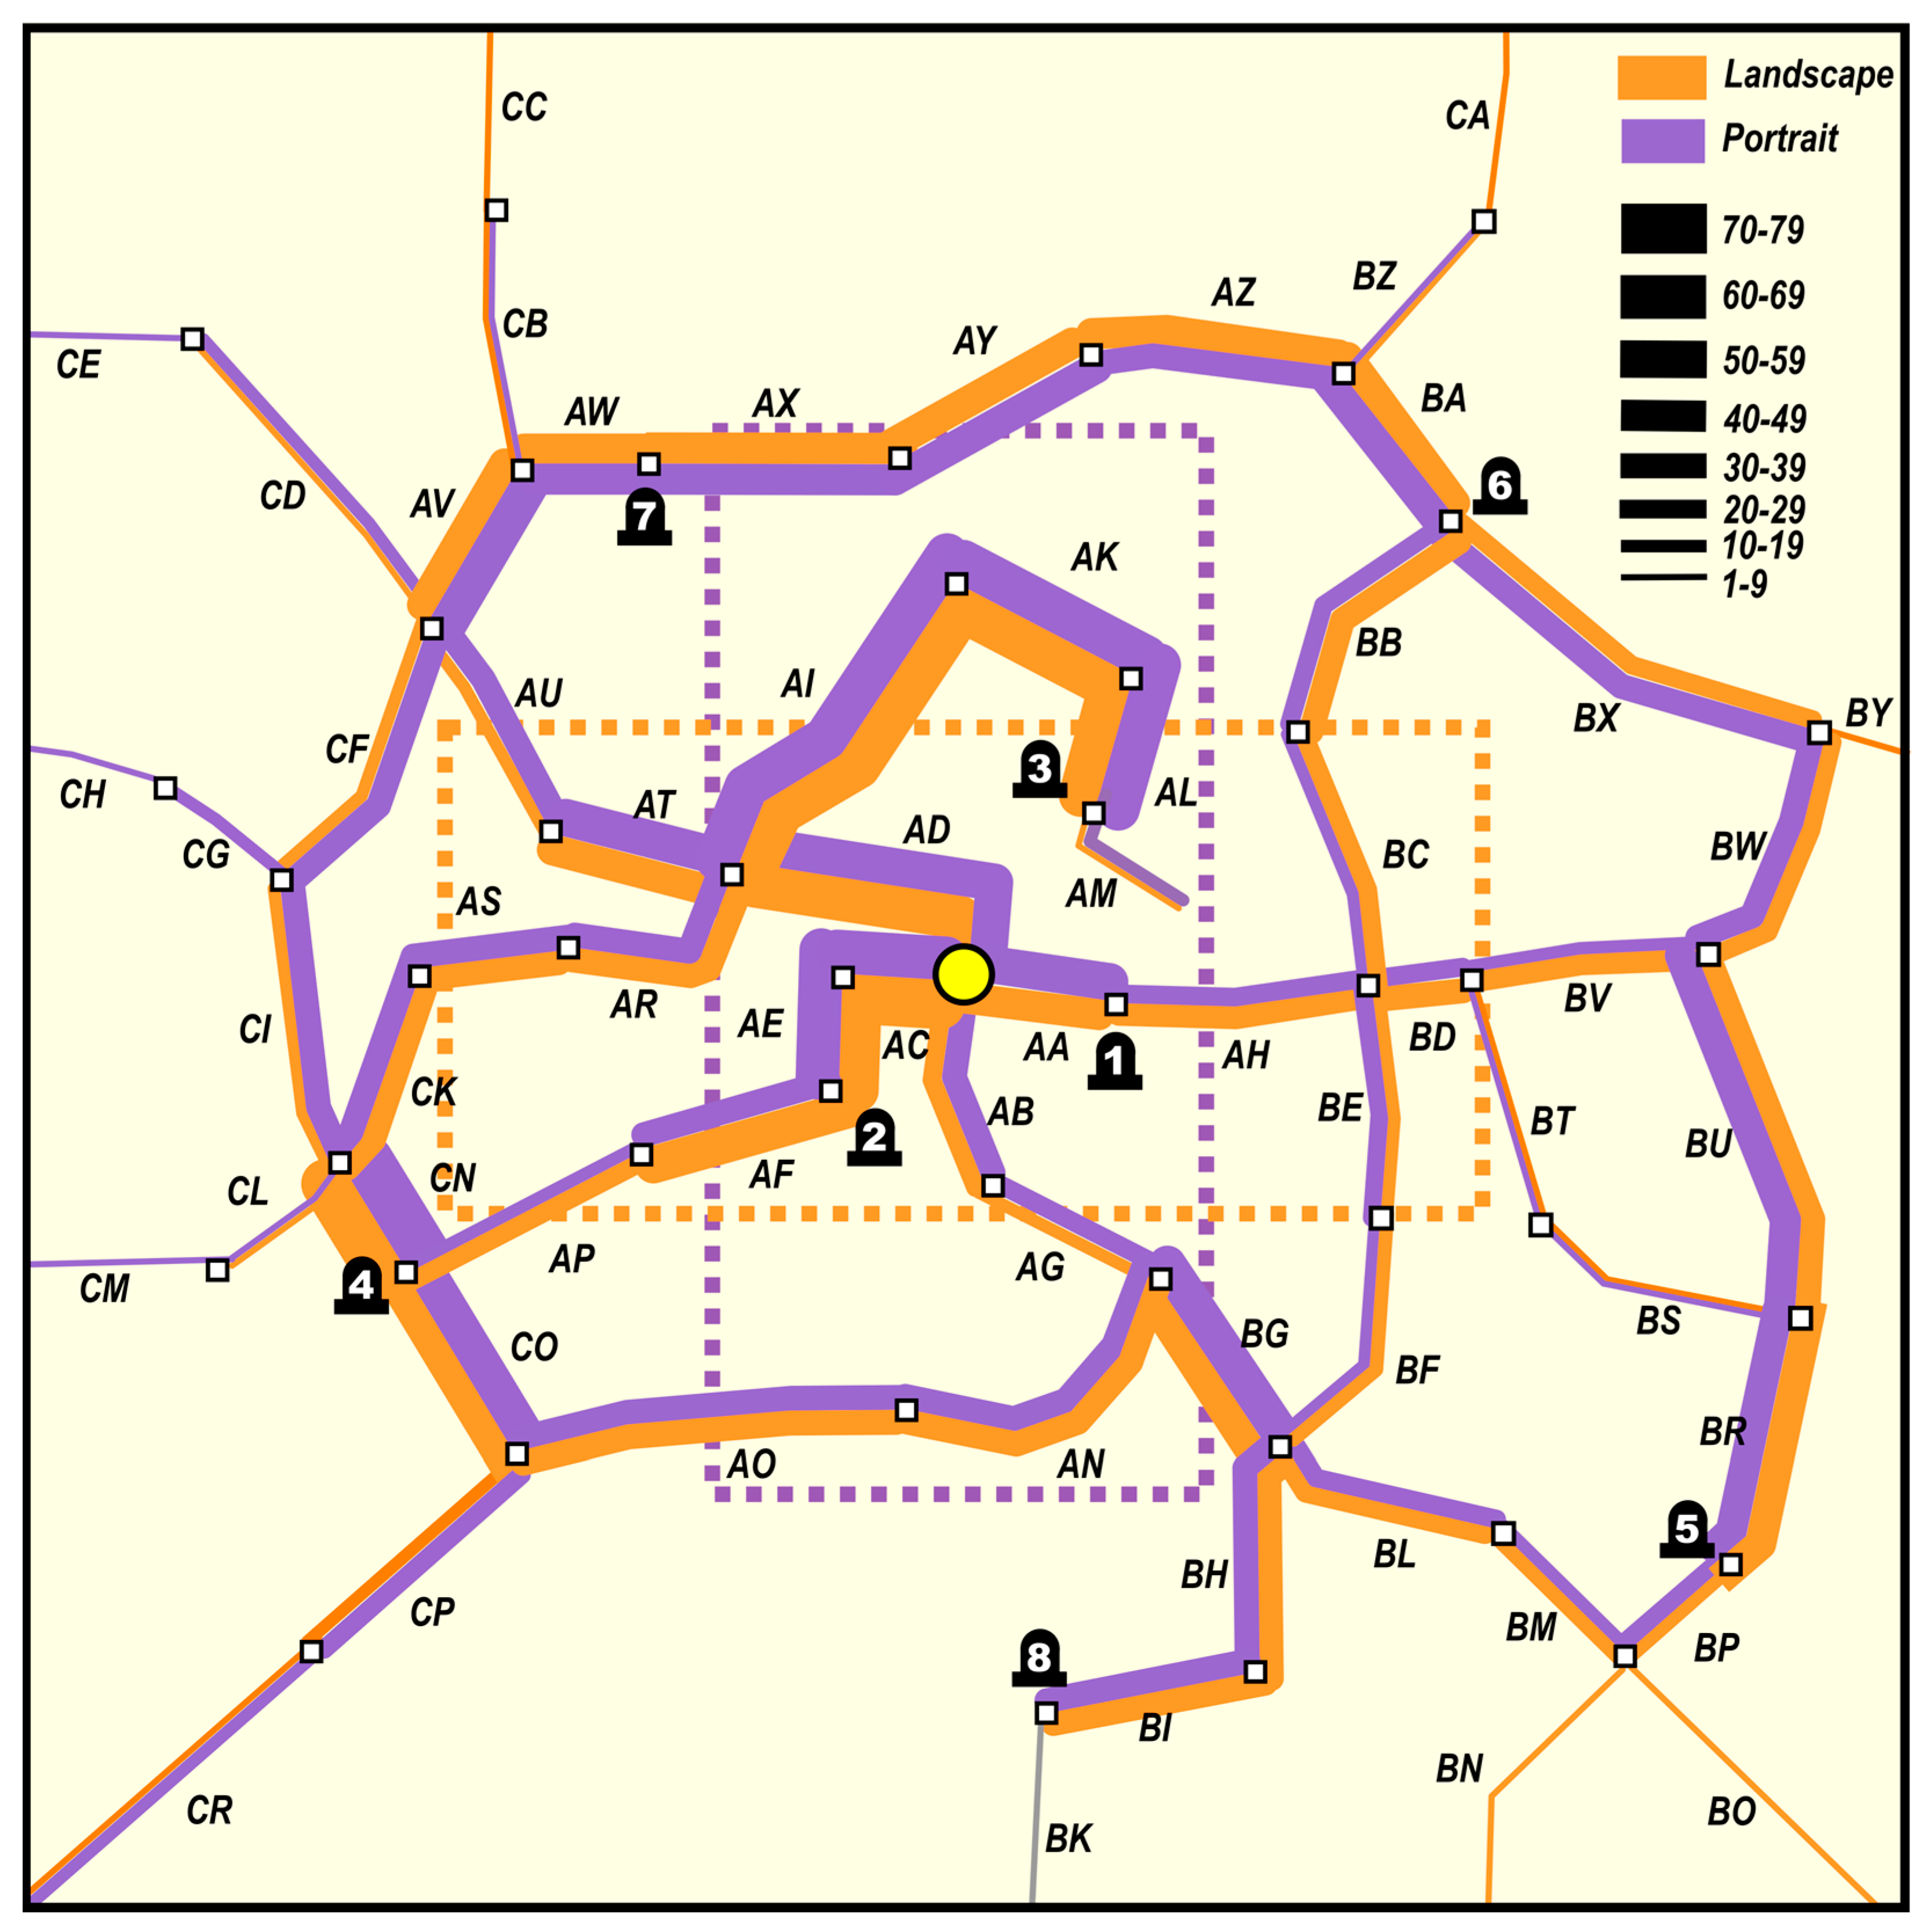
- Cartographic visualization: visual strategy: heat map and proportional point symbol map; road load intensity: flow map (band cartodiagram);
- Expected research results: List of general and particular similarities and differences for landscape and portrait orientation.
3.2. Creating a 2D Map for Smartphone


3.3. Creating an Application for Smartphone

3.4. Surveys among Map Users
4. Results
4.1. Statistical Analysis


4.2. Cartographic Visualization
5. Discussion


6. Conclusions
- regardless of the orientation of the smartphone, participants completed the whole task at a similar time (this is the recommendation that both device orientations are adequate for presenting topographical space on a mobile phone);
- both orientations implied different path selections (the recommendation is that the orientation of the smartphone has great importance to the better orientation on the north–south and the west–east axis);
- both orientations implied different participants’ visual strategies (the recommendation is that the smartphone orientation should support the visibility of crucial information on the map).
Author Contributions
Funding
Data Availability Statement
Conflicts of Interest
References
- Muehlenhaus, I. Internet mapping. In The Routledge Handbook of Mapping and Cartography; Kent, A.J., Vujakovic, P., Eds.; Routledge: London, UK, 2018; pp. 375–387. ISBN 9780367581046. [Google Scholar]
- Robinson, A.H.; Morrison, J.L.; Muehrecke, P.C.; Kimerling, A.J.; Guptil, S.C. Elements of Cartography, 6th ed.; Wiley: New York, NY, USA, 1995; ISBN 9788126524549. [Google Scholar]
- Kent, A.; Vujakovic, P. Cartographic Language: Towards a New Paradigm for Understanding Stylistic Diversity in Topographic Maps. Cartogr. J. 2011, 48, 21–40. [Google Scholar] [CrossRef]
- Medyńska-Gulij, B. Point Symbols: Investigating Principles and Originality in Cartographic Design. Cartogr. J. 2008, 45, 62–67. [Google Scholar] [CrossRef]
- Wood, C.H.; Keller, C.P. Cartographic Design: Theoretical and Practical Perspectives; Wiley: Chicherster, UK, 1996; pp. 1–10. ISBN 9780471965879. [Google Scholar]
- Spiess, E. Map compilation. In Basic Cartography: Volume Two. For Students and Technicians, 2nd ed.; Anson, R.W., Ormeling, F.J., Eds.; Butterworth-Heinemann: Oxford, UK, 2002; pp. 25–84. ISBN 9781851662326. [Google Scholar]
- Dent, B.D. Cartography: Thematic Map Design, 5th ed.; McGraw-Hill: Boston, CA, USA, 1999; ISBN 9780697384959. [Google Scholar]
- Lloyd, R. Attention on Maps. Cartogr. Perspect. 2005, 52, 28–57. [Google Scholar] [CrossRef]
- Medyńska-Gulij, B. How the Black Line, Dash and Dot Created the Rules of Cartographic Design 400 Years Ago. Cart. Graph. J. 2013, 50, 356–368. [Google Scholar] [CrossRef]
- Horbiński, T.; Zagata, K. View of Cartography in Video Games: Literature Review and Examples of Specific Solutions. KN J. Cartogr. Geogr. Inf. 2022, 72, 117–128. [Google Scholar] [CrossRef]
- Kapenekakis, I.; Chorianopoulos, K. Citizen science for pedestrian cartography: Collection and moderation of walkable routes in cities through mobile gamification. Hum. Cent. Comput. Inf. Sci. 2017, 7, 10. [Google Scholar] [CrossRef] [Green Version]
- Lammes, S.; Wilmott, C. The map as playground: Location-based games as cartographical practices. Convergence 2018, 24, 648–665. [Google Scholar] [CrossRef] [Green Version]
- Koulaxidis, G.; Xinogalos, S. Improving Mobile Game Performance with Basic Optimization Techniques in Unity. Modelling 2022, 3, 201–223. [Google Scholar] [CrossRef]
- Edler, D.; Keil, J.; Dickmann, F. From Na Pali to Earth—An ‘Unreal’ Engine for Modern Geodata? In Modern Approaches to the Visualization of Landscapes; Edler, D., Jenal, C., Kühne, O., Eds.; Springer: Wiesbaden, Germany, 2020; ISBN 9783658309558. [Google Scholar]
- Zaina, L.A.M.; de Mattos Fortes, R.P.; Casadei, V.; Nozaki, L.S.; Paiva, D.M.B. Preventing accessibility barriers: Guidelines for using user interface design patterns in mobile applications. J. Syst. Softw. 2022, 186, 111213. [Google Scholar] [CrossRef]
- Giurgiu, L.; Gligorea, I. Responsive Web Design Techniques. Int. Conf. Knowl. -Based Organ. 2017, 23, 37–42. [Google Scholar] [CrossRef]
- Horbiński, T.; Cybulski, P.; Medyńska-Gulij, B. Web Map Effectiveness in the Responsive Context of the Graphical User Interface. ISPRS Int. J. Geo-Inf. 2021, 10, 134. [Google Scholar] [CrossRef]
- Horbiński, T.; Cybulski, P. Similarities of global web mapping services functionality in the context of responsive web design. Geod. Cartogr. 2018, 67, 159–177. [Google Scholar] [CrossRef] [Green Version]
- Halik, Ł.; Kent, A.J. Measuring user preferences and behaviour in a topographic immersive virtual environment (TopoIVE) of 2D and 3D urban topographic data. Int. J. Digit. Earth 2021, 14, 1835–1867. [Google Scholar] [CrossRef]
- Korycka-Skorupa, J.; Gołȩbiowska, I. Multivariate mapping for experienced users: Comparing extrinsic and intrinsic maps with univariate map. Misc. Geogr. 2021, 25, 259–271. [Google Scholar] [CrossRef]
- Medyńska-Gulij, B.; Zagata, K. Experts and Gamers on Immersion into Reconstructed Strongholds. ISPRS Int. J. Geo-Inf. 2020, 9, 655. [Google Scholar] [CrossRef]
- Wielebski, Ł.; Medyńska-Gulij, B.; Halik, Ł.; Dickmann, F. Time, Spatial, and Descriptive Features of Pedestrian Tracks on Set of Visualizations. ISPRS Int. J. Geo-Inf. 2020, 9, 348. [Google Scholar] [CrossRef]
- Cybulski, P. An Empirical Study on the Effects of Temporal Trends in Spatial Patterns on Animated Choropleth Maps. ISPRS Int. J. Geo-Inf. 2022, 11, 273. [Google Scholar] [CrossRef]
- Horbiński, T.; Zagata, K. Interpretation of Map Symbols in the Context of Gamers’ Age and Experience. ISPRS Int. J. Geo-Inf. 2022, 11, 150. [Google Scholar] [CrossRef]
- Edler, D.; Keil, J.; Tuller, M.-C.; Bestgen, A.-K.; Dickmann, F. Searching for the ‘Right’ Legend: The Impact of Legend Position on Legend Decoding in a Cartographic Memory Task. Cartogr. J. 2020, 57, 6–17. [Google Scholar] [CrossRef]
- Zagata, K.; Gulij, J.; Halik, Ł.; Medyńska-Gulij, B. Mini-Map for Gamers Who Walk and Teleport in a Virtual Stronghold. ISPRS Int. J. Geo-Inf. 2021, 10, 96. [Google Scholar] [CrossRef]
- Lee, E.C.; Park, M.W. A New Eye Tracking Method as a Smartphone Interface. KSII Trans. Internet Inf. Syst. 2013, 7, 834–848. [Google Scholar] [CrossRef]
- Qu, Q.X.; Zhang, L.; Chao, W.Y.; Duffy, V. User Experience Design Based on Eye-Tracking Technology: A Case Study on Smartphone APPs. In Advances in Applied Digital Human Modeling and Simulation; Duffy, V., Ed.; Springer: Cham, Switzerland, 2017; ISBN 9783319416267. [Google Scholar]
- Chynał, P.; Szymański, J.M.; Sobecki, J. Using Eyetracking in a Mobile Applications Usability Testing. In Intelligent Information and Database Systems; Pan, J.S., Chen, S.M., Eds.; Springer: Berlin/Heidelberg, Germany, 2012; ISBN 9783642284922. [Google Scholar]
- Calka, B.; Nowak Da Costa, J.; Bielecka, E. Fine scale population density data and it’s application in risk assessment. Geomat. Nat. Hazards Risk 2017, 8, 1440–1455. [Google Scholar] [CrossRef] [Green Version]
- Dong, W.; Wang, S.; Chen, Y.; Meng, L. Using Eye Tracking to Evaluate the Usability of Flow Maps. ISPRS Int. J. Geo-Inf. 2018, 7, 281. [Google Scholar] [CrossRef] [Green Version]
- Keskin, M.; Ooms, K.; Dogru, A.O.; De Maeyer, P. Exploring the Cognitive Load of Expert and Novice Map Users Using EEG and Eye Tracking. ISPRS Int. J. Geo-Inf. 2020, 9, 429. [Google Scholar] [CrossRef]
- Smaczyński, M.; Medyńska-Gulij, B.; Halik, Ł. The Land Use Mapping Techniques (Including the Areas Used by Pedestrians) Based on Low-Level Aerial Imagery. ISPRS Int. J. Geo-Inf. 2020, 9, 754. [Google Scholar] [CrossRef]
- Kent, A.J. Topographic Maps: Methodological Approaches for Analyzing Cartographic Style. J. Map Geogr. Libr. 2009, 5, 131–156. [Google Scholar] [CrossRef]
- Jelizakov, D. Mobile Usability Made Simple. 2019. Available online: https://uxplanet.org/mobile-usability-made-simple-945e106e23eb (accessed on 5 July 2022).
- Gao, Y.; Li, A.; Zhu, T.; Liu, X.; Liu, X. How smartphone usage correlates with social anxiety and loneliness. PeerJ 2016, 4, e2197. [Google Scholar] [CrossRef] [Green Version]
- Hoober, S. How Do Users Really Hold Mobile Devices. 2013. Available online: https://www.uxmatters.com/mt/archives/2013/02/how-do-users-really-hold-mobile-devices.php (accessed on 5 July 2022).
- Forrest, D. Thematic Maps in Geography. In International Encyclopedia of the Social & Behavioral Sciences, 2nd ed.; Wright, J.D., Ed.; Elsevier: Oxford, UK, 2015; ISBN 9780080970875. [Google Scholar]
- Jiang, J.-Y.; Guo, F.; Chen, J.-H.; Tian, X.-H.; Lyu, W. Applying Eye-Tracking Technology to Measure Interactive Experience Towards the Navigation Interface of Mobile Games Considering Different Visual Attention Mechanisms. Appl. Sci. 2019, 9, 242. [Google Scholar] [CrossRef] [Green Version]
- Hejtmánek, L.; Oravcová, I.; Motýla, J.; Horáček, J.; Fajnerováa, I. Spatial knowledge impairment after GPS guided navigation: Eye-tracking study in a virtual town. Int. J. Hum.-Comput. Stud. 2018, 116, 15–24. [Google Scholar] [CrossRef]
- Christopoulou, E.; Xinogalos, S. Overview and Comparative Analysis of Game Engines for Desktop and Mobile Devices. Int. J. Serious Games 2017, 4, 21–36. [Google Scholar] [CrossRef]
- Wielebski, Ł.; Medyńska-Gulij, B. Graphically supported evaluation of mapping techniques used in presenting spatial accessibility. Cartogr. Geogr. Inf. Sci. 2019, 46, 311–333. [Google Scholar] [CrossRef]
Publisher’s Note: MDPI stays neutral with regard to jurisdictional claims in published maps and institutional affiliations. |
© 2022 by the authors. Licensee MDPI, Basel, Switzerland. This article is an open access article distributed under the terms and conditions of the Creative Commons Attribution (CC BY) license (https://creativecommons.org/licenses/by/4.0/).
Share and Cite
Medyńska-Gulij, B.; Gulij, J.; Cybulski, P.; Zagata, K.; Zawadzki, J.; Horbiński, T. Map Design and Usability of a Simplified Topographic 2D Map on the Smartphone in Landscape and Portrait Orientations. ISPRS Int. J. Geo-Inf. 2022, 11, 577. https://0-doi-org.brum.beds.ac.uk/10.3390/ijgi11110577
Medyńska-Gulij B, Gulij J, Cybulski P, Zagata K, Zawadzki J, Horbiński T. Map Design and Usability of a Simplified Topographic 2D Map on the Smartphone in Landscape and Portrait Orientations. ISPRS International Journal of Geo-Information. 2022; 11(11):577. https://0-doi-org.brum.beds.ac.uk/10.3390/ijgi11110577
Chicago/Turabian StyleMedyńska-Gulij, Beata, Jacek Gulij, Paweł Cybulski, Krzysztof Zagata, Jakub Zawadzki, and Tymoteusz Horbiński. 2022. "Map Design and Usability of a Simplified Topographic 2D Map on the Smartphone in Landscape and Portrait Orientations" ISPRS International Journal of Geo-Information 11, no. 11: 577. https://0-doi-org.brum.beds.ac.uk/10.3390/ijgi11110577