1. Introduction
Rapid global urbanization has promoted the development of three-dimensional urban spaces, both aboveground and underground. The number of megastructures such as skyscrapers, shopping malls, and superdeep underground buildings has increased significantly in recent years [
1,
2]. These buildings allow a very high density of people to live and work in an area. Additionally, an increasing number of built megastructures are facing over-aging problems and lack regular maintenance. These issues bring about challenges in terms of fire emergency prevention and control. On the one hand, the rapid onset of fire can produce dangers and threaten personal safety due to heat, smoke, and toxic gas [
3]. On the other hand, indoor spaces containing a high density of people cause uncertainties in fire scenarios. A reliable rescue and evacuation plan is, thus, of great importance for megastructures.
Recently, personal awareness of fire protection has gradually increased, while fire extinguishers have steadily improved. These improvements dramatically decrease serious fire accidents [
4]. However, building fire prevention should be a priority since fire might lead to significant disasters with inappropriate planning. Official standards or laws for fire protection are published by many government and international organizations, e.g., GBJ16 in China, NFPA 92 in the USA, BSI in the UK, and AS1530 in Australia. An effective warning system before a fire should be installed to minimize the damage during a fire process [
5]. A reasonable and scientific warning system should involve temporal and spatial simulations of building fires, influenced by the building structure, materials, local environment, and many other fire factors [
6,
7]. Moreover, the occurrence and development mechanism of a fire accident should also be taken into consideration. These factors can be revealed based on a fire scenario simulation [
7]. Furthermore, an accurate fire scenario simulation can also supply response strategies for building fire prevention and firefighting [
5,
8].
For building fire simulations and evaluations, previous studies have mainly focused on fire development theory, building structure and form, building materials, influential factors, process models, emergency responses, and standards [
2,
5,
9,
10,
11,
12,
13]. The numeric fire scenario simulation approach mainly contains three types, e.g., network-based, regional, and zonal [
14]. Yang et al. (2012) simulated fire development trends for different locations using temperature measurements in interior building corridors, elevators, and staircase exits [
1]. Bi et al. (2013) adopted the finite element analysis method to analyze the behavior of a reinforced-concrete-framed structure during a fire scene simulation, as well as the temperate distribution and deformation calculation of the structure [
15]. Jurickova (2014) pointed out that the geometry, ventilation, and construction method are critical when designing buildings, especially for coordination between civil and fire protection systems in large buildings [
16]. Setting an optimal safe distance between buildings is also important for fire protection [
17]. Previous studies have achieved good results in different scenarios, although three-dimensional information is still lacking. To solve this problem, building information modeling (BIM) was gradually introduced into simulation modeling [
18]. Song et al. (2019) proposed a combinatorial spatial data model (CSDM) to describe the complex geographic relationship with the indoor spatial environment during fires [
19]. Machine learning is also widely used to predict the spatial distributions of fire conditions [
20]. These studies simulated fire scenarios while considering different complicated factors efficiently and intelligently.
Regarding evacuations in fire events, this involves a reasoning and evaluation process of evacuation response behavior. This could be modeled based on risk prediction and comprehensive evaluations of evacuation conditions during building fire scenario development [
21,
22]. To decrease the casualties in fire disasters and improve evacuation efficiency, it is vitally important to explore and reveal the factors that impact evacuation [
23]. During fire evacuation, human behavior and capability can be significantly influenced by the environmental conditions [
24,
25], mainly due to temperature, smoke, reduced visibility, and toxic combustion gases [
3,
22,
26]. In addition, several factors influence residents’ emergency preparedness, such as fire risk perception, owner or renter status, and building-level emergency preparedness [
27]. Building fires pose significant threats to residents, first responders, and the structural system. It is thus beneficial to establish the critical parameters of the building, such as the number of stories, the width of the egress paths, the locations and number of exits, and the locations and number of firefighting device [
28,
29]. The time interval from the moment of detection of the fire to the moment of final completion of the evacuation to the safety zone must be sufficient. This time condition is generally recognized [
30,
31]. The capabilities of building fire evacuation modes are evaluated using five main core components, namely the pre-evacuation time, movement and navigation, exit usage, route availability, and flow constraints [
32]. In the modeling process, mobile fire evacuation systems and wireless data transmission systems can be dynamically monitored to control the facilities [
29,
33,
34], while indoor navigation technology can be used to obtain or supply spatial–temporal location and navigation information [
35]. At the same time, path searching can be gradually explored using a 3D GIS [
24], cellular automata (CA) [
36], artificial intelligence (AI) [
35,
37], graph theory [
38], or operations research (OR) [
31] approaches.
From the above review we can see that there is still a lack of a method for selecting the fire source locations for existing building evacuation plans [
39], while influencing factors should be considered for evacuation simulations as much as possible [
23]. At the same time, the data related to fire simulations and evacuations are increasing rapidly. Therefore, it is unfortunately difficult to use complicated calculations for personnel evacuation planning, as this requires too many resources [
40]. These factors will affect the efficiency of the fire prevention and protection planning process.
In this study, we aim to simplify fire simulation modeling and evacuation path planning. The objectives of this study are: (1) to analyze the spatial and temporal influential factors of building fires based on the realistic worst case; (2) to select fire scenario zones and parameter settings for the simulations; and (3) to design life safety guarantee routes based on a search algorithm.
2. Materials and Methods
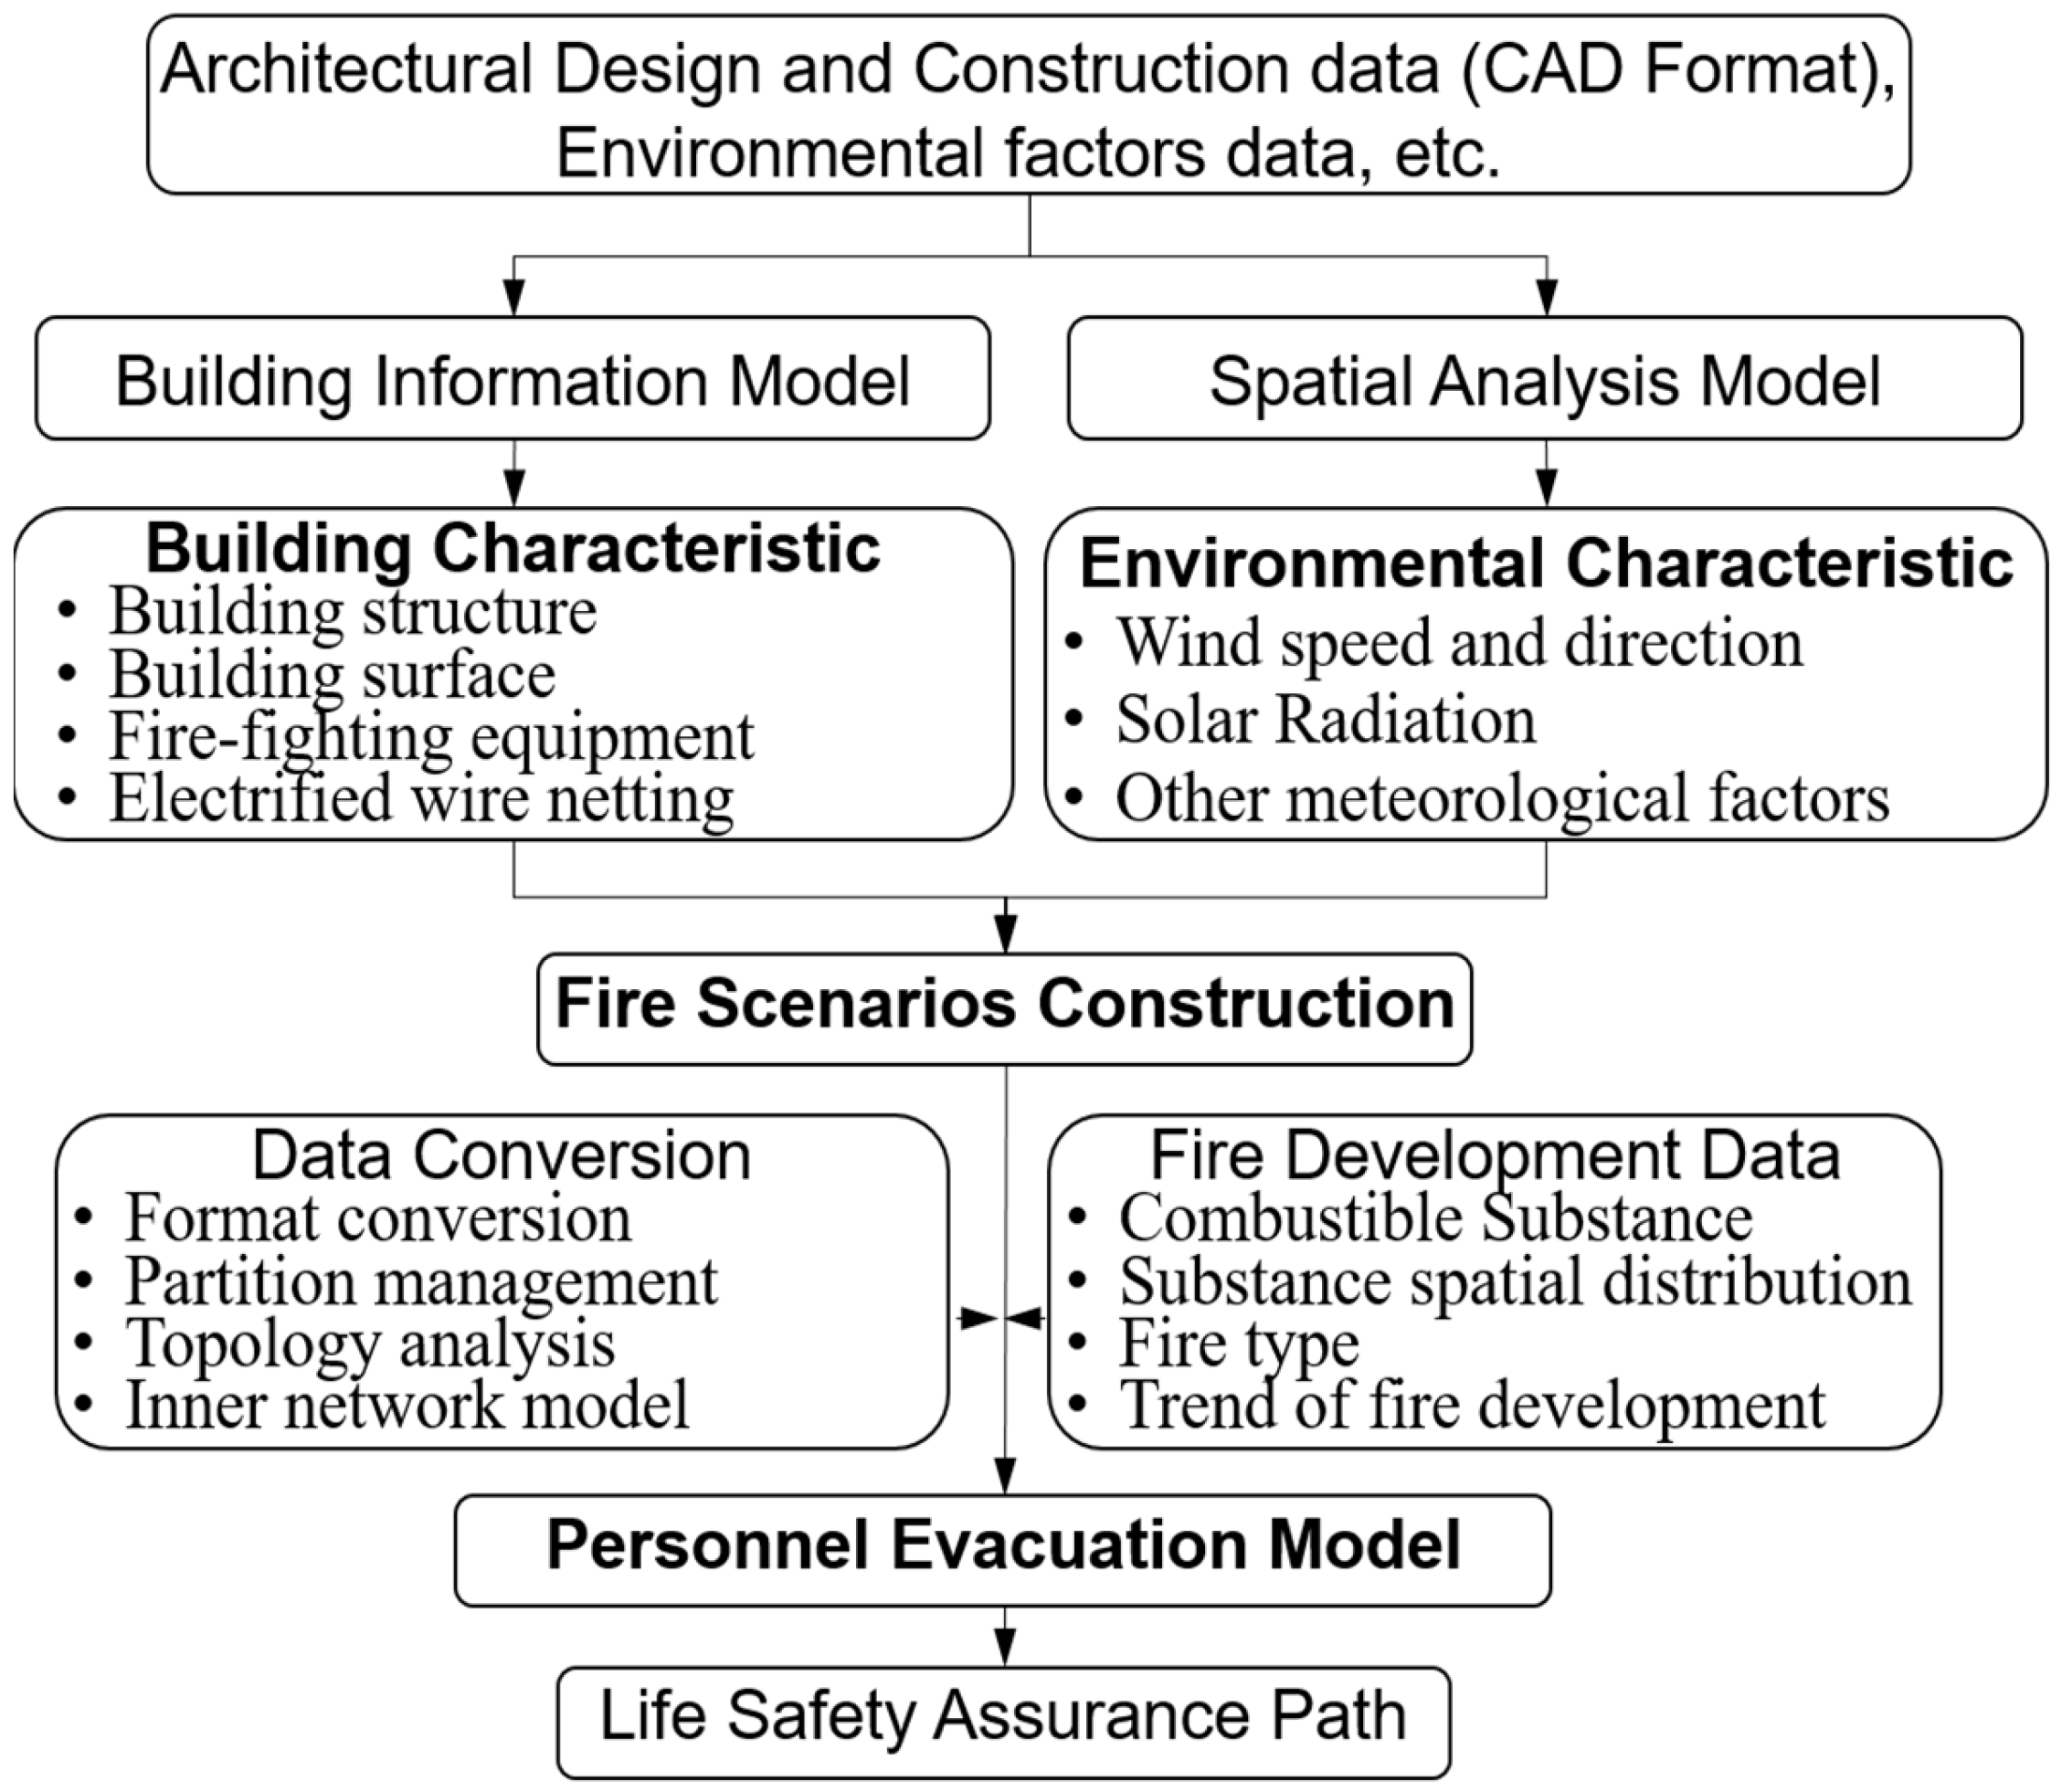
The basic idea of the proposed method in this study is to simulate the environmental factors during fire scenarios and thus obtain an evacuation plan. Taking advantage of GIS technology in spatial analysis, a BIM-based building model is applied to the GIS. Outer and internal environmental factors will be simulated by solar radiation and airflow simulation, respectively. After that, different simulation results in different seasons are then analyzed and used for evacuation planning. The fire scenario is then constructed based on the principle of the realistic worst case. A spatial route planning algorithm in GIS, the ant colony algorithm (ACO), is finally used for the evacuation route planning task according to the fire scenario. The overall workflow is illustrated in
Figure 1.
2.1. BIM Model Generation
The BIM model is firstly generated from original architectural design and construction files in a CAD format. In order to realize the conversion from the BIM model into GIS data, this study carried on secondary development based on Revit and Visual Studio 2014 platform. The conversion procedure mainly consists of several functions, such as structure transformation, spraying system transformation, pipeline transformation and so on. The transformation procedure mainly has two steps. Firstly, building constructs that require data transformation should be identified from the linked CAD drawing bits. Secondly, the identified building constructs further generate the corresponding 3D entities of Revit. The generated information can be transferred by the external .xml file. In the identification procedure, the function in the CAD secondary development kit was called to extract information from original .dwg files. This function can be encapsulated and invoked in Revit.
2.2. Fire Scenario Construction Based on the Pricipline of the Realistic Worst Case (RWC)
The scenario approach has been successfully used in environmental risk assessments of pesticides [
41], and here is introduced into this study for a comprehensive assessment of building fires. A scenario is a synthetic description of an event or series of actions and events, and this approach is widely used by organizations to understand different ways that future events might unfold or to test strategies against uncertain future developments [
41]. Scenarios are also only applied to local situations or to a limited number of ‘representative’ scenarios [
42]. In this study, the representative fire scenarios were selected based on serval fire factors.
In general, a fire will occur under specific realistic conditions affected by many factors comprehensively. In realistic conditions, a fire hazard is mainly affected by the basic features, the appendages, and the environmental characteristics of buildings. The level of fire hazard will thus be relatively low if the values of these factors are lower than the risk thresholds according to official standards or laws for fire protection. In order to predict the worst situation, the specific condition with factors closest to the risk thresholds can be seen as the realistic worst case. In several studies the percentile value of factors was used to evaluate the risk of different factors [
43,
44,
45]. In order to quantitatively reflect the spatial level features of fire factors the study carried on a flow chart of data processing that contains several processes, such as spatial interpolation and simulation, threshold segmentation, and spatial overlay analysis. For example, the spatial characteristics of buildings and environmental factors were overlaid and intersected; the processed result can be expressed in different levels on the spatial scale [
46]. Then, the zone of the realistic worst case can be selected according to the related standards. Additionally, this result can then be further used as a fire scenario for personnel evacuation. The environmental factors that make up the realistic worst case can be combined to evaluate fire risks from the spatial and temporal scales. With the calculation of percentiles based on the characteristics of environmental factors, the scenarios with a high fire incidence can be selected as priority zones for fire monitoring and prevention; that is to say, if the scenarios are within the safety standards, the level of fire risk is very low and the building can be regarded as being in a safely protected state. According to the principle of the realistic worst case, the characteristics of the most unfavorable factors possible were selected. Effective factors that are most likely to cause a fire in a real situation were first selected. The worst case does not represent the extreme worst conditions, but instead represents relatively bad effective factors that are likely in reality.
In general, fire scenarios contain a group of effective parameters and factors that need to be inputted into the model, such as the building structure, building surfaces, and micro-metrological factors of the interior and outdoor. The spatial–temporal behaviors of hazard factors were simulated and the damage that was caused by the fire was evaluated. The simulated result was much closer to reality based on the fire scenarios. Therefore, fire scenarios in the fire simulation model will not be overly conservative and the simulation results will not show excessive distortion.
Based on the fire protection standards and codes, such as the Technical Specification for Building Smoke Control and Exhaust Systems GB51251-2017 and the SFPE Handbook of Fire Protection Engineering, the parameter values of fire occurrence can be confirmed. If the fire hazard safety problem is within the prescribed safety standards, it can be considered that a fire will not occur or will not do much harm to the building or residents. On the basis of the realistic worst case, a fire is close to breaking out when the vulnerability and sensitivity of the effective factors accumulate under all possible situations on the whole. The accumulation can be described as a percentile according to the principles of spatial statistics. In this study, fire scenarios were built according to the characteristics of solar radiation, the speed and direction of the wind, the building surfaces, the distribution and types of combustible substances, the operational status of the smoke exhaust system, and the firepower and growth trends. Here, meteorological data were acquired from the National Meteorological Science Data Center (NMSDC,
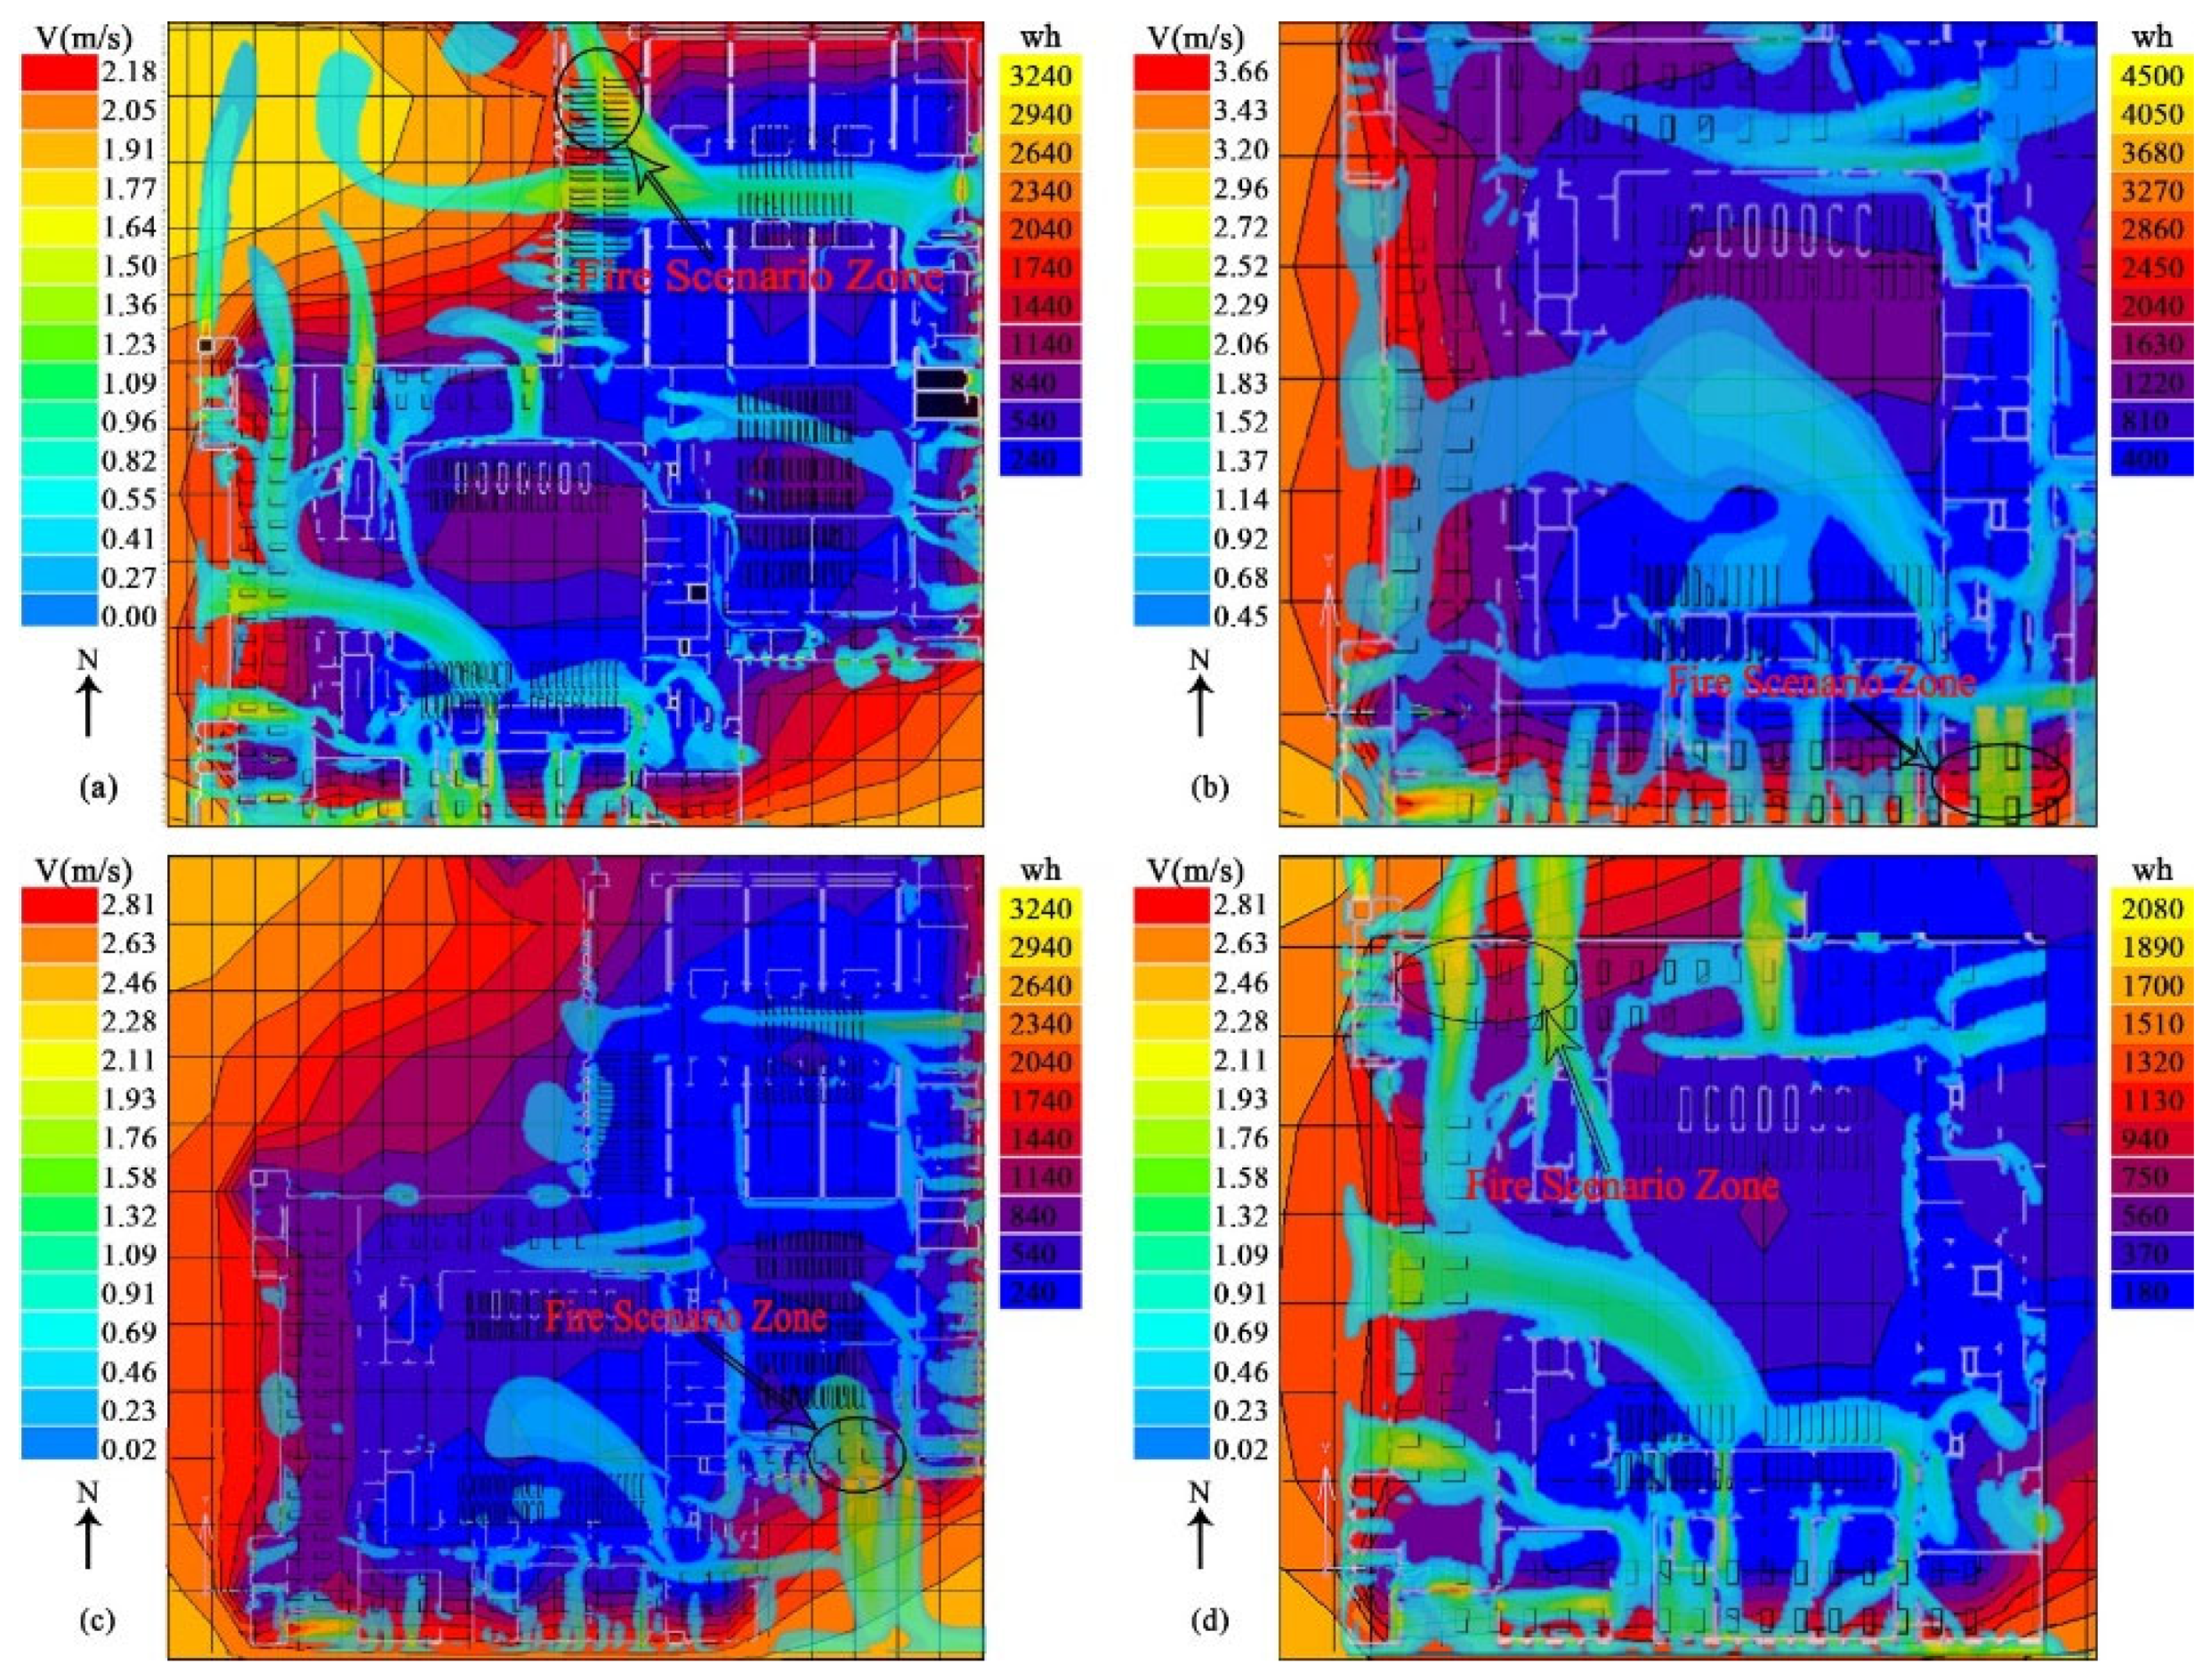
http://data.cma.cn, accessed on 1 December 2021), while building information and other relevant data were obtained from the relevant construction and management departments. By using a building information model (BIM) and geographical information system (GIS), the parameters of effective factors were spatially expressed and simulated across four seasons. When confirming the values of these parameters the percentile values were calculated with every parameter for building fire scenarios, such as the 90th percentile. All simulation results were overlaid and overlapping zones were extracted and classified with several further levels. This could be done by using the spatial overlaying function in ArcGIS software. Through this comprehensive analysis, fire scenarios were selected in different seasons and the parameters of fire scenarios were obtained as inputs for the fire simulation model, allowing consistent and reproducible calculations.
2.2.1. Influencing Factors of Fire Occurrence
Building fires are caused by multiple complicating factors, such as the building structure and surfaces, electric and other networks, indoor and outdoor environmental elements, and human behavior. On the whole, the formative factors of fire can be divided into four categories:
(1) Basic features of the building architecture and its appendages. This category includes the fire load, building material, firefighting equipment, fire compartment, electric equipment and network, smoke control, and exhaust facilities. The complexity of the building and essential facilities greatly affects the path and efficiency of the fire spread. The changes in temperature can be influenced by the thermal conductivity of the building structure. There can also be obvious differences in the degree of smoke obstruction based on the building structure. Fire prevention and control are greatly influenced by the fire prevention facilities and ventilation system. When a building goes into service, basic features of its architecture and appendages need to be checked, accepted, and monitored in the long term.
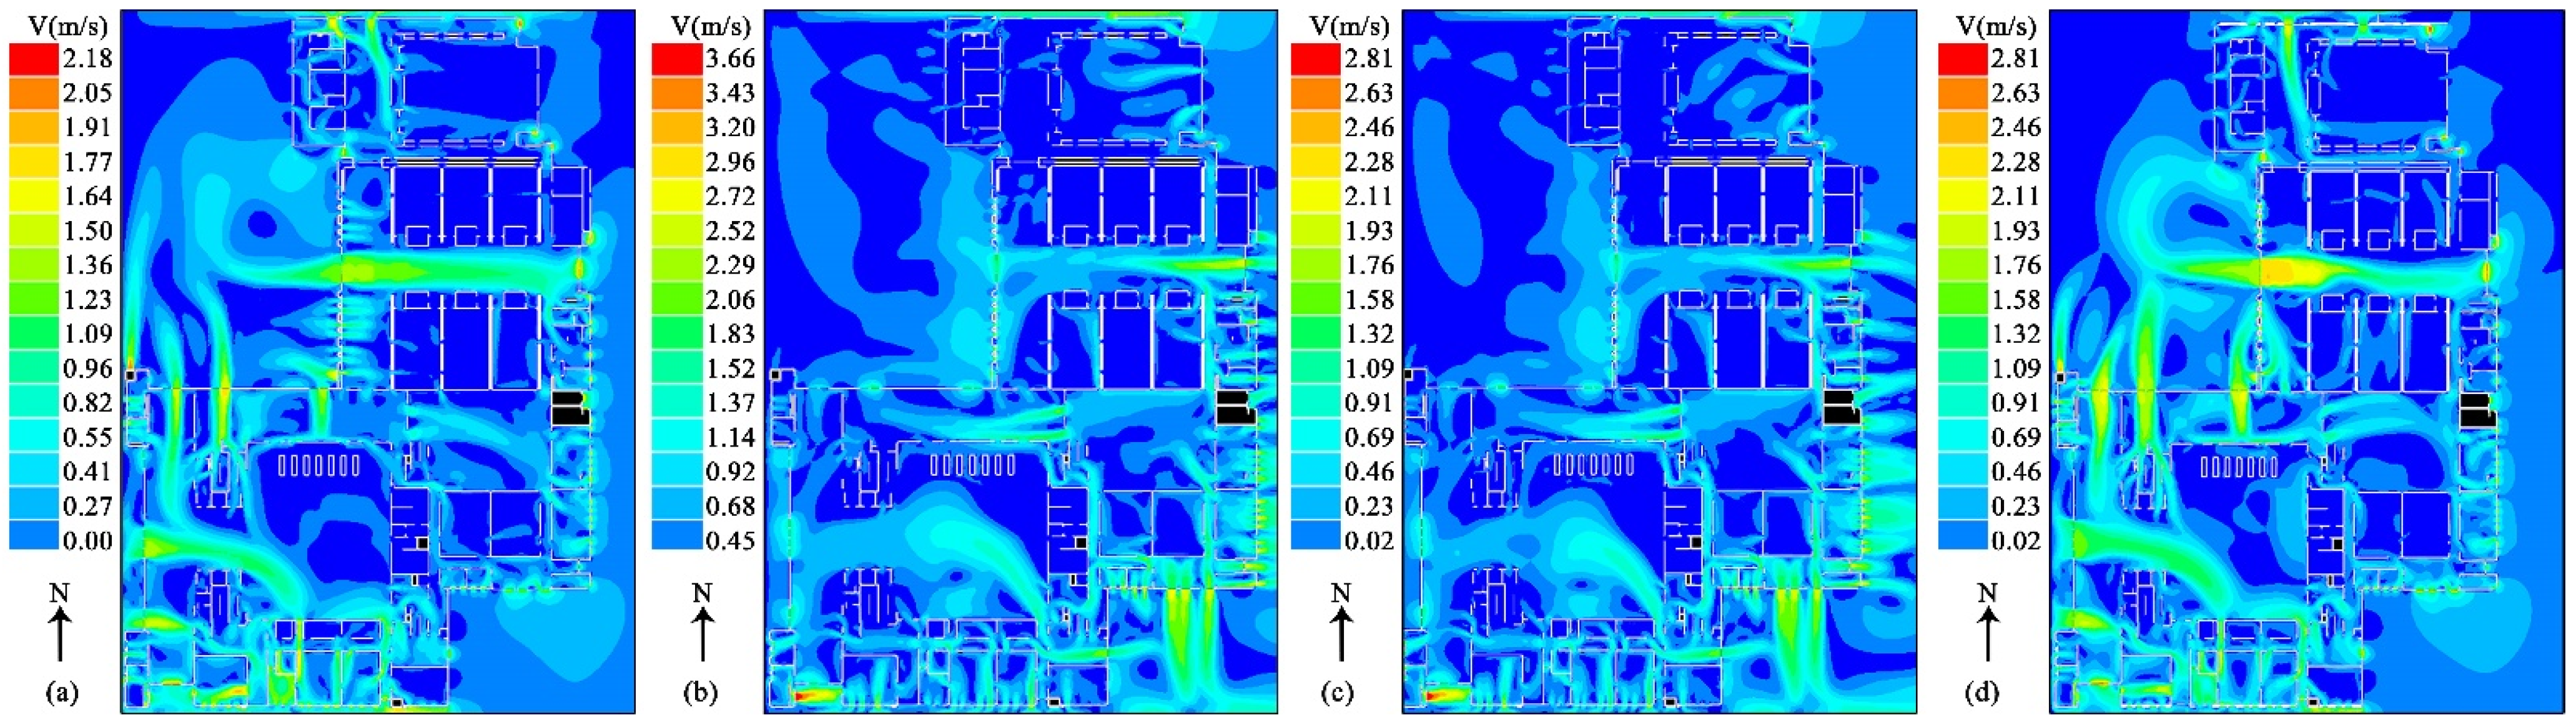
(2) Environmental factors. All of the environmental factors and local micrometeorological factors play important roles in building fires. Solar radiation can affect the temperature of the building’s surfaces, which increase when solar radiation is relatively high and then continue rising. Changes in airflow indoors and outdoors will also be affected by wind speed, causing variations in oxygen concentration in the fire zone. In most cases, the airflow can vary the direction and speed of the fire spread, especially in high winds and dry weather. Additionally, the meteorological factors show significant variations across the four seasons. In general, the frequency of fires is much higher in the spring and autumn.
(3) Fire characteristics. Being affected by combustible substances, fires can present different characteristics, such as in their spread speed, growth trends, destructive effects, and chain reactions. At the same time, fires can present different characteristics according to the growth stage. The effective factors will play different roles at different stages. With the development of fire behavior, the flames will also show different shapes, colors, heights, and temperatures for diverse building materials and structures.
(4) Human behavior. Personnel daily performance is an important factor in monitoring and preventing fire. Human behavior not only refers to the age distribution, fire protection consciousness, and response time, but also to daily management and treatment measures, which are inextricably linked to fire protection behavior. The normal and safe utilization of buildings and related equipment can effectively avoid the occurrence of fire.
According to the classification above, the structures, surfaces, and relevant networks are relatively fixed when a building is in normal use and serviced sufficiently. However, with long-term use these factors will affect the building fire risk with increasing age, although daily management and treatment can enhance the fire protection and prevention ability. Regarding the occurrence and development of fire, these aspects are closely related to the building characteristics and environmental factors. Therefore, ongoing changes in environmental factors will play an important role in fire risk at any time, which is the purpose of this study on fire scenarios.
2.2.2. Influencing Factors of Human Evacuation
It is known that the study of hazard factors of building fires can be effectively used to support the personnel evacuation planning process. The goal of an evacuation in a fire event is to evacuate all personnel safely out of the building before the fire hazard factor poses a risk to their lives. In this paper, we evaluated the safety of the fire environment according to the fire hazards and evacuation time. The evacuation time needs to consider the required safety egress time (RSET) and the available safety egress time (ASET) during a fire. In general, the evacuation criteria should state that the available safety egress time should be no less than the require safety egress time (ASET ≥ RSET). If the simulation result is fit to the criteria, the design and construction of the building should meet the fire safety requirements. Otherwise, the building should be optimized to meet the fire safety requirements. Regarding the process of personnel evacuation, relevant fire products and personnel behavior will influence the evacuation time. Several important factors are listed below, all of which will be input into the network model to analyze the personnel evacuation process.
(1) Temperature
After a fire breaks out in a building, the temperature will increase gradually as the fire field heats up. This will lead to serious injuries and risks to personal safety, such as skin and respiratory tract injuries. The National Fire Protection Association (NFPA) has analyzed a mass of data on accidents as well as experiments and has summarized the survival times of the human body under different temperatures (
Table 1). According to
Table 1, when the temperature of the fire field is no more than 60 °C, human health will not be greatly impacted. People can stay on-site for a short time and have the ability to escape. Human health will be threatened significantly with further temperature increases, even losing the ability to escape.
(2) Visibility
During the evacuation process, visibility represents the maximum distance at which a person can distinguish an object or direction in smoke. After a fire breaks out in a building, combustible substances burn violently. The large amount of smoke produced will spread gradually, and its concentration will increase. The visibility of emergency personnel will decrease significantly. Therefore, this reduced visibility will seriously affect the evacuation personnel’s judgment of the environment inside the building. It will be difficult for people to move towards the correct exit in time, as valuable escape time is likely wasted. It is believed that a visibility of no more than 13 m is needed to satisfy the requirements for personnel escape in the SFPE Handbook of Fire Protection Engineering. In other countries there will be different standards and understandings depending on the different spatial scales. Overall, visibility is an important influencing factor for evacuation in building fires.
(3) Toxic gas
Toxic gas is a major reason for casualties in many situations. The huge amount of smoke can cause personnel suffocation and even death. Additionally, toxic components can cause direct poisoning of the human body. In particular, when carbon monoxide enters the body it will prevent hemoglobin from binding, meaning people will become hypoxic, causing dizziness, nausea, limb weakness, and blurred vision. According to
Table 2, a concentration of carbon monoxide of 500 ppm is a critical value. When the concentration of carbon monoxide is greater than 500 ppm it is difficult to escape, and people show significant adverse reactions. Additionally, smoke particles and suspended particles produced by burning combustible substances produce toxicity and shading, which will have noticeable effects during personnel evacuation (
Table 3).
(4) Evacuation speed
The speed of personnel excavation plays a decisive role in the available safety egress time. The personnel walking speeds in different circumstances were delineated in the SFPE Handbook of Fire Protection Engineering. According to the handbook, walking speeds have been set for different spaces of a building. Personnel speed in clear and spacious zones is 1.1 m/s, while the speed is 0.7 m/s in passageways between seats and bookcases. At the same time, the speed is 0.4 m/s when navigating corners.
2.3. Fire Simulation and Evacuation Planning Based on the Ant Colony Algorithm (ACO)
(1) Fire growth model
The use of a fire growth model is a way of describing the development of a fire. The majority of fires, with the exception of an explosive ignition source, are characterized by a slow progress from the initial stage to a later stage of intense burning. Such fires can be described by the
t2 fire model, as follows:
where
Qf represents the rate of heat release from the ignition source,
a represents the fire increase modulus, and
t represents the ignition time. Based on the fire model, the development stage of the fire can be divided into the initial stage, growth stage, all-round development stage, and spread stage (
Table 4). According to the characteristics of the library and combustible substances studied here, the type of fire growth can be thought of as fast, while the fire increase modulus can be set to 0.0469 kw/s
2 in the fire model.
The scale of the fire depends on the heat release rate. The higher the rate of fire heat release, the greater the danger from the fire. In general, buildings with different characteristics have different heat release rates from the fire source. Therefore, it is important to select a feasible fire heat release rate in the simulation that accounts for most real fire situations, which will mean the simulation results have value. The heat release rates for all kinds of building were delineated in the Technical Specification for Building Smoke Control and Exhaust System GB51251-2017 (
Table 5). In this study, the library is an atrium structure without sprinklers. Combined with the realistic worst case, the maximum heat release rate is set as 4 MW in the fire simulation model in this paper.
(2) Resident evacuation model
The time of the shortest path (TSP) and distance of the shortest path (DSP) are common path-searching strategies. The TSP focuses on minimizing the time of personnel evacuation, while the DSP focuses on personnel evacuation over the lowest path length [
47]. Both of these ignore the influence of path conditions on personnel evacuation and cannot satisfy the personnel evacuation requirements in burning buildings. Therefore, the life safety assurance path (LSAP) approach was put forward in this study based on the network model. According to the need for personnel evacuation, the LSAP takes full account of the effects of temperature, smoke, and carbon monoxide, and also effectively avoids fire combustion products. Additionally, it searches the path, striking a balance between the TSP and DSP in order to ensure life safety. In the network model, attribute information for the inner path and fire scenario are input into a spatial database. Attribute information for the inner path can be divided into the path node, path width, and path length. The fire scenario information mainly contains data relating to the wind direction, wind speed, environmental temperature, firepower, fire increase modulus, and sprinkler as well as exhaust facilities. In addition, the path node information includes barriers, turns, intersections, and junctions. Based on the spatial, graphical, and attribute information for the inner path, the network modeling was carried out with topology processing; we then further implemented a network analysis with a path search algorithm.
The indoor network model is different from the outdoor network model, as it is a three-dimensional network model [
48,
49]. The path in the model has both horizontal and vertical extensions. The network database for the library was adopted using the concept of partition management and divided into different parts according to the number of floors; that is to say, every floor itself contained a separate network model, which can be connected to show safe passageways. Therefore, a large network model was built for the library based on the different parts.
An ant colony search algorithm was then used to analyze the personnel evacuation path, which could be done using the Network Analyst tool in ArcGIS software. The ACO is a simulation algorithm for searching the path of an ant colony when searching for food [
50]. Based on rules such as pheromone concentration, it determines the random advance route of an ant colony searching for food from the starting point to the target point. Given the starting point of the path search is
i, the target point is
j, and the operation expression of the random advance probability can be presented as follows [
50]:
In Equation (2), an individual searching for an exit is denoted by
l, and the time consumed is expressed in terms of
t. Expectation and pheromone heuristic factors were expressed as
and
separately. At a given time,
t, the probability of a person walking from
i to
j is denoted by
, and the pheromone concentration can be expressed as
. A set of path nodes that an individual,
l, can move toward can be expressed as
, and
.
represents the node set that has passed by. The heuristic information function corresponding to the section is represented by
. In addition, it is necessary to update pheromones on all paths involved in
m target nodes after everyone has gone through a path search cycle. The pheromone transformation is expressed as follows:
In Equation (3), as the time changes, pheromone volatility can be expressed as , and . The number of individuals is denoted as n, and the amount of information released by an individual, l, to path ij in the loop is denoted by .
From Equations (2) and (3) we can see that the ACO is a probabilistic algorithm to find optimal paths. It contains a group of non-intelligent or slightly intelligent agents that show intelligent behaviors by cooperating with each other, thereby providing the possibility of solving complex problems. In this work, the path situations change from moment to moment according to the fire development trend. Therefore, the evacuation path is a topological arithmetic path that is dynamically based on time intervals in the model and supply service.
2.4. Study Area and Data
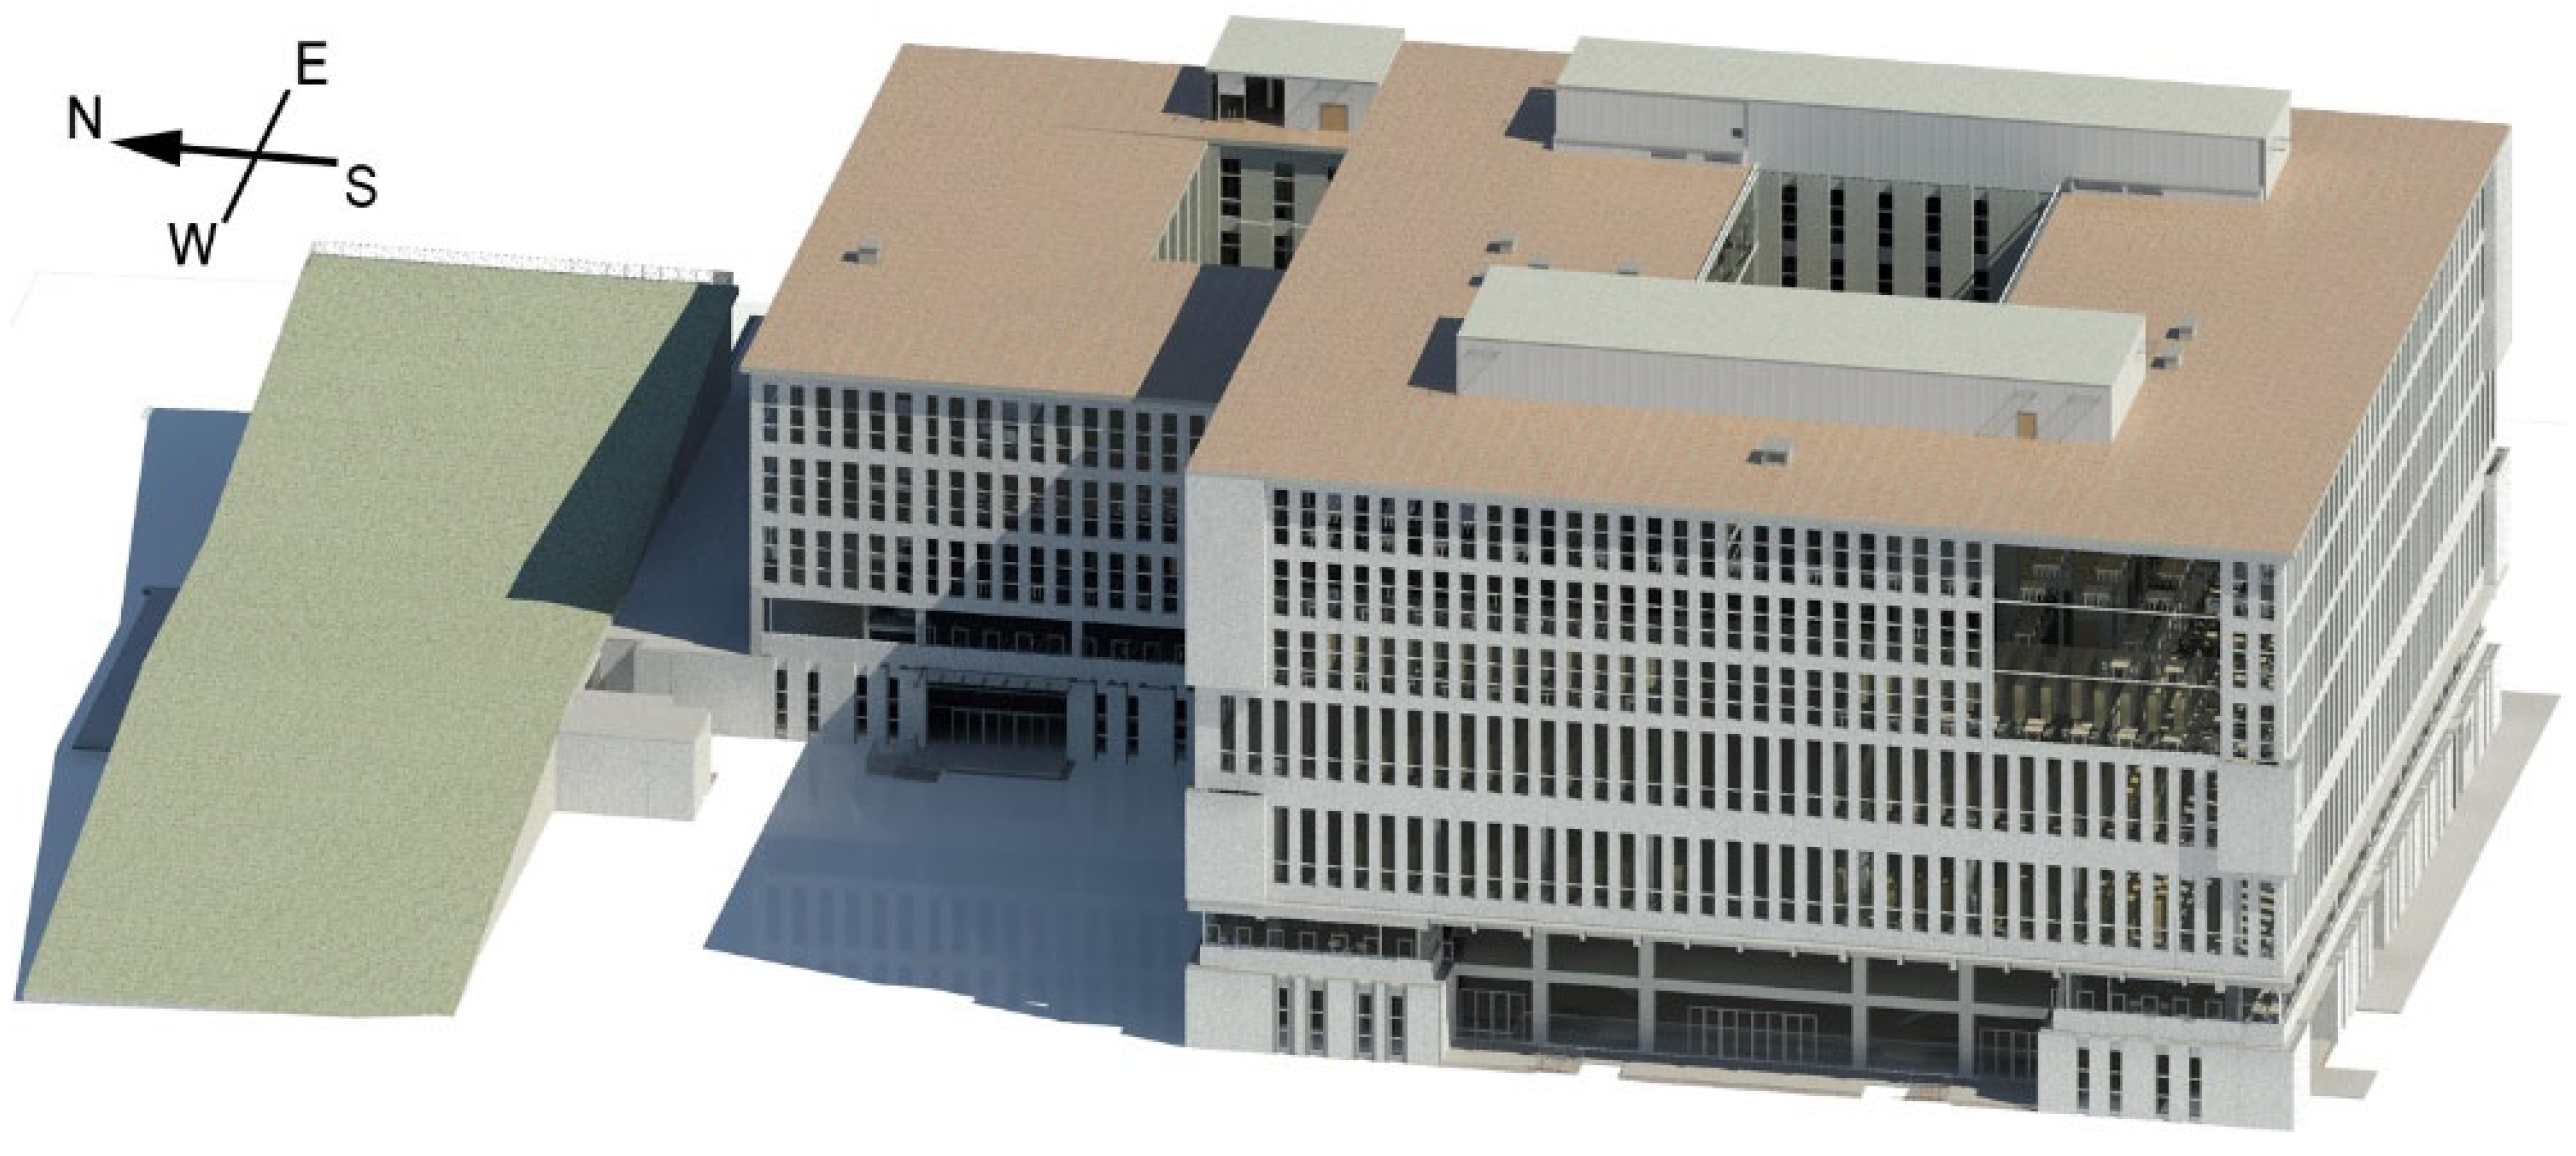
In this study, the library of the Nanjing Forestry University was selected as the research object. Compared to other buildings, the inner structure of the library is relative complex, the population density is much higher, and the types of combustible substances are very dense. The library adopted a transverse frame structure, which contains the main building and annex building, and its service life is 50 years (
Figure 2). The total construction area and base area equal 47230.8 m
2 and 7651.4 m
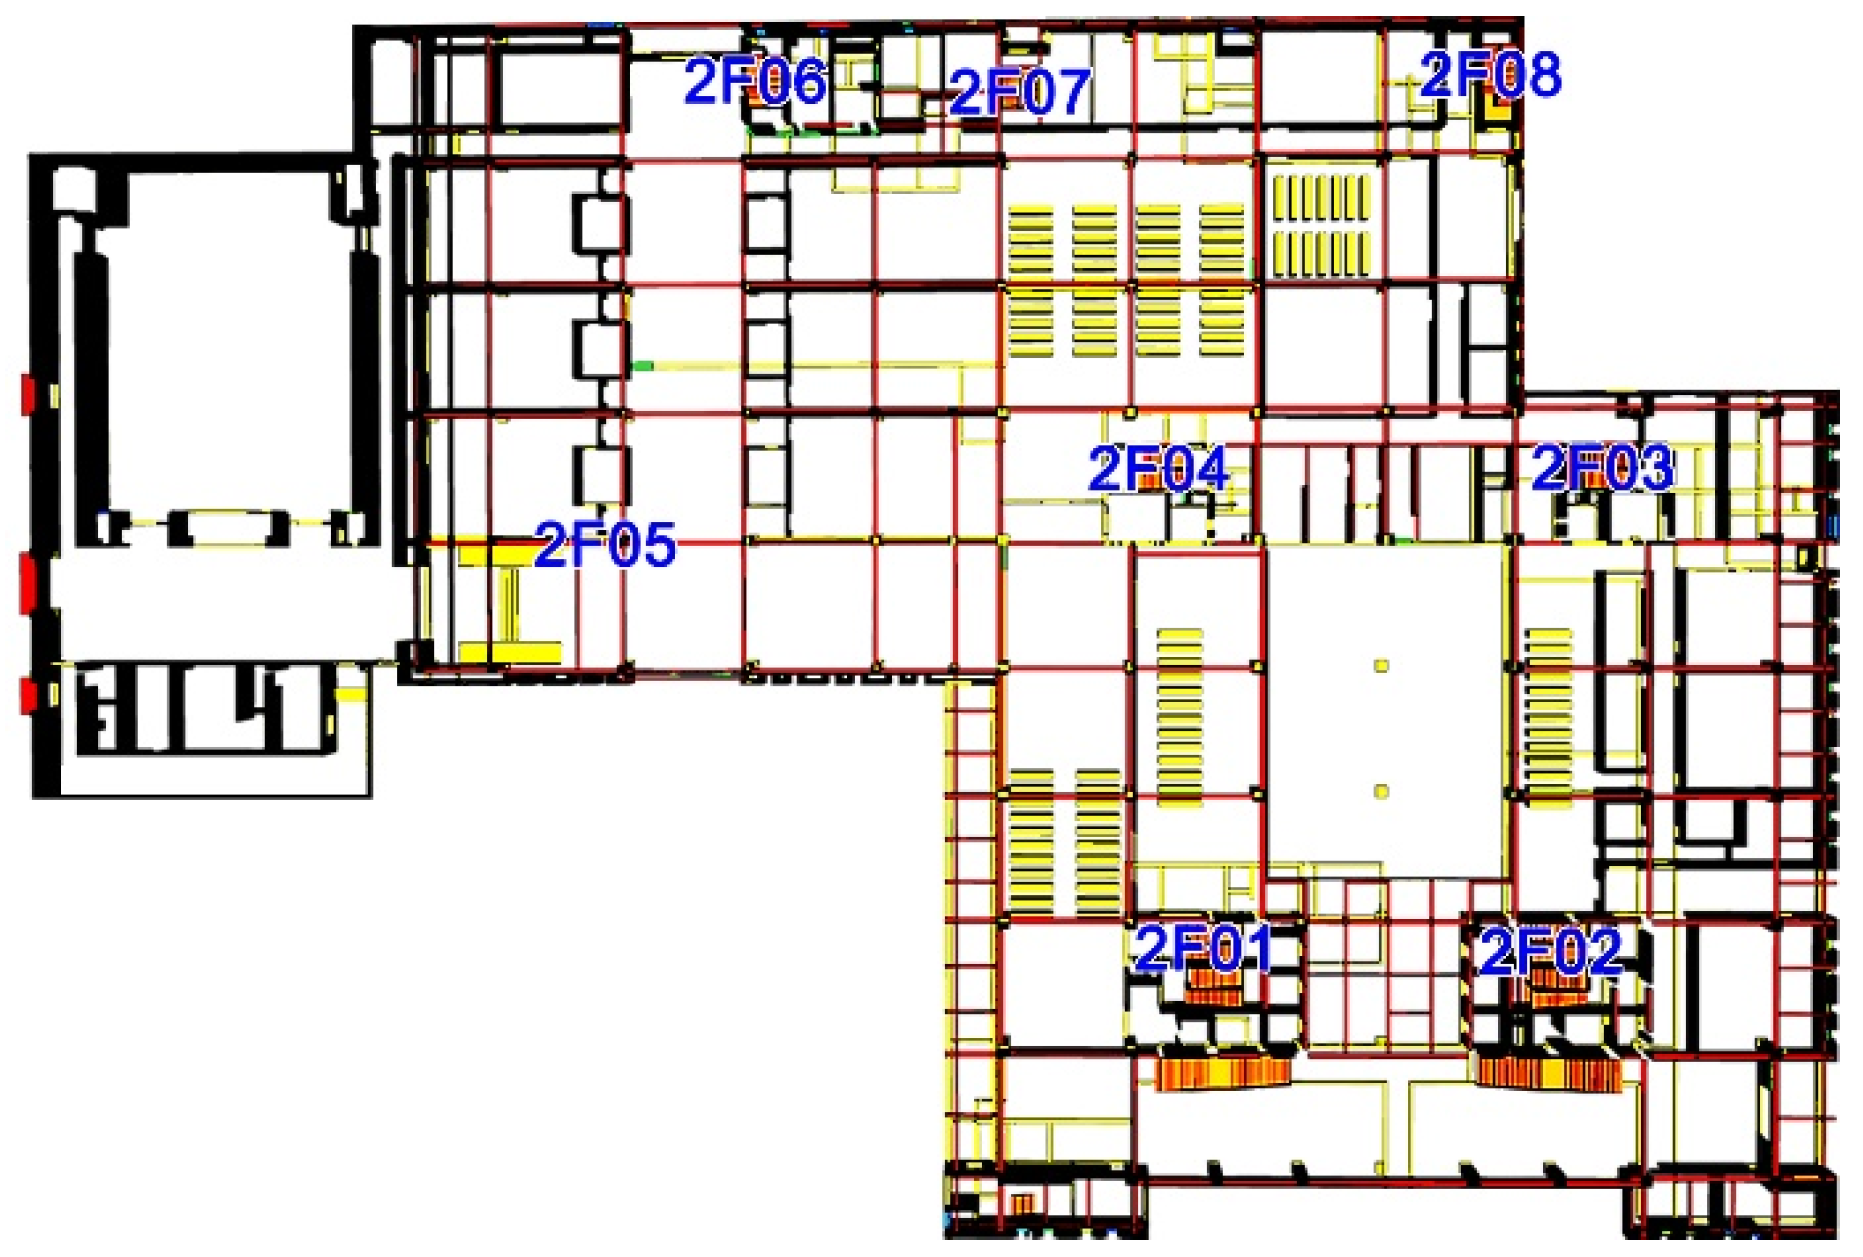
2, respectively. The building height is 34.9 m, which includes seven floors aboveground and one floor underground. The fire resistance rating is first-class. The earthquake fortification rating is seven degrees. The waterproof grade is first-class. For the inside of the building, the middle of the first and second floors contains an atrium structure, with a rectangle structure from the third floor to the seventh floor. There is a large number of reading rooms and lecture theatres, in addition to a large quantity of books, bookshelves, tables, and chairs in the corridors. Additionally, there are multiple staircases between the floors, distributed in the middle of the four corners of each floor. Therefore, the research object is a typical public agglomeration and key fire monitoring area, for which it is necessary to carry out a fire simulation.
4. Discussion
Based on the analysis of the fire scenarios and available evacuation times, the center of the high fire risk zone was selected as the starting point for personnel evacuation in the study. The available evacuation times for key passageways and risk zones were set as point obstacles and surface obstacles. By using the ant colony search algorithm and a spatial overlay analysis on the basis of fire scenario simulation results, people in the high-risk zone can obtain a life safety assurance path with high visibility, low carbon monoxide, good road conditions, and a long available evacuation time (
Figure 8).
The LSAP distance is 61.7 m, while the available evacuation time is 86.2 s in spring (
Table 9). The path starts from the starting point in the middle aisle on the north side of the third floor and turns east and right along the middle aisle among bookcases to the middle aisle on the east side of the annex building (
Figure 7), where people can be evacuated from the seventh-floor stairs. According to the results of the fire simulation at 200 s after a fire broke out, the influence of the fire products only exceeded the standards in the starting section of the LSAP. As the DSP was closed during the fire scenario, the fire products exceeded critical values on most sections of the path, which also occurred in the middle aisle of the TSP. After 400 s, the range of the influence of fire products tended to be stable. The TSP still exceeded the safety risk thresholds. On the contrary, for the LSAP, the seventh-floor stairway was not restricted by fire products. Therefore, it can be seen that the LSAP conditions were fit for personnel evacuation, although the available evacuation time was relatively long.
Here, the distance of the life safety assurance path was 94.0 m, and its available evacuation time was 125.3 s in summer (
Table 10). The LSAP overlapped with the TSP over the original section (
Figure 7). However, with the development of the fire risk, the LSAP to the other floors was much lower than with the TSP. Therefore, we selected the first floor stairway as the exit. About 150 s after the fire started, the section of the LSAP influenced by the fire products was much smaller than the DSP. The section of the life safety route affected by fire was much shorter than for the DSP. After 300 s, the influence of the fire products became stable in the building. The second stairway in the TSP was seriously affected by fire products. The visibility, temperature, and carbon monoxide all exceeded the critical values. In contrast, the fire products in the first stairway in the LSAP did not reach the critical value. These conditions were also suitable for personnel evacuation, although no advantages were seen at all in terms of time or distance.
Here, the distance of the life safety assurance path was 53.6 m, and its available evacuation time was 56.2 s in autumn (
Table 11). For the evacuation path and direction, these were far away from the fire scenario (
Figure 7). For this path we selected the lateral corridor on the second floor, meaning that people must go through the exit to the exterior on the left side in the annex building. Compared to the DSP and TSP, the LSAP has fewer nodes, meaning that people can avoid twists and turns during the evacuation process. About 100 s after the fire started, the visibility, temperature, and carbon monoxide exceeded the critical values in most sections of the DSP and partial sections of the TSP. After 200 s, the section length of the TSP affected by fire products gradually increased, meaning it was not fit for personnel evacuation. For the LSAP, the extent of fire products affected by southeast airflow spread to the north. Although the visibility in parts of the original section was lower than 10 m, the LSAP was still satisfactory for evacuation.
The distance of the life safety assurance path was 93.2 m, and its available evacuation time was 120.7 s in winter (
Table 12). The LSAP started at the starting point, followed the middle aisle of bookcases to the east corridor, and reached the third stairway on the sixth floor (
Figure 7). According to the simulation results, the LSAP overlapped with the TPS in the path bend. The fourth stairway was obviously influenced by fire products, meaning that the third stairway was selected as the exit. Although the number of turns and the distance gave no advantages, the LSAP conditions were good. About 150 s after the fire started, most sections of the DSP were affected by fire products. The visibility, temperature, and carbon monoxide exceeded the critical values that a person can bear. The conditions for the LSAP and TSP were suitable for evacuation. After 300 s, the fire products seriously affected the fourth stairway, such that it could not be selected as an exit. Therefore, the LSAP was a relatively better path for personnel evacuation.
In sum, the path selection process should minimize time and distance in consideration of personal safety. Additionally, with the development of spatial information, the Internet of Things, artificial intelligence, and other technologies, fire product and path evacuation simulations will be able to account for indoor positioning and navigation in real time, supplying adaptation measures for fire emergencies and firefighting in very large and tall buildings. The accurate construction of fire scenarios can also further improve the speed of fire emergency responses.
5. Conclusions
According to the principle of the realistic worst case, this study put forward methods and ideas for fire scenario construction as well as a description of the life safety assurance path via the integration of a BIM and GIS. Using a spatial–temporal analysis and an overlay analysis, the effective factors of building fires selected were assessed under fire scenarios. The characteristic parameters of fire scenarios were acquired for the fire simulation model. Based on the developmental trend of fire behavior, an ant colony search algorithm was furtherly used for personnel evacuation planning. The following conclusions can be drawn from the study.
Firstly, along with the fire increase trend, fire heat release rate, and working status of the fire protection and prevention system, the characteristic parameters of the fire scenarios were acquired according to spatial–temporal simulation of environmental factors. These parameters reflect the realistic worst case of fire in the building and can be entered into the fire and personnel evacuation simulation model for the protection and prevention of fire in daily life. A network model was then built based on the path attribute and fire scenario information. The building contained many exit passageways on different floors, and a joint topological analysis was performed for the network model of the whole building. The ant colony search algorithm was then used to assess the life safety assurance path based on the different fire scenarios and the development trends across the four seasons. The availability of the LSAP was compared with the TSP and DSP in terms of the safety, available evacuation time, and path distance. It was found that the LSAP reduced the path distance and consumed time as much as possible, ensuring personnel safe evacuation.
Although this study is a preliminary exploration on the integration of a BIM and GIS into fire scenario construction and evacuation planning, limitations still remain. Firstly, the current work could only be performed on the basis of different software tools as well as multi-source/format data; an integrated framework in an ‘all-tools-in-one-package’ needs to be further developed. Secondly, evacuation planning results are still on the basis of a 2D plane; the rich 3D information from the original BIM model is not well-used to achieve a real 3D analysis. Future work will mainly focus on introducing 3D information into fire scenario analysis, and corresponding methods are in need of exploration.


