Article

Semantic Integration of Raster Data for Earth Observation on Territorial Units †

by
Ba-Huy Tran
,
Nathalie Aussenac-Gilles
*,‡,
Catherine Comparot
and
Cassia Trojahn
Institut de Recherche en Informatique de Toulouse (IRIT), Université de Toulouse, CNRS, Toulouse INP, UT3, UT1, UT2, F-31062 Toulouse, France
*
Author to whom correspondence should be addressed.
This paper extends the paper presented at GEOLD@ESWC 2021.
These authors contributed equally to this work.
ISPRS Int. J. Geo-Inf. 2022, 11(2), 149; https://0-doi-org.brum.beds.ac.uk/10.3390/ijgi11020149
Submission received: 24 December 2021 / Revised: 10 February 2022 / Accepted: 11 February 2022 / Published: 19 February 2022
(This article belongs to the Special Issue Semantic Spatial Web)

Abstract

:
Semantic technologies have proven their relevance in facilitating the interpretation of Earth Observation (EO) data through formats such as RDF and reusable models, especially for the representation of space and time. While rasters are the usual data format for the results of image processing algorithms, a recurrent problem is transferring the pixel values of these rasters into features that make sense of the areas of interest on the Earth, thus facilitating the interpretation of their content. This paper addresses this issue through a semantic data integration process based on spatial and temporal properties. We propose (i) a modular and generic semantic model for the homogeneous representation of data qualifying a geographical area of interest thanks to territorial units (land parcels, administrative units, forest areas, etc.) that we define as divisions of a larger territory according to a criteria in relation with human activities; and (ii) a semantic extraction, transformation and load (ETL) process that builds on the model and the data extracted from rasters and that maps aggregated data to the corresponding unit areas. We evaluate our approach in terms of the (i) adaptability of the proposed model and pipeline to accommodate different use cases (vineyard and urban expansion monitoring), (ii) added value of the generated datasets to assist in decision making, and (iii) scalability of the approach.

1. Introduction

Earth Observation (EO) is a field that has evolved significantly in recent years thanks to large-scale Earth monitoring programs, such as the US Landsat Program (https://www.usgs.gov/land-resources/nli/landsat, accessed date: 23 December 2021) and the EU Copernicus Program (http://www.copernicus.eu/en, accessed date: 23 December 2021). In particular, with the Copernicus program launched by the European Space Agency (ESA), EO satellites collect data that will be combined with observation data from sensor networks on the Earth’s surface. Nowadays, two types of satellites are in production, Sentinel-1 and Sentinel-2, with several other types being expected by 2030. Since 2015, these satellites have provided high-quality Earth images (estimated at 8-10TB of data per day), providing users with free, reliable, and up-to-date Earth image data and metadata. The availability of these data sources has paved the way for better support of existing domain-specific applications and for the emergence of new ones, from agriculture to forestry, environmental monitoring to urban planning, climate studies, and disaster monitoring. These data sources, coupled with the development of machine learning algorithms, have stimulated image processing and its application in various fields.
One common data format in satellite image processing is the raster. A raster models geographical phenomena as a regular surface in which each cell (or pixel) is associated with an indicator (e.g., NDVI or change indicator) or a phenomenon value according to a predefined coding or classification (e.g., a land cover classification or a level of change coding). Several rasters can be provided for the same geographical area to monitor either the same phenomenon at different dates or different phenomena; they can be compared or combined to generate a new one [1]. However, from a decision-making perspective, the interpretation of their content requires additional higher-level data or knowledge representations associated with features that bring meaning to some areas of interest on Earth.
This paper deals with the integration of data computed from rasters as a way of qualifying areas of interest based on their spatial and temporal properties. For this purpose, we use the notion of territorial unit, which we define as a part of a larger territory, where the territory is divided according to a criterion linked to human activities (administration, law, economy, agriculture, etc.) and normalized in legally defined and accepted nomenclatures. Then, we assume that the areas of interest correspond to some territorial units selected for their relevance (in granularity or meaning) for the task in hand. Thus, areas of interest can be either administrative units (i.e., departments, counties) as defined in the NUTS (https://ec.europa.eu/eurostat/web/nuts/, accessed date: 23 December 2021) nomenclature, economical units (i.e., agricultural parcels), or cultural units (i.e., parish, language areas). Areas of interest are typically represented as geospatial features in a vector format. We are interested in studying (i) what kind of ontology is required to support knowledge extraction from EO data and to describe homogeneously different analysis results (observed properties or indicators) provided by the rasters; (ii) how to make rich EO data captured thanks to image processing and other kinds of related EO accessible and usable; and (iii) how to enable the data traceability (data sources, raster calculation, semantic process) to improve user confidence and data exploitation.
The main contributions of this paper can be summarized as follows:
  • A generic semantic model that allows the semantic and homogeneous description of spatio-temporal data to qualify predefined areas and to keep track of their provenance. This model is extendable to handle any kind of observed EO property and has been applied to several use cases.
  • A configurable and reproducible semantic Extract, Transform and Load (ETL) process (the process is encapsulated as a docker image, accessible on https://hub.docker.com/r/h2020candela/triplification, accessed date: 23 December 2021), based on the proposed model. We have defined a set of transformation functions to populate the semantic model with data and obtain a homogeneous semantic data representation. One of the features of this process is to extract and aggregate data from rasters together with data from other sources. Aggregation takes place on territorial units’ areas.
  • An EO Sentinel eco-system that allows exploiting Sentinel images, since we can represent and calculate different properties from Sentinel images (e.g., NDVI, change) or to import raster datasets from external sources (e.g., land cover data).
We evaluate our approach in terms of the adaptability of the proposed model to address different use cases (vineyard and urban expansion monitoring), the adaptability of the pipeline, and the added value of the generated datasets to assist in decision making. We also discuss the scalability of the approach and the relationship between the image resolution and the size of the reference territorial units. This paper extends [2] in two directions: (i) we detail the proposed semantic models and (ii) we extend the discussion on the use cases in which our models and pipeline have been applied.
This work was developed in the scope of the CANDELA (http://www.candela-h2020.eu/, accessed date: 23 December 2021) European project, which aims at creating a platform that provides building blocks and services that allow users to quickly use, manipulate, explore, and process Copernicus data as well as large open datasets. We contribute with this project by proposing a semantic-oriented data integration, as presented in this paper, and a semantic search module upon the integrated data.
The remainder of this paper is organized as follows. Section 2 discusses key related work. Section 3 presents our semantic model for integrating geographical areas and data extracted from rasters through their spatial and temporal dimensions. Section 4 details the semantic data integration process. Section 5 describes the experimental evaluation of our approach. Finally, Section 6 ends the paper and provides perspectives for future work.

2. Related Work

Our proposal concerns two main fields: semantic extraction, transform, and load (ETL) processes for data integration; and raster data processing, as discussed in the following.

2.1. Semantic ETL for EO Data Integration

The transformation and integration of (open) EO data can be addressed as a semantic ETL process, where the ETL process is guided by a semantic model. This model must homogeneously represent the data sources. In [3], the authors model EO imagery as a data cube with a specific place and time, thanks to the W3C RDF Data Cube (QB) ontology [4]. The RDF Data Cube combines standard vocabularies such as the Sensor Network vocabulary (SSN) (https://www.w3.org/TR/vocab-ssn/, accessed date: 23 December 2021), OWL-Time (for temporal concepts) [5], the Simple Knowledge Organisation System (SKOS) (https://www.w3.org/TR/skos-reference/, accessed date: 23 December 2021) to manage concept labels, and PROV-O (https://www.w3.org/TR/prov-o/, accessed date: 23 December 2021) (an ontology to represent the provenance of the data generated by the integration process). In [6], QB was used to publish tabular time series data and to structure it into slices that support multiple views on the data. Another spatio-temporal data cube is the semantic EO data cube proposed by [7]: it contains EO data where each observation is linked to at least one nominal (i.e., categorical) interpretation. Following a semantic ETL approach along with ontology-based data access (OBDA), the work from [8] proposes to extend Data Cube, GeoSPARQL (an OWL ontology and RDF query language for geospatial data) [9]), and OWL-Timein order to offer access to Copernicus services information. Here, SOSA (a lightweight but self-contained core ontology of SSN [10]) is adopted to represent observation collections, but alignments exist between SOSA and QB vocabularies to describe them as multi-dimensional data according to a ‘data cube’ model.
Closer to us, the work from [11] defined an ETL process to integrate EO image and external data sources, such as Corine Land cover, Urban Atlas, and Geonames. The process is carried out based on their SAR ontology. Another close work in terms of datasets is from [12], where data are integrated and published as Linked Open Data (LOD) based on an ontology, which was called proDataMarket. Three data sources, the Spanish land parcel identification system, Sentinel-2 satellite, and LiDAR flights, are integrated. In [13], satellite images are classified and enriched with additional semantic data to enable queries about what can be found at a particular location. In our approach, an exploitation of our integrated data facilitates image search.
Finally, while we do not fully address the scalability of our approach, several works are dealing with the management of large volumes of EO data. In [14], a framework helps to integrate and process large-scale heterogeneous big data generated from multiple sources for decision support to prevent natural disasters. The semantic integration of EO and non-EO data is based on the MEMOn modular ontology that reuses the BFO (Basic Formal Ontology (https://basic-formal-ontology.org/, accessed date: 23 December 2021)), SSN, and ENVO (Environmental Ontology (https://sites.google.com/site/environmentontology, accessed date: 23 December 2021)) ontologies.
While many approaches aim at producing open linked datasets, others focus on the methodological aspects of interconnecting heterogeneous data. For instance, to manage heterogeneous sensor data products, ref. [15] uses several related ontologies that form the INSAT-3D satellite description vocabulary. In [16], environmental services make extensive use of iOT data and data from government, national and European agencies. Our study here is close to these approaches in the sense that we guide the integration process on top of an ontology reusing existing standards.

2.2. Processing of Raster Data in a Semantic Framework

Raster data can be represented in two ways: either by treating the entire raster grid as coverage or by providing procedures to extract vector objects from the raster matrix. The first approach relies on constructing a semantic representation of the raster pixels so that each pixel attributes (geometry, values) are maintained. In [17], the RDF Grid coverage ontology is designed to allow a native integration of coverage in RDF triplestores. The gridded structure of the data is preserved and can be queried using SPARQL. Recently, the Ontop-spatial extension [18] has been developed to process raster data and create virtual geospatial RDF views above it.
The second approach consists of extracting entities from rasters and representing them as ontological features. These entities are sets of raster elements (i.e., sets of pixels) that meet a certain context-dependent definition. In [19], the approach integrates and processes scientific vector and raster data from LOD repositories using vectorization and mathematical tools for geo-processing. First, bounding boxes for input raster are used to query LOD endpoints for entities corresponding to a certain concept. The returned entities along with their geometry are next used to select raster pixels for supervised training based on content-based descriptors. Finally, the results can be vectorized and inserted back into the original repository. In [11], the approach proposes restructuring the images in patches that have a fixed size, on which external information is associated. Each patch is directly transformed into a feature based on the ontology. The work from [20] extends current standards to represent raster geo-data. A region of interest (ROI) is first polygonized, and then, the data are transformed into a semantic representation using R2RML mapping rules. This workaround is arguably not a complete solution to represent raster files in RDF, as the original geometric source of the data is not preserved [21]. Here, the areas of interest are predefined; hence, the geometries (polygons) are known.
Another close work is from [22], where a raster allows for modeling geographical phenomena as a regular surface in which each cell (or pixel) is associated with a phenomenon value. Each value associated with a pixel corresponds to an observation whereas we aggregate the values of a region. While their modeling is close to ours in terms of reused vocabularies, they do not represent metadata and provenance nor exploit Sentinel images. Our work adapts the one presented in [23,24] in several ways, with a different focus on the pipeline that generates RDF data from EO rasters and other data sources. Moreover, we do not need to consider versions of administrative units, and we explicitly refer to satellite images thanks to which we can compute new indices (in [23], only the land cover was considered), and we keep track of their provenance.
Finally, with respect to the work from [25,26], we are rather interested in identified areas of interest, whereas these authors seek to identify Regions of Interest (ROIs) that have been affected by significant changes and to associate contextual knowledge with these ROIs to annotate changes. Their approach has been applied to fire detection.

3. Semantic Model

We propose a semantic model to represent data from rasters that provide the observed properties of a region of interest divided into territorial units (land parcel, administrative unit, forest, etc.) along with their spatio-temporal dimensions. This model also allows us to keep track of the integrated data and metadata.
We developed this model following the NeOn methodology [27], which is a flexible methodology that proposes several scenarios. In particular, the scenario Reusing ontological resources [28] aims at selecting the most appropriate set of ontological resources with the ontology requirements. This scenario involves different activities, such as searching for candidate ontological resources that satisfy the requirements and evaluating them to check if they meet the developer’s needs, which is followed by the selection activity. In our case, we defined a set of requirements and searched for ontologies able to: (a) represent metadata concepts; (b) keep track of the raster files used as input of the ETL process; and (c) represent different types of data (territorial units, temporal and spatial data).
As a result of this search, we identified and manually evaluated the following existing resources, which are well-known in the domain: OGC standards such as GeoSPARQL (for geospatial data representation) and W3C recommendations such as OWL-Time (for representing temporal data), SOSA (for earth observations), DCAT (https://www.w3.org/TR/vocab-dcat-2/, accessed date: 23 December 2021) (a metadata vocabulary for cataloguing datasets), and PROV-O (for the provenance of the data generated by the integration process). Hence, our model relies on these selected models.
We propose a model composed of several interconnected sub-models describing the various types of data. We detail these sub-models in the following sections: tom, a territorial observation model to represent territorial units and their observations (captured in raster files); eom, an EO model to represent Sentinel image metadata; and eoam, an EO analysis model to represent rasters produced by image processing or vectors.

3.1. Territorial Observation Model (tom)

The Territorial Observation Model (tom) (Figure 1) represents any output of EO analysis activities—as long as it comes in raster format—as a collection of observations collected in the area of a territorial unit. The class tom:GeoFeatureObservationCollection (the sosa:ObservationCollection class is an extension proposed in a current working draft of SOSA— https://www.w3.org/TR/2020/WD-vocab-ssn-ext-20200116/, accessed date: 23 December 2021) represents a collection of observations (of type tom:GeoFeatureObservation), each of them observing a given property (sosa:ObservableProperty) on a given territorial unit.
Territorial units, having a footprint on Earth, are represented using the tom:GeoFeature class that specializes the classes sosa:FeatureOfInterest and geo:Feature. They belong to a type (tom:GeoFeatureType), such as an administrative unit (commune, county), a cadastral parcel, an agricultural parcel, a forest, or a geospatial data grid (such as Sentinel tiles). Using the sosa:hasSimpleResult property, each observation is associated to the value of the percentage covered by the property among all observed properties in the collection to which it belongs. For example, observations on a territorial unit can tell that it is covered by 40% of Mixed Forest and 60% of Coniferous Forest. The prov-o:Entity class allows us to keep track (using the prov-o:wasDerivedFrom property) on the one hand of the raster file used to create the collections of observations and on the other hand of the vector file used to create the territorial units (with classes from the eoam module described below).
The OWL file of this model is available at melodi.irit.fr/ontologies/tom/, accessed date: 23 December 2021 and can be visualized in WebVOWL at http://melodi.irit.fr/ontologies/tom/webvowl/index.html, accessed date: 23 December 2021.

3.2. Sentinel Images Metadata (eom)

The Sentinel image metadata (eom) is the sub-model dedicated to the representation of Sentinel image metadata. It mainly describes the product (an image) as the result of a sosa:Observation. Each observation is associated with a temporal information, namely the capture date (sosa:phenomenomTime) and a spatial information, namely the captured area (either by the geometry property of the eom:Product or by the sosa:hasFeatureOfInterest relation). To reduce the cost of image indexing, we assume that each Sentinel-2 image is mapped to a tile. So, the model proposes a class to represent tiles as spatial entities (geo:Feature). The model has been designed to take into account both Sentinel-1 and Sentinel-2 image metadata Figure 2.
The OWL file of this model is available at melodi.irit.fr/ontologies/eom/, accessed date: 23 December 2021 and can be visualized in WebVOWL at http://melodi.irit.fr/ontologies/eom/webvowl/index.html, accessed date: 23 December 2021.

3.3. EO Analysis Model (eoam)

In the EO analysis model (eoam), Sentinel images are consumed in different kinds of analyses, such as machine learning algorithms that identify changes between two images. Eoam provides information about the results (raster datasets) of these activities, since they are or will be consumed by the semantic integration process. Thanks to the PROV-O vocabulary, it is possible to know which Sentinel images have been used (eom:Product) as the input of a process (eoam:EOAnalysis) and which agent (prov-o:wasAssociatedWith) realized it. DCAT is used to represent catalog metadata of both raster and vector datasets. Thus, both raster files (eoam:RasterFile) and vector files (eoam:GeoFeatureFile) are considered as distributions of these datasets. A raster distribution is described by properties coming from the DCAT vocabulary: temporal coverage (dct:temporal), spatial properties (dct:Location), and spatial resolution (dcat:spatialResolutionInMeter). A vector distribution is described by the main attributes of the file such as the file size (dcat:byteSize), the file format (dct:format), or the coordinate reference system (CRS) used (dct:conformsToFigure 3.
The OWL file of this model is available at melodi.irit.fr/ontologies/eoam/, accessed date: 23 December 2021 and can be visualized in WebVOWL at http://melodi.irit.fr/ontologies/eoam/webvowl/index.html, accessed date: 23 December 2021.

4. EO Data Analysis Process

Before detailing the EO ETL process, we present the overall semantic architecture of our proposal.

4.1. Architecture

The architecture of the EO data analysis pipeline is depicted in Figure 4. This pipeline is composed of three main tasks:
  • Satellite images processing and analysis: This task consists of processing and analyzing satellite images coming from a DIAS (Data and Information Access Services) (in our project, CreoDias (https://creodias.eu/, accessed date: 23 December 2021)). Possible analyses can range from simple ones such as NDVI calculation to more sophisticated analyses such as change detection on time series or land cover annotation. The task generates raster files as output.
  • Semantic data integration: The task extracts data from the raster files using vector files that contain the territorial units to be observed. Vector sources could come from open data repositories or from our semantic database through Semantic search.
  • Semantic search: The task aims to analyze the integrated data by querying the semantic database. The SPARQL query results can be used to perform once again the first two tasks for further analysis, either as parameters for guiding the process or as input data. The results can also be used by specialized GIS applications for detailed analyses of the whole integrated data.

4.2. Semantic ETL Process

The semantic process is divided into several steps: (i) data extraction from raster and vector files; (ii) data transformation; and (iii) data load into the triplestore. Overall, it relies on the definition of semantic mappings by identifying the parts of the data source schemes that are related to the semantic data models, supporting the extraction process; and on the definition of transformation functions for populating the data models. The steps of the process are described in the following paragraphs.

4.2.1. Data Extraction from Raster and Vector Files

This step aims at extracting and structuring the data according to different objectives. The process requires two sources: a vector and a raster. First, metadata (e.g., issue date, format, CRS, or spatial extent) are extracted. Next, the vector file is processed to extract information about territorial units of a given type, including their geometry (a polygon), which is projected to the WGS84 CRS coordinate (the default CRS in GeoSPARQL). They will populate the tom:GeoFeature class. The raster is also processed to qualify each territorial unit contained in the vector file.
Currently, we distinguish two types of raster files, depending on the type of their pixel values:
  • Categorical rasters (as for land cover): in this kind of raster, a pixel value is a code that represents a class. Thus, additional information is needed to decode it. For example, in a CESBIO raster, pixel values encode a type of landcover; the value 15 is decoded as a vineyard;
  • Continuous rasters (as for NDVI or change indicators): a pixel value is processed to be automatically classified into a level (or class) such as Very low, Low, Middle, High, or Very high, for instance.
In order to qualify a territorial unit from a raster, either new properties (e.g., mean values) are extracted by pixel aggregation, or spatial masks are created to eliminate undesired areas (i.e., only the area inside the unit footprint is preserved). For example, the land cover of a land register parcel is calculated from a raster in three steps: (i) projecting the parcel and the raster land cover onto the same coordinate reference system; (ii) applying the parcel geometry as a mask onto the land cover raster image file; and (iii) calculating the percentage of each land cover class occupying the parcel. For example, the parcel presented in Figure 5 covers 16 pixels: 14 of them are annotated as vineyards (code 15), and the other two are grassland (code 13). Hence, 87.5% of the parcel are vineyards and 12.5% are grassland.
This process requires four parameters:
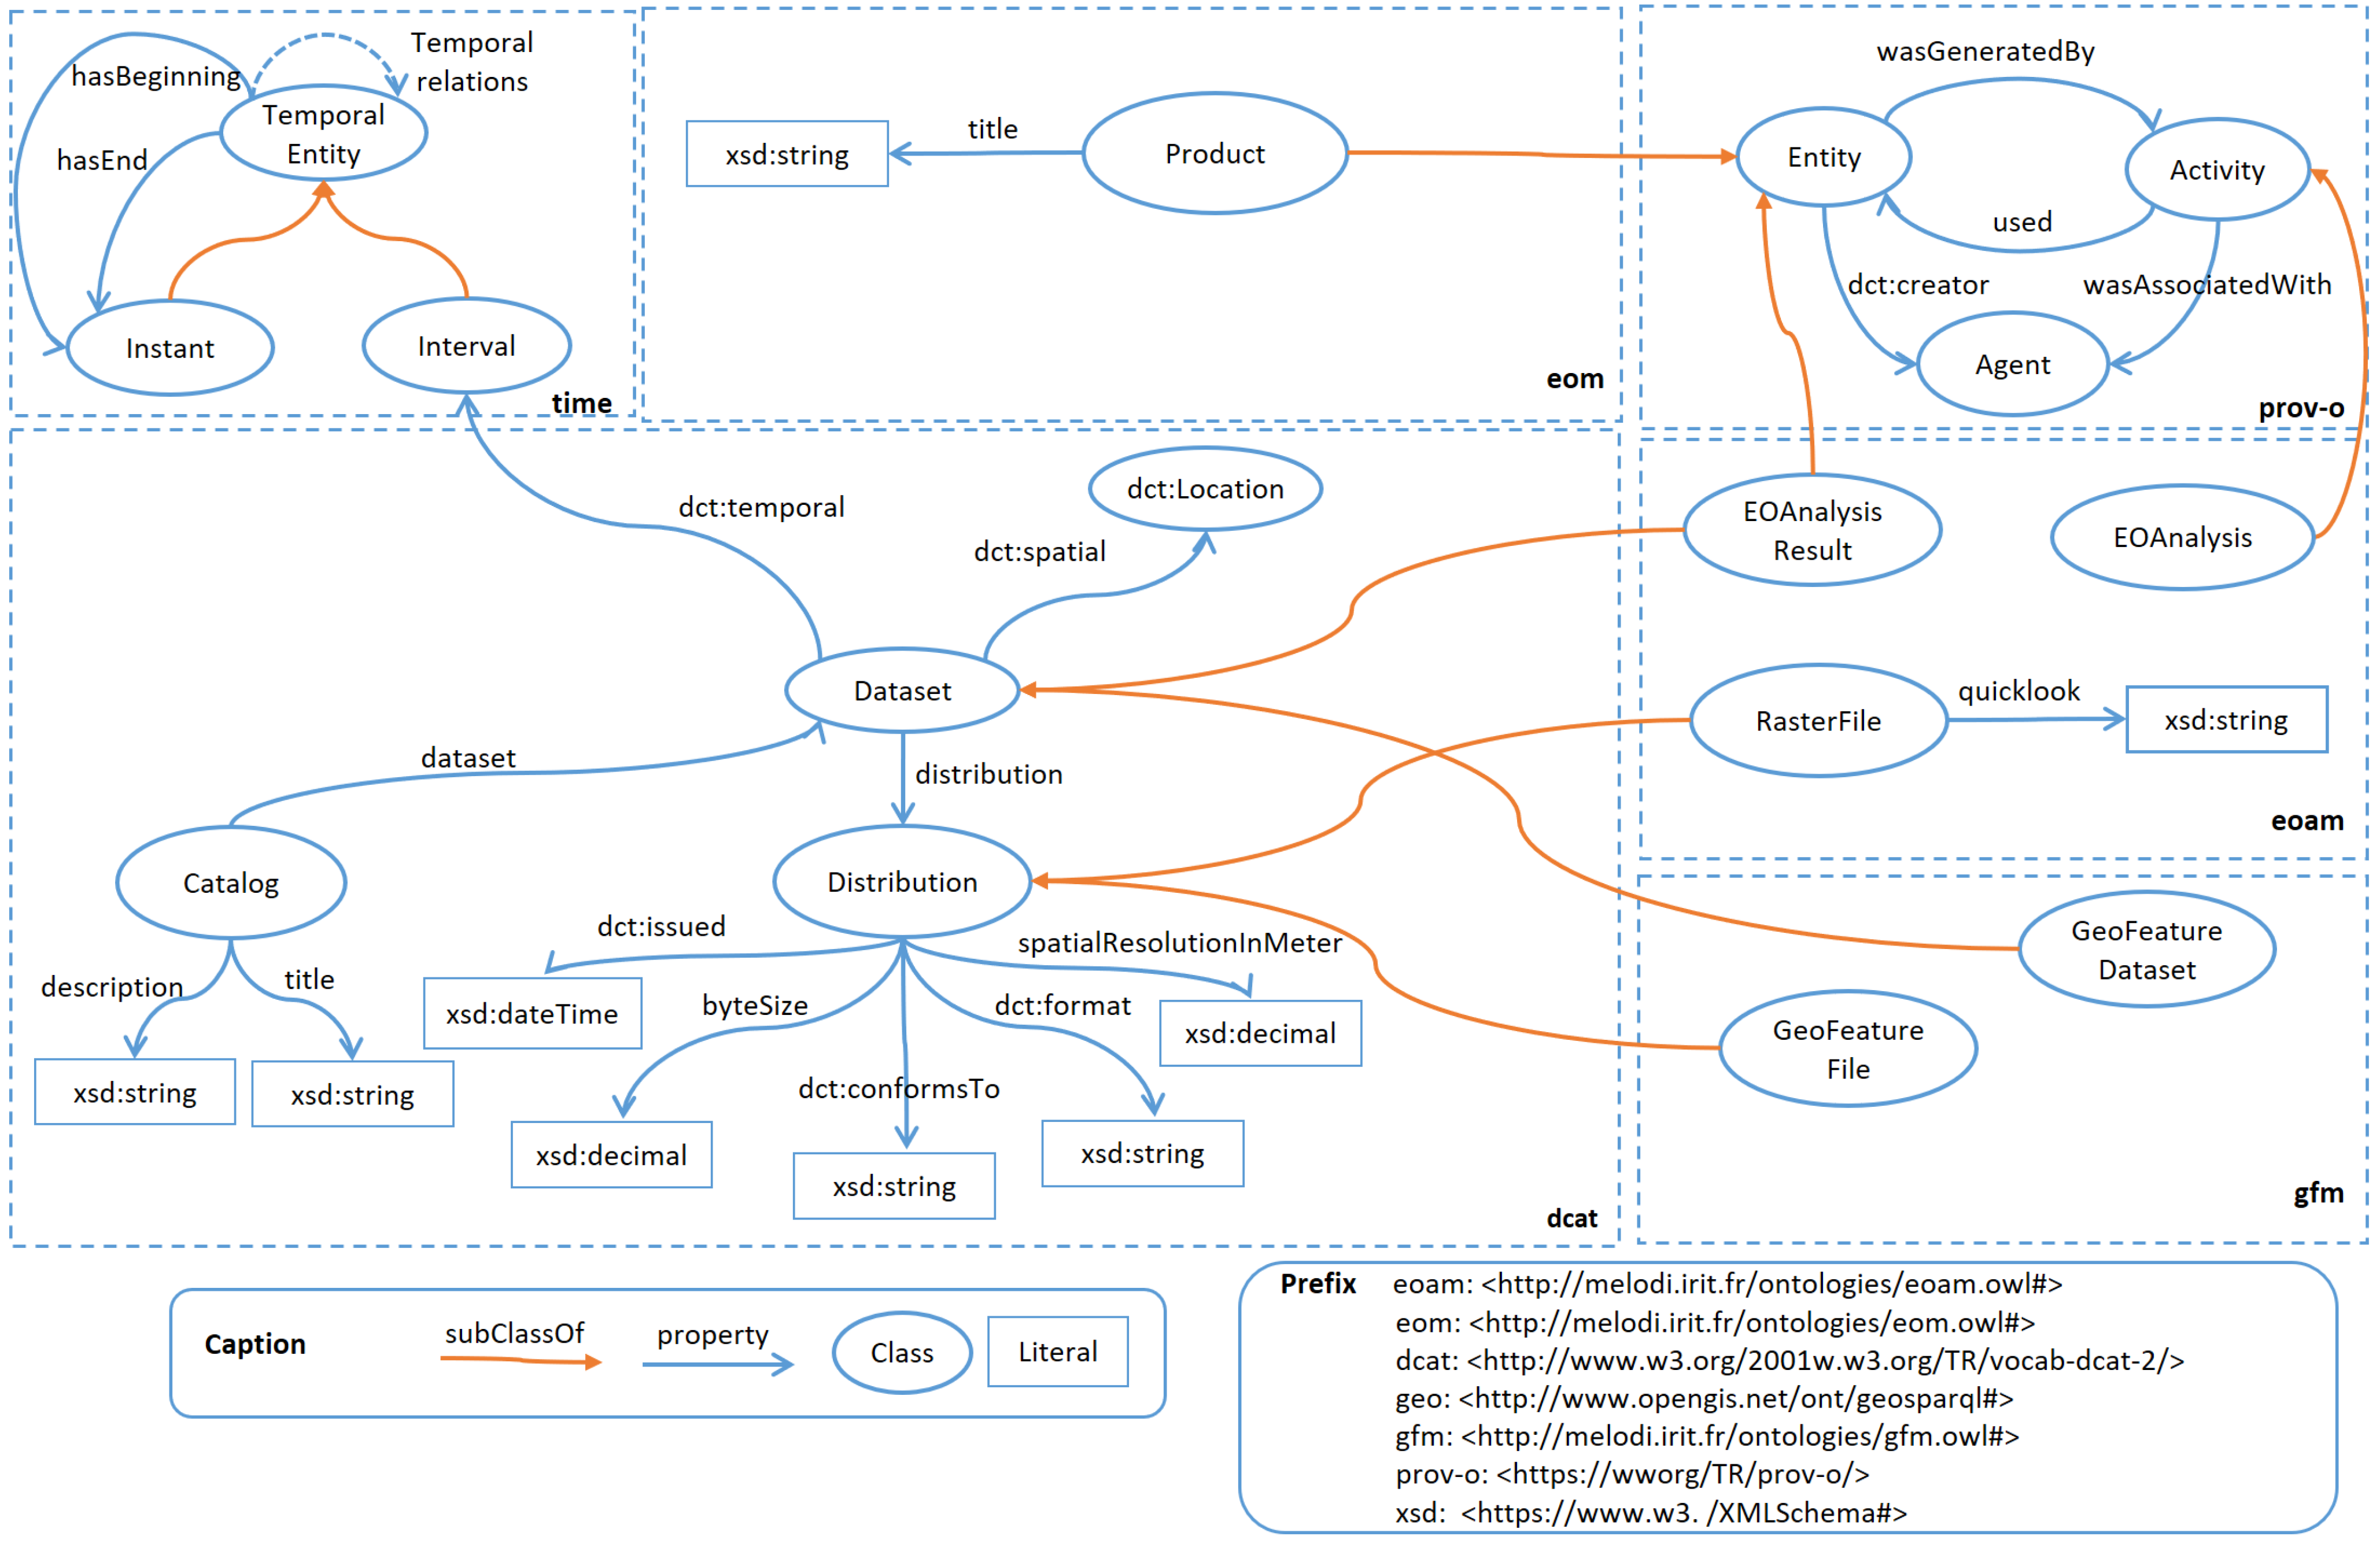
  • Period or date of validity of the raster data: this information will be represented as a time:TemporalEntity associated with each tom:GeoFeatureObservationCollection (one per territorial unit) using the sosa:phenomenonTime property.
  • Type of raster: this information, e.g., specific land cover, NDVI, or change, represented as an instance of tom:GeoFeatureObservablePropertyType, will be linked to each tom:GeoFeatureObservationCollection.
  • ID of the satellite images used to generate the raster. This ID is represented as an instance of eom:Product.
  • Agent who generated the raster, in other words, who performed the EO analysis process. This information is converted to an instance of prov-o:Agent.
The values extracted from the data sources are represented in a pivot format (JSON).

4.2.2. Data Transformation

This step aims at transforming the processed data into the semantic one. Templates that define the mappings between the extracted data (in JSON) and the ontologies are used as a basis in this process. Templates are usually written by hand. Although different data translation tools exist, such as D2RQ (http://d2rq.org/, accessed date: 23 December 2021), Ultrawrap (https://capsenta.com/ultrawrap/, accessed date: 23 December 2021), Morph (http://mayor2.dia.fi.upm.es/oeg-upm/index.php/en/technologies/315-morph-rdb/, accessed date: 23 December 2021), Ontop (http://ontop.inf.unibz.it/, accessed date: 23 December 2021), or GeoTriples (http://geotriples.di.uoa.gr/, accessed date: 23 December 2021), we chose to adapt the mapping template and processing mechanism described in [29]. This choice is motivated by the fact that it contains functions that help perform more sophisticated operations, especially feature masking. The output of this step is a set of RDF files.

4.2.3. Data Load

The final step is to import the RDF files into the triple store, following a materialization approach. Data sources are transformed into RDF graphs which are then loaded into a triple store and accessed through a SPARQL query engine. The advantage of such an approach is to facilitate future processing, analysis, or reasoning on the materialized RDF data. More precisely, this choice is motivated by three reasons:
  • It is not easy to perform on-demand mapping, since the data sources we considered (presented below) are available in different formats (JSON, GeoTIFF, shapefile, or even remote compressed files (see Section 5.1), which requires a prior pre-processing step.
  • A geospatial triplestore can be used as a warehouse to store semantic data to perform data enrichment and linking.
  • Different datasets may be offered by several endpoints requiring a federation mechanism. However, there is currently no query engine mature enough to answer GeoSPARQL queries over such a federation [8]. Considering that we send a single GeoSPARQL query to examine the territorial units stored in different triplestores, spatial comparisons on the fly are not possible.
In the following, we present an example SPARQL query on the resulting triplestore. This query retrieves all territorial units (their ID, type, and geometry) located in an area, defined by [zoneWKT] (for example, POLYGON (−0.457 45.125, 0.936 45.085, 0.869 44.099, −0.500 44.138, −0.457 45.125)) corresponding to the area of our Vineyard use case (see below), having observable properties with values greater than 0.5, in a given time interval defined by [startDate] and [endDate] (for example, 2017-04-01T00:00:00 and 2017-05-01T00:00:00).
PREFIX rdf: <http://www.w3.org/1999/02/22-rdf-syntax-ns#>
PREFIX sosa: <http://www.w3.org/ns/sosa/>
PREFIX tom: <http://melodi.irit.fr/ontologies/tom.owl#>
PREFIX provo: <http://www.w3.org/TR/prov-o/>
PREFIX eoam: <http://melodi.irit.fr/ontologies/eoam.owl#>
PREFIX dcat: <https://www.w3.org/TR/vocab-dcat-2/>
PREFIX geo: <http://www.opengis.net/ont/geosparql#>
PREFIX geof: <http://www.opengis.net/def/function/geosparql/>
PREFIX time: <http://www.w3.org/2006/time#>
PREFIX xsd: <http://www.w3.org/2001/XMLSchema#>
SELECT ?geofeature ?type_name ?wkt ?dti1 ?dti2 ?value
WHERE
{
?obsv a tom:GFObservation.
?obsv sosa:observedProperty ?prop.
?obsv sosa:hasSimpleResult ?value.
  FILTER(?value>=0.5).
?obsvCol sosa:hasMember ?obsv.
?obsvCol sosa:hasFeatureOfInterest ?geofeature.
?geofeature geo:hasGeometry/geo:asWKT ?wkt.
  FILTER(geof:sfContains("[zoneWKT]"^^geo:wktLiteral, ?wkt)).
?obsvCol sosa:phenomenonTime ?timeInterval.
?timeInterval time:hasBeginning/time:inXSDDateTime ?dti1.
?timeInterval time:hasEnd/time:inXSDDateTime ?dti2.
  FILTER((?dti1 <="[endDate]"^^xsd:dateTime &&
      ?dti2>="[startDate]"^^xsd:dateTime))).
?geofeature tom:hasType/tom:name ?type_name.
}
limit 100
The entire semantic ETL process is implemented using the docker technology and is publicly available (https://hub.docker.com/r/h2020candela/triplification), accessed date: 23 December 2021.

5. Experimental Evaluation

The evaluation was performed on two use cases describing different types of EO properties of a territorial unit. Since the integration process is performed by users based on their purpose, the integrated database is built according to these use cases.
The semantic data generated for these use cases is stored in a database that can be exposed through a semantic search interface or accessed via a SPARQL endpoint (http://melodi.irit.fr/tom/), accessed date: 23 December 2021.
We evaluated the approach in terms of (i) adaptability of the proposed model to two use cases; (ii) adaptability of the pipeline to each use case; and (iii) added value of the generated datasets to assist in decision making. We also discuss the scalability of the approach.

5.1. Use Cases

Two use cases of the CANDELA project were chosen for the demonstration:
  • Vineyard use case: The objective of this use case is to recover changes in vineyards that have been damaged by natural hazards such as frost or hail. These climatic events can cause significant losses in vineyards and reduce wine productions. Their periods are known to the user who selects the corresponding images. The study area is located in the Aquitaine region of France. The vineyards in this region were reported as heavily damaged by frost on 20 April 2017. We chose the village of Saint-Emilion (INSEE code: 33394) to conduct the study. Saint-Emilion is a small well-preserved medieval village that is famous for its prestigious red wine, which is called Grands Crus Classés.
  • Urban expansion use case: The use case aims at studying the changes associated with urban expansion on agricultural areas. This type of study can help land managers with their planning. We studied changes on villages between 2017 and 2020 around the Bordeaux city, one of the largest cities in France, which is surrounded by agricultural areas.
Despite their difference in nature, both use cases share a common set of raster types:
  • Change indicator: Two partners of the project, Thales Alenia Space France and Thales Alenia Space Italy, have each developed a change detection application to identify various types of changes between two Sentinel images. These tools produce change indicator raters representing the probability of changes between 0 and 1.
  • NDVI: NDVI information is obtained by processing near-infrared and red sensors of Sentinel images. The output of the calculation is a matrix of values between −1 and 1 characterizing the NDVI of each pixel. Since the values between −1 and 0 represent the elements composed of water, these values are set to 0 so that the rasters contain only values between 0 and 1.
  • Land cover: The datasets provide information about the land cover of an area on Earth. The CESBIO land cover datasets (http://osr-CESBIO.ups-tlse.fr/~oso/, accessed date: 23 December 2021) are used for our use cases. They cover the French territory with a spatial resolution of 10 m2.
Regarding the territorial units (vector datasets), land register data are used for the first use case, while the second use case exploits administrative unit data.

5.2. Adaptability of the Model

The adaptability (or genericity) of the proposed model to accommodate two use cases (each use case uses its own data describing different kinds of EO properties of an territorial unit) is proved by the following facts:
  • The model treats all the raster datasets, and their versions, in the same way, as long as they exist in the correct format. They can contain change, NDVI, or land cover information.
  • Different classifications can be used to observe the same type of EO property. For example, the land cover observations can come from Corine Land Cover, Global Land Cover Share, CESBIO, or other open sources.
  • The system can consume any vector source that describes territorial divisions, such as agricultural parcels, land register parcels, administrative units, Sentinel tiles, or forest units.

5.3. Adaptability of the Pipeline

Since the components of the pipeline are organized as services, the users can customize the pipeline by choosing and chaining up as many services as they want.
  • Vineyard use case: (i) We first obtain all the parcels of the Saint-Emilion village from the cadastre data and the CESBIO land cover raster for 2017. Then, semantic data integration is used to integrate the land cover and parcels information. (ii) Vineyard parcels within villages are retrieved via semantic search. (iii) Appropriated Sentinel-2 images are used for NDVI calculation. (iv) These images are also used for change detection. (v) The generated rasters from the 3rd and 4th steps along with the vector from the 2nd step are integrated into the semantic database. (vi) Finally, semantic search can be used to analyze all integrated information related to the vineyard of interest.
  • Urban expansion use case: (i) We first select adapted Sentinel images and execute NDVI calculation. (ii) These images are also used for change detection. (iii) We obtain vector data of all the villages of the Gironde department (INSEE code: 33) from the open administrative unit datasets. Semantic data integration is next launched using the raster generated from the previous step and the obtained vector files. (iv) Finally, we can perform semantic search to analyze the integrated data related to the villages of interest.
As mentioned in Section 4.2.1, the semantic data integration is configurable by a set of four parameters. These parameters can be provided as raster metadata or as function parameters. Users can also provide custom thresholds for class classification since the results of image processing and analysis can be highly scenario dependent. For example, in the vineyard use case, custom thresholds can be set for the classification of change indicators. The values below 0.1 could be translated as Very low change instead of below 0.2. These types of parameters must be set explicitly at runtime.

5.4. Added Value of the Generated Datasets in Helping Decision Making

We evaluate the benefits of using integrated data to assist in tasks such as land monitoring and data cross-checking, and we discuss them in what follows.

5.4.1. Improving Land Monitoring Thanks to Data Integration

Figure 6 shows an example of the web interface used to retrieve observations for the vineyard use case. The application supports three filters, each corresponding to one dimension: temporal (the user must define a period of time), semantic (the user must select an ObservableProperty from the three-view), and spatial (the user must draw an area of interest on the map). GeoSPARQL queries are formulated based on the input parameters and are next sent to the endpoint. Territorial units satisfying the constraints are displayed on the map (in this example, the displayed polygons are parcels located around the Langon village having vineyard as land cover in April 2017). All available observations made on a chosen territorial unit are displayed in tabular form on the right. To simplify the view, each line of the table only provides information about the observed property, period, value (in percentage), a thumbnail of the original raster (or the data source), and the Sentinel images used to generate the raster.
In this scenario, the integrated data can be exploited for territory monitoring. The knowledge base provides detailed information about the territorial units (the parcels) of the given area. An application of this type of analysis is land-cover monitoring over time. This can be done by examining all observations made on these territorial units. Figure 6 shows that vineyard was the main land cover (80% from CESBIO and 100% from Corine) of the selected parcel (e.g., the parcel 331640000D0523) in 2017. The parcel had low NDVI and was slightly changed during the frost period (having the very low change and low change levels).

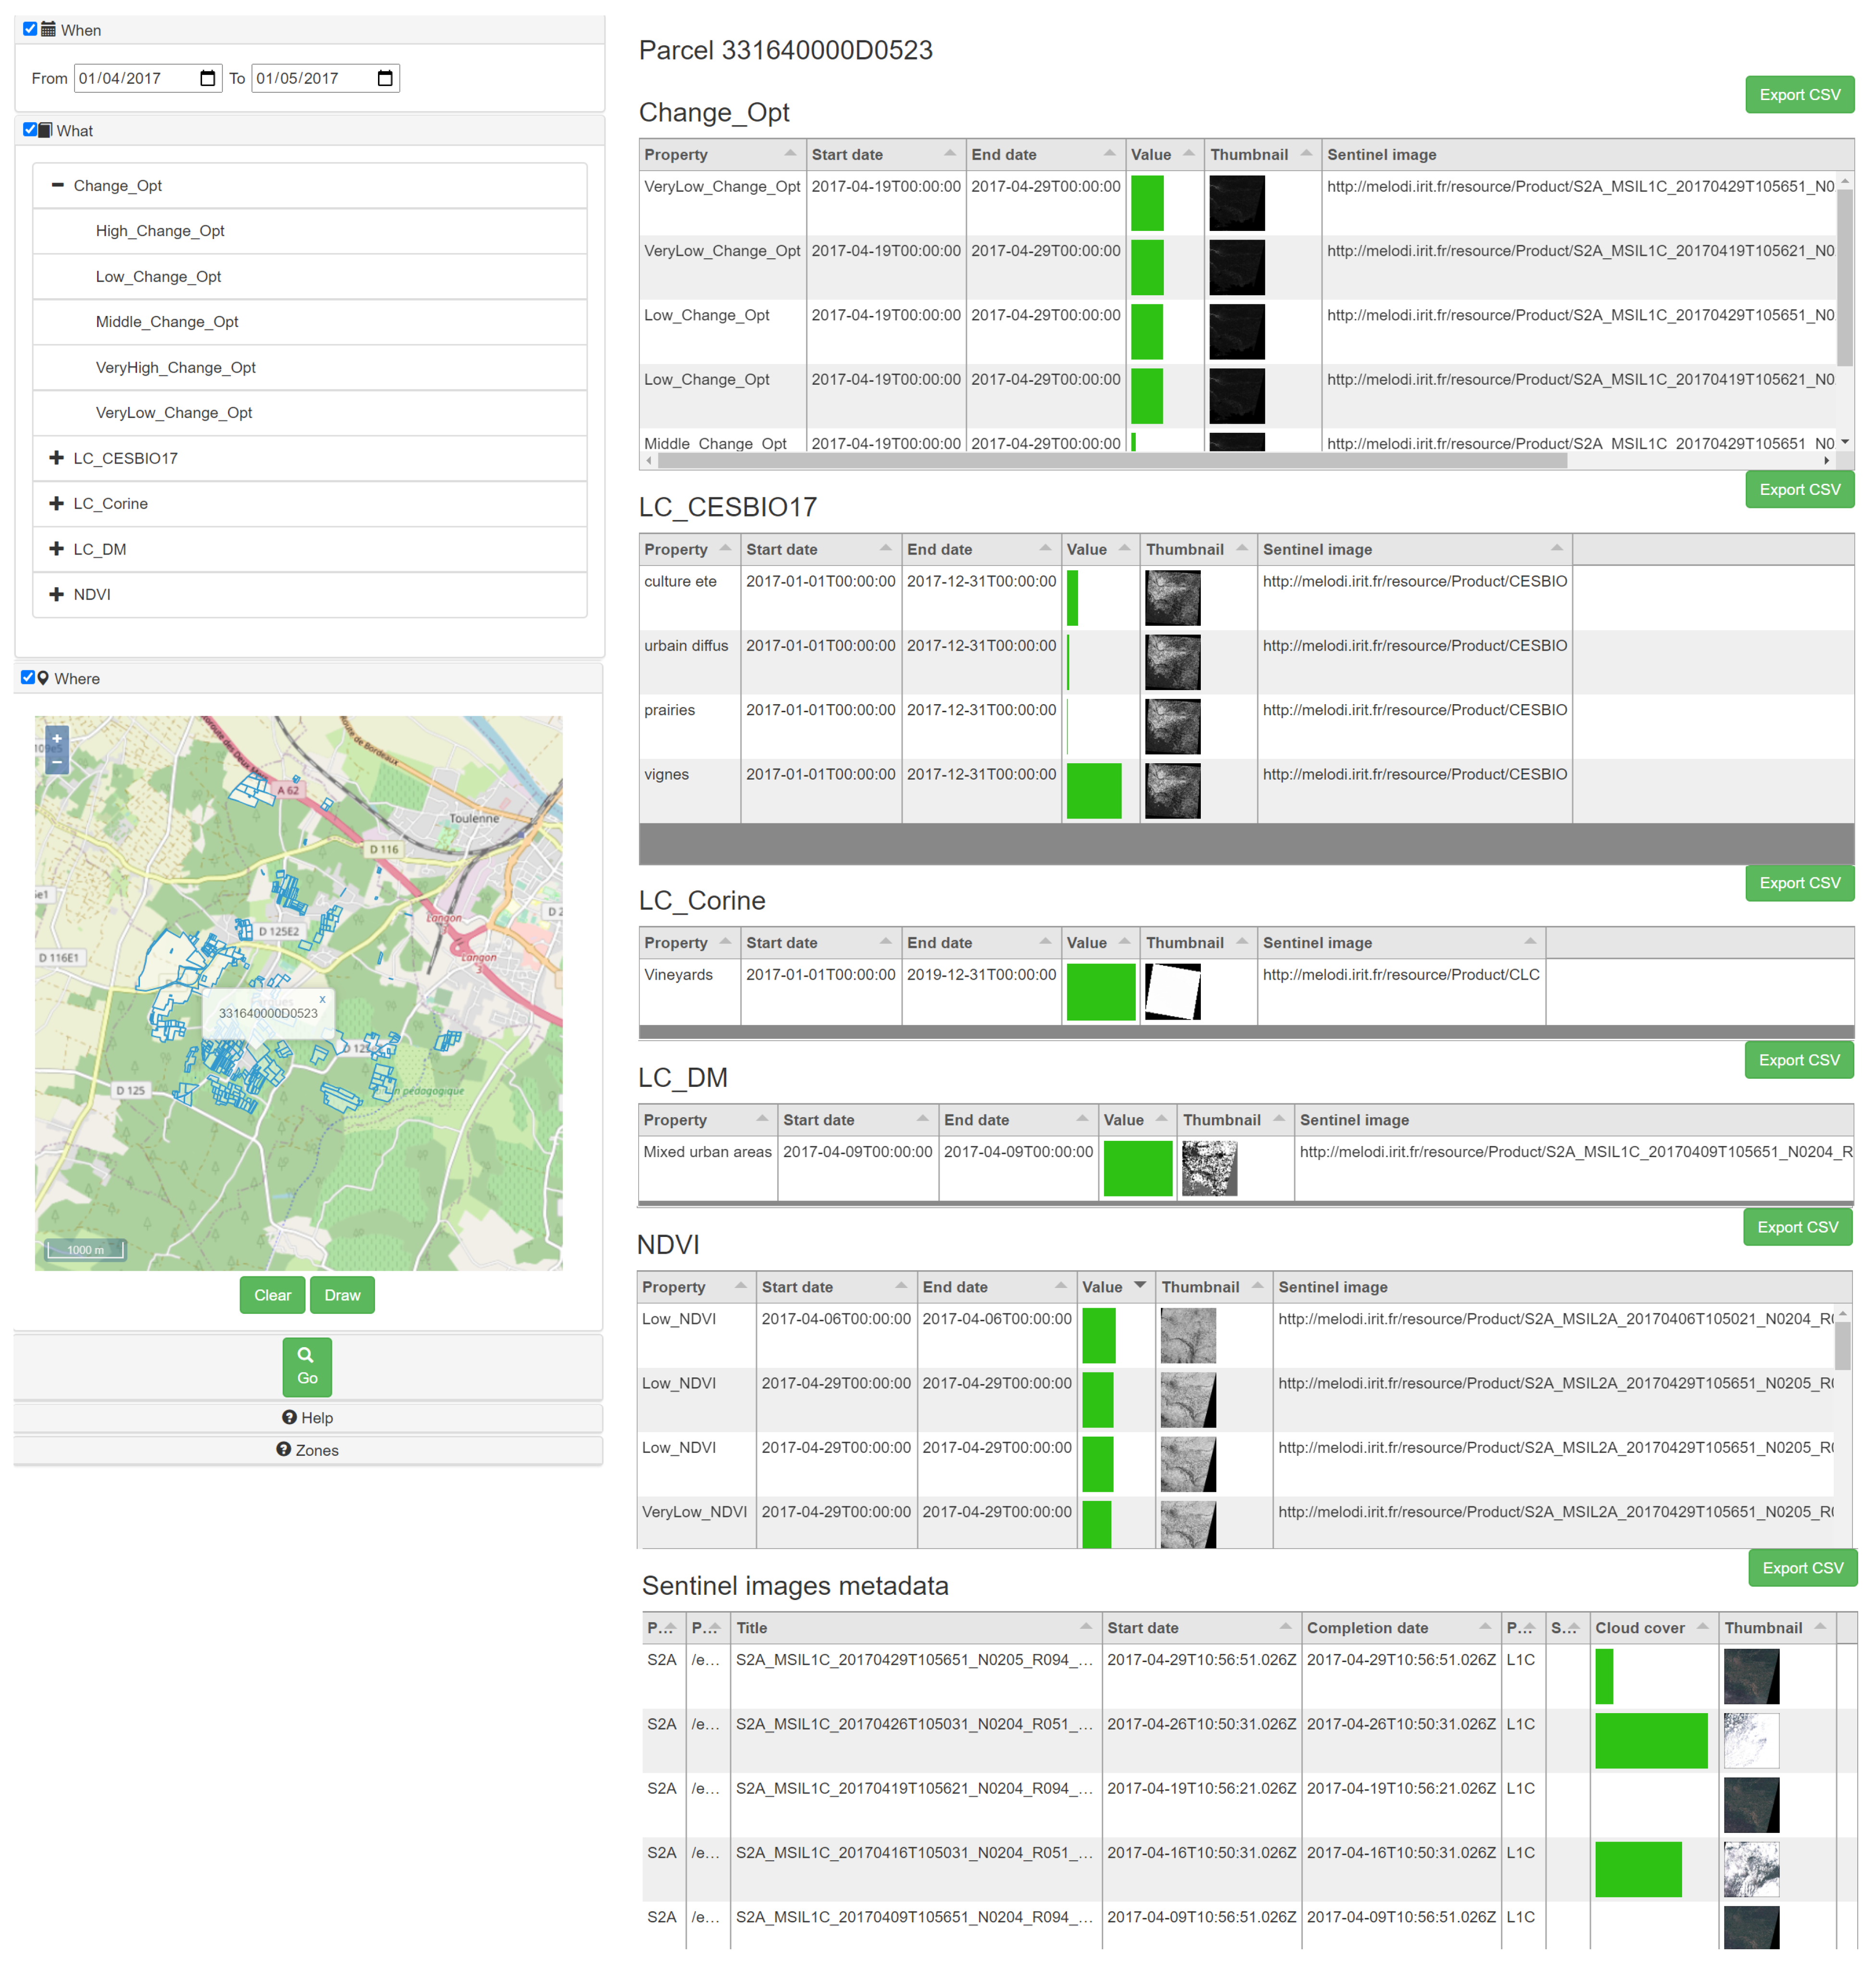
5.4.2. Data Cross-Verification Thanks to Data Integration

Another application is to check information from various sources, including the results provided by our partners. We used the land cover annotation dataset obtained by interactive data mining algorithms on satellite images [30], developed by DLR (German Aerospace Center). For example, it is possible to compare the CESBIO land cover information with the land cover annotated by DLR or to justify the change detection result based on land cover change. From Figure 6, several remarks arise from the comparison of the two observations:
  • The parcel was not correctly annotated by the user of DLR tools, as he identified it as a ‘Mixed urban area’ (property LC_DM).
  • CESBIO (property LC_CESBIO17) and Corine (property LC_Corine) correctly identify land cover at the parcel level. In fact, the differences observed between the two land covers come from the spatial resolution of the rasters (which has an impact on the precision). While the best resolution for the French area is given by CESBIO, the DLR data mining labels are given by a user with limited domain knowledge.
  • The parcel was detected as having low change by TAS (property Change_Opt) using their deep learning algorithm. In fact, there is about a 5% change in NDVI levels (property NDVI) during this period.

5.4.3. Use Cases Analysis

We evaluate the output of the pipeline presented in Section 5.3, knowing that it highly depends on the precision of the algorithms provided by our partners.
  • Vineyard use case: Two Sentinel-2 images collected on the T30TYQ tile are used for change detection and NDVI computation; they are respectively dated 19 April 2017 and 29 April 2017: we chose these images because they have very low cloud cover (0% and 15%) and the interval between these observations includes the period of study.
    Figure 7 represents an overview of the change levels detected and the degradation of NDVI between two dates (the NDVI after the phenomenon is lower than before, i.e., there is less vegetation than before). The very low change level is eliminated, since it is not very relevant. The NDVI degradation indicator represents the total percent degradation of five NDVI levels. We also eliminated parcels with less than 20% NDVI degradation.
    Finally, there are 858 parcels detected as having changed, 756 parcels detected as having NDVI degradation above 20%, and 510 parcels detected in both cases.
  • Urban expansion use case: For NDVI calculation and change detection, it is recommended to collect images at the same period and in summer to limit the cloud cover and the influence of vegetation growth. Thus, two Sentinel-2 images were collected on 2 August 2017 and 6 August 2020 and have 0% of cloud cover. Figure 8 (right) represents an overview of the detected change levels and degraded NDVI levels between these two dates, along with (left) the source Sentinel images. We can observe that (i) the detected levels of change correspond quite well with the degraded NDVI due to urbanization; (ii) the closer the village reaches the city, the more it is modified. The next analysis could compare the information on change, NDVI, and land cover at the parcel level for specific villages.

5.5. Approach Scalability

In terms of triplestore, we initially chose Strabon (http://strabon.di.uoa.gr/, accessed date: 23 December 2021) for its main advantages: (i) it extends the Sesame triplestore with the ability to store spatial RDF data in the PostgreSQL DBMS enhanced with PostGIS. It has a good overall performance due to special optimization techniques that allow spatial operations to take advantage of PostGIS functionality instead of relying on external libraries [31]. For complex applications that include both spatial joins or spatial aggregations, Strabon is an RDF store that performs well [32]. (ii) It provides a SPARQL endpoint that allows access to the content of the triplestore. The interface also provides additional capability to manage the knowledge base, for instance storage and update capabilities with SPARQL Update.
While Strabon performed well when considering a small number of triples in the data store, we faced scalability issues when the number of triples increased. Indeed, the same conclusion is reported in [33]. Therefore, for these reasons, we looked at query federation approaches where the data are stored in different triplestores. In our case, Strabon is used only for spatial data and GraphDB (https://graphdb.ontotext.com/, accessed date: 23 December 2021) (a semantic graph database compliant to the W3C standards) for the other data types. Preliminary experiments have shown two main advantages of this option: (i) faster response time for non-spatial queries, and (ii) scalable and robust as it ensures the result regardless of the amount of integrated data. Regarding the size of the generated RDF datasets, we populated 0.5 M geofeatures entities (about 2.5 M triples) in Strabon and 4 M observations (97.5 M triples) in GraphDB.

6. Conclusions

In this paper, we presented an approach for the integration of data calculated from rasters as a way of qualifying territorial units (represented as vectors), based on their spatio-temporal features. A first contribution is a generic semantic model that allows the homogeneous description of spatio-temporal data to qualify predefined areas. We used this model to semantically describe data from different use cases. A second contribution is a configurable semantic Extract Transform and Load (ETL) process based on that generic vocabulary. We used this process to extract the data from rasters and to link the observations to territorial units through their spatio-temporal dimensions. Last but not least, we produced semantic databases that can be further exploited for new purposes.
As future work, we plan to exploit big data scenarios with the management of Natura 2000 areas (https://www.eea.europa.eu/data-and-maps/data/natura-11, accessed date: 23 December 2021) (land cover evolution and change detection on conservation areas). We also plan to extend the proposed approach to handle data from CSV files, in particular, weather observations from ECAD (https://www.ecad.eu/, accessed date: 23 December 2021) or Meteo France (http://www.meteofrance.com/, accessed date: 23 December 2021). We could apply the Location Index (Loc-I) approach presented in [34] to boost the performance of our application. Finally, considering data cubes as multidimensional data arrays frequently used to manage geospatial data, including rasters, we consider managing this type of structure in the ETL pipeline.

Author Contributions

The authors contributed in the following way to the work reported in this paper and to its writing: conceptualization and methodology, Nathalie Aussenac-Gilles, Catherine Comparot, Ba-Huy Tran and Cassia Trojahn; software, Ba-Huy Tran; validation, Ba-Huy Tran and Catherine Comparot; formal analysis, Ba-Huy Tran and Cassia Trojahn; investigation, Nathalie Aussenac-Gilles, Catherine Comparot, Ba-Huy Tran and Cassia Trojahn; resources, Catherine Comparot and Ba-Huy Tran; data curation, Ba-Huy Tran; writing—original draft preparation, Catherine Comparot, Ba-Huy Tran and Cassia Trojahn; writing—review and editing, Nathalie Aussenac-Gilles, Catherine Comparot, Ba-Huy Tran and Cassia Trojahn; supervision, Nathalie Aussenac-Gilles, Catherine Comparot, and Cassia Trojahn; project administration, Nathalie Aussenac-Gilles, Ba-Huy Tran and Cassia Trojahn; funding acquisition, Nathalie Aussenac-Gilles and Cassia Trojahn. All authors have read and agreed to the published version of the manuscript.

Funding

This work benefited from two financial supports: an H2020 grant for the CANDELA project from an H2020 EC research and a grant from the French innovation program (PIA) under convention 776193.

Institutional Review Board Statement

Not applicable.

Informed Consent Statement

Not applicable.

Data Availability Statement

All the links to publicly available datasets and codes have been referenced in the text.

Conflicts of Interest

The authors declare no conflict of interest.

References

  1. Villegas, J.; Sánchez Pastor, H.; Hernanz, L.; Checa, M.; Roman, D. Enabling the Use of Sentinel-2 and LiDAR Data for Common Agriculture Policy Funds Assignment. Int. J. Geo-Inf. 2017, 6, 255. [Google Scholar] [CrossRef] [Green Version]
  2. Tran, B.H.; Aussenac-Gilles, N.; Comparot, C.; Trojahn, C. Semantic Integration of Raster Data for Earth Observation on Territorial Units. In Proceedings of the 4th International Workshop on GeoSpatial Linked Data (GeoLD 2021@ESWC 2021), Heraklion, Greece, 6–10 June 2021; Haller, A., Yaman, B., Sherif, M.A., Ngomo, A.C.N., Eds.; Mohamed Ahmed Sherif; Beyza Yaman; Armin Haller; Axel-Cyrille Ngonga Ngomo: Hersonissos, Greece, 2021; pp. 1–12. [Google Scholar]
  3. Zinke, C.; Ngomo, A.C.N. Discovering and Linking Spatio-Temporal Big Linked Data. In Proceedings of the IGARSS 2018—2018 IEEE International Geoscience and Remote Sensing Symposium, Valencia, Spain, 22–27 July 2018; pp. 411–414. [Google Scholar]
  4. Brizhinev, D.; Toyer, S.; Taylor, K.; Zhang, Z. Publishing and Using Earth Observation Data with the RDF Data Cube and the Discrete Global Grid System. Technical Report; W3C and OGC. 2017. Available online: https://www.w3.org/TR/eo-qb/ (accessed on 23 December 2021).
  5. Hobbs, J.R.; Pan, F. An ontology of time for the semantic web. ACM Trans. Asian Lang. Inf. Process. 2004, 3, 66–85. [Google Scholar] [CrossRef]
  6. Lefort, L.; Bobruk, J.; Haller, A.; Taylor, K.; Woolf, A. A Linked Sensor Data Cube for a 100 Year Homogenised Daily Temperature Dataset. In Proceedings of the 5th International Conference on Semantic Sensor Networks, SSN’12, Boston, MA, USA, 12 November 2012; CEUR-WS.org: Aachen, Germany, 2012; Volume 904, pp. 1–16. [Google Scholar]
  7. Augustin, H.; Sudmanns, M.; Tiede, D.; Lang, S.; Baraldi, A. Semantic Earth observation data cubes. Data 2019, 4, 102. [Google Scholar] [CrossRef] [Green Version]
  8. Bereta, K.; Caumont, H.; Daniels, U.; Goor, E.; Koubarakis, M.; Pantazi, D.A.; Stamoulis, G.; Ubels, S.; Venus, V.; Wahyudi, F. The Copernicus App Lab project: Easy Access to Copernicus Data. In Proceedings of the 22nd International Conference on Extending Database Technology (EDBT), Lisbon, Portugal, 26–29 March 2019. [Google Scholar]
  9. Kolas, D.; Perry, M.; Herring, J. Getting Started with GeoSPARQL; Technical Report; OGC: Rockville, MD, USA, 2013. [Google Scholar]
  10. Janowicz, K.; Haller, A.; Cox, S.J.; Phuoc, D.L.; Lefrançois, M. SOSA: A lightweight ontology for sensors, observations, samples, and actuators. J. Web Semant. 2019, 56, 1–10. [Google Scholar] [CrossRef] [Green Version]
  11. Espinoza-Molina, D.; Nikolaou, C.; Dumitru, C.O.; Bereta, K.; Koubarakis, M.; Schwarz, G.; Datcu, M. Very-High-Resolution SAR Images and Linked Open Data Analytics Based on Ontologies. IEEE J. Sel. Top. Appl. Earth Obs. Remote Sens. 2015, 8, 1696–1708. [Google Scholar] [CrossRef] [Green Version]
  12. Sukhobok, D.; Sanchez, H.; Estrada, J.; Roman, D. Linked Data for Common Agriculture Policy: Enabling Semantic Querying over Sentinel-2 and LiDAR Data. In Proceedings of the ISWC 2017 Posters & Demonstrations and Industry Tracks (ISWC-PD-Industry), Vienna, Austria, 23–25 October 2017; Nikitina, N., Song, D., Fokoue, A., Haase, P., Eds.; Number 1963 in CEUR Workshop Proceedings. 2017. [Google Scholar]
  13. Alirezaie, M.; Kiselev, A.; Längkvist, M.; Klügl, F.; Loutfi, A. An Ontology-Based Reasoning Framework for Querying Satellite Images for Disaster Monitoring. Sensors 2017, 17, 2545. [Google Scholar] [CrossRef] [PubMed] [Green Version]
  14. Masmoudi, M.; Taktak, H.; Ben Abdallah Ben Lamine, S.; Boukadi, K.; Karray, M.H.; Baazaoui Zghal, H.; Archimede, B.; Mrissa, M.; Guegan, C.G. PREDICAT: A Semantic Service-Oriented Platform for Data Interoperability and Linking in Earth Observation and Disaster Prediction. In Proceedings of the 2018 IEEE 11th Conference on Service-Oriented Computing and Applications (SOCA), Paris, France, 20–22 November 2018; pp. 194–201. [Google Scholar]
  15. Abburu, S.; Dube, N.; Nayak, M.R.; Golla, S. An Ontology Based Methodology for Satellite Data Semantic Interoperability. Adv. Electr. Comput. Eng. 2015, 15, 105–110. [Google Scholar] [CrossRef]
  16. Blower, J.; Gonçalves, P.; Caumont, H.; Koubarakis, M.; Perkins, B. Exploiting Open Environmental Data using Linked Data and Cloud Computing: The MELODIES project. In Proceedings of the EGU General Assembly Conference Abstracts, Vienna, Austria, 12–17 April 2015; p. 15624. [Google Scholar]
  17. Andrejev, A.; Misev, D.; Baumann, P.; Risch, T. Spatio-Temporal Gridded Data Processing on the Semantic Web. In Proceedings of the 2015 IEEE International Conference on Data Science and Data Intensive Systems, Sydney, Australia, 11–13 December 2015; pp. 38–45. [Google Scholar] [CrossRef]
  18. Bereta, K.; Xiao, G.; Koubarakis, M. Ontop-spatial: Ontop of geospatial databases. J. Web Semant. 2019, 58, 100514. [Google Scholar] [CrossRef]
  19. Arocena, J.; Lozano, J.; Quartulli, M.; Olaizola, I.; Bermudez, J. Linked open data for raster and vector geospatial information processing. In Proceedings of the 2015 IEEE International Geoscience and Remote Sensing Symposium (IGARSS), Milan, Italy, 26–31 July 2015; pp. 5023–5026. [Google Scholar]
  20. Homburg, T.; Prudhomme, C.; Würriehausen, F.; Karmacharya, A.; Boochs, F.; Roxin, A.; Cruz, C. Interpreting Heterogeneous Geospatial Data Using Semantic Web Technologies. In Proceedings of the Computational Science and Its Applications—ICCSA 2016, Beijing, China, 5–8 July 2016; Gervasi, O., Murgante, B., Misra, S., Rocha, A.M.A., Torre, C.M., Taniar, D., Apduhan, B.O., Stankova, E., Wang, S., Eds.; Springer International Publishing: Cham, Switzerland, 2016; pp. 240–255. [Google Scholar]
  21. Nishanbaev, I.; Champion, E.; Mcmeekin, D. A Survey of Geospatial Semantic Web for Cultural Heritage. Heritage 2019, 2, 1471–1498. [Google Scholar] [CrossRef] [Green Version]
  22. Ding, L.; Xiao, G.; Calvanese, D.; Meng, L. A Framework Uniting Ontology-Based Geodata Integration and Geovisual Analytics. ISPRS Int. J. Geo-Inf. 2020, 9, 474. [Google Scholar] [CrossRef]
  23. Tran, B.H.; Aussenac-Gilles, N.; Comparot, C.; Trojahn, C. Semantic Integration of Raster Data for Earth Observation: An RDF Dataset of Territorial Unit Versions with their Land Cover. ISPRS Int. J. Geo-Inf. 2020, 9, 503. [Google Scholar] [CrossRef]
  24. Tran, B.; Aussenac-Gilles, N.; Comparot, C.; Trojahn, C. An Approach for Integrating Earth Observation, Change Detection and Contextual Data for Semantic Search. In Proceedings of the IEEE International Geoscience and Remote Sensing Symposium, IGARSS 2020, Waikoloa, HI, USA, 26 September–2 October 2020. [Google Scholar] [CrossRef]
  25. Dorne, J.; Aussenac-Gilles, N.; Comparot, C.; Trojahn, C.; Hugues, R. Giving meaning to unsupervised EO change detection rasters: A semantic-driven approach. In Proceedings of the BIGSPATIAL ’20: Proceedings of the 9th ACM SIGSPATIAL International Workshop on Analytics for Big Geospatial Data, BigSpatial@SIGSPATIAL 2020, Seattle, WA, USA, 3 November 2020; Chandola, V., Vatsavai, R.R., Shashidharan, A., Eds.; ACM: New York, NY, USA, 2020; pp. 1–10. [Google Scholar] [CrossRef]
  26. Dorne, J.; Aussenac-Gilles, N.; Comparot, C.; Hugues, R.; Trojahn, C. From EO Change Rasters to Knowledge Graphs: An approach Based on Regions of Interest. In Proceedings of the 4th International Workshop on Geospatial Linked Data (GeoLD 2021) Co-Located with the 18th Extended Semantic Web Conference (ESWC 2021) (GeoLD 2021@ESWC 2021), Crete, Greece, 6–10 June 2021; Yaman, B., Sherif, M.A., Ngomo, A.C.N., Haller, A., Eds.; Beyza Yaman; Mohamed Ahmed Sherif; Axel-Cyrille Ngonga Ngomo; Armin Haller: Hersonissos, Greece, 2021; Volume 2977, pp. 76–79. [Google Scholar]
  27. Suárez-Figueroa, M.C.; Gómez-Pérez, A.; Fernández-López, M. The NeOn Methodology for Ontology Engineering. In Ontology Engineering in a Networked World; Suárez-Figueroa, M.C., Gómez-Pérez, A., Motta, E., Gangemi, A., Eds.; Springer: Berlin/Heidelberg, Germany, 2012; pp. 9–34. [Google Scholar]
  28. Suárez-Figueroa, M.C.; Gómez-Pérez, A.; Fernández-López, M. The NeOn Methodology framework: A scenario-based methodology for ontology development. Appl. Ontol. 2015, 10, 107–145. [Google Scholar] [CrossRef]
  29. Arenas, H.; Aussenac-Gilles, N.; Comparot, C.; Trojahn, C. Semantic Integration of Geospatial Data from Earth Observations. In Proceedings of the 20th International Conference on Knowledge Engineering and Knowledge Management, Bologna, Italy, 19–23 November 2016; pp. 97–100. [Google Scholar]
  30. Dumitru, C.O.; Schwarz, G.; Pulak-Siwiec, A.; Kulawik, B.; Lorenzo, J.; Datcu, M. Earth Observation Data Mining: A Use Case for Forest Monitoring. In Proceedings of the IGARSS 2019—2019 IEEE International Geoscience and Remote Sensing Symposium, Yokohama, Japan, 28 July–2 August 2019; pp. 5359–5362. [Google Scholar]
  31. Patroumpas, K.; Giannopoulos, G.; Athanasiou, S. Towards GeoSpatial Semantic Data Management: Strengths, Weaknesses, and Challenges Ahead. In Proceedings of the 22nd ACM SIGSPATIAL International Conference on Advances in Geographic Information Systems, Dallas, TX, USA, 4–7 November 2014; ACM: New York, NY, USA, 2014; pp. 301–310. [Google Scholar]
  32. Ioannidis, T.; Garbis, G.; Kyzirakos, K.; Bereta, K.; Koubarakis, M. Evaluating Geospatial RDF stores Using the Benchmark Geographica 2. J. Data Semant. 2021, 10, 189–228. [Google Scholar] [CrossRef]
  33. Quoc, H.N.M.; Serrano, M.; Mau, H.N.; Breslin, J.G.; Le-Phuoc, D. A Performance Study of RDF Stores for Linked Sensor Data; IOS Press: Amsterdam, The Netherland, 2019. [Google Scholar]
  34. Car, N.J.; Bastrakova, I. LDR: A 2nd-gen, National GeoLD System. In Proceedings of the 4th International Workshop on Geospatial Linked Data, GeoLD 2021, Virtual Event, 6–10 June 2021; pp. 42–50. [Google Scholar]
Figure 1. Territorial Observation Model (tom) representing property values of territories calculated from EO rasters.
Ijgi 11 00149 g001
Figure 2. Sentinel image metadata (eom) that relies on the tile concept to gather descriptions of images having the same footprint.
Ijgi 11 00149 g002
Figure 3. EO analysis model (eoam) providing information about the results of raster (e.g., Sentinel images) analyses.
Ijgi 11 00149 g003
Figure 4. Overall architecture of the proposed approach.
Ijgi 11 00149 g004
Figure 5. Example of feature mask (15: vineyard, 13: grassland).
Ijgi 11 00149 g005
Figure 6. Semantic search interface—application on the vineyard use case (available on melodi.irit.fr/semantic-search/), accessed date: 23 December 2021.
Ijgi 11 00149 g006
Figure 7. Analysis on the vineyards during the period 19–29 April 2017. (Left): Detected change level. (Right): NDVI degradation.
Ijgi 11 00149 g007
Figure 8. Analysis on urban expansion (2017–2020) at the village level. (Left) (Sentinel images). (Right): village INSEE code, change, and NDVI indicators.
Ijgi 11 00149 g008
Publisher’s Note: MDPI stays neutral with regard to jurisdictional claims in published maps and institutional affiliations.

