
Interpretation of Map Symbols in the Context of Gamers’ Age and Experience


Department of Cartography and Geomatics, Faculty of Geographical and Geological Sciences, Adam Mickiewicz University, 61-712 Poznań, Poland
*
Author to whom correspondence should be addressed.
ISPRS Int. J. Geo-Inf. 2022, 11(2), 150; https://0-doi-org.brum.beds.ac.uk/10.3390/ijgi11020150
Submission received: 16 December 2021
/
Revised: 30 January 2022
/
Accepted: 20 February 2022
/
Published: 21 February 2022
(This article belongs to the Special Issue Cartography and Geomedia)
Abstract
:In this article researchers examined the differences that may characterise selected groups of gamers with regard to age and time spent on playing a survival game, Valheim, confronted with their interpretation of map symbols used in the game. The Valheim video game, which was released in early 2021, is a survival game set in a gameplay world inspired by Norse mythology. The authors of the article noted that the age factor and gaming experience may have different results in terms of the interpretation of cartographic products. The obtained data came from an online questionnaire. In the statistical analysis the authors employed the Pearson’s chi-squared test and the Benjamini–Hochberg procedure to find statistically significant differences between selected groups of respondents and their subjective interpretation of map symbols. Statistical analysis showed several differences and interesting relationships in the interpretation of symbols in relation to the age of the players and in the interpretation of symbols in relation to the time spent in the game. For future research, it is worth continuing towards researching new video games with existing cartographic products in order to investigate how games and players influence the culture in which they participate.
1. Introduction
Video games are one of the most popular and common forms of entertainment every day. Most video games are spatial in nature, i.e., they present a number of phenomena related to each other by coherent spaces [1,2,3]. Game developers often provide in-game maps that help players navigate the virtual world [4,5]. Many games have more and more complex geographic areas and the need for easier understanding of the presented world requires improvement and adding newer and newer cartographic elements: mini-map, compass, arrows, world maps, cartographic symbols and others [6,7,8]. The inherent spatiality of video games allows the creation of maps in any video game genre. From maps depicting the game world (World of Warcraft), to interactive maps in computer games (Civilization series), to mobile games that support GPS (Pokémon GO), as well as using satellite maps (Zombies, Run!) that have interaction with the player at all time.
Video games constitute complex technological systems that combine numerous spatial, physical, and social issues. Geographers and cartographers are dealing with the topic of “cartography and games” [9,10,11,12] more and more often, describing the technical aspects of game and component production. The discussion about a constantly increasing impact of games on cartographic visualizations manifests itself through increasing popularity of virtual reality and augmented reality environments [13,14,15,16,17].
The problem of the evaluation of cartographic products is quite wide. Survey methods used in cartography appear in various forms: direct survey, internet survey, eye-tracking methods, GPS mobile device task, direct user observation in digital tasks [18,19,20,21]. When creating a survey, we must shift the emphasis to which population of participants we are targeting, which is limited by factors that are important for the presented purpose of the study, such as: age, gender, culture, country of origin, experience, factor confirming the purpose of the study or psychological motivations [22]. One of the most popular methods in cartography is the online survey, which allows you to collect data from a wide range of users and allows you to obtain subjective opinions [23,24]. In studies devoted to cartography, the number of respondents varies from 20 to 100 questionnaires concerning one version of the map [25,26,27], the number of which is proportionally greater depending on the number of versions of cartographic products [28,29].
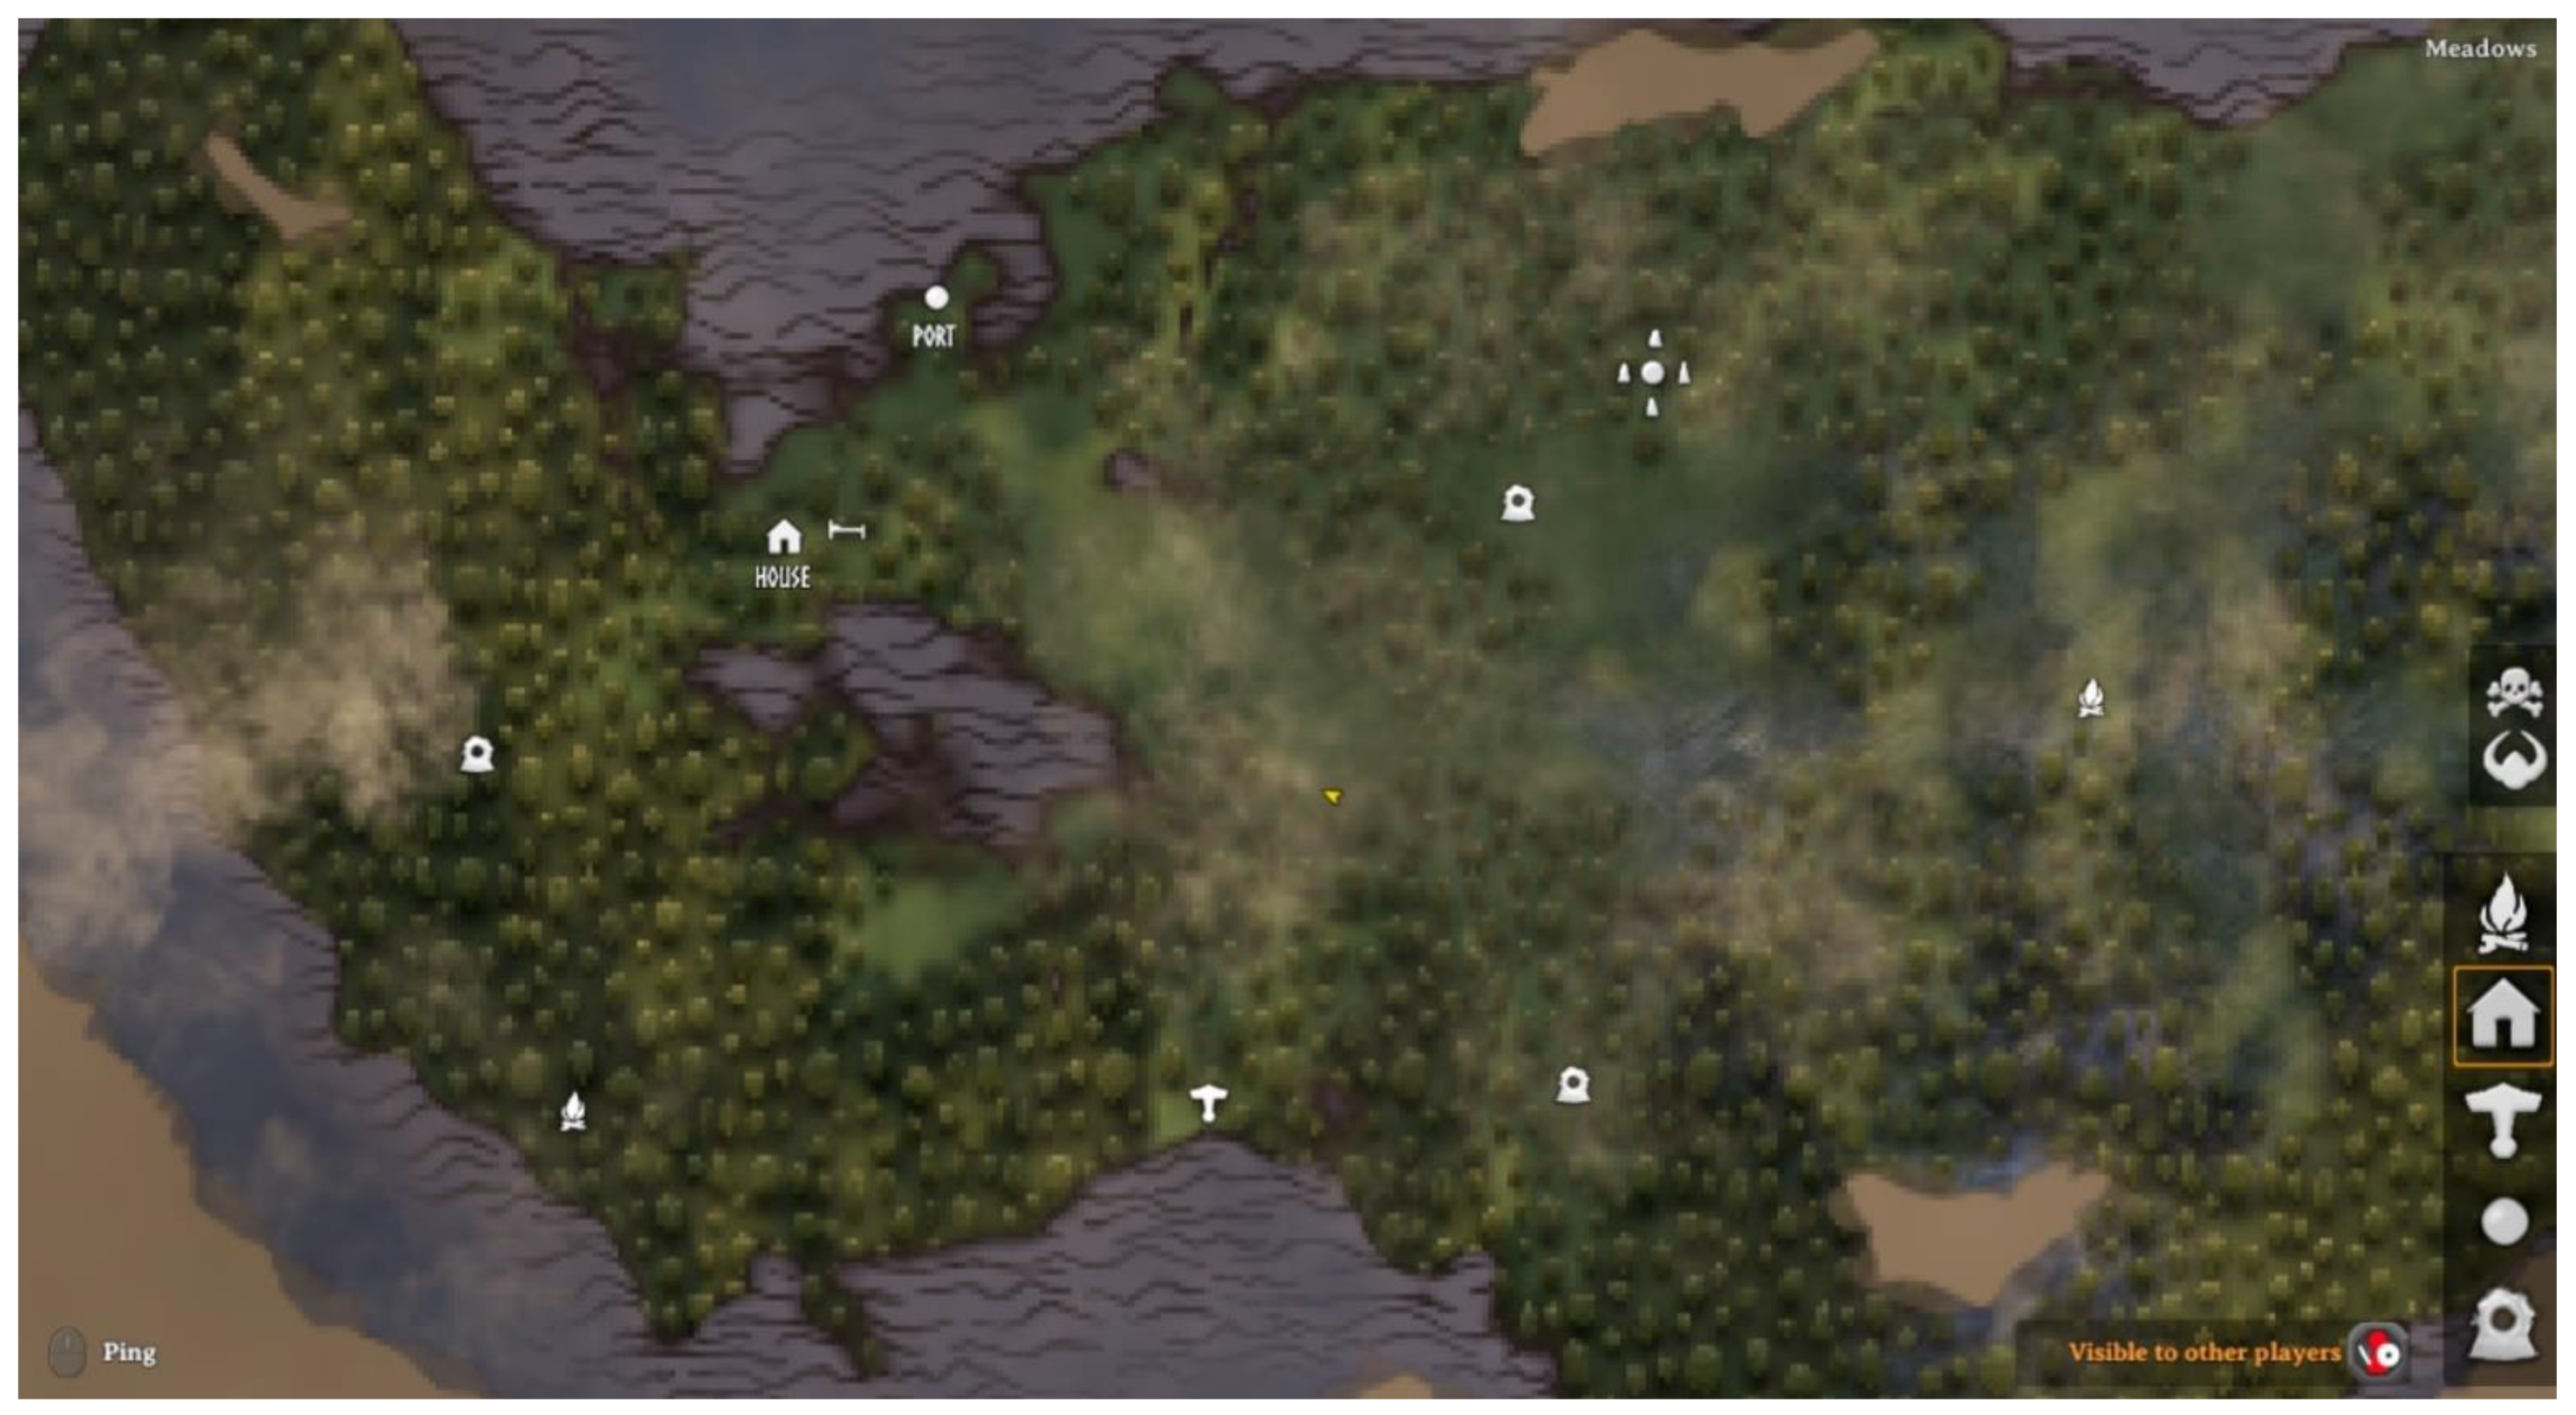
The space in video games is represented by map symbols that convey information using visual variables (Figure 1). Visual variables were introduced by Bertin [30] by identifying seven categories of variables, incl. shape or color. This classification was based on selectivity, i.e., the ability to distinguish one category while ignoring others. Graphical information, such as the shape and color of the symbol, and the context of use, can influence the users’ interpretation of the symbols. Keil et al. [31] noted that in many cases, the design of cartographic symbols is not based on the visualization of representative features of a given object, but on focusing on redefined design standards related to the function of the object.
Maps are an important integral element used in broadly understood geomedies [32]. Maps are often used in video games as a representation of a fictional geographical space, while the interpretation of cartographic symbols by various groups of users becomes an important problem [33]. The best recognizable are cartographic symbols that directly represent a specific object or refer to associations relating to the features of phenomena [34]. Another aspect studied in cartography is the experience of users in interpreting symbols on maps by experts or novices [35]. In the case of experts and novices, very large differences in the valorization of cartographic design are noted for the same visualization [36,37]. There are also differences in studies in which the length of time in which users use the application is important and they acquire the ability to use symbols and their functions [38]. In this research, we touched upon the importance of the length of experience in using cartographic symbols in one video game, which is important for the differences between first contact with the map and after longer use.
2. Research Goals and Questions
The data obtained through questionnaires are usually the nominal data. In this case, researchers can use a pool of nonparametric tests in the process of testing statistical hypotheses. Everything depends on what research objectives are, what researchers intend to achieve and what kind of variables and categories they want to juxtapose. In this article, the authors want to use the data from the questionnaire to examine the correlations in interpretations of map symbols from the “Valheim” video game. The authors looked for correlation or differences between independent groups of respondents (gamers) in the context of their age and time spent in the virtual game world. The authors concluded that the two research questions posed could help to obtain answers for understanding the interpretation of cartographic symbols:
- Is there any correlation between the age of gamers and their interpretation of symbols?
- Is there any correlation between the time spent on playing Valheim and the interpretation of symbols?
Questions about the age and time spent in a particular game are a universal factor in the questionnaire when it comes to video game literature. In the literature, the age of players is examined psychologically, how it affects psychosocial behavior among players and sets the boundary of life experiences that can be reflected in in-game behavior [39]. In contrast, time spent in a video game is often combined in psychology in research on mental health and social skills, as well as in cognitive research and interpretation of in-game phenomena that directly affect the player [40,41]. The authors, through the analysis and experience of scientific literature, concluded that these two factors will be the best reflection of the interpretation of cartographic symbols for various groups of respondents.
3. Material and Methods
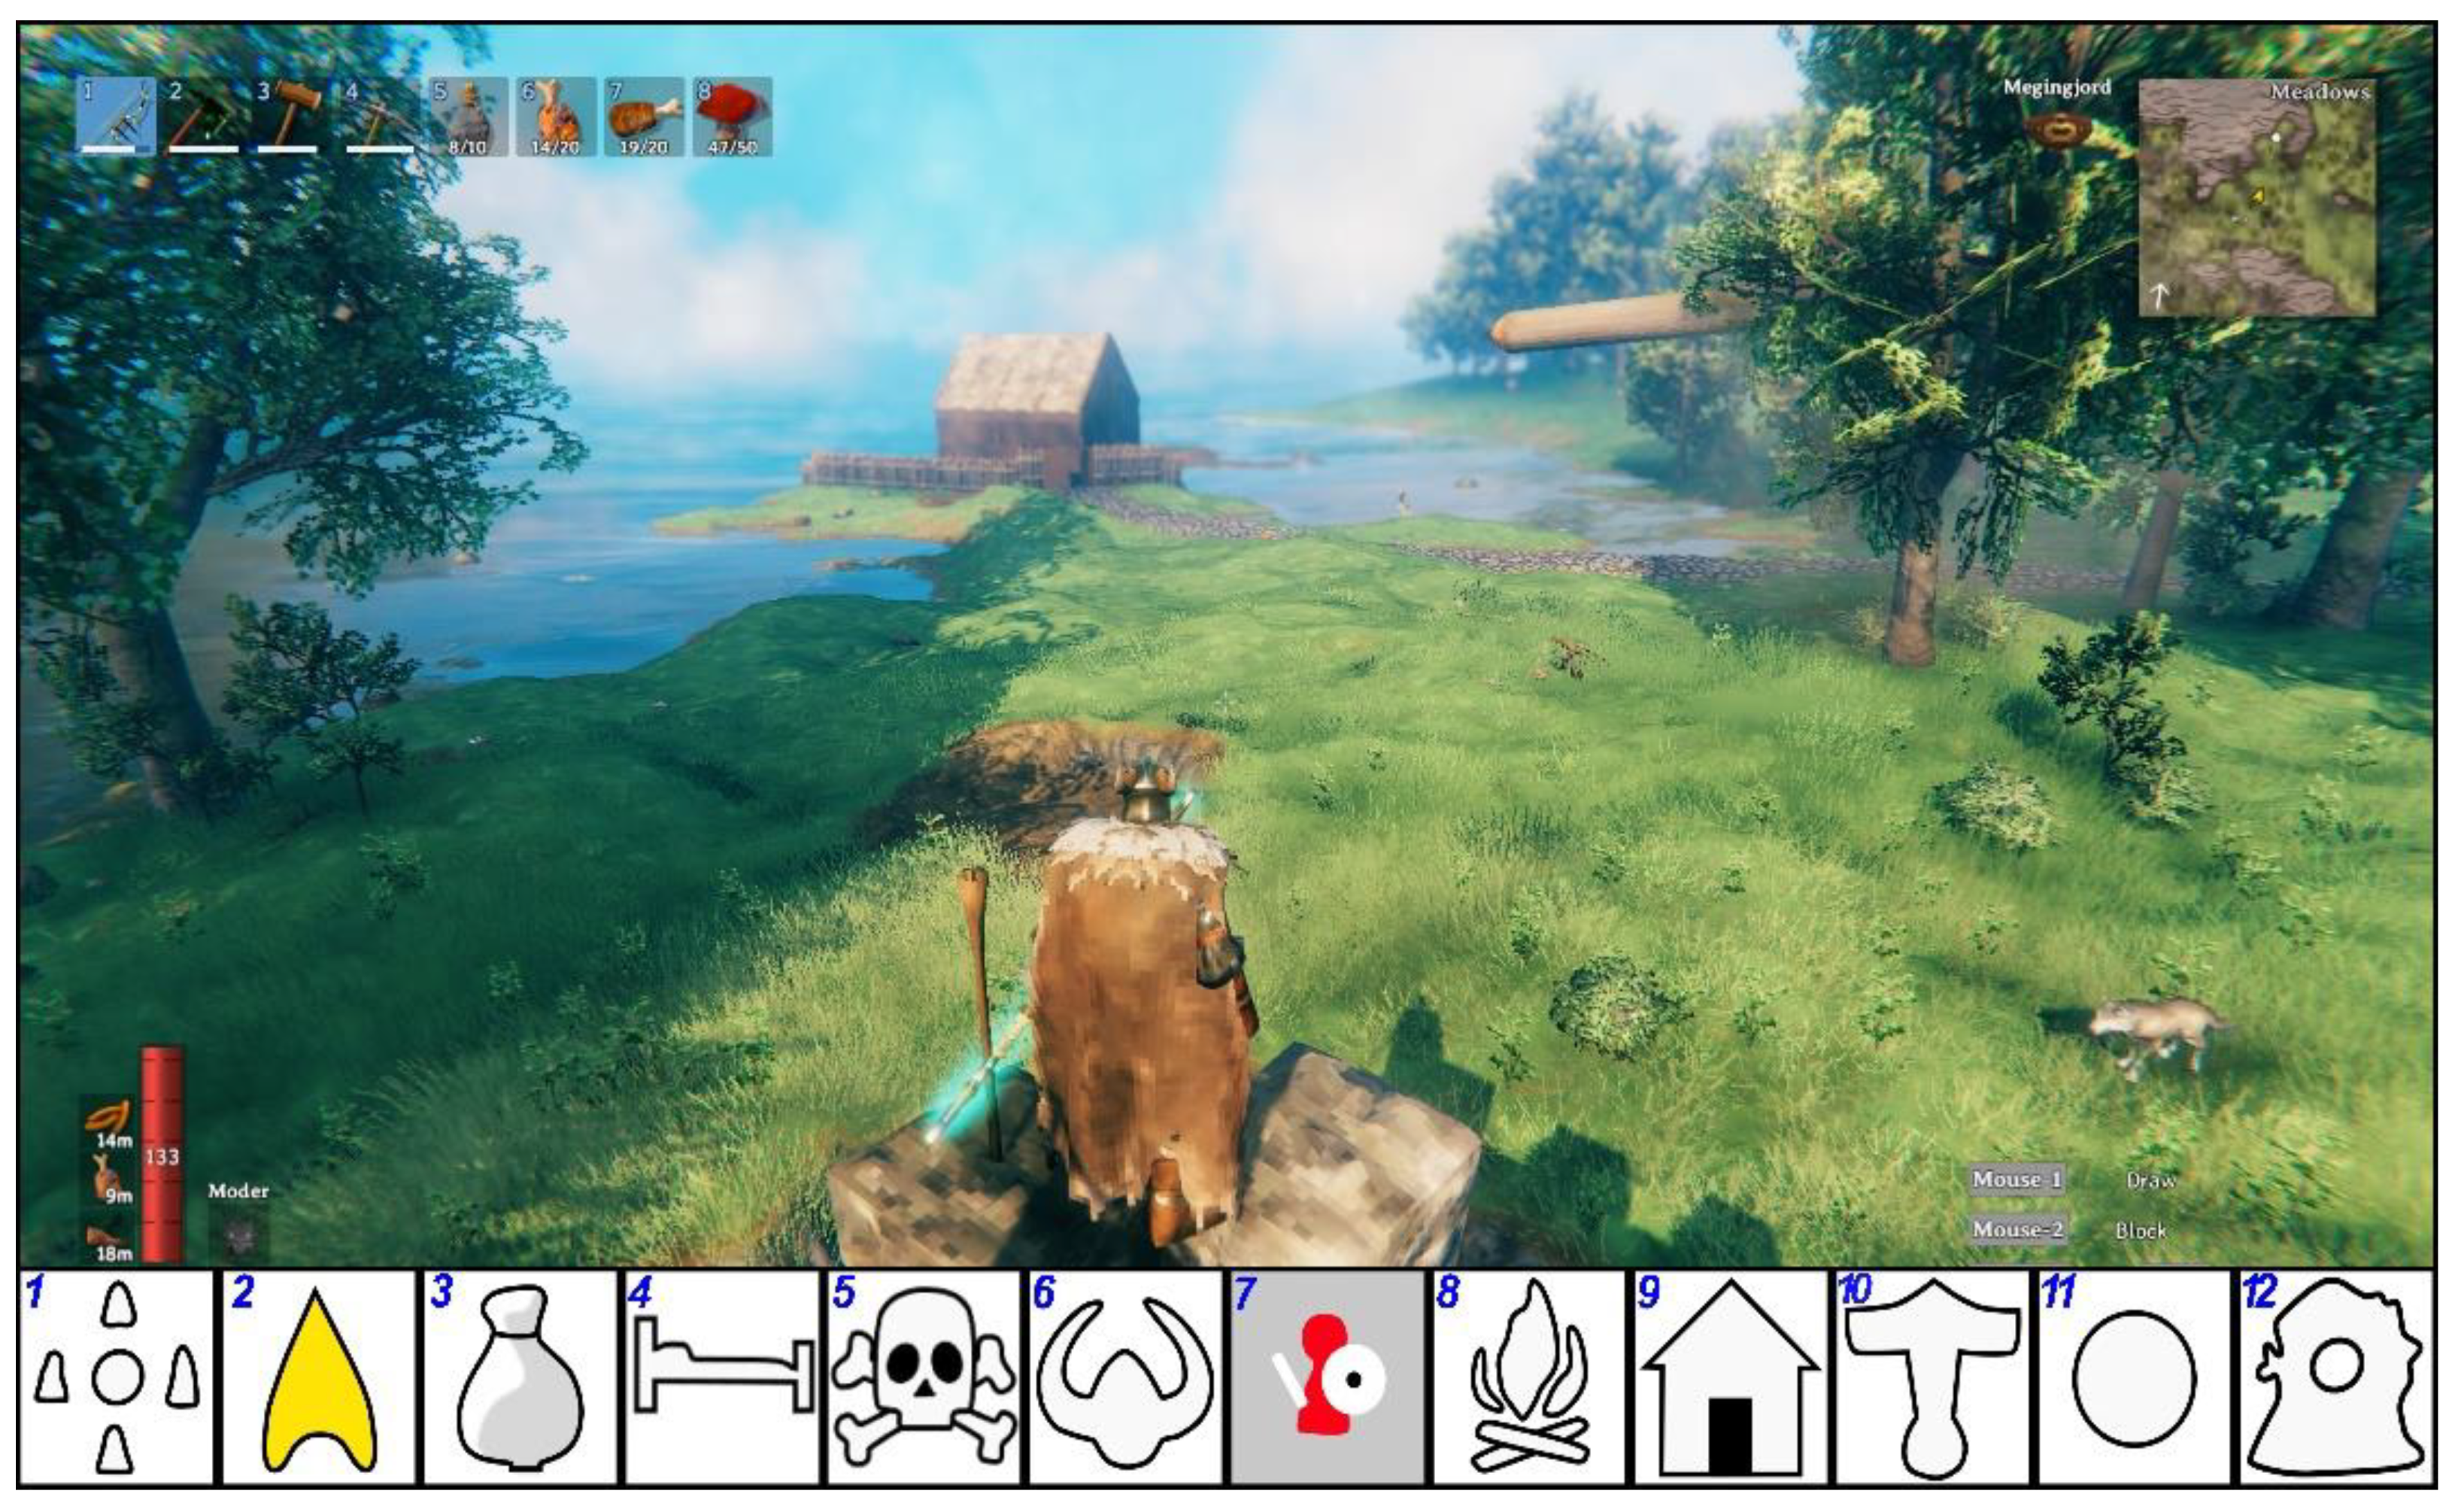
The Valheim computer game was created by Iron Gate studio, which became one of the most popular games in 2021. According to the Steam platform, at the beginning of February 2021, the game was downloaded by about 4 million people within 20 days [42]. It is a survival game set in a world based on Norse mythology with a sandbox concept. The game world has a very simple and understandable user interface that includes the map of the game’s world. The game map is a simple cartographic product that contains a designed sketch of the game world and 12 cartographic symbols occurring in various locations (Figure 2) [43].
Questionnaire data have been collected through the LimeSurvey platform [43,44,45] (Figure 3). A link to online survey was distributed internationally through gaming-related fora (Reddit, Gamespot, IGN, NeoGAF, Facebook groups). Data were collected between 19 and 31 March 2021. The number of respondents who participated in the survey was 1043. Out of 1043 respondents who filled out the entire survey, we choose only the 513 players of Valheim. According to temporal data, players had to spend 6 min on average for the survey (the maximum of 30 min and a minimum of 1 min) [43]. In this study, the opinions of gamers were taken into consideration. Respondents had full subjectivity of answers in the questionnaire; hence, to separate individual groups, the process of categorization was suggested. All the answers to the specified questions received their separate categories during the categorization. The authors developed a separate data categorization for each of the previously discussed symbols, due to their diversity and meaning. In the next stage, the number of responses from all the identified categories for each question was analyzed and it was determined that the category will be correct in the data analysis when the number of responses exceeds 1% of all responses in a particular group of respondents. This study does not address the problem of interpreting the symbols used in the game Valheim. This aspect was analyzed in the article [43].
As far as questionnaire data are concerned, the verification of hypotheses including qualitative variables takes place through nonparametric tests. The Pearson’s chi-squared test (χ2) is one of the nonparametric tests that are most frequently used in numerous research disciplines. The χ2 test may be used for examining the correlation between two variables. It was introduced by Karl Pearson and was an object of many discussions. In a series of articles, the χ2 test was analysed [46,47] and its problems were discussed [48,49]. The chi-square test has been applied in all research areas [50]. Its main uses are the following: goodness-of-fit [51,52,53], association/independence [54,55], homogeneity [56,57], classification [58,59,60,61,62], etc.
The authors of the study used the Pearson test in the context of the collected data from the article. It is commonly known that the Pearson’s chi-squared test belongs to the family of tests for which the following assumptions have been made [50,63,64]:
- The data are collected at random from the population;
- The size of the sample is large enough. The employment of the χ2 test with a research sample that is too small may lead to the unacceptable indicator of the type II error (adopting the null hypothesis, whereas it is, in fact, false) [65]. There is no arbitrarily established acceptable size of the sample, hence, the minimal value of the sample oscillates between 20 and 50 people;
- The value in individual cells is right when no more than 1/5 of the expected values are lower than 5 and there are no cells with the number zero [66].
W. G. Cochran is the source of the above rules [67] and, as Bolboacă et al. [50] write, they have been arbitrarily selected. When, out of the abovementioned assumptions, the third one is not fulfilled, the Yates’s correction for continuity is applied [68]. The Fisher’s exact test is an alternative when the Yates’s correction for continuity is unacceptable [69]. As Bolboacă et al. [50] highlight, the Fisher’s exact test turns out to be “the golden test” in the analysis of correlations whereas the Yates’s correction for continuity and the Mantel-Haenszel test may be used as alternative tests. It is worth emphasising that the Fisher’s exact test [70] is preferred when the data with the small-expected value are analysed.
The Pearson’s χ2 test, like other nonparametric tests, is not contingent upon the distribution of the examined set. Thus, it may be applied both for the normal distribution and for all other cases [65]. The χ2 test may be particularly useful in situations, in which two variables obtained by means of the questionnaire are measured in the nominal scale, and the results are presented in the matrix with the freely chosen number of verses and columns. The Pearson’s chi-square test is used mainly in studying correlations between nominal variables [65]. The variable is treated as nominal when its values represent categories, without any internal ranging, i.e., it is impossible to establish which case is larger, superior or more relevant than the other [71].
The chi-square test provides the information whether or not a given correlation occurs (a possibility of rejecting the null hypothesis); however, it fails to inform one about the significance of the indicated correlation. In the chi-square test, one compares the observed value with the expected value. Using the Fisher’s exact test helps one eliminate the failure to meet the third assumption of the χ2 test. To find significant differences between individual variables, one should apply a testing correction. In the context of the authors’ research, among the numerous corrections, the Benjamini–Hochberg treatment is the strongest. The correction demonstrates all the (statistically significant) differences and minimises the expected false positive rate among them [72].
4. Results
Statistical research has been conducted in the PQStat (v 1.8.0) software. The authors considered only the data concerning gamers that play Valheim to examine the differences in their interpretation of symbols included in the game. The differences will be studied between independent groups related to the age of respondents and the total time they had spent on playing the game before the research. Due to the fact that, as a part of statistical analyses that the authors carry out, they were dealing with the data coming from the questionnaire and they meet the criterion of nominal data, the authors selected the Pearson’s chi-square test to identify statistically significant differences in symbol interpretations. For all the analysed data, PQStat failed to show that the Cochran’s theorem (third assumption of the test) [66] was met; hence, the Fisher’s exact test was additionally performed [50,70]. To be able to specify significant differences between groups, the Benjamini–Hochberg procedure was implemented [72].
4.1. Age and Symbol Interpretation
The question about age is one of the most frequently asked questions in questionnaires [73]. It is also a way to verify whether or not respondents are a homogenous group agewise [74]. In this case, respondents were asked to reveal their age directly. After the questionnaire data had been collected, the authors distinguished five age groups based on the published statistical data on the global sector of computer games [75,76]. Then, the results were grouped into age cohorts:
- More than 46 years old (8.8% of players);
- From 31–45 years old (38.4% of players);
- From 26–30 years old (28.4% of players);
- From 20–25 years old (19.1% of players);
- Less than 19 years old (3.9% of players);
- None (1.4% of players).
Each gamer was free not to give their age and seven people used that opportunity. The largest age group consisted of gamers aged 31–45, and the smallest one of those below 19. Based on the data, one can conclude that gamers that participated in the research do not create a homogenous group of respondents.
One of the crucial objectives of the article was to examine whether the age of gamers directly affected the interpretation of symbols in the game of Valheim (the research question). Significant results of the Pearson’s χ2 test allowed researchers to find two correlations (Table 1):
4.1.1. Age and the Interpretation of Symbol 4
For this comparison, the p-value of the Pearson’s chi-square test was 0.044737. The Cochran’s theorem was not met (the third assumption of the chi-square test) [66]; therefore, the Fisher’s exact test (p-value = 0.01999) was performed. As it turns out from previous studies, gamers (questionnaire respondents) interpreted the symbol in the following way [43]:
- Cat. 1—Bed/sleep—54%;
- Cat. 2—Current spawn point/save point—42.5%;
- Cat. 3—Main base/home—3.3%;
- Other—0.2%.
The Benjamin–Hochberg procedure demonstrated two significant differences for the interpretation of symbol 4 between categories 1 and 3 (p-value = 0.032695), as well as 2 and 3 (p-value = 0.032695) (Figure 4B).
As far as part A Figure 4 is concerned, the Benjamin–Hochberg procedure failed to show any statistically relevant results (p-value > 0.05) concerning the differences between categories of interpretation of symbol 4.
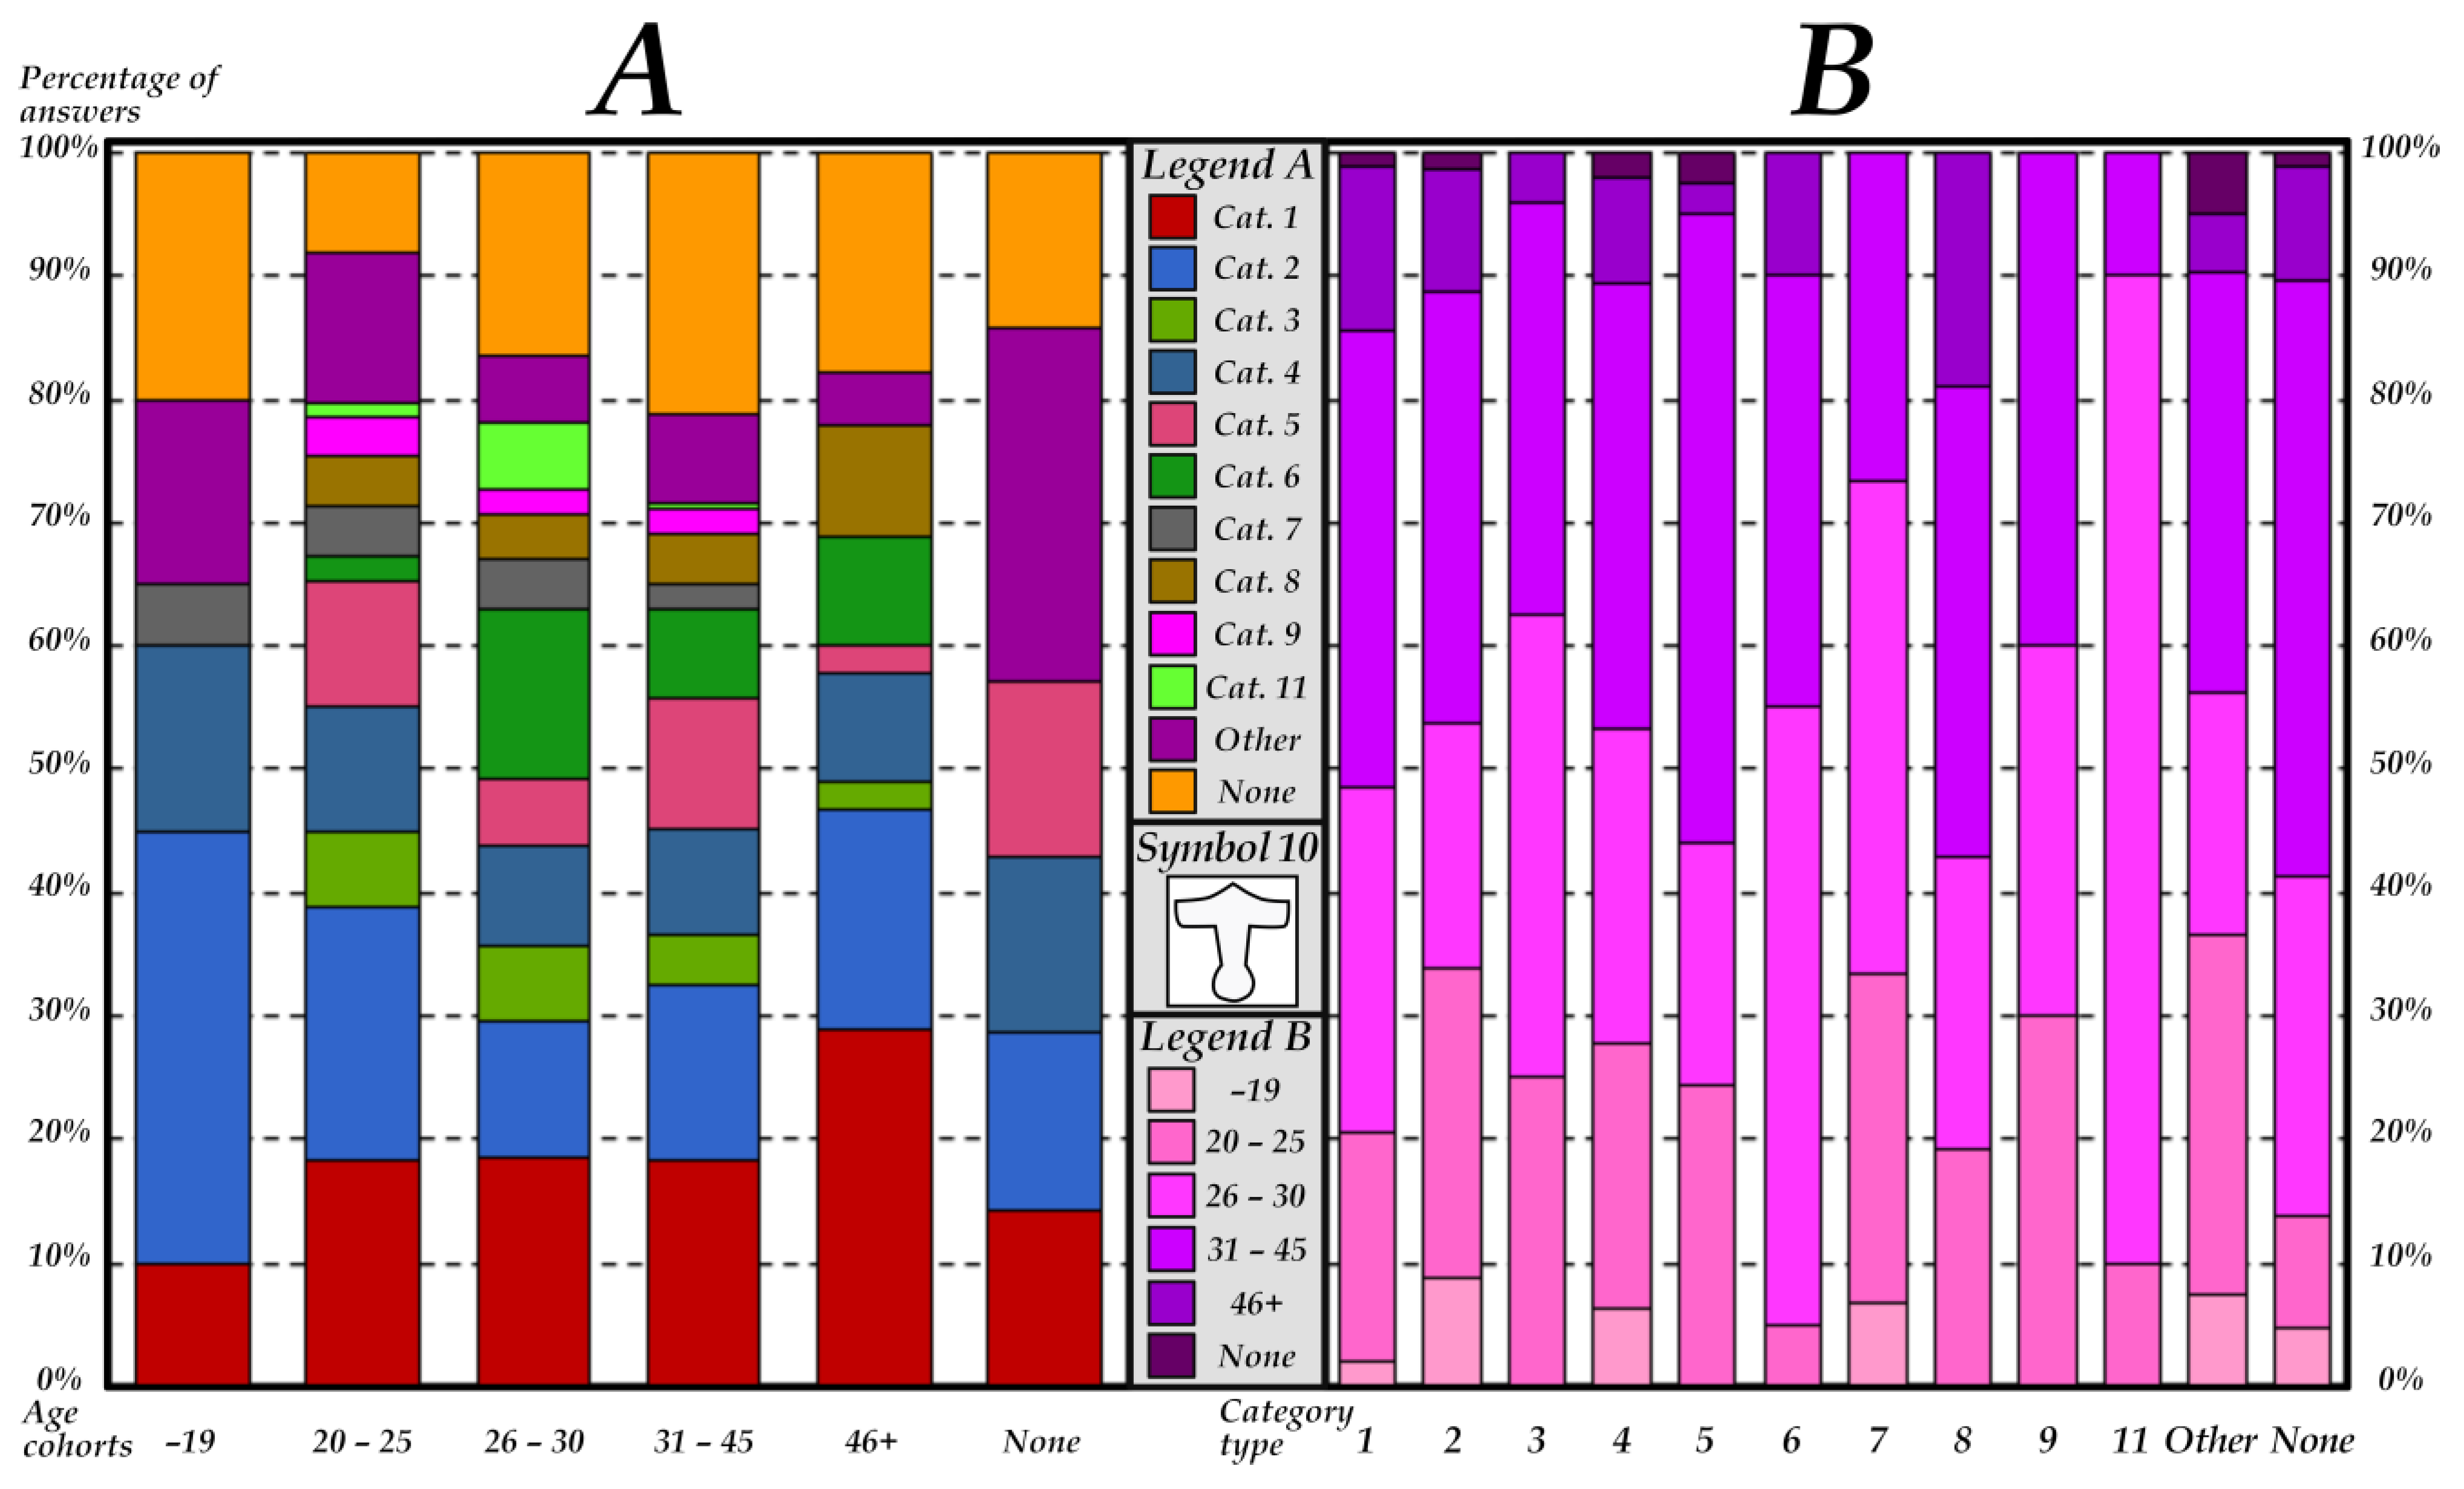
4.1.2. Age and Symbol 10 Interpretation
- Cat. 1—POI/waypoint—18.9%;
- Cat. 2—Dungeons/crypts/ruins—15.6%;
- Cat. 3—Altar/shrine/monument—4.7%;
- Cat. 4—Mining/ore/resources—9.2%;
- Cat. 5—Ship location/port/boat/anchor—8.0%;
- Cat. 6—Mjolnir—7.8%;
- Cat. 7—Hammer/forge/anvil/weapon Smith/armor—2.9%;
- Cat. 8—Enemy camp/enemy/monsters—4.1%;
- Cat. 9—Fight/challenge/combat/quest—1.9%;
- Cat. 11—Celtic scroll/Maypole/Norse myth—1.9%;
- None—17.0%;
- Other—8%.
The Pearson’s chi-square test confirms that the comparison made between age groups and symbol 10 interpretation groups is statistically significant (p-value = 0.035139; the Cochran’s theorem is not met). Unfortunately, the Fisher’s exact test fails to show a statistically significant result. Analysing the results of the Benjamin–Hochberg procedure, researchers noticed that it demonstrated statistically significant results, indicating differences between category 6 and category 2 (p-value = 0.048093) and Other (p-value = 0.048093) (Figure 5B). As far as part A Figure 5 is concerned, the Benjamini–Hochberg procedure demonstrated no statistically significant differences.
4.2. Time Spent on Playing the Game of Valheim and Symbol Interpretation
Time spent on playing a given game/each game objectively demonstrates the gamer’s commitment. It may directly translate into the correct understanding of some aspects of the game. In some video games the time needed for a single game is limited, e.g. a single game in the League of Legends takes between 25:02 to 32:30 min in the 5 vs. 5 mode on Summoner Rifts [77]. The gamer may play many games, but it is difficult to quit a certain time scheme in which certain amount of time is necessary to complete a single game. It looks different for survival games, such as the game analysed in the research, Valheim. In such games the time that the gamer may devote to a single game is unlimited. As long hours of playing the game go by, the gamer discovers new places or new mechanics of the game that was difficult to spot at the beginning. Therefore, the observation whether there are statistically significant differences between the time spent on playing Valheim and the interpretation of map symbols used in the game is a significant aspect of this article. Like for the age groups, the authors divided gamers into several groups with regard to time spent on playing the game. Considering the data that come from independent websites [78,79], which analysed the time spent in the game of Valheim based on time data from the Steam platform, the authors determined the following five groups in terms of the time spent on playing the game:
- 1—less than 30 h (86.0% gamers);
- 2—30–60 h (15.0% gamers);
- 3—60–90 h (21.8% gamers);
- 4—90–120 h (16.2% gamers);
- 5—120 and more hours (38.4% gamers).
Based on the statistical analyses carried out, researchers managed to achieve one statistically significant results of the Pearson’s chi-square test and one statistically significant difference of the Benjamini–Hochberg procedure (Table 2):
4.2.1. Time Spent on Playing the Game and Symbol 3 Interpretation
The statistically significant result of the Pearson’s chi-square test (p-value < 0.000001) was achieved for the comparison of groups of gamers divided according to the time spent on playing Valheim and symbol 3 interpretation (the Cochran’s theorem unfulfilled: lack of statistical significance for the Fisher’s exact test). The symbol 3 itself was interpreted by gamers in the following way:
- Cat. 1—Trader/Merchant—80.7%;
- Cat. 2—Loot/Bag of goods—8%;
- Cat. 3—Coin purse/Money—5.3%;
- Other—4.9%;
- None—1.2%.
The Benjamini–Hochberg procedure confirmed significant differences in interpretations of symbol 3 by groups of gamers selected in terms of the time they had spent on playing Valheim between category 2 and 1 (p-value < 0.000001), 3 (p-value = 0.000211) and Other (p-value = 0.020922) (Figure 6B). In the juxtaposition of the group of gamers (time spent on playing the game) with the category of symbol 3 interpretation the Benjamin–Hochberg procedure confirmed four differences between the <30 h of playing group and other groups. For all the differences statistical significance (p-value) was <0.00001.
4.2.2. Time Spent on Playing and Symbol 4 Interpretation
For groups selected on the basis of the time spent on playing Valheim, the Pearson’s χ2 test failed to achieve a statistically significant result for symbol 4 (p-value > 0.05; the Cochran’s theorem unfulfilled) but the Fisher’s exact test had a significant result (p-value = 0.019258). Unfortunately, the Benjamini–Hochberg’s multiple testing correction showed no differences, either for groups (time spent on playing the game) or the symbol 4 interpretation category.
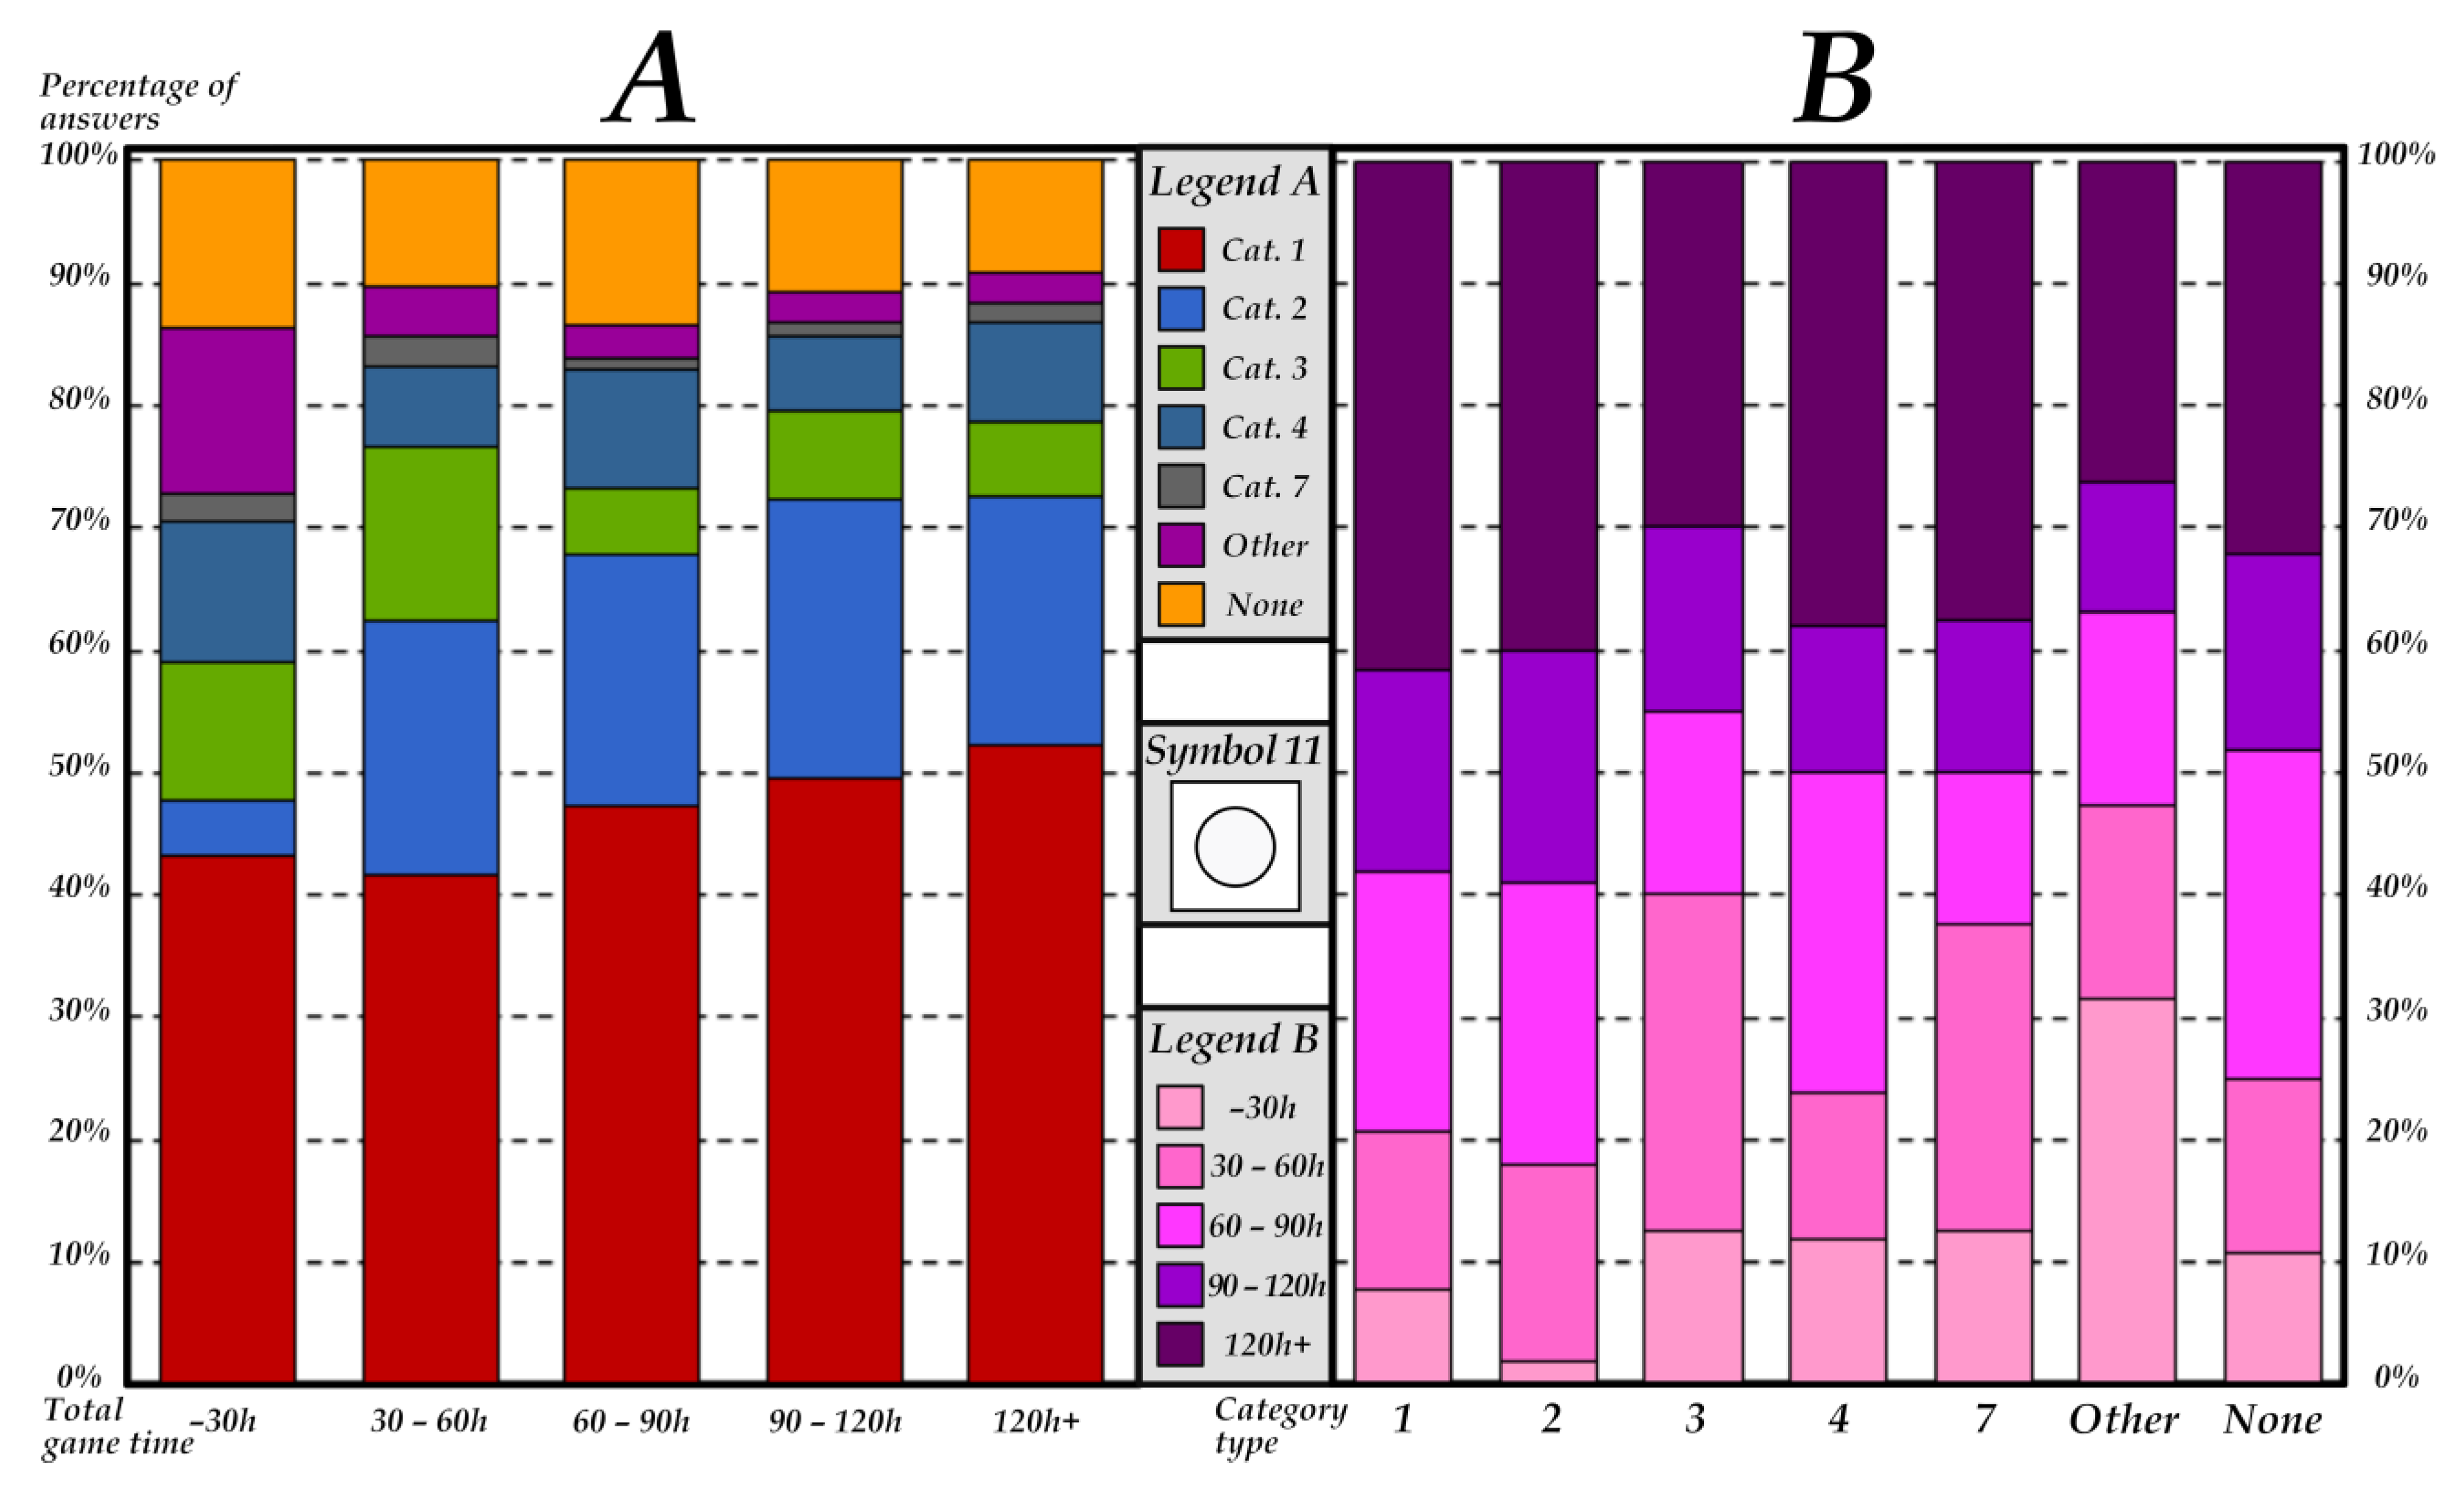
4.2.3. Time Spent on Playing the Game and Symbol 11 Interpretation
Symbol 11, presenting a black circle filled with the white colour, is the most universal map symbol in the game of Valheim, due to the fact that there is no graphic or color relationship with any of the places in the game. Each player could mark each place by distinguishing them with a signature. It was interpreted by gamers in the following way:
- Cat. 1—POI/waypoint—48.3%;
- Cat. 2—Resources/veins/berries—19.5%;
- Cat. 3—Interesting places/checkpoints/reference points—7.8%;
- Cat. 4—Dot/cicrle/pin/ball—8.2%;
- Cat. 7—Dungeon/crypt/tomb/cave/tunnel—1.6%;
- None—10.9%;
- Other—3.7%.
Even though it failed to achieve statistically significant results in the Pearson’s χ2 test (unfulfilled Cochran’s theorem) and in the Fisher’s exact test (p-value > 0.05), the Benjamini–Hochberg procedure was conducted, providing two significant differences. One of them occurred between the <30 h and 120 h+ hour of gaming groups (time spent on gaming) (p-value = 0.037632) (Figure 7A) and the other one between category 2 of the symbol 11′s interpretation and the group Other (p-value = 0.038049) (Figure 7B).
5. Discussion and Conclusions
The aim of the presented research was to investigate the correlations that can characterize the interpretations of individual cartographic symbols used in the game “Valheim” in the context of the age of the players and the time spent in the virtual world. In addition, the authors also asked two research questions. The research is based on the obtained survey data, applied statistical methods and developed conclusions in the context of cartography, which were obtained on the basis of the analysis of cartographic symbols in games, taking into account two parameters of the players (age and time spent in the game).
In the context of symbol 3, analysing Figure 4B, one can conclude that the fundamental difference between categories 3, as well as 1 and 2, lies in a significant disproportion between the younger and the older gamers. The younger gamers (the -19 and the 20–25 group) to the greater extent associated the symbol with main base/home, compared to the older gamers (26–30 and 31–45). On the other hand, older gamers had a greater tendency to interpret symbol 4 as bed/sleep or current spawn point/save point. It constitutes a significant difference in the interpretation of the symbol because the age groups 26–30 and 31–45 associated the symbol mostly with the function that the bed fulfils in the game, whereas groups -19 and 20–25 with the actual position in the game (in the game the bed needs to be roofed; therefore, it may be also easily associated with the constructed house or even the main headquarters of the gamer). It is worth highlighting that all the Other answers were added by gamers from the group aged 31–45.
In the juxtaposition of age groups and symbol 10 interpretation it may be observed that category 6 of the 26–30 age group has a greater contribution than of the 20–25 age group, and that there is neither -19 nor None group there (Figure 5B). What it directly means is that the youngest gamers (aged -19 and 20–25) failed to interpret symbol 10 as Mjolnir (Mjolnir is symbolically represented as a reversed symbol 10). It is possible, then, that the majority of younger respondents are not interested in Norse mythology. Additionally, the movie saga about Thor and his hammer Mjolnir were created in 2011 so the age groups analysed were at a very young age.
As far as Figure 6 symbol 3 is concerned, for some gamers it may actually be very distant from the starting point in the game; therefore, it frequently happens that many hours of playing the game are necessary to be able to reach that symbol on the map. Symbol 3, representing a bag (money) in the game of Valheim, denotes the location of the only NPC in the game and may occur in multiple places at the same time. Some gamers may be extremely lucky and encounter this symbol on their initial island or during their first travel but the results of our research related to the interpretation of symbol 3 prove clearly that the gamers that played less (below 30 h), constitute the greatest percentage of those who interpreted the symbol as category 2 (Loot/Bag of goods) (Figure 6B). Those gamers interpreted the symbol literally. Their answers differ significantly from interpretation 1, 3 and Other, as well as from other groups selected on the basis of the time spent on playing the game (Figure 6A). Category 1 refers directly to the function that NPC performs in the game, whereas category 3 may be strongly associated with the fact that in the location of symbol 3 the gamer may only spend the jewels and gold that they have gained. A small percentage of the <30 h and 30–60 h groups in the interpretation categories 1 and 3 corroborates the statement that gamers need a lot of time to discover that symbol in the game.
When groups (time spent on playing the game) and symbol 11 interpretations were juxtaposed, researchers noticed that the cases observed were characterized by the larger percentage of the Other group for gamers with the shortest gaming experience (<30 h) and by the smaller percentage of interpretation of number 2 symbol 11 (particularly in relation to gamers who had the longest gaming experience—120 h). The difference may be caused by the fact that gamers, who had spent more time playing the game, marked all the places they had visited or planned to visit again and associated them directly with things like resources, veins, and berries. The gamers with the shortest gaming experience (<30 h) came up with so many interpretations (which is related to the universality of the symbol) that those interpretations failed to be classified as one unique category.
The first research question asked in the introduction of the article: is there any correlation between the age of gamers and their interpretation of symbols? To answer, one needs to conclude on the basis of statistical analyses that, indeed, there is a correlation, and it is corroborated by two verified cases. Both cases were related to symbol 4 and 10. As far as symbol 4 is concerned, the 26–30 and 31–45 age groups interpreted the symbol, mostly associating it with the function it performs in the game, whereas the -19 and 20–25 age groups interpreted the symbol as the actual ranking in the game. For symbol 10, the youngest gamers (-19 and 20–25) failed to interpret the symbol as Mjolnir (Mjolnir is symbolically represented as a reversed symbol 10).
The second research question was related to the correlation between the time spent on playing the game of Valheim and the interpretation of symbols. In the comparison of these two groups of respondents the authors achieved significant results of statistical tests related to symbol 3. The results of the research leave no doubts: the gamers that had played less (below 30 h) constitute the largest percentage in the interpretation of the symbol as category 2 (loot/bag of goods) (Figure 6B). Those gamers interpreted the symbol literally. A small percentage of the <30 h and 30–60 h groups in the category of interpretation 1 and 3 corroborates the assumption that gamers need a lot of time to be able to discover that symbol during the game.
The methods applied (the Pearson’s chi-square test, the Fisher’s exact test, the Benjamini–Hochberg procedure) fulfilled their task. For the questionnaire data (nominal data), the employment of the nonparametric test was obligatory. In the analyses presented, the authors confronted the data about symbol interpretation with the data related to the age and time spent on playing that are usually used solely for characterizing the group of respondents. The authors also emphasise that the data have not been selected at random because they intended to confront the data with symbol interpretation, showing both the gamers’ commitment (time spent on playing the game) regardless of their age (age of gamers). The map symbols that occur in video games with specific graphic features also play a significant part in multimedia cartography [80], and the results obtained in the research may be taken into consideration in the process of map symbol design in geomedia [33].
The authors would like to point out that the obtained statistically significant results concern only three symbols (two symbols for the age and one symbol for the time spent in the game). It is not a substantial majority for the realized set of 12 symbols. Therefore, it is worth noting that the correlation between the age of the players and the time spent in the game, and the interpretations of symbols exists for individual symbols, not for the entire set. As a consequence, a question arises for subsequent research and the possibility of checking subsequent game titles and trying to find a title in which such dependencies exist for a larger number of symbols.
The procedure of verification of statistical hypotheses requires a set of specific skills, such as selectivity and the employment of suitable statistical tools, from the researcher. To a large extent, such skills decide upon the reliability of the results obtained and correctness of their interpretation. From the researcher’s point of view, it is interesting to discover correlations between the data/variables, e.g., similarities and differences. In this article, the authors verified and drew interesting conclusions on the correlation between the interpretation of symbols from the game of Valheim and the time spent on playing this game, as well as the age of gamers.
Along with new video games being launched, the authors are going to undertake new studies related to map symbols that appear in them. Video games are perceived as products of culture [81]; hence, the authors would like to develop their studies in this direction as games allow one to visualise how gamers influence and shape the culture they participate in [82], with culture being reproduced by symbols and elements presented, distributed, taught, and perpetuated in video games [83].
Author Contributions
Conceptualization, Tymoteusz Horbiński and Krzysztof Zagata; methodology, Tymoteusz Horbiński; formal analysis, Tymoteusz Horbiński and Krzysztof Zagata; resources, Tymoteusz Horbiński and Krzysztof Zagata; writing—original draft preparation, Tymoteusz Horbiński and Krzysztof Zagata; writing—review and editing, Tymoteusz Horbiński All authors have read and agreed to the published version of the manuscript.
Funding
This research received no external funding.
Institutional Review Board Statement
Not applicable.
Informed Consent Statement
Not applicable.
Data Availability Statement
Not applicable.
Acknowledgments
This paper is the result of research on cartography in video games and statistical analysis carried out within statutory research in the Department of Cartography and Geomatics, Faculty of Geographical and Geological Sciences, Adam Mickiewicz University Poznań, Poland.
Conflicts of Interest
The authors declare no conflict of interest.
References
- Ash, J.; Gallacher, L.A. Cultural Geography and Videogames. Geogr. Compass 2011, 5, 351–368. [Google Scholar] [CrossRef] [Green Version]
- Álvarez, R.; Duarte, F. Spatial Design and Placemaking: Learning from Video Games. Space Cult. 2017, 21, 208–232. [Google Scholar] [CrossRef]
- Wolf, M. 3 Space in the Video Game. In The Medium of the Video Game; Wolf, M., Ed.; University of Texas Press: New York, NY, USA, 2021; pp. 51–76. [Google Scholar] [CrossRef]
- Chądzyńska, D.; Gotlib, D. Maps in video games—Range of applications. Pol. Cartogr. Rev. 2015, 47, 137–145. [Google Scholar] [CrossRef] [Green Version]
- Toups, Z.O.; Lalone, N.; Alharthi, S.A.; Sharma, H.N.; Webb, A.M. Making Maps Available for Play. ACM Trans. Comput. Interact. 2019, 26, 43. [Google Scholar] [CrossRef]
- Johanson, C.; Gutwin, C.; Mandryk, R.L. The Effects of Navigation Assistance on Spatial Learning and Performance in a 3D Game. In Proceedings of the Annual Symposium on Computer-Human Interaction in Play (CHI PLAY ‘17). Association for Computing Machinery, New York, NY, USA, 15–18 October 2017; pp. 341–353. [Google Scholar] [CrossRef]
- Peacocke, M.; Teather, R.J.; Carette, J.; MacKenzie, I.S.; McArthur, V. An empirical comparison of first-person shooter information displays: HUDs, diegetic displays, and spatial representations. Entertain. Comput. 2018, 26, 41–58. [Google Scholar] [CrossRef]
- Caroux, L.; Isbister, K. Influence of head-up displays’ characteristics on user experience in video games. Int. J. Hum. Comput. Stud. 2016, 87, 65–79. [Google Scholar] [CrossRef] [Green Version]
- Garfield, S. On the Map: Why the World Looks the Way It Does; Profile Books: London, UK, 2012. [Google Scholar]
- Coulton, P.; Huck, J.; Gradinar, A.; Salinas, L. Mapping the beach beneath the street: Digital cartography for the playable city. In Playable Cities. The City as Digital Playground; Nijholt, A., Ed.; Springer: Singapore, 2017; pp. 137–162. [Google Scholar]
- Edler, D.; Dickmann, F. The Impact of 1980s and 1990s Video Games on Multimedia Ca;rtography. Cartogr. Int. J. Geogr. Inf. Geovis. 2017, 52, 168–177. [Google Scholar] [CrossRef]
- Edler, D. Where Spatial Visualization Meets Landscape Research and “Pinballology”: Examples of Landscape Construction in Pinball Games. KN-J. Cartogr. Geogr. Inf. 2020, 70, 55–69. [Google Scholar] [CrossRef]
- Hruby, F.; Ressl, R.; Valle, G.D.L.B.D. Geovisualization with immersive virtual environments in theory and practice. Int. J. Digit. Earth 2018, 12, 123–136. [Google Scholar] [CrossRef] [Green Version]
- Büyüksalih, G.; Kan, T.; Özkan, G.E.; Meriç, M.; Isın, L.; Kersten, T.P. Preserving the Knowledge of the Past Through Virtual Visits: From 3D Laser Scanning to Virtual Reality Visualisation at the Istanbul Çatalca İnceğiz Caves. PFG–J. Photogramm. Remote Sens. Geoinf. Sci. 2020, 88, 133–146. [Google Scholar] [CrossRef]
- Keil, J.; Korte, A.; Ratmer, A.; Edler, D.; Dickmann, F. Augmented Reality (AR) and Spatial Cognition: Effects of Holographic Grids on Distance Estimation and Location Memory in a 3D Indoor Scenario. PFG–J. Photogramm. Remote Sens. Geoinf. Sci. 2020, 88, 165–172. [Google Scholar] [CrossRef]
- Walmsley, A.P.; Kersten, T.P. The Imperial Cathedral in Königslutter (Germany) as an Immersive Experience in Virtual Reality with Integrated 360° Panoramic Photography. Appl. Sci. 2020, 10, 1517. [Google Scholar] [CrossRef] [Green Version]
- Zagata, K.; Gulij, J.; Halik, Ł.; Medyńska-Gulij, B. Mini-Map for Gamers Who Walk and Teleport in a Virtual Stronghold. ISPRS Int. J. Geo-Inf. 2021, 10, 96. [Google Scholar] [CrossRef]
- Cybulski, P. Spatial distance and cartographic background complexity in graduated point symbol map-reading task. Cartogr. Geogr. Inf. Sci. 2020, 47, 244–260. [Google Scholar] [CrossRef]
- Popelka, S.; Brychtova, A. Eye-tracking Study on Different Perception of 2D and 3D Terrain Visualisation. Cartogr. J. 2013, 50, 240–246. [Google Scholar] [CrossRef]
- Czepkiewicz, M.; Jankowski, P.; Młodkowski, M. Geo-questionnaires in urban planning: Recruitment methods, participant engagement, and data quality. Cartogr. Geogr. Inf. Sci. 2016, 44, 551–567. [Google Scholar] [CrossRef]
- Kapenekakis, I.; Chorianopoulos, K. Citizen science for pedestrian cartography: Collection and moderation of walkable routes in cities through mobile gamification. Hum. Cent. Comput. Inf. Sci. 2017, 7, 111. [Google Scholar] [CrossRef] [Green Version]
- Slocum, T.A.; Blok, C.; Jian, B.; Koussoulakou, A.; Montello, D.R.; Fuhrmann, S. Cognitive and usability issues in geovisualization. Cartogr. Geogr. Inf. Sci. 2001, 28, 61–75. [Google Scholar] [CrossRef] [Green Version]
- Pirani, N.; Ricker, B.A.; Kraak, M.J. Feminist cartography and the United Nations Sustainable Development Goal on gender equality: Emotional responses to three thematic maps. Can. Geogr. Géographe Can. 2020, 64, 184–198. [Google Scholar] [CrossRef]
- Poplin, A. How user-friendly are online interactive maps? Survey based on experiments with heterogeneous users. Cartogr. Geogr. Inf. Sci. 2015, 42, 358–376. [Google Scholar] [CrossRef]
- Medyńska-Gulij, B.; Zagata, K. Experts and Gamers on Immersion into Reconstructed Strongholds. ISPRS Int. J. Geo-Inf. 2020, 9, 655. [Google Scholar] [CrossRef]
- Çöltekin, A.; Heil, B.; Garlandini, S.; Fabrikant, S.I. Evaluating the effectiveness of interactive map interface designs: A case study integrating usability metrics with eye-movement analysis. Cartogr. Geogr. Inf. Sci. 2009, 36, 5–17. [Google Scholar] [CrossRef]
- Golebiowska, I.; Opach, T.; Rød, J.K. Breaking the Eyes: How Do Users Get Started with a Coordinated and Multiple View Geovisualization Tool? Cartogr. J. 2020, 57, 235–248. [Google Scholar] [CrossRef] [Green Version]
- Halik, Ł.; Medyńska-Gulij, B. The Differentiation of Point Symbols using Selected Visual Variables in the Mobile Augmented Reality System. Cartogr. J. 2016, 54, 147–156. [Google Scholar] [CrossRef]
- Cybulski, P. Effectiveness of Memorizing an Animated Route—Comparing Satellite and Road Map Differences in the Eye-Tracking Study. ISPRS Int. J. Geo-Inf. 2021, 10, 159. [Google Scholar] [CrossRef]
- Bertin, J. Semiology of Graphics: Diagrams, Networks, Maps, Trans; Berg, W., Ed.; University of Wisconsin Press: Madison, WI, USA, 1983. [Google Scholar]
- Keil, J.; Edler, D.; Dickmann, F.; Kuchinke, L. Meaningfulness of landmark pictograms reduces visual salience and recognition performance. Appl. Ergon. 2018, 75, 214–220. [Google Scholar] [CrossRef]
- Medyńska-Gulij, B. Cartography and Geomedia; Wydawnictwo Naukowe PWN: Warszawa, Poland, 2021; p. 286. (In Polish) [Google Scholar]
- Medyńska-Gulij, B.; Tegeler, T.; Bauer, H.; Zagata, K.; Wielebski, Ł. Filming the Historical Geography: Story from the Realm of Maps in Regensburg. ISPRS Int. J. Geo-Inf. 2021, 10, 764. [Google Scholar] [CrossRef]
- MacEachren, A.M. How Maps Work: Representation, Visualization and Design; Guilford Press: New York, NY, USA, 1995. [Google Scholar]
- Halik, Ł. The analysis of selected point-symbol visual variables of the Augmented Reality system for smartphone-type mobile devices. Geod. Cartogr. 2012, 61, 19–30. [Google Scholar]
- Robinson, A.H.; Morrison, J.L.; Muehrecke, P.C.; Kimerling, A.J.; Guptil, S.C. Elements of Cartography, 6th ed.; Wiley: New York, NY, USA, 1995. [Google Scholar]
- Dent, B.D. Cartography: Thematic Map Design, 5th ed.; McGraw-Hill: Boston, MA, USA, 1999. [Google Scholar]
- Cybulski, P.; Horbiński, T. User experience in using graphical user interfaces of web maps. ISPRS Int. J. Geo. Inf. 2020, 9, 412. [Google Scholar] [CrossRef]
- Przybylski, A.K. Electronic Gaming and Psychosocial Adjustment. Pediatrics 2014, 134, e716–e722. [Google Scholar] [CrossRef] [Green Version]
- Kovess-Masfety, V.; Keyes, K.; Hamilton, A.; Hanson, G.; Bitfoi, A.; Golitz, D.; Koç, C.; Kuijpers, R.; Lesinskiene, S.; Mihova, Z.; et al. Is time spent playing video games associated with mental health, cognitive and social skills in young children? Soc. Psychiatry Psychiatr. Epidemiol. 2016, 51, 349–357. [Google Scholar] [CrossRef] [PubMed] [Green Version]
- Shen, C.; Williams, D. Unpacking Time Online: Connecting Internet and Massively Multiplayer Online Game Use with Psychosocial Well-Being. Commun. Res. 2010, 38, 123–149. [Google Scholar] [CrossRef] [Green Version]
- Available online: https://steamcommunity.com/games/892970/announcements/detail/3058478454611894476 (accessed on 12 February 2021).
- Horbiński, T.; Zagata, K. Map Symbols in Video Games: The Example of “Valheim”. KN-J. Cartogr. Geogr. Inf. 2021, 71, 269–283. [Google Scholar] [CrossRef]
- Cybulski, P.; Wielebski, Ł. Effectiveness of dynamic point symbols in quantitative mapping. Cartogr. J. 2019, 56, 146–160. [Google Scholar] [CrossRef]
- Horbiński, T.; Cybulski, P.; Medyńska-Gulij, B. Graphic Design and Button Placement for Mobile Map Applications. Cartogr. J. 2020, 57, 196–208. [Google Scholar] [CrossRef]
- Mirvaliev, M. The components of chi-squared statistics for goodness-of-fit tests. J. Math. Sci. 1987, 38, 2357–2363. [Google Scholar] [CrossRef]
- Plackett, R.L. Karl Pearson and the Chi-Squared Test. Int. Stat. Rev. 1983, 51, 59. [Google Scholar] [CrossRef]
- Baird, D. The fisher/pearson Chi-squared controversary: A turning point for inductive inference. Br. J. Philos. Sci. 1983, 34, 105–118. [Google Scholar] [CrossRef] [Green Version]
- Cochran, W.G. Some methods for strengthening the common chi-square tests. Biometrics 1954, 10, 417–451. [Google Scholar] [CrossRef]
- Bolboacă, S.D.; Jäntschi, L.; Sestraş, A.F.; Sestraş, R.E.; Pamfil, D.C. Pearson-Fisher Chi-Square Statistic Revisited. Information 2011, 2, 528–545. [Google Scholar] [CrossRef] [Green Version]
- Li, G.; Doss, H. Generalized pearson-fisher Chi-square goodness-of-fit tests, with applications to models with life history data. Ann. Stat. 1993, 21, 772–797. [Google Scholar] [CrossRef]
- Moore, D.S.; Stubblebinea, J.B. Chi-square tests for multivariate normality with application to common stock prices. Commun. Stat. Theory Methods 1981, 10, 713–738. [Google Scholar] [CrossRef]
- Joe, H.; Maydeu-Olivares, A. A general family of limited information goodness-of-fit statistics for multinomial data. Psychometrika 2010, 75, 393–419. [Google Scholar] [CrossRef]
- Nathan, G. On the asymptotic power of tests for independence in contingency tables from stratified samples. J. Am. Stat. Assoc. 1972, 67, 917–920. [Google Scholar] [CrossRef]
- O’Brien, P.C.; Fleming, T.H. A multiple testing procedure for clinical trials. Biometrics 1979, 35, 549–556. [Google Scholar] [CrossRef]
- Cox, M.K.; Key, C.H. Post hoc pair-wise comparisons for the Chi-square test of homogeneity of proportions. Key Educ. Psychol. Meas. 1993, 53, 951–962. [Google Scholar] [CrossRef]
- Pardo, L.; Martín, N. Omogeneity/heterogeneity hypotheses for standardized mortality ratios based on minimum power-divergence estimators. Biom. J. 2009, 51, 819–836. [Google Scholar] [CrossRef] [PubMed]
- Andrés, A.M.; Tejedor, I.H. Comments on ‘Tests for the homogeneity of two binomial proportions in extremely unbalanced 2 × 2 contingency tables’. Stat. Med. 2009, 28, 528–531. [Google Scholar]
- Baker, S.; Cousins, R.D. Clarification of the use of Chi-square and likelihood functions in fits to histograms. Nucl. Instrum. Methods Phys. Res. 1984, 221, 437–442. [Google Scholar] [CrossRef]
- Elmore, K.L. Alternatives to the Chi-Square Test for Evaluating Rank Histograms from Ensemble Forecasts. Weather Forecast. 2005, 20, 789–795. [Google Scholar] [CrossRef] [Green Version]
- Zhang, J.-T. Approximate and Asymptotic Distributions of Chi-Squared–Type Mixtures with Applications. J. Am. Stat. Assoc. 2005, 100, 273–285. [Google Scholar] [CrossRef]
- Gagunashvili, N.D. Chi-square tests for comparing weighted histograms. Nucl. Instrum. Methods Phys. Res. Sect. A 2010, 614, 287–296. [Google Scholar] [CrossRef] [Green Version]
- Agresti, A. Introduction to Categorical Data Analysis; John Wiley and Sons: New York, NY, USA, 1996; pp. 231–236. [Google Scholar]
- Levin, I.P. Relating Statistics and Experimental Design; Sage Publications: Thousand Oaks, CA, USA, 1999. [Google Scholar]
- Neyman, J.; Pearson, E.S. (Eds.) The Testing of Statistical Hypotheses in Relation to Probabilities a Priori; Cambridge University Press: Cambridge, UK, 1967; pp. 186–202. [Google Scholar]
- Rosner, B. Fundamentals of Biostatistics. Chapter 10. Chi-Square Goodness of Fit, 6th ed.; Thomson Learning Academic Resource Center: Duxbury, MA, USA, 2006; pp. 438–441. [Google Scholar]
- Cochran, W.G. The χ2 test of goodness of fit. Ann. Math. Stat. 1952, 25, 315–345. [Google Scholar] [CrossRef]
- Yates, F. Contingency table involving small numbers and the χ2 test. Suppl. J. R. Stat. Soc. 1934, 1, 217–235. [Google Scholar] [CrossRef]
- Fisher, R.A. The logic of inductive inference. J. R. Stat. Soc. 1935, 98, 39–54. [Google Scholar] [CrossRef] [Green Version]
- Scholz, F.W.; Stephens, M.A. K-sample anderson-darling tests. J. Am. Stat. Assoc. 1987, 82, 918–924. [Google Scholar]
- Słowińska, M. Wykorzystanie testu chi-kwadrat w badaniach preferencji żywieniowych konsumentów. Eng. Sci. Technol. 2019, 1, 24–38. [Google Scholar] [CrossRef]
- Benjamini, Y.; Hochberg, Y. Controlling the False Discovery Rate: A Practical and Powerful Approach to Multiple Testing. J. R. Stat. Soc. Ser. B 1995, 57, 289–300. [Google Scholar] [CrossRef]
- Healey, B.; Gendall, P. Asking the Age Question in Mail and Online Surveys. Int. J. Mark. Res. 2007, 50, 309–317. [Google Scholar] [CrossRef]
- Wielebski, Ł.; Medyńska-Gulij, B. Graphically supported evaluation of mapping techniques used in presenting spatial accessibility. Cartogr. Geogr. Inf. Sci. 2019, 46, 311–333. [Google Scholar] [CrossRef]
- Available online: https://0-www-statista-com.brum.beds.ac.uk/statistics/189582/age-of-us-video-game-players/ (accessed on 12 February 2021).
- Available online: https://www.isfe.eu/data-key-facts/key-facts-about-europe-s-video-games-sector/ (accessed on 12 February 2021).
- Available online: https://www.leagueofgraphs.com/pl/rankings/game-durations (accessed on 12 February 2021).
- Available online: https://howlongtobeat.com/game?id=87873 (accessed on 12 February 2021).
- Available online: https://howlongis.io/app/892970/Valheim (accessed on 12 February 2021).
- Medyńska-Gulij, B.; Forrest, D.; Cybulski, P. Modern Cartographic Forms of Expression: The Renaissance of Multimedia Cartography. ISPRS Int. J. Geo-Inf. 2021, 10, 484. [Google Scholar] [CrossRef]
- Martin, C.B.; Deuze, M. The Independent Production of Culture: A Digital Games Case Study. Games Cult. 2009, 4, 276–295. [Google Scholar] [CrossRef] [Green Version]
- Steinkuehler, C.A. Why game (culture) studies now? Games Cult. 2006, 1, 97–102. [Google Scholar] [CrossRef] [Green Version]
- Shaw, A. What is video game culture? Cultural studies and game studies. Games Cult. 2010, 5, 403–424. [Google Scholar] [CrossRef]
Figure 1.
Map from the Valheim game.

Figure 2.
Screenshot from the game of Valheim and map symbols occurring on the map.

Figure 3.
Online questionnaire on LimeSurvey platform.

Figure 4.
Cumulative charts presenting a percentage of individual categories of symbol 4 interpretation, divided according to age (A) and including individual age groups, divided according to interpretation category (B).
Figure 4.
Cumulative charts presenting a percentage of individual categories of symbol 4 interpretation, divided according to age (A) and including individual age groups, divided according to interpretation category (B).

Figure 5.
Cumulative charts presenting a percentage of individual categories of symbol 10 interpretation, divided according to age (A) and including individual age groups, divided according to interpretation category (B).
Figure 5.
Cumulative charts presenting a percentage of individual categories of symbol 10 interpretation, divided according to age (A) and including individual age groups, divided according to interpretation category (B).

Figure 6.
Cumulative charts presenting a percentage of individual categories of symbol 3 interpretation, divided according to the time spent on playing Valheim (A) and including individual groups (time spent on playing), divided according to interpretation categories (B).
Figure 6.
Cumulative charts presenting a percentage of individual categories of symbol 3 interpretation, divided according to the time spent on playing Valheim (A) and including individual groups (time spent on playing), divided according to interpretation categories (B).

Figure 7.
Cumulative charts presenting a percentage of individual categories of symbol 11 interpretation, divided according to the time spent on playing Valheim (A) and including individual groups (time spent on playing), divided according to interpretation categories (B).
Figure 7.
Cumulative charts presenting a percentage of individual categories of symbol 11 interpretation, divided according to the time spent on playing Valheim (A) and including individual groups (time spent on playing), divided according to interpretation categories (B).


Table 1.
Pearson’s test for the age of players.
| Symbol | 1 | 2 | 3 | 4 | 5 | 6 |
| Pearson χ2 test (p-value) | 0.7753 | 0.0526 | 0.2255 | 0.0447 | 0.4464 | 0.4360 |
| Symbol | 7 | 8 | 9 | 10 | 11 | 12 |
| Pearson χ2 test (p-value) | 0.7238 | 0.3941 | 0.8696 | 0.0351 | 0.4229 | 0.0604 |
Table 2.
Pearson’s test for time spent in-game.
| Symbol | 1 | 2 | 3 | 4 | 5 | 6 |
| Pearson χ2 test (p-value) | 0.0842 | 0.6506 | <0.000001 | 0.0684 | 0.7413 | 0.4352 |
| Symbol | 7 | 8 | 9 | 10 | 11 | 12 |
| Pearson χ2 test (p-value) | 0.3414 | 0.5664 | 0.9001 | 0.1883 | 0.1464 | 0.1430 |
Publisher’s Note: MDPI stays neutral with regard to jurisdictional claims in published maps and institutional affiliations. |
© 2022 by the authors. Licensee MDPI, Basel, Switzerland. This article is an open access article distributed under the terms and conditions of the Creative Commons Attribution (CC BY) license (https://creativecommons.org/licenses/by/4.0/).
Share and Cite
MDPI and ACS Style
Horbiński, T.; Zagata, K. Interpretation of Map Symbols in the Context of Gamers’ Age and Experience. ISPRS Int. J. Geo-Inf. 2022, 11, 150. https://0-doi-org.brum.beds.ac.uk/10.3390/ijgi11020150
AMA Style
Horbiński T, Zagata K. Interpretation of Map Symbols in the Context of Gamers’ Age and Experience. ISPRS International Journal of Geo-Information. 2022; 11(2):150. https://0-doi-org.brum.beds.ac.uk/10.3390/ijgi11020150
Chicago/Turabian StyleHorbiński, Tymoteusz, and Krzysztof Zagata. 2022. "Interpretation of Map Symbols in the Context of Gamers’ Age and Experience" ISPRS International Journal of Geo-Information 11, no. 2: 150. https://0-doi-org.brum.beds.ac.uk/10.3390/ijgi11020150
Note that from the first issue of 2016, this journal uses article numbers instead of page numbers. See further details here.