Article

Assessment and Mapping Soil Water Erosion Using RUSLE Approach and GIS Tools: Case of Oued el-Hai Watershed, Aurès West, Northeastern of Algeria

State Key Laboratory of Natural Hazards and Regional Planning, Institute of Earth Sciences and Universe, Batna 2 University, Batna 05000, Algeria
*
Author to whom correspondence should be addressed.
ISPRS Int. J. Geo-Inf. 2022, 11(2), 84; https://0-doi-org.brum.beds.ac.uk/10.3390/ijgi11020084
Submission received: 10 November 2021 / Revised: 2 January 2022 / Accepted: 10 January 2022 / Published: 24 January 2022
(This article belongs to the Special Issue Integrating GIS and Remote Sensing in Soil Mapping and Modeling)

Abstract

:
The problem of soil water erosion is one of the primary causes of agro-pedological heritage degradation. The combined effect of natural factors and inappropriate human actions has weakened the soil, which seriously threatens the region’s fertile lands and soils, which can ultimately lead to an irreversible situation of desertification. This study focuses on analysis and mapping of the vulnerability to erosion in Oued el-Hai watershed, Algeria, based on a technical methodology that combines the universal soil loss equation (USLE) with the geographic information system (GIS) tools. The results are organized into three main classes of different rate values, from one area to another, depending on the influence of different factors that control the erosion process. The highest loss rate value is greater than 30 t·ha−1·yr−1 and covers 23.2% of the total area, mainly located in the mountainous areas with steep slopes. However, the minimum potential erosion rate value is mainly located on the plain, with an average of 10 t·ha−1·yr−1 covering 45.2% of the total area of the watershed. The estimate of potential water erosion has given alarming results. The total area of the watershed could lose a rate of 16.69 t·ha−1·yr−1 (on average) each year. The method and results described in this article are valuable for understanding the soil erosion risk and are useful for managing and planning land use that will avoid land degradation. Hence, the results of this study are considered an important document which constitutes a decision support tool in terms of the management and protection of natural resources.

Graphical Abstract

1. Introduction

Soil is a food resource for more than 7.5 billion inhabitants, a support of human activities, a purification system and a water reserve. It remains largely unknown by those who use it directly and on a daily basis. Soil is increasingly threatened by multiple physical, chemical and biological degradations. The loss of productive soils will amplify food price volatility and potentially push millions of people into poverty. The careful management of soil can increase the food supply, provide support for climate regulation and a pathway to safeguard ecosystem functions [1]. The main threat to soils is erosion by wind and water, as highlighted by the latest United Nations publications, namely the state of soil resources in the world [2], where soil erosion has been identified as one of the major soil threats. Water erosion of soils has become a global problem, where accelerated forms of soil erosion have become a widespread phenomenon and pose a major challenge to achieving the United Nations Sustainable Development Goals [3].
Climate change and ever-increasing erosion in many regions of the world, and especially in arid and semi-arid environments, lead to the degradation of the living conditions of residents and disastrous consequences for natural resources and the population [4]. In Algeria, soil resources are seriously threatened by water erosion [5,6,7,8,9,10,11,12]. Annual water losses due to siltation in dams are estimated at around 20 million m2 [13], with an average annual specific erosion varying between 2000 and 4000 t/km2 [14]. However, the intensity of water erosion varies from one region to another: it varied from 47% in the west, 27% in the center and 26% in the eastern part of the country [15]. In 2011, the Ministry of Agriculture and Rural Development and Fisheries (MARDF) estimated that around 14 million hectares of mountain areas in the north of the country were degraded by water erosion. The various bathymetric surveys, carried out over the period 1986–2008 by the National Agency for Dams and Transfers on all of 59 dams in operation, showed that the volume lost by siltation was 898 Mm³ or 13.4% of total volume holdbacks (Ministry of Water Resources, 2010) [16].
The modeling and forecasting of soil erosion by water has more than seven decades of history. There are many different models; some are simple, and some are more complex, such as the Soil Erosion Model for Mediterranean Regions (SEMMED) [17], the revised model of Morgan, Morgan and Finney (RMMF) [18], the Water Erosion Prediction Project (WEPP) [19], the Soil and Water Assessment Tool (SWAT) [20], and the European Soil Erosion Model EUROSEM [21], as well as the update of existing empirical approaches. Currently, the universal soil loss equation (USLE) [22] and revised USLE (RUSLE) [23] are the most widely applied soils erosion prediction models in the world (have been applied in 109 countries) and under many different conditions. It has been most often applied for over 80 years due to its robustness, simplicity, high degree of flexibility, accuracy and accessibility of data [24,25,26,27].
In order to assess the effects of soils water erosion, we used the USLE/RUSLE model, which is one of the most widely used methods in the Mediterranean region: in Algeria [8,11,28]; in Turkey [29,30]; in Morocco [31,32]; in Spain [33]; in Italy [34,35]; in Tunisia [36]; and in Ethiopia [37]. There are many other similar studies on land degradation due to soil erosion [38,39]. The above-mentioned studies show the limitations of the RUSLE model. The estimation of potential soil erosion is improved by the development of the RUSLE model. The RUSLE model has different input factors that can be taken from the literature or from statistical and empirical data by integration with GIS. Results generated by RUSLE are valid for the estimation of soil erosion due to water. Estimation of the quantity of soil erosion is important because the results of this study will be beneficial for researchers and engineers to plan for the control of soil loss in the future. The RUSLE model based on GIS was also used in similar studies [40,41] and provides quantitative data of soil erosion. The method involves applying all factors of the RUSLE equation to georeferenced data. Incorporating remote sensing data and GIS techniques with the USLE/RUSLE model offers researchers the ability to predict the average annual rate of soil erosion at local, regional and national scales. The Oued el-Hai watershed is considered to be a typical area of water erosion, due to many erosion factors, such as climate, geology, topography, plant cover and soil conditions.
The main objective of this study is the quantitative estimation of sensitivity to soil erosion in the Oued el-Hai watershed (NE Algeria). The maps are produced with the integration of remote sensing data and GIS tools using the RUSLE model. The maps will identify the intensity of erosion in different parts and their influencing factors in more concrete standings. To fight against and prevent this phenomenon of soil degradation, it is important to define the risk degree of water erosion and factors that control it. Producing accurate water erosion risk maps helps decision makers adopt best strategies in land rehabilitation and erosion control projects, such as the sustainability of dams, ecosystems, and better agriculture production.

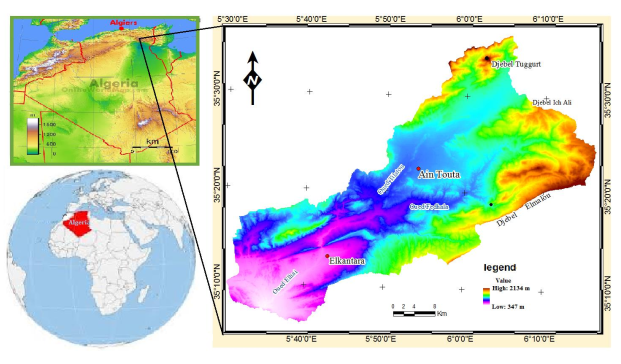
2. Study Site Location

The watershed of Oued el-Hai represents one of the three largest valleys of the Aurès massif in Eastern Algeria, with an impluvium of nearly 1660 km². It is part of the large watershed of Chott Melghir. It is located in the southern mountain slope of Aurès, between the longitudes 5°30′ and 6°17′ east and the latitudes 35°5′ and 35°35′ north. It is bounded to the north by the Constantine highlands watershed, to the east by the Oued Abdi watershed, to the west by the Chott El-Hodna watershed (Figure 1). It is elongated in a NE–SW direction.
The Oued el-Hai watershed is characterized by a series of massifs of a NE–SW orientation, with a decrease in the altitude from north to south, such as the Belezma mountains to the north in which the maximum altitude reaches 2091 m at Dj. Tuggurt. To the west are the Metlili mountains (peak reaches 1496 m). To the south is Dj. Bous at 1789 m, while to the east is Dj. El Malouat2091 m and Dj. El Rherahat1865 m. The prevailing climate is semi-arid to arid, and the precipitation is most often in form of violent and short thunderstorms. The irregularity of rains can occur during the same year or from one year to the next. The natural vegetation of the Oued el-Hai watershed belongs to the arid and semi-arid bioclimatic stage. It is presented in a very degraded form on heights, such as Aleppo pine, Juniper, Holm Oak and Thuja. On the lower slopes, areas not prepared for agriculture use are covered by Alfa and Mugwort. The bottom of the valley is of a gentle slope and occupied by very modest cereal cultivation.
The different geological units extend from Quaternary to Triassic, of which the main formations belong to the Cretaceous [36]. The geological formations are very variable: basically, sedimentary rocks, such as more or less hard limestones, sometimes dolomitic, and marly rocks strongly altered on the surface mainly due to the very harsh climate of the region. The fields occupied by alternating between gray and green marl and clear massive limestone, outcrop at Djebels Tuggurt, Ich Ali and Metlili. The massive limestones occupy the half-block of El Kantara with a thickness of 340 m, Djebels Bouss and El Malou. Hard sandstones and soft marls containing gypsum crystals, outcrop in the extreme north of the basin (Jebel Tichao). Therefore, Oued El-Hai watershed is characterized by components that promote onset of all forms of erosion. Altitudes decrease from upstream to downstream with a vertical drop of 1714 m. The slopes are medium to steep, where the class of slope ranging from 0% to 3 % and 4% to 12% presents 42.96%, whereas the class of slope ranging from 12.5% to 20% presents 48.84% of the total area. Rock formations are of medium to low resistance to erosion. Additionally, soils are skeletal, little evolved with raw minerals and poorly protected by degraded to very degraded vegetation, particularly scrubland. All these factors prove that the study area suffers from the phenomenon of erosion.

3. Materials and Methods

3.1. Sources of Data
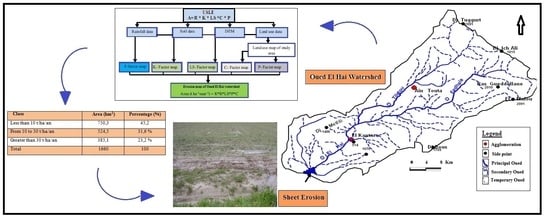
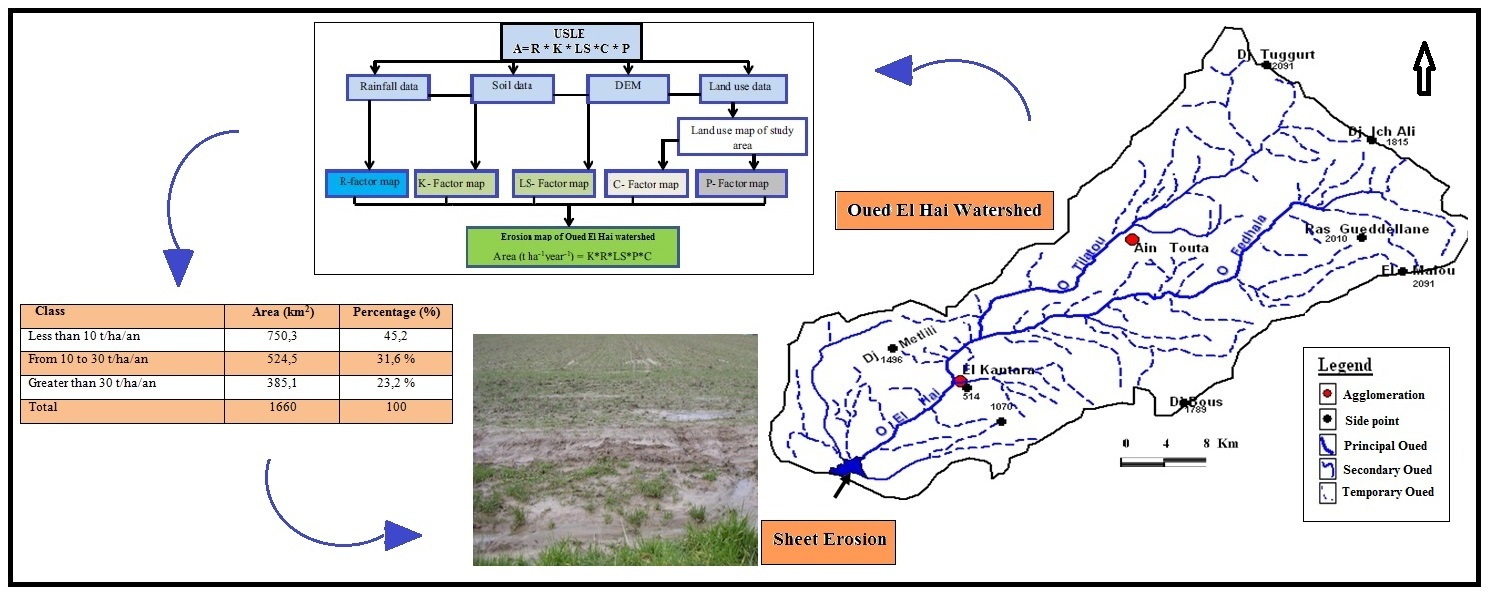
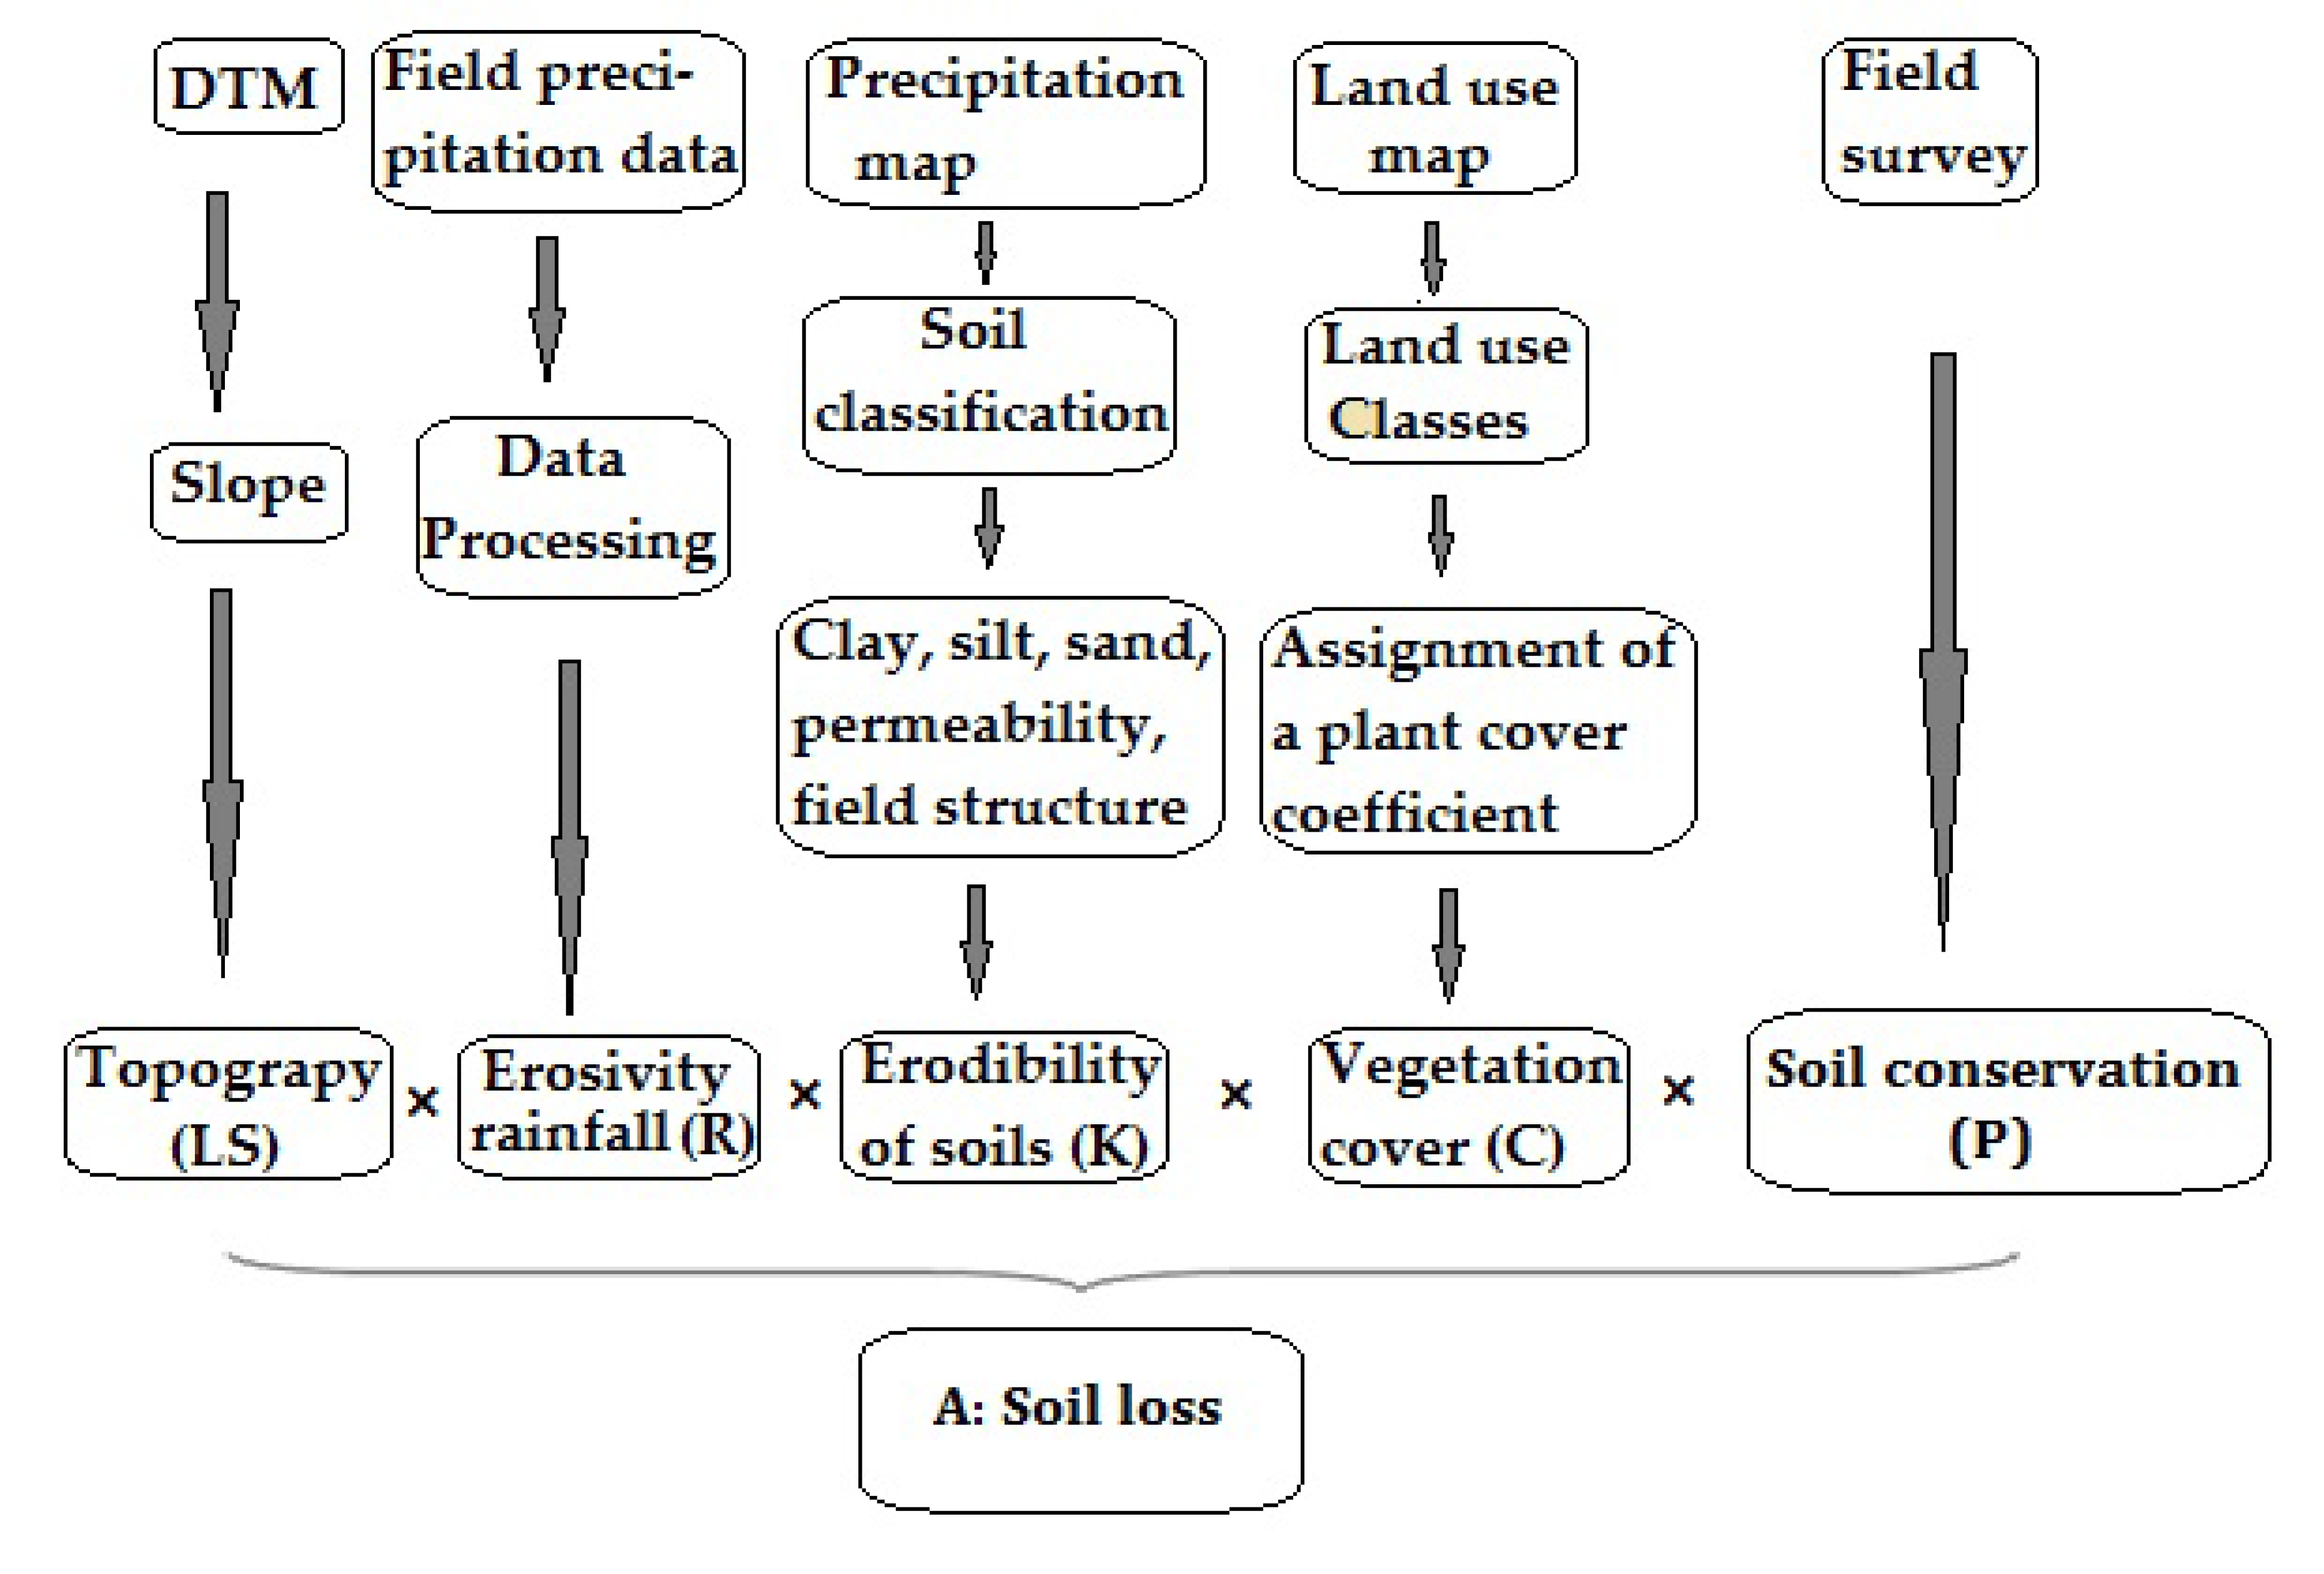
The important input parameters used in this study were rainfall, soil and land use (Table 1).

3.2. Method

Several soil erosion models exist with varying degrees of complexity. One of the most widely applied empirical models for assessing the sheet and rill erosion is the universal soil loss equation (USLE), developed by Wischmeier and Smith in 1965.The adopted methodology is based on the estimation of (USLE) parameters. This method of analysis allows us to develop cartographic documents in order to fully understand the areas subjected to water erosion risk. It is an empirical model that combines factors that have a direct or indirect impact on the rate of the non-linear water erosion of soils. Therefore, the RUSLE model was selected and applied in the study area, as it requires land use, a land cover map that can be generated by remote sensing images, management practices, soil types and properties. The other advantage of a selection of RUSLE is that the parameters of this model can be easily integrated with GIS for better analysis. The overall methodology used in the present study is schematically represented in Figure 2.
When combined with GIS techniques, the revised WISCHMEIER equation [42] allows not only to estimate the rate of gross soil loss, but also to analyze its spatial distribution. According to the USLE model, erosion is a multiplicative function (Equation (1)) taking into account rainfall erosion (factor R) by resistance of the environment (factors C, K, LS, and P). Each factor is a numerical estimate of a specific component that affects the severity of soil erosion at a given location. Five factors are used to calculate soil losses (A): precipitation aggressiveness (R), soil erodibility (K), topography (LS), land cover (C), and anti-erosion practices (P).So the equation is in the form:
A = R·K·LS·C·P
A = Average annual soil loss (metric t·ha−1·yr−1).
R = Rainfall Erosivity Factor (Mega Joules mm/ t·ha−1·yr−1).
K = Soil erodibility index to water erosion (metric t/ha/MJ/mm).
LS = Topographic factor depending on the slope and its length (L in meter and S in%).
C = Land cover.
P = Conservation and development factor.

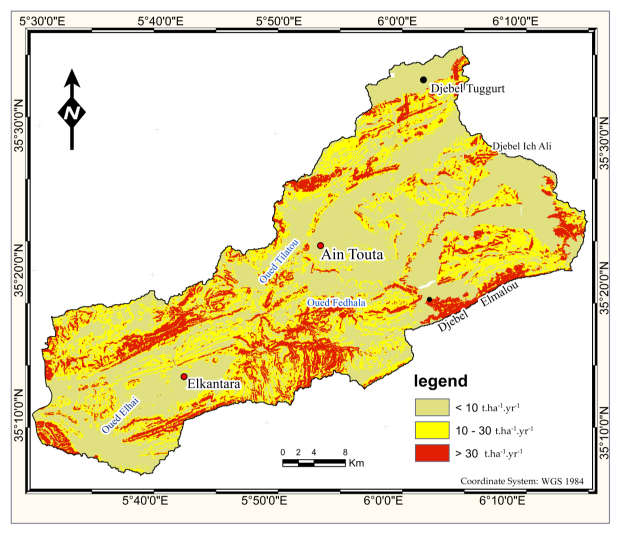
4. Results and Discussion

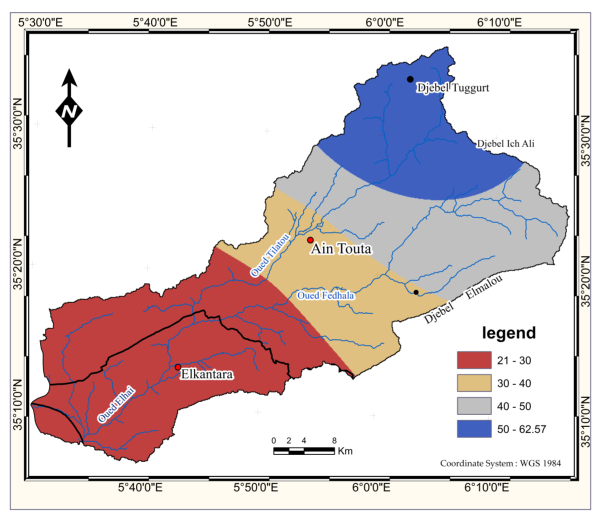
4.1. Rainfall Erosivity Factor (R)

Rain is the main factor in water erosion. Its erosivity depends mainly on its quantity and intensity or on the kinetic energy which results directly from it. Rain erosivity is often quantified using the R factor of the equation in [43]. In calculating this parameter, we used the maximum intensity of precipitation for 30 min (I30) as well as rain kinetic energy, for all heavy rains exceeding a certain rainfall threshold (E30) (Table 2). As these data are generally not available at conventional weather stations, a simplified method was used to estimate the R factor. According to [37], a good correlation (r2 = 0.95) was found between the average of E30, I30 and the product of annual precipitation multiplied by rains that fell during 1 h and 24 h with a period recurrence of 2 years. In this sense, Wischmeier proposed another formula [38]:
R = K · C n
C = h 1 · h 24 · H
R: Rainfall erosivity factor (MJ·mm·ha−1·h−1·yr−1).
C: Rainfall factor. Calculated by the multiplication of h1, h24 and H.
h1: Maximum height of fallen rain in 1 h with a recurrence of 2 years (cm).
h24: Maximum rain height of 24 h with a recurrence of 2 years (cm).
H: Average annual rainfall height (cm).
K, n: climate-related coefficients (in sub-humid to semi-arid climates, K = 0.751, n = 0.80).
In order to determine the fallen precipitation during heavy rains of different duration (t) and desired frequency (ht%), the Montana-type formula [39] is applied.
h t % = h j %     t 24 b
C V = e c a r   t t y p e   P j P j
P j % = P j C V 2 + 1
t: duration;
ht: desired frequency;
hj%: maximum daily frequency rainfall, determined after adjusting series of maximum daily rainfall to Gumbel’s theoretical law (see Table 2);
P j : daily precipitation;
P j : average daily precipitation;
b: climatic exponent determined by adjusting Gumbel law of short-term rains recorded in 20 stations equipped with a pluviograph:
b = 1 In I 2 In I 1 In t 2 In t 1
I 1 = 25 mm h , t 1 = 0.5 h ,   I 2 = P j 24 mm / h , t 2 = 2 h
The values of R for five stations are presented in Table 3 down below.
The application of kriging was carried out by a simple kriging-type interpolation method under Geostatistical Analyst of ArcGis software for the development of R map (Figure 3). In the watershed that is the subject of our study, the R value varies from 21 at the outlet to 62.57 on Jebel Tuggurt with an overall average of 40.3 (MJ·mm·ha−1·h−1·yr−1).

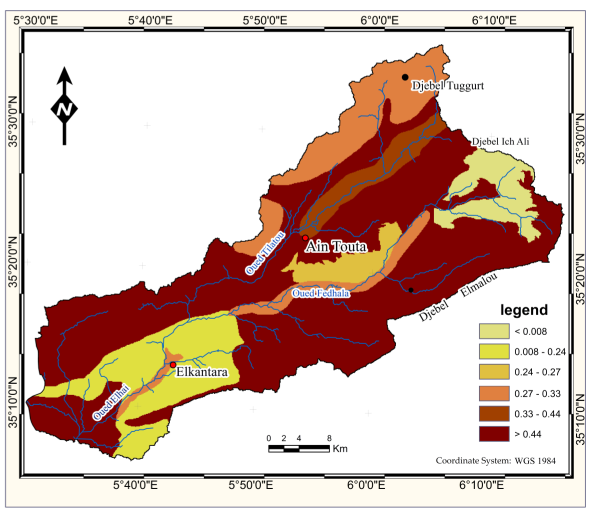
4.2. Soil Erodibility (K)

The nature of soil is a major parameter of erosion since the removal of particles directly depends on the properties of soil and subsoil. The data available for K factor calculation were the soil map. It was possible to obtain the K factor for a type of soil from the results of soil analyses. It was possible to determine the percentages of clay, silt, sand and organic matter of each major type of soil, by taking samples and then generalizing on the concerned type. The repetition of experiments on different types of soils enabled [22] to develop an equation for calculation of soil erodibility:
100K = 2.1·M1,14·(10−4)·(12 − a) + 3.25·(b − 2) + 2.5·(c − 3)
M: calculated by the formula M = (% fine sand + silt). (100 − % clay);
a: percentage of organic matter;
b: permeability code;
c: structure code.
The soils erodibility index of the Oued el-Hai watershed varies from 0.27 to 0.44 in wind input soils and 0.008 to 0.27 in alluvial input soils (Figure 4). We noticed that the forest areas have deferent granulometric characteristics compared to other lands of the same type, in particular, its organic matter components.

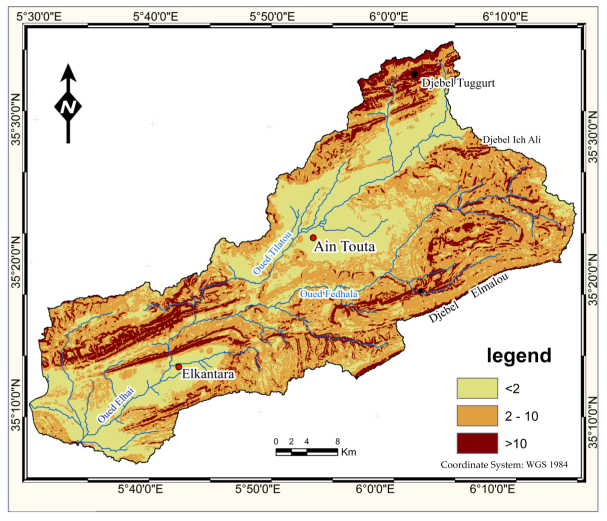
4.3. Topographic Factor (LS)

The topographic factor LS of [22] gives satisfactory results as to influence of length and inclination of slope in the erosion phenomenon (Figure 5). It therefore takes into account two elements: inclination (S) and slope length (L). These two factors are most often combined into a single dimensionless factor (LS). The topographic factor (LS) was calculated by [22] by the following formula:
LS = (L/22.13)m·(0.065 + 0.045·S + 0.065·S2)
L is the slope length in m;
S is the incline of the slope in %;
m is a parameter such that m = 0.5 if slope is >5%; m = 0.4 if slope is 3.5 to 4.5%; m = 0.3 if slope is 1 to 3% and m = 0.2 if slope is <1%.

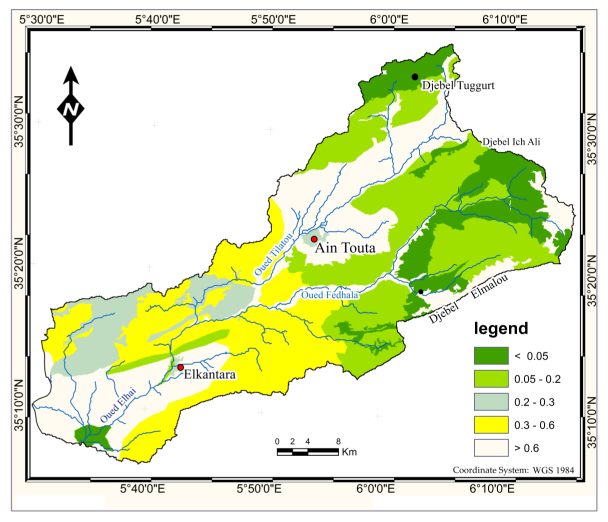
4.4. Land Use Factor—Plant Cover (C)

Factor C considers land use (plant cover, development and agricultural practices). In fact, the erosion more particularly affects certain types of crops, while it is less severe or simply absent for certain activities and developments. The type of vegetation cover must absolutely be considered since the damping of raindrops, the slowing of runoff and infiltration depend on it. The factor C is defined as a ratio of soil loss on land cultivated under specific conditions to corresponding soil loss on fallow land [44]. It can be calculated using Table 4 below.
The land use map for the studied watershed was established by interpretation of satellite images using GoogleEarth (Figure 6). A visual digitization work was assisted by cartographic documents collected from the forest conservation service and the National Bureau of Studies for Rural Development (NBSRD). The quality of work is considered satisfied after a comparison of results obtained with observations and knowledge of field.

4.5. The Anti-Erosion Practical Factor (P)

Contour, alternating strip or terraced crops, bench reforestation and ridging are the most effective soil conservation practices. The values of P are less than or equal to 1. A value of 1 is assigned to land on which none of the above practices are used. The values of P vary according to the adopted practice and also according to the slope. Throughout the Oued el-Hai watershed, there are no anti-erosion facilities, and farmers do not use anti-erosion cultivation practices. The crops are mainly cereals, and the plowing is rarely parallel to the contour lines. There are some attempts to rehabilitate forests by reforestation, but not in benches. In this context, the value (P = 1) is assigned to the entire area of the basin.
Soil erosion is an alarming and very serious problem, especially in the study area, where different factors contribute to the rapid erosion of soil. Factors, such as steep slope of the region, very erodible soils, alarming degradation of the plant cover, and climate cause the issue of soil erosion. The study area is fed by precipitation most often in the form of violent and short thunderstorms [46]. For the estimation of soil loss in the study area, the revised universal soil loss equation (RUSLE) model was used in combination with geographic information system (GIS).
It is not possible to calculate the soil loss by using conventional methods due to the high cost, and because they are time consuming [47]. Therefore, the revised universal soil loss equation (RUSLE) model is most widely used because it is simple, easy, and requires less data and time. RUSLE is a straightforward and empirically based model that has the ability to predict the long-term average annual rate of soil erosion on slopes using data on rainfall pattern, soil type, topography, crop system and management practices. The integration of the RUSLE model with GIS data generates more accurate results. This model can easily be implemented, and required data are easily available for most countries. The use of GIS allows us to map the spatial distribution of soil erosion risk.
In the present research, a soil erosion rate map was generated for the Oued el-Hai watershed. Several data sources were used for the generation of RUSLE model input factors and were stored as raster GIS layers in the ArcGIS software. Potential soil loss is estimated from the product of factors (R, K, LS, C and P), which represents the geo-environmental scenario of the study area in the spatial analyst extension of Arc GIS software.
We analyzed each of the five main factors responsible for the erosion phenomenon in our study area. We integrated the results of these analyzes into a general model and of quantified soil losses. The crossing of data taken into account in erosive process is based on a combination in a mesh model. Each information layer is represented by a “raster” image, where the value of each cell is equal to a sensitivity level to erosion for the considered parameter. This level of sensitivity is represented by a value defined previously and also different for each parameter. All of these images constitute a multi-varied space. The data are crossed by multiplying values of the five factors R, K, LS, C and P in the “raster calculator” of ArcGIS Spatial Analyst module. The result of this multiplication is a “raster” layer giving the amount of potentially erodible soil in t·ha−1·yr−1 over the entire study area. The values obtained are grouped into classes for the purposes of map legibility (Figure 7).
The adopted classification is based on the soil’s tolerance to loss. It assumes that on average, the soils can tolerate losses of up to 10 t·ha−1·yr−1 while allowing a high level of agricultural production. Above 30 t·ha−1·yr−1, the loss is high and the soils are severely degraded, which can adversely affect production. In the Oued el-Hai watershed, the results obtained are organized into three classes (see Table 5).
Class 1. The soil loss rate is less than 10 t·ha−1·yr−1 and covers 45.2% of the total area of the watershed. It occupies the plains of Ain Touta and El Kantara because of the low slope and is also located under the dense and moderately dense forests of Jebel Tuggurt and Jebel Garouaou.
Class 2. The loss is 10 to 30 t·ha−1·yr−1, and it represents 31.6% of the catchment area. It concerns sectors with steep slopes and weak vegetation, as also, on the reliefs foothills, transition sectors between steep slopes and lowlands. It mainly extends on the cereal-oriented highlands.
Class 3. The loss rate is greater than 30 t·ha−1·yr−1, and covers 23.2% of the total area of the watershed. It concerns, in particular, the banks of watercourses and abrupt sectors devoid of plant cover (bare land).
Average loss by water erosion in aquifers for all the homogeneous units is about 16.69 t·ha−1·yr−1. The erosion rates differ from one area to another of the watershed, depending on the influence of different factors that control the erosion process. However, the minimum potential erosion rate values are mainly located on the plain of Ain Touta and lower than El Kantara because of the low slope. For some forests, such as Jebel Tuggurt and Jebel Garoua, despite the value of the K factor and the low value of the plant cover factor, their potential erosion rate remains high. The extreme high erosion rate values are mainly located in the mountainous areas with quite steep slopes. They are not agricultural lands, mostly bare soils with very low vegetation cover (Figure 8). There is some information on the results of USLE/RUSLE application in some regions in Algeria but they are general, and cannot be compared due to the great difference in the physical, climate and soil characteristics. Algeria is a wide country from east to west and from north to south. Concerning our study area, no previous studies have been made yet that uses this application in particular or the erosion in general. The current study is the first one on this region, which uses the RUSLE approach. Therefore, we could not compare our results.
The above study is helpful to researchers and planners for better planning to control the loss of soil in the high severity zones. The results obtained from the study are significant in recognizing and obtaining a complete understanding of risks related to the erosion of soil for the study area: not only the risks, but also figuring out the dominant and significant factors contributing to soil erosion. The factors, such as land use, land cover, and topography of the area, and their contribution to soil erosion, can be analyzed.
The management of natural resources and planning/policymaking can use the results of this study to reduce the land degradation in this region. The assessment of potential risk can be done in the regions of complex topography and high precipitation/rainfall rates. This will assist in recognizing priority areas for imposing plans and precautionary measures to resolve the conflict of erosion and other issues related to land degradation.

5. Conclusions

The work of this investigation exposes the application results of the universal soil loss equation using a geographic information system in the Oued el-Hai watershed. The results show that the watershed is highly prone to and severely affected by soil erosion. If the rates of soil erosion continue at the same rate, it will probably cause severe land degradation. The watershed is losing an average of 16.69 t·ha−1·yr−1. This value corresponds to the not-tolerated erosion by the soils, which undergo an aggressive climate with low precipitation, but with stormy character. Located in time and space, they do not allow pedological changes to compensate for the soil loss. The percentage of the area under the influence of very high soil erosion (i.e., 23.2%) is an alarming indicator that this region needs to be addressed properly in the matter of soil erosion.
This serious situation is favored by the other factors of erosion, which also combine to accelerate erosion, such as steep slopes, very erodible soils and the alarming degradation of the plant cover. However, integrating the model into a GIS has many advantages. It allows to rationally manage a multitude of qualitative and quantitative data relating to the various factors of soil degradation and to establish a synthetic map of the sensitivity degrees distribution to erosion in different areas of the watershed.
Although the validity of USLE soil losses is subject to debate (it only applies to layer erosion and the estimated loss amounts do not include losses from other types of erosion (linear, solifluxion, etc.), the method provides significant help to policymakers and planners to plan erosion control interventions, and to take precautionary measures according to the obtained values of soil erosion, especially in areas where layer erosion predominates over linear erosion. It also allows to choose suitable cultivation techniques and anti-erosion methods, considering the risk nature (low, high or very high) and to monitor the impact of land use and development. The integration of GIS with the RUSLE model technique can be used in other areas of Algeria, in order to estimate and monitoring soil erosion on wider scales. In addition, the use of other methods, such as the analytic hierarchy process (AHP), might aid in ameliorating and comparing the results in our study area.

Author Contributions

Aida Bensekhria, conceiving and designing the study; Aida Bensekhria, data collection; Rabah Bouhata, methodology, and investigation; Aida Bensekhria, software and mapping; Aida Bensekhria and Rabah Bouhata, analysis and interpretation; Aida Bensekhria and Rabah Bouhata, writing—original draft preparation; Rabah Bouhata, review and editing. All authors provided critical review and final approval of the manuscript. All authors have read and agreed to the published version of the manuscript.

Funding

This research received no external funding.

Institutional Review Board Statement

Not applicable.

Informed Consent Statement

Not applicable.

Data Availability Statement

Not applicable.

Acknowledgments

The authors are deeply grateful to the unknown reviewers and the editors for their critical reading of the manuscript.

Conflicts of Interest

The authors declare no conflict of interest.

References

  1. FAO; ITPS. État des Ressources en Sols du Monde—Résumé Technique; Organisation des Nations Unies pour L’alimentation et L’agriculture et Groupe Technique Intergouvernemental sur les Sols: Rome, Italy, 2015. [Google Scholar]
  2. FAO. GLADIS—Global Land Degradation Information System; Food and Agriculture Organization of the United Nations: Rome, Italy, 2015. [Google Scholar]
  3. Keesstra, S.D.; Bouma, J.; Wallinga, J.; Tittonell, P.; Smith, P.; Cerdà, A.; Montanarella, L.; Quinton, J.N.; Pachepsky, Y.; van der Putten, W.H.; et al. The significance of soils and soil science towards realization of the United Nations Sustainable Development Goals. Soil 2016, 2, 111–128. [Google Scholar] [CrossRef] [Green Version]
  4. Meddi, M.; Boukhari, Y.; Morsli, B. Etude du Ruissellement Et Du Transport Solide Dans Les Monts De Beni-Chougrane, Algérie: Utilisation De La Simulation De Pluie. In Proceedings of the Symposium S1 Held during the Seventh IAHS Scientific Assembly, Foz do Iguaçu, Brazil, 4–9 April 2005; Volume 291, pp. 21–28. [Google Scholar]
  5. Morsli, B.; Habi, M.; Meddi, M. Dynamique de l’érosion en zone méditerranéenne algérienne: Facteurs explicatifs de variation du ruissellement et de l’érosion sous différentes occupations du sol. Rev. Sci. L’eau 2013, 26, 89–105. [Google Scholar] [CrossRef] [Green Version]
  6. Touaibia, B. Problématique de l’érosion et du transport solide en Algérie septentrionale. Sécheresse 2010, 21, 1–6. [Google Scholar] [CrossRef]
  7. Mazour, M.; Roose, E. Influence de la couverture végétale sur le ruissellement et l’érosion des sols sur parcelles d’érosion dans des bassins versants du Nord-Ouest de l’Algérie. Bull. Réseau Eros. 2002, 21, 320–330. [Google Scholar]
  8. Arar, A.; Chenchouni, H. A “simple”geomatics-based approach for assessing water erosion hazard at mountain areas. Arab J. Geosci. 2014, 7, 1–12. [Google Scholar] [CrossRef]
  9. Selmi, K.; Khanchoul, K. Sediment load estimation in the Mellegue catchment, Algeria. J. Water Land Dev. 2016, 31, 129–137. [Google Scholar] [CrossRef]
  10. Chebbani, R.; Djilli, K.; Roose, E. Étude des risques d’érosion dans le bassin versant de l’Isser. Algérie. Bull. Réseau Eros. 2009, 19, 85–95. [Google Scholar]
  11. Djoukbala, O.; Mazour, M.; Hasbaia, M.; Benselama, O. Estimating of water erosion in semi arid regions using RUSLE equationunder GIS environment. Environ. Earth Sci. 2018, 77, 345. [Google Scholar] [CrossRef]
  12. Belarbi, F.; Bouchelkia, H.; Remini, B.; Benmansour, A. Quantification and study of monthly variation of suspendedsedimentloads in Tafna basin—Algeria. J. Water Land Dev. 2018, 37, 29–38. [Google Scholar] [CrossRef]
  13. Remini, B. L’envasement des barrages. Bull. Réseau Eros. 2000, 20, 165–171. [Google Scholar]
  14. Demmak, A. Contribution à l’étude de l’érosion et des Transports Solides en Algérie. Ph.D. Thesis, Université de Paris VI, Paris, France, 1982; p. 323. [Google Scholar]
  15. Hallouz, F.; Meddi, M.; Mahé, G.; Alirahmani, S.; Keddar, A. Modeling of discharge and sediment transport through the SWAT model in the basin of Harraza (Northwest of Algeria). Water Sci. 2018, 32, 79–88. [Google Scholar] [CrossRef] [Green Version]
  16. Touahir, S.; Asri, A.; Remini, B.; Saad, H. Prédiction de l’érosion hydrique dans le bassin versant de l’oued Zeddine et de l’envasement du barrage OuledMellouk (Nord-Ouest algérien). Géomorphologie 2018, 24, 167–182. [Google Scholar] [CrossRef]
  17. De Jong, S.M.; Paracchini, M.L.; Bertolo, F.; Folving, S.; Megier, J.; de Roo, A.P.J. Regional assessment of soil erosion using the distributed model SEMMED and remotely sensed data. Catena 1999, 37, 291–308. [Google Scholar] [CrossRef]
  18. Morgan, R.P.C. A simple approach to soil loss prediction: A revised Morgan–Morgan–Finney model. Catena 2001, 44, 305–322. [Google Scholar] [CrossRef]
  19. Boardman, J. Soil erosion science: Reflections on the limitations of current approaches. Catena 2006, 68, 73–86. [Google Scholar] [CrossRef]
  20. Neitsch, S.L.; Arnold, J.G.; Kiniry, J.R.; Williams, J.R. Soil and Water Assessment Tool—Theoretical Documentation Version 2009; Texas Water Resources Institute: College Station, TX, USA, 2011. [Google Scholar]
  21. Morgan, R.P.C.; Quinton, J.N.; Smith, R.E.; Govers, G.; Poesen, J.W.A.; Auerswald, K. The European soil erosion model (EUROSEM): A process-based approach for predicting soil loss from fields and small catchments. Earth Surf. Process. Landf. 1998, 23, 527–544. [Google Scholar] [CrossRef]
  22. Wischmeier, W.H.; Smith, D.D. Predicting Rainfall Erosion Losses—A Guide to Conservation Planning, Agriculture Handbook; No. 537; USDA/Science and Education Administration 1978; US. Govt. Printing Office: Washington, DC, USA, 1978.
  23. Renard, K.; Foster, G.; Weesies, G.; McCool, D.; Yoder, D. Predicting Soil Erosion by Water: A Guide to Conservation Planning with the Revised Universal Soil Loss Equation (RUSLE). Agriculture Handbook 703; Department of Agriculture, Agricultural Research Service: Washington, DC, USA, 1997.
  24. Alewell, C.; Borrelli, P.; Meusburger, K.; Panagos, P. Using the USLE: Chances, challenges and limitations of soil erosion modeling. Int. Soil Water Conserv. Res. 2019, 7, 203–225. [Google Scholar] [CrossRef]
  25. Mihi, A.; Benarfa, N.; Arar, A. Assessing and mapping water erosion-prone areas in northeastern Algeria using analytic hierarchy process, USLE/RUSLE equation, GIS, and remote sensing. Appl. Geomat. 2019, 12, 179–191. [Google Scholar] [CrossRef]
  26. Radoane, M.; Vespremeanu-Stroe, A. Landform Dynamics and Evolution in Romania; Springer Nature: Cham, Switzerland, 2017; pp. 371–396. [Google Scholar]
  27. Markose, V.J.; Jayappa, K.S. Soilloss estimation and prioritization of sub-watersheds of Kali River basin, Karnataka, India, using RUSLE and GIS. Environ. Monit. Assess. 2016, 188, 1–16. [Google Scholar] [CrossRef]
  28. Benchettouh, A.; Kouri, L.; Jebari, S. Spatial estimation of soil erosion risk using RUSLE/GIS techniques and practices conservation suggested for reducing soil erosion in Wadi Mina watershed (northwest, Algeria). Arab. J. Geosci. 2017, 10, 79. [Google Scholar] [CrossRef]
  29. Imamoglu, A.; Dengiz, O. Determination of soil erosion risk using RUSLE model and soil organic carbon loss in Alaca catchment (Central Black Searegion, Turkey). Rend. Lince 2016, 28, 11–23. [Google Scholar] [CrossRef]
  30. Erdoğan, M.; Esbah, H.; Berberoglu, S.; Garzia, F.; Guarascio, M.; Maestas, F. Erosion risk mapping usingruslewith GIS: Case study of BüyükMenderes river basin of Turkey. Int. J. Saf. Secur. Eng. 2016, 6, 132–140. [Google Scholar] [CrossRef] [Green Version]
  31. Bou-Imajjane, L.; Belfoul, M.A. Soil Loss Assessment in Western High Atlas of Morocco: Beni Mohand Watershed Study Case. Appl. Environ. Soil Sci. 2020, 2020, 6384176. [Google Scholar] [CrossRef]
  32. Elaloui, A.; Marrakchi, C.; Fekri, A. USLE-based assessment of soil erosion by water in the watershed upstream Tessaoute(Central High Atlas, Morocco). Model Earth Syst. Environ. 2017, 3, 873–885. [Google Scholar] [CrossRef]
  33. Fernández, C.; Vega, J.A. Evaluation of RUSLE and PESERA models for predicting soil erosion losses in the first year after wildfire in NW Spain. Geoderma 2016, 273, 64–72. [Google Scholar] [CrossRef]
  34. Khemiri, K.; Jebari, S. Évaluation de l’érosion hydrique dans des bassins versants de la zone semi-aride tunisienne avec les modèles RUSLE et MUSLE couplés à un Système d’information géographique. Cah. Agric. 2021, 30, 7. [Google Scholar] [CrossRef]
  35. Rellini, I.; Scopesi, C.; Olivari, S.; Firpo, M.; Maerker, M. Assessment of soil erosion risk in a typical Mediterranean environmentusing a high resolution RUSLE approach (Portofinopromontory, NW-Italy). J. Maps 2019, 15, 356–362. [Google Scholar] [CrossRef]
  36. Miloudi, B. Evaluation et Cartographie Du Risque D’érosion Hydrique Dans Le Bassin Versant De Oued El Hai. Master’s Thesis, Université Batna 2, Batna, Algérie, 2018. [Google Scholar]
  37. Teshome, A.; Halefom, A.; Teshome, M.; Ahmad, I.; Taddele, Y.; Dananto, M.; Demisse, S.; Szucs, P. Soil erosion modeling using GIS and revised universal soil loss equation approach: A case study of Guna-Tana landscape, Northern Ethiopia. Model. Earth Syst. Environ. 2020, 7, 125–134. [Google Scholar] [CrossRef]
  38. Xie, H.; Zhang, Y.; Wu, Z.; Lv, T. A Bibliometric Analysis on Land Degradation: Current Status, Development, and Future Directions. Land 2020, 9, 28. [Google Scholar] [CrossRef] [Green Version]
  39. Belay, H.T.; Malede, D.A.; Geleta, F.B. Erosion Risk Potential Assessment Using GIS and RS for Soil and Water Resource Conservation Plan: The Case of Yisir Watershed, Northwestern Ethiopia. Agric. For. Fish. 2020, 9, 11. [Google Scholar] [CrossRef]
  40. Chuenchum, P.; Xu, M.; Tang, W. Estimation of Soil Erosion and Sediment Yield in the Lancang–Mekong River Using the Modified Revised Universal Soil Loss Equation and GIS Techniques. Water 2020, 12, 135. [Google Scholar] [CrossRef] [Green Version]
  41. Atoma, H.; Suryabhagavan, K.V.; Balakrishnan, M. Soil erosion assessment using RUSLE model and GIS in Hulukawatershed, Central Ethiopia. Sustain. Water Resour. Manag. 2020, 6, 12. [Google Scholar] [CrossRef]
  42. El HageHassan, H.; Charbel, L.; Touchart, L. Modélisation de l’érosion hydrique à l’échelle du bassin versant du Mhaydssé. Békaa-Liban. VertigO 2018. [Google Scholar] [CrossRef]
  43. Arnoldus, H.M.J. An approximation of the rainfall factor in the Universal Soil Loss Equation. In De Boodt and Gabriels: Assessment of Erosion; FAO Land and Water Development Division; Wiley&Sons: Chichester, UK, 1980; pp. 127–132. [Google Scholar]
  44. Guettouche, M.S. Perspective De L’application De L’équation Dite “Universelle” De Perte De Sol Wischmeier En Algérie. Analyse Théorique; Université Des Sciences et de la Technologie Houari Boumediene: Bab-Ezzouar, Algeria, 1988. [Google Scholar]
  45. Achite, M.; Meddi, M. Contribution à l’étude des courbes IDF dans la région de Chlef. In Proceedings of the Conférence Nationale sur l’eau et Environnement, Biskra, Algérie, 12–13 November 2005. [Google Scholar]
  46. Sadik, A.; Bouhlassa, S.; Auajjar, J.; Faleh, A.; Macaire, J. Utilisation d’un SIG pour l’évaluation et la cartographie des risques d’érosion par l’Equation universelle des pertes en sol dans le Rif oriental (Maroc): Cas du bassin versant de l’oued Boussouab, Bulletin de l’Institut Scientifique, Rabat. Sci. Terre 2004, 26, 69–79. [Google Scholar]
  47. Amin, M.; Romshoo, S.A. Comparative assessment of soil erosion modeling approaches in a Himalayan watershed. Model. Earth Syst. Environ. 2019, 5, 175–192. [Google Scholar] [CrossRef]
Figure 1. Location map of Oued el-Hai watershed.
Ijgi 11 00084 g001
Figure 2. Flow chart of methodology.
Ijgi 11 00084 g002
Figure 3. Map of rainfall erosivity factor (R) unit (MJ·mm·ha−1h−1yr−1).
Ijgi 11 00084 g003
Figure 4. Soil erodibility map (K).
Ijgi 11 00084 g004
Figure 5. Topographic factor map (LS).
Ijgi 11 00084 g005
Figure 6. Land use factor map (C).
Ijgi 11 00084 g006
Figure 7. The erosion map of Oued el-Hai watershed presenting three main classes of soil loss rate and their geographic distribution.
Ijgi 11 00084 g007
Figure 8. Some forms of water erosion in Oued el-Hai watershed. (14) Bad lands; (5) ravine on clayey soil (regressive erosion) in Ain Touta; (68) Underminingof the banks of Oued Tilatou and Oued Ain Touta, respectively. (Photos taken by authors).
Ijgi 11 00084 g008
Table 1. Source of data and description.
NoData TypeSourceDescription
1Rainfall dataNational Weather CenterPrecipitation data for 30 years (1984–2014) of five precipitation stations
2Soil dataAures soil map
Laboratory field sample analysis results
The soil map prepared by BNEDER (1984)
3SRTM–DEMhttps://earthexplorer.usgs.gov/ (accessed on 2 January 2022)N35E005.hgt
23 September 2014
N35E006.hgt
23 September 2014
Resolution 30 m
4Land useSatellite image (Landsat)
Vegetation cover map
Extracted from satellite image and vegetation cover map
Table 2. Distribution of rainfall in Oued el-Hai watershed.
Station/ParametersPj Avg (mm)Standard Deviation (mm)H Annual (mm)
Djamourah27.012.754164.2
Segana28.244.594183.69
Ain Touta32.373.872262.37
Tazoult35.335.142353.0
Chaabet.O.Chlih40.326.14413.80
Table 3. Values of rainfall erosivity factor for five stations.
Parameters/StationDjamourahSeganaAin ToutaTazoultChaabet.O.Chlih
Pj avg (mm)27.0128.2432.3735.3340.32
Standard deviation2.7544.5943.8725.1426.14
CV0.1020.1630.1190.1460.152
Pj% (mm)26.8727.8832.1434.9739.864
b0.200.210.250.270.30
h1 (cm)1.4281.4281.4521.4821.527
h24 (cm)2.6872.7883.2173.4973.986
H (cm)16.4218.36926.23735.3041.380
R (MJ·mm·ha−1·h−1·yr−1)20.6523.2735.1548.4862.60
Table 4. Factor C according to [45].
Vegetation Cover TypeCVegetation Cover TypeC
Dense reforestation0.058Clear Matorral, dense course0.20
Moderately dense forest0.13Very degraded Matorral0.22
Degraded Matorral, dense course0.17Steppes in alfa0.32
Clear reforestation0.18Cereal cultivation0.70
Table 5. Soil loss classes mainly presented in the study area.
ClassArea (km2)Percentage (%)
Less than 10 t·ha−1·yr−1750.345.2
From 10 to 30 t·ha−1·yr−1524.531.6%
Greater than 30 t·ha−1·yr−1385.123.2%
Total1660100
Publisher’s Note: MDPI stays neutral with regard to jurisdictional claims in published maps and institutional affiliations.

