
An Empirical Study on the Effects of Temporal Trends in Spatial Patterns on Animated Choropleth Maps


Department of Cartography and Geomatics, Faculty of Geographical and Geological Sciences, Adam Mickiewicz University Poznan, 61-712 Poznań, Poland
ISPRS Int. J. Geo-Inf. 2022, 11(5), 273; https://0-doi-org.brum.beds.ac.uk/10.3390/ijgi11050273
Submission received: 1 March 2022
/
Revised: 11 April 2022
/
Accepted: 15 April 2022
/
Published: 20 April 2022
(This article belongs to the Special Issue Cartography and Geomedia)
Abstract
:Animated cartographic visualization incorporates the concept of geomedia presented in this Special Issue. The presented study aims to examine the effectiveness of spatial pattern and temporal trend recognition on animated choropleth maps. In a controlled laboratory experiment with participants and eye tracking, fifteen animated maps were used to show a different spatial patterns and temporal trends. The participants’ task was to correctly detect the patterns and trends on a choropleth map. The study results show that effective spatial pattern and temporal trend recognition on a choropleth map is related to participants’ visual behavior. Visual attention clustered in the central part of the choropleth map supports effective spatio-temporal relationship recognition. The larger the area covered by the fixation cluster, the higher the probability of correct temporal trend and spatial pattern recognition. However, animated choropleth maps are more suitable for presenting temporal trends than spatial patterns. Understanding the difficulty in the correct recognition of spatio-temporal relationships might be a reason for implementing techniques that support effective visual searches such as highlighting, cartographic redundancy, or interactive tools. For end-users, the presented study reveals the necessity of the application of a specific visual strategy. Focusing on the central part of the map is the most effective strategy for the recognition of spatio-temporal relationships.
1. Introduction
Dynamic maps, so-called cartographic animations, are part of multimedia cartography [1,2,3]. The advancement of digital technology has brought significant developments. Existing animated maps have basic time navigation features such as a time sliders, using audio narration instead of a legend, or taking advantage of modern APIs [4,5] and JavaScript libraries [6,7]. Cartographic animation is consistent with the concept of geomedia, which means communicating about geographic space through multimedia related to spatio-temporal dimensions [8]. Owing to this, cartographic animation finds application not only in geovisualization [9], but also in augmented reality systems [10], movies [11], and computer games [12].
However, as Harrower [13,14] correctly noted, the problem with animated maps is their perception. Changes in space on maps require the user’s memorization of spatial patterns, and not only comparison, observation, and interpretation. The problem of dynamic maps’ perception relates to a multitude of changes such as disappearance, value changes, or movement [15]. Nevertheless, dynamic maps play an important role in visual analysis [16]. Hegarty et al. [17] and Lee et al. [18] gave evidence that people process animated maps through a series of static snapshots rather than a dynamic representation. Juergens [19] suggests that design issues such as map projections could be also a source of misleading interpretation of temporal geographic data.
Much scientific research has dealt with the animated map perception issue. Some research is concerned with the perception of smooth and abrupt changes [20,21,22]. Other studies are concerned with comparing effectiveness against static maps [23,24]. Part of the research is related to searching for the most efficient solution in animated map design [25,26]. These studies focus on perception issues, e.g., change blindness [27,28,29,30].
Eye tracking technology allows one to record eye movements in real time. The main two components of this movement are saccades and fixations [31]. Saccades are rapid gaze movements from one location to another. The second component is fixation, which relates to a relatively stationary gaze on a single location. There is also a specific eye movement, i.e., smooth pursuit. This is slow eye tracking of a moving objects [32]. On dynamic maps, it concerns, among other things, the movement of point objects along the static route [33]. However, the dominant change in the choropleth map is the change in enumeration units [34]. Therefore, the user’s visual strategy could rely on the specific sequence of fixations and saccades (e.g., fixation duration and saccadic amplitude). When users search for trends and patterns on a map, the visual strategy could be used to determine the effective performance. The connection between eye tracking measures and the cognitive processing of a map lies in the idea that fixating objects correlate with the cognitive processing of the fixated objects. This assumption is well established in cognitive studies such as Just and Carpenter [35] or Rayner [36] and also in recent cartographic research [37]. Thus, the following research questions arise: What is an effective visual strategy in pattern searching on a dynamic map? Can different spatial patterns be easier to detect? Are components of spatio-temporal relationships recognized with the same level of effectiveness?
Both spatial patterns and temporal trends are the subject of research in the context of the methodology adopted by Andrienko et al. [38]. In this regard, the main aim of this research was to assess the effectiveness of pattern and trend recognition on animated choropleth maps. Eye tracking could be used to help understand the differences between effective and ineffective recognition among study participants. Knowing that a specific spatial pattern or temporal trend is difficult to detect, end-users should be aware of a specific visual strategy that supports correct recognition. Additionally, we state the hypothesis that effective spatial pattern and temporal trend recognition on a choropleth map are related to participants’ visual behavior. To verify this research assumption, a map-based empirical study with participants and eye tracking technology was conducted. Therefore, in Section 3, the adopted methodology is presented, in particular: participants, equipment, materials, procedure, and analysis.
2. Related Research
Spatio-temporal data include data classifications according to changes occurring over time [39,40]. One can distinguish existential changes (disappearance/appearance), spatial property changes (visual variables), or thematic property changes (increase/decrease). Earlier, Peuquet [41] distinguished the space (where), time (when), and object (what) components of spatio-temporal data. Andrienko et al. [38] extended this issue. Identification and comparison tasks could serve as elementary searches or general searches since there is the possibility of distinguishing spatio-temporal map-based tasks. Such cartographic tasks do not contradict the phenomena taking place in geographical space. Moreover, many phenomena that change in space and time show regularities [42]. The correct identification of regularities is possible, among others, owing to an appropriate cartographic presentation. To estimate the correctness of the users’ perception of these regularities, one needs to design appropriate map-based tasks [43,44].
Regularities in geographical space can be viewed as spatial patterns or temporal trends [45]. The spatial pattern is related to the distribution of a phenomenon in physical or administrative space [46]. In geographic research, one can distinguish several patterns: clustered, peripheral, grid, linear, radial, or dispersed patterns [47,48,49,50]. In animated maps, these patterns change over time. However, despite the changes, several trends occur. The most basic temporal trends are an increase in phenomena, a decrease in a phenomenon, or the absence of a trend [51,52]. Of course, a more detailed breakdown of temporal trends considers increases and decreases, e.g., linear or logarithmic. In addition, it can also be cyclical.
Blok et al. [53] presented research on the visualization of the relationship between spatial patterns in time. They focused on synchronization, which is the main dynamic variable in cartographic animation. In their research, they designed an alternative visual exploration of spatio-temporal relationships. The results showed that one synchronous animation is sufficient to display juxtaposed data. However, it was found that, in some cases, the relationship between spatial patterns requires two alternative visualizations. Therefore, they concluded that empirical research is lacking in the determination of the effectiveness of the proposed tools.
Edsall et al. [54] provided tools for the visualization of spatial and temporal periodicity in geographic data. The proposed tools used both idealized and real-world environmental space–time data. Decomposing geographic time series involved using a three-dimensional Fourier transformation into spatio-temporal periodicities. Owing to these tools patterns and trends were easily observed. However, this study did not involve users’ visual cognition to understand the difficulties of pattern and trend recognition.
Griffin et al. [55] compared the visual identification of space–time clusters on animated maps and static small-multiple maps. Their research proved that animated maps contributed to the correct identification of patterns, contrary to small-multiple maps. The animation pace supported different types of clusters. Griffin et al. (2006) found a threshold in the animation pace. They identified that if the animation pace is too slow, correct spatial pattern identification decreases among users. However, in their study, clustered patterns moved in time and space, and they did not test the identification of other types of spatial patterns.
Schiewe [56] conducted empirical research on the visual perception of spatial patterns in choropleth maps. He examined the intuitive ranking of color lightness, the neglect of small areas, and the attention to data classification when interpreting spatial patterns. The study participants detected extreme values, central tendencies, and homogeneities. The results confirmed that a legend improves the effective identification of extreme values. Additionally, the detection rate of extreme values in small areas was increased. However, most participants relied on the color lightness distribution and not on the data classification during pattern interpretation.
Karsznia et al. [57] studied effective spatial pattern recognition in choropleth maps with an optimal hexagonal enumeration unit size. They examined nine sizes of hexagonal units and showed that the enumeration unit size impacts users’ spatial pattern recognition abilities. In conclusion, they argued that the largest and the smallest units’ were not suitable for indicating spatial patterns. Their research delivered the optimal range of EUS (enumeration size units) without indicating sharp boundaries. However, their experimental procedure did not include changes in the spatial pattern over time.
Changes in the detection of global trends and local outliers on an animated choropleth map were studied by Traun et al. [58]. In a user testing study, they found that outlier-preserving value generalization in space supports local outlier identification. However, generalization did not support the participants’ ability to correctly detect the spatial pattern movement. They conclude that spatial pattern recognition is related more to personal features (e.g., age) rather than specific map design.
Summarizing this section, it should be mentioned that spatial pattern cognition was well studied based on cartographic and psychological basics. The research gaps exist in the context of temporal trends in spatial patterns. There has been some indication of the effectiveness of patterns in trend recognition. However, the presented study focused more on trends in patterns, especially their effectiveness in terms of correct recognition and, additionally, users’ visual behavior during a map-based task.
3. Methodology
3.1. Participants
Eighteen students of the Faculty of Geographic and Geological Sciences at Adam Mickiewicz University participated in the experiment. The participants described their characteristics: age, gender, and education. A total of 10 of them indicated male gender and 8 indicated female gender. The participants’ age range was 21–22 years, and they were in the third year of their studies, taking geodetic and cartographic courses. They did not receive payment and participated voluntarily. They could resign from participation at any time in the study.
3.2. Equipment
To display map stimuli, an 27” ASUS LCD with a 1980 × 1080 px screen resolution was used. A Gazepoint GP3 HD eye tracker with a sampling frequency of 150 Hz recorded the participants’ eye movements. The visual angle accuracy was 0.5°, allowing up to 35 cm (horizontal) × 22 cm (vertical) movement. The average distance between the participant and the monitor was approximately 62 cm. The calibration procedure used a 9-point method using Gazepoint Control software (www.gazept.com, accessed 12 December 2021).
3.3. Materials
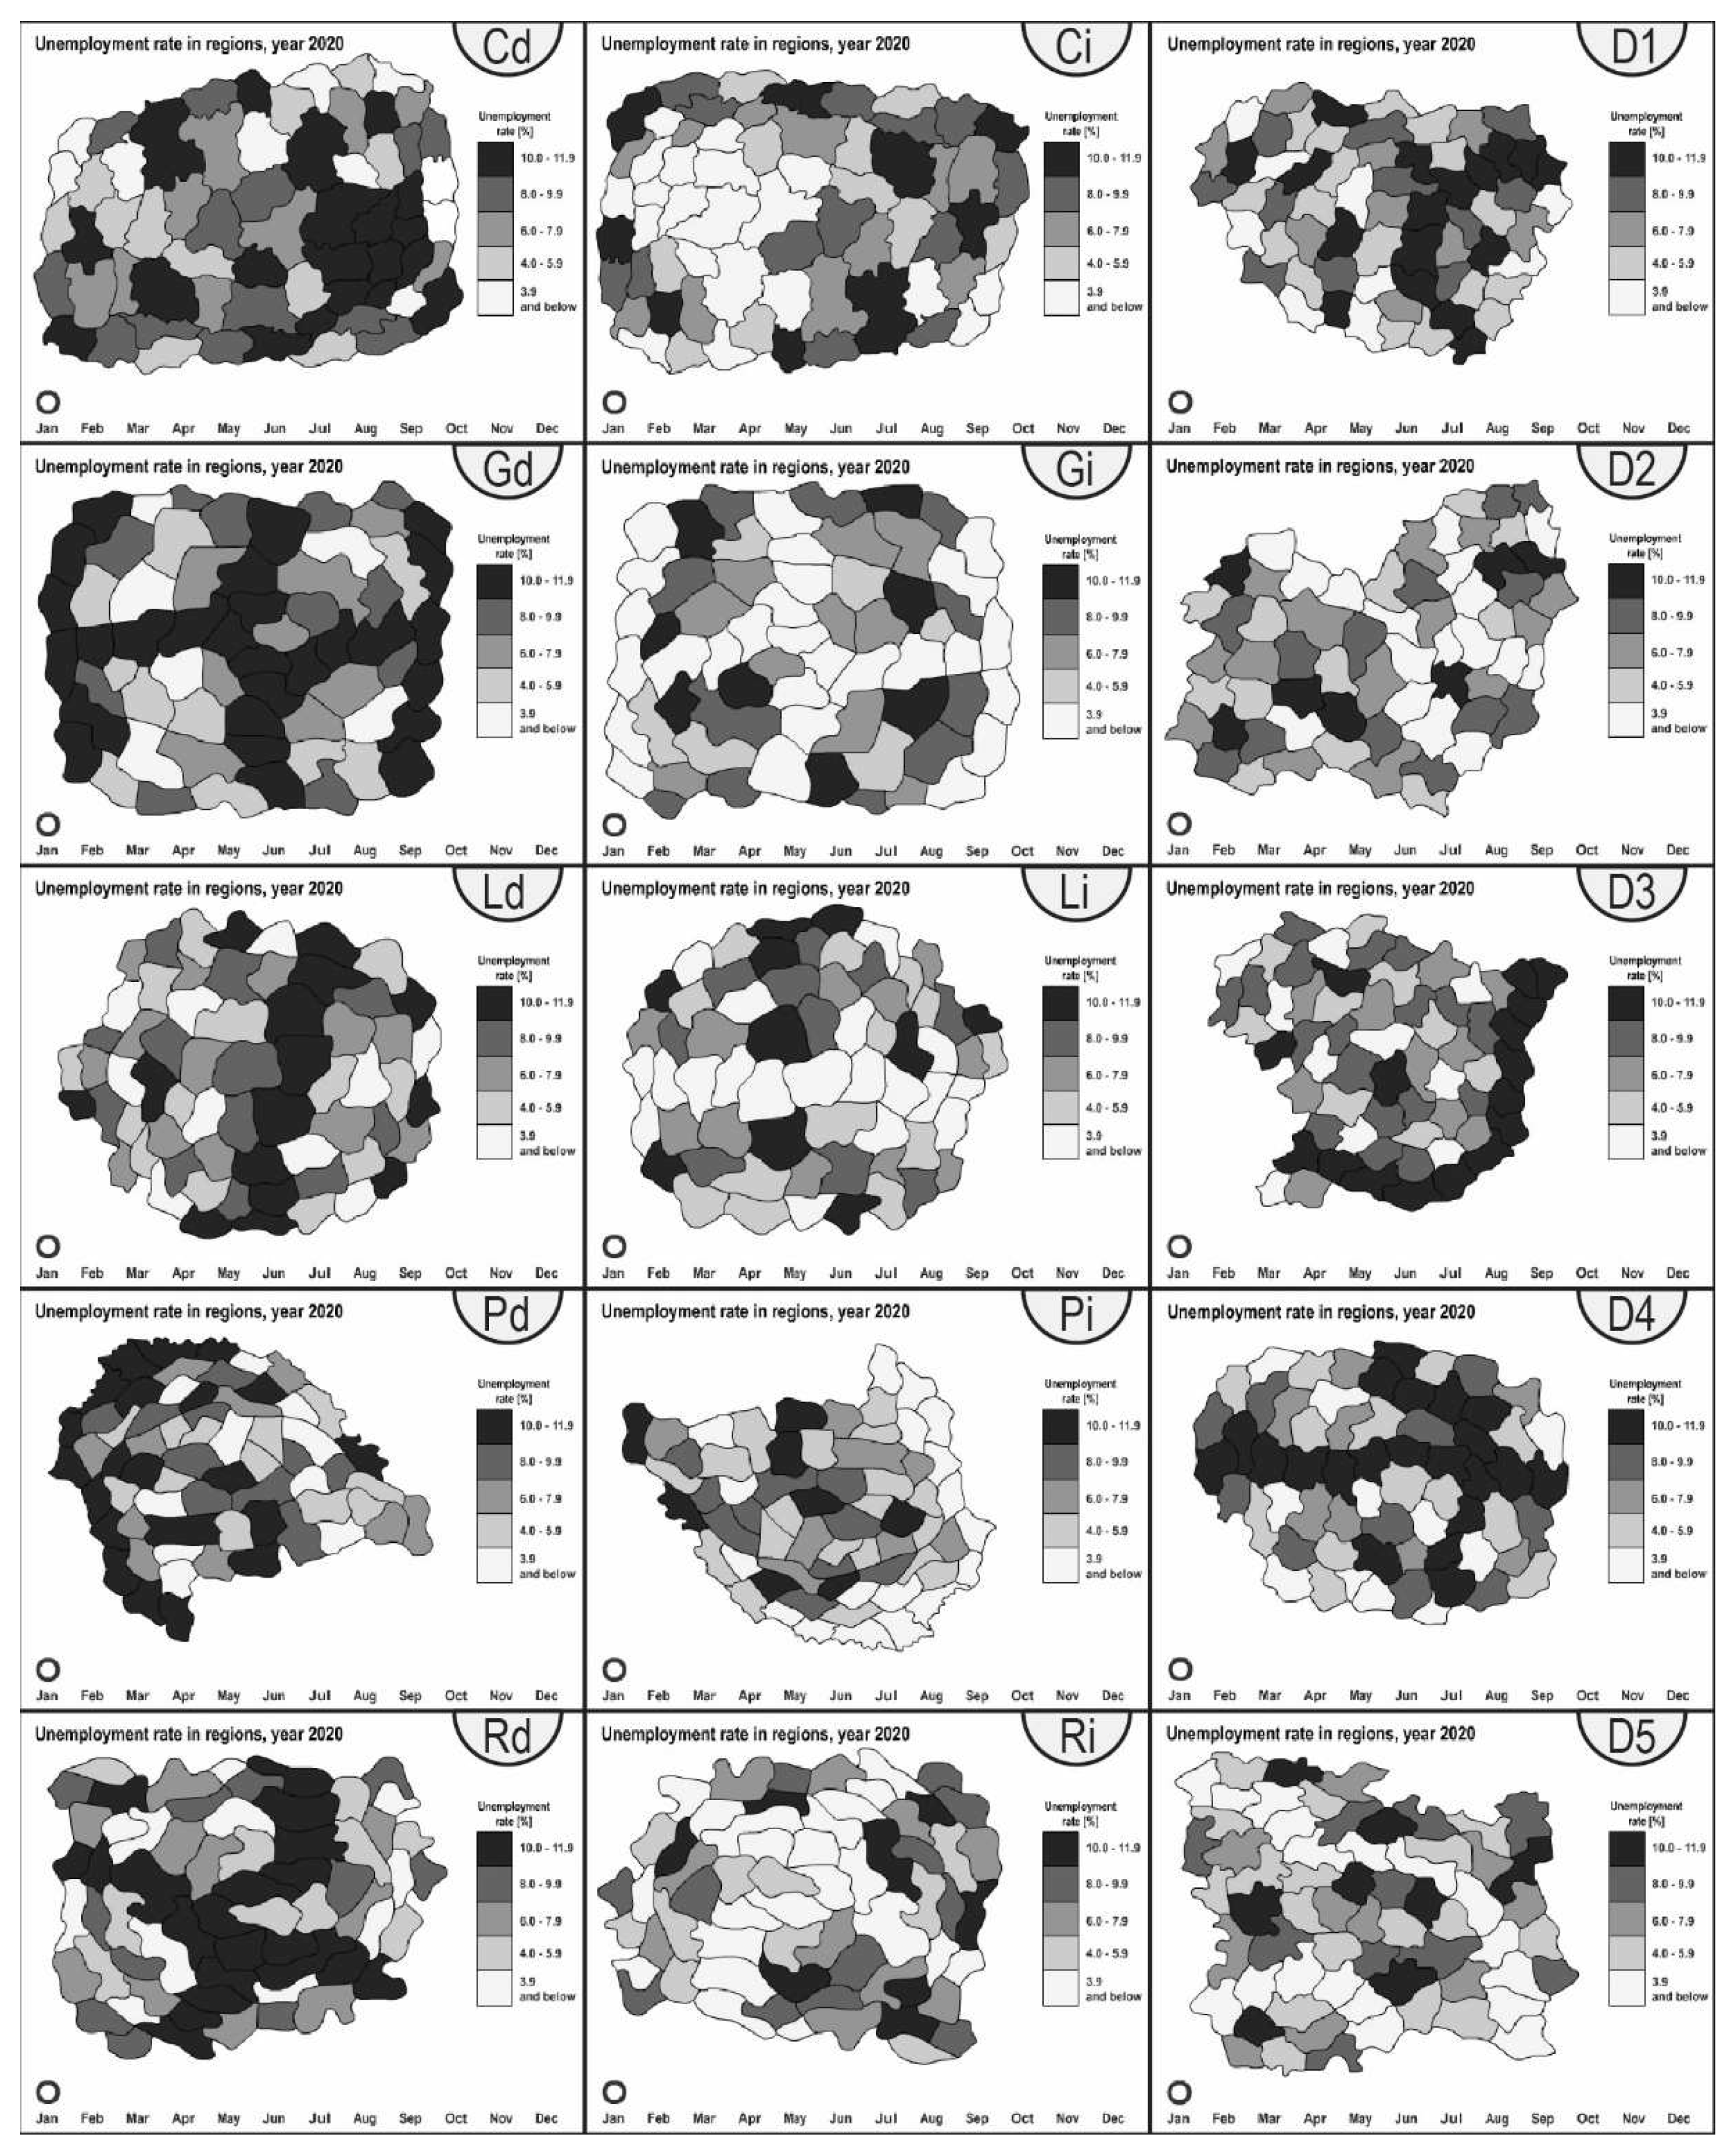
Fifteen animated choropleth maps of the unemployment rate constituted the main cartographic material. Each choropleth had 63 enumeration units classified into 5 classes of a sequential single-hue greyscale according to ColorBrewer 2.0 (5-class Greys). Each of the animated maps lasted 30 seconds and showed changes over twelve months. The study participants viewed each map once.
In the first month of the animation (January), the maps legibly showed (using one color hue) one of the following patterns: radial, clustered, linear, grid, peripheral, or dispersed (Figure 1). In the following months, the enumeration units changed their hue randomly except for the pattern units. The pattern units did change their hue randomly, but changed in a specific direction. There were two possible directions of this temporal trend: an increase (from light to dark) or a decrease (from dark to light). This indicated the phenomenon intensity. The pattern units did not change their hue altogether, but consequently changed in one of the directions of the trend.
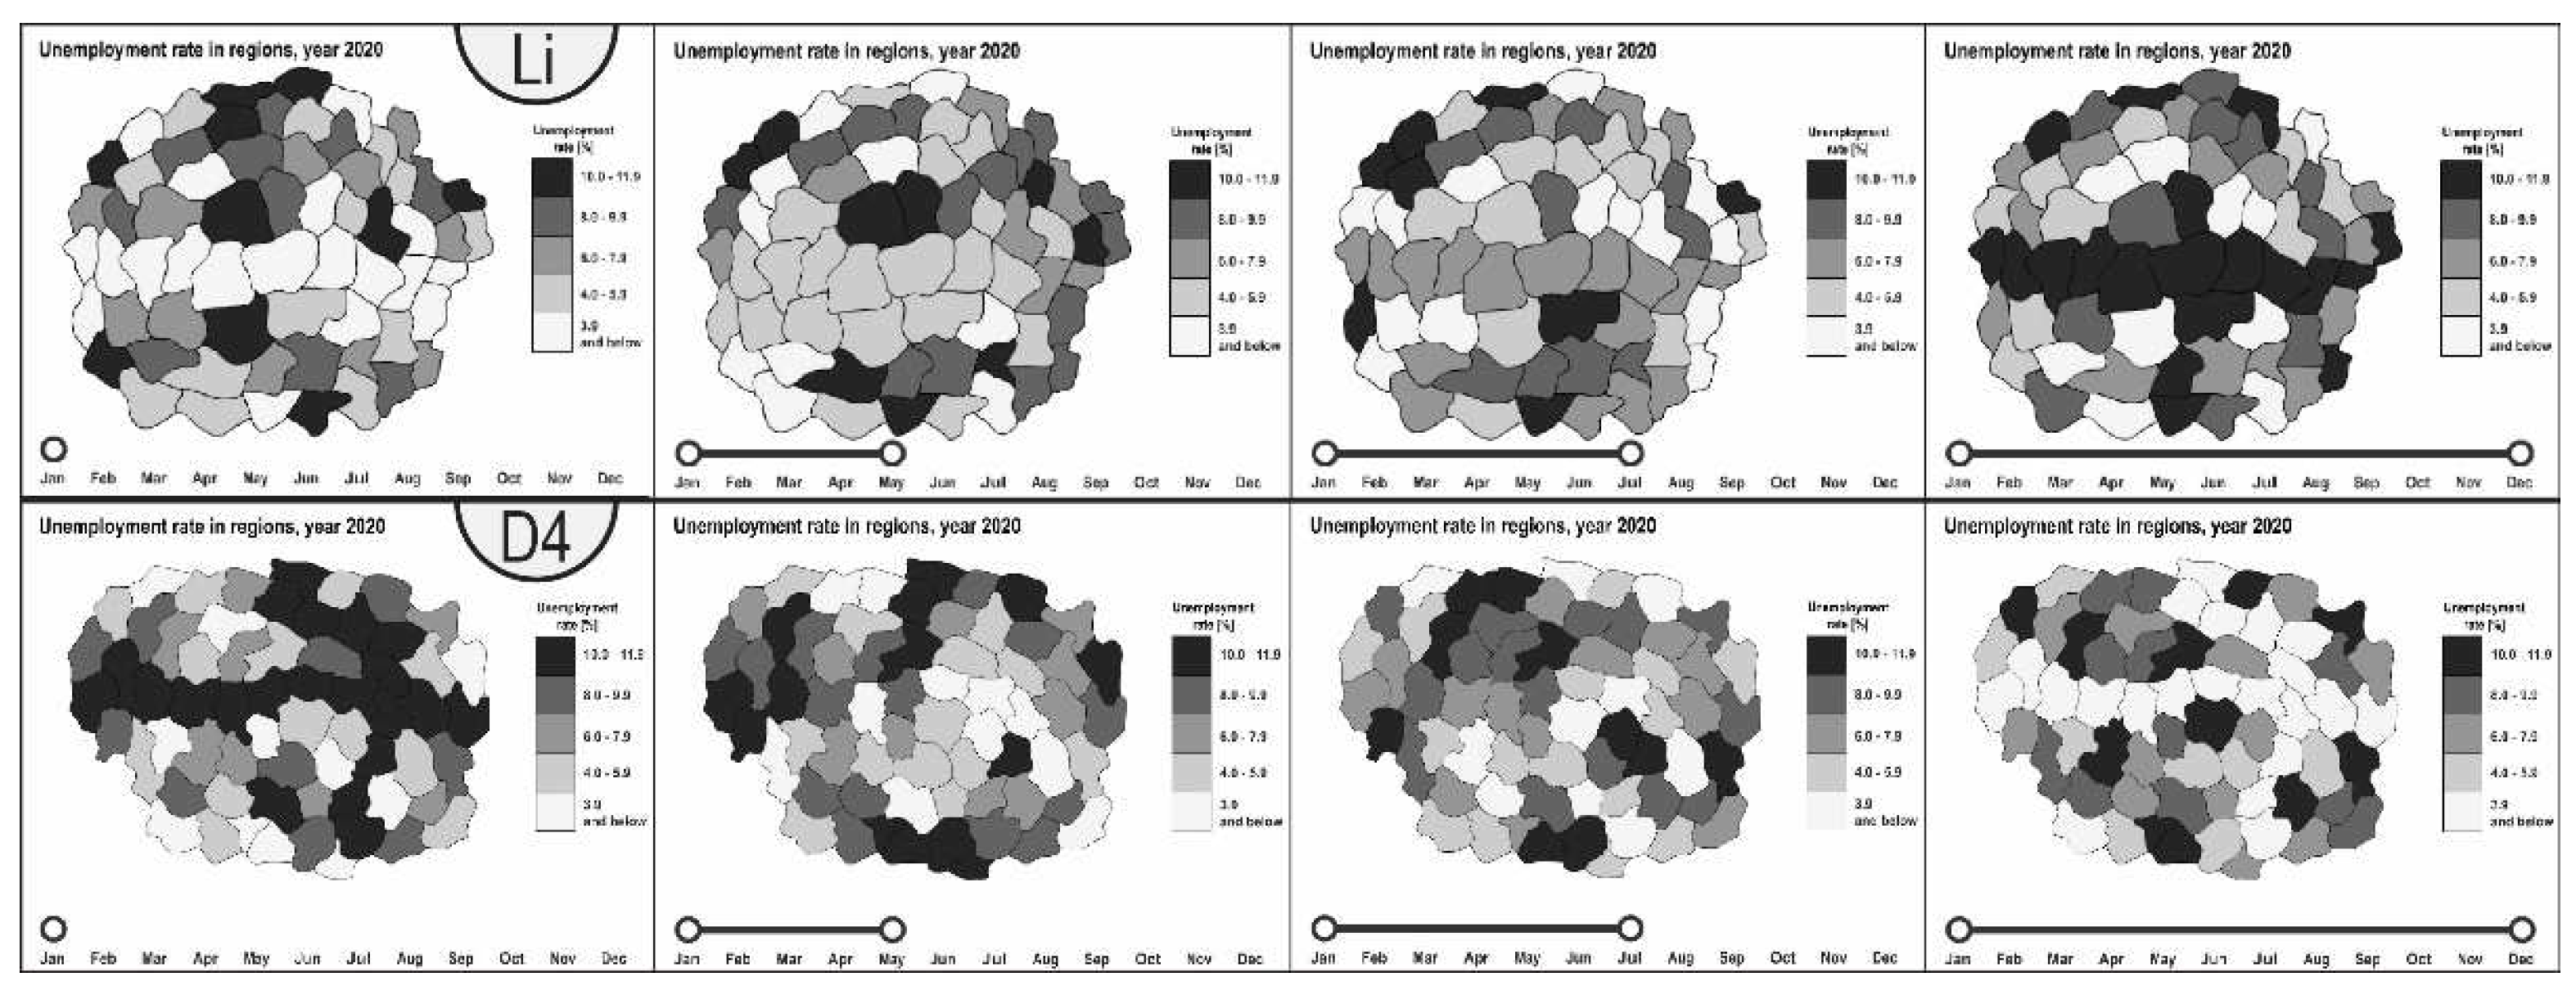
The only exception was the dispersed pattern. In this case, all of the enumeration units changed their hue randomly, even the pattern units. As a consequence, the pattern visible at the beginning of the animation was lost and did not follow any trend. Finally, in the last month of the animation (December), each pattern was again clearly visible with one color hue. Figure 2 present thes frames of the animated maps of linear patterns with an increasing trend and dispersed patterns with no trend.
3.4. Procedure
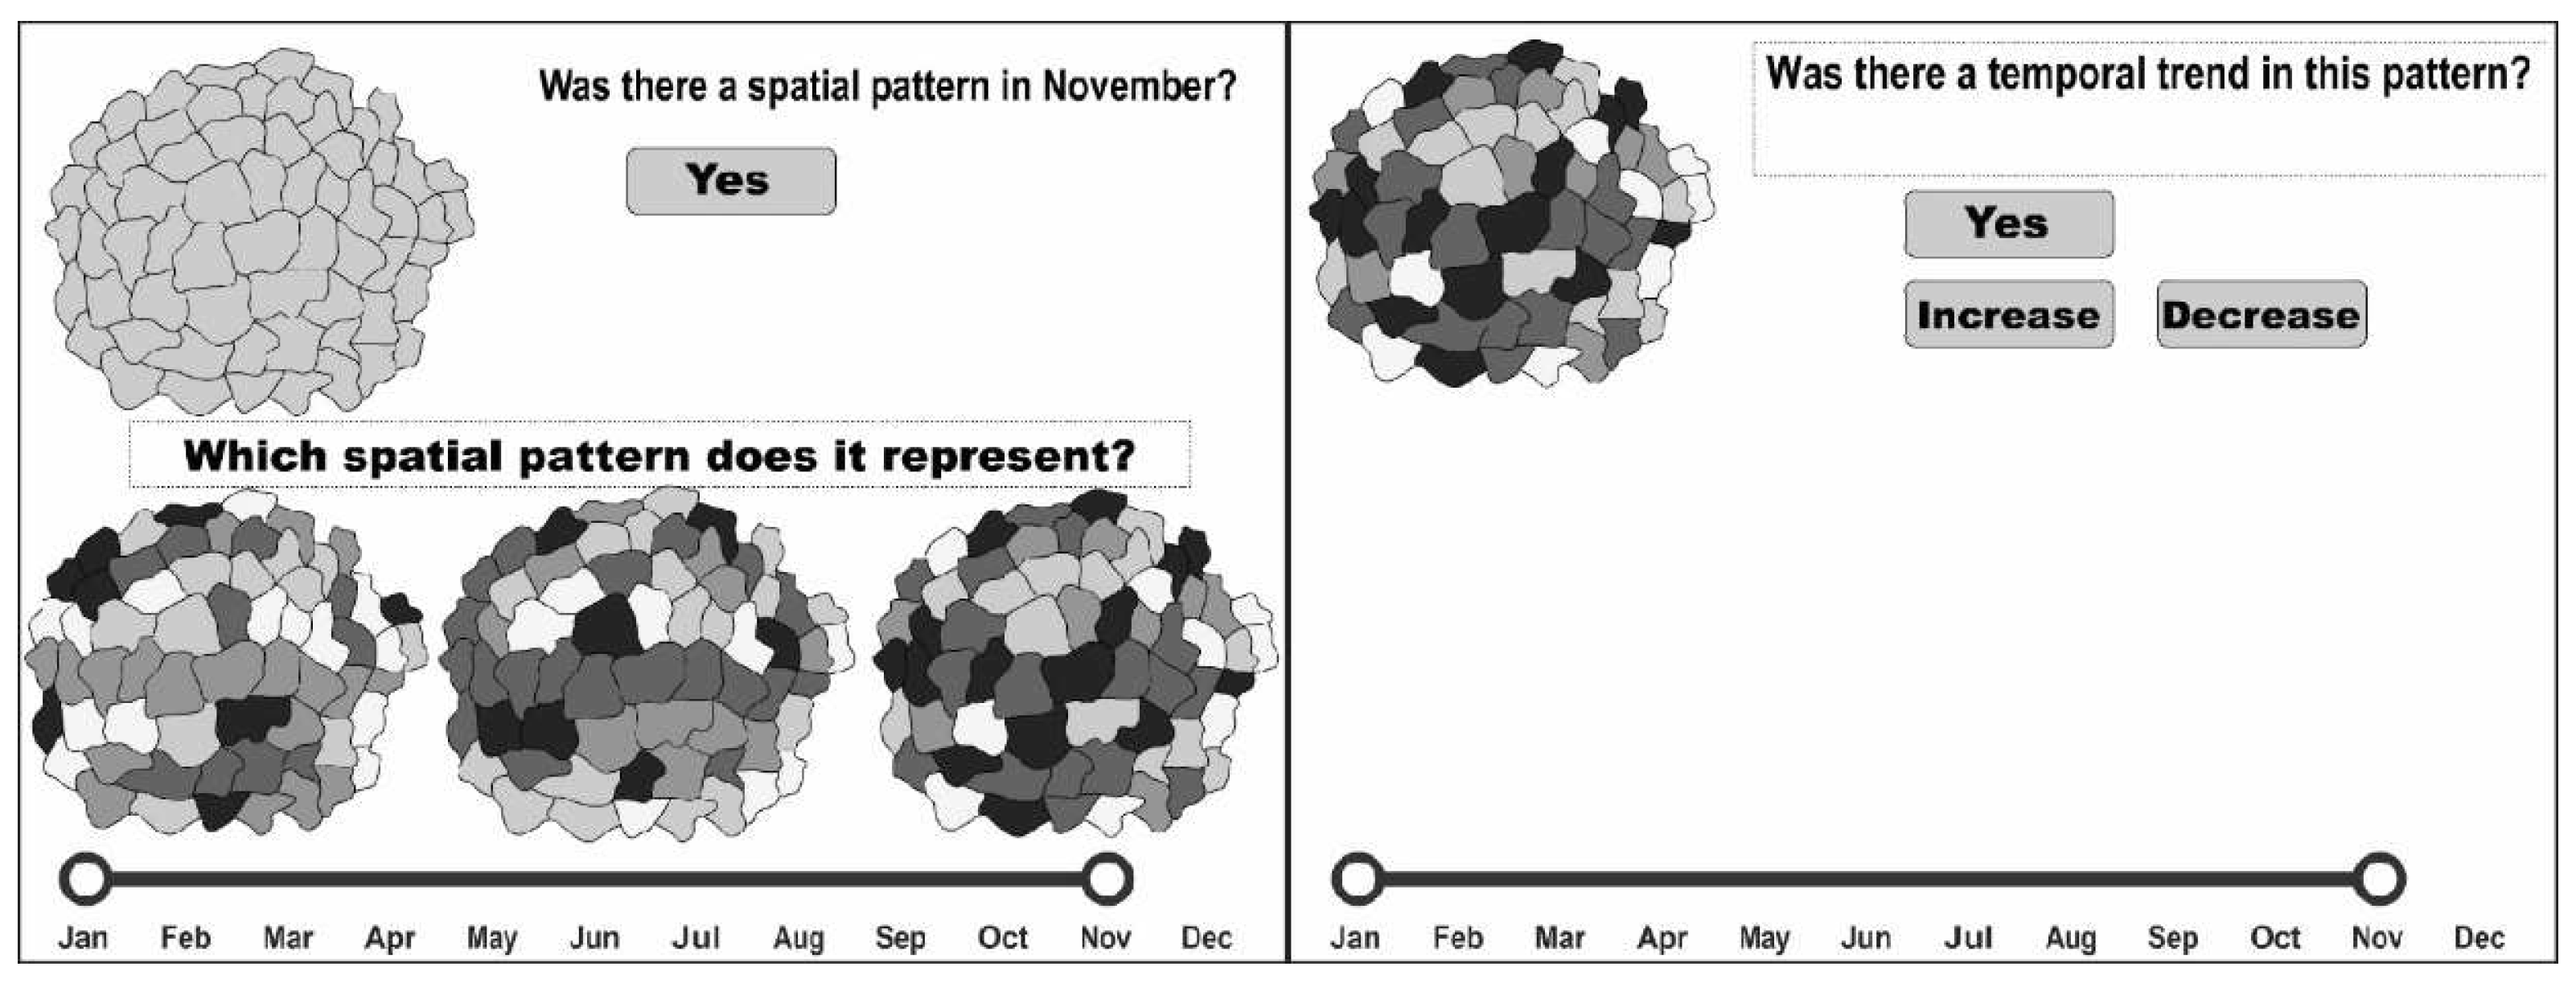
The procedure consisted of presenting all fifteen maps in a random order to each participant. Before the presentation, each study participant was given an introduction to the purpose of the study. The experiment began with a 9-point calibration reaching a gaze sample score of 90% on average. Secondly, participants performed a set of familiarization tasks. Next, they watched fifteen animated maps. After each map, there were three questions regarding spatial pattern and temporal trend (Figure 3 presents an interactive response protocol that appeared after the animation ended):
- Was there a spatial pattern in (random month except for January and December)? (Possible answers: Yes or No).
- Which spatial pattern does it represent? (One of three maps to choose from; only one was correct).
- Was there a temporal trend in this pattern? (Possible answers: Yes or No; if Yes, then the possible answers were Increase or Decrease)
3.5. Analysis
The analysis of participants’ visual behavior included eye tracking metrics such as fixation location, fixation count, fixation duration, and saccadic magnitude. Fixation count describes how many times the participants gazed at a specific location. This might indicate the ease in understanding the spatio-temporal data. The more fixations on the timeline, the more focused attention it required. This is related to the fixation duration. Longer durations might indicate a longer duration of attention. Therefore, these issues are related to perception. Saccadic magnitude describes the length of rapid eye movement from one fixation to another. This metric might suggest the difficulty in map interpretation. Participants’ shorter saccades correlated with a high number of long-duration fixations, which might result in ineffective spatio-temporal dependencies. The statistical analysis involved 6*2 Friedman’s test since the data had a non-parametrical distribution. The within-subject factors were the spatial pattern type (six conditions) and the correct recognition of patterns and temporal trends (two conditions). Correct pattern recognition effectiveness was based on the number of correct spatial pattern indications after the animation was viewed. It was a binary response, where 0 was assumed when the participants incorrectly identified a spatial pattern in a given month. Additionally, analyzing the spatial distribution of fixations was based on fixation coordinates recorded with eye tracking and spatial statistics such as Average Nearest Neighbor and Kernel Density.
4. Results
4.1. Spatial Pattern and Temporal Trend Recognition Effectiveness
Figure 4 presents the results of spatial pattern and temporal trend recognition effectiveness. The participants recognized the lack of a pattern the best (dispersed pattern); 73% of their answers were correct. There was a similar result in the case of recognizing the absence of a trend; 84% of the participants responded correctly. Correct identification at a random point (month) in the animation time was recorded for most of the studied patterns. The pattern recognition effectiveness ranged between 64% and 55%. The only exception was the radial pattern. Its effectiveness achieved 28%. The effectiveness of identifying temporal trends in spatial patterns ranged between 53% and 75%.
However, in some cases, the participants recognized the increasing trend more effectively than the decreasing trend. This was the case for the clustered pattern (recognition of 60% of the increasing trends vs. 40% of the decreasing trends), radial pattern (recognition of 60% of the increasing trends vs. 40% of the decreasing trends), and grid pattern (recognition of 58% of the increasing trends vs. 43% of the decreasing trends). In the case of a linear pattern and peripheral pattern, the trends’ recognition rates were similar (recognition of 48% of the increasing trends vs. 52% of the decreasing trends).
4.2. Participants’ Visual Behavior
Figure 5 presents Freidman’s test results in the context of three eye tracking metrics describing the participants’ visual behavior. Friedman’s test detected statistically significant differences between all three eye tracking metrics. Fixation count varied substantially among the selected factors. The highest differences were among clustered patterns juxtaposed with correct pattern and trend recognition. The second large significant difference between correct and incorrect answers was in the peripheral and linear patterns. In both patterns, participants who answered correctly had more fixation on the map in contrast to participants who recognized them incorrectly. Additionally, the radial pattern had significant differences in the fixation count among participants who responded correctly or incorrectly. However, in the case of grid patterns, the participants who correctly recognized spatio-temporal dependencies had fewer fixations than those who responded incorrectly (χ2 = 82.4; p < 0.000001). This shows that, in most cases, if participants had to fixate more on the animated map, there was a higher probability of incorrect recognition of spatial patterns and temporal trends.
Fixation duration was differed significantly among participants’ pattern and trend recognition in radial pattern conditions (χ2 = 9.6; p < 0.00193). Interestingly, the radial pattern was the least effective recognized pattern by participants. Participants who incorrectly recognized spatio-temporal dependencies had longer fixations, while participants who responded correctly had a statistically significantly shorter fixation duration.
Saccadic magnitude expressed in visual angle degrees was statistically significant among the selected within-subject factors (χ2 = 3.28; p < 0.04). The saccadic magnitude was similar in the case of dispersed and peripheral patterns. The most crucial variation between participants’ correct and incorrect recognition of spatio-temporal relations was visible in the case of the clustered, radial, and linear patterns. It is significant that these patterns had the lowest effectiveness in temporal trend detection. In the linear and radial pattern conditions, participants who incorrectly responded had longer saccades, while in the clustered pattern it was the opposite.
Inconsistency between the spatial patterns regarding correct and incorrect responses among the selected eye tracking metrics is visible. It should be noted that different spatial patterns require various visual behaviors for effective performance. The main factor crucial for determining effective visual behavior is the fixation count. Statistically significant differences between the saccadic magnitude in the linear, clustered, and radial patterns might indicate that these are more complex patterns for visual analysis. Since the dispersed, peripheral, and grid patterns had similar saccadic magnitude differences, shorter saccades could be crucial for effective recognition of these patterns. This might be confirmed by the finding that these patterns had similar visual strategies according to the fixation count.
Based on Euclidean distance Average Nearest Neighbor was calculated for correct and incorrect recognition participants. The results are presented in Table 1, which contains all related values such as Observed Mean Distance (OMD), Expected Mean Distance (EMD), Nearest Neighbor Index (NNI), z-score (z), and p-value (p). Most fixations, both correct and incorrect recognition, showed statistically significant clustering visual behavior. The only exception was a dispersed pattern with incorrect recognition participants (random distribution of fixations). The calculated distance included the local coordinate system of the recorded screen. Therefore, the X and Y axes of the coordinate system were a percentage of the monitor height and width.
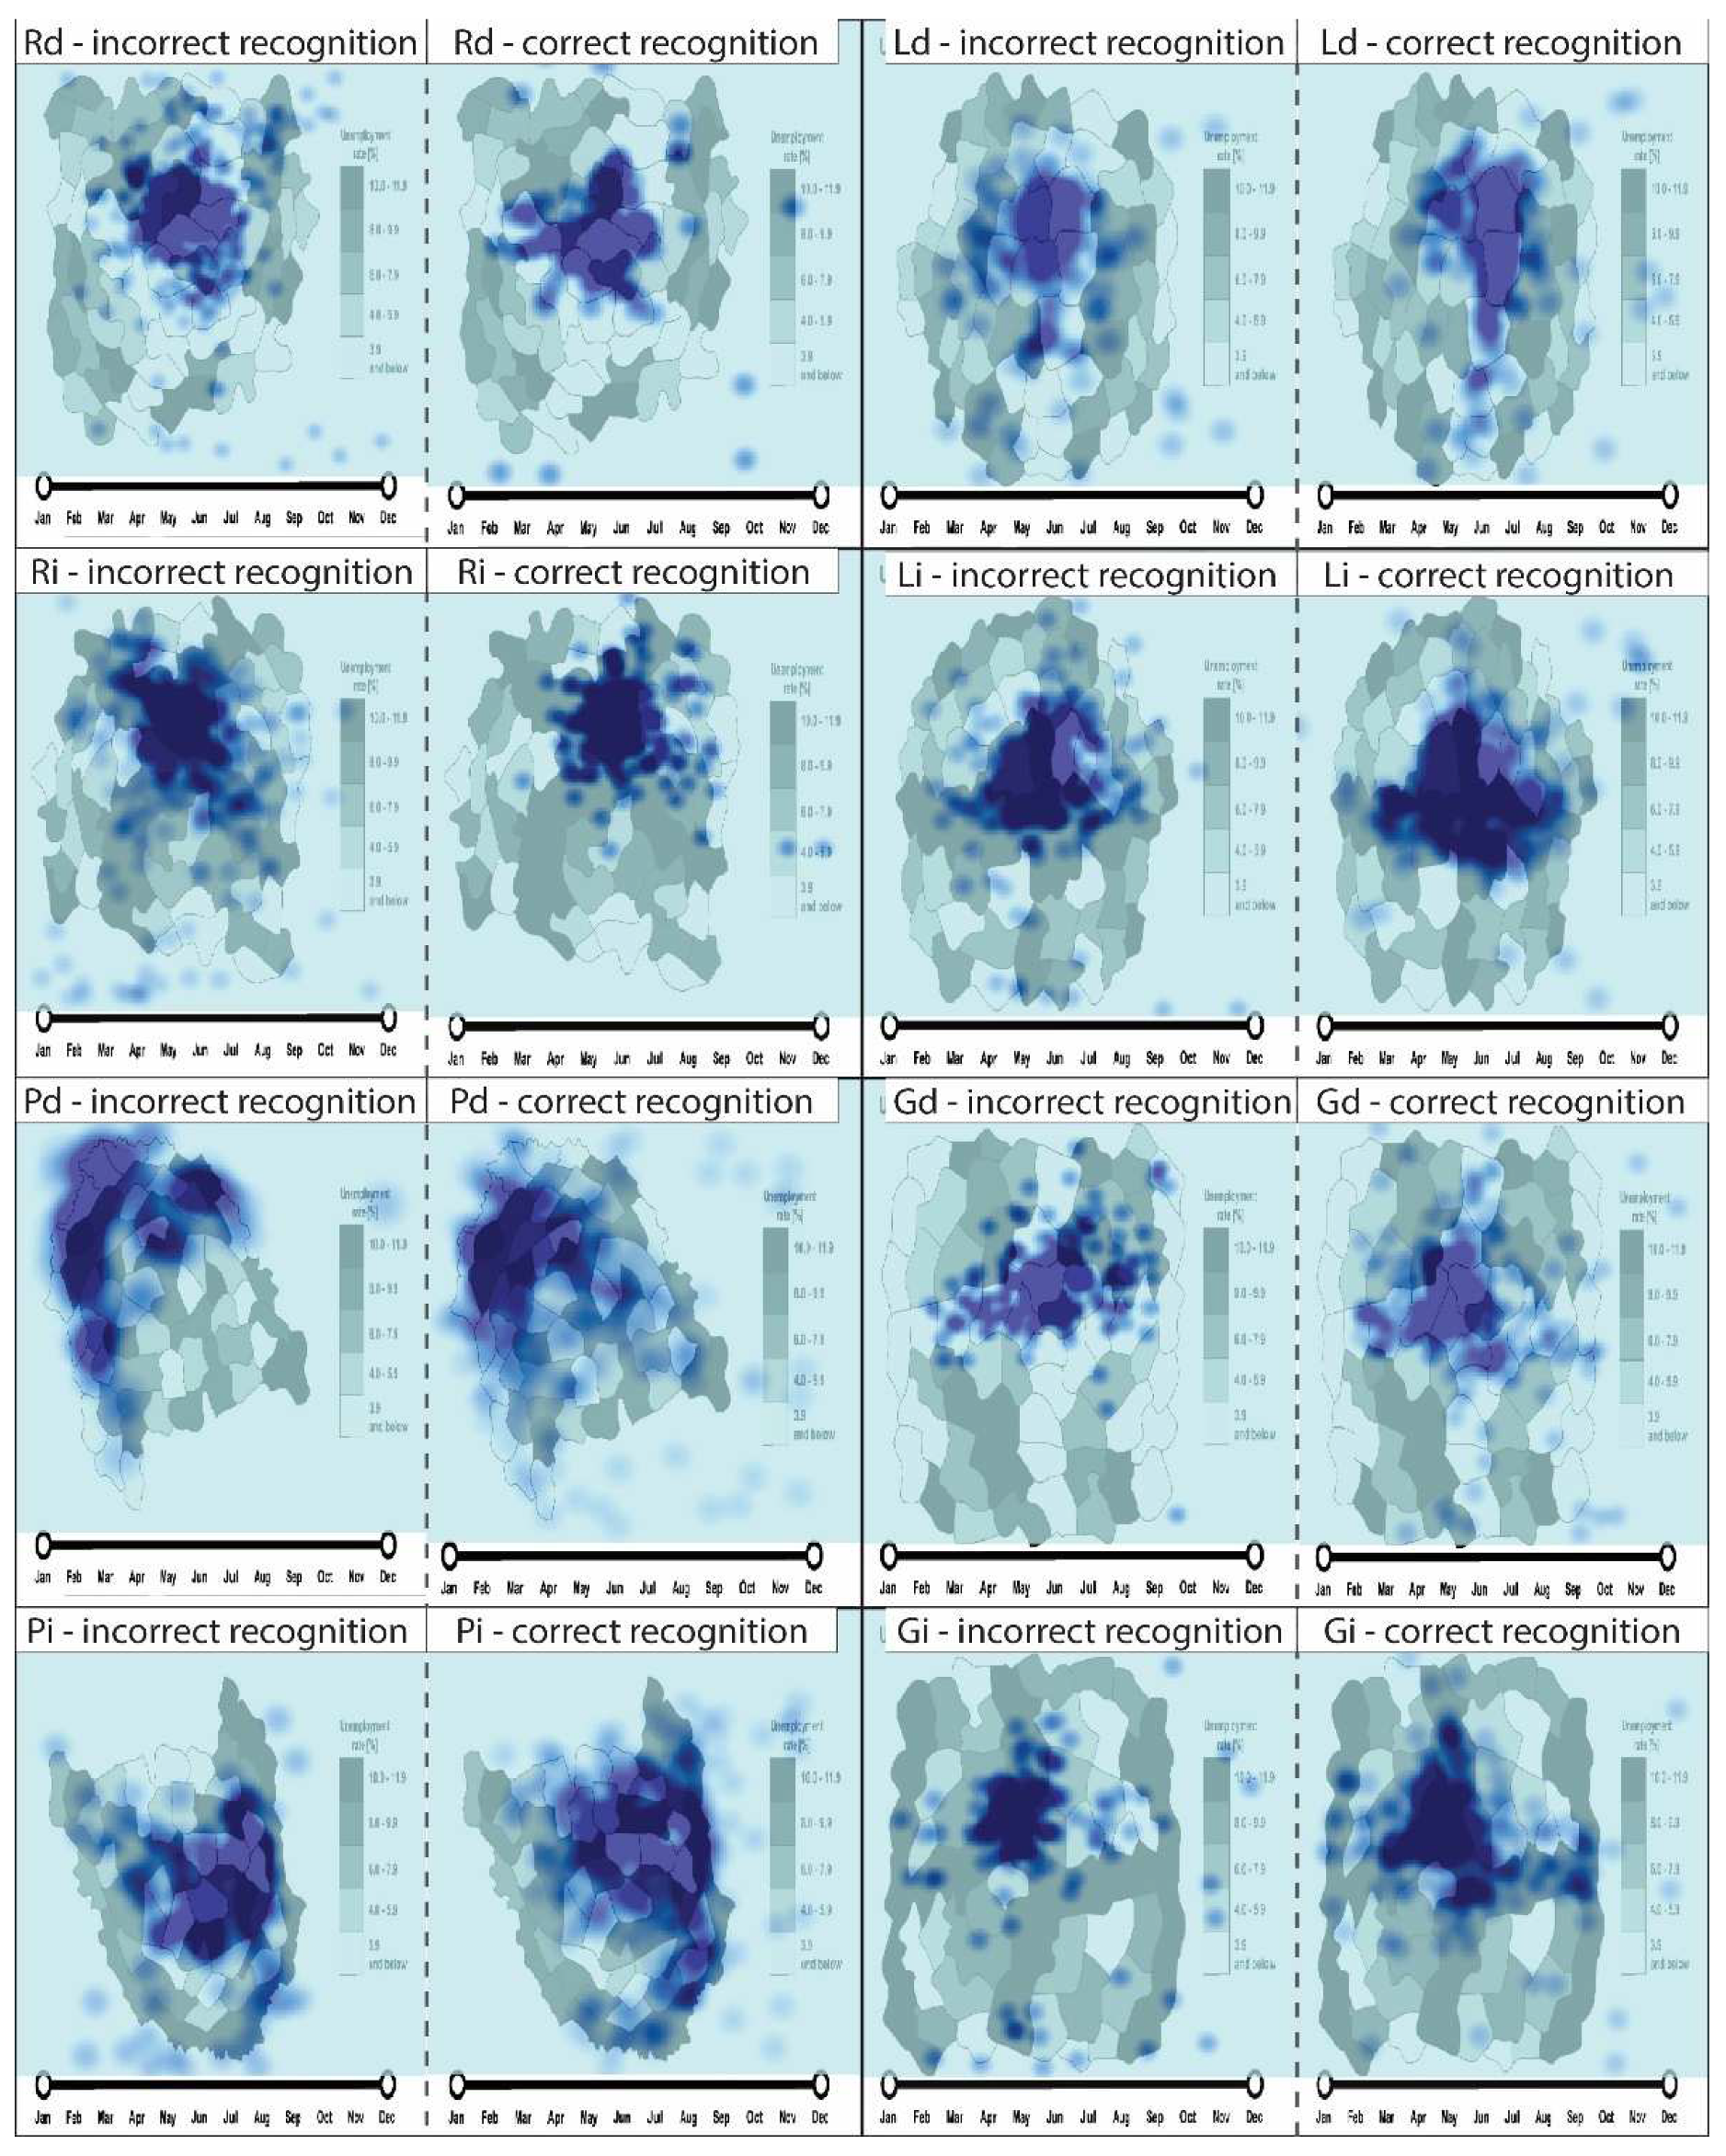
This clustering of participant fixations was confirmed and located on a map stimulus with Kernel Density. In most cases, participants who correctly recognized the spatial patterns and temporal trends had different fixation concentration areas from those of participants with incorrect responses. As can be seen in Figure 6, correct recognition corresponds to a specific visual behavior. This consisted of the concentration of fixations near the spatial pattern. However, in particular, what distinguished correct recognition from incorrect recognition was that, if the recognitions were correct, the fixation clusters covered a larger area of the map. It is significant that the correct recognition fixation cluster covers a larger part of the spatial pattern than in the case of incorrect recognition. The only exception was the clustered pattern. For the decreasing temporal trends, the participants’ correct recognition fixation cluster covers a larger area. However, it is slightly shifted from the pattern. Therefore, the cluster area of fixations is outside the pattern on the map. In the case of increasing temporal trends, the incorrect recognition fixation cluster covers a larger area than that of the correct recognition cluster. Therefore, there is a difference between the participants’ visual behavior.
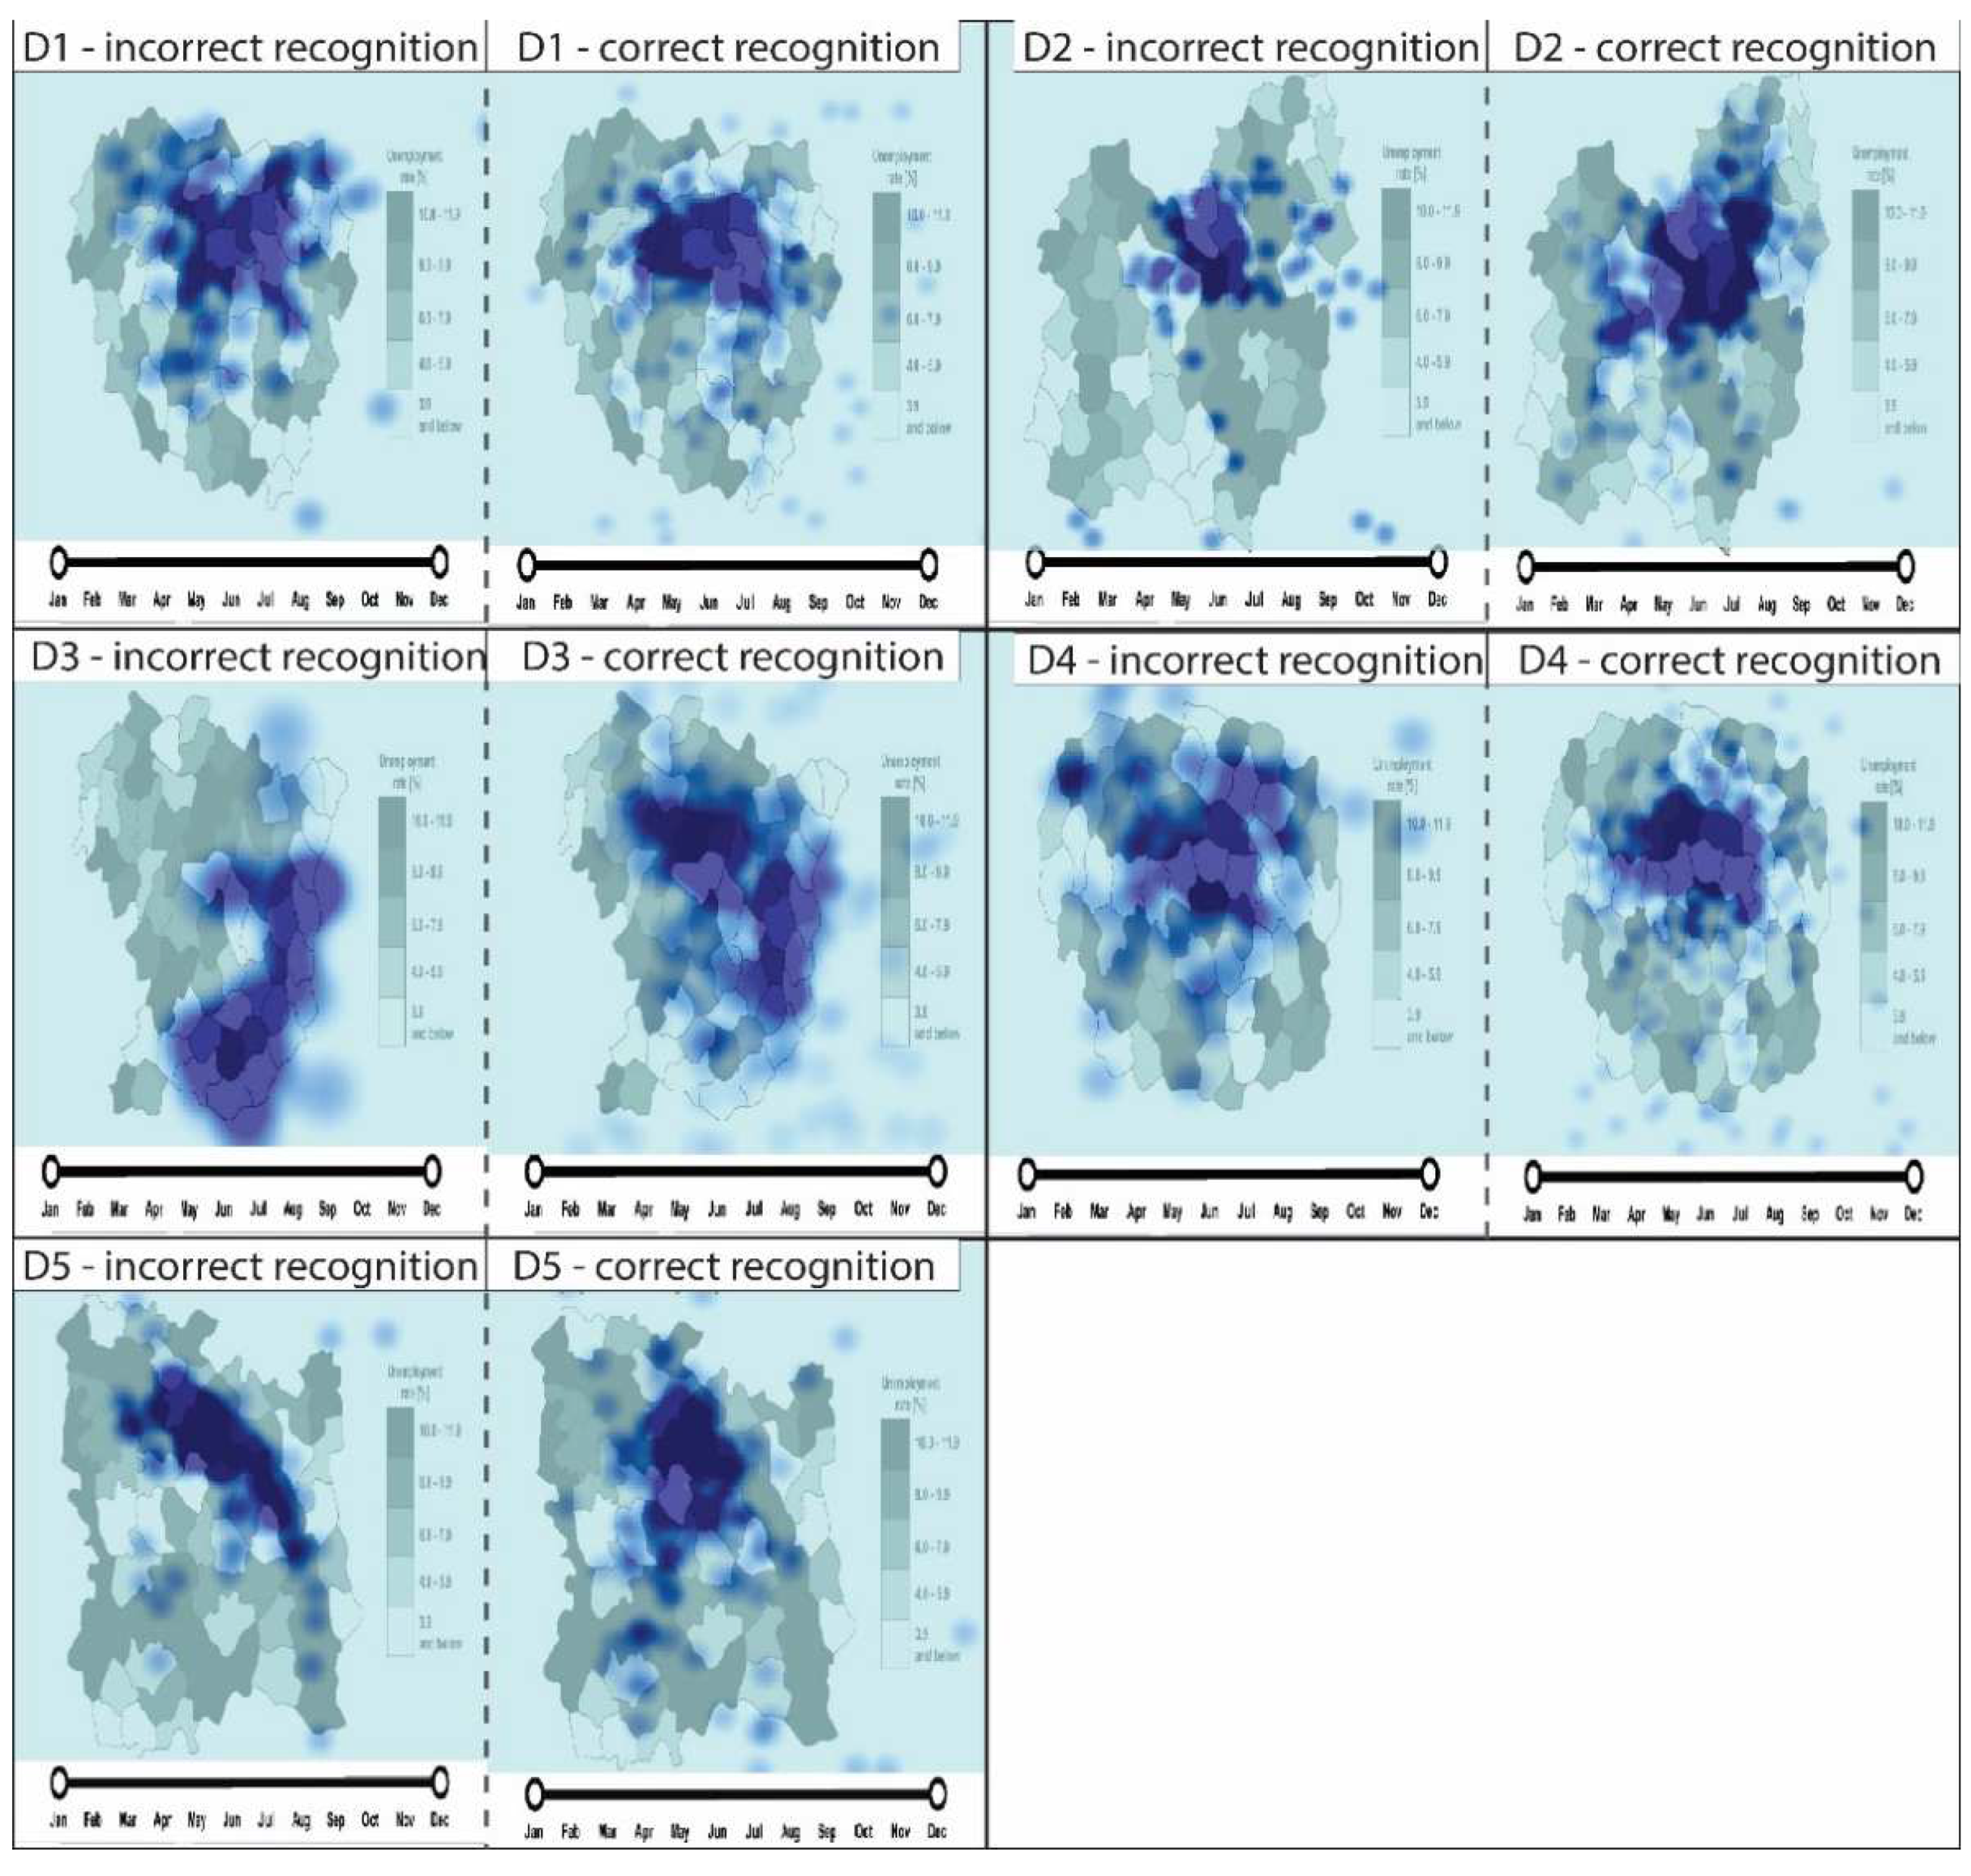
When analyzing the lack of patterns (dispersed pattern), the results are not as clear as when there was a presence of a spatial pattern. Participants’ fixation clusters occur in both incorrect and correct recognition. In the case of the D1, D2, and D4 maps, the cluster distribution is similar to the case of the occurrence of the spatial patterns and temporal trends. Correct recognition fixation clusters cover a larger area. The situation is different when analyzing the D3 and D5 maps. In both cases, the incorrect recognition fixation clusters cover a larger area than the correct recognition fixation clusters. Figure 7 presents the result of Kernel Density based on the participants’ fixation and recognition.
5. Discussion
The effectiveness, measured as the correct recognition of temporal trends and spatial patterns, differed among the analyzed stimuli. It appears that the study participants were better at recognizing temporal trends for most of the maps. This is especially beneficial for animated maps related to injury prevention. Cinnamon et al. [59] showed that participants could detect temporal trends relatively quickly, in comparison to static and interactive maps. Therefore, this study consists of empirical evidence supporting the previous hypothesis regarding the usefulness of animated products for the visualization of temporal trends [14,60]. Choropleth maps are more effective when the data have a peripheral spatial pattern or the lack of one (effectiveness above 64%). For the visualization of data with a radial pattern, one should search for other mapping methods due to the low choropleth map effectiveness (below 29%). The presented research had only one animation speed. However, according to Griffin et al. [55], different animation speeds may support the recognition of some patterns. Additionally, following Roth’s [4] suggestions of including interactive tools could increase animated map effectiveness. Considering hexagonal enumeration units might also help in the recognition of less effective patterns (e.g., radial) [57]. Even some techniques of highlighting the most crucial information might be worthy of consideration [25].
The recognition of spatial patterns was found to be more difficult than the recognition of temporal trends. Based on the results, the most effective was the dispersed pattern. This proves previous assumptions that animated conditions support both the lack of pattern recognition and strong pattern recognition [55]. This is also true for the recognition of temporal trends, which did not appear while displaying dispersed pattern maps. It was found that most of the patterns analyzed in this study had similar effectiveness (from 55% to 64%). The only exception was the radial pattern, which had the lowest effectiveness (28%). This type of spatial pattern is related to road and railroad mapping [61].
The study results report statistically significant differences between correct (effective) and incorrect (ineffective) recognition of temporal trends and spatial patterns. These differences are related to participants’ visual behavior. As Shiewe [56] showed, different choropleth mapping techniques could support the successful interpretation of cartographic data. However, this study used only one mapping method. Therefore, the spatial pattern classification is related to the color intensities, and a legend was rarely fixated upon. Differences in the participants’ correct and incorrect recognition were visible in the saccadic magnitude in the case of the clustered, radial, and linear patterns. Two of these patterns were the only ones where the participants recognized more increasing trends than decreasing ones. In Cybulski’s [33] study, different saccade lengths are related to variability in spatial abilities or other personal features. Additionally, Dong et al. [62] presented the role of previous experiences in differences between the spatial behavior of novices and experts. Finally, Trauns et al.’s [58] study confirmed the reported results regarding the role of map users’ personal features, which may determine map effectiveness to a greater extent than the specific map design itself.
The spatial analysis of the visual behavior showed that the study participants fixated mostly on specific areas. Fixation clusters appeared among correct and incorrect recognitions. The fixation clusters were located in the central part of the map. The only exceptions were maps with a peripheral pattern and some dispersed patterns (D3), which generated clusters that were shifted to near the pattern. Previous studies by Dong et al. [63] and Cybulski and Krassanakis [64] have explained this type of visual behavior. To observe the whole map during animation, the participants mainly observed its central part. The participants’ sporadically observed peripheral parts of the map. A larger area covered by longer duration fixations characterized the participants’ correct recognition fixation clusters. This might be related to change blindness when a participant fails to notice a change on a dynamic map [63,65].
6. Conclusions
The main aim of this research was to investigate the effectiveness of spatial pattern and temporal trend recognition assessment on a choropleth map. The presented study achieved this goal. The results show that spatial pattern recognition on a choropleth map varies, and that this depends on the pattern itself. The radial pattern was the least effective, and the peripheral pattern was the most effective. Despite this, the results were compared to those for maps with no pattern (dispersed pattern) and showed that recognizing the lack of a pattern is even more effective. Therefore, animated choropleth maps could support the visualization of specific spatial patterns. However, they are more suitable for presenting temporal trends. Temporal trends in spatial data had a recognition effectiveness of 64%.
The empirical results confirm the research hypothesis that effective spatial pattern and temporal trend recognition on a choropleth map is related to participants’ visual behavior. Visual attention clustered in the central part of the choropleth map supports effective spatio-temporal relationship recognition. The larger the area covered by the fixation cluster, the higher the probability of correct temporal trend and spatial pattern recognition. This has specific implications for map makers and map users. For the visualization of temporal trends in spatial patterns using a choropleth map, one might consider a simple design since the interpretation of this type of data is more demanding than a static map. Understanding the difficulty in the correct recognition of spatio-temporal relationships might be a reason for implementing techniques that support effective visual searches such as highlighting, cartographic redundancy, or interactive tools. For end-users, the presented study reveals the necessity of the application of a specific visual strategy. Focusing on the central part of the map was found to be the most effective strategy for the recognition of spatio-temporal relationships.
The study limitations relate to the number of participants. Due to the COVID-19 pandemic, we experienced difficulties with user testing. This was related to legal restrictions and the necessity to maintain social distance and disinfect equipment and rooms. Therefore, it would be beneficial to increase the number of research participants in future studies.
In future studies, it would be interesting to compare the presented results with different spatial pattern and temporal trend mapping methods. This would help find the best cartographic solutions for spatio-temporal relationships, which are ineffective using a choropleth map. The presented study does not exhaust the topic of recognizing patterns and trends on maps. Users might experience more complex spatial patterns or more than one pattern on a map. Additionally, a temporal trend might initially be an increasing trend, and afterward become a decreasing trend. These more complicated spatio-temporal relationships require interdisciplinary studies, including cartography and psychology. Future cartographic visualization designers might benefit from these empirical results by taking into account the awareness that map users do not perceive space and time with the same level of effectiveness. The author believes that future temporal cartographic products need to be reconsidered in terms of temporal legend design to maintain effective communication with the user.
Funding
This research received no external funding.
Data Availability Statement
The data that support the findings of this study are openly available in the “Harvard Dataverse” at https://0-doi-org.brum.beds.ac.uk/10.7910/DVN/NFJW6B.
Acknowledgments
The author would like to thank all anonymous reviewers for their fruitful comments and recommendations. The paper is the result of research on visualization methods carried out within statutory research in the Department of Cartography and Geomatics, Faculty of Geographical and Geological Sciences, Adam Mickiewicz University Poznan, Poland.
Conflicts of Interest
The author declares no conflict of interest.
References
- Gartner, G.; Bennet, D.A.; Morita, T. Towards ubiquitous Cartography. Cartogr. Geogr. Inf. Sc. 2007, 34, 247–257. [Google Scholar] [CrossRef] [Green Version]
- Edler, D.; Dickmann, F. The Impact of 1980s and 1990s Video Games on Multimedia Cartography. Cartographica 2017, 52, 168–177. [Google Scholar] [CrossRef]
- Medyńska-Gulij, B.; Forrest, D.; Cybulski, P. Modern Cartographic Forms of Expression: The Renaissance of Multimedia Cartography. ISPRS Int. J. Geoinf. 2021, 10, 484. [Google Scholar] [CrossRef]
- Roth, R.E. Interactive maps: What we know and what we need to know. J. Spat. Inf. Sci. 2013, 6, 59–115. [Google Scholar] [CrossRef]
- Roth, R.E.; Donohue, R.G.; Sack, C.M.; Wallace, T.R.; Buckingham, T.M.A. A Process for Keeping Pace with Evolving Web Mapping Technologies. Cartogr. Perspect. 2014, 78, 25–52. [Google Scholar] [CrossRef] [Green Version]
- Sack, C.M.; Donohue, R.G.; Roth, R.E. Interactive and Multivariate Choropleth Maps with D3. Cartogr. Perspect. 2014, 78, 57–78. [Google Scholar] [CrossRef]
- Horbiński, T.; Cybulski, P.; Medyńska-Gulij, B. Web Map Effectiveness in the Responsive Context of the Graphical User Interface. ISPRS Int. J. Geoinf. 2021, 10, 134. [Google Scholar] [CrossRef]
- Medyńska-Gulij, B. Cartography and Geomedia; Wydawnictwo Naukowe PWN: Warsaw, Poland, 2021; p. 12. [Google Scholar]
- Medyńska-Gulij, B.; Halik, Ł.; Wielebski, Ł.; Dickmann, F. Multiperspective visualization of spatial spare time activities—A smartphone-based approach to mapping tourist routes. KN-J. Cartogr. Geogr. 2015, 65, 323–329. [Google Scholar]
- Halik, Ł.; Kent, A.J. Measuring user preferences and behaviour in a topographic immersive virtual environment (TopoIVE) of 2D and 3D urban topographic data. Int. J. Digit. Earth 2021, 14, 1835–1867. [Google Scholar] [CrossRef]
- Medyńska-Gulij, B.; Tegeler, T.; Bauer, H.; Zagata, K.; Wielebski, Ł. Filming the Historical Geography: Story from the Realm of Maps in Regensburg. ISPRS Int. J. Geoinf. 2021, 10, 764. [Google Scholar] [CrossRef]
- Horbiński, T.; Zagata, K. Interpretation of Map Symbols in the Context of Gamers’ Age and Experience. ISPRS Int. J. Geoinf. 2022, 12, 150. [Google Scholar] [CrossRef]
- Harrower, M. A look at the history and future of animated maps. Cartographica 2004, 39, 33–43. [Google Scholar] [CrossRef]
- Harrower, M. The Cognitive Limits of Animated Maps. Cartographica 2007, 42, 349–357. [Google Scholar] [CrossRef]
- Fish, C. Cartographic Challenges in Animated Mapping. In Proceedings of the ICA Workshop on Envisioning the Future of Cartographic Research, Curitiba, Brazil, 21 August 2015. [Google Scholar]
- Andrienko, G.; Andrienko, N.; Demsar, U.; Dransch, D.; Dykes, J.; Fabrikant, S.I.; Jern, M.; Kraak, M.-J.; Schumann, H.; Tominski, C. Space, time and visual analytics. Int. J. Geogr. Inf. Sci. 2010, 24, 1577–1600. [Google Scholar] [CrossRef] [Green Version]
- Hegarty, M.; Kriz, S.; Cate, C. The roles of mental animations and external animations in understanding mechanical systems. Cogn. Instr. 2003, 21, 325–360. [Google Scholar] [CrossRef]
- Lee, P.U.; Klippel, A.; Tappe, H. The effect of motion in graphical user interfaces. In Smart Graphics: Lecture Notes in Computer Science; Butz, A., Krüger, A., Olivier, P., Eds.; Springer: Berlin/Heidelberg, Germany, 2003; Volume 2733, pp. 12–21. [Google Scholar]
- Juergens, C. Trustworthy COVID-19 Mapping: Geo-Spatial Data Literacy Aspects of Choropleth Maps. KN-J. Cartogr. Geogr. 2020, 70, 155–161. [Google Scholar] [CrossRef] [PubMed]
- von Wyss, M. The production of smooth scale changes in an animated map project. Cartogr. Perspect. 1996, 23, 12–20. [Google Scholar] [CrossRef]
- Battersby, S.E.; Goldsberry, K.P. Considerations in Design of Transition Behaviors for Dynamic Thematic Maps. Cartogr. Perspect. 2010, 65, 16–32. [Google Scholar] [CrossRef]
- Roth, R.E. Cartographic Design as Visual Storytelling: Synthesis and Review of Map-Based Narratives, Genres, and Tropes. Cartogr. J. 2021, 58, 83–114. [Google Scholar] [CrossRef]
- Harrower, M. Tips for Designing Effective Animated Maps. Cartogr. Perspect. 2003, 44, 63–65. [Google Scholar] [CrossRef]
- Lloyd, R.E. Attention on Maps. Cartogr. Perspect. 2005, 52, 28–57. [Google Scholar] [CrossRef]
- Robinson, A.C. Highlighting in Geovisualization. Cartogr. Geogr. Inf. Sci. 2013, 38, 373–383. [Google Scholar] [CrossRef]
- Maggi, S.; Fabrikant, S.I.; Imbert, J.-P.; Hurter, C. How Do Display Design and User Characteristics Matters in Animation? An Empirical Study with Air Traffic Control Displays. Cartographica 2016, 51, 25–37. [Google Scholar] [CrossRef]
- Goldsberry, K.P.; Battersby, S.E. Issues of Change Detection in Animated Choropleth Maps. Cartographica 2009, 44, 201–215. [Google Scholar] [CrossRef] [Green Version]
- Fish, C.; Goldsberry, K.P.; Battersby, S.E. Change Blindness in Animated Choropleth Maps: An Empirical Study. Cartogr. Geogr. Inf. Sci. 2011, 38, 250–362. [Google Scholar] [CrossRef]
- Moon, S.; Kim, E.-K.; Hwang, C.-S. Effects of Spatial Distribution on Change Detection in Animated Choropleth Maps. J. Korean Soc. Surv. Geod. Photogramm. Cartogr. 2014, 32, 571–580. [Google Scholar] [CrossRef]
- Cybulski, P.; Medyńska-Gulij, B. Cartographic Redundancy in Reducing Change Blindness in Detecting Extreme Values in Spatio-Temporal Maps. ISPRS Int. J. Geoinf. 2018, 7, 8. [Google Scholar] [CrossRef] [Green Version]
- Fisher, B.; Ramsperger, E. Human express saccades: Extremely short reaction times of goal directed eye movements. Exp. Brain Res. 1984, 57, 191–195. [Google Scholar] [CrossRef] [PubMed]
- Lisberger, S.G. Visual guidance of smooth pursuit eye movements: Sensation, action, and what happens in between. Neuron 2010, 66, 477–491. [Google Scholar] [CrossRef] [Green Version]
- Cybulski, P. Effectiveness of Memorizing an Animated Route—Comparing Satellite and Road Map Differences in the Eye-Tracking Study. ISPRS Int. J. Geoinf. 2021, 10, 159. [Google Scholar] [CrossRef]
- Harrower, M. Unclassed Animated Choropleth Maps. Cartogr. J. 2007, 44, 313–320. [Google Scholar] [CrossRef]
- Just, M.A.; Carpenter, P.A. Eye Fixations and Cognitive Processes. Cogn. Psychol. 1967, 8, 441–480. [Google Scholar] [CrossRef]
- Rayner, K. Eye Movements and Attention in Reading, Scene Perception, and Visual Search. Q. J. Exp. Psychol. 2009, 62, 1457–1506. [Google Scholar] [CrossRef] [PubMed]
- Edler, D.; Keil, J.; Tuller, M.-C.; Bestgen, A.-K.; Dickmann, F. Searching for the ‘Right’ Legend: The Impact of Legend Position on Legend Decoding in a Cartographic Memory Task. Cartogr. J. 2020, 57, 6–17. [Google Scholar] [CrossRef]
- Andrienko, N.; Andrienko, G.; Gatalsky, P. Exploratory spatio-temporal visualization: An analytical review. J. Vis. Lang. Comput. 2003, 14, 503–541. [Google Scholar] [CrossRef]
- DiBiase, D.; MacEachren, A.M.; Krygier, J.B.; Reeves, C. Animation and the role of map design in scientific visualization. Cartogr. Geogr. Inf. Sys. 1992, 19, 201–214. [Google Scholar] [CrossRef]
- Blok, C. Monitoring change: Characteristics of dynamic geo-spatial phenomena for visual exploration. In Spatial Cognition II, Lecture Notes on Artificial Intelligence; Freska, C., Habel, C., Brauer, W., Wender, K.F., Eds.; Springer: Berlin/Heidelberg, Germany, 2000; Volume 1849, pp. 16–30. [Google Scholar]
- Peuquet, D.J. It’s about time: A conceptual framework for the representation of temporal dynamics in geographic information systems. Ann. Am. Assoc. Geogr. 1994, 84, 441–461. [Google Scholar] [CrossRef]
- Li, D.; Samet, H.; Varshney, A. Visualizing accessibility with choropleth maps. In Proceedings of the 5th ACM SIGSPATIAL International Workshop on Location-based Recommendations, Geosocial Networks and Geoadvertising, Bejijng, China, 2 November 2021. [Google Scholar]
- Bertin, J. Semiology of Graphics Diagrams Networks Maps; The University of Wisconsin Press: Madison, WI, USA, 1986. [Google Scholar]
- Medyńska-Gulij, B. The effect of cartographic content on tourist map users. Cartography 2003, 32, 49–54. [Google Scholar] [CrossRef]
- Schroeder, J.P. Trends in patterns versus patterns in trends: A key distinction for visualizing geographic time-series data. In Proceedings of the 23rd International Cartographic Conference, Moskov, Russia, 4–10 August 2007. [Google Scholar]
- Borregaard, M.K.; Hendrichsen, D.; Nachman, G. Spatial distribution patterns. In Encyclopedia of Ecology, 2nd ed.; Jørgensen, S.E., Fath, B.D., Eds.; Elsevier: Oxford, UK, 2009; pp. 3303–3310. [Google Scholar]
- Ripley, B.D. Modelling Spatial Patterns. J. R. Stat. Soc. Ser. B Stat. Methodol. 1977, 39, 172–192. [Google Scholar] [CrossRef]
- Anders, A.M.; Roe, G.H.; Hallet, B.; Montgomery, D.R.; Finnegan, N.J.; Putkonen, J. Spatial patterns of precipitation and topography in the Himalaya. In Tectonics, Climate, and Landscape Evolution; Willett, S.D., Hovius, N., Brandon, M.T., Fisher, D.M., Eds.; The Geological Society of America: Colorado, CO, USA, 2006; pp. 39–53. [Google Scholar]
- Sapiro, P. Explaining geographic patterns of small group internal migration. Popul. Space Place 2017, 23, e0278. [Google Scholar] [CrossRef]
- Sinnott-Armstrong, M.; Downie, A.E.; Federman, S.; Valido, A.; Jordano, P.; Donoghue, M.I. Global geographic patterns in the colours and sizes of animal-dispersed fruits. Glob. Ecol. Biogeogr. 2018, 27, 1339–1351. [Google Scholar] [CrossRef]
- Kraak, M.-J.; MacEachren, A.M. Visualization of spatial data’s temporal component. In Proceedings of the Spatial Data Handling, Advances in GIS Research, Edinburgh, Scotland, UK, 5–9 September 1994. [Google Scholar]
- Guo, D.; Chen, J.; MacEachren, A.M.; Liao, K. A Visualization System for Space-Time and Multivariate Patterns. IEEE Trans. Vis. Comput. Graph. 2006, 12, 1461–1474. [Google Scholar] [PubMed] [Green Version]
- Blok, C.; Köbben, B.; Cheng, T.; Kuterema, A.A. Visualization of Relationship Between Spatial Patterns in Time by Cartographic Animation. Cartogr. Geogr. Inf. Sci. 1999, 26, 139–151. [Google Scholar] [CrossRef]
- Edsall, R.M.; Harrower, M.; Mennis, J.L. Tools for visualizing properties of spatial and temporal periodicity in geographic data. Comput. Geosci. 2000, 26, 109–118. [Google Scholar] [CrossRef] [Green Version]
- Griffin, A.L.; MacEachren, A.M.; Hardisty, F.; Steiner, E.; Li, B. A Comparison of Animated Maps with Static Small-Multiple Maps for Visually Identifying Space-Time Clusters. Ann. Am. Assoc. Geogr. 2006, 96, 740–753. [Google Scholar] [CrossRef] [Green Version]
- Schiewe, J. Empirical Studies on the Visual Perception of Spatial Patterns in Choropleth Maps. KN-J. Cartogr. Geogr. 2019, 69, 217–228. [Google Scholar] [CrossRef] [Green Version]
- Karsznia, I.; Gołębiowska, I.M.; Korycka-Skorupa, J.; Nowacki, T. Searching for an Optimal Hexagonal Shaped Enumeration Unit Size for Effective Spatial Pattern Recognition in Choropleth Maps. ISPRS Int. J. Geoinf. 2021, 10, 576. [Google Scholar] [CrossRef]
- Traun, C.; Schreyer, M.L.; Wallentin, G. Empirical Insight from a Study on Outlier Preserving Value Generalization in Animated Choropleth Maps. ISPRS Int. J. Geoinf. 2021, 10, 208. [Google Scholar] [CrossRef]
- Cinnamon, J.; Rinner, C.; Cusimano, M.D.; Marshall, S.; Bekele, T.; Hernandez, T.; Glazier, R.H.; Chipman, M.L. Evaluating web-based static, animated and interactive maps for injury prevention. Geospat. Health 2009, 4, 3–16. [Google Scholar] [CrossRef] [Green Version]
- Koussoulakou, A.; Kraak, M.-J. Spatio-temporal maps and cartographic communication. Cartogr. J. 1992, 29, 101–108. [Google Scholar] [CrossRef]
- Monmonier, M. Mapping It Out: Expository Cartography for the Humanities and Social Sciences; University of Chicago Press: Chicago, IL, USA, 2015; p. 12. [Google Scholar]
- Dong, W.; Zheng, L.; Liu, B.; Meng, L. Using Eye Tracking to Explore Differences in Map-Based Spatial Ability between Geographers and Non-Geographers. ISPRS Int. J. Geoinf. 2018, 7, 337. [Google Scholar] [CrossRef] [Green Version]
- Dong, W.; Liao, H.; Xu, F.; Liu, Z.; Zhang, S. Using Eye Tracking to Evaluate the Usability of Animated Maps. Sci. China Earth Sci. 2014, 57, 512–522. [Google Scholar] [CrossRef]
- Cybulski, P.; Krassanakis, V. The Role of Magnitude of Change in Detecting Fixed Enumeration Units on Dynamic Choropleth Maps. Cartogr. J. 2021, 1–17. [Google Scholar] [CrossRef]
- Rensink, R.A. Change Detection. Annu. Rev. Psychol. 2002, 53, 245–277. [Google Scholar] [CrossRef] [PubMed]
Figure 1.
Map stimuli used in the research. Spatial patterns: C: clustered, G: grid, L: linear, P: peripheral, R: radial, D: dispersed. Temporal trends: d: decrease, i: increase.
Figure 1.
Map stimuli used in the research. Spatial patterns: C: clustered, G: grid, L: linear, P: peripheral, R: radial, D: dispersed. Temporal trends: d: decrease, i: increase.

Figure 2.
Selected frames of a linear and dispersed pattern. An increasing trend is in a linear pattern. The dispersed pattern has no trend. In D4, the spatial pattern is only visible at both ends of animation and did not appear in other months. Li—linear increasing, D4—dispersed pattern map number 4.

Figure 3.
An interactive protocol for the participants’ responses was presented after each animated map ended.
Figure 3.
An interactive protocol for the participants’ responses was presented after each animated map ended.

Figure 4.
Results of spatial pattern and temporal trend recognition effectiveness calculated as a percentage of participants’ correct responses.
Figure 4.
Results of spatial pattern and temporal trend recognition effectiveness calculated as a percentage of participants’ correct responses.

Figure 5.
3 Spatial analysis of participants’ visual behavior.

Figure 6.
Fixation density clusters for correct and incorrect recognition of spatial patterns and temporal trends.
Figure 6.
Fixation density clusters for correct and incorrect recognition of spatial patterns and temporal trends.

Figure 7.
Fixation density clusters for correct and incorrect recognition of spatial patterns and temporal trends when analyzing dispersed patterns.
Figure 7.
Fixation density clusters for correct and incorrect recognition of spatial patterns and temporal trends when analyzing dispersed patterns.


Table 1.
Average Nearest Neighbor Summary of the fixation distribution of participants’ correct and incorrect recognition.
Table 1.
Average Nearest Neighbor Summary of the fixation distribution of participants’ correct and incorrect recognition.
| Average Nearest Neighbor Summary | ||||||||||
|---|---|---|---|---|---|---|---|---|---|---|
| Incorrect Recognition | Correct Recognition | |||||||||
| OMD | EMD | NNI | z | p | OMD | EMD | NNI | z | p | |
| D1 | 0.0235 | 0.0299 | 0.785 | −4.460 | <0.0000 | 0,0099 | 0.0167 | 0,593 | −16.922 | <0.0000 |
| D2 | 0.0148 | 0.0223 | 0.663 | −7.327 | <0.0000 | 0.0103 | 0.0159 | 0.652 | −13.643 | <0.0000 |
| D3 | 0.0267 | 0.0285 | 0.936 | −0.794 | 0.4272 | 0.0112 | 0.0168 | 0.667 | −13.192 | <0.0000 |
| D4 | 0.0254 | 0.0292 | 0.871 | −2.722 | 0.0065 | 0.0086 | 0.0136 | 0.637 | −17.654 | <0.0000 |
| D5 | 0.0153 | 0.0237 | 0.646 | −8.800 | <0.0000 | 0.0157 | 0.0219 | 0.716 | −8.255 | <0.0000 |
| Pd | 0.0195 | 0.0309 | 0.630 | −7.148 | <0.0000 | 0.0121 | 0.0173 | 0.702 | −11.623 | <0.0000 |
| Pi | 0.0158 | 0.0202 | 0.782 | −5.799 | <0.0000 | 0.0112 | 0.0140 | 0.796 | −8.267 | <0.0000 |
| Gd | 0.0114 | 0.0176 | 0.647 | −9.854 | <0.0000 | 0.0126 | 0.0173 | 0.727 | −9.382 | <0.0000 |
| Gi | 0.0167 | 0.0251 | 0.664 | −8.596 | <0.0000 | 0.0137 | 0.0186 | 0.737 | −8.942 | <0.0000 |
| Ld | 0.0145 | 0.0196 | 0.741 | −6.947 | <0.0000 | 0.0136 | 0.0189 | 0.720 | −7.926 | <0.0000 |
| Li | 0.0114 | 0.0168 | 0.678 | −11.092 | <0.0000 | 0.0140 | 0.0230 | 0.609 | −12.306 | <0.0000 |
| Cd | 0.0149 | 0.0214 | 0.696 | −8.868 | <0.0000 | 0.0166 | 0.0232 | 0.713 | −7.757 | <0.0000 |
| Ci | 0.0196 | 0.0287 | 0.682 | −7.423 | <0.0000 | 0.0099 | 0.0154 | 0.640 | −16.880 | <0.0000 |
| Rd | 0.0104 | 0.0158 | 0.662 | −13.700 | <0.0000 | 0.0173 | 0.0265 | 0.655 | −7.640 | <0.0000 |
| Ri | 0.0113 | 0.0159 | 0.710 | −11.433 | <0.0000 | 0.0142 | 0.0211 | 0.675 | −8.584 | <0.0000 |
Publisher’s Note: MDPI stays neutral with regard to jurisdictional claims in published maps and institutional affiliations. |
© 2022 by the author. Licensee MDPI, Basel, Switzerland. This article is an open access article distributed under the terms and conditions of the Creative Commons Attribution (CC BY) license (https://creativecommons.org/licenses/by/4.0/).
Share and Cite
MDPI and ACS Style
Cybulski, P. An Empirical Study on the Effects of Temporal Trends in Spatial Patterns on Animated Choropleth Maps. ISPRS Int. J. Geo-Inf. 2022, 11, 273. https://0-doi-org.brum.beds.ac.uk/10.3390/ijgi11050273
AMA Style
Cybulski P. An Empirical Study on the Effects of Temporal Trends in Spatial Patterns on Animated Choropleth Maps. ISPRS International Journal of Geo-Information. 2022; 11(5):273. https://0-doi-org.brum.beds.ac.uk/10.3390/ijgi11050273
Chicago/Turabian StyleCybulski, Paweł. 2022. "An Empirical Study on the Effects of Temporal Trends in Spatial Patterns on Animated Choropleth Maps" ISPRS International Journal of Geo-Information 11, no. 5: 273. https://0-doi-org.brum.beds.ac.uk/10.3390/ijgi11050273
Note that from the first issue of 2016, this journal uses article numbers instead of page numbers. See further details here.