Article

Landscape Ecological Risk and Ecological Security Pattern Construction in World Natural Heritage Sites: A Case Study of Bayinbuluke, Xinjiang, China

1
State Key Laboratory of Desert and Oasis Ecology, Xinjiang Institute of Ecology and Geography, Chinese Academy of Sciences, Urumqi 830000, China
2
University of Chinese Academy of Sciences, Beijing 100101, China
*
Author to whom correspondence should be addressed.
ISPRS Int. J. Geo-Inf. 2022, 11(6), 328; https://0-doi-org.brum.beds.ac.uk/10.3390/ijgi11060328
Submission received: 12 May 2022 / Revised: 21 May 2022 / Accepted: 29 May 2022 / Published: 30 May 2022
(This article belongs to the Special Issue Application of GIS for Biodiversity Research)

Abstract

:
The evaluation of ecological risk and the construction of ecological security patterns are significant for the conservation of World Natural Heritage sites with high outstanding universal value. This paper constructed a landscape ecological risk evaluation framework for Bayinbuluke using the three aspects of the “nature–society–landscape pattern” and a cumulative resistance surface from the risk evaluation results. The ecological sources were identified based on Morphological Spatial Pattern Analysis (MSPA) and the landscape index. Finally, the Minimum Cumulative Resistance model (MCR) and gravity model were used to obtain both key ecological corridors and general ecological corridors. The results showed that: (1) the influencing factors of landscape ecological risk were, in order of strongest to weakest, landscape pattern factors, natural factors, and social factors; (2) the spatial differences in terms of landscape ecological risk within the study area could be identified. Low-risk areas were mainly concentrated in the core area, high-risk areas were mainly in the outer buffer zone, and the overall ecological risk level at Bayinbuluke was high; and (3) a total of four key corridors and ten general corridors could be constructed. This study provides a reference for decision-making on the ecological security and protection of heritage sites.

1. Introduction

Today, both human activities and changes in the natural environment frequently impact regional ecology, as landscape fragmentation and shrinking habitat areas threaten biological survival [1,2]. Increasing landscape connectivity is essential to reducing habitat fragmentation and promoting species migration. In addition, the construction of landscape ecological security patterns improves landscape connectivity by identifying relevant critical functional connections, ultimately achieving species conservation. Natural heritage sites are essential areas with high bio-ecological value. As protected areas with unique representation, the ecological conservation of heritage sites is of great significance.
Ecological risk reflects the negative impacts of human activities and natural environmental changes on ecosystems [3]. Ecological risk assessment is a tool that can effectively support ecosystem management [4]. As an approach that combines geography and ecological processes, ecological risk assessment focuses on the spatial and temporal heterogeneity of ecological risk in a particular region [5]. A landscape is a territorial complex with economic, ecological, and aesthetic values. Landscape ecological risk refers to the negative impact of natural factors or anthropogenic disturbances on ecosystems and landscape patterns. Related evaluation results are important for understanding the overall characteristics of regional ecological risk, determining and predicting impacts, and managing ecological risk. Moreover, the concept of ecological security emphasizes the ability of ecosystems to safeguard human health, economic development, and social stability from threats [6]. The significance of constructing ecological security patterns is to identify and restore ecological networks consisting of key landscape elements, improve the landscape connectivity of each element, and promote the regional circulation of materials and energy [7]. The ecological security pattern has become one way to alleviate conflict between environmental protection and economic development.
World Natural Heritage (WNH) sites are natural areas of outstanding universal value, representing the best of nature in geology, bioecology, and aesthetics. WNH sites are essential for biodiversity conservation and the maintenance of ecological health. However, the conservation of WNH sites is under threat due to climate change, natural disasters, and human activities [8]. These issues seriously threaten the security and sustainability of ecosystems at WNH sites. Therefore, landscape ecological risk assessment of heritage sites and the construction of ecological security patterns can effectively safeguard outstanding universal values and ecosystem services.
This paper is organized as follows. Following the introduction, the second part introduces the literature review. The third part introduces the study area and data source. The fourth part presents a rigorous description of the methods employed. The fifth part introduces the empirical results of the study, evaluating ecological risk in the landscape, the selection of ecological sources, and the construction of ecological corridors. The following part discusses the theoretical and practical implications. Finally, the conclusion provides a brief summary, summarizes any limitations, and recommends avenues for future research.

2. Literature Review

2.1. Landscape Ecological Risk

In recent years, relevant scholars have effectively explored ecological risk assessment. Mann et al. [9] constructed a landscape ecological risk index using landscape metrics to assess changes in landscape structure and risk influenced by the road network and topography in the Central Himalaya. An ecological risk-based Bayesian model was used to explore the potential effects of multiple factors on habitat and resources in a forested landscape in northeastern Oregon [10]. The main research areas are watersheds [11], urban areas [12], coastal areas heavily influenced by human activities [13,14,15], and ecologically sensitive areas such as wetlands [16] and nature reserves [17]. As described, landscape ecological risk assessment can comprehensively reflect the spatial distribution of regional risks and provide a reference for decision-making in the contexts of regional development, construction, and ecological restoration. It is important for the study of protected areas with high conservation value such as heritage sites. Moreover, there is a close relationship between land use and ecological risk, and landscape pattern can quantitatively reflect changes in land use. The landscape index method is a common method used in landscape ecological risk assessment [13], and is usually calculated as the product of landscape disturbance and landscape vulnerability [18]. Landscape pattern-based assessment methods can evaluate ecological risk at a regional scale. However, regional ecosystems are often affected by a combination of natural and human activities. The landscape pattern index can hardly provide a practical overview of the compound risk in the study area [17,19]. Thus, researchers have begun to integrate multiple factors into landscape patterns. Li et al. [20] used the Potential–Connectedness–Resilience three-dimensional (PCR 3D) framework to analyze the spatial heterogeneity of landscape ecological risk. Yan et al. [21] developed a landscape ecological risk indicator system for urban agglomerations based on the “nature–neighborhood–landscape” concept. Studying the spatial and temporal distribution characteristics of ecological risk in WNH sites and the classification of different levels are significant when proposing management measures. In this study, multiple factors were considered when analyzing the landscape ecological risk of WNH sites.

2.2. Ecological Security Pattern

The ecological security pattern is an important method of ensuring ecological security and sustainable development. Various scholars have studied ecological security patterns from different perspectives, leading to the formation of a mainstream research paradigm based on ecological sources and ecological corridor identification. Nina Klar et al. [22] used least-cost path models to find the best potential corridors for wildcats in Lower Saxony, Germany. Corridors are the carriers of energy and material flows in a region, and are important for ensuring the integrity of ecosystem functions within the region. Zhou et al. [23] integrated evaluations of ecosystem services value and ecological sensitivity in order to construct an ecological security pattern for the urban agglomeration around Hangzhou Bay. Commonly used methods for identifying ecological sources include the direct selection of woodlands, water bodies, and other important ecological lands; however, qualitative identification ignores internal differences. The morphological spatial pattern analysis (MSPA) approach, which focuses on measuring structural connectivity [24,25], has been introduced to identify ecological sources. The MSPA method identifies important habitat patches in the study area at the image element level and identifies landscape types important for maintaining connectivity by selecting foregrounds and backgrounds based on land use data, then using a series of image processing methods to classify foregrounds into seven categories according to morphology [26]. While identifying the ecological corridors, the minimum cumulative resistance (MCR) model can better reflect the interaction between landscape pattern change and ecological process evolution [23,27]. The key to the MCR model is the setting of the resistance surface. The construction of resistance surface is generally based on land cover type in order to set resistance values, which reflect the interaction between landscape patterns and ecological processes [28,29]. Many of the current studies are based on the direct assignment of values by experts based on land cover types, and there is no uniform paradigm for the resistance values of different types. Proper setting of the resistance value has a considerable impact on ecological network construction. Previous studies have strong subjectivity in the determination of the landscape resistance value. Therefore, they have been unable to reveal the intrinsic complexity of ecological processes and human activities. In this study, landscape ecological risk evaluation results were used to construct resistance surfaces.

2.3. World Natural Heritage

The study of ecological security patterns mainly focuses on regions where the impact of anthropogenic activities is more intense [30,31], and there are fewer studies on natural territories that are sensitive to the impact of human activities and natural disturbances. Natural heritage sites’ ecological environments are fragile. There are various threats to heritage sites, and scholars have conducted numerous studies on threat factors and ecological security conservation. Allan et al. [8] analyzed human footprint data from 94 heritage sites and global forest monitoring data from 134 heritage sites and found that anthropogenic stresses dominate the impact on natural heritage sites. The Galapagos Islands WNHS was listed as endangered between 2007 and 2010 due to invasive species and overexploitation. Almost 300 different invasive alien species are considered a threat to just over half of all world heritage sites [32]. Mairota et al. [33] used landscape pattern analysis to provide scientific guidance and management options for conservation management practitioners and local governments.
This paper took Bayinbuluke, a famous WNHS in China, as the study area and employed a suite of analytical approaches in order to analyze landscape ecological risk and establish an ecological security pattern. Research on Bayinbuluke’s conservation involves ecosystem health assessment [34] and ecological environment assessment [35]. However, vegetation degradation and grazing [36] threaten the conservation and ecological security of the outstanding universal values of the natural heritage site. From the perspective of landscape security pattern, the analysis of important patches and corridors that are important to natural heritage sites can provide necessary decision support for the sustainable management of biodiversity conservation in the study area. This paper constructed a landscape ecological risk assessment system based on the “nature–society–landscape pattern” in order to evaluate the risk to Bayinbuluke’s landscape and obtained the spatial distribution of different levels of risk. This assessment system can better reveal the intrinsic complexity of human activities and ecological processes. Then, by combining the MSPA and MCR methods to construct an ecological network, we provided scientific references to protect the ecological value and promote the sustainable development of Bayinbuluke.

3. Study Area and Data Source
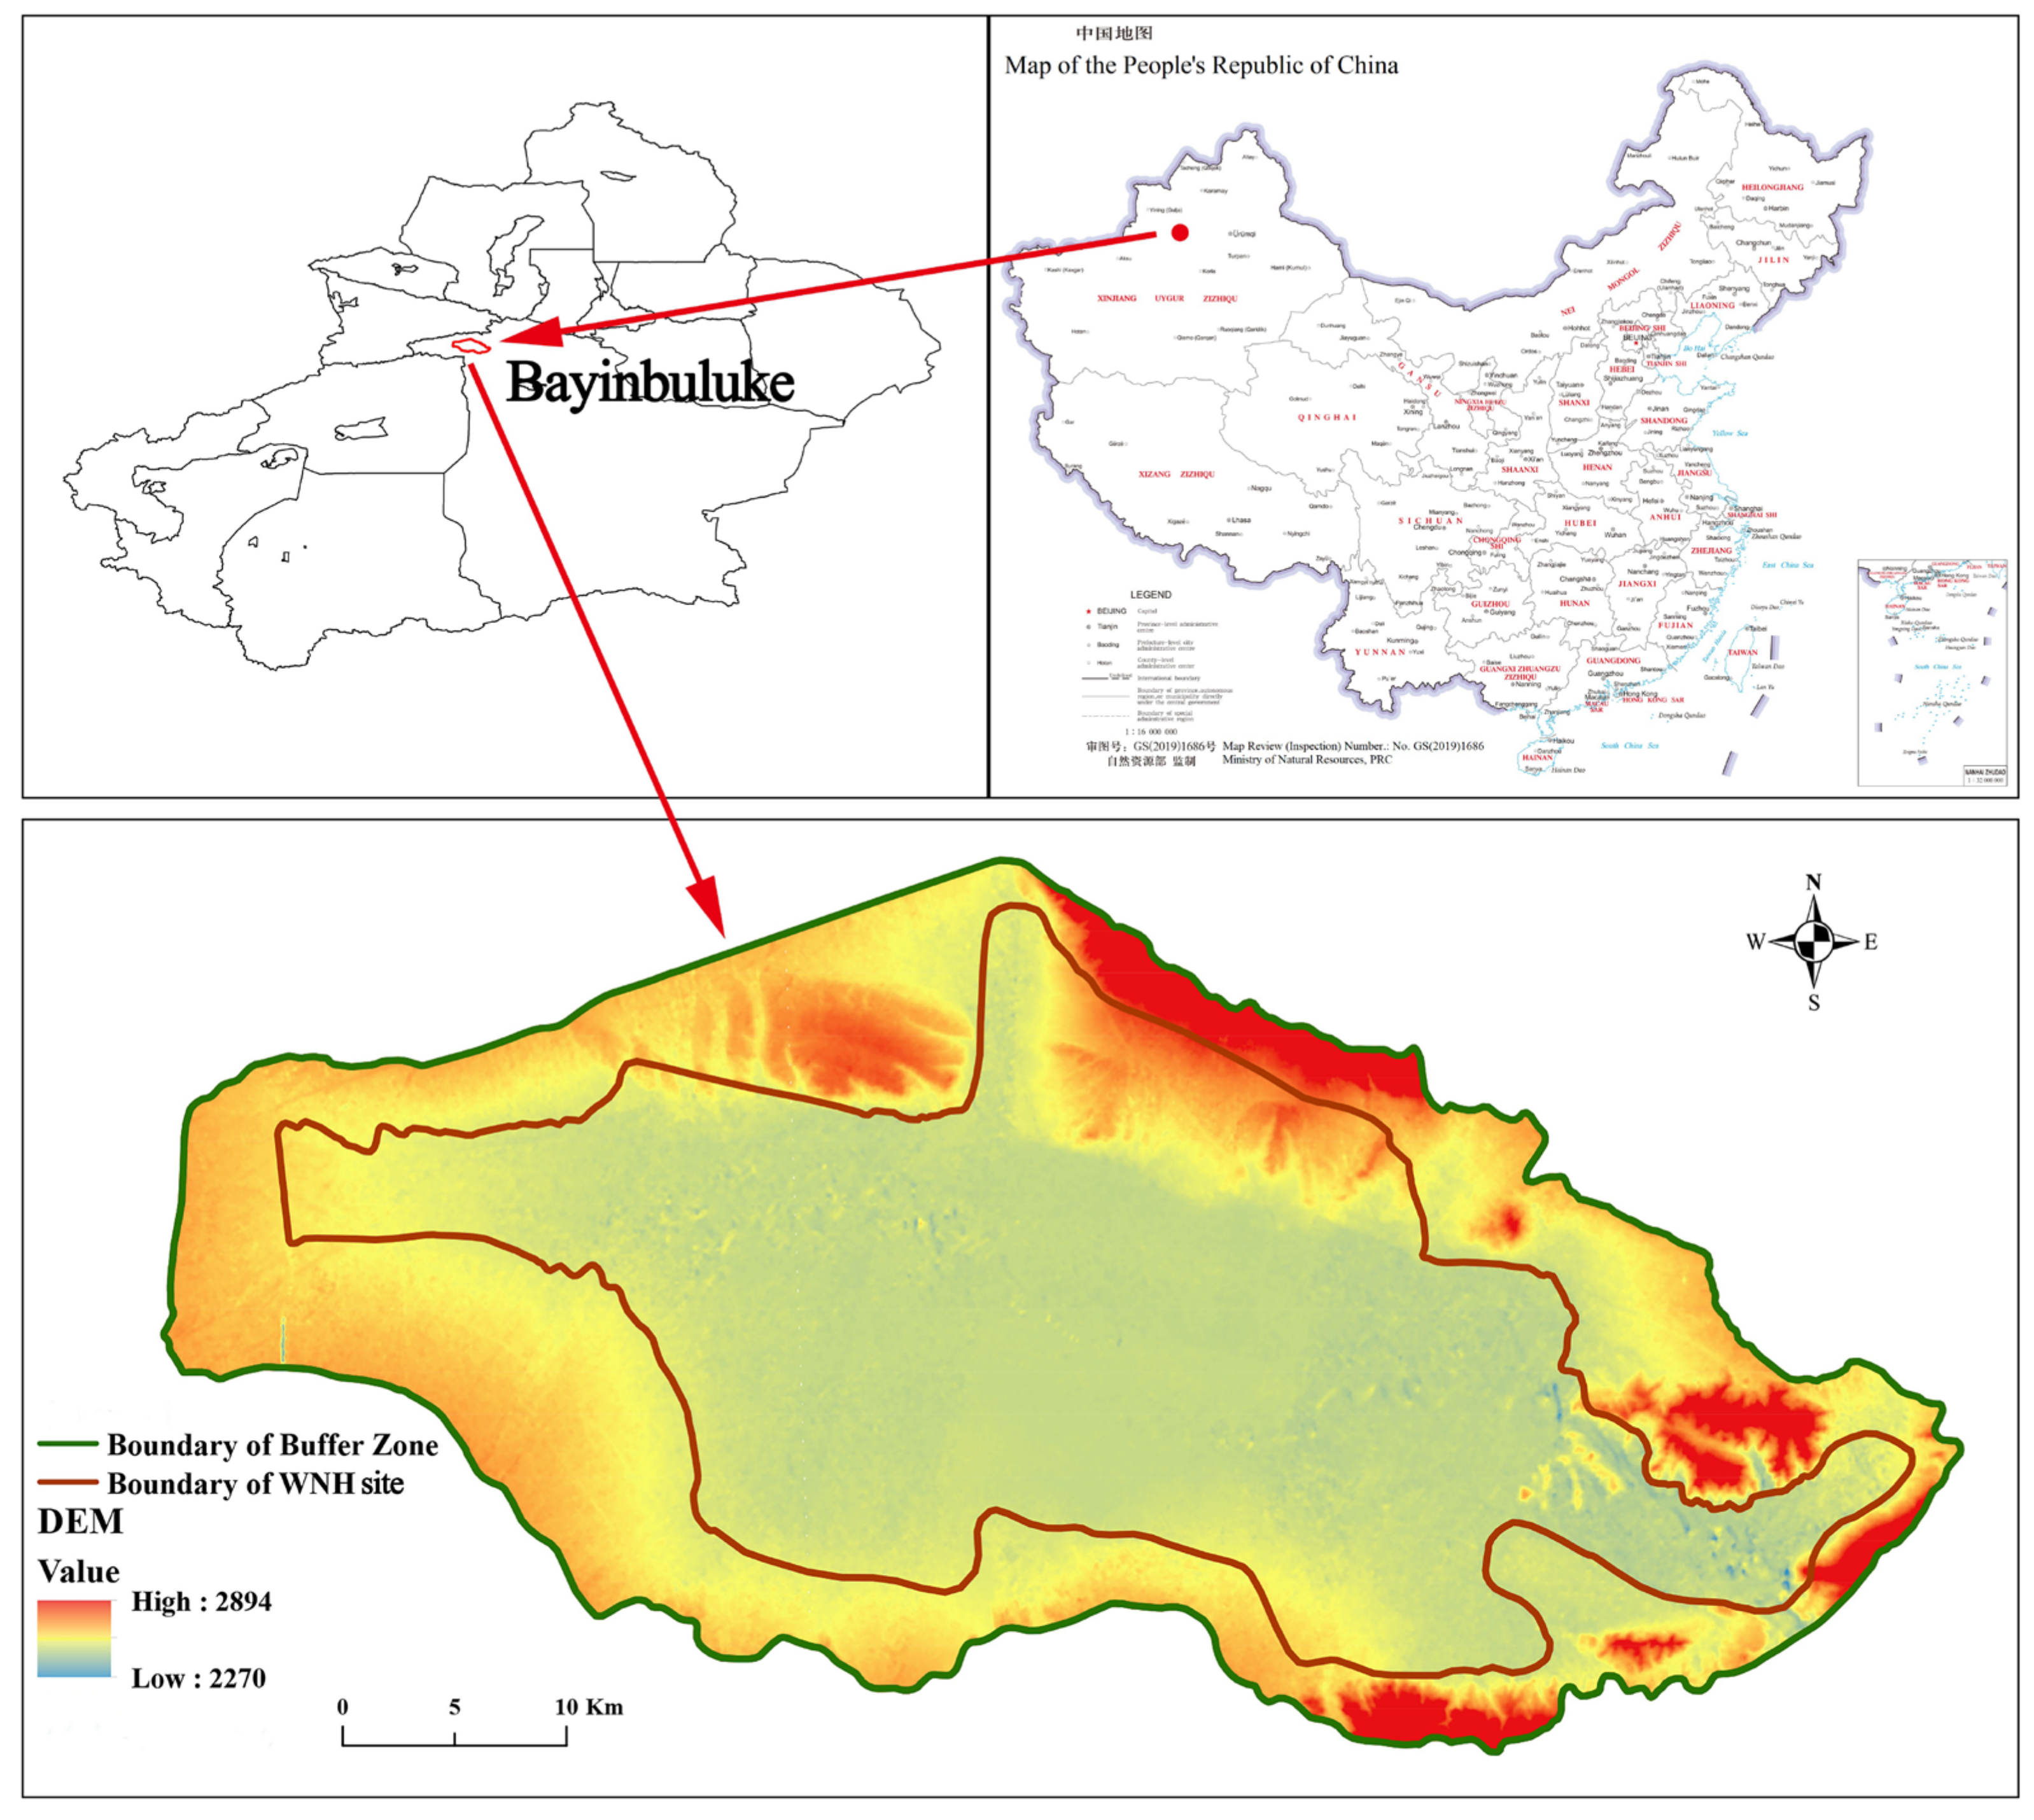
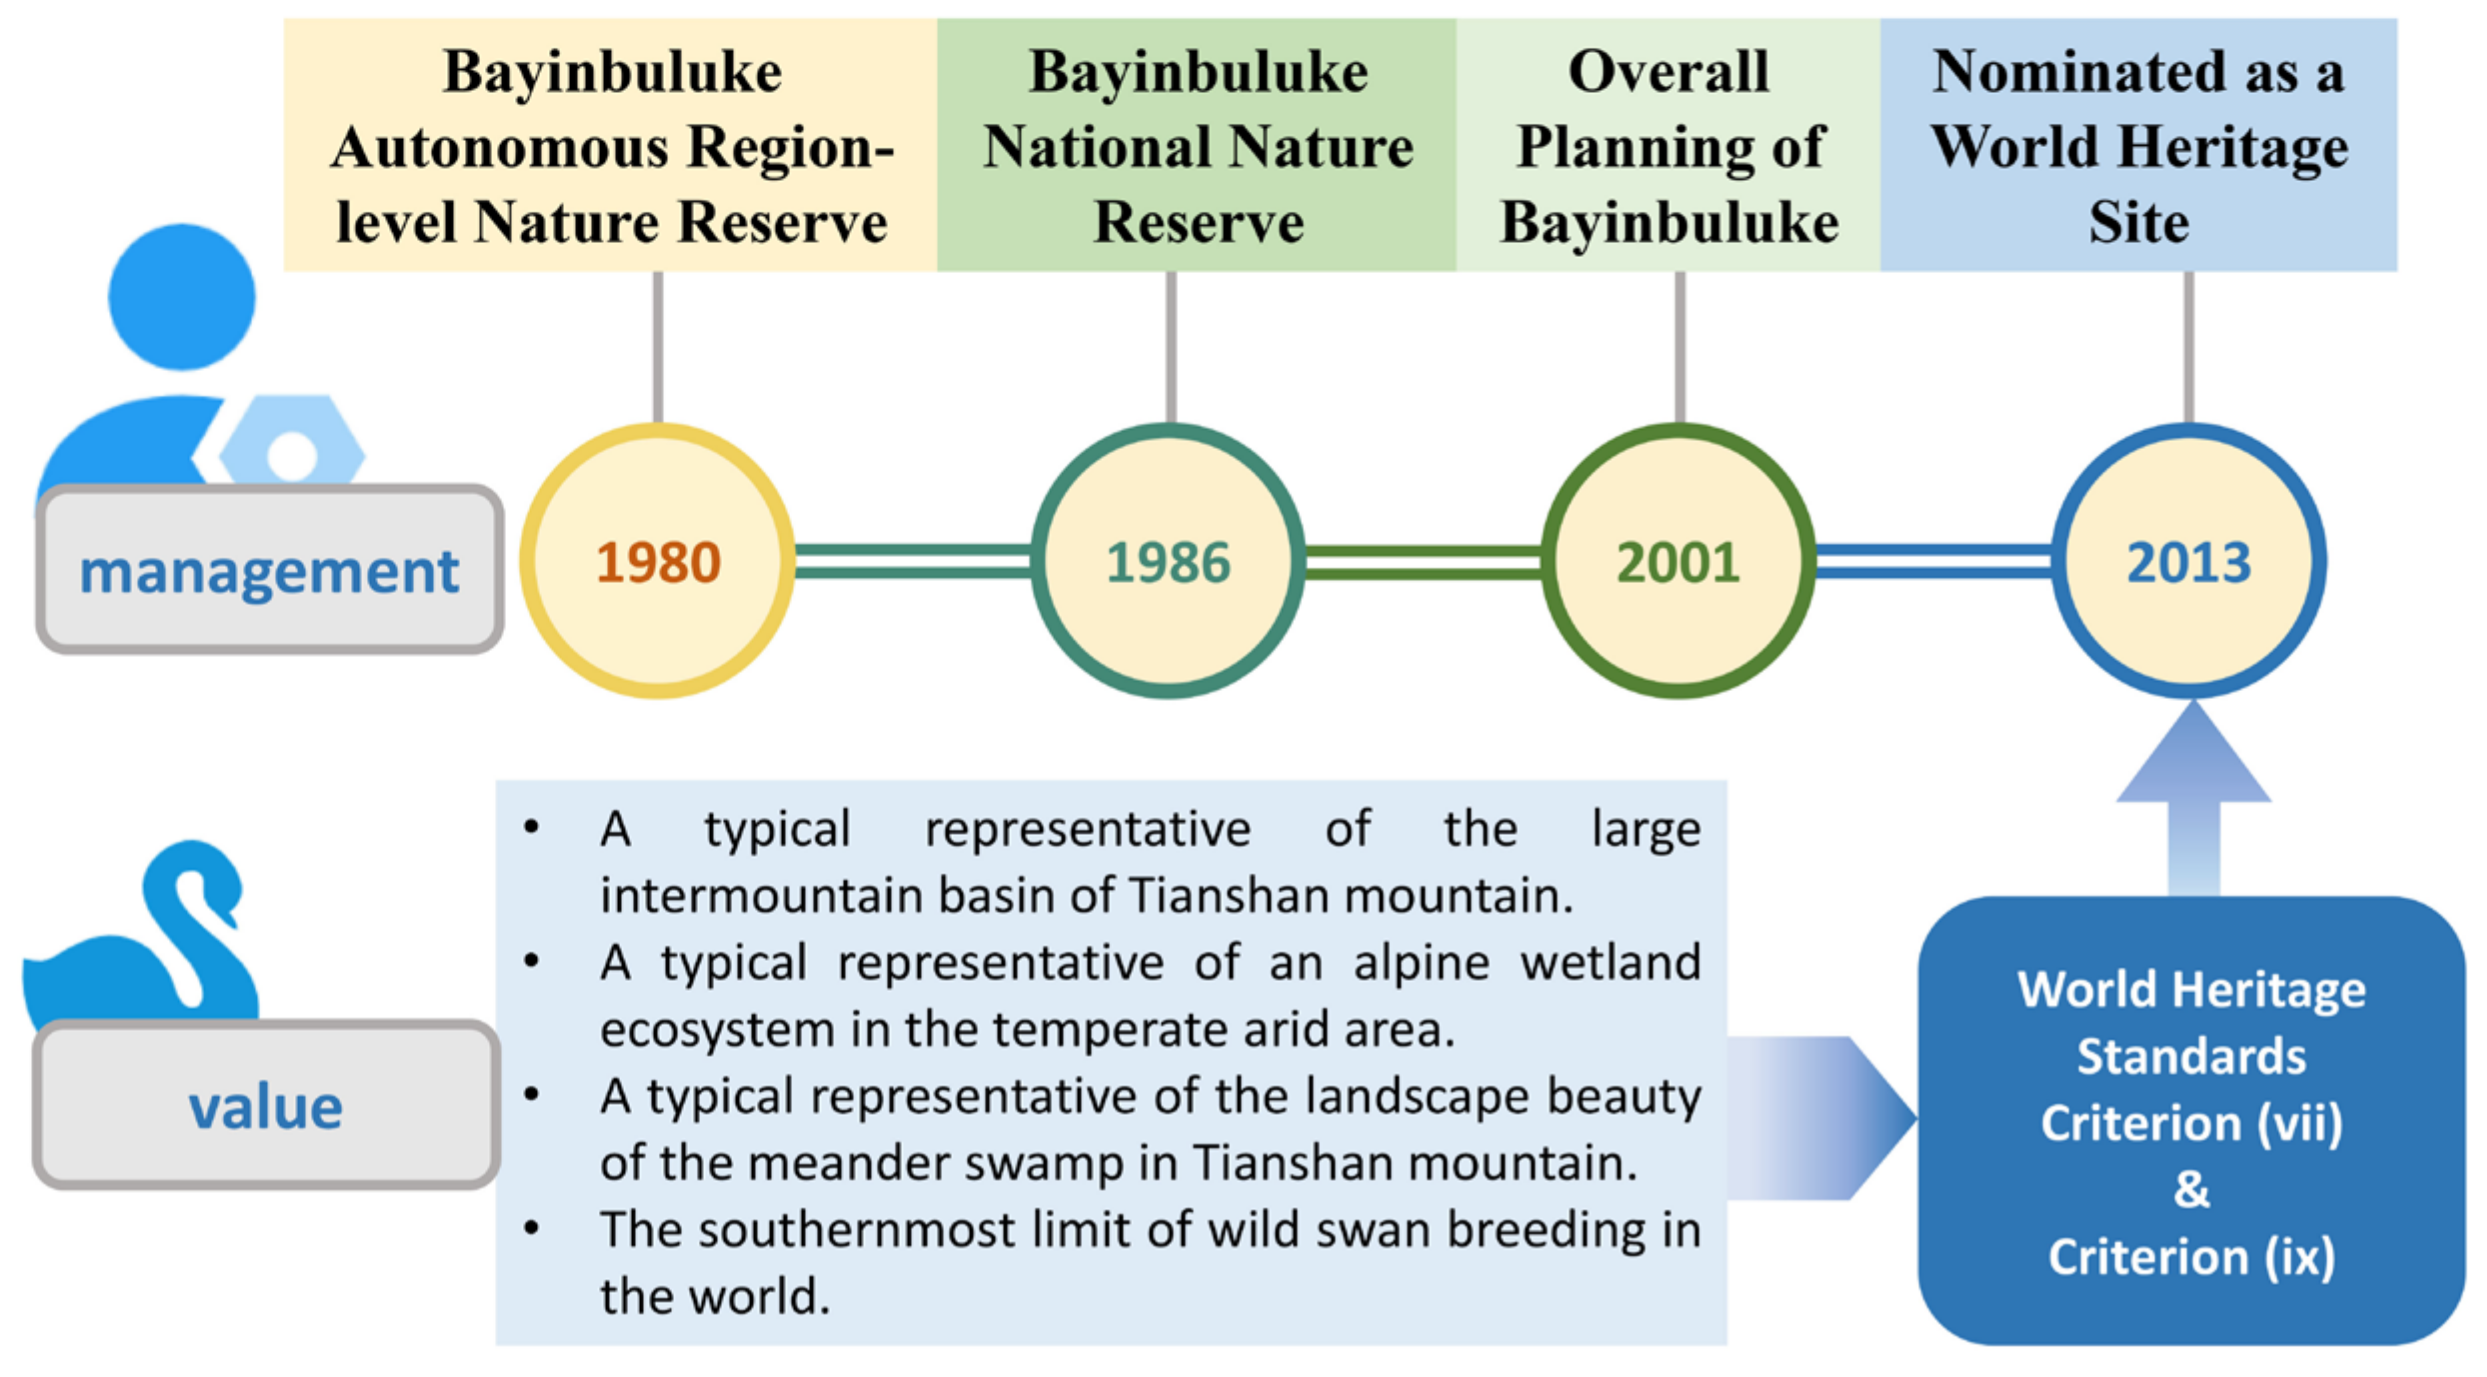
3.1. Study Area

The Xinjiang Tianshan was listed on the World Natural Heritage List in 2013. The heritage sites here have the most typical integrated landscape of arid desert areas globally, with the most representative natural landscapes of forests, mountain grasslands, and alpine meadows. The nominated site is a comprehensive reflection of the most representative landscape features and ecosystems of the mountains, an area of natural essence with outstanding scientific and aesthetic value [37]. The Tianshan World Heritage Site conforms to criteria (vii) and (ix) of the World Heritage Criteria [38], (vii) to contain superlative natural phenomena or areas of exceptional natural beauty and aesthetic importance and (ix) to be outstanding examples representing significant on-going ecological and biological processes in the evolution and development of terrestrial, fresh water, coastal and marine ecosystems, and communities of plants and animals [39]. Bayinbuluke is a component of the Tianshan Heritage Site (Figure 1), a prominent representative of the high inter-mountain basin of the Tianshan Mountains, with typical alpine meadows and alpine wetland ecosystems [40]. Bayinbuluke management history and world heritage values are shown in Figure 2.
Bayinbuluke is located in the central part of the Tianshan Mountains in Xinjiang, with a total area of 1094.48 km2 and a buffer zone of 800.9 km2. Surrounded by mountains, it has a temperate continental arid climate with cool, short summers and long, cold winters. The average annual temperature is −4.6 °C, and the average annual precipitation is 276 mm, with rainfall concentrated in June to August. Bayinbuluke is part of the Kaidu River basin, fed mainly by snow and ice melt and rainfall, with local groundwater recharge. The numerous rivers of various sizes formed by the snow-capped mountains flow into the Kaidu River, creating about 1000 km2 of swampy grassland and lakes along its nine curves. Bayinbuluke is the largest swan habitat in China and the world’s largest breeding colony of wild swans. In addition, there are 104 animal species listed on the IUCN Red List of Species [37]. Bayinbuluke’s buffer zone is home to 2602 seasonal herders who engage in seasonal grazing activities from June to September.

3.2. Data Sources and Processing

3.2.1. Data Sources

A database was established to evaluate the landscape ecological risk of Bayinbuluke (Table 1).

3.2.2. Data Processing
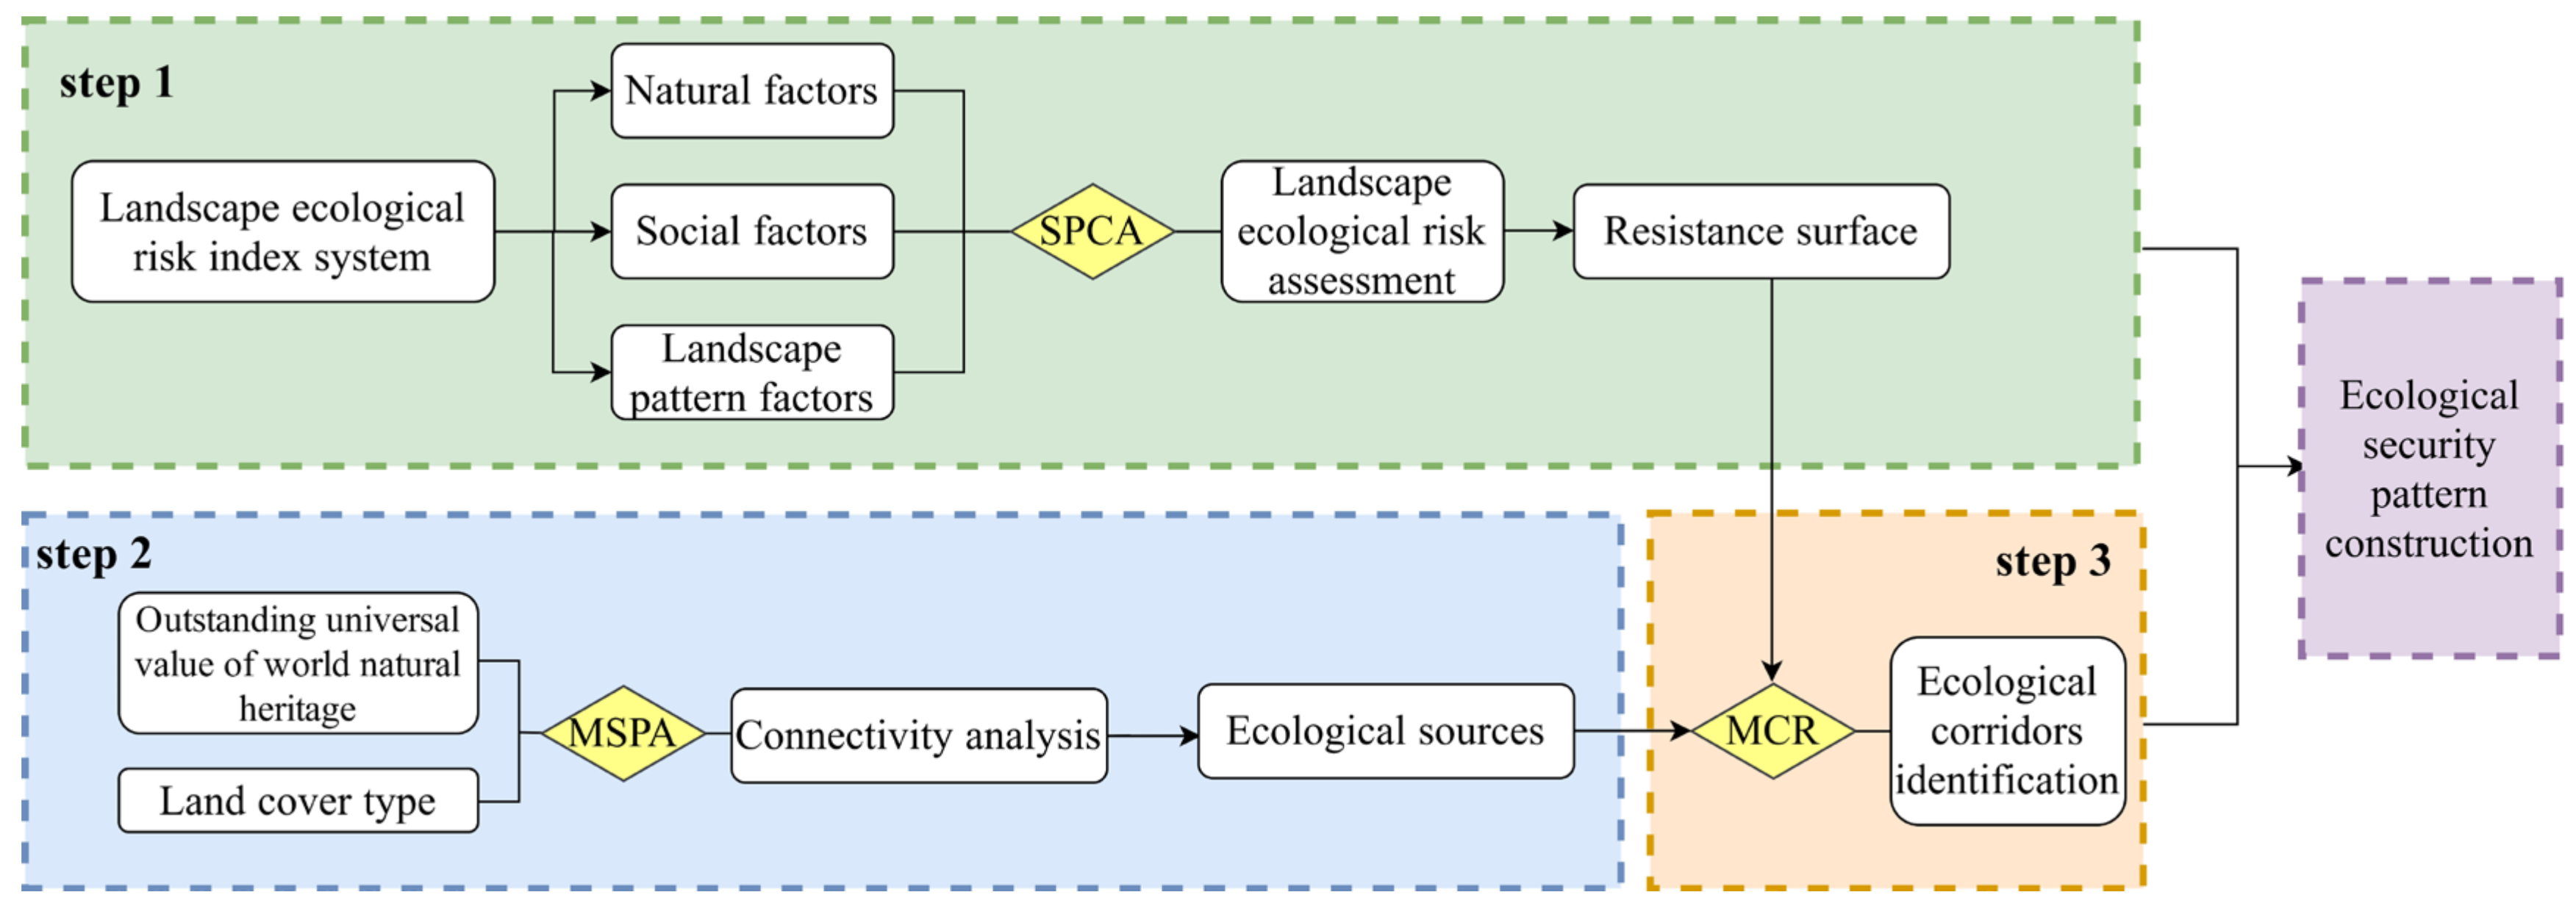
The remote sensing images were pre-processed with ENVI 5.3 (http://www.enviidl.com/ (accessed on 8 July 2021)), including radiometric calibration, atmospheric corrections, and clipping. We used the supervised classification tool in ENVI 5.3 to obtain land cover types. The study area was divided into the swamp, wetland meadow, water, cropland, high-coverage grassland, medium-coverage grassland, low-coverage grassland, sand, and bare rock. The landscape pattern index was calculated using Fragstats 4.2 (https://www.fs.usda.gov/pnw/publications/fragstats-spatial-pattern-analysis-program-quantifying-landscape-structure (accessed on 1 May 2021)). ArcGIS 10.5 (https://www.esri.com/software/arcgis/arcgis-for-desktop (accessed on 1 May 2021)) was used for spatial analysis and spatial display of indicators. Altitude and slope were retrieved from DEM data. All layers maintained the same coordinate system and cell size (WGS_1984_UTM_45N, 30 × 30 m).

4. Methods

The framework of this study was divided into three parts (Figure 3). First, the index system of “nature–society–landscape pattern” was used to assess the ecological risk to Bayinbuluke’s landscape. Second, the ecological sources were obtained based on the MSPA and landscape index. Finally, the ecological corridors were constructed according to the MCR model, and a scientific basis was proposed for the outstanding universal value and ecological conservation.

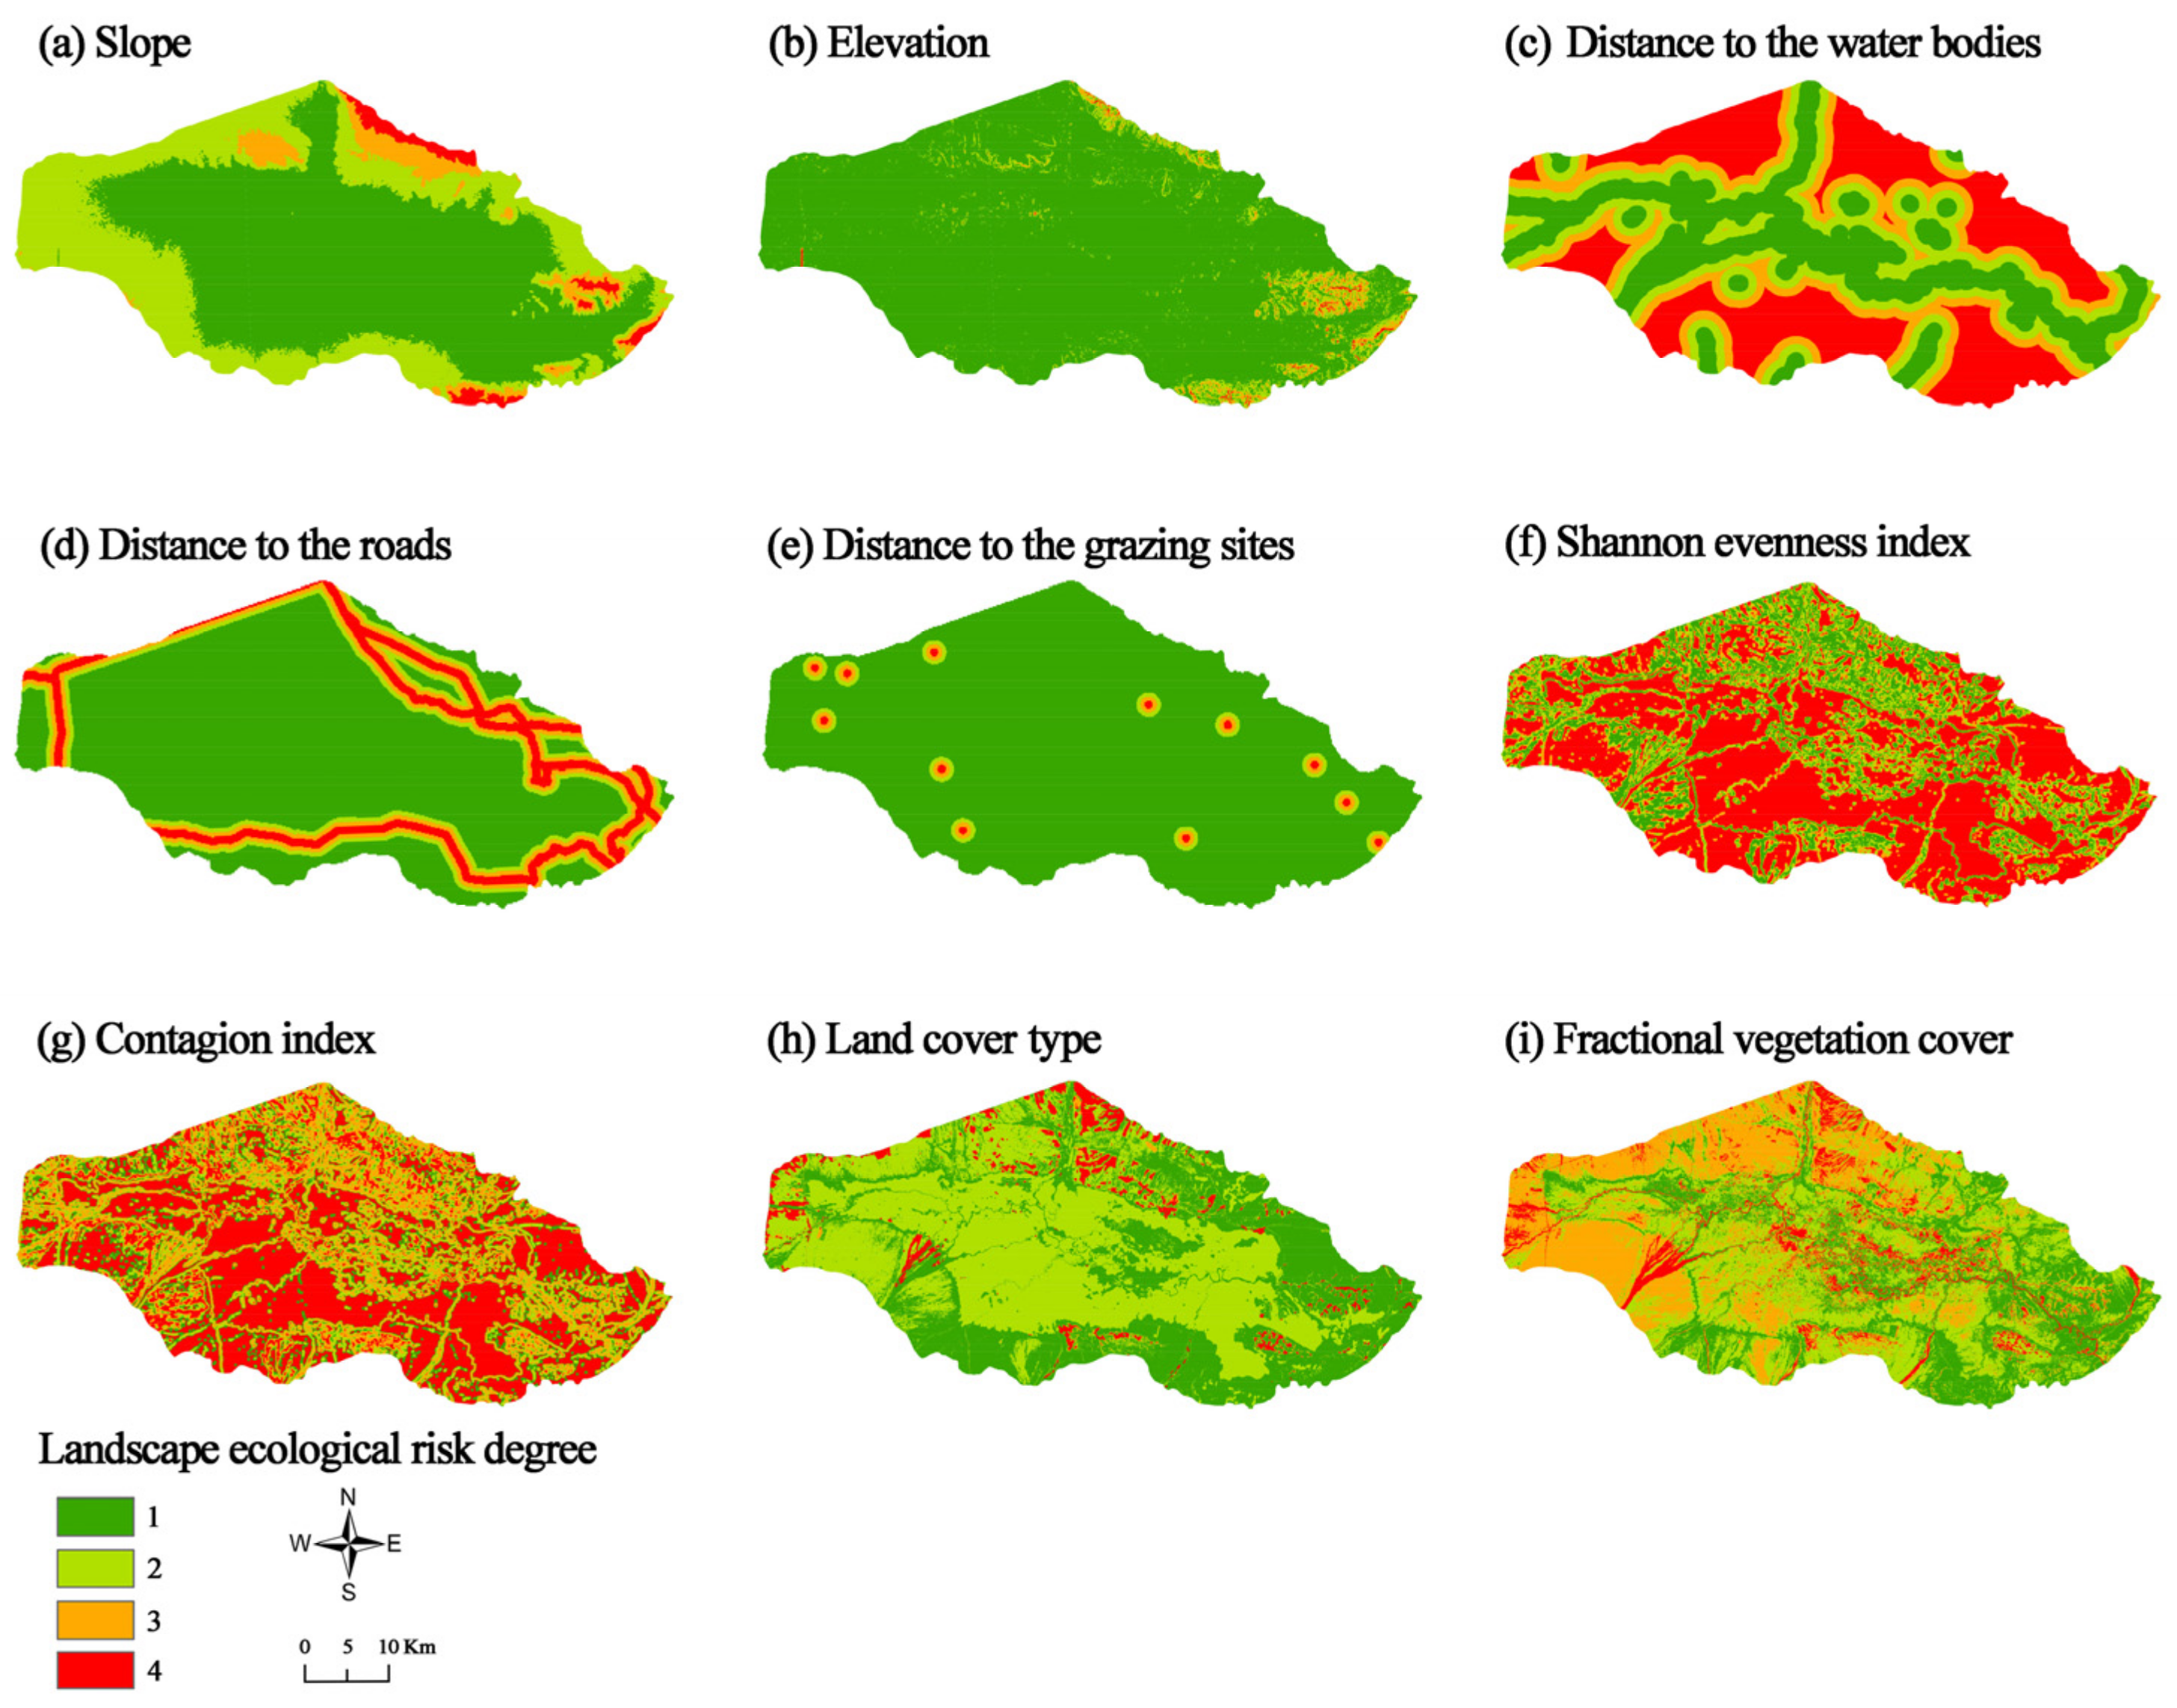
4.1. Selection of Landscape Ecological Risk Assessment Factors

This study constructed the landscape ecological risk index system of a “nature–society–landscape pattern”. The ecological risk of different landscapes was divided into four levels, with levels 1–4 representing low, medium, high, and extremely high risk, respectively (Table 2). The quantitative spatial expression of each indicator was processed through the reclassification tool in ArcGIS 10.5.
Slope, elevation, and distance to water bodies were selected as the natural factors. Slope and elevation reflect the potential impact of topographic factors on hazards such as soil erosion, with a higher value meaning more significant ecological risk to the landscape [41]. Slopes of 8°, 15°, and 25° corresponded to the cut-offs for mild, moderate, and intense soil erosion, respectively [42]. Water bodies provide ecosystem services for habitat maintenance, and a nearby water body, lowers the ecological risk to the landscape [43].
Social factors include distance to roads and distance to grazing sites. Grazing often leads to significant changes in landscape pattern. Grazing, an ordinary human activity in Bayinbuluke during the summer, has an impact on the ecology of the heritage site. The roads serve both the daily passage of herders and as a route for tourist buses. The distance reflects the extent of human activity on ecosystem disturbance, with proximity to roads and grazing sites comes higher ecological risk.
The Shannon Evenness Index (SHEI), Contagion Index (CONTAG), land cover type, and fractional vegetation cover were selected as the landscape pattern factors. The SHEI indicates the maximum possible diversity of the landscape for a particular landscape richness, with higher values indicating more stable ecosystems in the area. The value range is between 0 and 1. A value of 1 indicates that the patch types are evenly distributed with maximum diversity. The CONTAG indicates the connectivity of the dominant patches of the landscape pattern, with higher values indicating higher integrity of the landscape pattern [21,43,44]. Diverse landscape patterns can show a stronger ability to cope with external disturbances. The complex relationship between landscape patterns and ecological risk can be reflected an extent using CONTAG and SHEI indicators. The SHEI and CONTAG were visualized using a moving window in Fragstats 4.2 software, which was set at 500 m. The classification of land cover types was as referred to in previous studies [43]. Fractional vegetation cover was calculated in ENVI 5.3 based on remote sensing images [45].

4.2. Spatial Principal Component Analysis (SPCA)

SPCA transforms input multi-band data into a new space by rotating the original axes to form a new multivariate attribute space [46,47,48]. The spatial loadings, contribution of each component, and cumulative contribution are calculated, and the components with a cumulative contribution of more than 90% can be identified as statistically significant principal components in order to obtain the weights of each factor. In this paper, the SPCA was introduced into the ecological risk assessment of WNH sites; the specific formula is expressed as follows [49]:
E = i = 1 m   j = 1 n a i j F j
where E represents the comprehensive result of landscape ecological risk assessment, a i j is the j-th principal component corresponding to the i-th grid, and F j represents the eigenvalue contribution rate of the j-th principal component.
The spatial principal component analysis was processed using the principal components tool of ArcGIS. The cumulative contribution of each principal component was weighted and superimposed, and the final results of the landscape ecological risk evaluation were obtained by grading through the natural breaks method.

4.3. Construction of Ecological Security Pattern

4.3.1. Identification of Ecological Sources

Ecological sources are essential to the regional ecology and provide vital ecological services [23,50,51]. Bayinbuluke’s heritage value is reflected in the fact that it is the largest habitat for swans in China. Furthermore, it is home to 104 animal species listed on the IUCN Red List of At-Risk Species (2010). Therefore, we chose the areas most critical for the life of Bayinbuluke’s wildlife. Water, swamp, and high cover grasslands were extracted as the foreground for the MSPA analysis; then, other landscape types were used as background. The data were converted to a 30 × 30 m binary raster in the “tiff” format. The eight-neighborhood analysis method was used to analyze the data in Guidos 2.6, and seven landscape types (branch, edge, perforation, islet, core, bridge, and loop) were obtained.
The level of landscape connectivity reflects whether a particular landscape is conducive to species migration within source patches. The core areas were extracted as landscape elements for the connectivity analysis. The integral index of connectivity (IIC) and probability of connectivity (PC) are important landscape pattern indicators [52,53]:
IIC = i = 1 n j = 1 n a i · a j 1 + n l i j A L 2
PC = i = 1 n j = 1 n a i · a j · p i j * A L 2
d I = I I r e m o v e I × 100 %
where n denotes the total number of patches, ai and aj denote the area of patch i and patch j, respectively, nlij denotes the connectivity between patch i and patch j, AL is the total area of the landscape, and p i j * is the maximum probability of direct dispersal of species in i and j. I refers to IIC and PC, and Iremove is the connectivity index value of the landscape after removing patch i from that landscape.
This study used Conefor 2.6 to calculate the landscape connectivity index of the core area [54]. Conefor 2.6 is a landscape connectivity recognition software that calculates patch connectivity and identifies core patches vital to ecological connectivity [55,56]. The threshold value of the patch connectivity distance was set to 2000 and the probability of connectivity was set to 0.5. Based on the IIC and PC, eleven patches (dPC > 2) were selected as ecological sources.

4.3.2. Construction of Ecological Corridors

Corridors are linear landscape elements that function as channels or barriers and are important bridges for energy flow [21]. Connecting ecological sources by constructing ecological corridors is essential to protect biodiversity and maintain the regional ecological environment. The resistance surface is the resistance to ecological processes such as material exchange, energy transfer and species migration between ecological sources [43]. The construction of the resistance surface is important for the corridor [57]. The MCR model extracted potential ecological corridors in this study, which calculated the minimum cumulative resistance distance between the source and the target in order to determine the path [23,43,58]. The formula is as follows:
MCR = f m i n i = 1 m j = 1 n ( D i j W i )
where MCR denotes the cumulative value of the minimum resistance between ecological source j and any point i, Dij represents the distance spanned between the i-th grid and the j-th ecological source, and Wi is the resistance value of the i-th grid on the landscape resistance surface that prevents the ecological flow from operating.
We used the strength of interactions between ecological sources to characterize the effectiveness of potential ecological corridors. In this paper, the gravity model is used to identify the key ecological corridors extracted by the MCR model [59]. The formula is as follows:
G i j = N i × N j D i j 2 = [ 1 P i × ln S i ] 1 P j × ln S j I i j I m a x 2 = I m a x 2 ln S i × ln S j I i j 2 P i P j
where Gij is the interaction between patch i and patch j, Ni and Nj are the weight coefficients of the two patches, Dij denotes the normalised value of corridor resistance between patch i and j, Pi and Pj are the resistance value of patch i and j, respectively, Si and Sj are the areas of patch i and patch j, respectively, Iij denotes the cumulative resistance value of the corridor between patch i and patch j, and Imax is the maximum resistance of all corridors in the study area.

5. Results

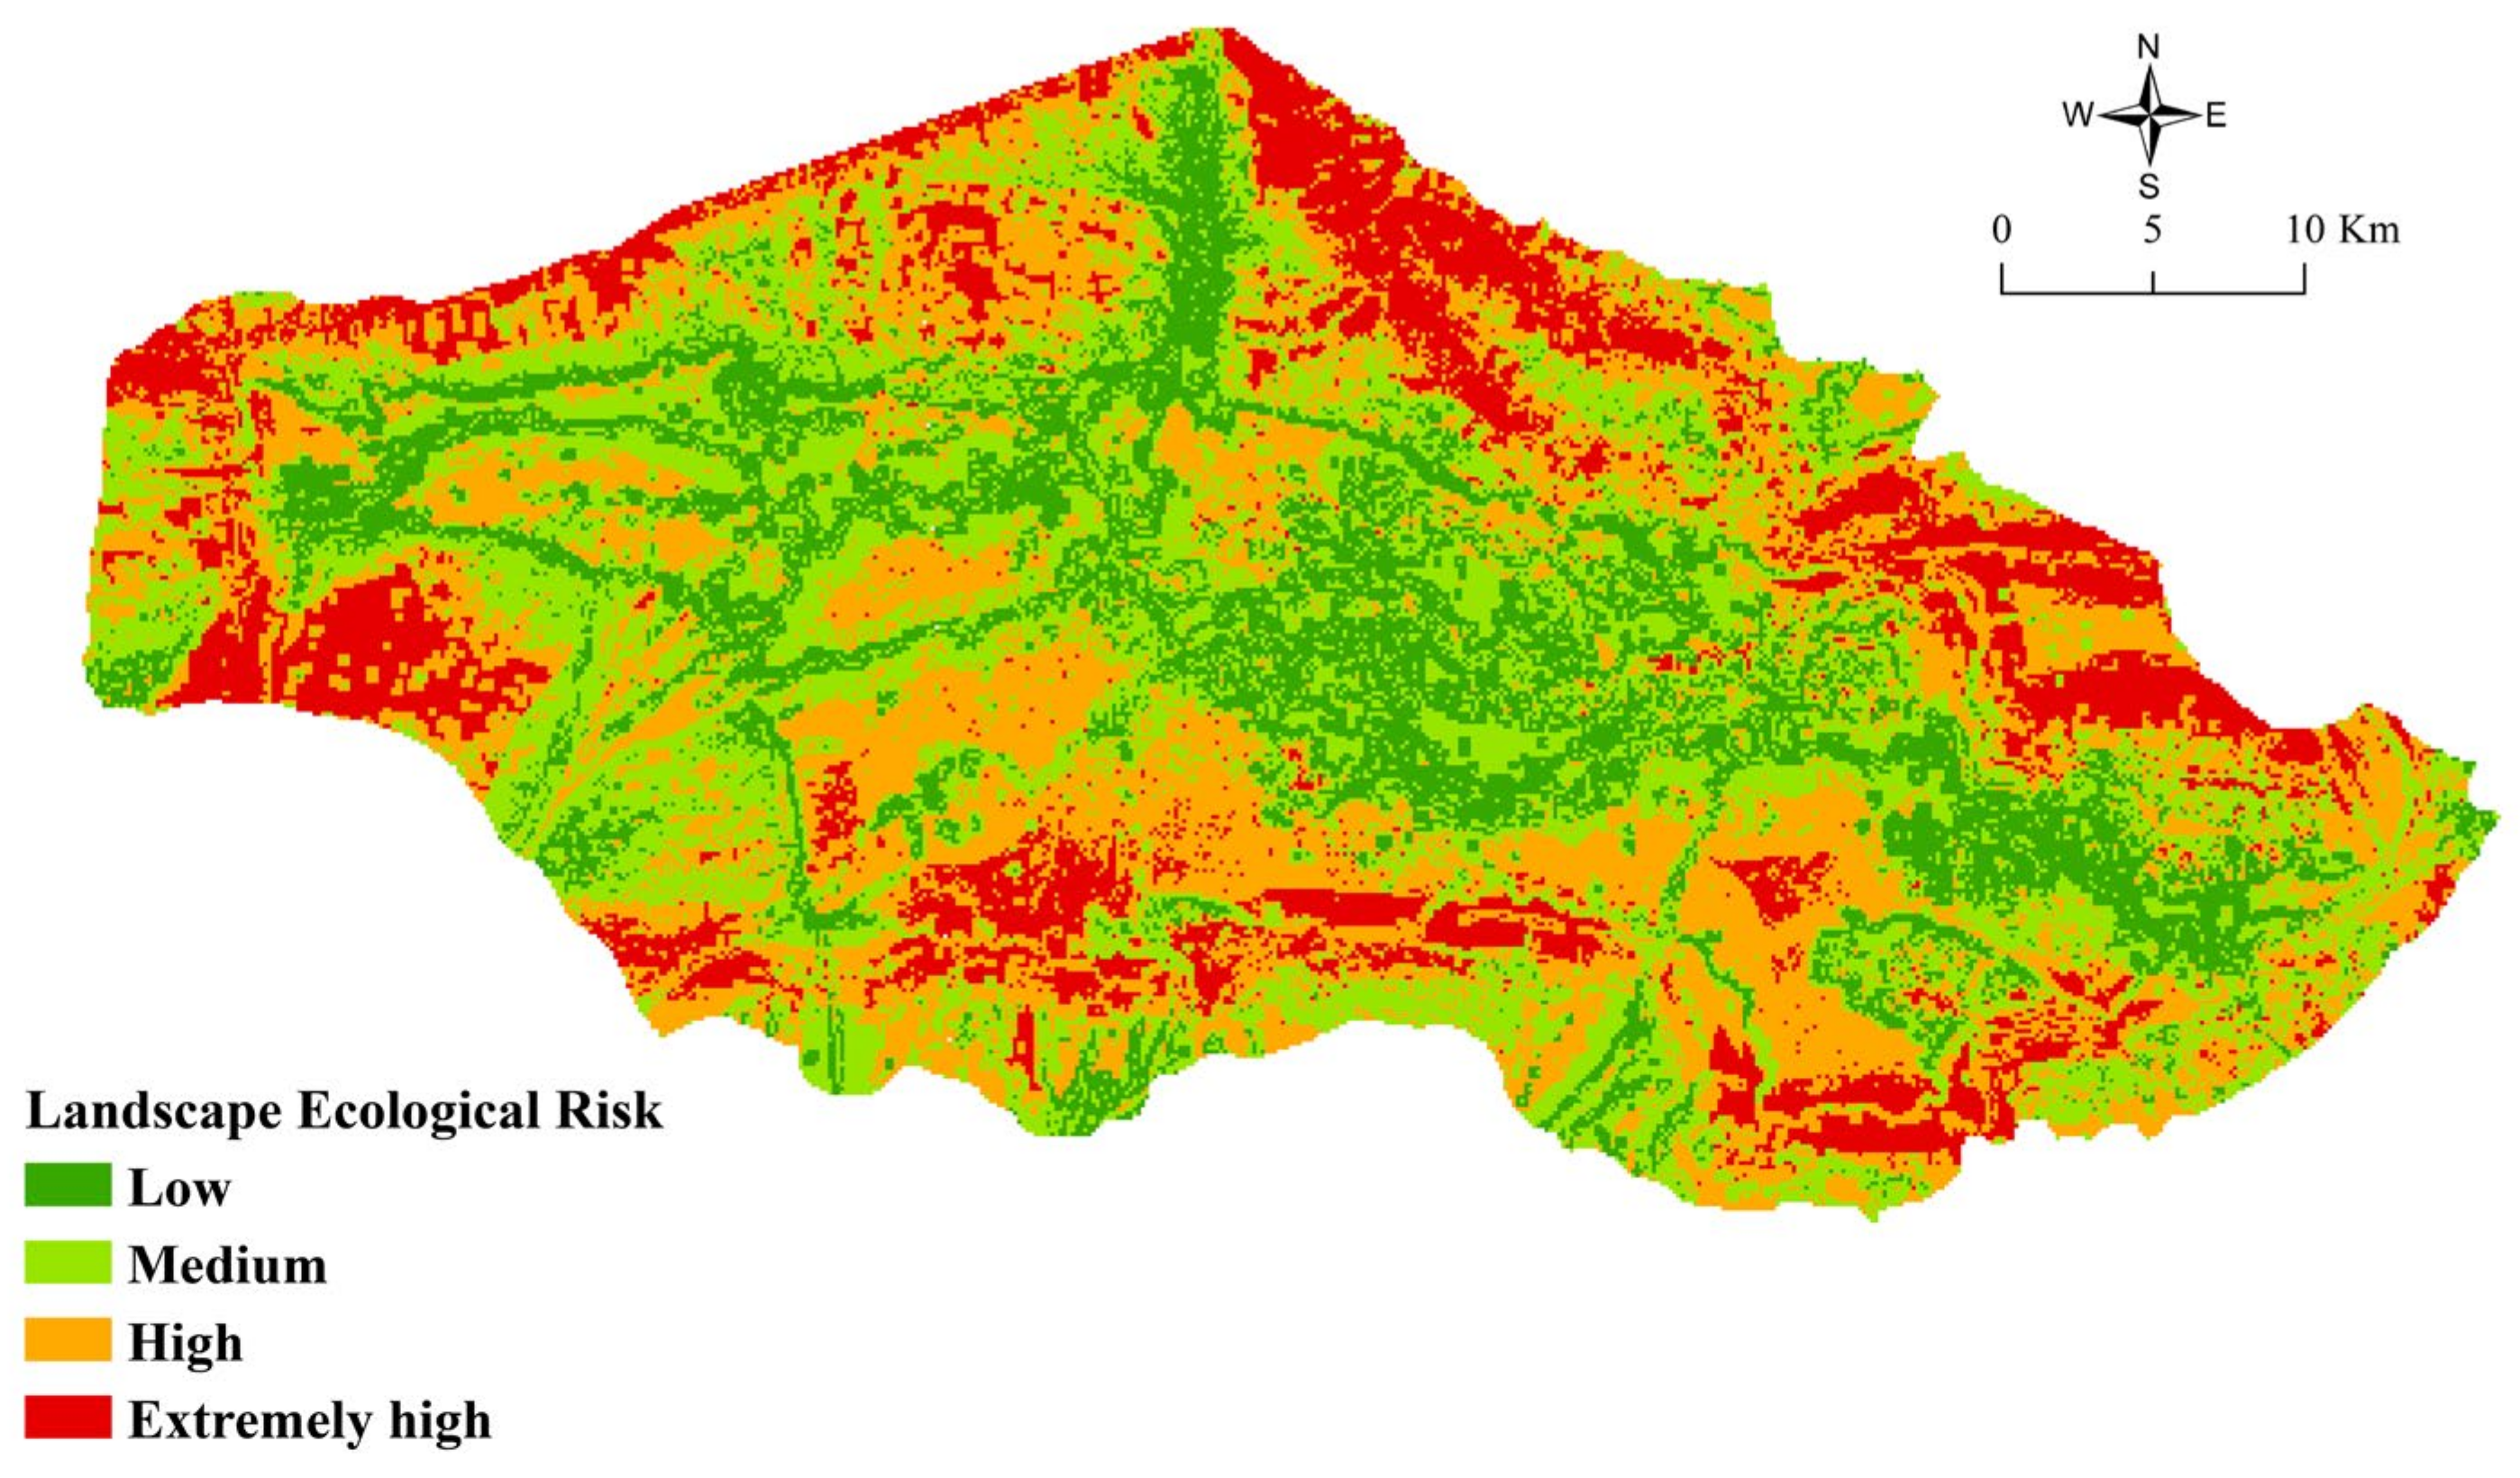
5.1. Landscape Ecological Risk Assessment

In the SPCA, the cumulative contribution of the first six spatial principal components reached 90%, which means that these components can effectively summarise the ecological risk information of Bayinbuluke’s landscape (Table 3). The weights of each indicator factor were calculated based on the initial characteristic roots and cumulative contribution rates of the first six principal components (Table 4). In terms of evaluation aspects, the landscape ecological risk evaluation results were more influenced by the landscape pattern and less affected by natural and social factors. In terms of individual factors, the four most influential factors were distance to roads, fractional vegetation cover, the SHEI, and the CONTAG. Thus, the construction of roads and the distribution of diversity in different patches influence ecological security.
In our analysis of the spatial distribution map of landscape ecological risk evaluation factors (Figure 4), the risk distribution trends of slope and elevation factors in the natural index were similar, with high-risk areas relatively few in number and concentrated in the northwestern and southeastern regions. Greater distance to water bodies meant higher landscape ecological risk. In the social aspect, the landscape ecological risk of roads showed a zonal distribution. The landscape ecological risk of grazing sites showed a point-like distribution. In the landscape pattern aspect, the SHEI and CONTAG showed firm spatial heterogeneity. The landscape ecological risk of the land-cover factor was mainly in the north. The ecological risk of the fractional vegetation cover factor was mainly concentrated in the west and the north.
According to the spatial distribution characteristics of landscape ecological risk in Bayinbuluke (Table 5, Figure 5), the low-risk areas were mainly located in the core area of Bayinbuluke, accounting for 18.82% of the total area. The areas of medium and high landscape ecological risk were similar in size, while the high-risk area was 625.99 km2, accounting for the largest proportion of the study area. The distribution of high-risk areas was relatively fragmented and mainly concentrated in the southern part of the study area. The extremely high-risk area was 307.65 km2 and was mainly located in the buffer zone around the edge of the heritage site, and occupied the smallest area of the region. These areas were at risk due to higher slopes, higher elevations, landscape fragmentation, and grazing. Overall, the ecological risk in the study area was high.

5.2. The Construction of Ecological Security Pattern for Bayinbuluke

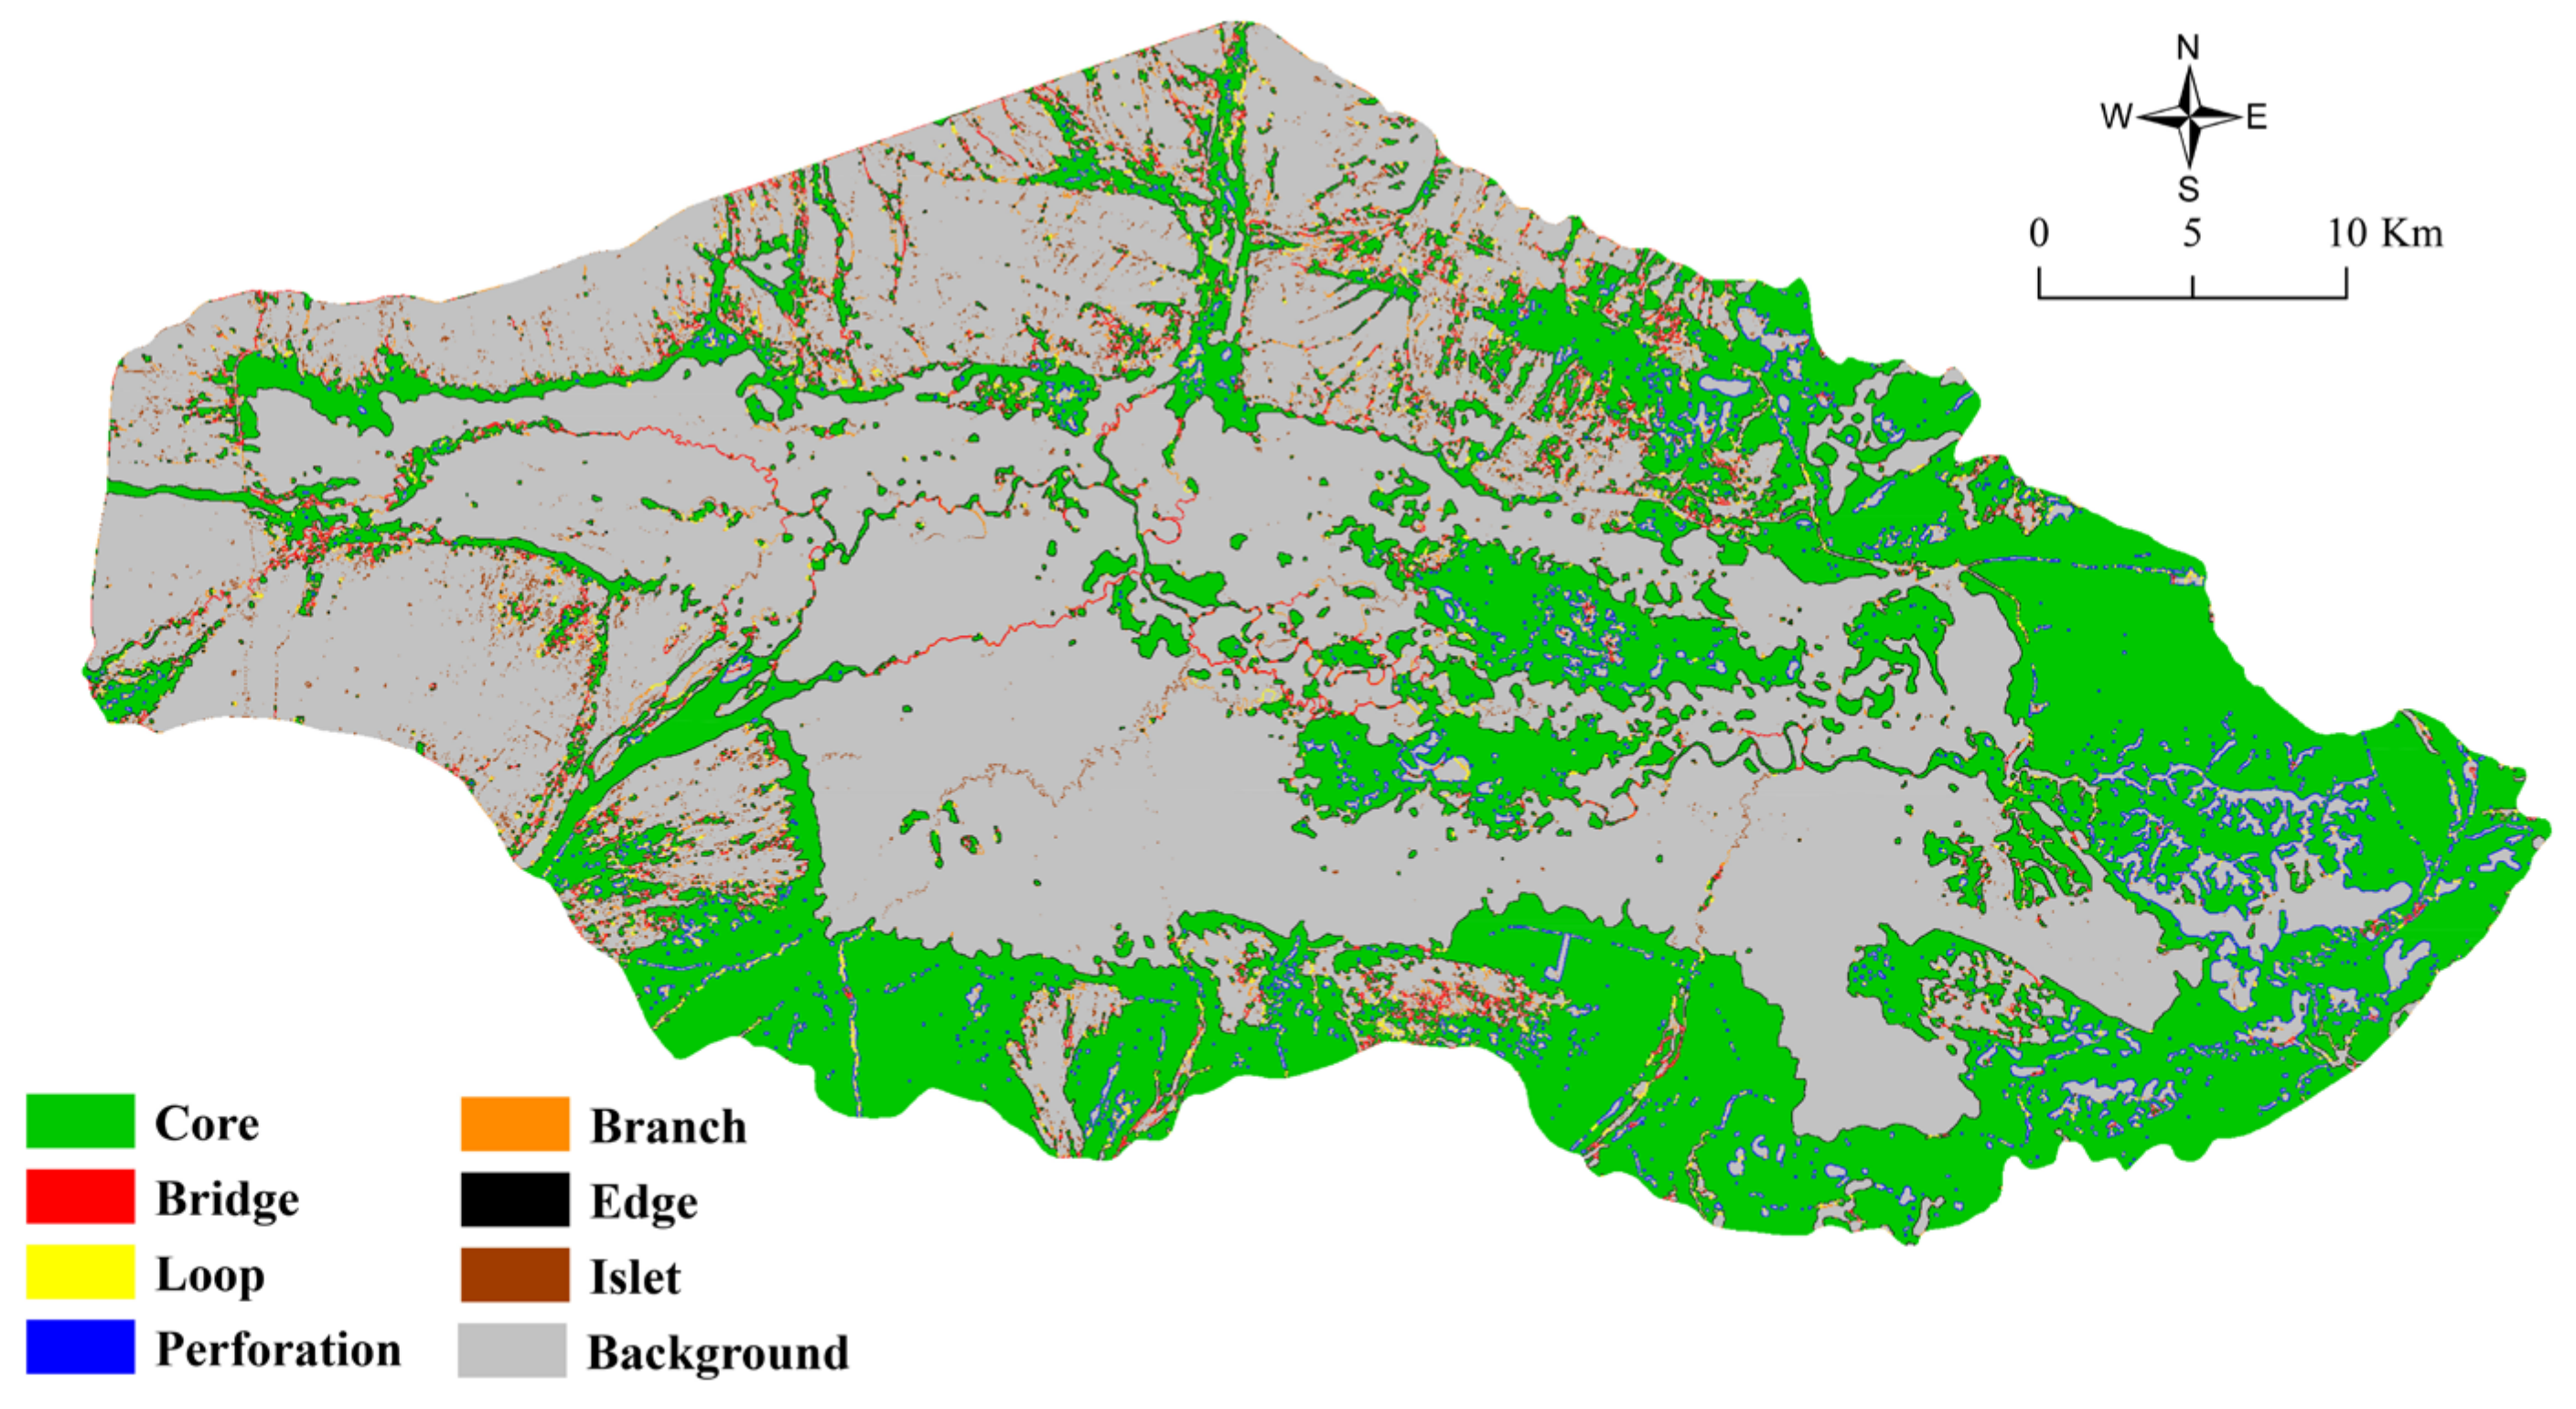
5.2.1. Establishment of Ecological Sources

Seven landscape categories were obtained based on Guidos analysis software (Figure 6). Then, using Conefor software, the IIC and PC were chosen to evaluate the landscape connectivity of the core area, with the threshold set to 2000 and the probability of connectivity set to 0.5. The final eleven patches with an area greater than 1 km2 and a dPC value greater than 2 were identified as ecological sources (Table 6), covering an area of 509 km2. Large areas of high-coverage grassland dominate, with a relatively small proportion of rivers and swamp mainly in the south and northeast of Bayinbuluke, where the ecosystems are relatively stable and the biodiversity is abundant, which is conducive to the spread and maintenance of species.

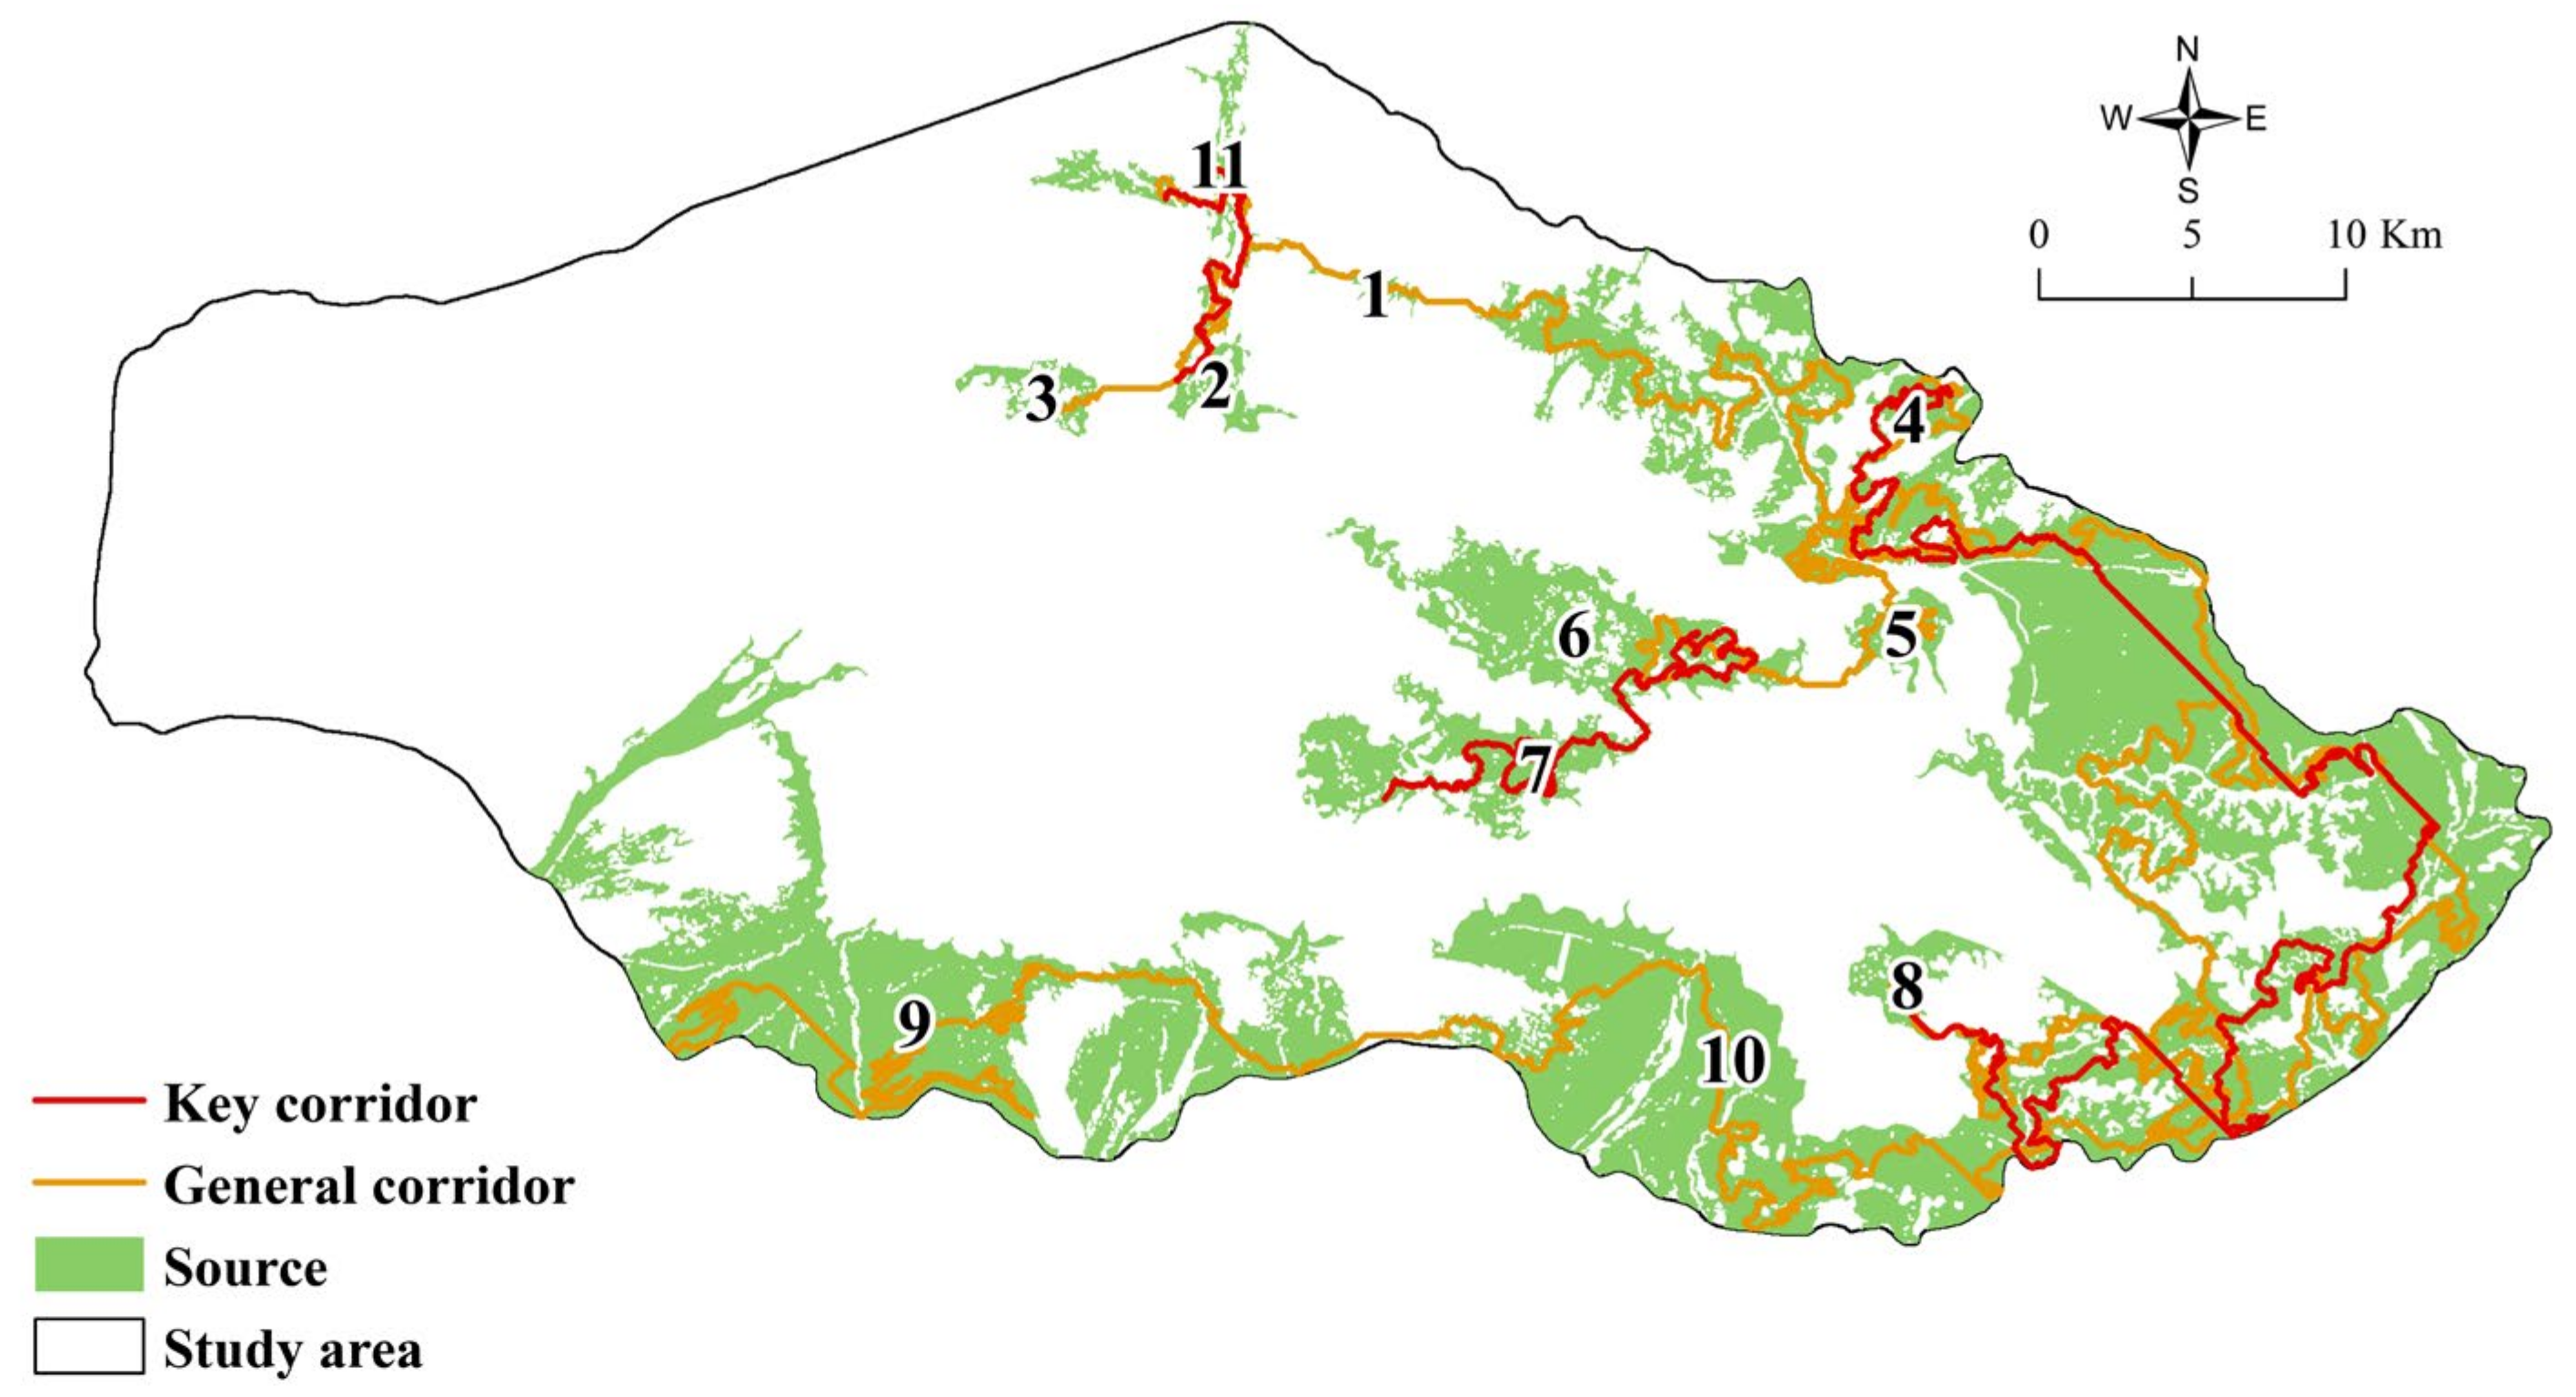
5.2.2. Ecological Corridors Construction

In this paper, the cumulative resistance surface was constructed based on the evaluation results of ecological sources and landscape ecological risk using the cost distance tool in ArcGIS. Finally, the natural breaks method classified the resistance surface into four grades (Table 7).
The potential ecological corridors were identified based on the gravity model, and the interaction intensity between sources was classified into three classes (0, 10), [10, 100), and [100, +∞). Then, the corridor interaction intensity in [100, +∞) was identified as the key corridor. The corridor interaction intensity in [10, 100) was identified as general corridor. The interactions’ intensity in (0, 10) was weak, and thus was not considered.
Fourteen corridors (four key corridors and ten general corridors) were selected based on the gravity model results in order to obtain the ecological network map of the study area (Figure 7). Ecological corridors among source sites 2 and 11, 4 and 10, 6 and 7, and 8 and 10 were important. It was easier for species to overcome migration resistance and achieve material transfer between these corridors. Source 10 was the most frequent source of material exchange and energy flow in the network. Source sites 4 and 5 had good connectivity with several source sites via general corridors. The northern part of the study area had better connectivity with the eastern part, and the ecological corridors were more dense and favorable for species migration. The southern part of the study area was less connected to other parts, and the network was not well developed.

6. Discussion

Taking Bayinbuluke World Natural Heritage Site as the study area, this paper established an index evaluation system from the three aspects of a “nature–society–landscape pattern” and evaluated the landscape ecological risk using spatial principal component analysis. The ecological sources were selected according to the outstanding universal values of the heritage sites and the MSPA method. Then, the ecological network of Bayinbuluke was constructed using MCR according to the evaluation results on the landscape ecological risk. The main conclusions are as follows.
(1) The evaluation system of the “nature–society–landscape pattern” of the World Natural Heritage site was constructed by selecting nine factors to evaluate the landscape ecological risk. As shown in Table 4, the evaluation factor of landscape pattern had the strongest influence on the comprehensive risk, followed by the natural factors, while the impact of social factors was weak. In terms of individual factors, distance to roads, fractional vegetation cover, SHEI, and CONTAG had important effects on the ecological risk.
(2) As Figure 5 and Table 5 show, the overall ecological risk level in the study area was high, with areas of low risk concentrated in the core area and high-risk areas mainly in the outer buffer zone. This result is consistent with the findings of the ecological environment assessment of Bayinbuluke conducted by Liu et al. [35]. The high-risk area was 625.99 km2 and the extremely high-risk area was 307.65 km2, with the combined area accounting for 49.26% of the overall area.
(3) Water bodies, swamps, and high-coverage grassland were selected as foregrounds based on the MSPA, which simplified the process of judging landscape patterns [60]. Then, eleven core area patches larger than 1 km2 and dPC greater than 2 were selected as ecological sources based on landscape connectivity, avoiding the subjectivity of artificially selecting ecological sources [52]. The distribution of ecological sources in the study area was heterogeneous. The patches with larger areas were mainly located in the northeastern and southern parts of the study area. The patches in the north were smaller and striped.
(4) The minimum cumulative depletion paths between ecological sources were constructed based on the MCR model, and four key corridors and ten general corridors were identified. Sources 4, 5, and 10 had good connectivity. From the overall view of the constructed ecological network, the northern part of the study area is well connected with the eastern part. The ecological corridors are relatively dense and conducive to species migration between patches. However, few corridors connect the south with the east.

6.1. Theoretical Implications

First, current studies have focused on the construction of security patterns in urban clusters and watersheds [30,31], and fewer studies have been conducted on nature reserves. Heritage sites are representative nature reserves, and thus research is necessary. Moreover, previous studies on ecological risk have mainly focused on analyzing natural and human influences [17,19]. In this study, the “nature–society–landscape pattern” of landscape ecological risk evaluation was constructed for a World Natural Heritage site and landscape pattern factors were considered. The evaluation system was able to reveal the inherent complexity of human activities and ecological processes. In addition, the SPCA method was used to determine the weights of landscape ecological risk indicators, which reduced the subjectivity of weights obtained by human empirical judgment. This method was able to reflect more objectively the differences in the importance of different indicators. Overall, this study provides a new research framework for determining the ecological security pattern of nature reserves.
Second, the determination of the resistance surface is the basis for the construction of the MCR model, which has a considerable impact on ecological network construction. Previous studies have had strong subjectivity in the determination of the landscape resistance value [23,27]. In this study, the results of the landscape ecological risk evaluation were used as the basis for landscape resistance assignment, and natural and social landscape pattern factors were considered comprehensively.
Finally, the selection of ecological sources is crucial to the construction of ecological security patterns. In previous studies, important ecological lands such as water and forest were mostly selected directly as ecological sources based on area size [21]. In this study, we extracted the ecological sources by analyzing the outstanding universal values of the WNH sites in combination with the MSPA method. The importance of the core patches in the study area was quantitatively evaluated based on PC and IIC, reducing subjectivity to a certain extent.

6.2. Practical Implications

The landscape pattern had an important influence on the ecological risk to the landscape of Bayinbuluke. The management organization should therefore focus on protecting those buffer zones with a high level of risk. Seasonal grazing from June to September exists in the buffer zone [34], and land desertification is spreading in certain areas, leading to the spread of ecological risks to the periphery. Therefore, local areas of land desertification should be treated in a timely manner in order to prevent further expansion. The local herders should be encouraged to carry out only moderate grazing, which is good for maintaining the soil quality of alpine grasslands [36]. In terms of individual factors, the distance to roads leads to the highest landscape risk. According to the results of the multi-level ecological network constructed from the key corridors and general corridors, it is clear that the southern part of the study area is weakly connected to other parts; thus, the connections here should be increased. In summation, this study provides a practical approach to preventing and managing ecological risk in Bayinbuluke’s landscape as well as a reference for landscape pattern optimization elsewhere.

7. Conclusions

An analytical framework is proposed for assessing landscape ecological risk and the construction of ecological security patterns, taking the Bayinbuluke World Heritage Site as an example. Our results show that landscape pattern factors and natural factors have the most decisive influence on the ecological risk to Bayinbuluke. In terms of spatial distribution, high-risk areas were mainly located within the peripheral buffer zone. Based on the MSPA combined with connectivity index analysis, eleven patches were identified as ecological sources, mainly distributed in the northeastern and southern regions of the study area. Four critical corridors and ten general corridors were identified according to MCR. The results of our study provide a theoretical reference for national nature reserves with similar ecological issues.
Several limitations of this study need to be acknowledged. In this paper, due to the lack of biologically detailed information on the Bayinbuluke heritage site, the resistance surface for ecological network construction was obtained solely through the results of the landscape ecological risk assessment, without landscape resistance assignment for species’ living characteristics. In selecting ecological sources, there may be small patches missing, which could have impacted the results of ecological corridor identification [21]. In addition, dPC > 2 was used as the screening threshold in the identification of ecological sources; however, the scientific validity of the threshold selection needs to be further verified [61]. Therefore, future studies can be compared by setting different thresholds during the identification stage. Moreover, the evaluation of landscape ecological risk was analyzed using geospatial information data from 2020. Future studies might focus on changes in the distribution of ecological risk in the landscape over a longer time series.

Author Contributions

Writing—original draft preparation, Xiaodong Chen; writing—review and editing, Xiaodong Chen and Fang Han; visualization, Xiaodong Chen and Tian Wang; supervision, Zhaoping Yang. All authors have read and agreed to the published version of the manuscript.

Funding

This research was funded by the National Natural Science Foundation of China, grant number No. 41971192.

Data Availability Statement

The dataset was provided by Geospatial Data Cloud (http://www.gscloud.cn, accessed on 10 July 2021).

Conflicts of Interest

The authors declare no conflict of interest.

References

  1. Jackson, N.D.; Fahrig, L. Relative effects of road mortality and decreased connectivity on population genetic diversity. Biol. Conserv. 2011, 144, 3143–3148. [Google Scholar] [CrossRef]
  2. Fischer, J.; Lindenmayer, D.B. Landscape modification and habitat fragmentation: A synthesis. Glob. Ecol. Biogeogr. 2007, 16, 265–280. [Google Scholar] [CrossRef]
  3. Depietri, Y. The social–ecological dimension of vulnerability and risk to natural hazards. Sustain. Sci. 2020, 15, 587–604. [Google Scholar] [CrossRef]
  4. Zhao, Z.; Zhang, T. Integration of Ecosystem Services into Ecological Risk Assessment for Implementation in Ecosystem-Based River Management: A Case Study of the Yellow River, China. Hum. Ecol. Risk Assess. 2013, 19, 80–97. [Google Scholar] [CrossRef]
  5. Leuven, R.S.E.W.; Gne, I.P. Riverine landscape dynamics and ecological risk assessment. Freshw. Biol. 2010, 47, 845–865. [Google Scholar] [CrossRef]
  6. Cao, Q.; Zhang, X.; Ma, H.; Wu, J. Review of landscape ecological risk and an assessment framework based on ecological services: ESRISK. Acta Geogr. Sin. 2018, 73, 843–855. (In Chinese) [Google Scholar] [CrossRef]
  7. Cunha, N.S.; Magalhaes, M.R. Methodology for mapping the national ecological network to mainland Portugal: A planning tool towards a green infrastructure. Ecol. Indic. 2019, 104, 802–818. [Google Scholar] [CrossRef]
  8. Allan, J.R.; Venter, O.; Maxwell, S.; Bertzky, B.; Jones, K.; Shi, Y.; Watson, J.E.M. Recent increases in human pressure and forest loss threaten many Natural World Heritage Sites. Biol. Conserv. 2017, 206, 47–55. [Google Scholar] [CrossRef] [Green Version]
  9. Mann, D.; Anees, M.M.; Rankavat, S.; Joshi, P.K. Spatio-temporal variations in landscape ecological risk related to road network in the Central Himalaya. Hum. Ecol. Risk Assess. 2021, 27, 289–306. [Google Scholar] [CrossRef]
  10. Ayre, K.K.; Landis, W.G. A Bayesian Approach to Landscape Ecological Risk Assessment Applied to the Upper Grande Ronde Watershed, Oregon. Hum. Ecol. Risk Assess. 2012, 18, 946–970. [Google Scholar] [CrossRef]
  11. Wang, B.; Ding, M.; Li, S.; Liu, L.; Ai, J. Assessment of landscape ecological risk for a cross-border basin: A case study of the Koshi River Basin, central Himalayas. Ecol. Indic. 2020, 117, 106621. [Google Scholar] [CrossRef]
  12. Li, W.; Wang, Y.; Xie, S.; Sun, R.; Cheng, X. Impacts of landscape multifunctionality change on landscape ecological risk in a megacity, China: A case study of Beijing. Ecol. Indic. 2020, 117, 106681. [Google Scholar] [CrossRef]
  13. Zhang, W.; Chang, W.; Zhu, Z.; Hui, Z. Landscape ecological risk assessment of Chinese coastal cities based on land use change. Appl. Geogr. 2020, 117, 102174. [Google Scholar] [CrossRef]
  14. Li, J.; Pu, R.; Gong, H.; Luo, X.; Ye, M.; Feng, B. Evolution characteristics of landscape ecological risk patterns in coastal zones in Zhejiang Province, China. Sustainability 2017, 9, 584. [Google Scholar] [CrossRef] [Green Version]
  15. Hayes, E.H.; Landis, W.G. Regional ecological risk assessment of a near shore marine environment: Cherry Point, WA. Hum. Ecol. Risk Assess. 2004, 10, 299–325. [Google Scholar] [CrossRef]
  16. Malekmohammadi, B.; Blouchi, L.R. Ecological risk assessment of wetland ecosystems using Multi Criteria Decision Making and Geographic Information System. Ecol. Indic. 2014, 41, 133–144. [Google Scholar] [CrossRef]
  17. Wang, H.; Liu, X.; Zhao, C.; Chang, Y.; Zang, F. Spatial-temporal pattern analysis of landscape ecological risk assessment based on land use/land cover change in Baishuijiang National nature reserve in Gansu Province, China. Ecol. Indic. 2021, 124, 107454. [Google Scholar] [CrossRef]
  18. Dale, V.H.; Kline, K.L. Issues in using landscape indicators to assess land changes. Ecol. Indic. 2013, 28, 91–99. [Google Scholar] [CrossRef]
  19. Gong, J.; Cao, E.; Xie, Y.; Xu, C.; Li, H.; Yan, L. Integrating ecosystem services and landscape ecological risk into adaptive management: Insights from a western mountain-basin area, China. J. Environ. Manag. 2021, 281, 111817. [Google Scholar] [CrossRef]
  20. Li, X.; Li, S.; Zhang, Y.; O’Connor, P.J.; Zhang, L.; Yan, J. Landscape Ecological Risk Assessment under Multiple Indicators. Land 2021, 10, 739. [Google Scholar] [CrossRef]
  21. Yan, Y.; Ju, H.; Zhang, S.; Chen, G. The Construction of Ecological Security Patterns in Coastal Areas Based on Landscape Ecological Risk Assessment—A Case Study of Jiaodong Peninsula, China. Int. J. Environ. Res. Public Health 2021, 18, 12249. [Google Scholar] [CrossRef]
  22. Klar, N.; Herrmann, M.; Henning-Hahn, M.; Pott-Dörfer, B.; Hofer, H.; Kramer-Schadt, S. Between ecological theory and planning practice: (Re-) Connecting forest patches for the wildcat in Lower Saxony, Germany. Landsc. Urban Plan. 2012, 105, 376–384. [Google Scholar] [CrossRef]
  23. Zhou, D.; Lin, Z.; Ma, S.; Qi, J.; Yan, T. Assessing an ecological security network for a rapid urbanization region in Eastern China. Land Degrad. Dev. 2021, 32, 2642–2660. [Google Scholar] [CrossRef]
  24. Vogt, P.; Ferrari, J.R.; Lookingbill, T.R.; Gardner, R.H.; Riitters, K.H.; Ostapowicz, K. Mapping functional connectivity. Ecol. Indic. 2009, 9, 64–71. [Google Scholar] [CrossRef]
  25. Velázquez, J.; Gutiérrez, J.; Hernando, A.; García-Abril, A. Evaluating landscape connectivity in fragmented habitats: Cantabrian capercaillie (Tetrao urogallus cantabricus) in northern Spain. For. Ecol. Manag. 2017, 389, 59–67. [Google Scholar] [CrossRef]
  26. Ye, H.; Yang, Z.; Xu, X. Ecological Corridors Analysis Based on MSPA and MCR Model—A Case Study of the Tomur World Natural Heritage Region. Sustainability 2020, 12, 959. [Google Scholar] [CrossRef] [Green Version]
  27. Li, Y.; Zhang, Y.; Jiang, Z.; Guo, C.; Zhao, M.; Yang, Z.; Guo, M.; Wu, B.; Chen, Q. Integrating morphological spatial pattern analysis and the minimal cumulative resistance model to optimize urban ecological networks: A case study in Shenzhen City, China. Ecol. Process. 2021, 10, 63. [Google Scholar] [CrossRef]
  28. Fu, W.; Liu, S.; Degloria, S.D.; Dong, S.; Beazley, R. Characterizing the “fragmentation–barrier” effect of road networks on landscape connectivity: A case study in Xishuangbanna, Southwest China. Landsc. Urban Plan. 2010, 95, 122–129. [Google Scholar] [CrossRef]
  29. Miquelle, D.G.; Rozhnov, V.V.; Ermoshin, V.; Murzin, A.A.; Nikolaev, I.G.; Hernandez-Blanco, J.A.; Naidenko, S.V. Identifying ecological corridors for Amur tigers (Panthera tigris altaica) and Amur leopards (Panthera pardus orientalis). Integr. Zool. 2015, 10, 389–402. [Google Scholar] [CrossRef]
  30. Kang, J.M.; Zhang, X.; Zhu, X.W.; Zhang, B.L. Ecological security pattern: A new idea for balancing regional development and ecological protection. A case study of the Jiaodong Peninsula, China. Glob. Ecol. Conserv. 2021, 26, 17. [Google Scholar] [CrossRef]
  31. Ma, X.B.; Sun, B.; Hou, G.L.; Zhong, X.; Li, L. Evaluation and spatial effects of tourism ecological security in the Yangtze River Delta. Ecol. Indic. 2021, 131, 11. [Google Scholar] [CrossRef]
  32. Shackleton, R.T.; Bertzky, B.; Wood, L.E.; Bunbury, N.; Jager, H.; van Merm, R.; Sevilla, C.; Smith, K.; Wilson, J.R.U.; Witt, A.B.R.; et al. Biological invasions in World Heritage Sites: Current status and a proposed monitoring and reporting framework. Biodivers. Conserv. 2020, 29, 3327–3347. [Google Scholar] [CrossRef]
  33. Mairota, P.; Cafarelli, B.; Boccaccio, L.; Leronni, V.; Labadessa, R.; Kosmidou, V.; Nagendra, H. Using landscape structure to develop quantitative baselines for protected area monitoring. Ecol. Indic. 2013, 33, 82–95. [Google Scholar] [CrossRef]
  34. Wang, Z.; Yang, Z.; Shi, H.; Han, F.; Liu, Q.; Qi, J.; Lu, Y. Ecosystem Health Assessment of World Natural Heritage Sites Based on Remote Sensing and Field Sampling Verification: Bayanbulak as Case Study. Sustainability 2020, 12, 2610. [Google Scholar] [CrossRef] [Green Version]
  35. Liu, Q.; Yang, Z.; Han, F.; Shi, H.; Wang, Z.; Chen, X. Ecological environment assessment in world natural heritage site based on Remote-Sensing Data. a case study from the Bayinbuluke. Sustainability 2019, 11, 6385. [Google Scholar] [CrossRef] [Green Version]
  36. Yu, P.; Han, D.; Liu, S.; Wen, X.; Huang, Y.; Jia, H. Soil quality assessment under different land uses in an alpine grassland. Catena 2018, 171, 280–287. [Google Scholar] [CrossRef]
  37. Yang, Z.; Zhang, X.; Xu, X.; Han, F.; Zhang, Y.; Yang, W.; Yan, S.; Hai, Y.; Yin, L.; Zhao, X. World Natural Heritage of Xinjiang Tianshan; Science Press: Beijing, China, 2017; pp. 133–143. [Google Scholar]
  38. Xu, X.; Yang, Z.; Saiken, A.; Rui, S.; Liu, X. Natural Heritage value of Xinjiang Tianshan and global comparative analysis. J. Mt. Sci. 2012, 9, 262–273. [Google Scholar] [CrossRef]
  39. UNESCO. Operational Guidelines for the Implementation of the World Heritage Convention; UNESCO: Paris, France, 2015. [Google Scholar]
  40. Ha, S.; Yang, Z. Evaluation for landscape aesthetic value of the Natural World Heritage Site. Environ. Monit. Assess. 2019, 191, 483. [Google Scholar] [CrossRef]
  41. Li, X.; Wu, B.; Wang, H.; Zhang, J. Regional soil erosion risk assessment in Hai Basin. Natl. Remote Sens. Bull. 2011, 15, 372–387. (In Chinese) [Google Scholar]
  42. Tang, G.; Song, J. Comparison of slope classification methods in slope mapping from DEMs. J. Soil Water Conserv. 2006, 20, 157–160. (In Chinese) [Google Scholar] [CrossRef]
  43. Li, Q.; Zhang, Z.; Wan, L.; Yang, C.; Zhang, J.; Ye, C.; Chen, Y. Landscape pattern optimization in Ningjiang River Basin based on landscape ecological risk assessment. Acta Geogr. Sin. 2019, 74, 1420–1437. (In Chinese) [Google Scholar] [CrossRef]
  44. Wu, J.; Shen, W.; Sun, W.; Tueller, P.T. Empirical patterns of the effects of changing scale on landscape metrics. Landsc. Ecol. 2002, 17, 761–782. [Google Scholar] [CrossRef]
  45. Li, M. The Method of Vegetation Fraction Estimation by Remote Sensing. Master’s Thesis, Institute of Remote Sensing Applications, Chinese Academy of Sciences, Beijing, China, 2003. [Google Scholar]
  46. Rahman, M.; Shi, Z.; Cai, C.; Zhu, D. Assessing soil erosion hazard-a raster based GIS approach with spatial principal component analysis (SPCA). Earth Sci. Inform. 2015, 8, 853–865. [Google Scholar] [CrossRef]
  47. Hotelling, H. Analysis of a complex of statistical variables into principal components. J. Educ. Psychol. 1933, 24, 417. [Google Scholar] [CrossRef]
  48. Zou, T.; Yoshino, K. Environmental vulnerability evaluation using a spatial principal components approach in the Daxing’anling region, China. Ecol. Indic. 2017, 78, 405–415. [Google Scholar] [CrossRef]
  49. Pan, J.; Liu, X. Assessment of landscape ecological security and optimization of landscape pattern based on spatial principal component analysis and resistance model in arid inland area: A case study of Ganzhou District, Zhangye City, Northwest China. Chin. J. Appl. Ecol. 2015, 26, 3126–3136. (In Chinese) [Google Scholar] [CrossRef]
  50. Chen, C.; Meurk, C.D.; Ignatieva, M.; Stewart, G.H.; Wu, S. Identifying and evaluating functional connectivity for building urban ecological networks. Acta Ecol. Sin. 2015, 35, 18–35. (In Chinese) [Google Scholar] [CrossRef] [Green Version]
  51. Chen, L.; Fu, B.; Zhao, W. Source-sink landscape theory and its ecological significance. Front. Biol. China 2008, 3, 131–136. [Google Scholar] [CrossRef]
  52. Pascual-Hortal, L.; Saura, S. Comparison and development of new graph-based landscape connectivity indices: Towards the priorization of habitat patches and corridors for conservation. Landsc. Ecol. 2006, 21, 959–967. [Google Scholar] [CrossRef]
  53. Saura, S.; Pascual-Hortal, L. A new habitat availability index to integrate connectivity in landscape conservation planning: Comparison with existing indices and application to a case study. Landsc. Urban Plan. 2007, 83, 91–103. [Google Scholar] [CrossRef]
  54. Saura, S.; Torné, J. Conefor Sensinode 2.2: A software package for quantifying the importance of habitat patches for landscape connectivity. Environ. Modell. Softw. 2009, 24, 135–139. [Google Scholar] [CrossRef]
  55. Baranyi, G.; Saura, S.; Podani, J.; Jordán, F. Contribution of habitat patches to network connectivity: Redundancy and uniqueness of topological indices. Ecol. Indic. 2011, 11, 1301–1310. [Google Scholar] [CrossRef]
  56. Rubio, L.; Saura, S. Assessing the importance of individual habitat patches as irreplaceable connecting elements: An analysis of simulated and real landscape data. Ecol. Complex. 2012, 11, 28–37. [Google Scholar] [CrossRef]
  57. Graves, T.; Chandler, R.B.; Royle, J.A.; Beier, P.; Kendall, K.C. Estimating landscape resistance to dispersal. Landsc. Ecol. 2014, 29, 1201–1211. [Google Scholar] [CrossRef]
  58. Li, F.; Ye, Y.; Song, B.; Wang, R. Evaluation of urban suitable ecological land based on the minimum cumulative resistance model: A case study from Changzhou, China. Ecol. Indic. 2015, 318, 194–203. [Google Scholar] [CrossRef]
  59. Kline, J.D.; Moses, A.; Alig, R.J. Integrating Urbanization into Landscape-level Ecological Assessments. Ecosystems 2001, 4, 3–18. [Google Scholar] [CrossRef]
  60. An, Y.; Liu, S.L.; Sun, Y.X.; Shi, F.N.; Beazley, R. Construction and optimization of an ecological network based on morphological spatial pattern analysis and circuit theory. Landsc. Ecol. 2021, 36, 2059–2076. [Google Scholar] [CrossRef]
  61. Bunn, A.G.; Urban, D.L.; Keitt, T.H. Landscape connectivity: A conservation application of graph theory. J. Environ. Manage. 2000, 59, 265–278. [Google Scholar] [CrossRef] [Green Version]
Figure 1. Location of Bayinbuluke (source: GS(2019)1686).
Ijgi 11 00328 g001
Figure 2. Bayinbuluke Management History and World Heritage Values.
Ijgi 11 00328 g002
Figure 3. The framework of the research.
Ijgi 11 00328 g003
Figure 4. Degree of landscape ecological risk for each factor.
Ijgi 11 00328 g004
Figure 5. Spatial distribution of landscape ecological risk.
Ijgi 11 00328 g005
Figure 6. Pattern classes of the study area based on MSPA.
Ijgi 11 00328 g006
Figure 7. Distribution of ecological corridors in the study area.
Ijgi 11 00328 g007
Table 1. List of data resources.
DataData Sources
The WNH restricted and buffer boundaries of Bayinbulukethe material declaration for Xinjiang Tianshan NWH
The spatial information on the roads and communitiesA field survey (from 26 July 2021, to 31 July 2021) in Bayinbuluke
Remote sensing data of Landsat-8 OLI (resolution 30 m)Geospatial Data Cloud
(http://www.gscloud.cn, accessed on 8 July 2021)
Digital Elevation Model (DEM) (resolution 30 m)Geospatial Data Cloud
(http://www.gscloud.cn, accessed on 10 July 2021)
Table 2. The evaluation factors used to determine landscape ecological risk.
Evaluation AspectsIndicatorsIndicator GradeGrading Standard
natureSlope (°)10–8
28–15
315–25
4>25
Elevation (m)12270–2428
22429–2500
32501–2613
42614–2894
distance to the water bodies (m)10–1000
21000–2000
32000–3000
4>3000
societydistance to the roads (m)1>1500
21000–1500
3500–1000
40–500
distance to the grazing sites (m)1>1500
21000–1500
3500–1000
40–500
landscape patternShannon evenness index10.75–1
20.5–0.75
30.25–0.5
40–0.25
contagion index (%)175–100
250–75
325–50
40–25
land cover type1Swamp, wetland meadow, water, high-coverage grassland
2medium–coverage grassland
3Cropland, low–coverage grassland
4bare land, sand
fractional vegetation cover10.75–1
20.53–0.74
30.26–0.52
40–0.25
Table 3. Characteristic roots of principal components and their cumulative contribution rate.
Principal ComponentCharacteristic ValueContribution RateCumulative Contribution Rate
11.0309823.815123.8151
20.9345821.588345.4034
30.6886815.908261.3115
40.6150214.206775.5183
50.4695210.845786.364
60.259455.993292.3572
70.192244.440796.7979
80.072131.666298.4641
90.066491.5359100
Table 4. Weight of index factors for landscape ecological risk assessment.
Evaluation DimensionEvaluation IndexWeight
natureslope0.0696
elevation0.0251
distance to the water bodies0.1168
societydistance to the roads0.1981
distance to the grazing sites0.0076
landscape patternShannon evenness index0.1444
contagion index0.1335
land cover type0.1263
fractional vegetation cover0.1786
Table 5. Areas of different landscape ecological risk levels.
Ecological RiskArea (km2)Percentage of the Area (%)
low 356.65 18.82
medium 605.09 31.92
high 625.99 33.03
extremely high307.65 16.23
Table 6. Ranking of the core area based on landscape connectivity.
RankNumberdPCdIIC
11092.7186589.23183
2937.7906125.60198
369.135511.18494
476.108960.86053
515.028750.00082
623.370000.06264
7112.769660.07650
842.363981.61449
982.360991.78633
1032.141780.01074
1152.001780.02286
Table 7. Classification criteria of the landscape cumulative resistance.
Resistance GradeCumulative Resistance Value
10–5378
25379–10,757
310,758–16,135
413,136–21,514
Publisher’s Note: MDPI stays neutral with regard to jurisdictional claims in published maps and institutional affiliations.

