
Usefulness of Plane-Based Augmented Geovisualization—Case of “The Crown of Polish Mountains 3D”

Adam Mickiewicz University, Poznań, Poland, Department of Cartography and Geomatics, 61-712 Poznań, Poland
*
Author to whom correspondence should be addressed.
ISPRS Int. J. Geo-Inf. 2023, 12(2), 38; https://0-doi-org.brum.beds.ac.uk/10.3390/ijgi12020038
Submission received: 2 December 2022
/
Revised: 11 January 2023
/
Accepted: 17 January 2023
/
Published: 22 January 2023
(This article belongs to the Special Issue Cartography and Geomedia)
Abstract
:In this article, we suggest the introduction of a new method of generating AR content, which we propose to call plane-based augmented geovisualizations (PAGs). This method concerns cases in which AR geovisualizations are embedded directly on any plane detected by the AR device, as in the case of the investigated “Crown of Polish Mountains 3D” application. The study on the usefulness of the AR solution against a classic solution was conducted as part of an online survey of people from various age and social groups. The application in the monitor version showing 3D models of mountain peaks (without AR mode) was tested by the respondents themselves. The use of the application in the AR mode, which requires a smartphone with the appropriate module, was tested by the respondents based on a prepared video demonstrating its operation. The results of the research on three age groups show that the AR mode was preferred among users against all compared criteria, but some differences between age groups were clearly visible. In the case of the criterion of ease of use of the AR mode, the result was not so unambiguous, which is why further research is necessary. The research results show the potential of the AR mode in presenting 3D terrain models.
1. Introduction
Along with the development of technology and the introduction of mobile devices, such as tablets or smartphones, to the market, new opportunities to use maps and the derivatives of cartographic visualizations that apply the third dimension to present spatial data have arisen [1,2,3]. New map products have been emerging as a result of technological advances. Digital geospatial representation has been evolving in three areas: three-dimensional (3D) spaces, real-time dynamics, and fusion of virtual and real objects [4,5]. Augmented reality (AR) has similar characteristics. The concept of AR was first introduced by scientists working for Boeing Company in the early 1990s to assist in mechanical assembly [6]. The important step in laying the theoretical foundation for the augmented reality system was to create a reality–virtuality continuum [7] in which AR could find its place. This paved the way for a further process of defining three fundamental features of AR by Azuma [8]: combining real and virtual, interaction in real time, and registered in 3D.
From a geographical point of view, visualizations that use AR can be divided into: augmented virtual environments (AVEs) or as augmented geographic reality (AGR) [9]. According to Cheng et al. [9] (p. 427), AGR should be divided, based on field experiences and maps, into augmented reality environments (AREs) and augmented maps (AMs), respectively. In AREs, visual information (e.g., digital tags) is added to objects in the real world to perform functions, such as navigation and illustration. AMs are maps on which multiple types of geographic information (e.g., models and multimedia files) are superimposed to enhance cartographic information transfer and users’ spatial cognitive ability. AMs are a subgroup of cartographic products that use the marker-based tracking method [10].
The campus tour system prototype by Feiner et al. [11] is referred to as the earliest prototype of the ARE. The opportunities offered by ARE were also examined in the context of using classic visual variables [12] and those that were gradually appearing as a result of technological advance related to digital cartography [13] for designing signatures that demonstrate the distance of the topographic object from the observer [14]. Another example of an ARE is provided by the research of Fukuda et al. [15], who demonstrated a solution that uses handheld augmented reality systems for urban landscape simulation. Kourouthanassis et al. [16] presented the use of mobile AR on the smartphone, testing a travel guide named CorfuAR.
In 2002, Bobrich and Otto [17], for the first time, developed AMs that integrated paper maps and virtual geographic information. In this system, the map becomes the reference frame of multiuser interaction, and cards with a quick response (QR) code become the identification anchor points of virtual interaction tools. When listing examples of the opportunities that augmented maps (AMs) bring, one also needs to mention the research by Morrison et al. [18], in which the employment of AR technology in combination with traditional paper maps was compared. De Almeida Pereira et al. [19] noted that adding 3D AR representation at the top of a paper map can enhance users’ abilities to perform spatial positioning and to read map data.
Two aforementioned methods of generating AR content (ARE and AM) fail to consider cases in which AR geovisualizations are located on a freely chosen plane detected by the AR device. It was possible to single out the new method of generating AR content thanks to the progress in the evolution of algorithms of detecting planes in the real world. For this reason, we suggested introducing the third group of geovisualizations, known as plane-based augmented geovisualization (PAG), to the classification system. In such solutions, geovisualization is mounted on a freely selected plane identified by the mobile device. It releases the user from the necessity of handling a physical object (e.g., a map) that displays virtual content on its screen. PAGs are a subgroup of cartographic products that use the feature-based tracking method [10].
Until recently, AR solutions have been created and shared mainly as applications uploaded from dedicated stores and installed directly in the memory of the smartphone. Advances in technology have allowed one to establish a set of webXR standards that use the opportunities of web browsers of mobile devices. WebXR is a group of standards that are used together to support rendering 3D scenes to hardware designed for presenting virtual worlds (virtual reality, VR) or for adding graphical imagery to the real world (augmented reality, AR) on the Web (https://developer.mozilla.org/en-US/docs/Web/API/WebXR_Device_API accessed on 18 November 2022) [20].
Numerous currently available models of smartphones are equipped to handle webXR, which allows one to assume that in the near future the number of users of such solutions is going to grow. It is also the reason why such applications should be developed in cartography as well. Nevertheless, similar assumptions should be supported by the research.
In the literature, one may encounter different solutions used for cartographic visualizations, starting with static 2D ones, surface three-dimensional, and ending with interactive ones [21]. The examples of publications that present land relief with the use of 3D and AR are as follows: studies by Siqueira [22] that apply this technology to teaching topographic surfaces; papers by Templin et al. [23] in which it is used as a supporting tool in “inland and coastal water zones” navigation; works by Brejcha et al. [24] that create augmented photographs resulting from the combination of DEM and a photo taken in the field. The research on moving around the virtual world by walking and teleportation is also known [25].
The usefulness of 3D geovisualization in the AR technology displayed with the use of the PAG method was the topic discussed in this research. In the research, the usefulness was defined by examining the preferred by users’ way in which the landscape and topographic traits were explored for the collection of mountain peaks, visualized in AR and using the PAG method, and without the AR mode, within one “Korona Gór Polski 3D” (The Crown of Polish Mountains 3D) application. The application tested included a 3D representation of the collection of mountain peaks, the so-called crown of mountains, i.e., the highest mountain tops in a given country, whose review and exploration is possible through the Web browser, on the smartphone (in AR), or, more conventionally, on the PC (without AR technology). The subjective feelings and impressions that application users had during the process of using both modes (AR/no AR) may decide upon what solution will be chosen more willingly; thus, we decided to test how respondents evaluated those two opportunities.
2. Aim and Questions
The main objective of the research was to determine the preferences of users from different age groups related to the opportunity to watch a 3D model of the Tarnica mountain peak onscreen in the AR mode (using the PAG method) and without AR. To meet this objective, researchers prepared an online survey, which allowed them to test the application, based on a set of objective and subjective questions, and ask users’ opinion concerning it.
An online survey is a method of testing used on application users that offers the opportunity to reach the largest group of respondents of different ages and from different backgrounds. The survey proves to be a useful tool for obtaining opinions concerning the tested cartographic products regardless of whether researchers need the opinions of experts or amateurs [26,27]. Based on the appropriate structure of surveys, one may obtain answers from users related to their subjective evaluation of cartographic visualizations and objective effectiveness determined on the basis of the tasks completed [28]. In this research, we focused on subjective feelings that matter significantly because, for the large part, they determine whether or not a specific cartographic product meets with interest and is going to be willingly used. To make it more precise, the objective of this research raised the following questions:
- −
- How do users evaluate applications with a 3D geovisualization displayed in AR and without AR? Which mode functions better in the specific comparative criteria (convenience and simplicity of operating the 3D model; effectiveness related to the opportunity to scrutinize the 3D model more thoroughly; attractiveness of the 3D model’s exploration; opportunity to assess differences in relative terrain elevation differences, based on the 3D model)?
- −
- Is there any correlation between the age of respondents and the way they perceive both available, comparable solutions (i.e., modes with AR and without AR)? can any principle be observed in this context?
3. Materials and Methods
To meet the objective and answer the above questions, we adopted six main research stages:
- −
- To create and make publicly available the tested application (https://kgp3d.amu.edu.pl accessed on 29 November 2022) (Section 3.1);
- −
- To schedule simple tasks for users to familiarize themselves with the application in the screen mode (i.e., without AR) (Section 3.2);
- −
- To produce a demonstration video (movie) showing the use of the tested application on a smartphone in the AR mode (Section 3.2);
- −
- To prepare an internet questionnaire and carry out surveys among the users (Section 3.2);
- −
- To choose age groups for the result analysis (Section 3.3);
- −
- To present a statistical analysis of the results (Section 4).
3.1. The “Korona Gór Polski 3D” Application
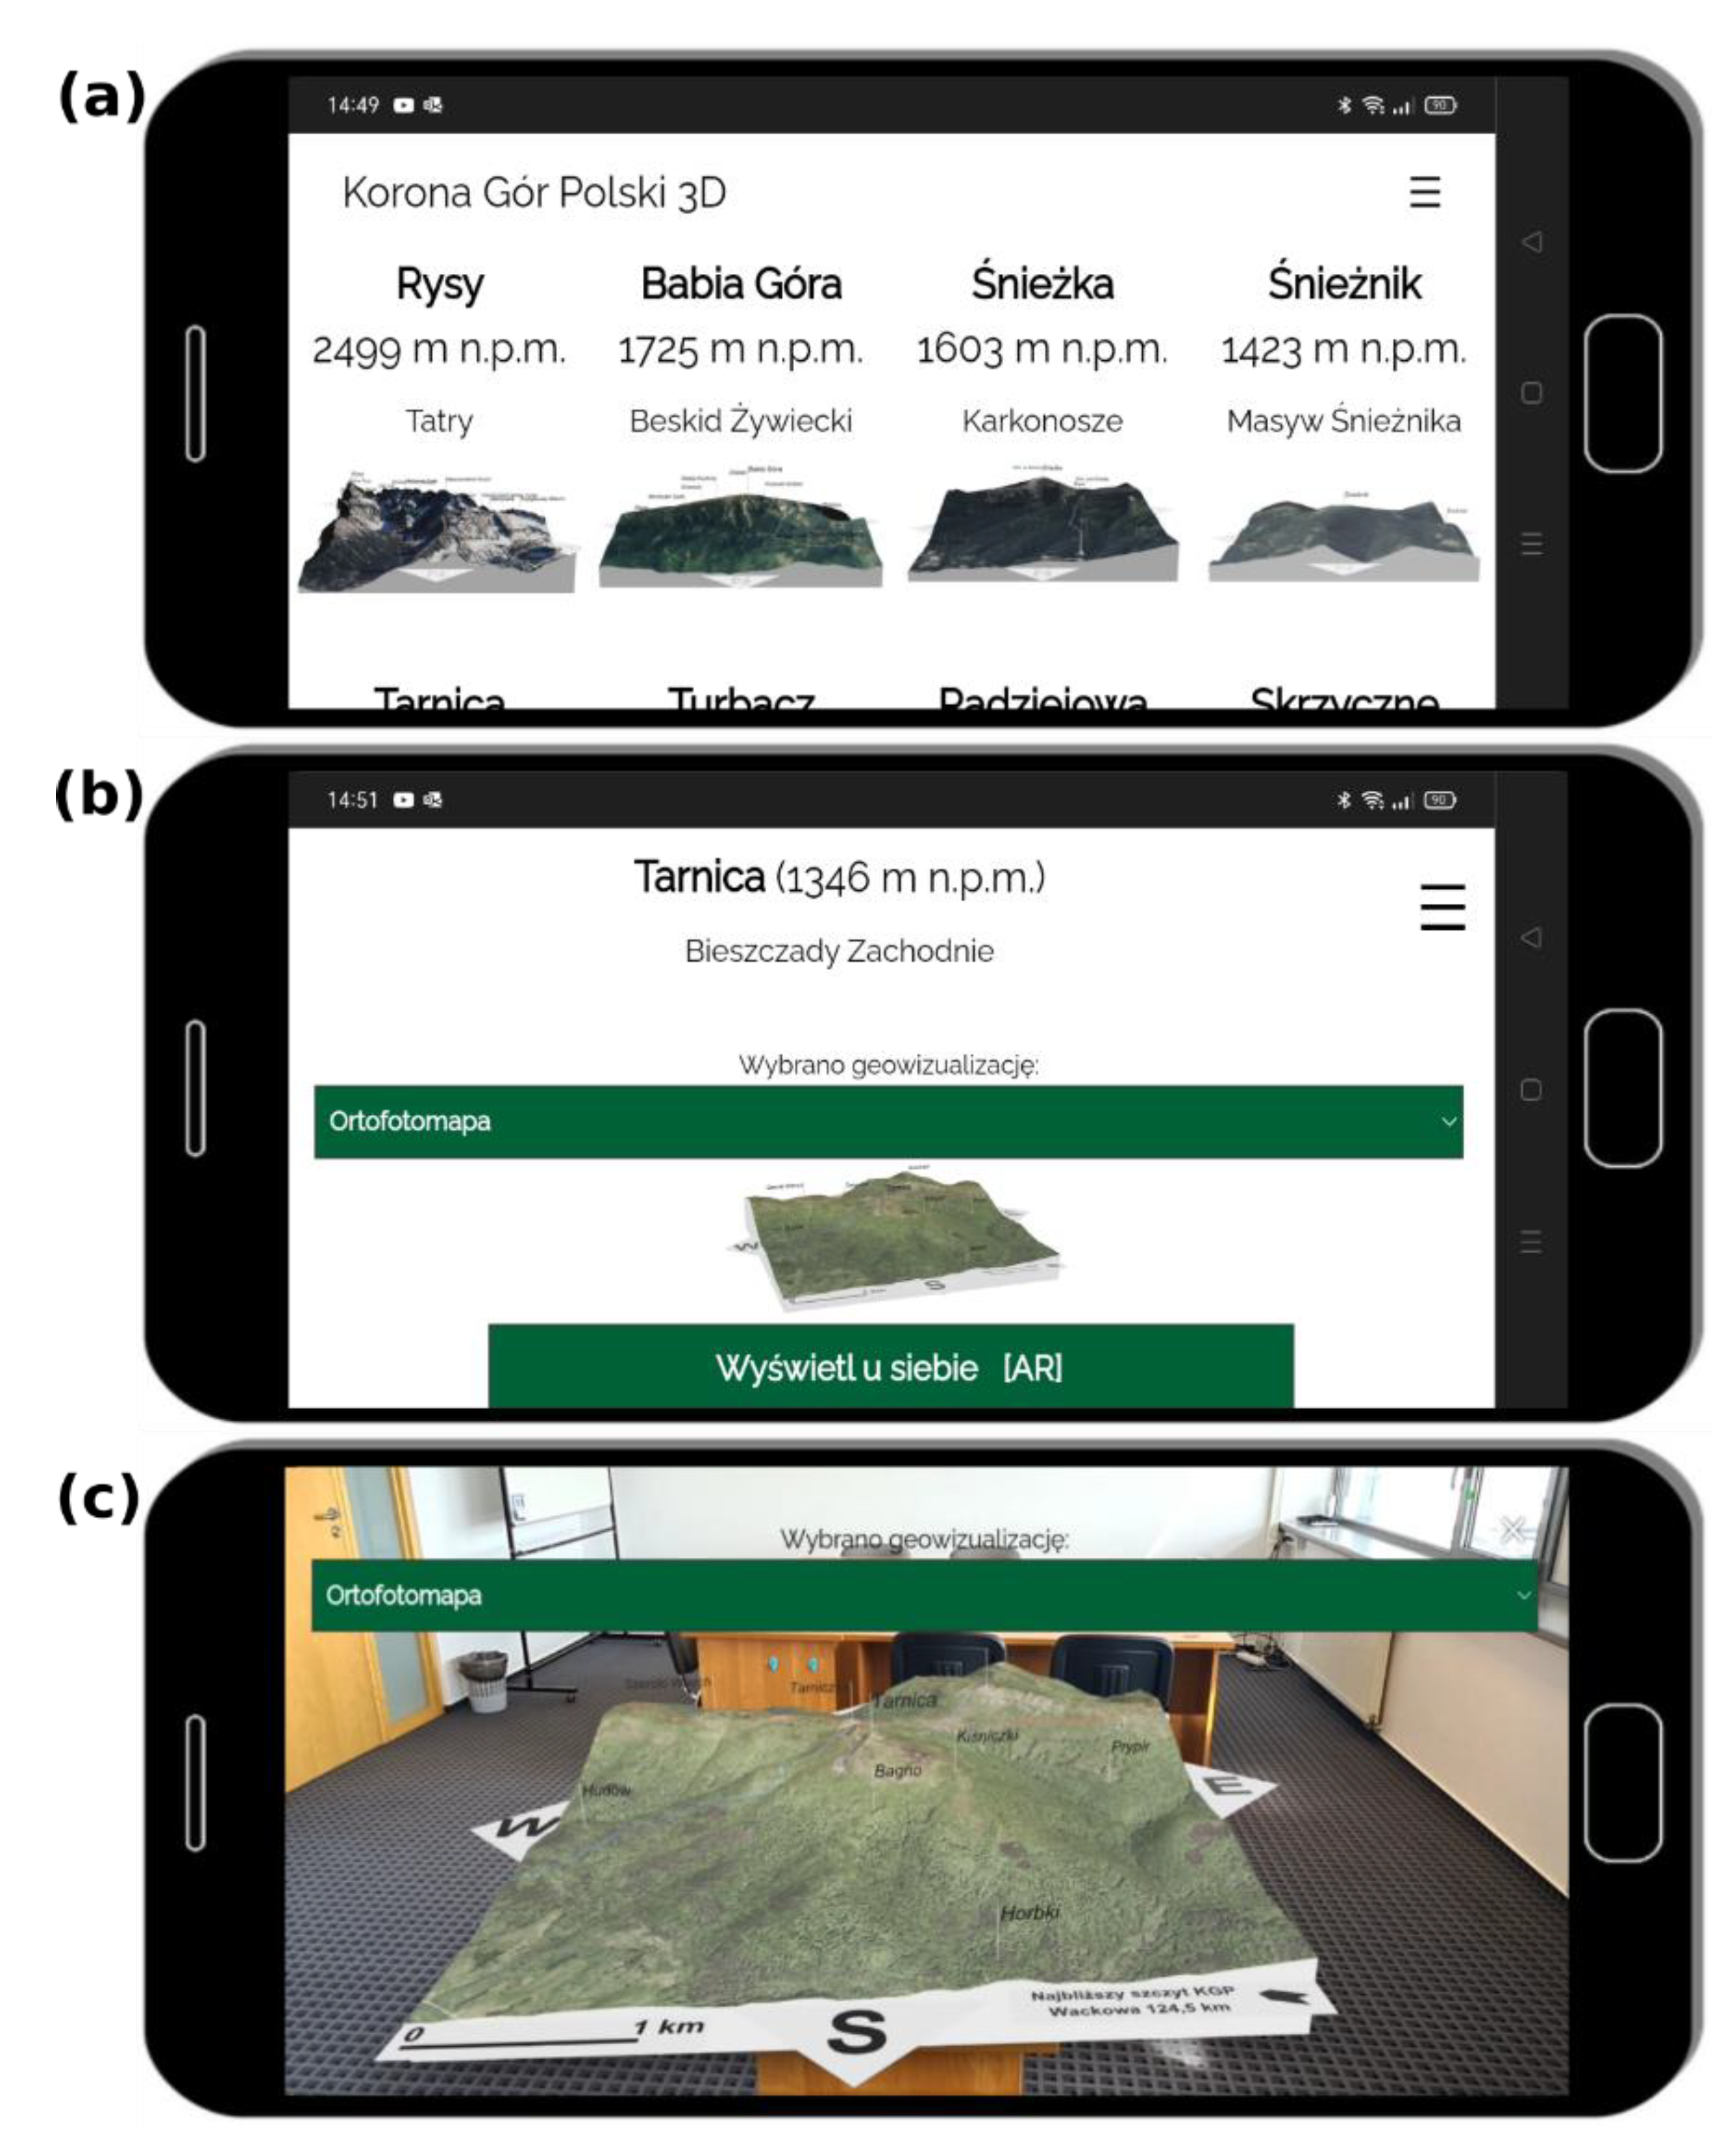
The “Korona Gór Polski 3D” (The Crown of the Polish Mountains 3D) application is an original application developed by the authors. The application uses webXR standards that make it work directly in the web browser, without the necessity of installing files. It is available to anybody, free of charge, at the following link: https://kgp3d.amu.edu.pl (accessed on 29 November 2022) The purpose of the application is to demonstrate 28 3D models of mountain peaks on the territory of Poland, located in different mountain ranges referred to as “Korona Gór Polski” [29,30]. The application may be used on a PC or smartphone screen. Figure 1 presents an example of the view in the application on the screen of the mobile device. Figure 1a shows the application’s welcome screen, with the option to select a 3D model of the mountain peak, 1b demonstrates a given peak with the option to display it in the AR mode and 1c presents the same peak in the AR mode.
Technologically, the application is based on the model-viewer library (https://modelviewer.dev accessed on 27 November 2022) [31]. It offers the opportunity to view 3D models of specific mountain peaks, both on a monitor and smartphone screen, in the classic mode or in AR, provided that the device is equipped with the ARCore module. The application has the same functions both on PCs and mobile devices, but the there are differences in how the 3D model is navigated on the mobile device with a touch screen vs. on the PC. Those differences are presented in Table 1.
The first difference is related to the size of the screen on which the 3D model is presented. For PC monitors, the difference is much greater than for smartphones. Only some monitors are equipped with a touch screen (i.e., interactive monitor) function, which is actually the fundamental feature of smartphones [32]. To change the scale of the 3D model on the classic monitor, one needs to use the scroll mouse and on the smartphone a two-finger move (changing the distance between them increases or decreases the scale). In the application displayed on the PC monitor, the rotation of the 3D model in the application used on the smartphone, in the no AR mode, is related to the scrolling move of the finger on the screen, whereas in the AR mode, the rotation is possible with the use of two fingers and making a circular movement with them.
When it comes to the opportunity to change the location of the 3D model in relation to the observer, the model remains in the center of the monitor for the whole time by default. As far as the smartphone (without AR) is concerned, a quick double tap on the screen moves the model. In the AR mode, the user may move the 3D model freely, moving the finger on the touchscreen to a freely selected part of the screen. When the application is used on a PC monitor, the location of the model remains fixed in relation to the observer like on the smartphone without the AR mode. The AR mode is related to two types of the observer–3D model relation. The first one assumes a fixed location of the operator in relation to the model. It is actually a situation, in which, initially, users find a plane on which they want to display the model, rotating and scaling it to adjust it to the plane appropriately. The second type of the observer–3D model in the AR mode relation is directly related to viewing the 3D model in that mode after it is mounted on the selected plane.
The application’s modes of use differ in the ways the model may be explored. In the monitor mode, the observer may watch the model from a distance like on the smartphone without AR. However, when the AR mode is on, the observer has an opportunity to enter the model, i.e., by making a large close-up or by stepping onto the plane the model is mounted on if the model is on the floor.
3.2. The Subject of the Study and the Online Survey
The 3D application, presented in Section 3.1, works on mobile devices in the AR mode or without the AR mode (compare with Table 1). However, to be able to collect unified data, independent of the parameters of the mobile device, we decided that respondents would study the following material: the application that was displayed on the PC screen without AR and the demonstrational video on using the application on the smartphone in the AR mode. This approach allowed us to carry out the study on a bigger group of respondents. Regardless of the technical abilities of the mobile device that the respondents had, it was how they could see how to use the application with the AR technology with the PAG method applied. The preferences of the users who selected either the AR mode or no AR mode while answering questions, according to the traits that were included in the comparative criteria, constituted the object of research. In order to collect all of the data, an internet survey was designed.
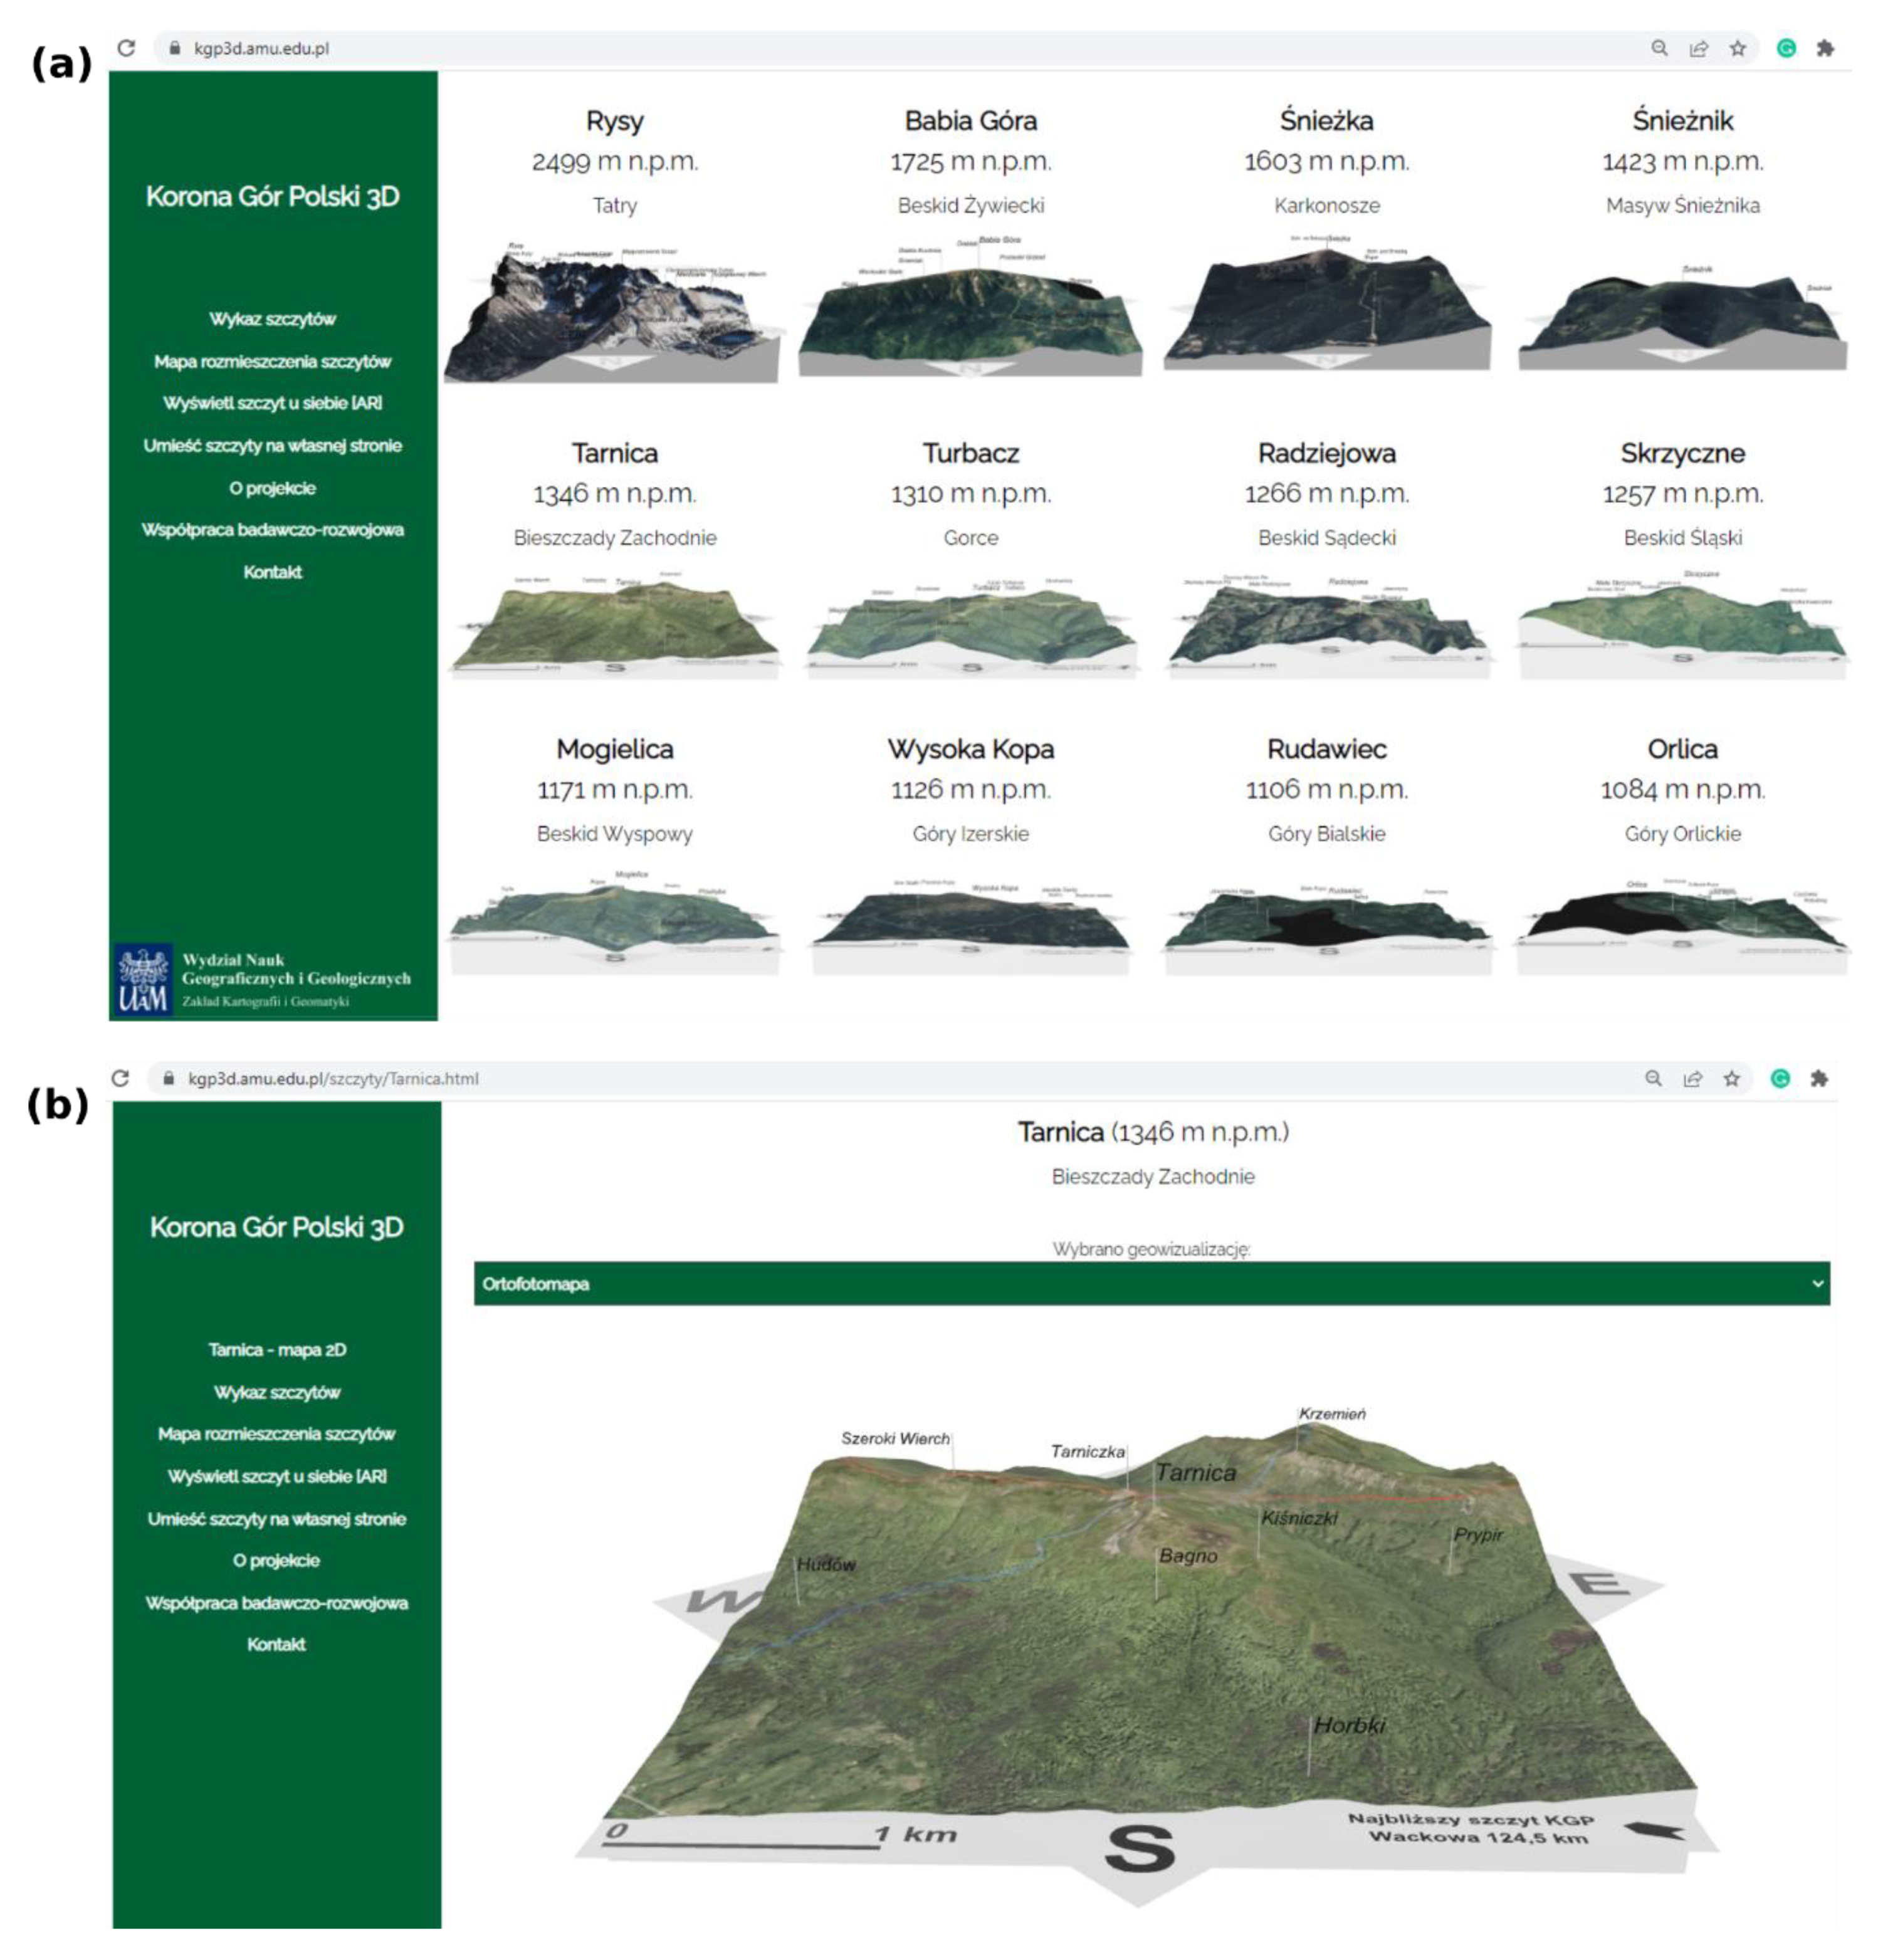
The research survey was constructed in Limesurvey (internet survey tool) and consisted of four metric questions and two task sections with 6 subjective questions, based on the Likert scale [33]. Firstly, the data regarding respondents were collected (sex and age). In addition, respondents were asked about the AR term and previous experience related to the application that used that technology. The interaction between the user and the 3D model of the mountain peak Tarnica without AR (Figure 2b) was the next step. This was the rotation of the peak, closing it up and switching on and off the layer that showed the area visible from the peak. This was supposed to familiarize users with the way the application (and some selected elements of its functioning) is handled.
Figure 2a depicts the welcome screen of the application displayed on the monitor in the web browser in which respondents had to select a mountain peak from the list. Figure 2b presents a view of the selected 3D model.
Then, the respondents were asked to watch a video that showed how to use the application in the AR mode (Figure 3). Due to the registration of the real image and of the image displayed on the smartphone screen, functioning in the AR technology, each respondent had an opportunity to see what operating the 3D model looked like and what opportunities to view/operate it in that mode were available (https://youtu.be/E_t8ZU2OtMY accessed on 29 November 2022). To demonstrate how the AR mode worked, a Samsung Galaxy S20 smartphone was used.
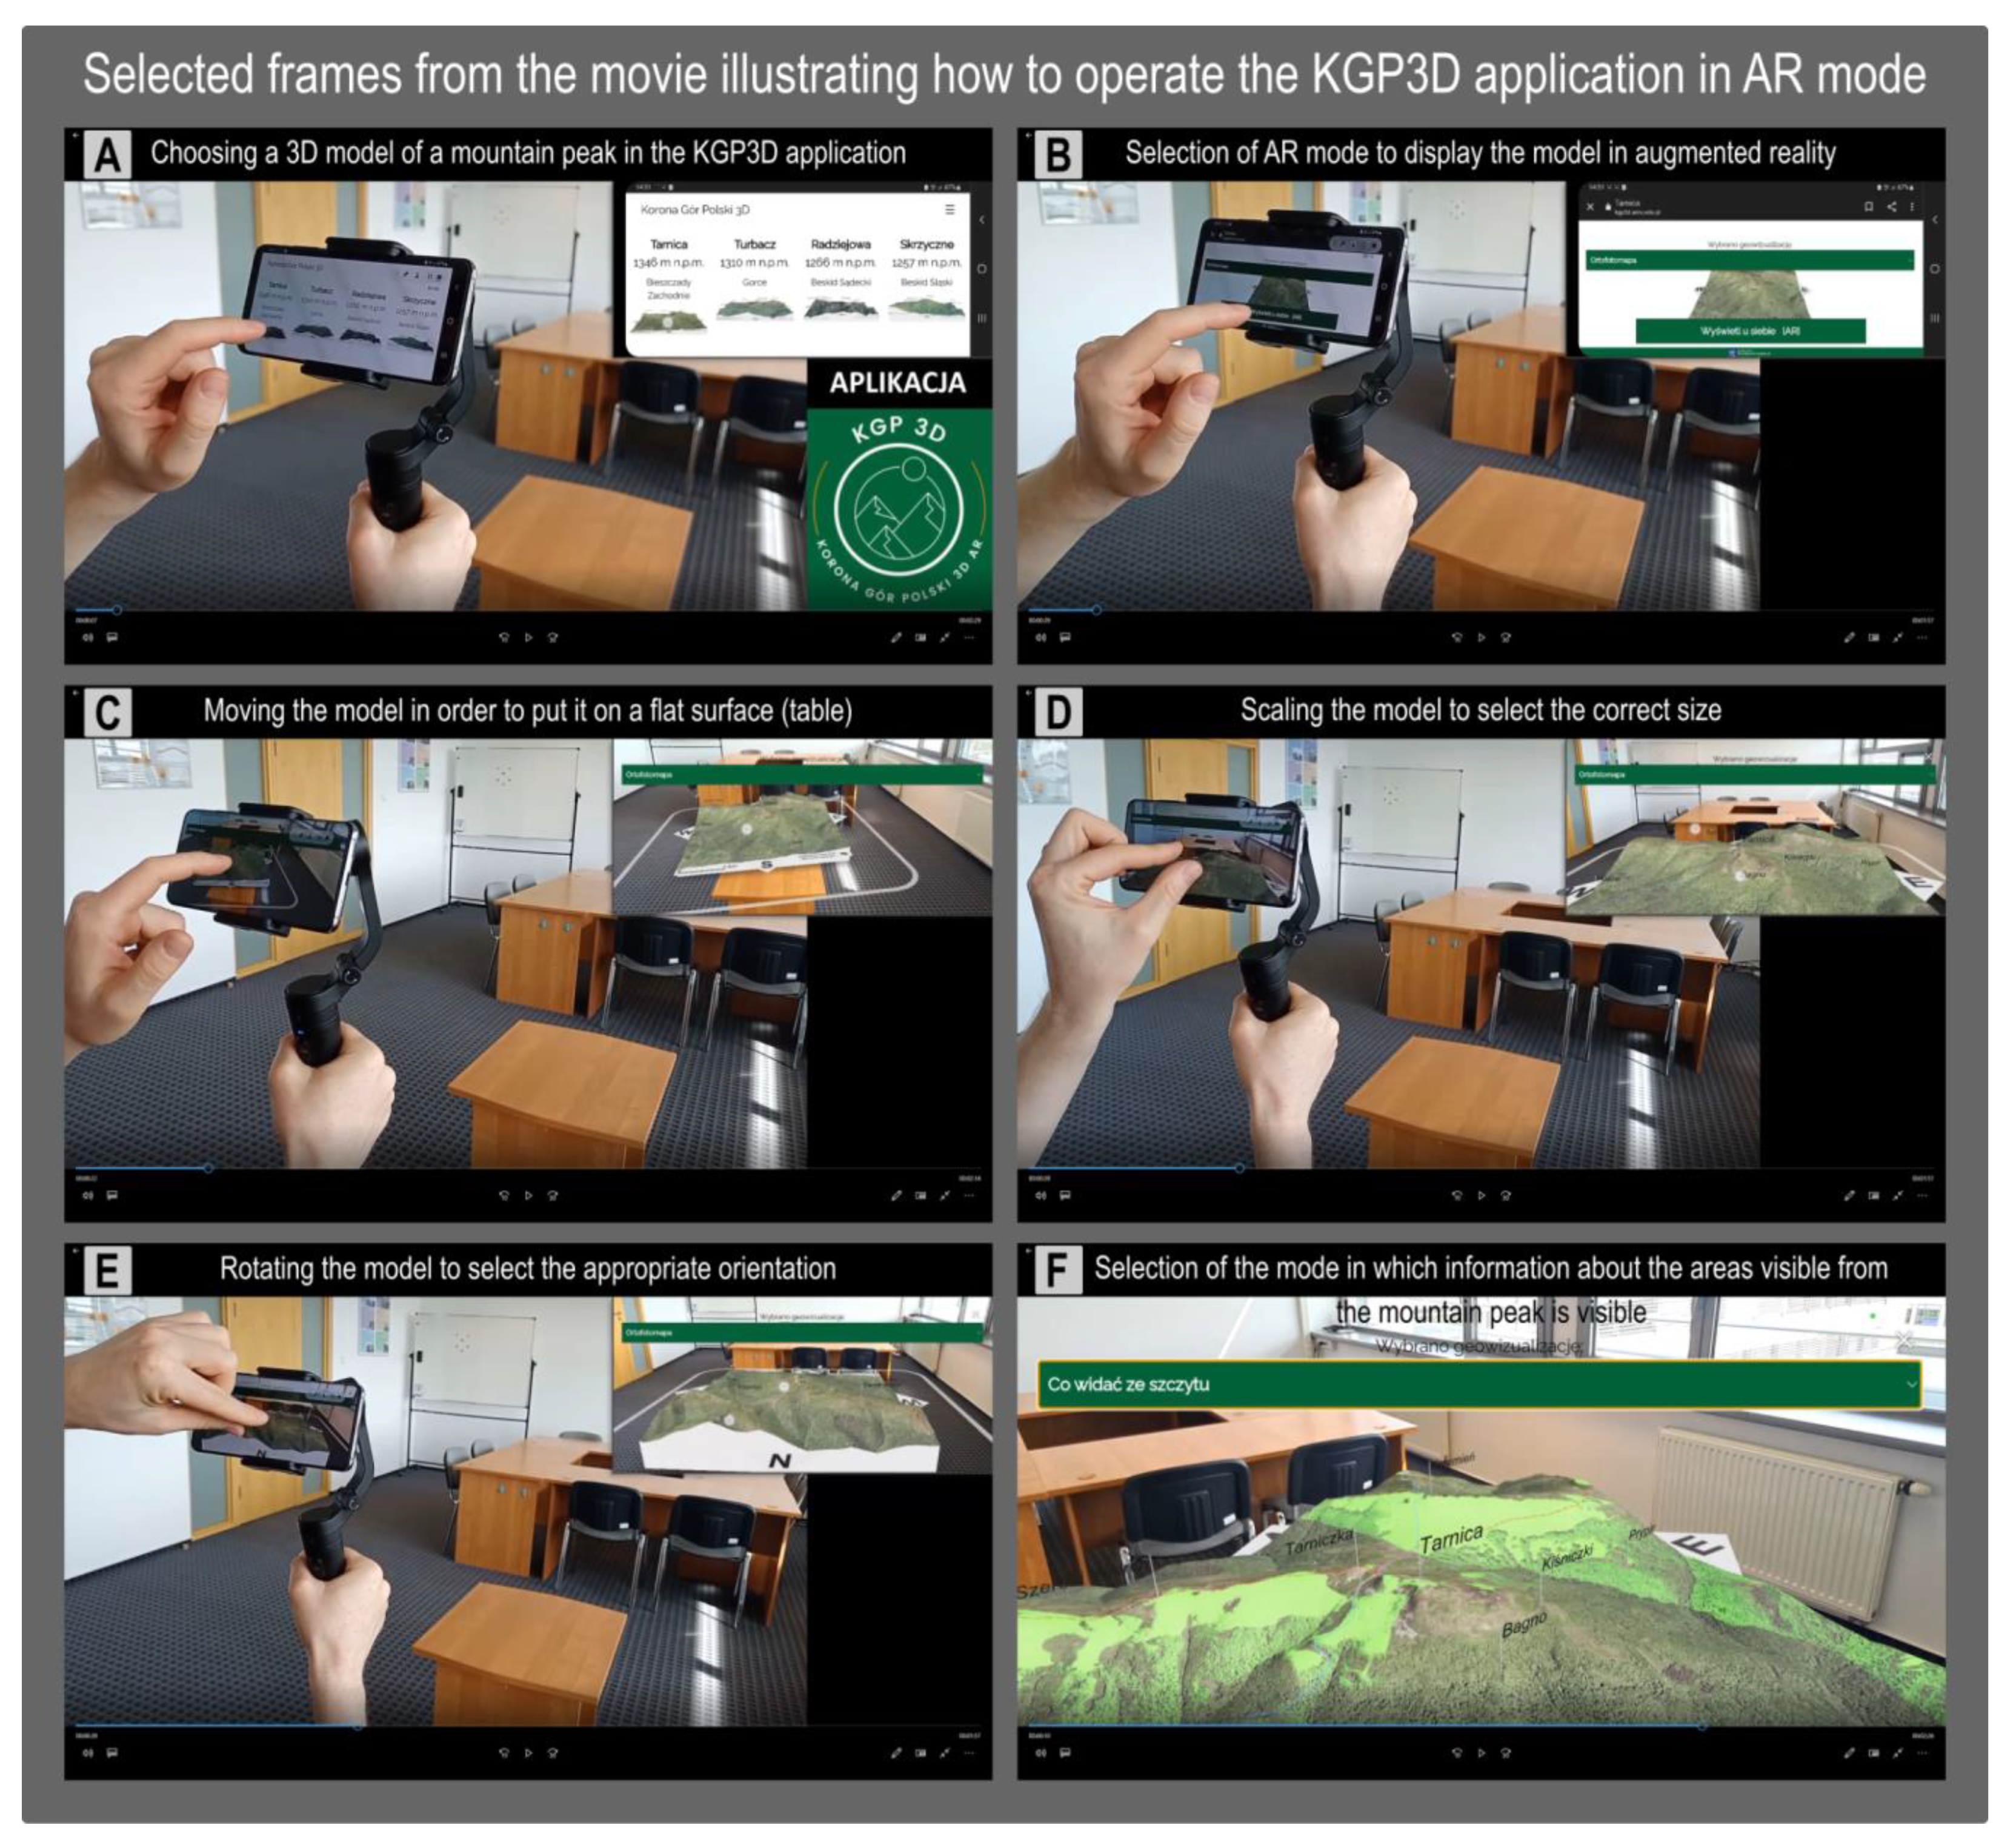
In the video, which was the main part of the test survey (Figure 3), the view of the real image, along with the view of the 3D model laid on the real-world view and visible on the smartphone screen, was registered. It was also possible to see the activities performed by the operator. Selected frames of the video are presented in the Figure 3.
In the first shot from the video (A), one can see the moment of the selection of the Tarnica mountain peak (1346 m above sea level). Shot B presents the moment of starting the AR mode in which the mountain peak is going to be displayed. Shot C shows the operator moving the 3D model to place it in the appropriate position on a flat surface. In shot D, one can see how the operator is scaling the model to adjust its size to the one required. Shot E demonstrates that the operator is rotating the model around its own axis. In shot F, one can clearly see that the operator has moved; the model is located in a fixed place that was presented previously, but the operator is looking at the model from a different side of the table, from a different angle and distance. The shot also demonstrates the area visible from the mountain peak (in green) that can be entered by the option “Co widać ze szczytu?” (What can you see from the mountain top?). In the top right corner of the frames (A–E), from the video one can see the same image that is visible on the smartphone screen. The short video was necessary to make it easier for the respondents to compare both modes available in the application and to help them decide which one (i.e., AR/no and AR) fits a given criterion better (in their opinion).
After watching the video, each respondent would receive six questions concerning their preferences related to the modes of the application compared, i.e., no AR mode (Figure 2b) and AR mode (Figure 3), and suggestions on which one was:
- ○
- More convenient and with a simpler manner of operating the 3D model (F1);
- ○
- More effective (the opportunity to scrutinize a fragment of the 3D model more thoroughly) (F2);
- ○
- More realistic in terms of the visual reception of the 3D model (F3);
- ○
- More natural when it comes to the manner of viewing the 3D model (F4);
- ○
- More interesting and attractive way of exploring the 3D model (F5);
- ○
- Better as far as observing and assessing relative differences in the altitude of the land that was concerned (F6).
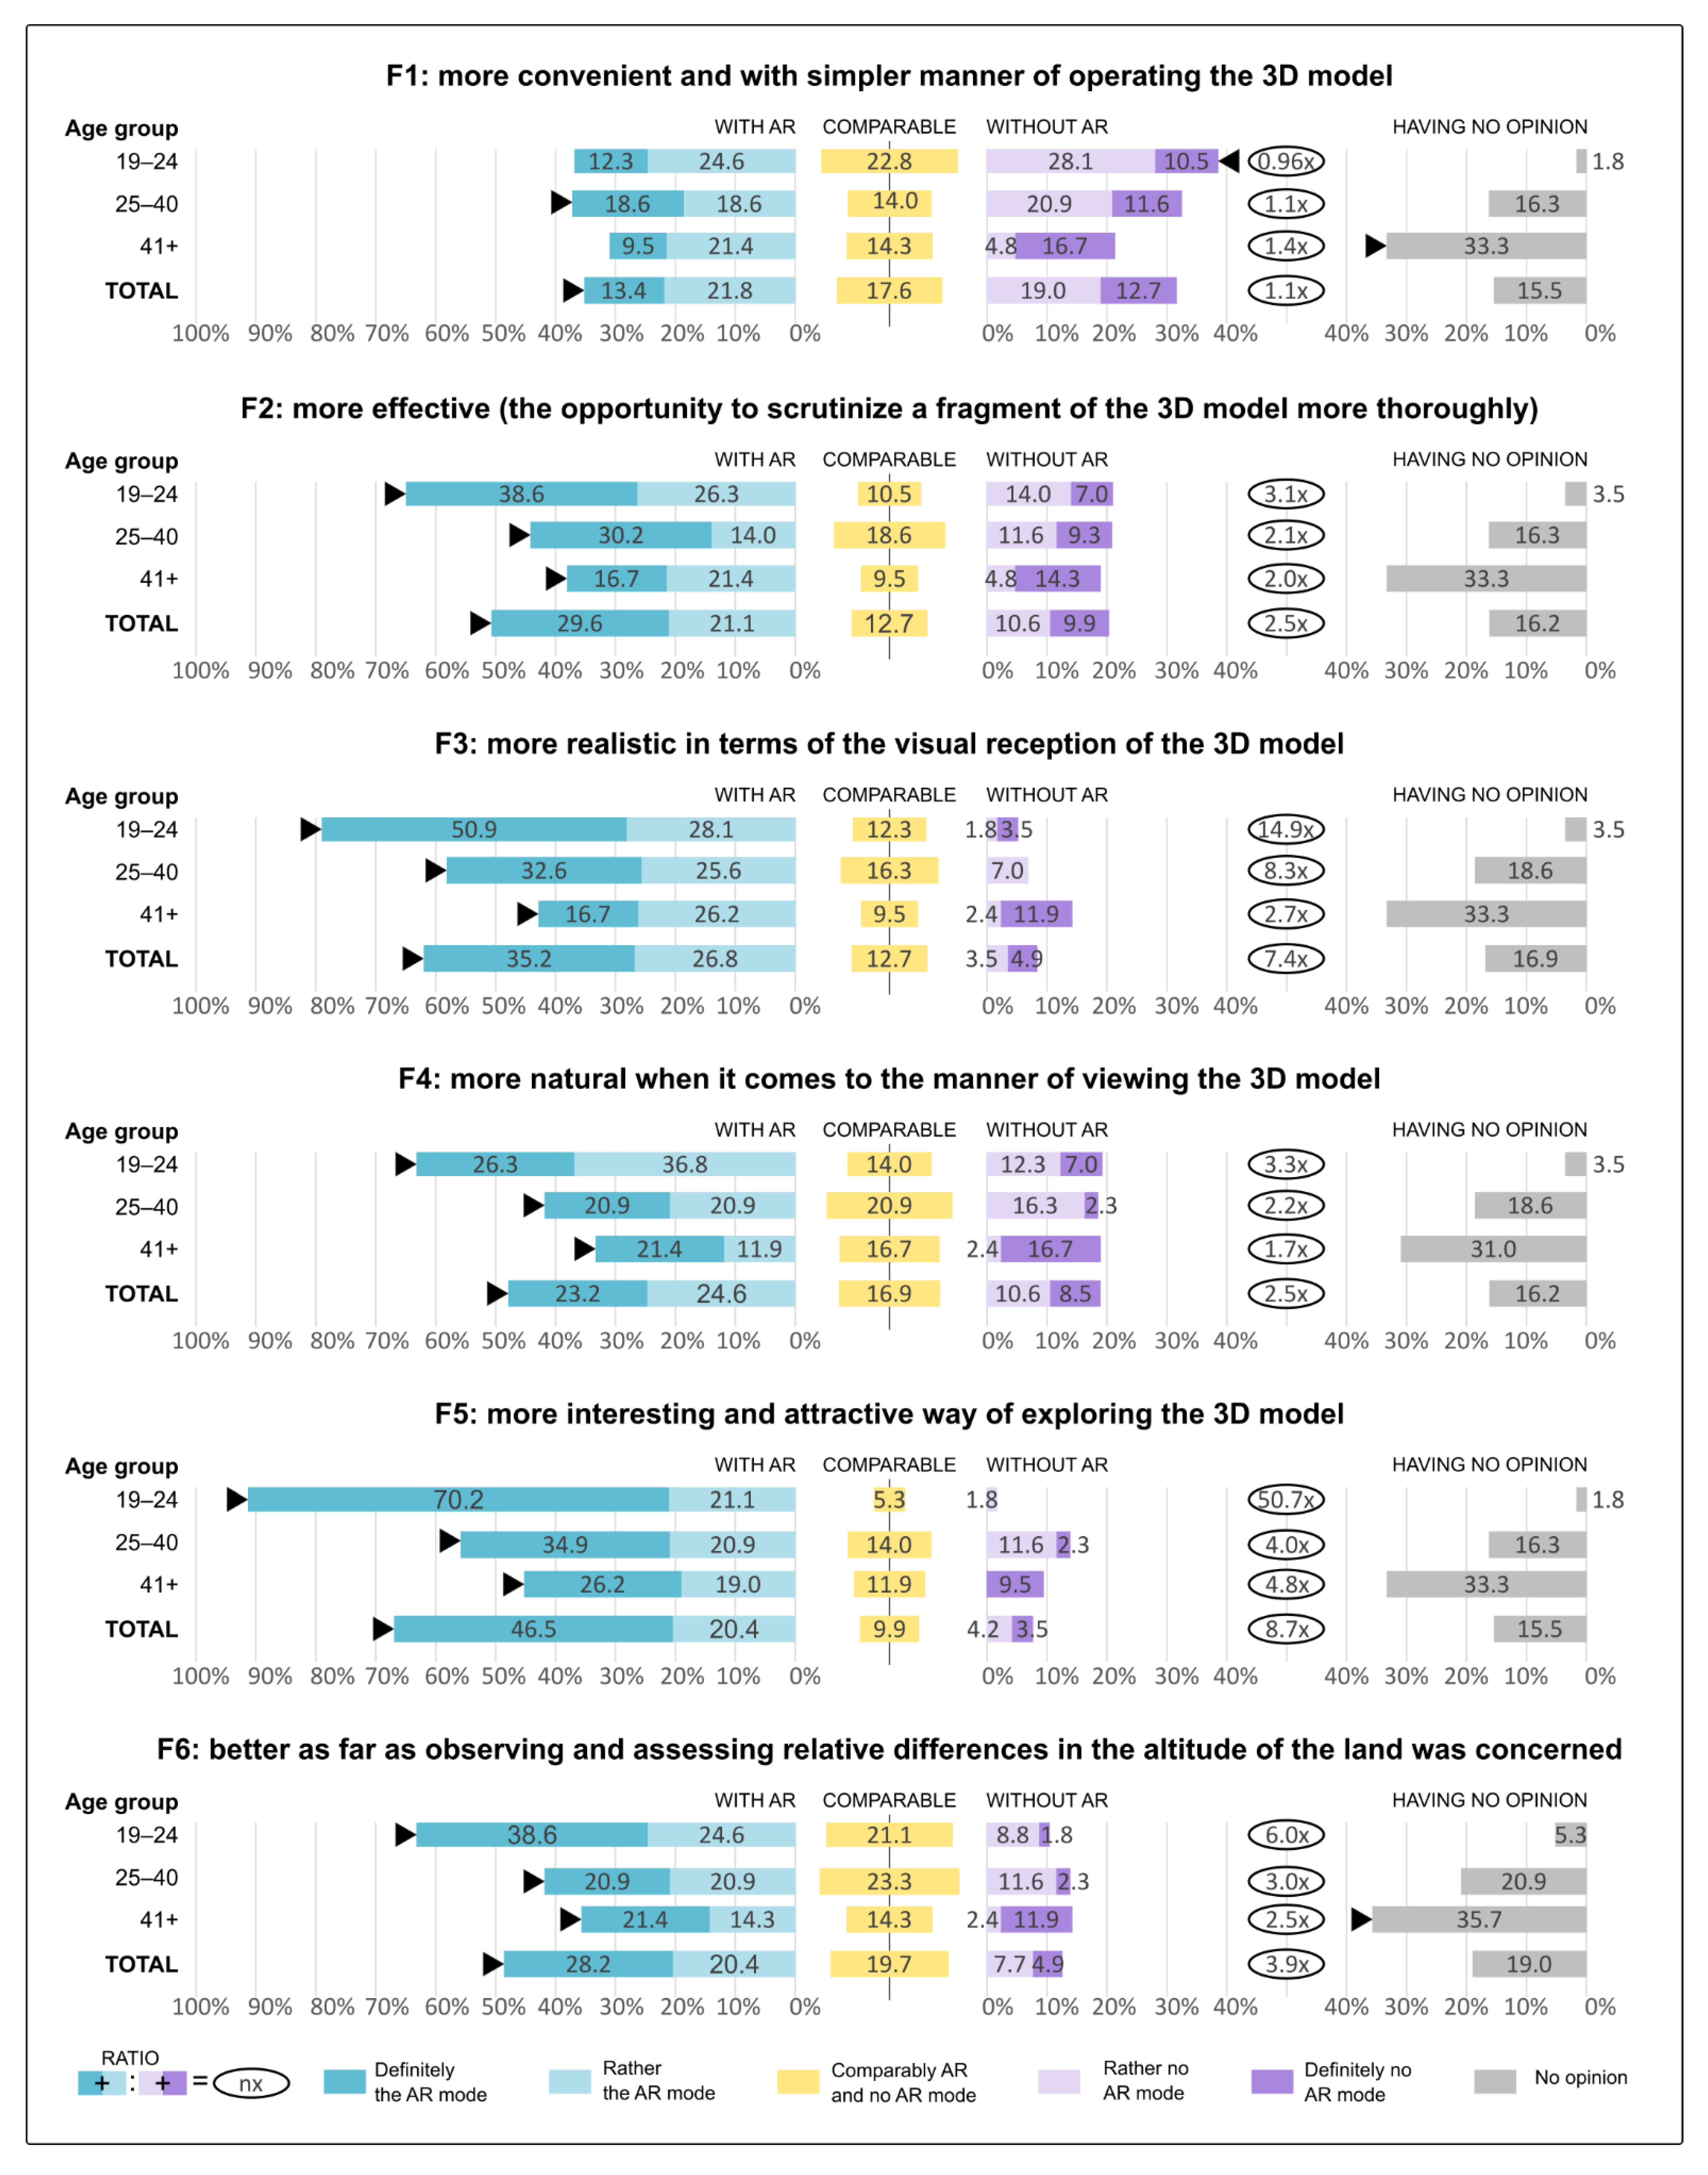
In the brackets above, the researchers provided the number of the subsection according to consecutive factors (compare with Figure 4). Respondents had the following qualitative answers: Definitely the AR mode; Rather the AR mode; Comparably AR and no AR mode; Rather no AR mode; Definitely no AR mode; and No opinion.
3.3. Participants
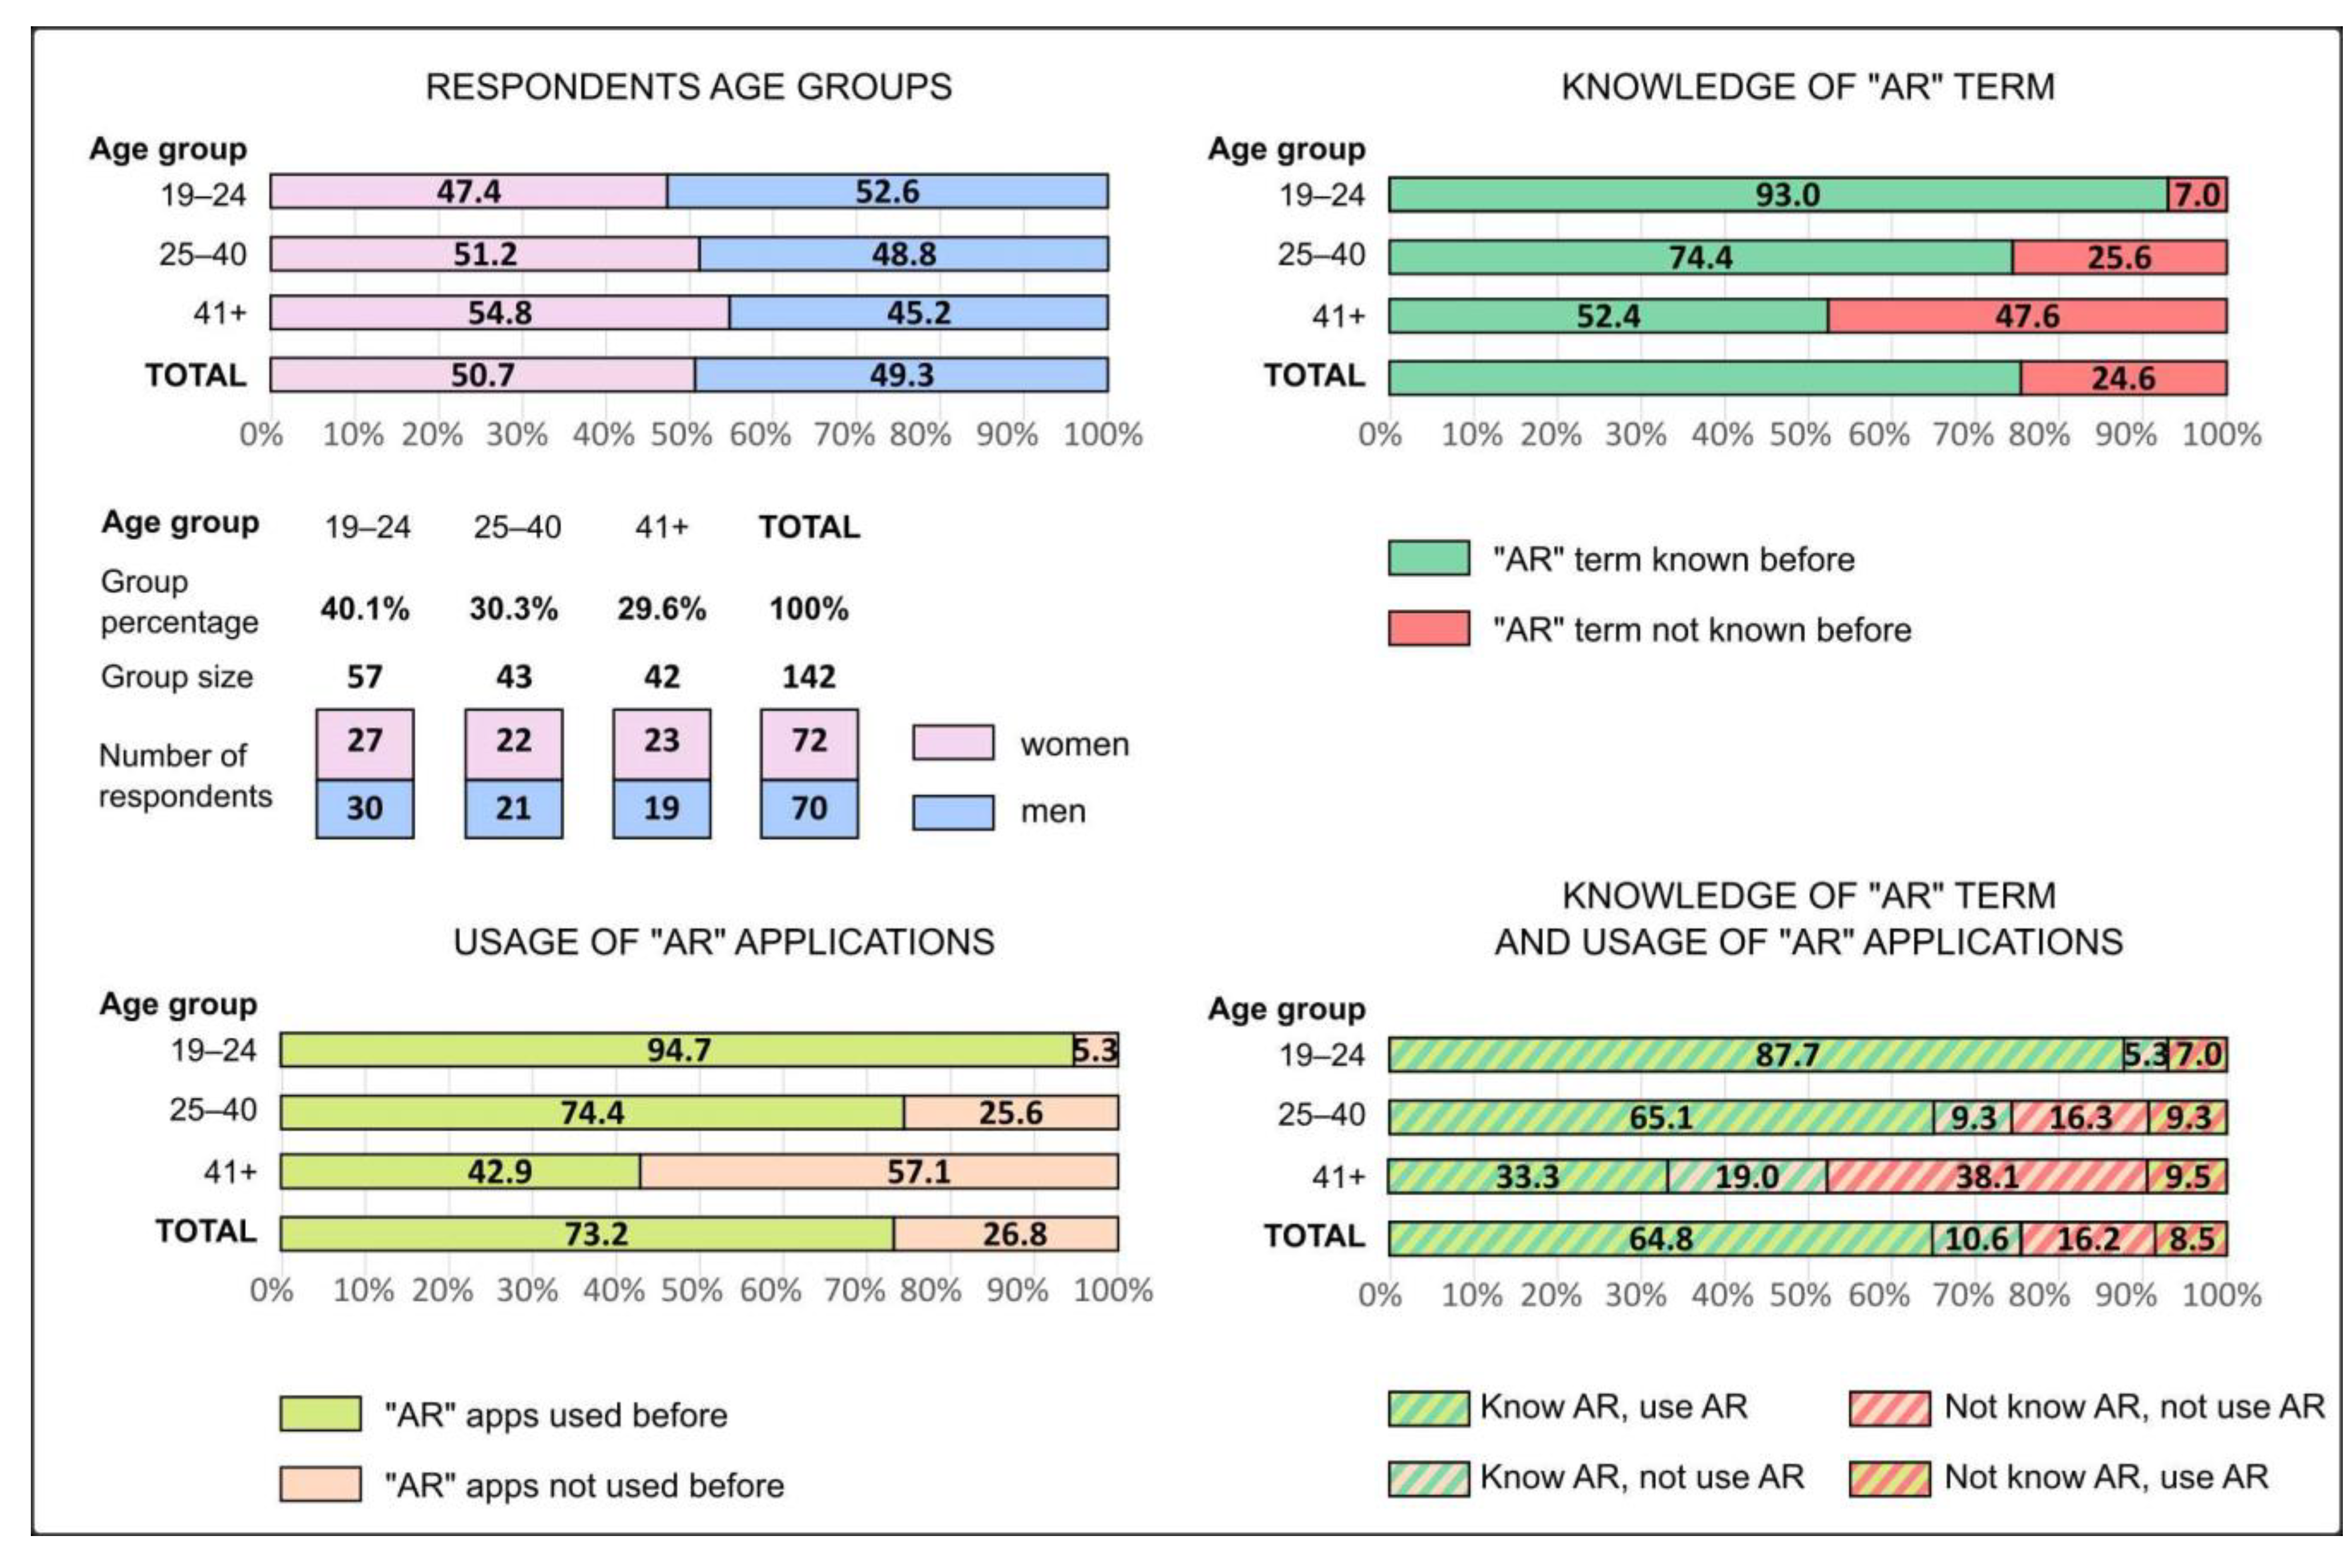
The study was carried out in the form of an online survey in the group of 142 respondents (72 women, 70 men) of different ages. The youngest participant was 19, the oldest was 83 and the largest number of respondents consisted of people aged 21 (the average age was 32, the median was 28). The respondents were also diverse in terms of social groups; there were students doing majors in Geography-related fields, researchers and people from Klub Zdobywców Korony Gór Polski (Club of the Conquerors of the Crown of Polish Mountains) active in social media. The respondents filled in the survey voluntarily, without any time constraints and gratification, and they could end it at any moment. They were divided into three age groups (19–24; 25–40; 41+), with a similar number of people in each, and with similar percentages in terms of the division into sexes. Figure 4 demonstrates the entire structure of the respondents according to the knowledge of the term “augmented reality” and according to sex, in specific age groups, and overall.
The youngest age group consisted of people aged 19–24. Many of them use a computer and mobile devices not only for studying and working but also for the entertainment, such as computer games, social media and multimedia (e.g., films and music). Another group included people aged 25–40, who remember the “era” before mobile devices with colorful touch screens, and the existence of solutions is not as obvious to them as it is for the younger age group that failed to understand or remember a different state of affairs. The third age group (over 40) consisted of both people who started their adventure with computers when computers were just beginning to come into common use and those who remembered the times when computers and mobile devices had not existed yet or maybe had been in a very early stage of development. Among people aged 19–24, 93% had heard about the term “augmented reality” before they took part in the research; in the group aged 25–40, it was 74.4%; and in the group aged over 40, it was a little bit more than half (52.4%). As much as 94.7% of the youngest respondents used an application that used AR in the past; in the group of people aged 25–40, that percentage was only 74.4%; and in the group aged 41+, the percentage was lower than half (42.9%). There were 50 people who knew the term AR and used such applications in the 19–24 group (87.7% of respondents in this age group), 28 in the 25–40 group (which is 65.1%), and 14 in the 41+ group (respectively 33.3%). When it comes to people that knew the term AR but failed to use such applications, the numbers were the following: 3 in the 19–24 group (5.3% of respondents in this age group), 4 in the 25–40 group (which is 9.3%), and 8 in the 41+ group (respectively 19.0%). There were no people in the 19–24 group that did not know the AR term and failed to use AR applications, in the 25–40 group there were 7 such people (16.3% of respondents in this age group), and in the 41+ group there were 16 such people (which is 38.1%). There were 4 people in each age group that failed to know the AR term but did use such applications (which is 7.0% for the 19–24 age group, 9.3% for the 25–40 age group and respectively 9.5% for the 41+ age group). A total of 64.8% of all respondents in the study knew the term AR before and had used AR applications; 10.6% knew the term AR before, but had not used AR apps; 16.2% declared that they did not know the term AR before and had not used AR apps as well; and 8.5% of respondents did not know the term AR, but they had used apps using this technology.
4. Results
Figure 5 demonstrates the preferences of the respondents that evaluated the two modes of using the application (i.e., AR and without AR), i.e., viewing the 3D model of the exemplary mountain top, Tarnica, in terms of which one works best in the context of the analyzed usage traits. The respondents had the following qualitative answers to choose from (Figure 5): Definitely the AR mode (dark blue), Rather the AR mode (light blue), Comparable between the AR mode and the no AR mode (yellow), Rather no AR mode (light purple), Definitely no AR mode (dark purple), and No opinion (grey). The black triangles show the dominating answer (if specific modes are indicated, the triangles refer to “Definitely” and “Rather” answers considered jointly). As far as age groups are concerned, there was a visible tendency to give the “No opinion” answer more often by respondents in the 41+ age group. In each case, it was the number reaching one-third of the respondents in a given age group. People from the 19–24 group were more decisive as the percentage of the “No opinion” answer was the lowest in this group. Generally, the total result for all age groups and for all criteria showed that the AR mode had more supporters.
In F1, in which respondents were supposed to choose the mode of using the application that was more convenient and with the simpler manner of controlling the 3D model, the polarization was the greatest; the number of answers suggesting that the AR/no AR mode was the better choice was similar in all age groups. In the youngest age group, the no AR mode scored slightly higher (the ratio of with AR/Without AR answers was 0.96), and in the middle (25–40) group the AR mode scored higher (1.1). The AR mode was preferred also in the oldest age group, but it was the “No opinion” answer that actually scored the highest there. The “Comparable between the AR mode and no AR mode” scored the highest in the 19–24 age group. Considering all of the respondents from all age groups, the AR mode seemed to score the highest but only slightly (1.1). The percentage of the respondents who thought that both modes were comparable in that respect was 17.6% and of those who had no opinion 15.5%.
The next subsection (F2) was related to the choice of the more effective mode, i.e., the one that allowed one to take a closer look at the fragment of the model. In that case, in each age group, the mode with AR won significantly. The with AR/without AR ratio was 3.1 for the 19–24 group, 2.1 for the 25–40 group and 2.0 for the 41+ group, respectively. Taking into consideration all answers, the AR mode scored slightly higher than 50% of all answers (29.6% for Definitely the AR mode, 21.2% for Rather the AR mode); for 12.7% of the respondents, both modes were comparable in this respect; slightly more than 20% of the respondents chose Without AR (10.6%—Rather no AR mode, 9.9%—Definitely no AR mode); and 16.2% of the respondents had no opinion. The people that definitely preferred the AR mode came from the youngest age group (38.6% of answers in that group).
As far as F3 is concerned, the respondents were supposed to evaluate which mode was more realistic in terms of the visual perception of the 3D model. In all age groups, there was a strong preference for the AR mode, with a relatively low percentage of “Without AR” answers. In the 19–24 age group, 80% of respondents chose the AR mode; in the 25–40 age group, nearly 60%; and in the 41+ group, it was less than 45%. The last group scored higher in terms of the “Without AR” answer, still reaching less than 15%. Considering all answers from all age groups, the AR mode scored over 60% (35.2% Definitely the AR mode, 26.8% Rather the AR mode), 12.7% of the respondents claimed that both modes were comparable, less than 10% of respondents selected the “Without AR” answer (3.5% Rather no AR mode, 4.9% Definitely no AR mode) and 16.9% of the respondents had no opinion on the matter.
When it comes to F4, according to which respondents decided which mode was the more natural when it comes to viewing the 3D model, it was characteristic that in all age groups answers favoring the absence of AR scored 20%, while in the 41+ group the answer “Definitely no AR mode” was selected more often (16.7%). In the 19–24 group, 63.1% selected the AR mode; in the 25–40, it was 41.8%; and in the 41+, it was 33.3%. In total, 46.8% of the respondents chose the AR mode (23.2%—Definitely the AR mode, 24.6%—Rather the AR mode), 16.9% of respondents believe that both modes were comparable and 19.4% of the respondents chose no AR (10.6%—Rather no AR mode, 8.5%—Definitely no AR mode), with 16.2% of the respondents choosing the “No opinion” answer.
The fifth criterion, according to which respondents selected the more interesting and attractive way of exploring the 3D model, (F5), was dominated by the supporters of AR. It was particularly visible for the 19–24 age group, in which 91.3% of the respondents believed so in total (70.2% chose the “Definitely the AR mode” answer). It was the highest score that was not achieved for any other criterion. At the same time, only 1.8% of the youngest respondents selected no AR for that criterion, and only 5.3% decided that both modes were comparable. In the 25–40 group and 41+ group, a general preference for AR was observed, while there were more “Comparable” and “No opinion” answers. In total, 66.9% of all of the respondents selected AR (46.5%—Definitely the AR mode, 20.4% Rather the AR mode). Both modes were evaluated as comparable by 9.9% of the respondents, and only 7.7% of the respondents chose the mode without AR. “No opinion” was selected by 15.5% of the respondents.
The last criterion, (F6), was related to choosing which mode was better for perceiving and estimating the relative land elevation differences. The distribution of the results looks similar to the one for the fourth criterion. There were many undecisive people in the 41+ age group. In total, 48.6% of the respondents selected the AR mode (28.2%—Definitely the AR mode, 20.4%—Rather the AR mode), 19.7% claimed that both modes seemed comparable to them, 12.6% chose no AR (7.7%—Rather no AR mode, 4.9%—Definitely the AR mode) and 19% of the respondents had no opinion on the matter.
The most unambiguous results were achieved for F5, as the with AR/Without AR ratio was 8.7 in total. This means that the respondents selected AR nearly nine times more often. Particularly, a great part was played by young people, as the number of young people who selected AR was 50 times higher than the number of those who did not select AR. F3 was the second most important criterion. The number of AR supporters was 7.4 times higher than the number of AR opponents. Again, the largest ratio, not as high as for F2, was noted for the 19–24 age group (14.9 times). F6 ranked 3rd. The general ratio was 3.9. F2 and F4 ranked 4th ex aequo. F1 ranked last, with the number of votes distributed nearly evenly, with a slight advantage of AR.
5. Discussion
It seems that, along with the development and popularization of new technologies, devices that handle webXR standards and detection of planes are going to be increasingly available. Currently, the list of such devices includes over 600 models of smartphones of different manufacturers (https://developers.google.com/ar/devices accessed on 29 November 2022) [34]. Among the multiple types of the AR user interface available, such as a backpack computer with HDM, PDA, tablet or AR glasses [35], smartphones are those that seem to be the most available and universal, as we use them for numerous other purposes and have them always at our fingertips.
The AR technology opens up a whole range of new opportunities to interact with digital, 3D models of land relief that may constitute visual aids in learning the topography of specific places. Using webXR standards and algorithms of plane detection allows one to separate a new method of displaying content in AR, i.e., plane-based augmented geovisualizations (PAGs). A PAG frees users from the necessity to be in a specific place to see virtual content, as it frequently happens in augmented reality environments (AREs). Moreover, it is not necessary to use physical objects (paper maps) to start digital content as in augmented map (AM) solutions The tested application, developed for the purposes of this research, constitutes an example of using the PAG method in creating AR solutions. The application makes it possible to display 3D models whenever the mobile device that handles webXR standard detects a plane.
The display of the 3D model on the smartphone screen, combined with the real view of the surroundings (i.e., the room) in which the observation takes place and the plane, on which the model is mounted, makes the entire image more realistic, allowing the user to become immersed in the emerging, partially fictional world. The research shows that the feelings and impressions that were accompanying users during the process of exploring the land relief model seemed to be much closer to reality than when a classic interaction with a 3D model, operated with peripheral devices (a mouse, keyboard or a joystick), takes place. The manner of viewing the model in the AR mode resembles the natural one, because it requires observers to move, change the perspective of looking, change the distance if they want to see the model from a different side or scrutinize a detail that is invisible at a larger distance. At the same time, due to the mobility and flexibility of the solution, users have the freedom to choose the location in which they want to view the model, the scale at which the model is being presented and the initial rotation angle in relation to the observation location.
This research constituted a part of the trend in publications that encourages researchers to examine and establish whether various solutions, such as AR, may be used in practice; whether they may constitute an interesting method of promoting tourism; whether they may be helpful in education (e.g., in teaching geography), specifically, topography [22]; and whether they may be useful in such specific fields as mountain rescue services. As far as education is concerned, Scholz et al. [36] and De Almeida Pereira et al. [19] noted that the 3D representation of AR can enhance users’ abilities to perform spatial positioning and read map data, respectively.
The research on the usability of geomedia is frequently related to homogenous groups, e.g., students [37,38]. What is important in our study, however, was the testing of the usefulness of the AR application among different age groups. The division of respondents into three age groups (19–24; 25–40; 41+) and from different backgrounds became crucial. It seemed legitimate to divide respondents into three age groups because similarities and differences in the preferences related to the factors analyzed (F1–F6) could immediately be observed. Furthermore, significant differences in the subjective preferences of amateurs and experts were noted by Medyńska and Zagata [26] for the reconstruction of the stronghold in 3D, as well as by Medyńska et al. [27] for the complexity level of a people gathering presentation on an animated map.
Those age thresholds were arbitrary, and the respondents may significantly differ in terms of habits, skills, and knowledge of the technology of geovisualizing the geographic space of the mountains, regardless of age. However, the differences obtained seem to prove that the conditions described may be the foundation for adopting such categories for dividing respondents into subgroups.
6. Conclusions
Generally speaking, one may conclude that the AR mode in the application received positive evaluation according to different criteria (F2–F6), which means that respondents, regardless of age, can see the potential of such a solution. In some of the criteria, such as the attractiveness of that way of exploring the 3D model, a significant advantage may be observed; in others, such as easy operation (navigation), the opinions seemed a lot more divided. Quantitative differences were clearly visible in the age groups. One may actually observe certain regularities. It needs to be said that respondents in the 19–24 age group had the most positive opinion concerning presenting the 3D model in the AR mode. In all cases apart from F1, their percentage was over 65%. F1 was the only criterion in which, in that age group, there were slightly more people skeptical concerning AR but that was a statistically irrelevant difference (only 1.7%). It was also the only case in the entire research when the number of supporters of the monitor mode outnumbered the supporters of AR. In the 25–40 age group, the percentage of AR supporters was slightly lower, still reaching over 40% for all criteria, except F1, for which the opinions were almost evenly distributed (roughly 50/50) in all age groups. In the 41 and more age group, AR supporters comprised at least 35% of the respondents for all criteria (except F1). Older respondents (41+ years old) were more reserved towards that way of using the application. Those respondents, much more often than the younger ones, did not have an opinion concerning whether AR worked better for a given criterion. This was most observable for F6 (35.7%) but also for other criteria, where the percentage of indecisive answers was 31–33.3%. There were fewer respondents without an opinion in the 25–40 age group and that percentage was the lowest in the youngest group (the percentage oscillated between 1.8 and 5.3%).
The most unambiguous preferences for using AR for the presentation of the 3D model were observed for criterion F5 (the more interesting and attractive way of exploring the 3D model). F3 (the more realistic when it comes to the visual perception of the 3D model) ranked 2nd. F6 (better at perceiving relative terrain elevation differences) ranked 3rd. F2 (more effective in terms of taking a closer look at the 3D model), and F4 (more natural when it comes to viewing the 3D model) ranked 4th ex aequo. F1 (more convenient and characterized by the simpler way of controlling the 3D model) had an almost equal distribution of votes, with a slight advantage of those for AR.
It is also worth noting that there were some differences in terms of the previous experience with AR within age groups. When it came to the knowledge of the term “augmented reality” and previous experience in using similar applications, those differences were arranged according to age groups: the lower the age of respondents, the higher percentage of AR users or those who knew the term AR prior to participating in this study The higher the age of respondents, the lower the percentage of such people. Nine respondents from the 41+ age group knew the term AR but had not used similar applications before. In each group there were three respondents that shared the same experience. There were four people in each group that failed to know the term AR but did use AR applications. There was nobody aged 19–24 that used AR applications but failed to know the term. In the 25–40 age group, there were six such respondents, and there were 16 in the 41+ group.
The results show that AR technology that uses the PAG method for creating applications that allow one to view 3D models of land relief fragments is highly useful. They corroborate the fact that this solution may constitute an interesting, willingly chosen alternative to the classic approach to interactive exploration of 3D models on the computer. High scores obtained for specific criteria prove that users have a great interest in this form of geovisualization. The results of the research corroborate the potential of the AR technology and encourage researchers to conduct more studies, extending the range of research by adding the test with the application displayed in AR, with respondents using it physically on their smartphones.
Further research and the development of 3D models of land relief forms in AR may focus on special effects that could be added to the model to make the image even more realistic [39]. On historical topographic maps, the third dimension of the land relief was highlighted by means of suitably applied painterly means of expression [40]. Here, the orthophoto map was the cartographic base and the main objective was to simulate lighting and weather conditions. The opportunities to change the lighting conditions are well known from GIS applications, used for rendering 3D land relief models. Those conditions have a significant impact on the perception of the model [41]. It seems that, in this situation, smart solutions should adjust the height of the source of lighting, as well as the direction of lighting and length of the shadow cast to the position of the observer in relation to cardinal directions, the season, the time of the day and the real lighting conditions that may occur in a given location as a result of all those factors [42,43,44]. Furthermore, adding mist, as it takes place in the online 3D atlas of Switzerland (www.atlasderschweiz.ch accessed on 29 November 2022) [45,46], as well as rain, snow and clouds (as in 3D cities or in the digital land relief model in the TerrainView application), could create a highly interesting effect.
Author Contributions
Conceptualization, Ł.H. and Ł.W.; methodology, Ł.H. and Ł.W.; software, Ł.H.; validation, Ł.H.; formal analysis, Ł.W.; investigation, Ł.H. and Ł.W.; resources, Ł.H.; data curation, Ł.W.; writing—original draft preparation, Ł.H.; writing—review and editing, Ł.W.; visualization, Ł.H.; supervision, not applicable; project administration, Ł.H.; funding acquisition, not applicable. All authors have read and agreed to the published version of the manuscript.
Funding
This research received no external funding.
Data Availability Statement
Not applicable.
Conflicts of Interest
The authors declare no conflict of interest.
References
- Biljecki, F.; Ledoux, H.; Stoter, J.; Zhao, J. Formalisation of the level of detail in 3D city modelling. Comput. Environ. Urban Syst. 2014, 48, 1–15. [Google Scholar] [CrossRef] [Green Version]
- Gill, L.; Lange, E. Getting virtual 3D landscapes out of the lab. Comput. Environ. Urban Syst. 2015, 54, 356–362. [Google Scholar] [CrossRef] [Green Version]
- Wang, W.; Wu, X.; He, A.; Chen, Z. Modelling and Visualizing Holographic 3D Geographical Scenes with Timely Data Based on the HoloLens. IJGI 2019, 8, 539. [Google Scholar] [CrossRef] [Green Version]
- Lv, G.N.; Yu, Z.Y.; Yuan, L.W.; Luo, W.; Zhou, L.C.; Wu, M.G.; Sheng, Y.H. Is the Future of Cartography the Scenario Science? J. Geo-Inf. Sci. 2018, 20, 1–6. [Google Scholar] [CrossRef]
- Kersten, T.P.; Edler, D. Special Issue “Methods and Applications of Virtual and Augmented Reality in Geo-Information Sciences”. PFG 2020, 88, 119–120. [Google Scholar] [CrossRef] [Green Version]
- Caudell, T.; Mizell, D. Augmented reality: An application of heads-up display technology to manual manufacturing processes. In Proceedings of the Twenty-Fifth Hawaii International Conference on System Sciences, Kauai, HI, USA, 7–10 January 1992; p. 2. [Google Scholar] [CrossRef]
- Milgram, P.; Kishino, F. A Taxonomy of Mixed Reality Visual Displays. IEICE Trans. Inf. Syst. 1994, E77-D, 1321–1329. [Google Scholar]
- Azuma, R.T. A Survey of Augmented Reality. Presence: Teleoperators Virtual Environ. 1997, 6, 355–385. [Google Scholar] [CrossRef]
- Cheng, Y.; Zhu, G.; Yang, C.; Miao, G.; Ge, W. Characteristics of augmented map research from a cartographic perspective. Cartogr. Geogr. Inf. Sci. 2022, 49, 426–442. [Google Scholar] [CrossRef]
- Dickmann, F.; Keil, J.; Dickmann, P.L.; Edler, D. The Impact of Augmented Reality Techniques on Cartographic Visualization. KN J. Cartogr. Geogr. Inf. 2021, 71, 285–295. [Google Scholar] [CrossRef]
- Feiner, S.; MacIntyre, B.; Höllerer, T.; Webster, A. A touring machine: Prototyping 3D mobile augmented reality systems for exploring the urban environment. Pers. Technol. 1997, 1, 208–217. [Google Scholar] [CrossRef]
- Bertin, J.; Barbut, M. Sémiologie Graphique: Les Diagrammes, Les Réseaux, Les Cartes; Éditions de l’École des hautes études en sciences sociales: Paris, France, 2013; ISBN 2713224179. [Google Scholar]
- Halik, Ł. The analysis of visual variables for use in the cartographic design of point symbols for mobile Augmented Reality applications. Geod. Cartogr. 2012, 61, 19–30. [Google Scholar] [CrossRef] [Green Version]
- Halik, Ł.; Medyńska-Gulij, B. The Differentiation of Point Symbols using Selected Visual Variables in the Mobile Augmented Reality System. Cartogr. J. 2016, 32, 147–156. [Google Scholar] [CrossRef]
- Fukuda, T.; Zhang, T.; Yabuki, N. Improvement of registration accuracy of a handheld augmented reality system for urban landscape simulation. Front. Archit. Res. 2014, 3, 386–397. [Google Scholar] [CrossRef] [Green Version]
- Kourouthanassis, P.; Boletsis, C.; Bardaki, C.; Chasanidou, D. Tourists responses to mobile augmented reality travel guides: The role of emotions on adoption behavior. Pervasive Mob. Comput. 2015, 18, 71–87. [Google Scholar] [CrossRef]
- Bobrich, J.; Otto, S. Augmented Maps. Int. Arch. Photogramm. Remote Sens. Spat. Inf. Sci. 2002, 34, 502–505. [Google Scholar]
- Morrison, A.; Mulloni, A.; Lemmelä, S.; Oulasvirta, A.; Jacucci, G.; Peltonen, P.; Schmalstieg, D.; Regenbrecht, H. Collaborative use of mobile augmented reality with paper maps. Comput. Graph. 2011, 35, 789–799. [Google Scholar] [CrossRef] [Green Version]
- De Almeida Pereira, G.H.; Stock, K.; Stamato Delazari, L.; Centeno, J.A.S. Augmented Reality and Maps: New Possibilities for Engaging with Geographic Data. Cartogr. J. 2018, 54, 313–321. [Google Scholar] [CrossRef]
- Mozzila.org. WebXR Device API. Available online: https://developer.mozilla.org/en-US/docs/Web/API/WebXR_Device_API (accessed on 2 December 2022).
- Horbiński, T.; Medyńska-Gulij, B. Geovisualisation as a process of creating complementary visualisations: Static two-dimensional, surface three-dimensional, and interactive. Geod. Cartogr. 2017, 66, 45–58. [Google Scholar] [CrossRef]
- Siqueira, P. Teaching Topographic Surface Concepts in Augmented Reality and Virtual Reality Web Environments. International J. Innov. Educ. Res. 2019, 7, 307–320. [Google Scholar] [CrossRef]
- Templin, T.; Popielarczyk, D.; Gryszko, M. Using Augmented and Virtual Reality (AR/VR) to Support Safe Navigation on Inland and Coastal Water Zones. Remote Sens. 2022, 14, 1520. [Google Scholar] [CrossRef]
- Brejcha, J.; Lukáč, M.; Hold-Geoffroy, Y.; Wang, O.; Čadík, M. LandscapeAR: Large Scale Outdoor Augmented Reality by Matching Photographs with Terrain Models Using Learned Descriptors; Springer International Publishing: Cham, Switzerland, 2020. [Google Scholar]
- Zagata, K.; Gulij, J.; Halik, Ł.; Medyńska-Gulij, B. Mini-Map for Gamers Who Walk and Teleport in a Virtual Stronghold. IJGI 2021, 10, 96. [Google Scholar] [CrossRef]
- Medyńska-Gulij, B.; Zagata, K. Experts and Gamers on Immersion into Reconstructed Strongholds. IJGI 2020, 9, 655. [Google Scholar] [CrossRef]
- Medyńska-Gulij, B.; Wielebski, Ł.; Halik, Ł.; Smaczyński, M. Complexity Level of People Gathering Presentation on an Animated Map—Objective Effectiveness Versus Expert Opinion. IJGI 2020, 9, 117. [Google Scholar] [CrossRef] [Green Version]
- Wielebski, Ł.; Medyńska-Gulij, B. Graphically supported evaluation of mapping techniques used in presenting spatial accessibility. Cartogr. Geogr. Inf. Sci. 2019, 46, 311–333. [Google Scholar] [CrossRef]
- Andrzejewski, B.; Witkowska, M. Górska Korona Polski: Wędrówka Przez Cztery Pory Roku, Wydanie II.; Wydawnictwo STAPIS: Katowice, Poland, 2019; ISBN 8379670930. [Google Scholar]
- Bzowski, K. Korona Polskich Gór, Wydanie II.; Wydawnictwo Helion: Gliwice, Poland, 2018; ISBN 8328348209. [Google Scholar]
- Easily display interactive 3D models on the web & in AR. Available online: https://modelviewer.dev/ (accessed on 2 December 2022).
- Medyńska-Gulij, B.; Gulij, J.; Cybulski, P.; Zagata, K.; Zawadzki, J.; Horbiński, T. Map Design and Usability of a Simplified Topographic 2D Map on the Smartphone in Landscape and Portrait Orientations. IJGI 2022, 11, 577. [Google Scholar] [CrossRef]
- Likert, R. A technique for the measurement of attitudes. Arch. Psychol. 1932, 22, 55. [Google Scholar]
- Google. ARCore supported devices. Available online: https://developers.google.com/ar/devices (accessed on 2 December 2022).
- Halik, Ł. Wykorzystanie mobilnego systemu rozszerzonej rzeczywistości w robotach geodezyjnych–wywiad terenowy. Geod. -Mag. Geoinformacyjny 2012, 209, 20–25. [Google Scholar]
- Scholz, M.A.; Huynh, N.T.; Brysch, C.P.; Scholz, R.W. An Evaluation of University World Geography Textbook Questions for Components of Spatial Thinking. J. Geogr. 2014, 113, 208–219. [Google Scholar] [CrossRef]
- Cybulski, P. Spatial distance and cartographic background complexity in graduated point symbol map-reading task. Cartogr. Geogr. Inf. Sci. 2020, 47, 244–260. [Google Scholar] [CrossRef]
- Cybulski, P.; Wielebski, Ł. Effectiveness of Dynamic Point Symbols in Quantitative Mapping. Cartogr. J. 2019, 56, 146–160. [Google Scholar] [CrossRef]
- Svobodová, J.; Voženílek, V. Relief for Models of Natural Phenomena; Springer: Dordrecht, The Netherlands, 2009. [Google Scholar]
- Medyńska-Gulij, B. Geomedia Attributes for Perspective Visualization of Relief for Historical Non-Cartometric Water-Colored Topographic Maps. IJGI 2022, 11, 554. [Google Scholar] [CrossRef]
- Medyńska-Gulij, B.; Lis, M.; Wielebski, Ł. Wizualizacja wymiernych i plastycznych cech rzeźby na podstawie numerycznego modelu terenu dla Wielkopolskiego Parku Narodowego. In BADANIA FIZJOGRAFICZNE 2012, R. III–Seria A–Geografia Fizyczna (A61); Wydawnictwo Poznańskiego Towarzystwa Przyjaciół Nauk: Poznan, Poland, 2012; pp. 187–207. [Google Scholar]
- Farmakis-Serebryakova, M.; Hurni, L. Comparison of Relief Shading Techniques Applied to Landforms. IJGI 2020, 9, 253. [Google Scholar] [CrossRef] [Green Version]
- Veronesi, F.; Hurni, L. A GIS tool to increase the visual quality of relief shading by automatically changing the light direction. Comput. Geosci. 2015, 74, 121–127. [Google Scholar] [CrossRef]
- Jenny, B.; Heitzler, M.; Singh, D.; Farmakis-Serebryakova, M.; Liu, J.C.; Hurni, L. Cartographic Relief Shading with Neural Networks. CoRR 2020, 27, 1225–1235. [Google Scholar] [CrossRef]
- Institute of Cartography and Geoinformation, ETH Zurich. Atlas of Switzerland. Available online: www.atlasderschweiz.ch (accessed on 2 December 2022).
- Sieber, R.; Serebryakova, M.; Schnürer, R.; Hurni, L. Atlas of Switzerland Goes Online and 3D—Concept, Architecture and Visualization Methods; Springer International Publishing: Cham, Switzerland, 2016. [Google Scholar]
Figure 1.
View of the tested application displayed on the screen of a smartphone (a) with the initial page enabling the selection of a mountain peak; (b) the 3D model of the Tarnica peak displayed without the AR mode; (c) the 3D model of the Tarnica peak located on the top of a coffee table in the AR mode using the PAG method.

Figure 2.
(a) The welcome view of the tested application window with a list of peaks to choose from; (b) the view of the selected three-dimensional model of the Tarnica peak in the web browser displayed on the PC monitor.
Figure 2.
(a) The welcome view of the tested application window with a list of peaks to choose from; (b) the view of the selected three-dimensional model of the Tarnica peak in the web browser displayed on the PC monitor.

Figure 3.
Selected frames from the video attached to the survey questionnaire showing the use of the tested application and activities (A–F) performed by the operator on a smartphone equipped with the AR mode (https://youtu.be/E_t8ZU2OtMY accessed on 28 November 2022)—compare with Figure 1a–c.
Figure 3.
Selected frames from the video attached to the survey questionnaire showing the use of the tested application and activities (A–F) performed by the operator on a smartphone equipped with the AR mode (https://youtu.be/E_t8ZU2OtMY accessed on 28 November 2022)—compare with Figure 1a–c.

Figure 4.
Structure of the respondents by age, sex and knowledge of the term “AR” and previous use of other AR applications by the respondents.
Figure 4.
Structure of the respondents by age, sex and knowledge of the term “AR” and previous use of other AR applications by the respondents.

Figure 5.
Respondents’ preferences regarding the use of the application in the AR mode or non-AR mode, broken down by age group and in total.
Figure 5.
Respondents’ preferences regarding the use of the application in the AR mode or non-AR mode, broken down by age group and in total.


Table 1.
Comparison of the operations and capabilities of the tested application according to three modes of use: on a computer screen (PC), on a smartphone without AR, on a smartphone with AR.
Table 1.
Comparison of the operations and capabilities of the tested application according to three modes of use: on a computer screen (PC), on a smartphone without AR, on a smartphone with AR.
| Type and Characteristics of the Device | PC (Personal Computer) Desktop Mode | Smartphone without AR Mode | Smartphone with AR Mode |
|---|---|---|---|
| Screen (display) type | Traditional screen (non-touch) | Touch screen (or a tablet/laptop with a larger touch screen) | Touch screen with AR image superimposed |
| Screen size | Big | Small | Small |
| Scaling the 3D model | Using the mouse scroll | Using two fingers to slide across the screen (increase/decrease the distance between the fingers) | |
| Rotation of the 3D model by 360 degrees in the horizontal plane | Hold down the left mouse button and move the mouse (360 degrees for the vertical axis)/use the left or right arrow keys on the keyboard | Drag your finger across the screen (swipe) | Using two fingers on the touchscreen in opposite directions (circling) |
| Rotation of the 3D model by 360 degrees in other planes | Hold down the left mouse button and move the mouse (2 × 180 degrees for the horizontal axis) / use the up or down arrow keys on the keyboard | Drag your finger across the screen (swipe) | Impossible (the 3D model keeps its position in the horizontal plane all the time) |
| Changing the position of the 3D model relative to the observer | By default, the 3D model is always in the center of the screen (hold down the right mouse button to drag to another place) | By default, the 3D model is always in the center of the screen (double quick tap on the screen moves the model) | Possible (you can display the 3D model in any part of the screen by swiping it with your finger on the touch screen) |
| The relationship of the observer and the 3D model | Observer position fixed—change of scale and rotation of the 3D model relative to the observer | A. The position of the observer is variable (moving) - the position of the 3D model remains constant in the horizontal plane. To see the model from a different angle or to move closer/ farther away from it, the observer must change his position | |
| B. Fixed position of the observer - the observer can change the position of the 3D model on the screen, but only in the horizontal plane, rotate the model around its vertical axis or scale the model | |||
| 3D model exploration | The observer can view the model only at a distance (specified maximum magnification level) | The observer has the ability to enter the area occupied by the model | |
Disclaimer/Publisher’s Note: The statements, opinions and data contained in all publications are solely those of the individual author(s) and contributor(s) and not of MDPI and/or the editor(s). MDPI and/or the editor(s) disclaim responsibility for any injury to people or property resulting from any ideas, methods, instructions or products referred to in the content. |
© 2023 by the authors. Licensee MDPI, Basel, Switzerland. This article is an open access article distributed under the terms and conditions of the Creative Commons Attribution (CC BY) license (https://creativecommons.org/licenses/by/4.0/).
Share and Cite
MDPI and ACS Style
Halik, Ł.; Wielebski, Ł. Usefulness of Plane-Based Augmented Geovisualization—Case of “The Crown of Polish Mountains 3D”. ISPRS Int. J. Geo-Inf. 2023, 12, 38. https://0-doi-org.brum.beds.ac.uk/10.3390/ijgi12020038
AMA Style
Halik Ł, Wielebski Ł. Usefulness of Plane-Based Augmented Geovisualization—Case of “The Crown of Polish Mountains 3D”. ISPRS International Journal of Geo-Information. 2023; 12(2):38. https://0-doi-org.brum.beds.ac.uk/10.3390/ijgi12020038
Chicago/Turabian StyleHalik, Łukasz, and Łukasz Wielebski. 2023. "Usefulness of Plane-Based Augmented Geovisualization—Case of “The Crown of Polish Mountains 3D”" ISPRS International Journal of Geo-Information 12, no. 2: 38. https://0-doi-org.brum.beds.ac.uk/10.3390/ijgi12020038
Note that from the first issue of 2016, this journal uses article numbers instead of page numbers. See further details here.