

BiodivAR: A Cartographic Authoring Tool for the Visualization of Geolocated Media in Augmented Reality
 , , and
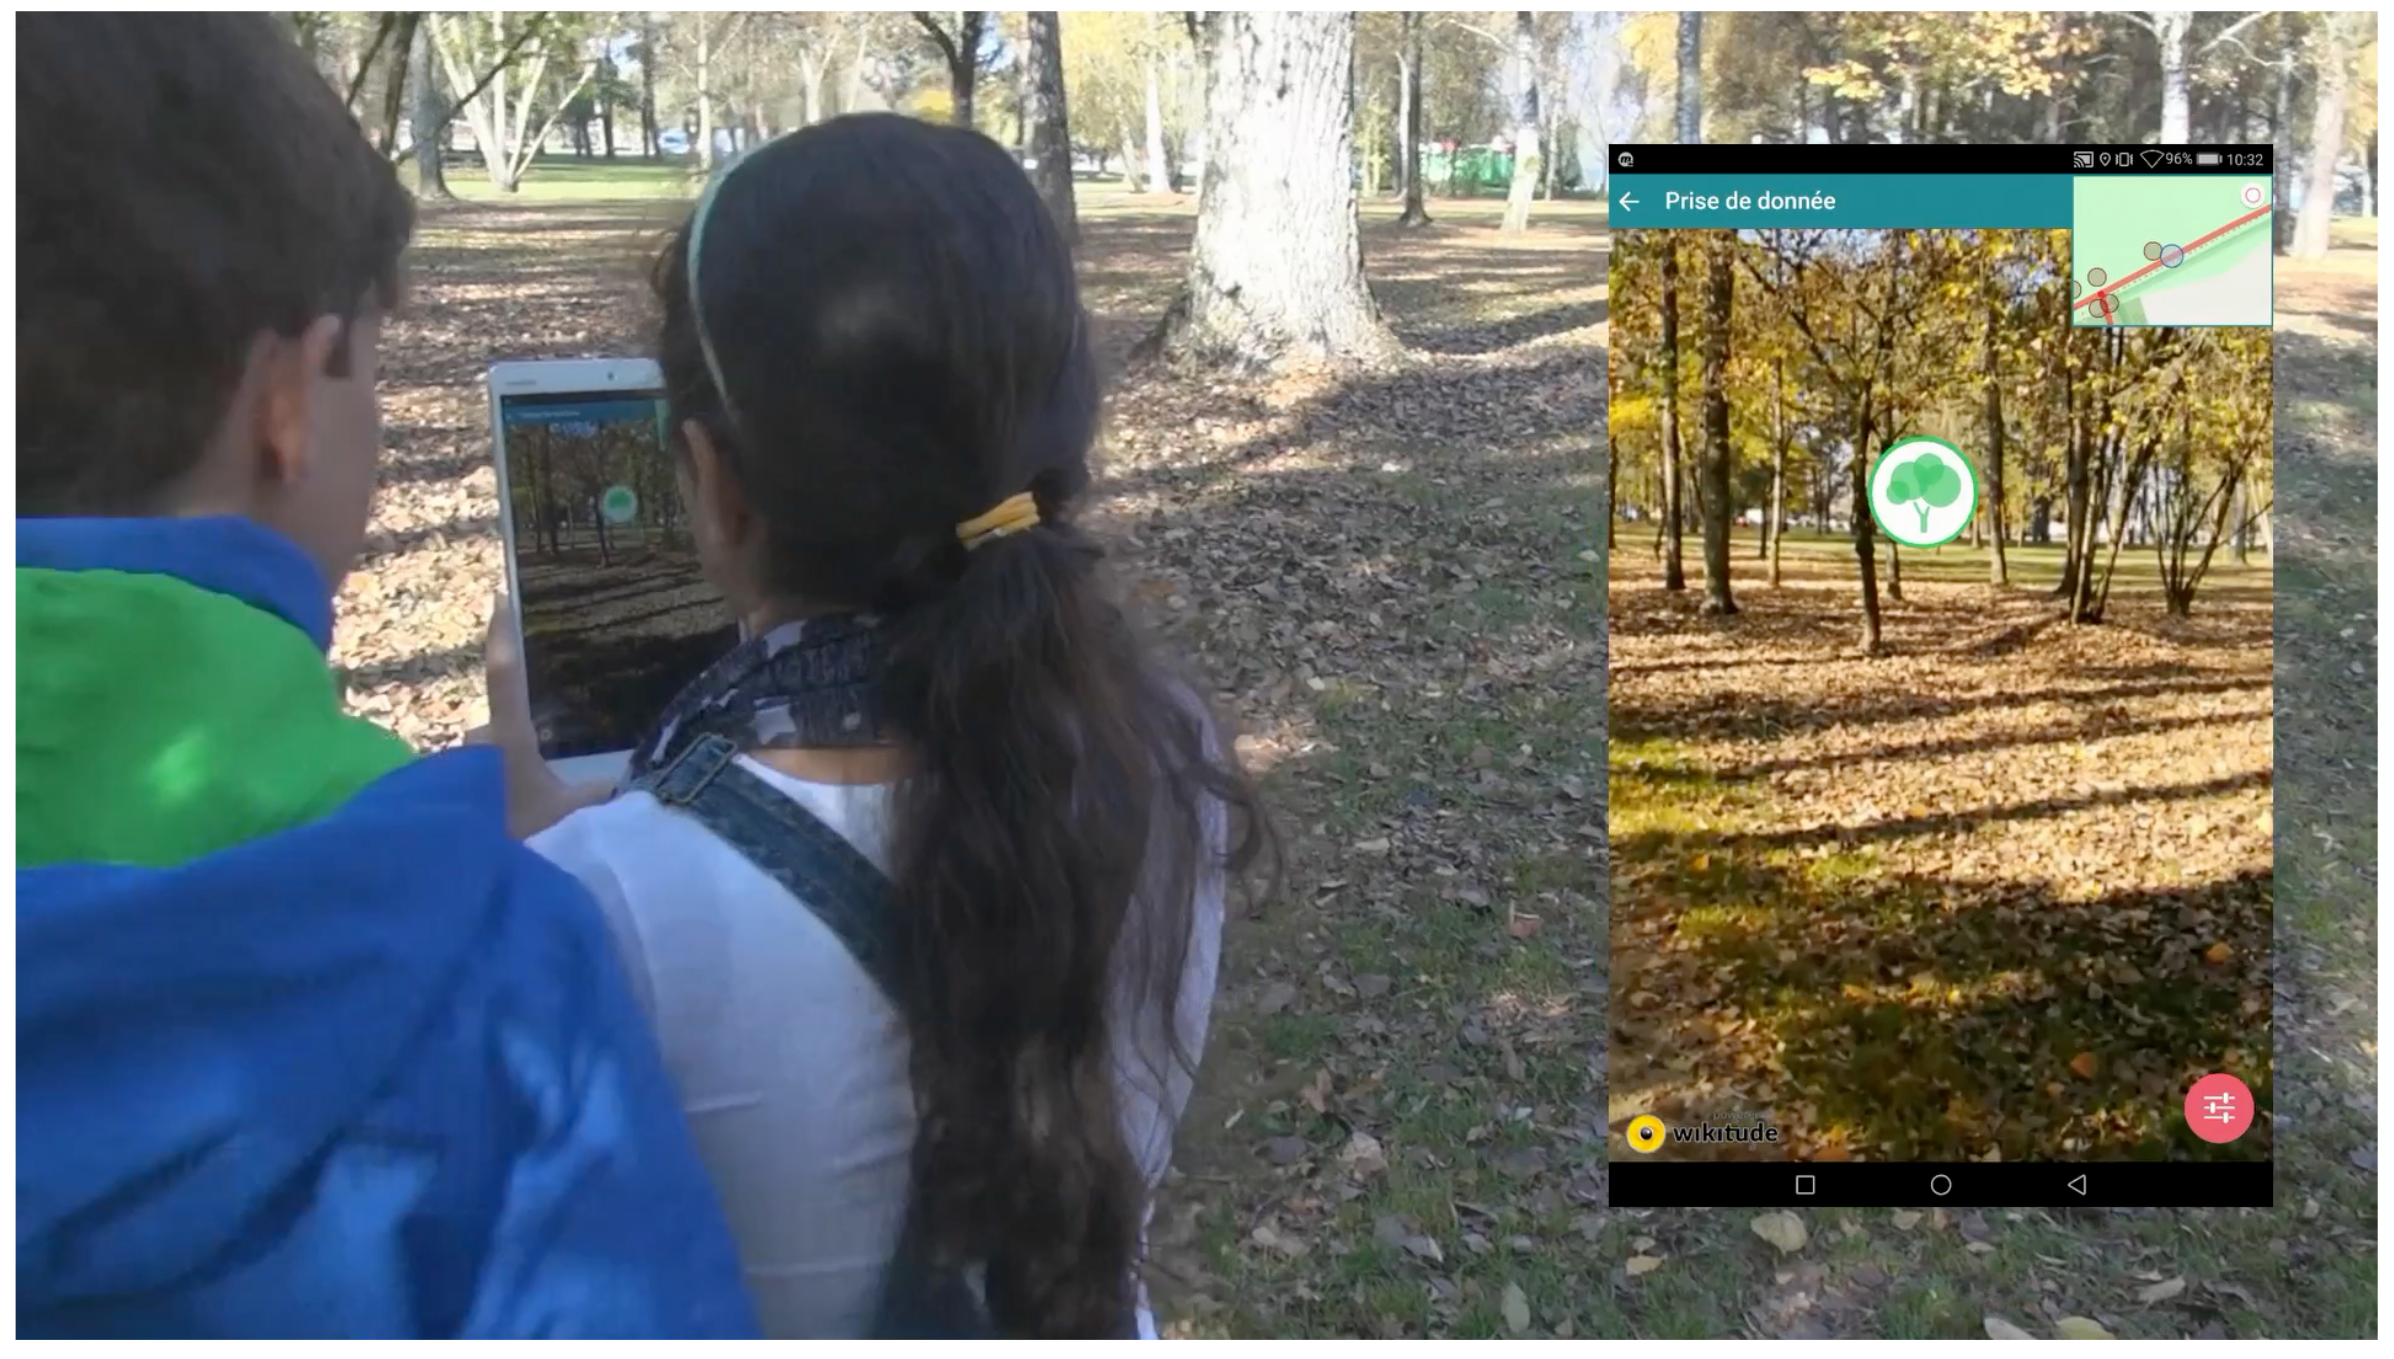
Abstract
:1. Introduction
1.1. Goals and Structure of the Paper
1.2. Research Goals of the Project
- Create an authoring tool that is easy to use The application we developed features a cartographic authoring tool for the creation of custom AR learning experiences (ARLEs). It was designed based on information retrieved from interviews and co-design sessions with target users and it is primarily intended to facilitate the organization of field trips in nature. It should be actionable by anyone with little prior technological knowledge, [2] which comes with great utilisabilty requirements. It is also targeted to be implemented in the context of citizen science (CS) projects, through visualizing existing geolocated data, or contributing new data.
- Design a location-based AR interface that supports nature exploration The application features an AR immersive mode for visualizing the text, photography, graphics, 3D animation, and sound in virtual environments. When these spatial media contain information about the geographical space they’re anchored to, they have the potential to engage users in a singular way [3,4,5,6,7,8]. We aim to leverage this particular type of immersive interface’s attractiveness and efficiency to engage users to actively explore outdoors.
- Try to better the usability of location-based AR interfaces Because location-based AR depends on geolocation data, the accuracy of that data is of direct consequence on the interface’s stability [4,5,8,9,10,11]. We propose the use of an external module for satellite navigation with real-time kinematics (RTK) that achieves centimeter-accuracy. We also lay down the concept for a data fusion method using simultaneous localization and mapping (SLAM) data and geolocation data to further improve heading data, which has an equally important impact on location-based AR interfaces.
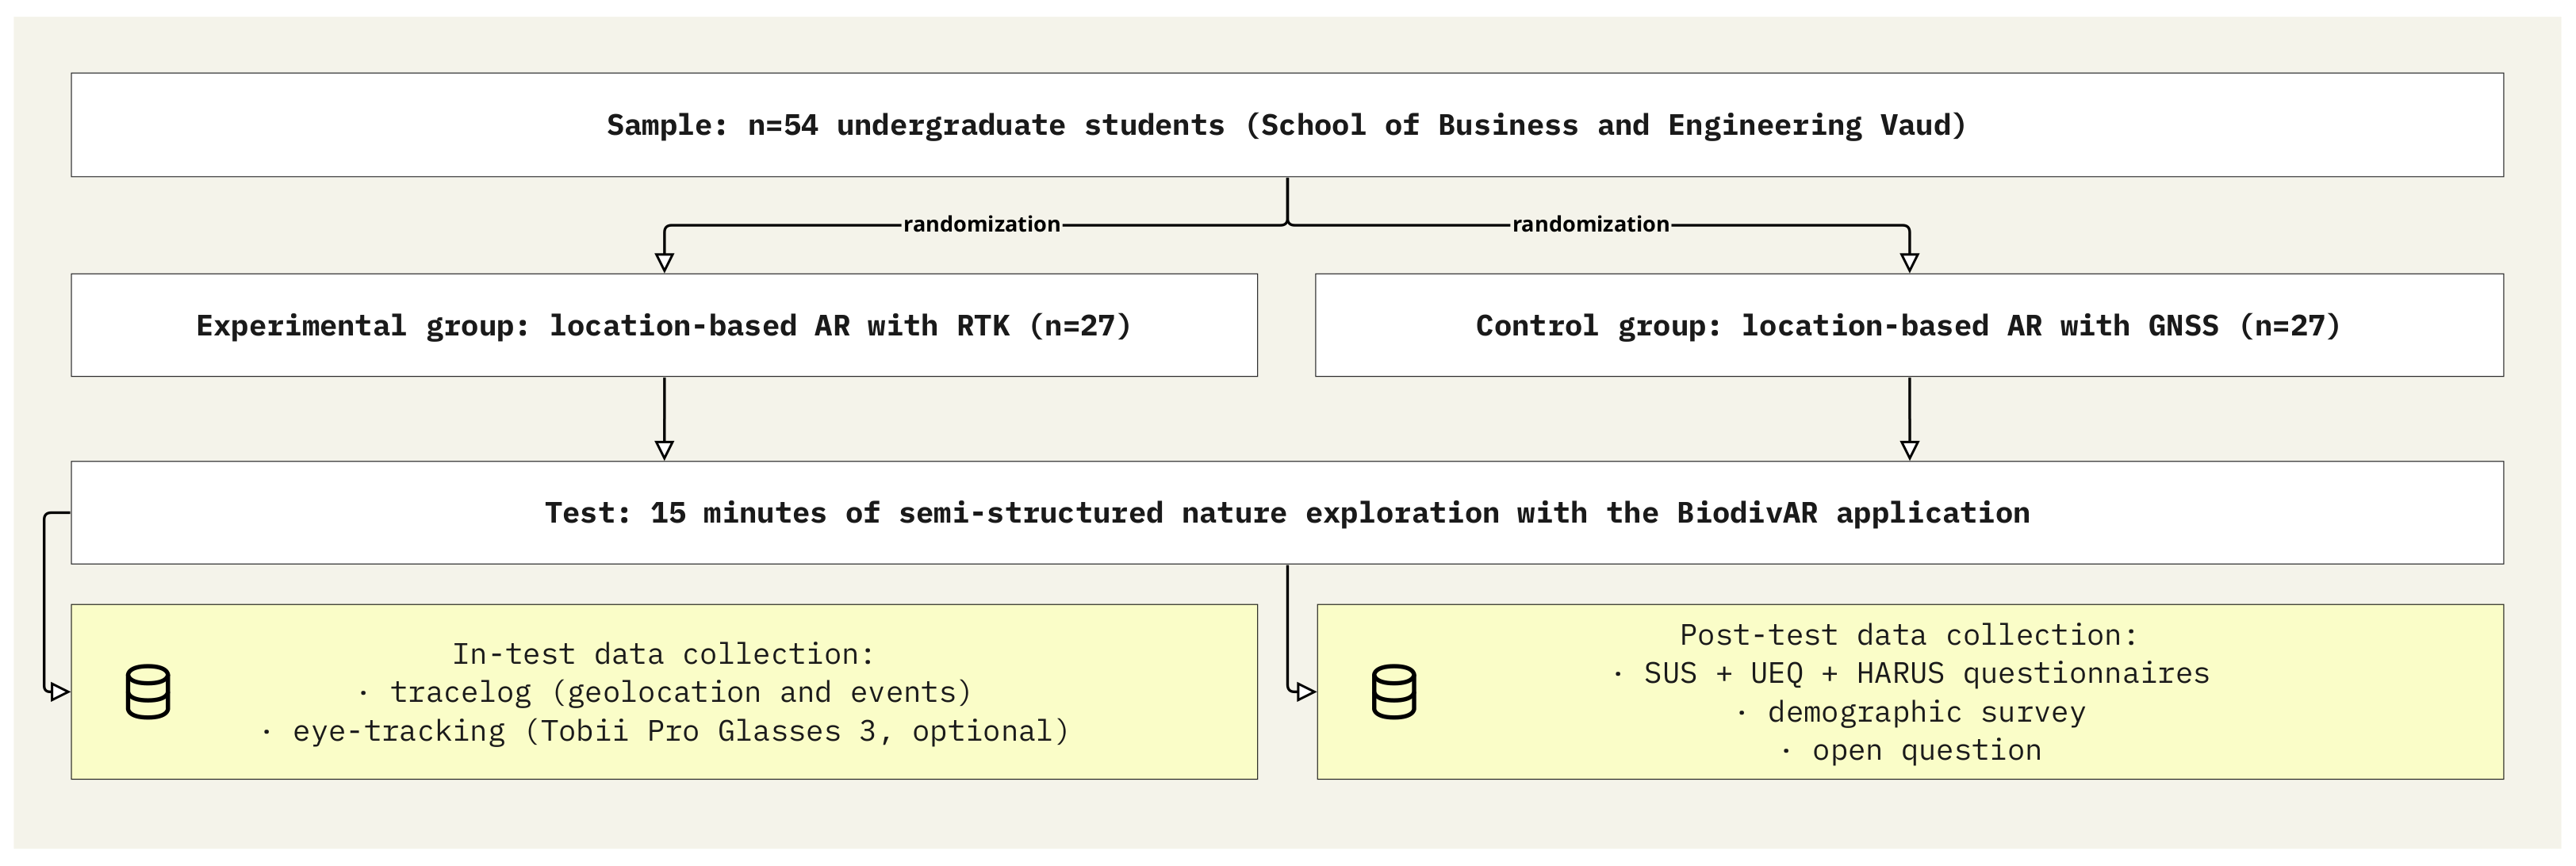
- Evaluate the tool’s usability As a UCD project, its successes and failures are to be assessed primarily on the basis of its usability, acceptance and user satisfaction as measured by self-reported user data, and on the improvements observed with respect to the prior iteration [1]. We have conducted a comparative user test (n = 54) to assess the tool’s usability in combination with two geolocation data sources. The results have not been fully processed and analyzed yet and will be presented in a subsequent paper.
2. Background
2.1. Augmented Reality for Education
2.2. Proof of Concept: The BioSentiers Mobile Application
3. Materials and Methods
3.1. User-Centered Design
3.1.1. Participant Observation
3.1.2. Interviews
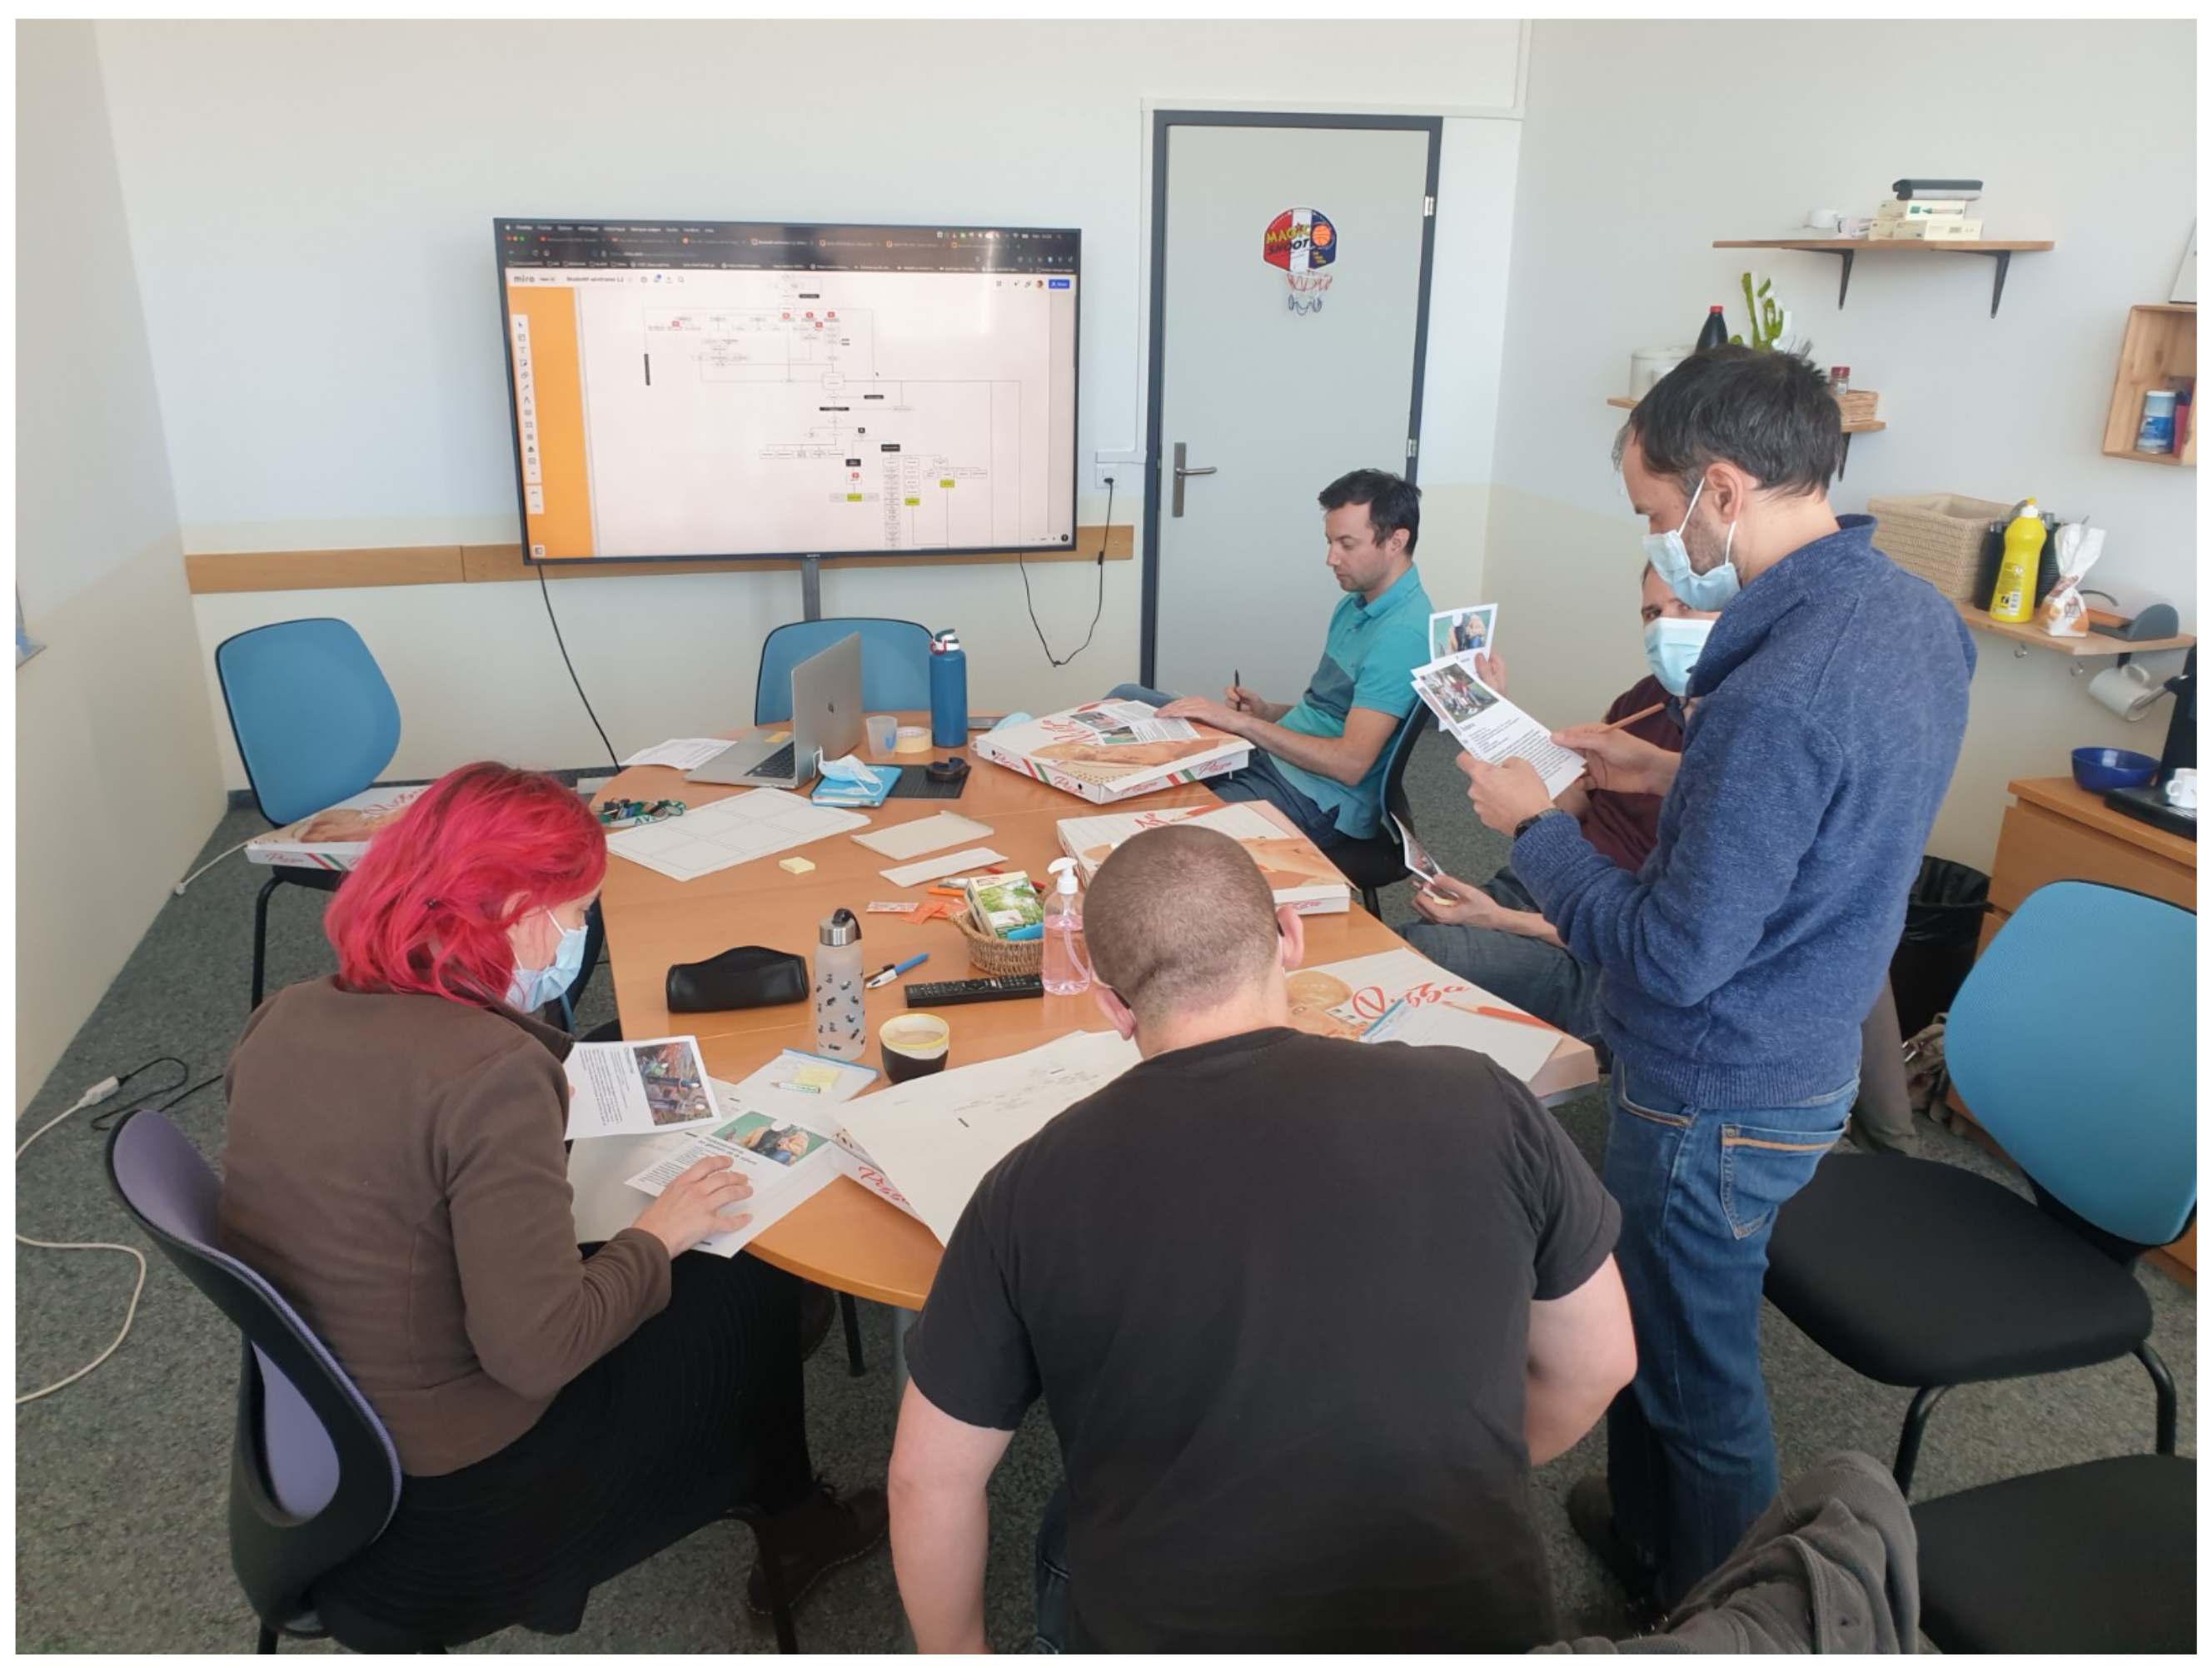
3.1.3. Co-Design
- 1.
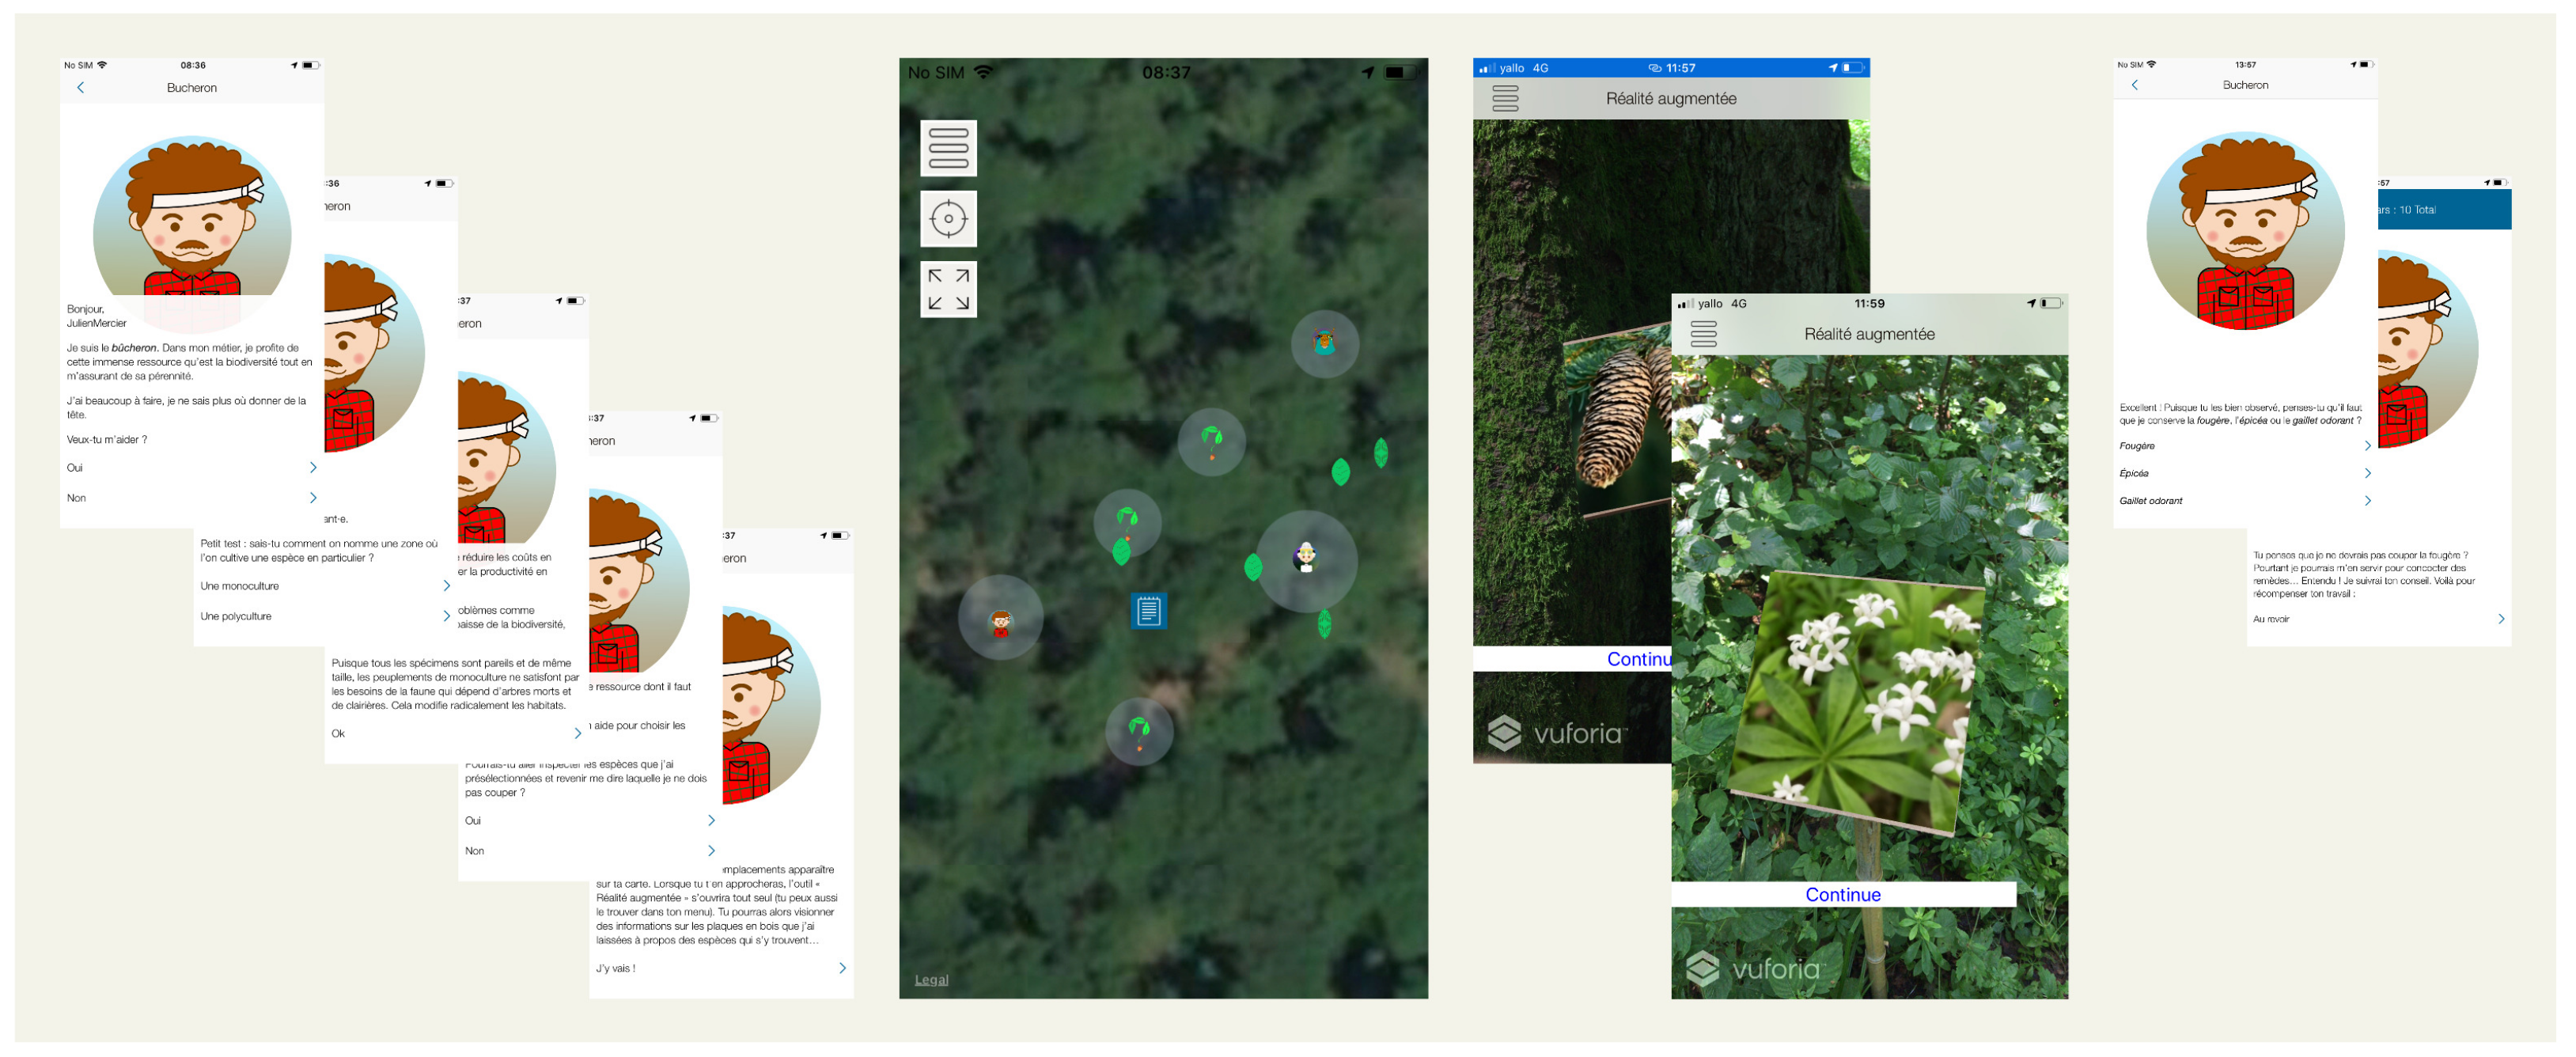
- The workshop with the middle-school teacher resulted in the formulation of a scenario suitable for pupils in this age group (8–11 y.o.). It entails an excursion during which the pupils visualize information about various plant species in AR, some of which are useful to humans (edible, in medicine, for manufacturing, etc.), and others are not directly useful or even harmful. Both categories would be presented successively, in two distinct geographical zones. Upon returning to the classroom, a period of reflection would enable the pupils to notice the differences by themselves. The goal is for them to realize that the utilitarian relationship humans hold with nature as a commodity sometimes collides with the wish to protect and place all plant species on an equal footing. The workshop led to the implementation of:
- (a)
- A style customization feature for the POIs (colors, shapes, volumes, fills, etc.)
- (b)
- A “geofencing” feature that would allow users to draw walls visible in AR
- (c)
- Data visualization features on a 2D map that would allow users to visualize the media anchored within POIs remotely, after the field trip
- 2.
- The workshop with the outdoor learning didactics led to the creation of a learning scenario where the excursion was framed as a mission where pupils would be presented with an environmental problem. Specifically, the scenario would be that of the construction of a real estate project on a natural reserve. After exploring the milieu, pupils would have to write an essay discussing the pros and cons of the project and how they think the situation should be handled, based on their observations during the field trip. The didactician suggested various perspectives be offered within the ARLE so that pupils may learn to express themselves from different points of view, which is thematized in the French curriculum for this age group. This specific workshop did not result in the inclusion of new features within the app, but it provided insight on how to broaden the possible pedagogical framing that happens outside of the application. It also supported the relevance of data visualization features on a 2D map, by planning to use these tools after the field trip, upon returning to the classroom.
- 3.
- The workshop with the higher-education teaching assistant was oriented towards the creation of a use case for students (18–25 y.o.) in nature engineering. The system would be used to collect data on the field as they explore nature. They would be tasked with collecting data, creating POIs, uploading photographs, identifying and monitoring specimens, writing comments, and making observations. In this scenario, the goals would both be for the students to learn about biodiversity by applying theoretical knowledge they have previously studied, and also to actively contribute to biodiversity data that can be harnessed for research. Thanks to the use of interoperable GeoJSON files, participants can further valorize the data they collected by uploading it to existing CS databases such as the Global Biodiversity Information Facility https://www.gbif.org/ (accessed on 28 December 2022) or Infoflora (in Switzerland) https://www.infoflora.ch/fr/ (accessed on 28 December 2022) projects. Because the objectives of this age group are aligned with–and better known as–those of CS, they have been modeled according to this nomination in the application’s use cases. The workshop led to the inclusion of the following features that allow users to achieve CS goals:
- (a)
- A feature for creating custom data attributes;
- (b)
- The possibility to create/edit POIs from the mobile interface;
- (c)
- The ability to import/export data (interoperability with other geoportals);
- (d)
- The ability to make ARLEs available/editable by everyone (wiki);
- (e)
- The possibility to switch rapidly between ARLEs, to use them as quiz/answer key.
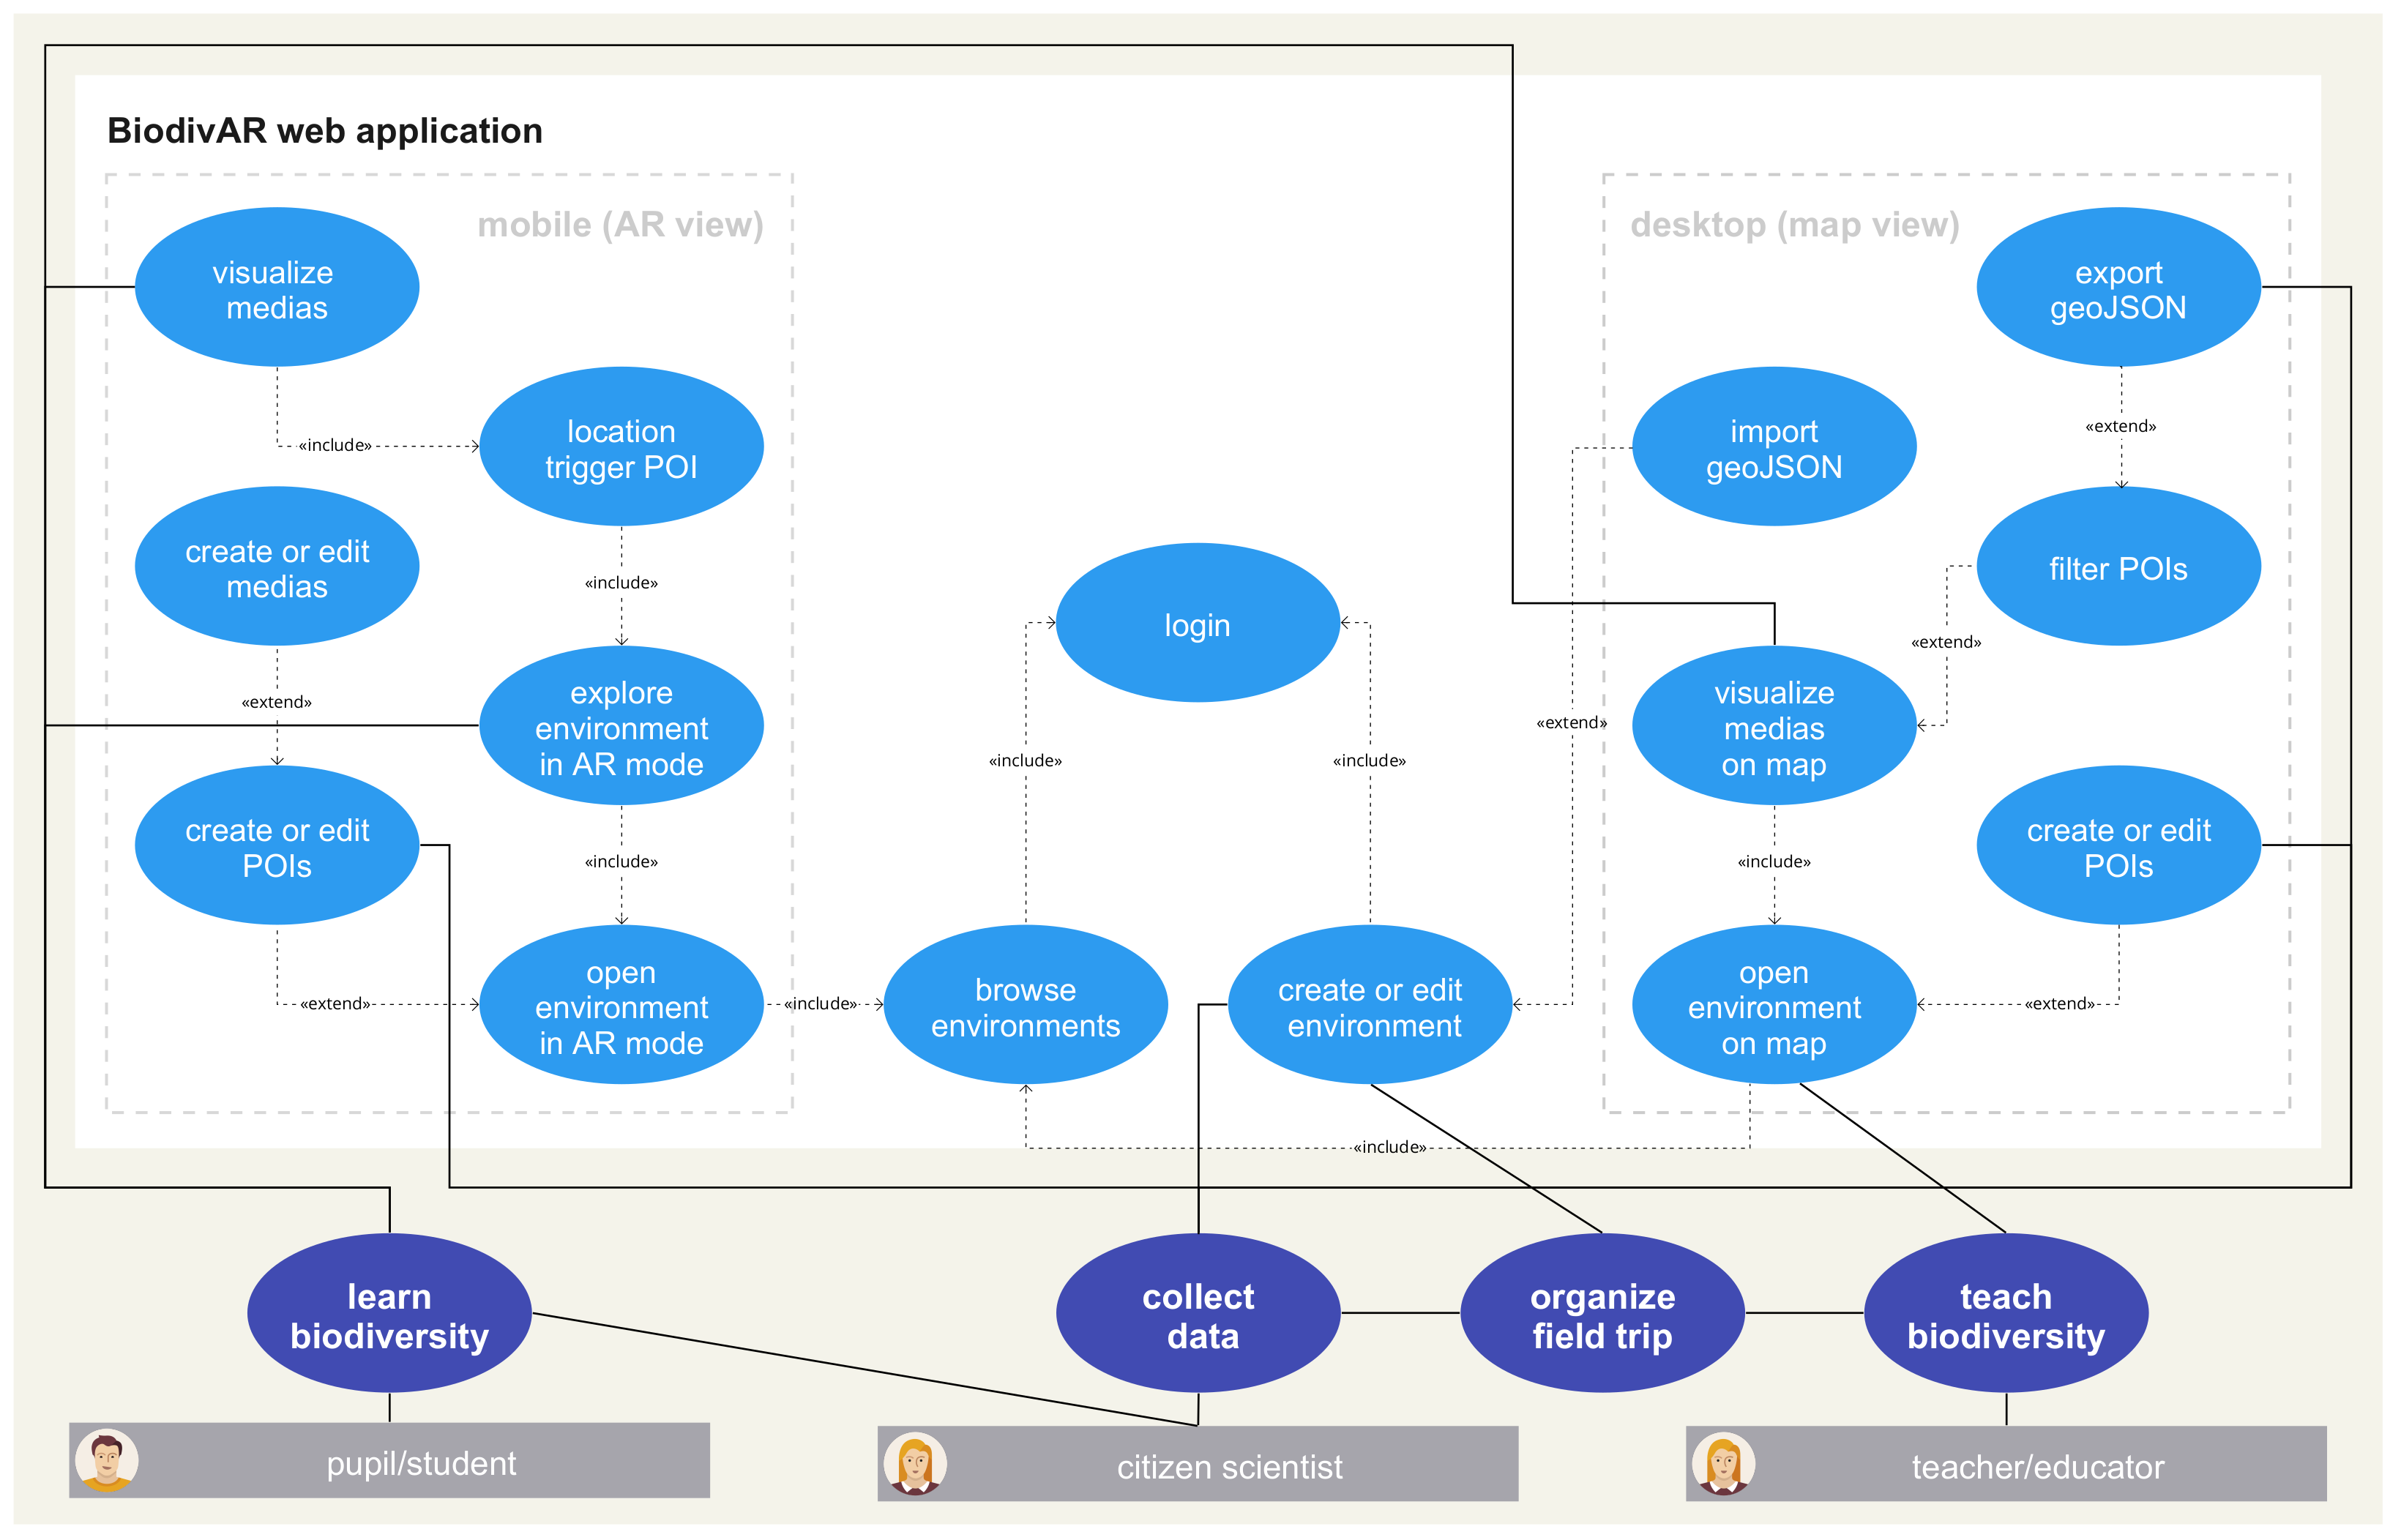
3.1.4. Use Cases
3.1.5. Rapid Prototyping and Ad Hoc Testing
3.1.6. Ideation
3.2. Architecture and Implementation
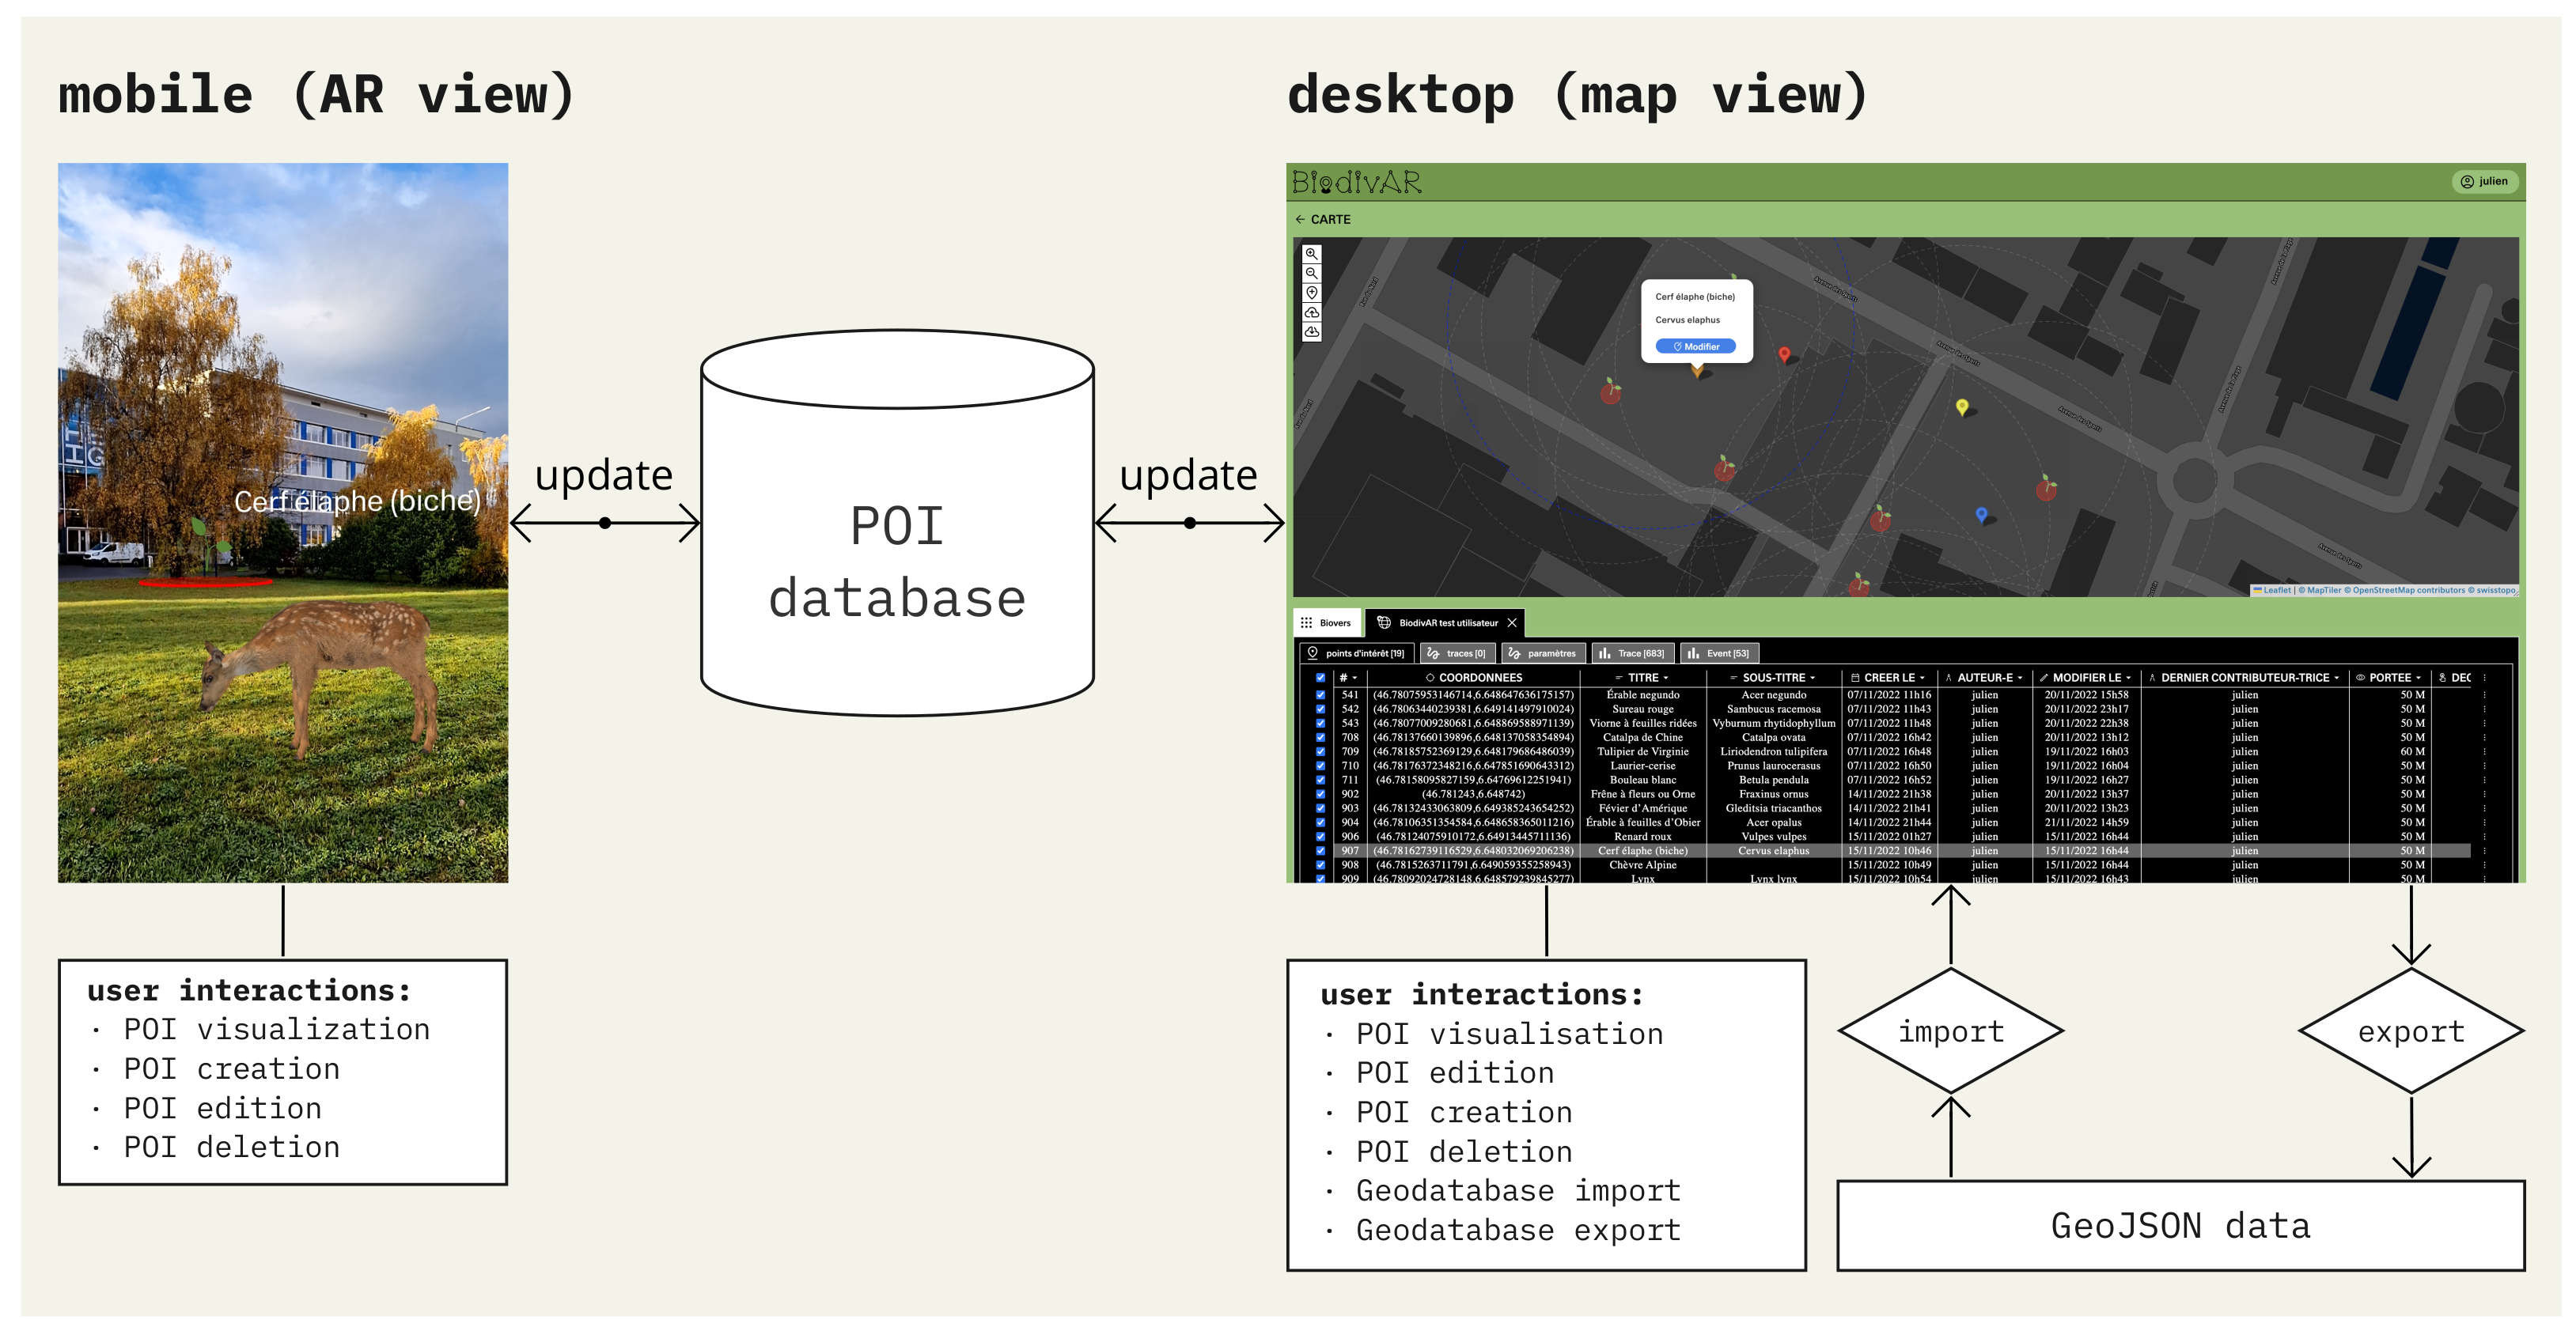
3.2.1. Concept
- 1.
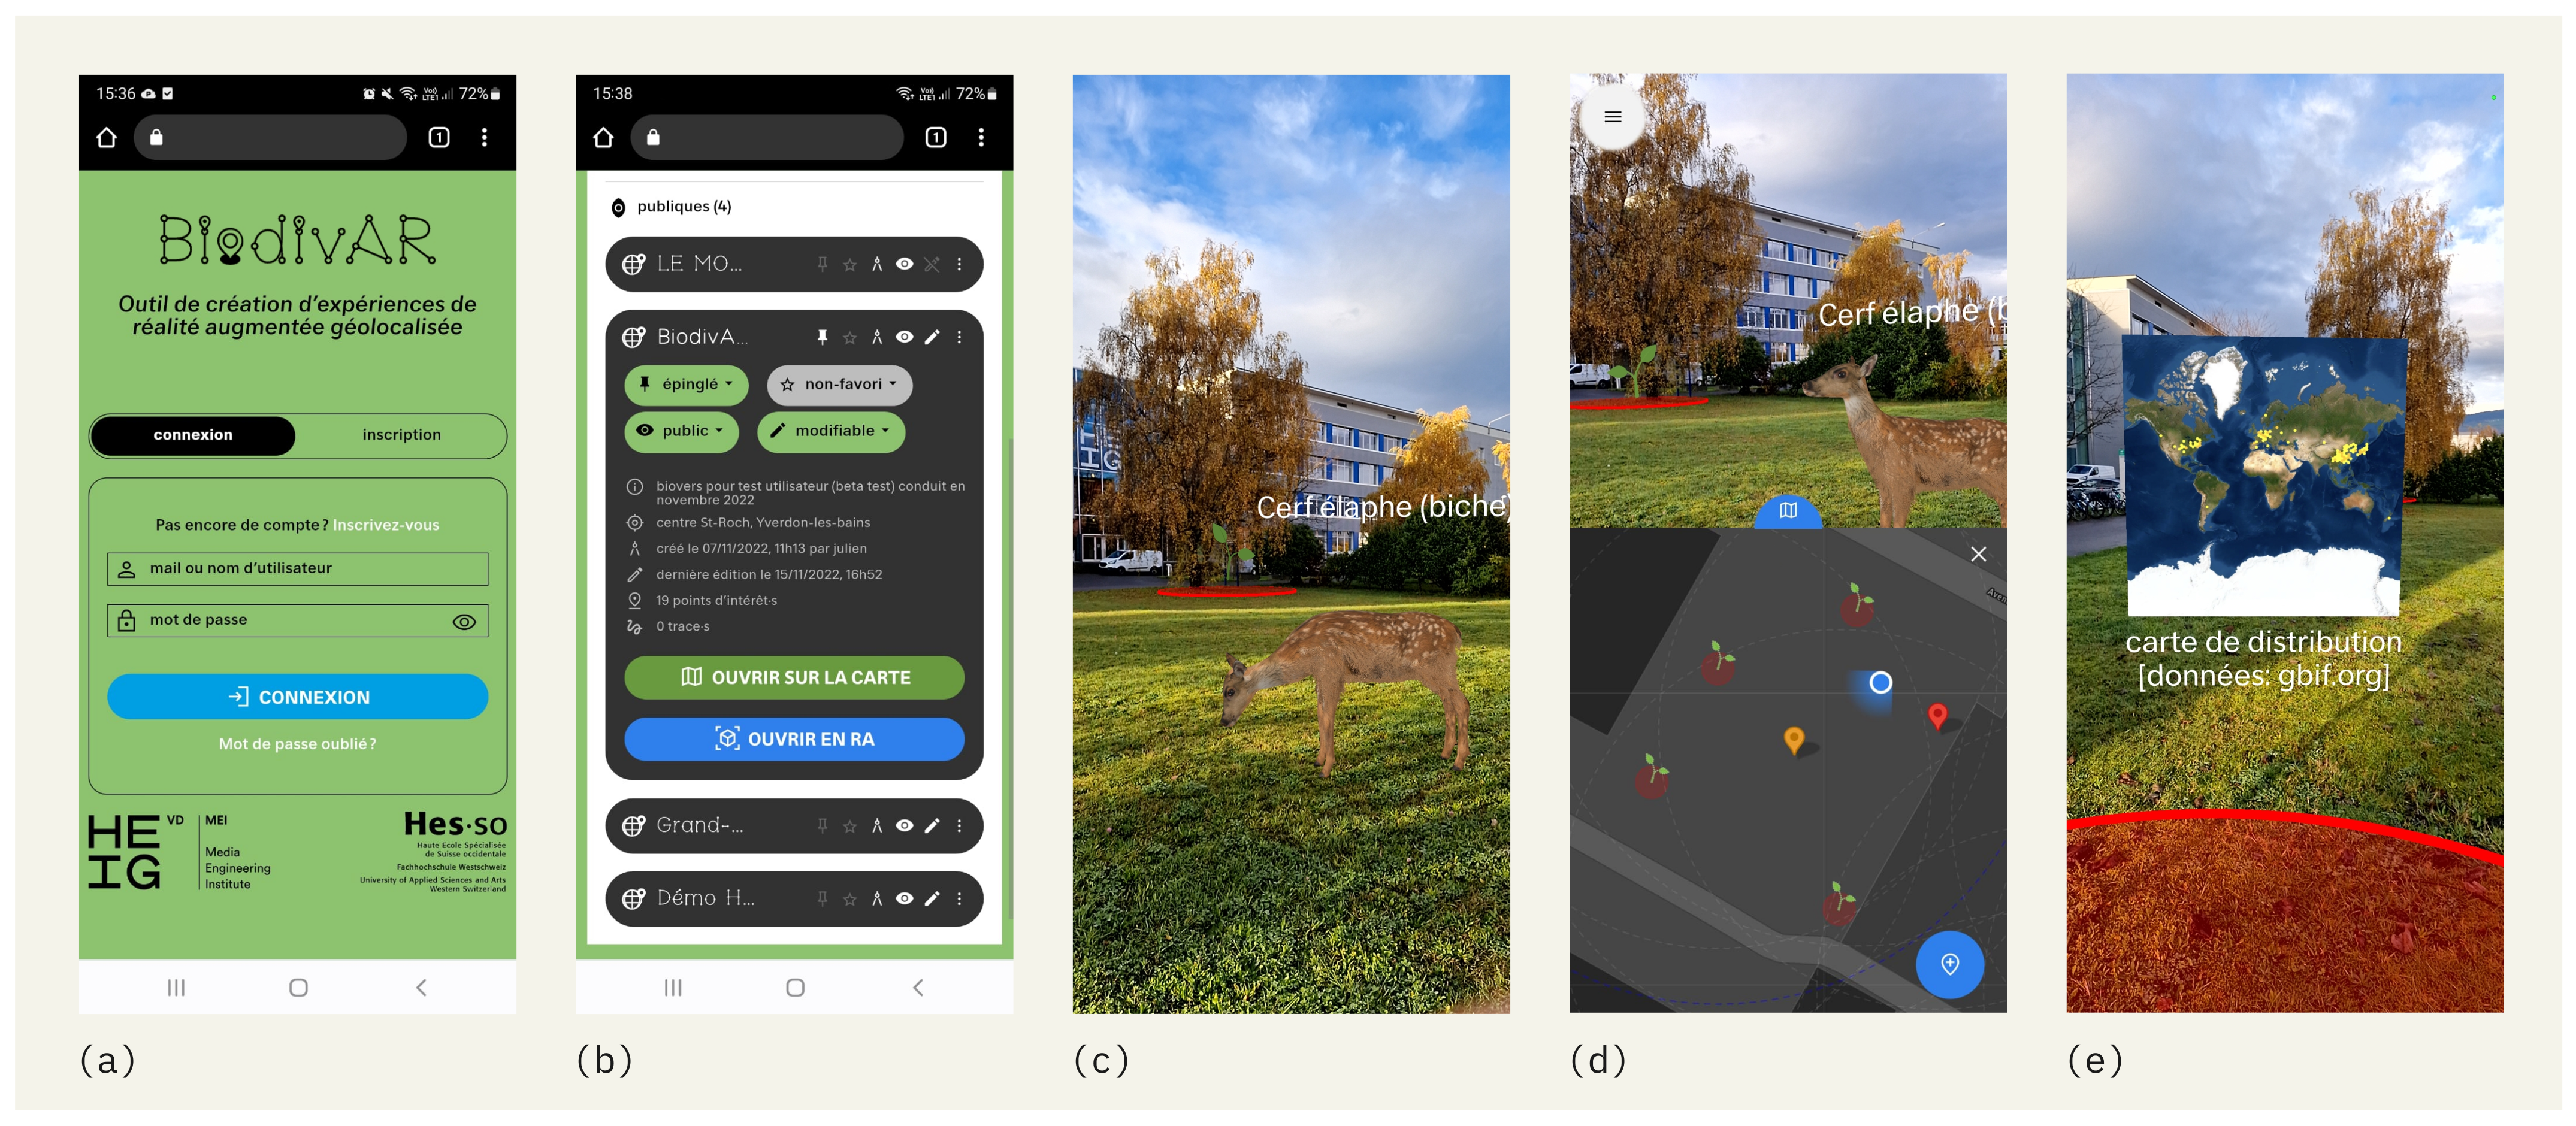
- A bioverse is an ARLE containing geolocated POIs. It can be created by any registered user and set to public or private. If public, it can be visited by any user. A bioverse may also be set to editable in order to allow users to contribute or edit its content, or non-editable to grant them visualization rights only. Bioverses can be exported as geoJSON files for archiving/re-importing, or to visualize and analyze their data in other geoportals. They can also be duplicated or deleted within the application. They have a title, a short description, and may be associated with a location to help grasp their range (i.e., “The World”, “Switzerland”, “Yverdon-les-Bains”, “my garden”, etc.). The managing of bioverses is meant to support various use cases, which came up during co-design sessions. A teacher could conceive several bioverses and assign them to different groups of students, or create one as a quiz and a second one as an answer key. Basically, it enables the creation of thematic virtual environments, and facilitates navigation across them, such as TV channels.
- 2.
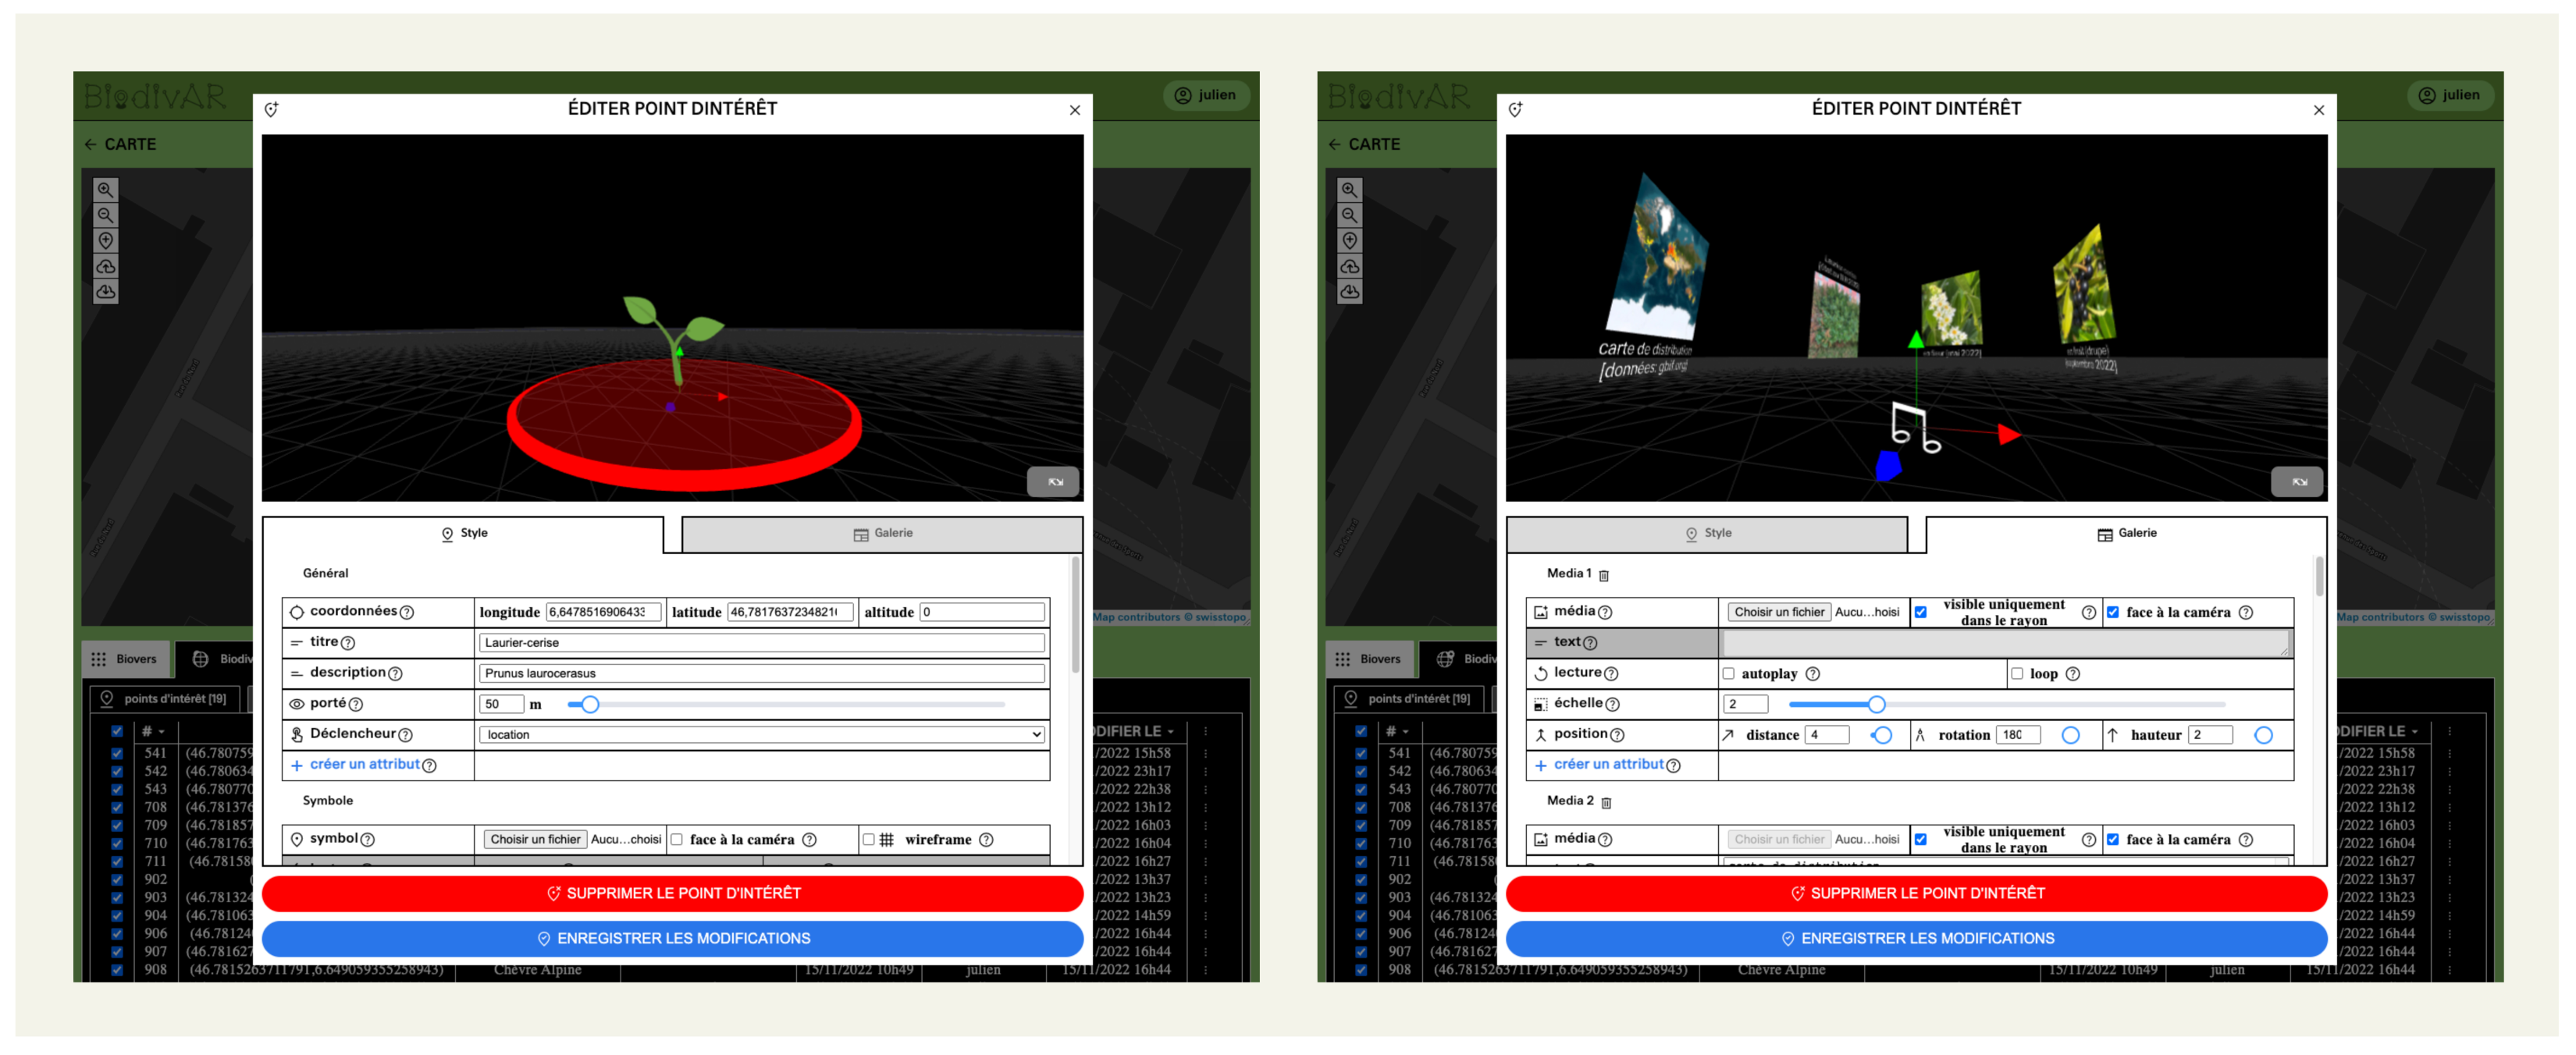
- A POI is a 3D scene anchored to a set of geographic coordinates. Users may add as many media (3D, audio, image files, texts) as they such as in the scene and position each one of them relative to the origin (= the geographic coordinates). The creator thus decides to present media separately or jointly to transmit information about a location, depending on what makes sense in a given situation. In AR mode, any media attached to the POI appears somewhat realistically, as if it belonged to the real world: it scales up or down as users approach or move away. A POI may also contain user-defined custom and stylistic attributes. Because the design of 3D/spatial cartographic symbols directly impacts usability, [46] our system allows users to customize 3D and 2D symbols to better suit their specific needs. Each POI needs to have a visibility/audibility scope (in meters): it is the distance from which the POI becomes visible/audible in AR mode. This allows authors to choose the best-fitting settings for any given scenario: where the visibility is short (urban zone or forest), POIs should not be visible from too far to avoid them overlapping with landscape components. Each POI also contains a radius (in meters), which is the distance within which users will trigger the visibility/audibility of additional media, depending on their attributes. The radius may be stylized (shape, size, stroke width, stroke color, fill color, elevation, animation) to be visible as a colored circle/cylinder/sphere/hemisphere in AR mode. This helps users realize when they “enter” a POI. While users are located within a POI’s radius, the tracking mode will stop relying on geolocation data and switch to WebXR immersive-AR mode’s tracking capabilities only, which rely on computer vision and inertial sensor data. This prevents jumpy geolocation data from kicking users out of a POI while they are visualizing media within it. A POI may also feature a 50 × 50 px image that will be displayed as a cartographic symbol on the 2D map.
- 3.
- A media can be a 3D file (gltf, glb), a picture (.jpg, .png), a sound file (.m4a, .mp3), or plain text that will be converted into a 3D mesh. Audio media can be set to play spatially or not and can be looped or only play once. Each media is imported individually in the POI editor and placed in space relatively to the origin, which is also the geographic coordinates the POI is anchored to. This flexibility allows users to create a wide range of POI types, from photo galleries to audio-only invisible ones. Each media can be set to be triggered by a user’s location at different thresholds:
- It can be visible/audible from the moment a user is within the “scope,” and disappear when they enter the “radius.” Use case: a 3D cartographic symbol; a sound-effect that plays when users enter/exit the “radius.”
- It can be invisible/silent until the user reaches the “radius”. Use case: a gallery of media about a specimen that should only be visible once users reach a specific area; a podcast that plays when users are facing a landmark).
- A media may be set to be visible/audible both within “scope” and “radius” (use case: a 3D symbol that should remain visible while another sound-based media is triggered at close range; an ambient spatial sound).
- In a more peripheral way, a media may be set to be invisible and silent at all times, when AR visualization features are not required. Use case: a CS data-collecting field trip.
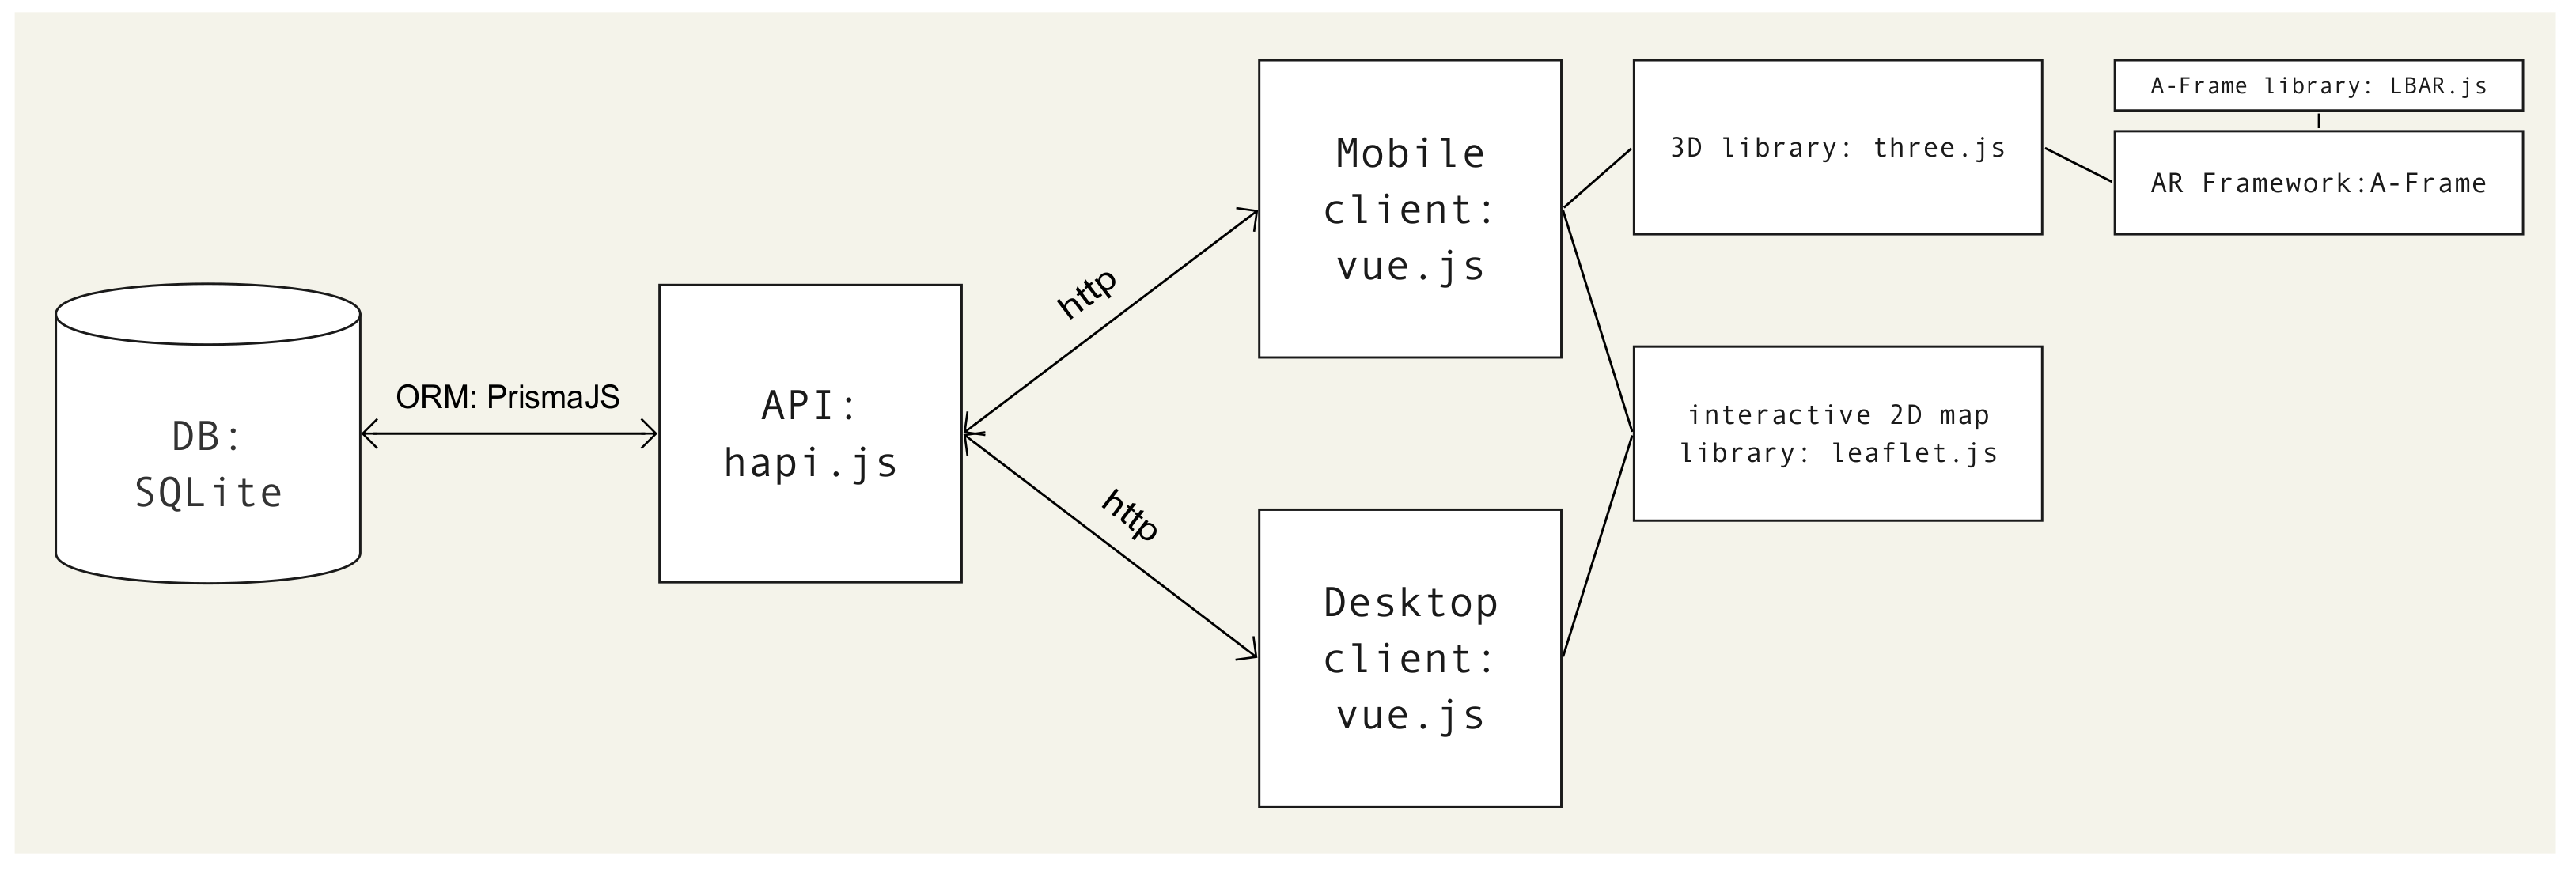
3.2.2. Tools, Frameworks and Standards
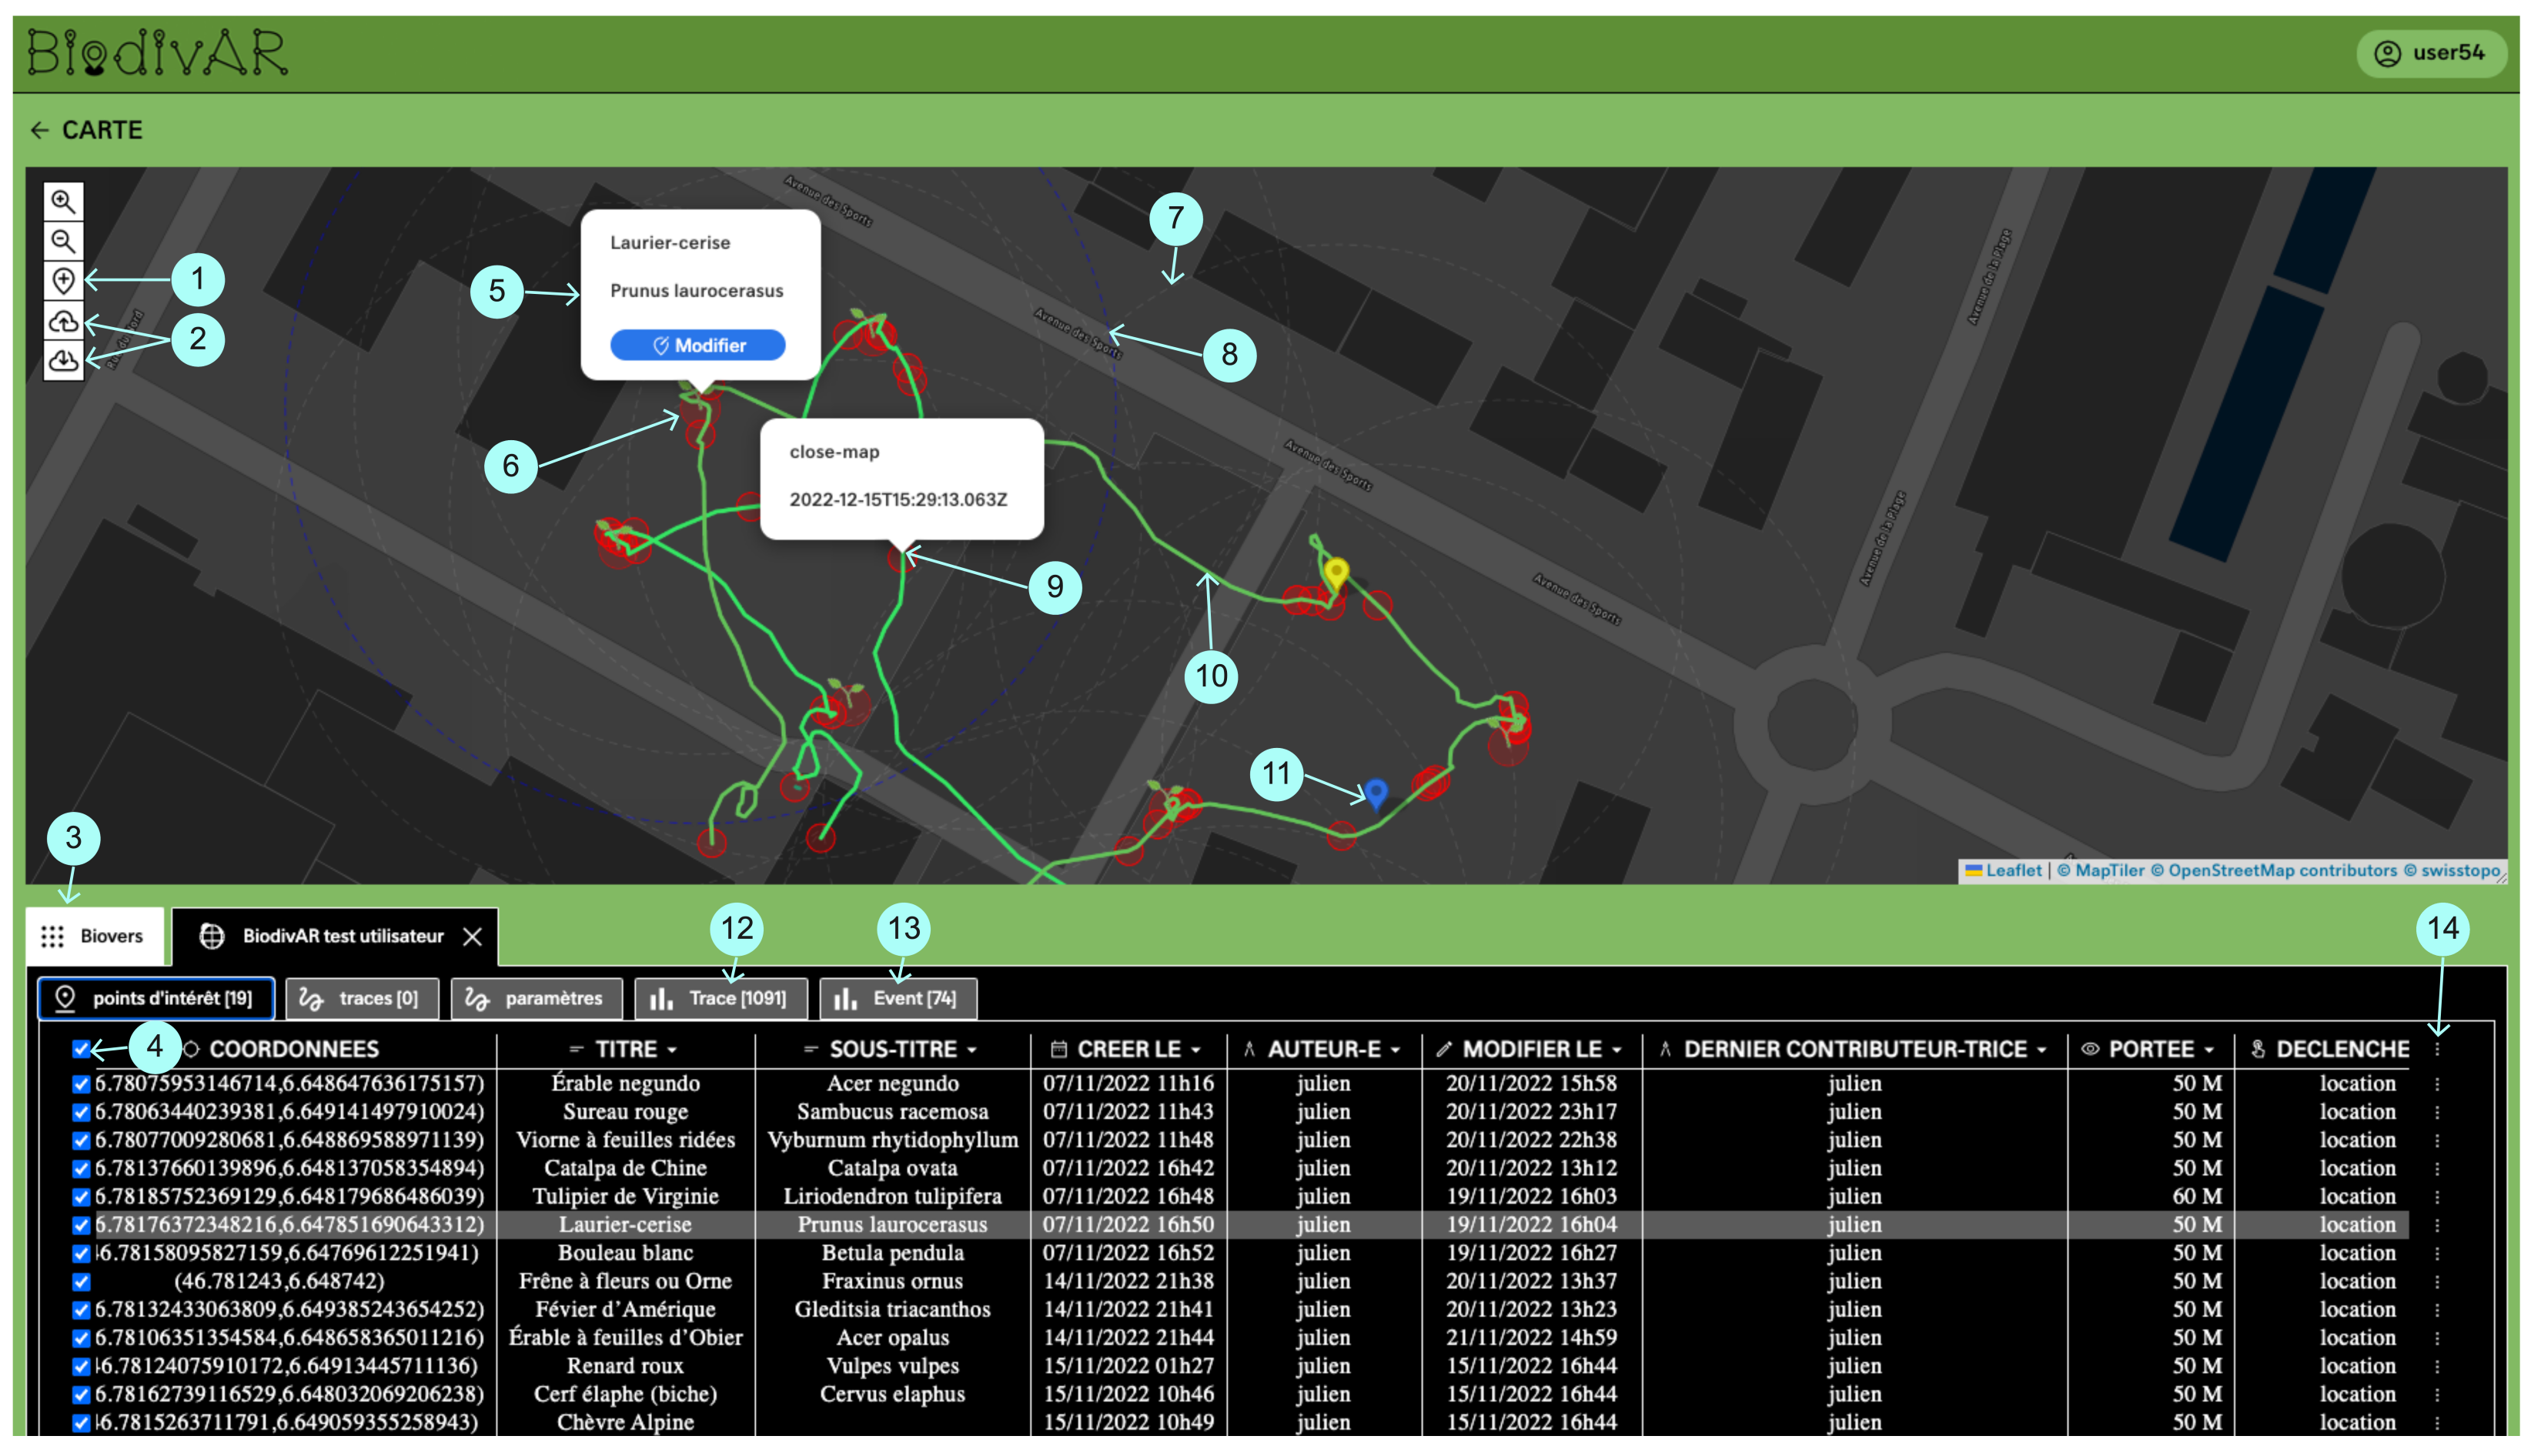
3.2.3. Desktop User Interface
3.2.4. Mobile User Interface
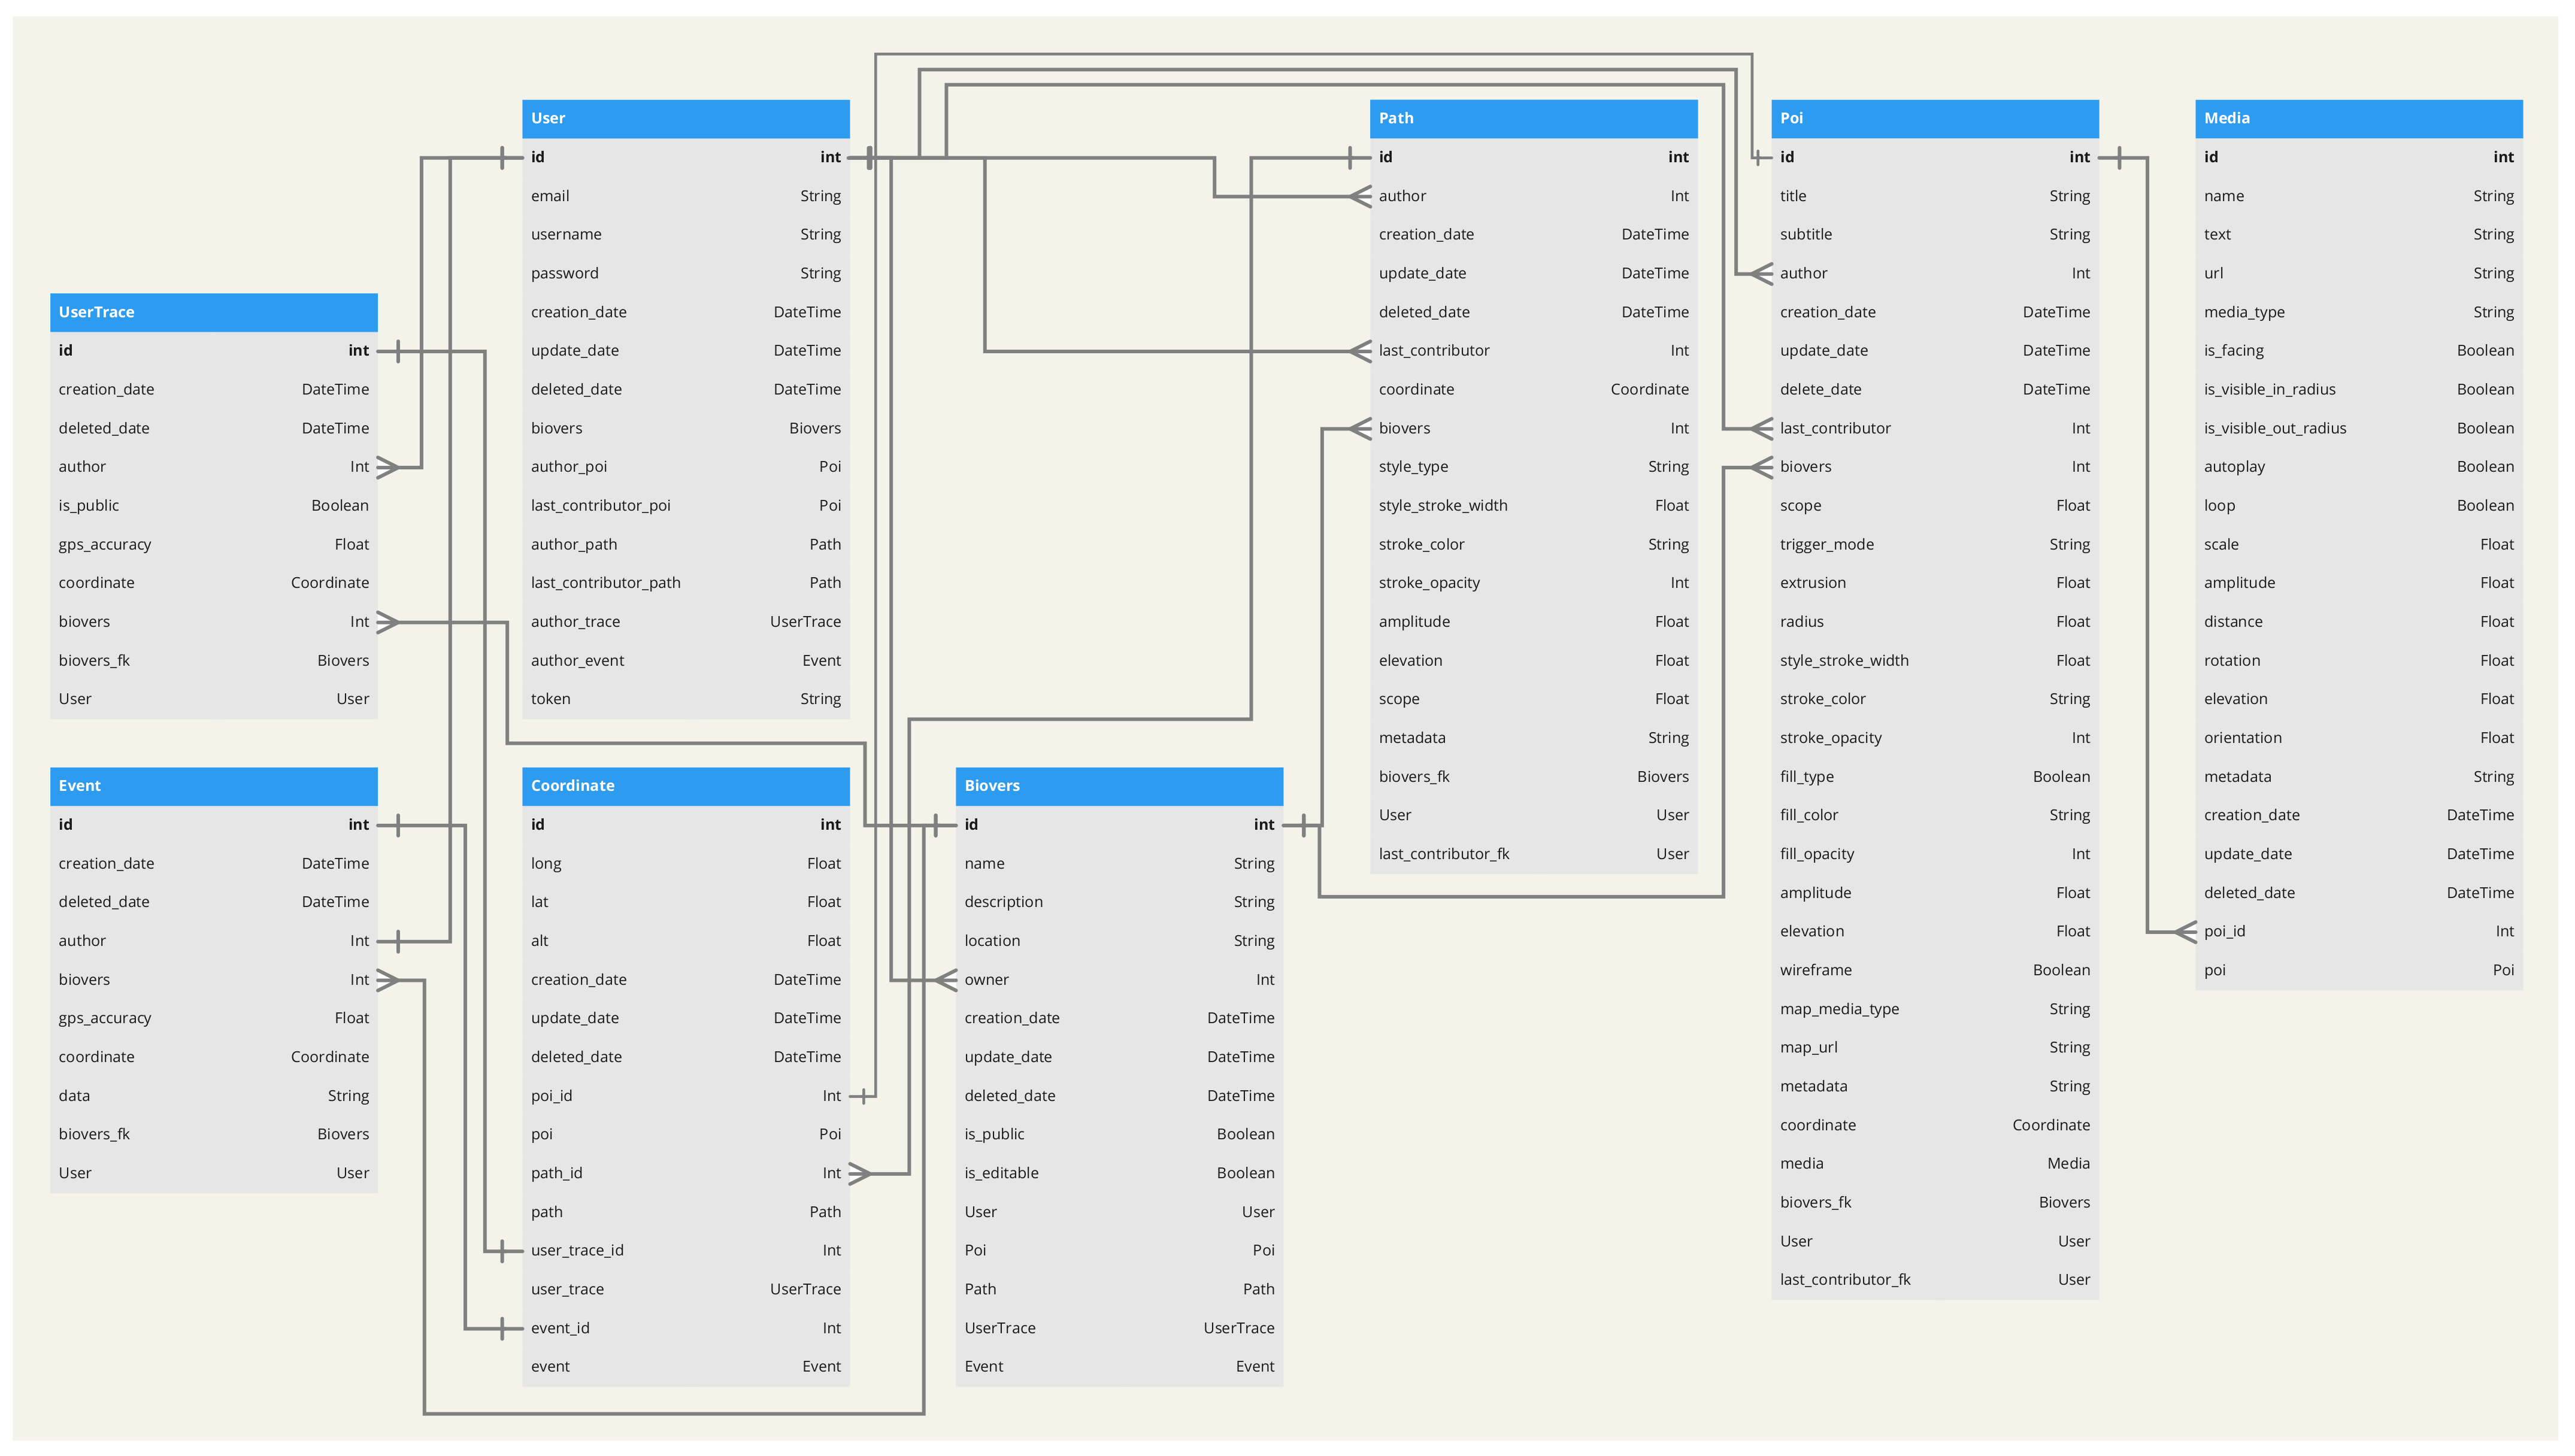
3.2.5. Database structure
- UserTrace: an object that stores the Coordinates of a given User at a given time rate. All logged Coordinates include a timestamp, the accuracy of the geolocation data, and the currently open Bioverse.
- Event: an object that stores user-triggered events while they are using the system in AR mode. All logged events include a timestamp, Coordinates and the accuracy of the measured location. There are eight types of logged events:
- –
- biovers-open|biovers-close: a user opens or closes a bioverse.
- –
- biovers-enter-poi-708|biovers-exit-poi-708: a user enters or exits the radius of a POI (+ POI id).
- –
- open-map|close-map: a user opens or closes the map while in AR mode.
- –
- create|update-poi-933: a user creates or edits a POI (+ POI id).
- User: an object that stores a User’s profile information (username, email, password…) and the bioverses, POIs and paths they have authored.
- Coordinate: an object that contains geographic coordinates (longitude, latitude, altitude). POI, Path, UserTrace, and Event all include a Coordinate object.
- Path: an object that contains a series of Coordinates that constitute a polyline entity in the A-Frame scene.
- POI: an object that contains Coordinates and Media that constitute a POI entity in the A-Frame scene.
- Media: an object that contains a media’s url (3D, sound, image, text) as well as its local coordinates relative to a POI’s geographic Coordinates.
- Bioverse: an object that contains all other objects as well as user-defined parameters defining the virtual environment’s visibility and editability to other users.
- POIs: a GeoJSON file that contains the data to build geolocated A-Frame point entities in the AR scene, including media URL and their positions relative to the geographic coordinates.
- Paths: a GeoJSON file that contains the data to build geolocated A-Frame polyline entities in the AR scene.
- Tracelog: a GeoJSON file that contains user-generated geographic coordinates of a user (at 1 Hz).
- Events: a GeoJSON file that contains user-generated events that are most of the possible interactions between a user and the system while in AR mode.
4. Geolocation Data Enhancement
4.1. Location-Based AR Bottleneck
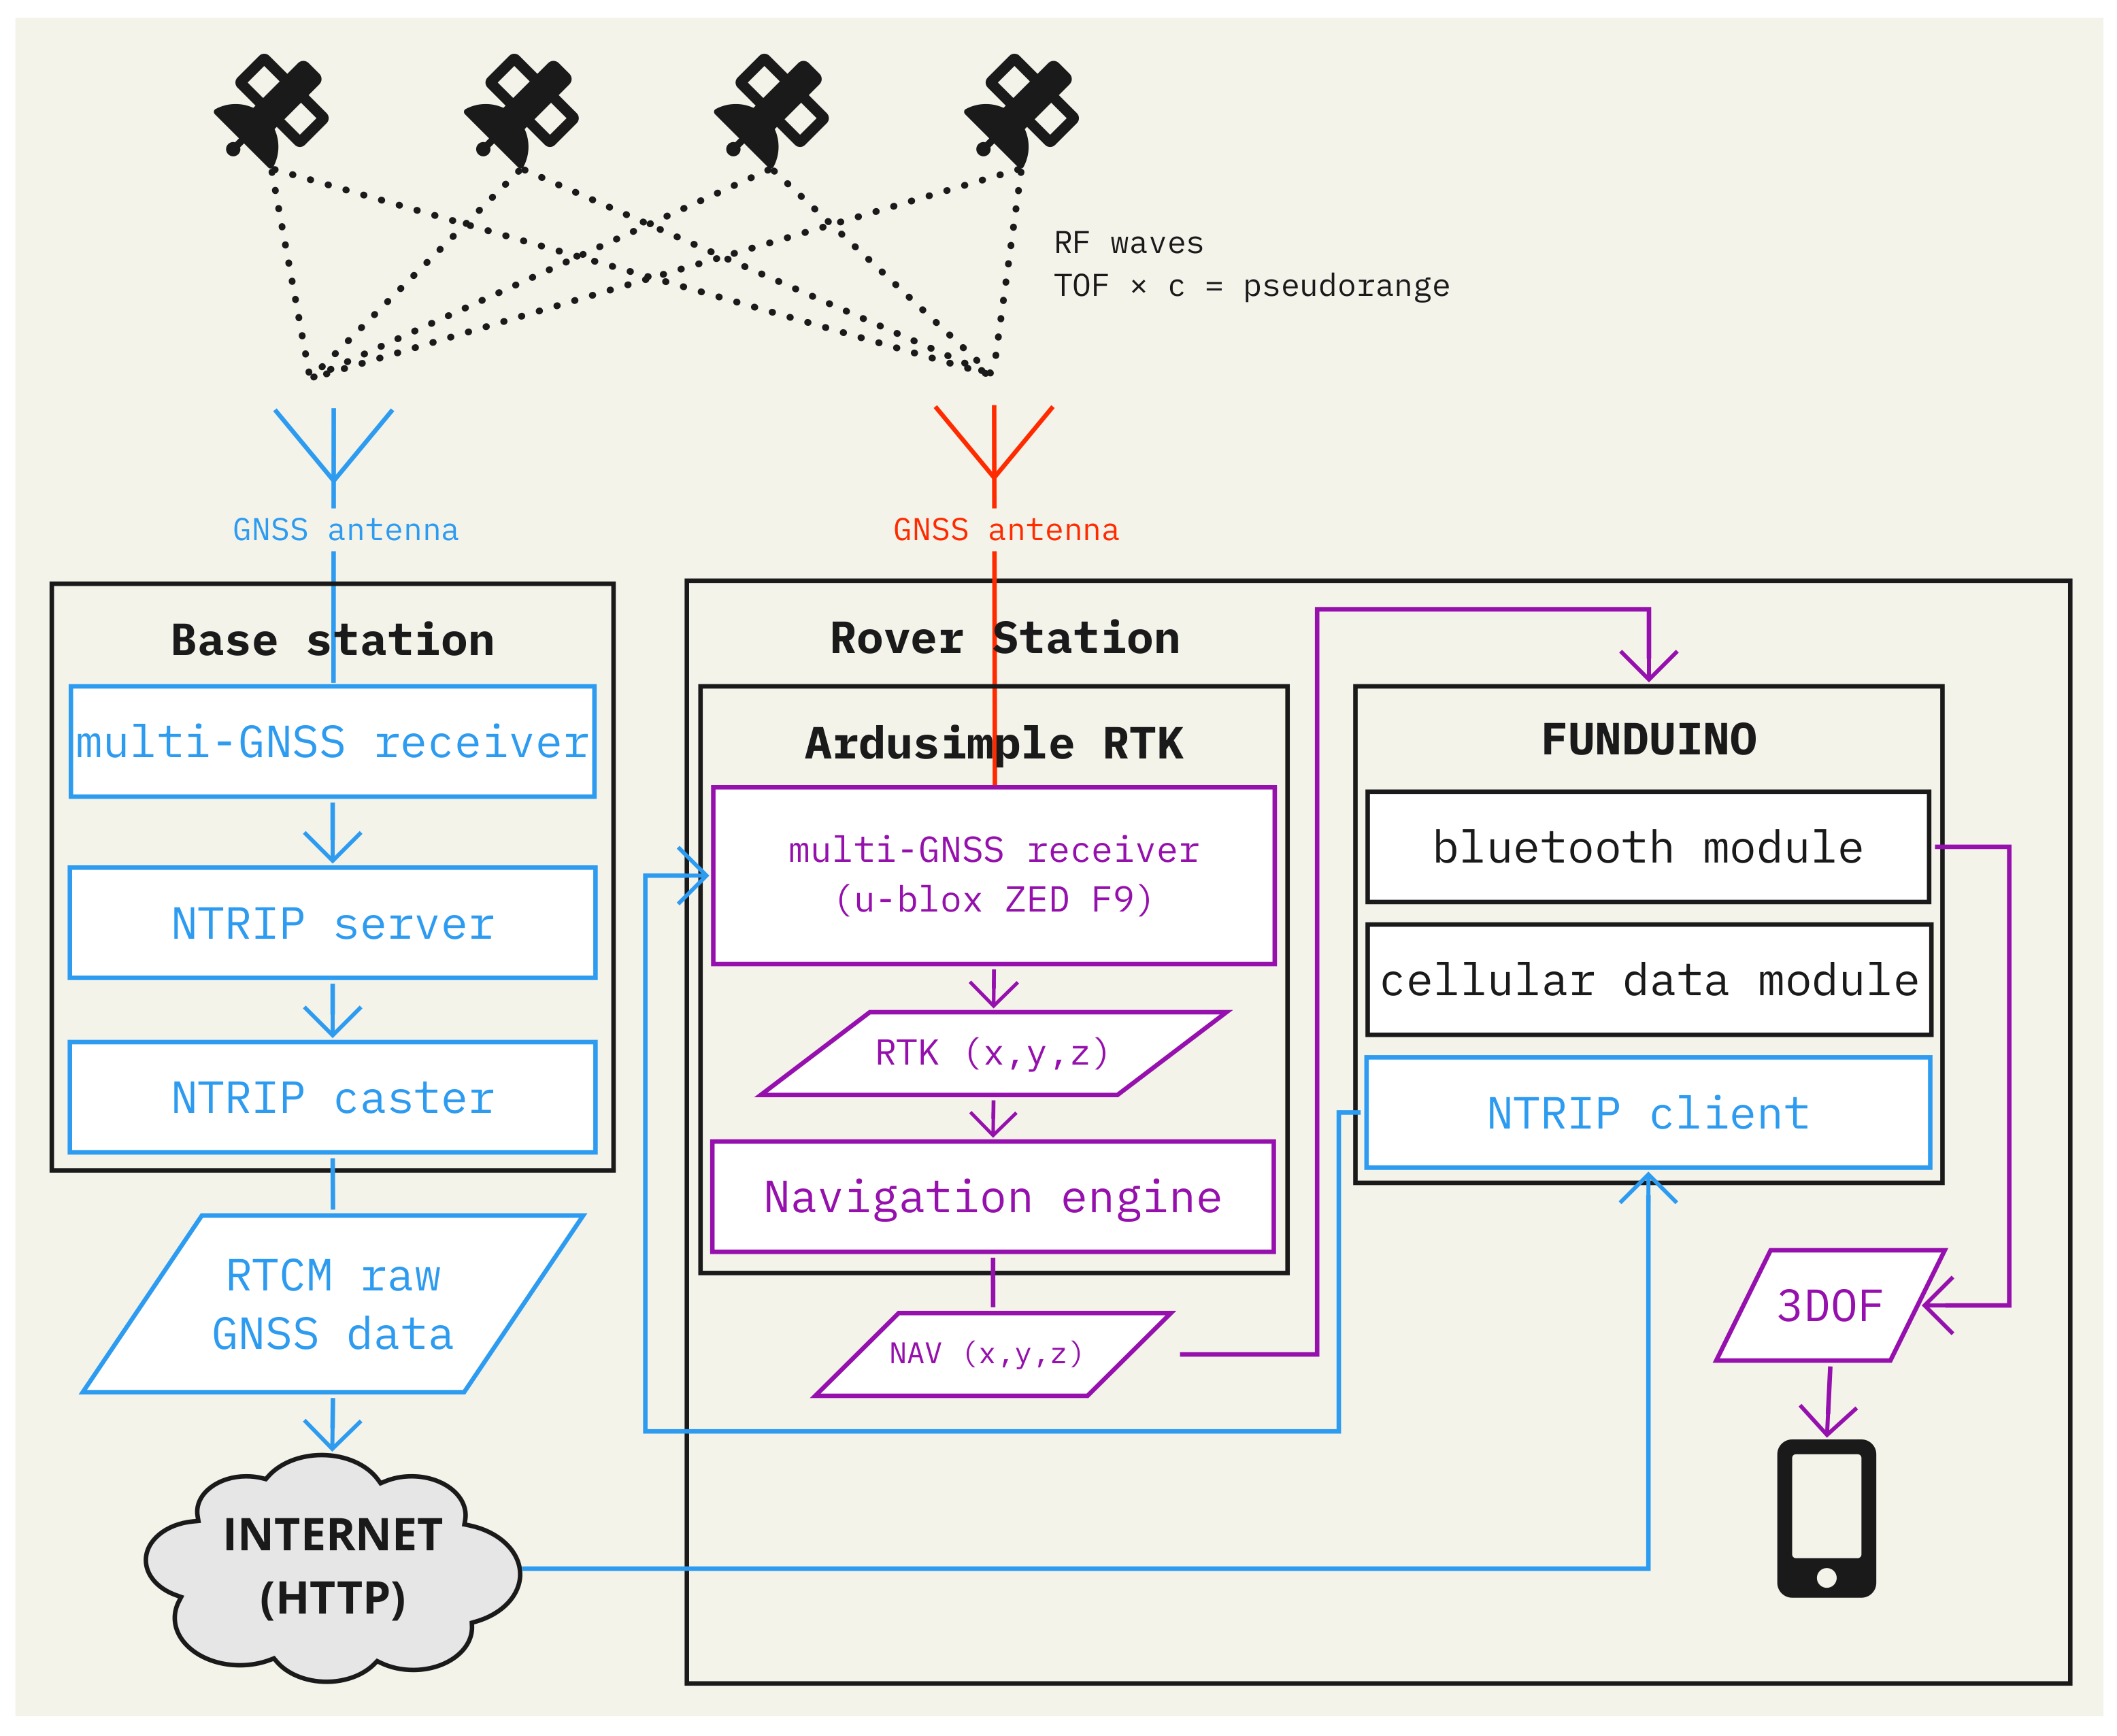
4.2. Geolocation Data Enhancement with RTK
4.2.1. Ardusimple RTK Surveyor Kit
4.2.2. Data Fusion: SLAM and GNSS
5. Proposed Methodology for Evaluation
Comparative User Test: Location-Based AR Combined with GNSS Versus RTK
- System Usability Scale (SUS), [55] for a generic evaluation of the system.
- User Experience Questionnaire (UEQ), [56] for a comprehensive measure of user experience in terms of attractiveness, efficiency, reliability, stimulation, and novelty.
- Handheld Augmented Reality Usability Scale (HARUS), [57] a mobile AR-specific questionnaire.
6. Conclusions
- 1.
- Firstly, the exclusive use of open-source frameworks makes it suitable for practices such as remote collaboration, co-creation and community development. These open-source tools and frameworks additionally comply with geographical and web standards, which enables data interoperability. In particular, the use of an actively emerging open web standard (WebXR) allows for easy maintenance and contributions from the web development community, which will allow the application to be progressively improved and enriched with new AR features. Beyond the open software elements that compose it, the system focuses on participation by the public by allowing anyone to contribute to the bioverse directory, making them discoverable and/or editable by other users, in the spirit of CS initiatives.
- 2.
- Secondly, focusing on problems and challenges identified in a previous—proof of concept—iteration [9] (AR usability; geolocation data accuracy; the lack of interaction with augmented objects; and the lack of a flexible authoring tool) allowed us to build on top of an existing knowledge base. By using a UCD methodology, we attempted to tailor the application to fit the needs and expectations of our target users. We introduce the use of an external RTK module to try and address the inaccuracy of geolocation data and the usability issues it induces. While the previous prototype had hard-coded geolocated POIs, the current application allows the creation or editing of augmented objects by unskilled users. The cartographic interface with online editing features makes it possible for anyone without advanced programming skills to create AR experiences. The data structure we conceptualized enables the creation and editing of advanced, customizable and interactive geolocated POIs.
- 3.
- Finally, we conducted a comparative test to assess our system’s usability and understand the impact of different geolocation data on usability. Eye-tracking data and geolocated traces will provide us with a multitude of unique points of view on how the application is actually used by participants. In a typical iterative design methodology, we will use user feedback to help us further refine and improve the application in a subsequent iteration.
Author Contributions
Funding
Informed Consent Statement
Data Availability Statement
Acknowledgments
Conflicts of Interest
Abbreviations
| API | Application Programming Interface |
| AR | Augmented Reality |
| ARLE | Augmented Reality Learning Environment |
| CS | Citizen science |
| GNSS | Global Navigation Satellite System |
| JSON | JavaScript object notation |
| ORM | Object–relational mapping |
| POI | Point of interest |
| RTCM | Radio Technical Commission for Maritime Services |
| RTK | Real-time kinematic positioning |
| SLAM | Simultaneous localization and mapping |
| UCD | User-Centered Design |
| UI | User Interface |
| UX | User experience |
| VPS | Visual Positioning System |
| WGS | World Geodetic System |
| 3DOF | Three degrees of freedom |
References
- Rubin, J.; Chisnell, D. Handbook of Usability Testing: How to Plan, Design, and Conduct Effective Tests, 2nd ed.; Wiley Pub: Indianapolis, IN, USA, 2008. [Google Scholar]
- Cubillo, J.; Martin, S.; Castro, M.; Boticki, I. Preparing augmented reality learning content should be easy: UNED ARLE-an authoring tool for augmented reality learning environments. Comput. Appl. Eng. Educ. 2015, 23, 778–789. [Google Scholar] [CrossRef]
- Rosenbaum, E.; Klopfer, E.; Perry, J. On Location Learning: Authentic Applied Science with Networked Augmented Realities. J. Sci. Educ. Technol. 2007, 16, 31–45. [Google Scholar] [CrossRef]
- Chiang, T.H.C.; Yang, S.J.H.; Hwang, G.J. An Augmented Reality-based Mobile Learning System to Improve Students’ Learning Achievements and Motivations in Natural Science Inquiry Activities. J. Educ. Technol. Soc. 2014, 17, 352–365. [Google Scholar]
- Dunleavy, M.; Dede, C.; Mitchell, R. Affordances and Limitations of Immersive Participatory Augmented Reality Simulations for Teaching and Learning. J. Sci. Educ. Technol. 2009, 18, 7–22. [Google Scholar] [CrossRef]
- Facer, K.; Joiner, R.; Stanton, D.; Reid, J.; Hull, R.; Kirk, D. Savannah: Mobile gaming and learning?: Mobile gaming and learning. J. Comput. Assist. Learn. 2004, 20, 399–409. [Google Scholar] [CrossRef]
- Perry, J.; Klopfer, E.; Norton, M.; Sutch, D.; Sandford, R.; Facer, K. AR gone wild: Two approaches to using augmented reality learning games in Zoos. In Proceedings of the 8th on International conference for the Learning Sciences, Utrecht, The Netherlands, 24–28 June 2008; Volume 3, pp. 322–329. [Google Scholar]
- Ryokai, K.; Agogino, A. Off the paved paths: Exploring nature with a mobile augmented reality learning tool. J. Mob. Hum. Comput. Interact. 2013, 5, 21–49. [Google Scholar] [CrossRef]
- Ingensand, J.; Lotfian, M.; Ertz, O.; Piot, D.; Composto, S.; Oberson, M.; Oulevay, S.; Da Cunha, M. Augmented reality technologies for biodiversity education—A case study. In Proceedings of the 21st Conference on Geo-Information Science, AGILE, Lund, Sweden, 12–15 June 2018. [Google Scholar]
- Admiraal, W.; Huizenga, J.; Akkerman, S.; Dam, G.T. The concept of flow in collaborative game-based learning. Comput. Hum. Behav. 2009, 27, 1185–1194. [Google Scholar] [CrossRef]
- Lee, G.; Duenser, A.; Kim, S.; Billinghurst, M. CityViewAR: A Mobile Outdoor AR Application for City visualization. In Proceedings of the 2012 IEEE International Symposium on Mixed and Augmented Reality—Arts, Media and Humanities (ISMAR-AMH), Media, Atlanta, GA, USA, 5–8 November 2012 ; p. 64. [Google Scholar] [CrossRef]
- Azuma, R.T. A Survey of Augmented Reality. Presence: Teleoperators and Virtual Environ. Presence: Teleoperators and Virtual Environments 1997, 6, 355–385. [Google Scholar] [CrossRef]
- Geroimenko, V. Augmented Reality in Education: A New Technology for Teaching and Learning; Springer International Publishing: Berlin/Heidelberg, Germany, 2020. [Google Scholar]
- Lee, S.; Choi, J.; Park, J.I. Interactive E-Learning System Using Pattern Recognition and Augmented Reality. IEEE Trans. Consum. Electron. 2009, 55, 883–890. [Google Scholar] [CrossRef]
- Alnagrat, A.; Ismail, R.; Syed Idrus, S.Z. A Review of Extended Reality (XR) Technologies in the Future of Human Education: Current Trend and Future Opportunity. J. Hum. Reprod. Sci. 2022, 1, 81–96. [Google Scholar] [CrossRef]
- Martin, S.; Diaz, G.; Sancristobal, E.; Gil, R.; Castro, M.; Peire, J. New technology trends in education: Seven years of forecasts and convergence. Comput. Educ. 2011, 57, 1893–1906. [Google Scholar] [CrossRef]
- Antonioli, M.; Blake, C.; Sparks, K. Augmented Reality Applications in Education. J. Technol. Stud. 2014, 40, 96–107. [Google Scholar] [CrossRef]
- Diegmann, P.; Schmidt-Kraepelin, M.; Eynden, S.; Basten, D. Benefits of Augmented Reality in Educational Environments— A Systematic Literature Review. Wirtsch. Proc. 2015, 2015, 103. [Google Scholar]
- Bacca, J.; Baldiris, S.; Fabregat, R.; Graf, S.; Kinshuk. Augmented Reality Trends in Education: A Systematic Review of Research and Applications. J. Educ. Technol. Soc. 2014, 17, 133–149. [Google Scholar]
- Garzón, J.; Acevedo, J. Meta-analysis of the impact of Augmented Reality on students’ learning gains. Educ. Res. Rev. 2019, 27, 244–260. [Google Scholar] [CrossRef]
- Georgiou, Y.; Kyza, E.A. Relations between student motivation, immersion and learning outcomes in location-based augmented reality settings. Comput. Hum. Behav. 2018, 89, 173–181. [Google Scholar] [CrossRef]
- Cabiria, J. Augmenting Engagement: Augmented Reality in Education. Cut. Edge Technol. High. Educ. 2012, 6, 225–251. [Google Scholar] [CrossRef]
- Dede, C. Immersive Interfaces for Engagement and Learning. Science 2009, 323, 66–69. [Google Scholar] [CrossRef]
- Raber, J.; Ferdig, R.; Gandolfi, E.; Clements, R. An analysis of motivation and situational interest in a location-based augmented reality application. Interact. Des. Archit. 2022, 52, 198–220. [Google Scholar] [CrossRef]
- Medyńska-Gulij, B.; Zagata, K. Experts and Gamers on Immersion into Reconstructed Strongholds. ISPRS Int. J. Geo-Inf. 2020, 9, 655. [Google Scholar] [CrossRef]
- Arvola, M.; Fuchs, I.E.; Nyman, I.; Szczepanski, A. Mobile Augmented Reality and Outdoor Education. Built Environ. 2021, 47, 223–242. [Google Scholar] [CrossRef]
- Chiang, T.H.C.; Yang, S.J.H.; Hwang, G.J. Students’ online interactive patterns in augmented reality-based inquiry activities. Comput. Educ. 2014, 78, 97–108. [Google Scholar] [CrossRef]
- Barclay, L. Acoustic Ecology and Ecological Sound Art: Listening to Changing Ecosystems. In Sound, Media, Ecology; Droumeva, M., Jordan, R., Eds.; Palgrave Studies in Audio-Visual Culture; Springer International Publishing: Berlin/Heidelberg, Germany, 2010; pp. 153–177. [Google Scholar] [CrossRef]
- O’Shea, P.M.; Dede, C.; Cherian, M. Research Note: The Results of Formatively Evaluating an Augmented Reality Curriculum Based on Modified Design Principles. Int. J. Gaming Comput. Mediat. Simulat. 2011, 3, 57–66. [Google Scholar] [CrossRef]
- Bloom, M.A.; Holden, M.; Sawey, A.T.; Weinburgh, M.H. Promoting the Use of Outdoor Learning Spaces by K-12 Inservice Science Teachers Through an Outdoor Professional Development Experience. In The Inclusion of Environmental Education in Science Teacher Education; Bodzin, A.M., Shiner Klein, B., Weaver, S., Eds.; Springer: Dodreht, The Netherlands, 2010; pp. 97–110. [Google Scholar] [CrossRef]
- Capps, D.K.; Crawford, B.A. Inquiry-Based Instruction and Teaching About Nature of Science: Are They Happening? J. Sci. Teach. Educ. 2013, 24, 497–526. [Google Scholar] [CrossRef]
- Bitter, G. The Pedagogical Potential of Augmented Reality Apps. Int. J. Eng. Sci. Invent. 2014, 3, 13–17. [Google Scholar]
- Rauschnabel, P.A.; Rossmann, A.; tom Dieck, M.C. An adoption framework for mobile augmented reality games: The case of Pokémon Go. Comput. Hum. Behav. 2017, 76, 276–286. [Google Scholar] [CrossRef]
- Althoff, T.; White, R.W.; Horvitz, E. Influence of Pok\’emon Go on Physical Activity: Study and Implications. arXiv 2016, arXiv:1610.02085. [Google Scholar] [CrossRef]
- Bressler, D.M.; Bodzin, A.M. A mixed methods assessment of students’ flow experiences during a mobile augmented reality science game. J. Comput. Assist. Learn. 2013, 29, 505–517. [Google Scholar] [CrossRef]
- Debandi, F.; Iacoviello, R.; Messina, A.; Montagnuolo, M.; Manuri, F.; Sanna, A.; Zappia, D. Enhancing cultural tourism by a mixed reality application for outdoor navigation and information browsing using immersive devices. IOP Conf. Ser. Mater. Sci. Eng. 2018, 364, 012048. [Google Scholar] [CrossRef]
- Alakärppä, I.; Jaakkola, E.; Väyrynen, J.; Häkkilä, J. Using nature elements in mobile AR for education with children. In Proceedings of the 19th International Conference on Human–Computer Interaction with Mobile Devices and Services, Association for Computing Machinery, MobileHCI ’17, Vienna, Austria, 4–7 September 2017; pp. 1–13. [Google Scholar] [CrossRef]
- Eliasson, J.; Knutsson, O.; Ramberg, R.; Cerratto-Pargman, T. Using Smartphones and QR Codes for Supporting Students in Exploring Tree Species. In Proceedings of the Scaling up Learning for Sustained Impact; Lecture Notes in Computer Science; Hernández-Leo, D., Ley, T., Klamma, R., Harrer, A., Eds.; Springer: Berlin/Heidelberg, 2013; pp. 436–441. [Google Scholar] [CrossRef]
- Goth, C.; Frohberg, D.; Schwabe, G. The Focus Problem in Mobile Learning. In Proceedings of the 2006 Fourth IEEE International Workshop on Wireless, Mobile and Ubiquitous Technology in Education (WMTE’06), Athens, Greece, 16–17 November 2006; pp. 153–160. [Google Scholar] [CrossRef]
- Cimbali, F. Adaptation de l’application BioSentiers pour une utilisation pédagogique [Bachelor thesis]. School of Engineering and Management Vaud, HES-SO University of Applied Sciences and Arts Western Switzerland. 2018. Available online: http://tb.heig-vd.ch/6531 (accessed on 28 December 2022).
- Potvin, P.; Hasni, A. Analysis of the Decline in Interest Towards School Science and Technology from Grades 5 Through 11. J. Sci. Educ. Technol. 2014, 23, 784–802. [Google Scholar] [CrossRef]
- Lenhart, A.; Ling, R.; Campbell, S.; Purcell, K. Teens and Mobile Phones; Technical Report; Pew Research Center’s Internet & American Life Project: Washington, DC, USA, 2010. [Google Scholar]
- Tripp, S.; Bichelmeyer, B. Rapid Prototyping: An Alternative Instructional Design Strategy. Educ. Technol. Res. Dev. 1990, 38, 31–44. [Google Scholar] [CrossRef]
- Gagnon, D. ARIS: An Open Source Platform for Developing Mobile Learning Experiences [Computer Software]. Madison, WI: Field Day Lab. 2020. Available online: https://fielddaylab.org/make/aris/ (accessed on 28 December 2022).
- Mercier, J.; León, L. edTech, réalité augmentée et exploration. Educateur 2021, 10. Available online: https://www.le-ser.ch/lecole-dehors-vers-une-pedagogie-du-rapport-au-monde (accessed on 28 December 2022).
- Halik, Ł.; Medyńska-Gulij, B. The Differentiation of Point Symbols using Selected Visual Variables in the Mobile Augmented Reality System. Cartogr. J. 2017, 54, 147–156. [Google Scholar] [CrossRef]
- Carpignoli, N. AR.js Studio: An Authoring Platform to Build Web Augmented Reality Experiences [Computer Software]. 2020. Available online: https://ar-js-org.github.io/studio/ (accessed on 28 December 2022).
- Chabloz, N. LBAR.js: A Minimalist Library for Creating WebXR Location-Based Markers with A-Frame [Computer software]. 2020. Available online: https://github.com/MediaComem/LBAR.js/ (accessed on 28 December 2022).
- Butler, H.; Daly, M.; Doyle, A.; Gillies, S.; Schaub, T.; Hagen, S. The GeoJSON Format. Request for Comments RFC 7946, Internet Engineering Task Force. 2016, p. 28. Available online: https://www.rfc-editor.org/info/rfc7946 (accessed on 28 December 2022). [CrossRef]
- GPS.gov: Official U.S. Government Information about the Global Positioning System (GPS) and Related Topics [Internet Website]. Available online: https://www.gps.gov (accessed on 28 December 2022).
- Abdi, E.; Mariv, H.S.; Deljouei, A.; Sohrabi, H. Accuracy and precision of consumer-grade GPS positioning in an urban green space environment. For. Sci. Technol. 2014, 10, 141–147. [Google Scholar] [CrossRef]
- Morar, A.; Băluţoiu, M.A.; Moldoveanu, A.; Moldoveanu, F.; Butean, A.; Asavei, V. Evaluation of the ARCore Indoor Localization Technology. In Proceedings of the 2020 19th RoEduNet Conference: Networking in Education and Research (RoEduNet), Bucharest, Romania, 11–12 December 2020; pp. 1–5443. [Google Scholar] [CrossRef]
- ArduSimple: RTK Handheld Kit [Internet Website]. Available online: https://www.ardusimple.com/product/rtk-handheld-surveyor-kit/ (accessed on 28 December 2022).
- Renaudin, V.; Afzal, M.; Lachapelle, G. Magnetic perturbations detection and heading estimation using magnetometers. J. Locat. Based Serv. 2012, 6, 161–185. [Google Scholar] [CrossRef]
- Brooke, J. Usability Evaluation In Industry. SUS: A ’Quick and Dirty’ Usability Scale; CRC Press: Boca Raton, FL, USA, 1996; pp. 207–212. [Google Scholar] [CrossRef]
- Construction and Evaluation of a User Experience Questionnaire. Available online: https://www.researchgate.net/publication/221217803_Construction_and_Evaluation_of_a_User_Experience_Questionnaire (accessed on 28 December 2022).
- Santos, M.E.; Polvi, J.; Taketomi, T.; Yamamoto, G.; Sandor, C.; Kato, H. Toward Standard Usability Questionnaires for Handheld Augmented Reality. IEEE Comput. Graph. Appl. 2015, 35, 66–75. [Google Scholar] [CrossRef]
- Google. Build Global-Scale, Immersive, Location-Based AR Experiences with the ARCore Geospatial API [Computer Software]. 2022. Available online: https://developers.google.com/ar/develop/geospatial (accessed on 28 December 2022).
- Medyńska-Gulij, B.; Wielebski, Ł.; Halik, Ł.; Smaczyński, M. Complexity Level of People Gathering Presentation on an Animated Map—Objective Effectiveness Versus Expert Opinion. ISPRS Int. J. Geo-Inf. 2020, 9, 117. [Google Scholar] [CrossRef] [Green Version]


Disclaimer/Publisher’s Note: The statements, opinions and data contained in all publications are solely those of the individual author(s) and contributor(s) and not of MDPI and/or the editor(s). MDPI and/or the editor(s) disclaim responsibility for any injury to people or property resulting from any ideas, methods, instructions or products referred to in the content. |
© 2023 by the authors. Licensee MDPI, Basel, Switzerland. This article is an open access article distributed under the terms and conditions of the Creative Commons Attribution (CC BY) license (https://creativecommons.org/licenses/by/4.0/).
Share and Cite
Mercier, J.; Chabloz, N.; Dozot, G.; Ertz, O.; Bocher, E.; Rappo, D. BiodivAR: A Cartographic Authoring Tool for the Visualization of Geolocated Media in Augmented Reality. ISPRS Int. J. Geo-Inf. 2023, 12, 61. https://0-doi-org.brum.beds.ac.uk/10.3390/ijgi12020061
Mercier J, Chabloz N, Dozot G, Ertz O, Bocher E, Rappo D. BiodivAR: A Cartographic Authoring Tool for the Visualization of Geolocated Media in Augmented Reality. ISPRS International Journal of Geo-Information. 2023; 12(2):61. https://0-doi-org.brum.beds.ac.uk/10.3390/ijgi12020061
Chicago/Turabian StyleMercier, Julien, Nicolas Chabloz, Gregory Dozot, Olivier Ertz, Erwan Bocher, and Daniel Rappo. 2023. "BiodivAR: A Cartographic Authoring Tool for the Visualization of Geolocated Media in Augmented Reality" ISPRS International Journal of Geo-Information 12, no. 2: 61. https://0-doi-org.brum.beds.ac.uk/10.3390/ijgi12020061