Article

Collaborative Strategies for Sustainable EU Flood Risk Management: FOSS and Geospatial Tools—Challenges and Opportunities for Operative Risk Analysis

1
School of Engineering, University of Basilicata, via dell’Ateneo Lucano n.10, Potenza 85100, Italy
2
Sustainable Development and Energy Sources Department, Ricerca sul Sistema Energetico S.p.A., Milano 20134, Italy
3
Department of Bioresource Engineering, McGill University, Ste Anne de Bellevue, Montréal, QC H3A 0G4, Canada
*
Author to whom correspondence should be addressed.
ISPRS Int. J. Geo-Inf. 2015, 4(4), 2704-2727; https://0-doi-org.brum.beds.ac.uk/10.3390/ijgi4042704
Submission received: 26 September 2015 / Revised: 4 November 2015 / Accepted: 17 November 2015 / Published: 2 December 2015
(This article belongs to the Special Issue Bridging the Gap between Geospatial Theory and Technology)

Abstract

:
An analysis of global statistics shows a substantial increase in flood damage over the past few decades. Moreover, it is expected that flood risk will continue to rise due to the combined effect of increasing numbers of people and economic assets in risk-prone areas and the effects of climate change. In order to mitigate the impact of natural hazards on European economies and societies, improved risk assessment, and management needs to be pursued. With the recent transition to a more risk-based approach in European flood management policy, flood analysis models have become an important part of flood risk management (FRM). In this context, free and open-source (FOSS) geospatial models provide better and more complete information to stakeholders regarding their compliance with the Flood Directive (2007/60/EC) for effective and collaborative FRM. A geospatial model is an essential tool to address the European challenge for comprehensive and sustainable FRM because it allows for the use of integrated social and economic quantitative risk outcomes in a spatio-temporal domain. Moreover, a FOSS model can support governance processes using an interactive, transparent and collaborative approach, providing a meaningful experience that both promotes learning and generates knowledge through a process of guided discovery regarding flood risk management. This article aims to organize the available knowledge and characteristics of the methods available to give operational recommendations and principles that can support authorities, local entities, and the stakeholders involved in decision-making with regard to flood risk management in their compliance with the Floods Directive (2007/60/EC).

1. Introduction

The observed increase of flood damage across Europe [1] has focused, since 2005, the attention of scientists, policy-makers, media, and society in general on the field of risk assessment and management. This is being driven by the expectation that the probabilities of floods and their consequences, caused by changes in the meteorological drivers of floods, or by changing land-use patterns and socio-economic development, will continue to rise in the coming decades [2,3,4,5,6,7,8,9,10,11,12], therefore aggravating existing flood risk. In this light, the concept of managing flood risk has shifted towards exploring more comprehensive and sustainable approaches [13,14,15,16]. This change has been guided by international initiatives and recent legislation at a European level; the European Floods Directive 2007/60/EC [17], is one example. This flood risk management (FRM) vision (presented in [17]) not only considers hazards, but also possible consequences. The directive prescribes risk assessment and mapping as well as the development of flood risk management plans, aimed at reducing adverse consequences. These plans need to incorporate and integrate economic, ecological, and social impacts, e.g., human health, environment, cultural heritage, and economic activity, among others. FRM should become an important and comprehensive process to adapt to a constantly changing environment due to, for instance, climate change, population growth and economic change. This approach of managing risk takes a more holistic view, by explicitly covering all aspects (e.g., prevention, mitigation, preparation, response, recovery) of the disaster management cycle [18], instead of focusing mainly on flood prevention.
This type of management framework requires the consideration and combination of both risk mitigation (structural technical flood defense measures such as dams, dikes, or polders) and adaptation measures (non-structural, “soft” measures such as preparation of local stakeholders, flood insurance, information management, social networks) [19]. That means measures aimed at reducing the flood hazard, like dikes or retention measures, are taken into account, but also measures that focus on the reduction of vulnerability, such as land use restrictions in the flood plain, warning systems, or insurance. Finally, the Flood Risk Directive [17] calls for the development of effective tools for a cost-benefit analysis of the mitigation options that may be taken to manage technical, financial, and political decisions in flood risk management. In this context, risk analysis models are gaining increased attention in the fields of flood risk management since they allow us to evaluate the cost-effectiveness of mitigation measures and, thus, optimize investments [20]. This is especially important given the limited financial resources available in most cases.
Whilst these requirements are welcome in light of the scientific achievements and recent understanding of risk, they charge stakeholders with new duties and challenges that, not only are they not always able to handle, but for which scientific and technical development is still probably insufficient to provide the necessary knowledge to support stakeholders’ flood risk management decisions. Given this context, this paper presents both current advances and limitations of the available models from the perspective of the authors (focusing mainly on consequence estimation in flood risk analysis). On the other hand, the objective of the paper is not to develop a new harmonized flood risk analysis model that is readily applicable all over Europe. This would be difficult due to the different kinds of floods different European countries are confronted with, the great heterogeneity of available data, and last but not least the different objectives and scales of damage evaluation approaches. Instead, we aim to organize the available knowledge and characteristics of the methods available into operational recommendations and principles to support authorities and stakeholders in their compliance with the Floods Directive [17]. This can be viewed as a good starting point for future scientific research to address the challenge of helping stakeholders to choose the best, or optimum, course of action to adopt, i.e., a process of choice, which helps identify the best of the available options in terms of efficiency and equity [21].

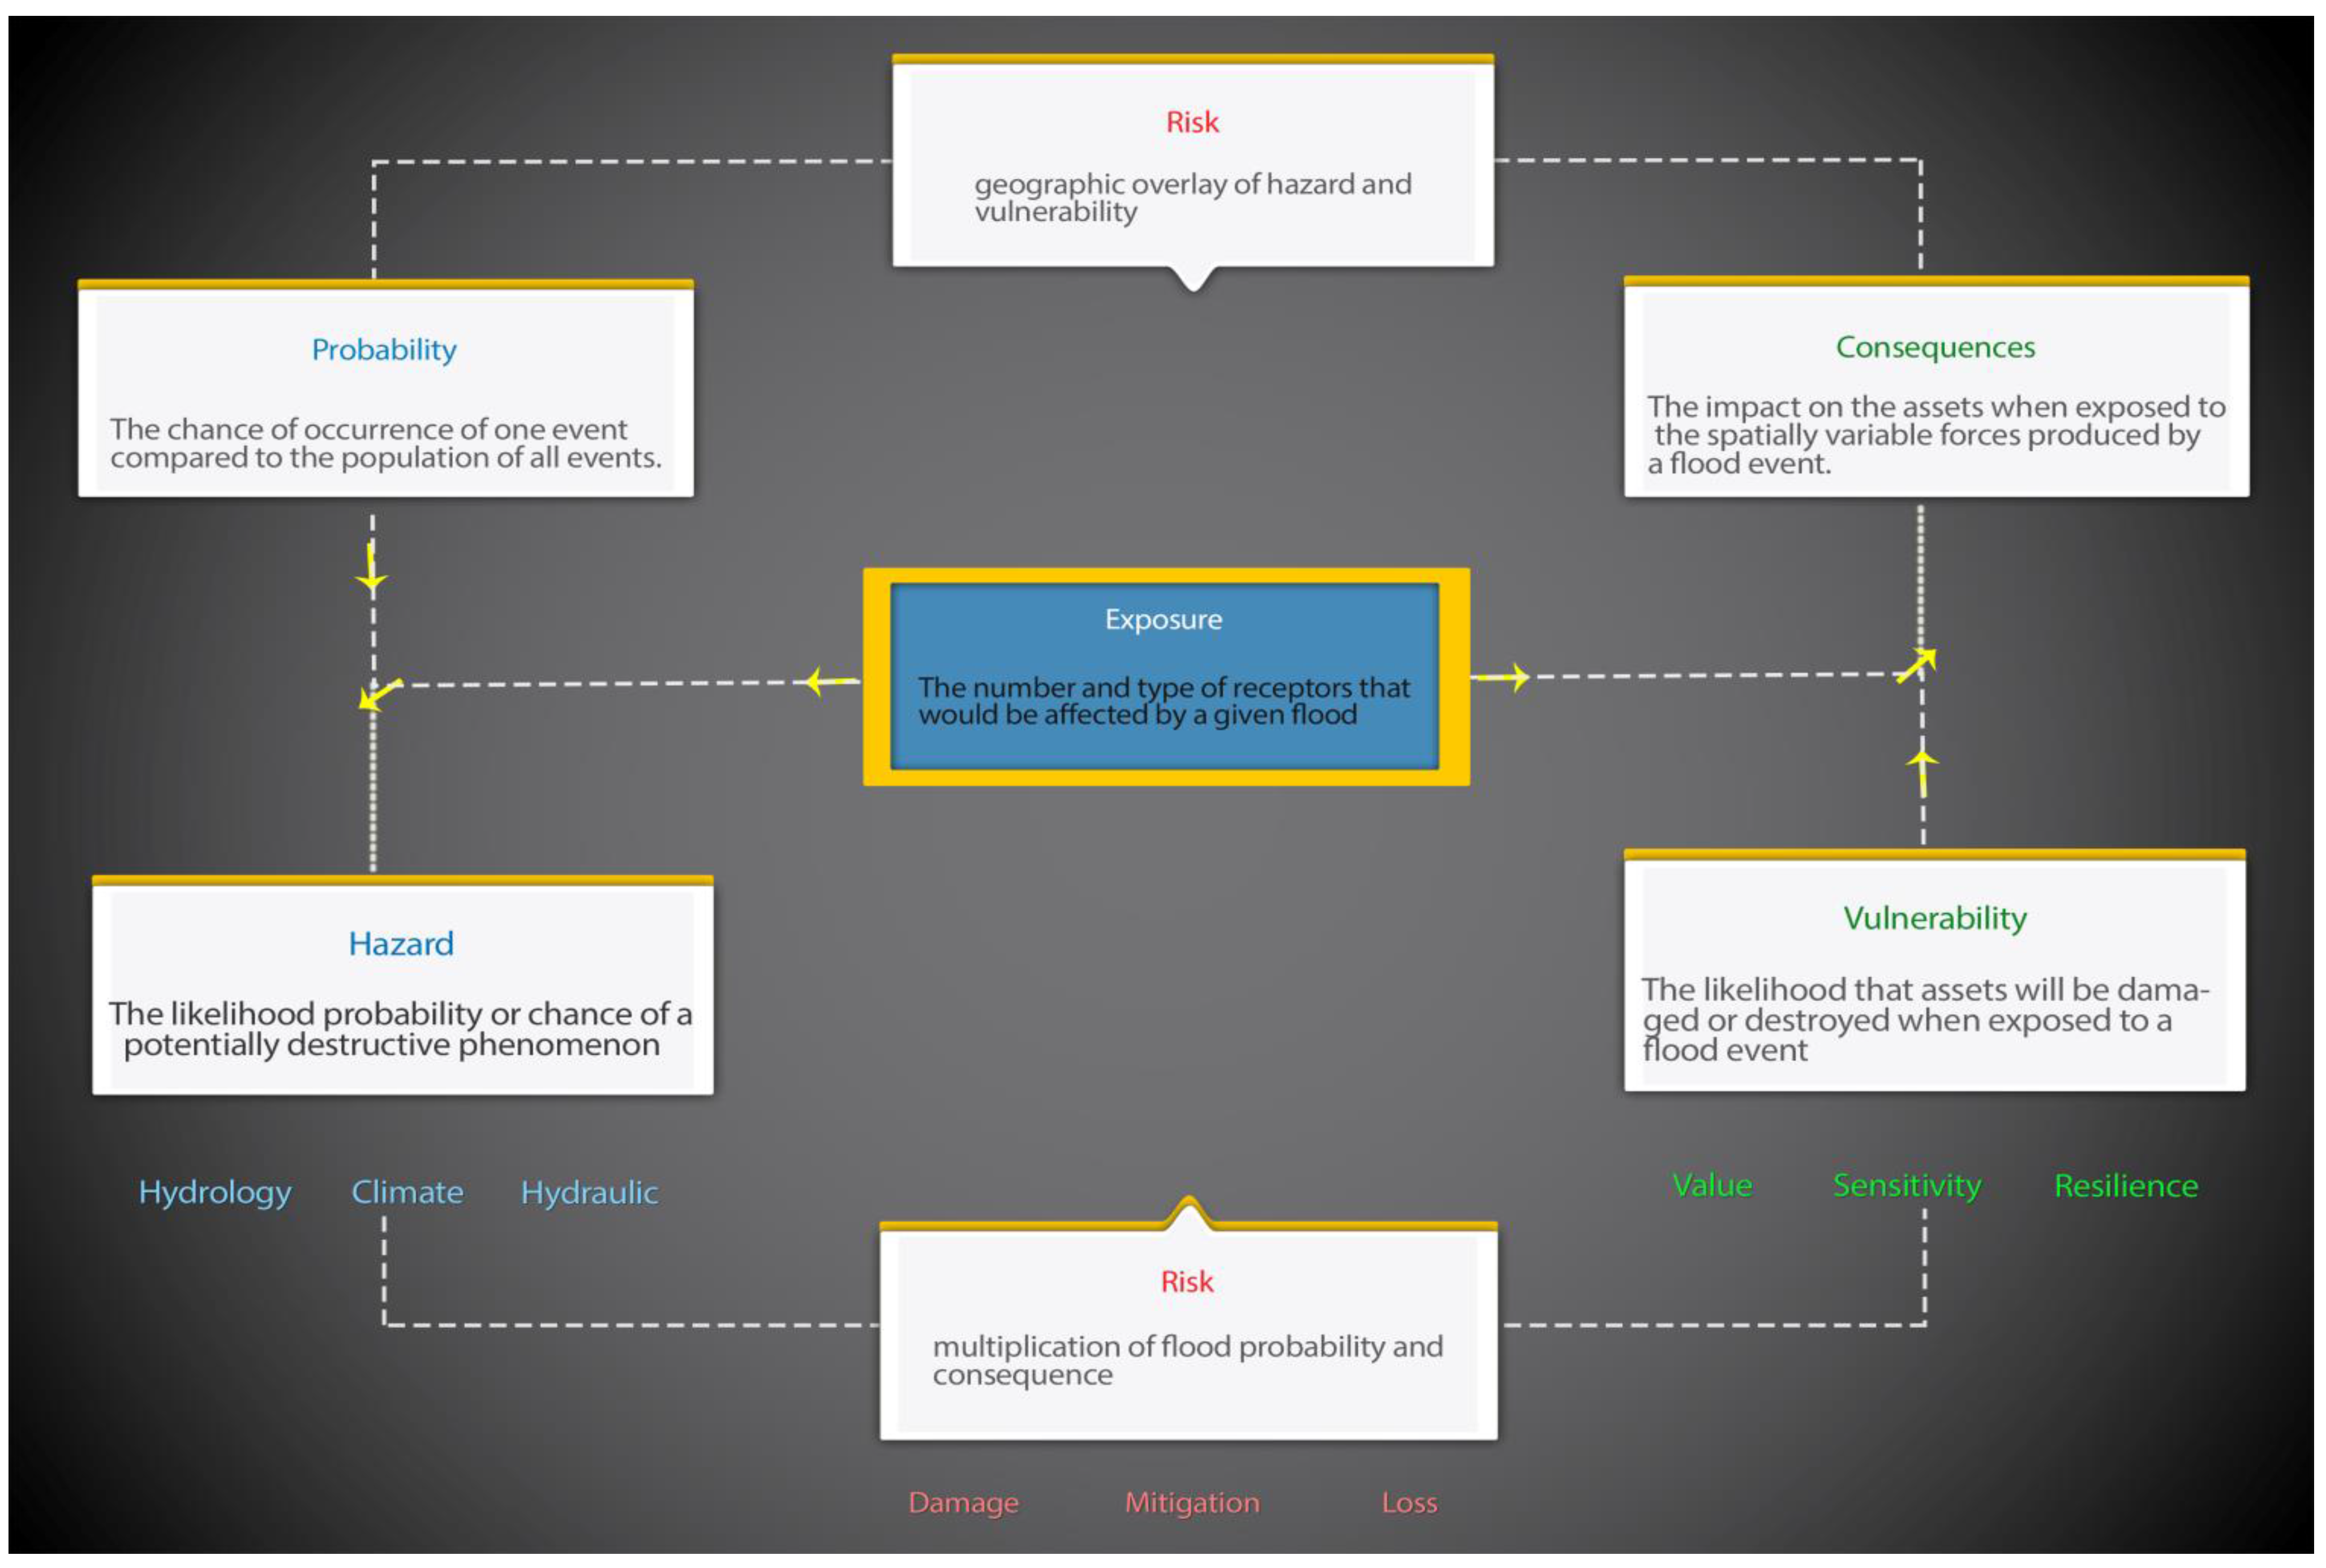
2. Basic Flood Risk Concepts

Before we can adequately frame the challenges of flood risk management (FRM), we first give a summary of the key concepts of flood risk analysis and management. The terminology sometimes differs across the literature and among hazard communities but the technical and scientific efforts in various EU projects, such as FLOODsite and CONHAZ (e.g., [22,23]), have been able to reach a common vocabulary within the flood risk management context, that is considered, in this paper, as guidance.
Two main definitions are currently accepted and commonly utilized for the term “risk”. The first definition has a long tradition among natural scientists, and especially among engineers, because they have typically strived for a reduction of the probability of flooding by means of flood protection:
Risk= Probability × Consequences
where probability is often referenced to a specific time frame, for example, as an annual exceedance probability, and the characteristics of the flooding are largely captured within the term consequences [24]. An alternative definition is:
Risk= Hazard × Exposure × Vulnerability
This definition is often preferred by social scientists and especially among planners, who usually regard hazard as a given, and spatial planning and influencing people’s behavior as the means to adapt to that given [25]. In the second definition, the flood’s possible extent and depth (and other flood characteristics including probability) are all covered by the term “hazard”. A hazard is considered a natural or human activity with the potential to result in harm. On the other hand, vulnerability concerns the characteristics of a system that describes its potential to be harmed. According to this definition, exposure is rather the result of overlaying a flood’s (or all possible floods’) footprint(s) on a map of receptors than a constituent of risk by itself:
Risk=Hazard ∩ Vulnerability
In this equation, the exposure is determined by the presence of receptors as well as their character, e.g., their vulnerability, on the one hand, and characteristics of the flooding on the other hand.
In the first definition, exposure determinants, such as water depth and extent, are included in the term consequence, because they are indeed a hydraulic consequence of a breach and, hence, required for the calculation of the consequences of a breach in terms of economic damage or number of fatalities. In the second definition, flood depth and extent are hazard characteristics, along with probability. By explicitly distinguishing exposure determinants as a separate constituent of flood risk, such as receptors, the two competing definitions and schools can be reconciled (Figure 1). According to this scheme, consequences represent an impact (or improvement) such as economic, social or environmental impact and may be expressed quantitatively; probability not only includes probabilities of potential hazards (e.g., exceedance probabilities of river water levels) but also the conditional probabilities of the system response given such a hazard (e.g., probability of failure of a flood defense system for a certain river water level).
Figure 1. Flood Risk Concept Chain.
Ijgi 04 02704 g001
In this context, flood risk analysis can be defined as the process of determining risk by analyzing and combining probabilities and consequence, which explicitly considers exposure/receptors. The risk analysis should focus not only on obtaining the existent risk but also on analyzing the impact of risk reduction measures, i.e., flood risk mitigation. The risk is now viewed from a wider and more comprehensive perspective where both structural and non-structural measures must be considered and combined in the best possible way, and must be attuned to the specific context concerned. Hence, flood risk management (FRM) combines results, information, and recommendations from risk analysis and mitigation practices, which are used as key information for the definition and prioritization of risk reduction measures.

3. Conceptual Overview of Common Practices for Risk Analysis Models

A standard procedure for flood risk analysis at the meso/micro scale has not yet been established in Europe. The Flood Risk Directive only defines the general requirements; member states, themselves, decide on the appropriate methods needed for its implementation as geographical, hydrological and social differences demand specific approaches. This results in a wide range of flood analysis models of different complexities with substantial differences in underlying components [23,26]. A generalized procedure/model for risk analysis (Figure 2), following the risk definition of Section 2, should perform several damage assessments for events with different probabilities taking into account structural and non-structural mitigation measures.
Figure 2. Overview of general flood assessment.
Ijgi 04 02704 g002
Generally, flood risk analysis models start with an assessment of the flood hazard, which indicates the probability and intensity of a possible event. Meteorological, hydrological, and hydraulic investigations to define the hazard and estimation of flood impact to define vulnerability can be undertaken separately in the first place, but have to be combined for the final risk analysis. Indeed, the hazard information can be overlaid with socio-economic information, such as land use data, building datasets, information on population, regional gross domestic product (GDP), etc. Doing so gives an indication of what is actually exposed to flooding.
Clearly, risk quantification depends on spatial specifications (e.g., area of interest, spatial resolution of data) and relies on an appropriate scale of the flood hazard and land-use/buildings maps. Information on the exposure can be combined with information on the vulnerability of such assets, by relating the relative damage of the elements at risk to the flood impact, and the hazard characteristics to estimate the potential damage. Moreover, the effect of the mitigation measurement on the potential damage should be evaluated to provide all the necessary knowledge on the basis of which proper FRM actions/measures can be defined and communicated to stakeholders. Risk analysis outcomes should produce relevant information for stakeholders in a way that is meaningful to them and fit for their purposes. Moreover, the provision of risk analysis information to all stakeholders, including the general public, can play an important role by both increasing understanding of risk management as a shared responsibility and building social capacity to respond to risk [27].

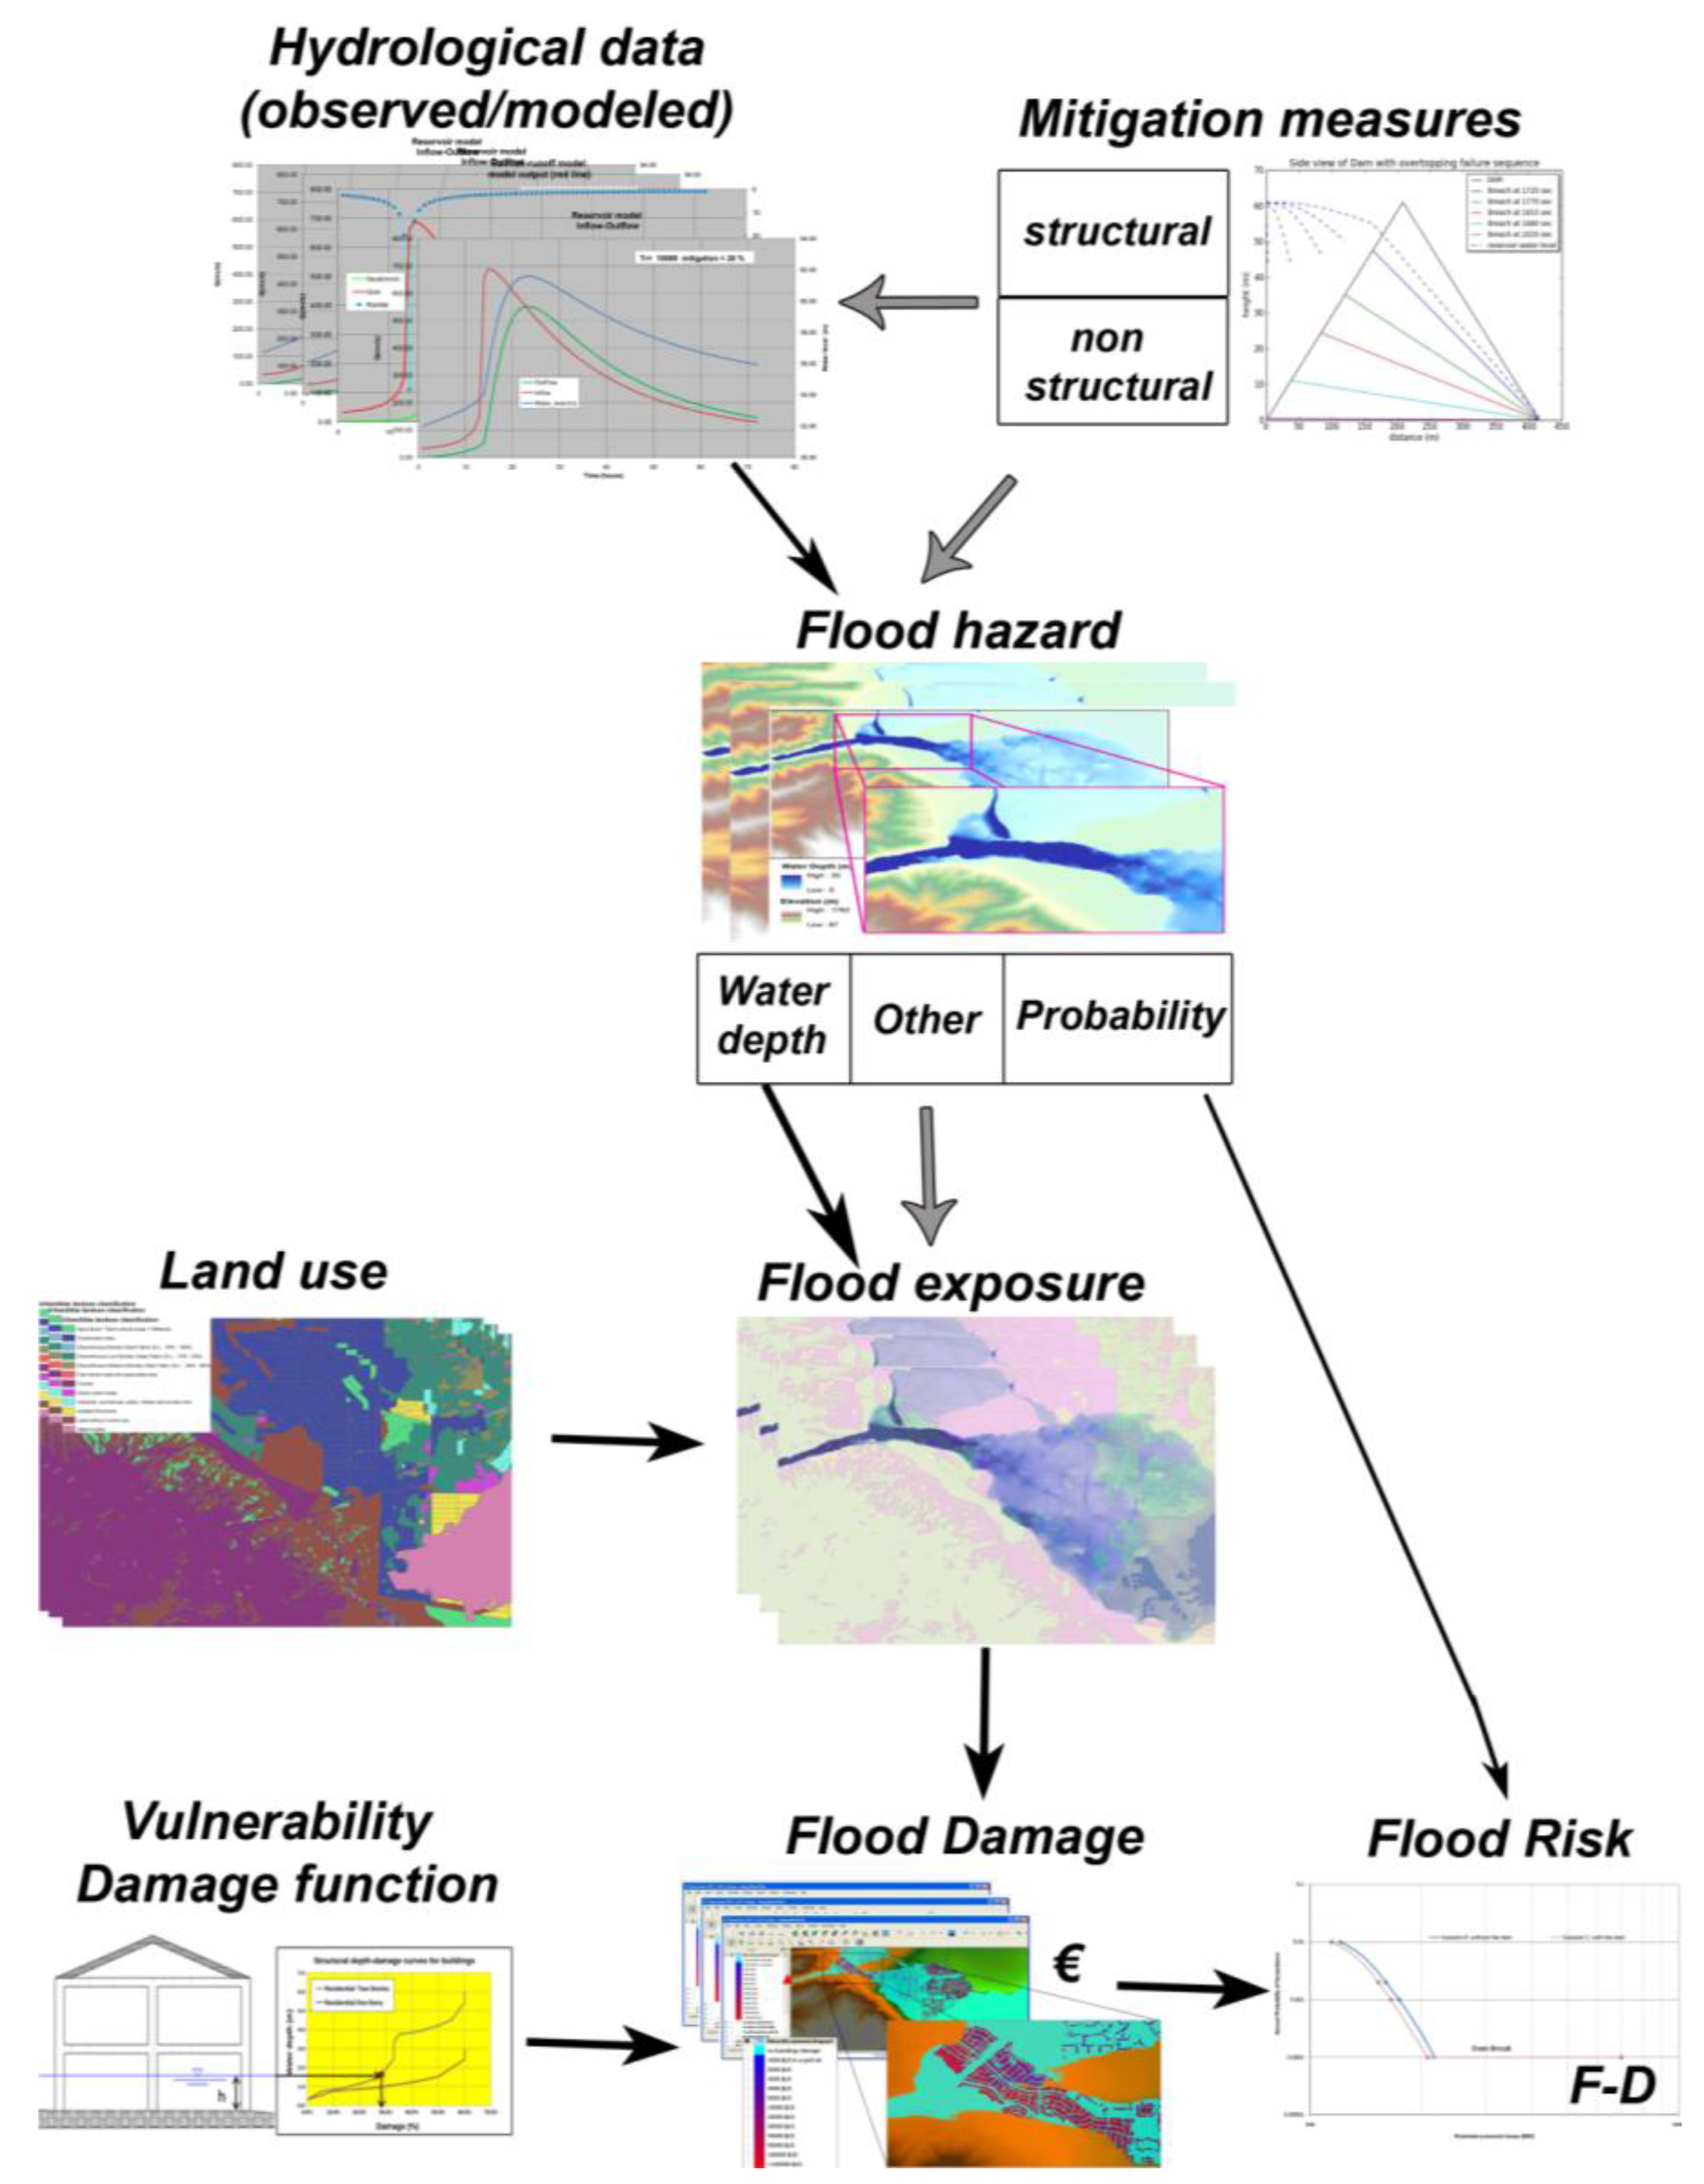
4. General Approach for Flood Risk Analysis Models

Methods for the analysis of flood risk generally include three main steps: (i) determination of the probability of flooding; (ii) simulation of flood characteristics; and (iii) assessment of the consequences, (social, economic, and environmental), that capture the effect of structural and non-structural mitigation measures. In theory, the risk estimate should be based on a fully probabilistic analysis in which all the possible loads on the flood defense system, the resistance of the system, and possible breaches, flood patterns, and their consequences are included. Such an approach would require a numerical procedure and a very large number of simulations. Due to limitations in time and resources a simple approach is usually selected, in which one considers limited numbers of event scenarios where the probability of each scenario is estimated separately, and the consequences are calculated deterministically. The usual procedure is to apply a flood frequency analysis to a given record of discharge data and to transform the discharge associated to defined return periods, e.g., the 100-year event into inundation extent and depths, but also into velocity, flood duration, water contamination, sediment concentration, and information content of a flood warning. Finally, the consequences for different flood scenarios can be estimated based on the outputs of flood simulations and information regarding spatial distribution of socio-economic assets explicitly covering mitigation and adaptation measures. Flood consequences can be, in general, classified into direct and indirect impacts [28]. Direct impacts are those, which occur due to the physical contact of floodwater with humans, property, or any other objects. Indirect impacts are induced by the direct impacts and occur—in space or time—after the flood event. Both types of impacts can be classified into tangible and intangible impacts, depending on whether or not they can be assessed in monetary values [23]. Different classifications of flood consequences can be found in the literature, such as the classification proposed by the CONHAZ project (“Costs of Natural Hazards”), including five categories [23]: (1) direct costs; (2) business interruption costs;(3) indirect costs; (4) intangible costs; and (5) risk mitigation costs.
With regard to indirect costs, there is a need for a better understanding of the processes leading to damage so that they can be modeled appropriately. Furthermore, [29] regard the potential transfer of these methods to practitioners as being quite unrealistic. The reasons for this are that the models require a high degree of skill to run and entail complex mechanisms and uncertainties.
Frequently, consequence analyses focus only on direct flood loss, which is estimated by damage or loss functions. Most flood loss models have in common that the direct monetary flood loss is a function of the type or use of the building and the inundation depth (i.e. depth-damage curves). Recent studies, [26,30], have shown that estimations based on stage-damage functions may have a large uncertainty since water depth and building use only explain part of the data variance. Therefore, some flood loss models include parameters such as flood duration, contamination, early warning, or precautionary measures. The most common and internationally-accepted approach in damage functions is based on depth-damage curves [31]. While some depth-damage curves are constructed using empirical damage data, others are defined based on expert judgment in combination with artificial inundation scenarios. The outcome of the functions can be the absolute monetary loss or relative loss functions, i.e., the loss is given as a percentage of the building or content value and to calculate the monetary value of the damage, percentages are multiplied by the maximum damage value of proprieties. The values can be expressed as either replacement costs, i.e., the estimated new value of the object or class, or depreciated/repair costs, i.e., an estimate of the present-day cost of replacement or reparation. Replacement costs represent total expected monetary flows and are estimated to be higher than depreciated costs, which express real economic loss [32]. Moreover, the function gives expected losses to a specific property or land use type. In most cases, the classification is based on economic sectors, such as private households, companies, infrastructure, and agriculture, with a further distinction into sub-classes. This is based on the understanding that different economic sectors show different characteristics concerning assets and susceptibility (Figure 3). For example, elements at risk in the residential sector are mainly buildings; this is only partly the case in other sectors such as the commercial, agricultural, or public sector. Further, flood impact varies between sectors. For example, flood damage to residential buildings is strongly dependent on the water depth of a flood, whereas for damage to agricultural crops the time of flooding and the duration of the flood are decisive. Due to regional differentiation across Europe, in terms of characteristics of the study areas (e.g., geographic, socio-economic) and data available (e.g., accuracy quality and reliability of data), it is recommended, where possible, to use depth-damage curves and maximum damage values that represent local conditions and the types of buildings present. Clearly, risk quantification depends on spatial specifications (e.g., area of interest, spatial resolution of data) and relies on an appropriate scale of the flood hazard and land-use maps or element at risk maps. Indeed, the risk analysis model can use an object based approach, which uses a large number of object types and corresponding flood damage characteristics, and the more aggregated surface area-based models, i.e., land-use approach. Object-based models have the advantage that they can control for varying building density in areas, but the data are less available and can increase the complexity of the calculations over larger areas. In a GIS system, the input variables such as land use or buildings map, inundation depth, associated depth-damage curves, and maximum damage value, can easily be stored and utilized to perform an analysis of the amount of damage that would result (Figure 2) should a flooding event occur. However, few models take into account the spatial distribution of risks, as well as the effects of flood mitigation measures. Instead, it is essential to consider which areas benefit most from a measure and which areas do not. Furthermore, little attention is usually given to non-structural mitigation measures that should be evaluated in the same manner as structural options. Non-structural measures for flood risk reduction do not involve construction of civil works. They refer to policies, awareness, knowledge development, public commitment, and methods and operating practices, including participatory mechanisms and the provision of information. Non-structural measures, such as urban planning and policies, flood forecasting, communication, mobilization, coordination and operating practice, insurance, and aid mechanism measures, are efficient and sustainable methods of reducing flood risk [33].
Figure 3. Example of change in susceptibility on the basis of the economic sector embodied by depth-damage curves [34].
Ijgi 04 02704 g003
In this way, risk analysis models can provide a clear overview of the social and economic flood risk and also evaluate the effects of several structural and non-structural measures to support authorities in their compliance with the Floods Directive [17] (Figure 2). An approach to support adequate information to ensure appropriate decision and communication is to use the outcomes of risk models to represent F-N and F-D curves [35]. F-N curves are a graphical representation of the probability of events causing a specified level of harm to a specific population. F-N curves show the cumulative frequency (F) at which N or more members of the population will be affected. Similarly, F-D curves show the cumulative frequency (F) for each level of potential economic damages (D). The F-N curve presents the cumulative annual exceedance probability of the expected estimated level of potential fatalities and the area under the curve corresponds to total social risk. The F-D curve illustrates the estimated level of economic damages and the area under the curve represents economic risk. These curves are a useful way of presenting risk information that can be used by managers and system designers to help decision-making about risk, and they are appropriate for comparison of risks from different situations, such as the comparison between the situation with and without a number of structural and/or non-structural measures [33].

5. Current Advances and Barriers to Implementation for Risk Analysis Models

Current risk analysis models employ a diversity of approaches for implementing the Flood Risk Directive within the context of the different conditions present in European countries. Even though there is extensive literature on risk analysis, the available models have diverse levels of detail and degrees of complexity on the basis of the applicability of the methods at different scales and purposes. It is, therefore, vital to synthesize current limits and challenges and identify current best practices to support governmental authorities and executing bodies dealing with flood risk management.

5.1. Cultivate and Promote Open-Data and the Communication of Uncertainty Information

As was said before, each country has its own history, its own ethics, and its own rules. In terms of data, this influences what has been collected in the past, what is available for different purposes and for whom, and what could be available in the future. Indeed, data availability and the potential of collecting the data have a significant influence on existing models. The lack of sufficient, detailed, comparable, and reliable data is one of the main sources of uncertainty in risk analysis models [36].
Uncertainty exists in flood risk and hazard sources of information because of generalizations, assumptions and aggregations of information, which propagates through the model calculations to accumulate in the final damage estimate (see e.g., [37]). In this context, the use of Geographical Information Systems (GIS) provides the ability to capture relevant urban data and present this in a spatial manner. GIS enables the creation of databases that can include information about natural and built assets, and the extent of a natural feature, such as a watercourse or catchment area, and presents this information spatially [34]. Moreover, this approach could benefit from the incorporation of data from high-resolution aerial imagery and airborne LiDAR into GIS data sets in order to provide required information about the location and size of individual buildings. Such detailed spatial information can limit the uncertainty of a flood risk analysis model, in terms of flood hazard and consequence estimation.
The elements at risk are often represented by low-resolution land-use maps with a limited number of land-use classes, which significantly generalize the real situation. Linked to the elements at risk, the value of these elements is also compounded by these generalizations resulting from a limited amount of land-use classes. Even if the amount of classes would not be limited, there would still be further generalizations because of spatial differences, temporal differences, and different methods to value elements at risk [38]. Therefore, it is essential that the detailed information about, for example, individual buildings’ location and size, are integrated with additional information about building construction type, land-use classification, and residential population estimates.
Moreover, Computational Fluid Dynamics (CFD) modeling of urban flood events is very useful for characterizing the complexity of an urban system. In particular, the use of mesh-free methods for CFD has grown exponentially during the last decade [39]. These methods, whose main idea is to substitute the grid by a set of arbitrarily distributed nodes, are expected to be more adaptable and versatile than the conventional grid-based approaches, especially for those applications with severe discontinuities in the fluid, such as urban areas characterized by detailed spatial elements. The shortcoming of these new methods is that they are generally more time-consuming than Eulerian CFD techniques, since the numerical stencil of each computational node is composed of approximately one hundred particles in 3D, rather than a tenth of cells for mesh-based models.
On one hand, the increasing availability of high spatial resolution geographical and remote-sensing data can further facilitate the development of harmonized flood risk analysis models for consistent assessment across different spatial scales. On the other hand, the lack of post-event data limits the accuracy of the available models that often cannot be validated. This shortcoming limits the models’ transferring in space and time, i.e., from region to region or from one event to another. An increase in quality and comparability of post-event data, as well as model inter-comparison studies, should support model validation in different regions and at different points in time. Moreover, data at local or regional levels are often at the aggregated level and, therefore, they can be incomplete in terms of categorization and/or spatial resolution. It is therefore essential to include uncertainty in the decision support module, to provide some measure of the uncertainty associated with the overall data, analysis and outputs. This can be done, for example, by a range (i.e., a lower and upper and perhaps a mean value), by a standard deviation figure, or by means of a probability distribution or with more complex statistical methods (e.g., Monte Carlo analysis, Bayesian approach, etc.), and based on statistical inference, such as the GLUE approach [40] and UCODE [41].
Recently, efforts have been made to increase the production and utilization of open data. The latter can increase government transparency and accountability and broaden participation in governance. Open data and open models promote a level of transparency in risk assessment that represents an appealing change from the past, when assumptions, data sets, and methodologies, along with the associated uncertainties, were invisible to the end-user. Crowdsourcing is increasingly being viewed by governments and communities as a solution that enables bottom-up participation in the understanding of risk management solutions to an otherwise expensive challenge of data collection; an example of this approach is OpenStreetMap, called the “Wiki of the Maps”. Thus, efforts have to be made to express the uncertainty in the decision but also to reduce it by establishing a coherent framework for data collection and evaluation.

5.2. Challenge in Developing a Harmonized European Approach while Providing Room for Including Necessary Regional Adjustments

Although there has been an increase in empirical and analytical skills and approaches regarding risk analysis, additional knowledge is necessary for the establishment of a pan-European approach. Modeled risk analysis outcomes are highly uncertain, particularly due to the lack of sufficient, comparable, and reliable data. Open-access European databases should be developed which ensure consistency, sufficiently detailed information, and minimum data quality standards. Damage data also needs to be differentiated according to different loss types and regional differences.

5.2.1. Spatial Scales

The choice of an appropriate risk assessment approach is always a trade-off between accuracy and effort (Table 1). In order to support decisions on concrete risk reduction measures for a specific site, detailed micro-scale approaches should be applied. On the other hand, the micro-approaches require significant effort and data requirements. The meso-scale is generally sub-national, referring to a certain province, watershed, or large city; the micro-scale is the smallest scale considered, which relates to a town or specific river stretch.
Table 1. Scale level and accuracy of evaluation for damage assessment.
Scale LevelData NeedsStudy AreaScopeAccuracyEfforts
macrolow/aggregatedglobal/international(re)insurance/global policylowlow
mesoland-useregionalflood protection strategiesmiddlemiddle
microland-use or object typelocallocal flood mitigation measureshighhigh
Generally, meso- or micro-scale approaches could lead to considerable uncertainties in the results, especially with regard to the spatial accuracy of the results, because land use data sources or damage functions with a high level of aggregation are applied. However, the spatial detail of the model should be set into relation to the additional effort required to apply that model.

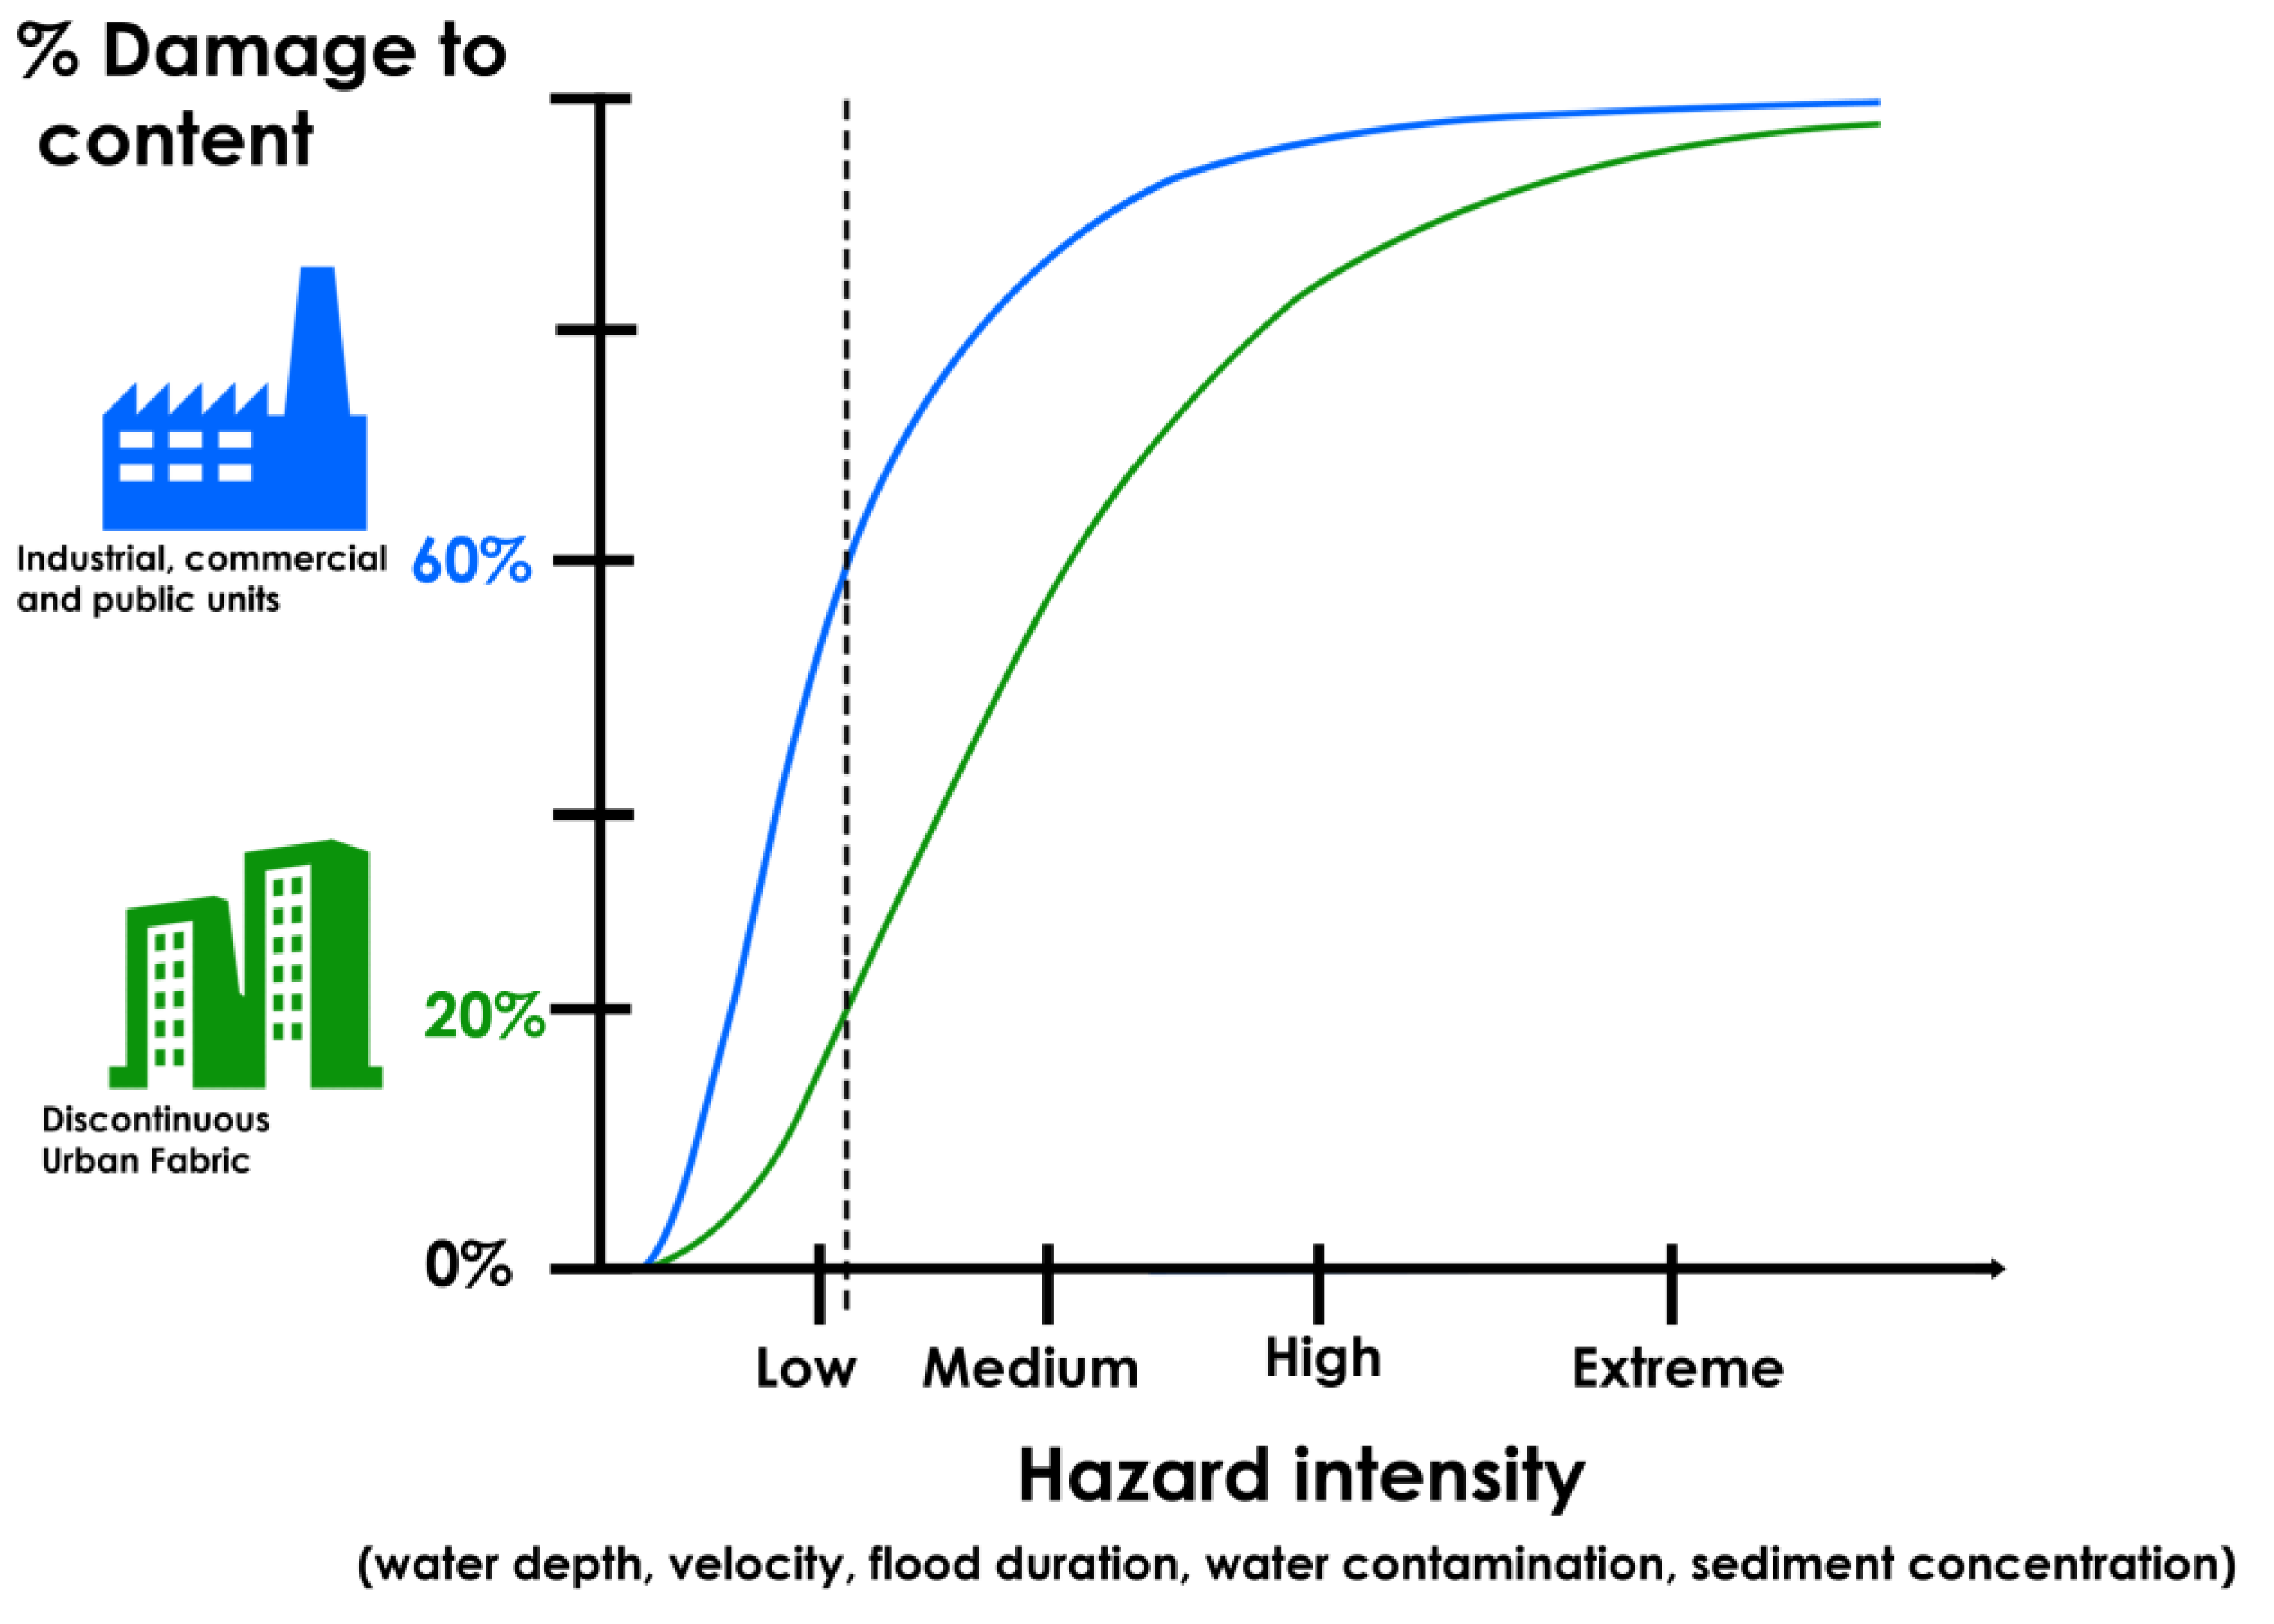
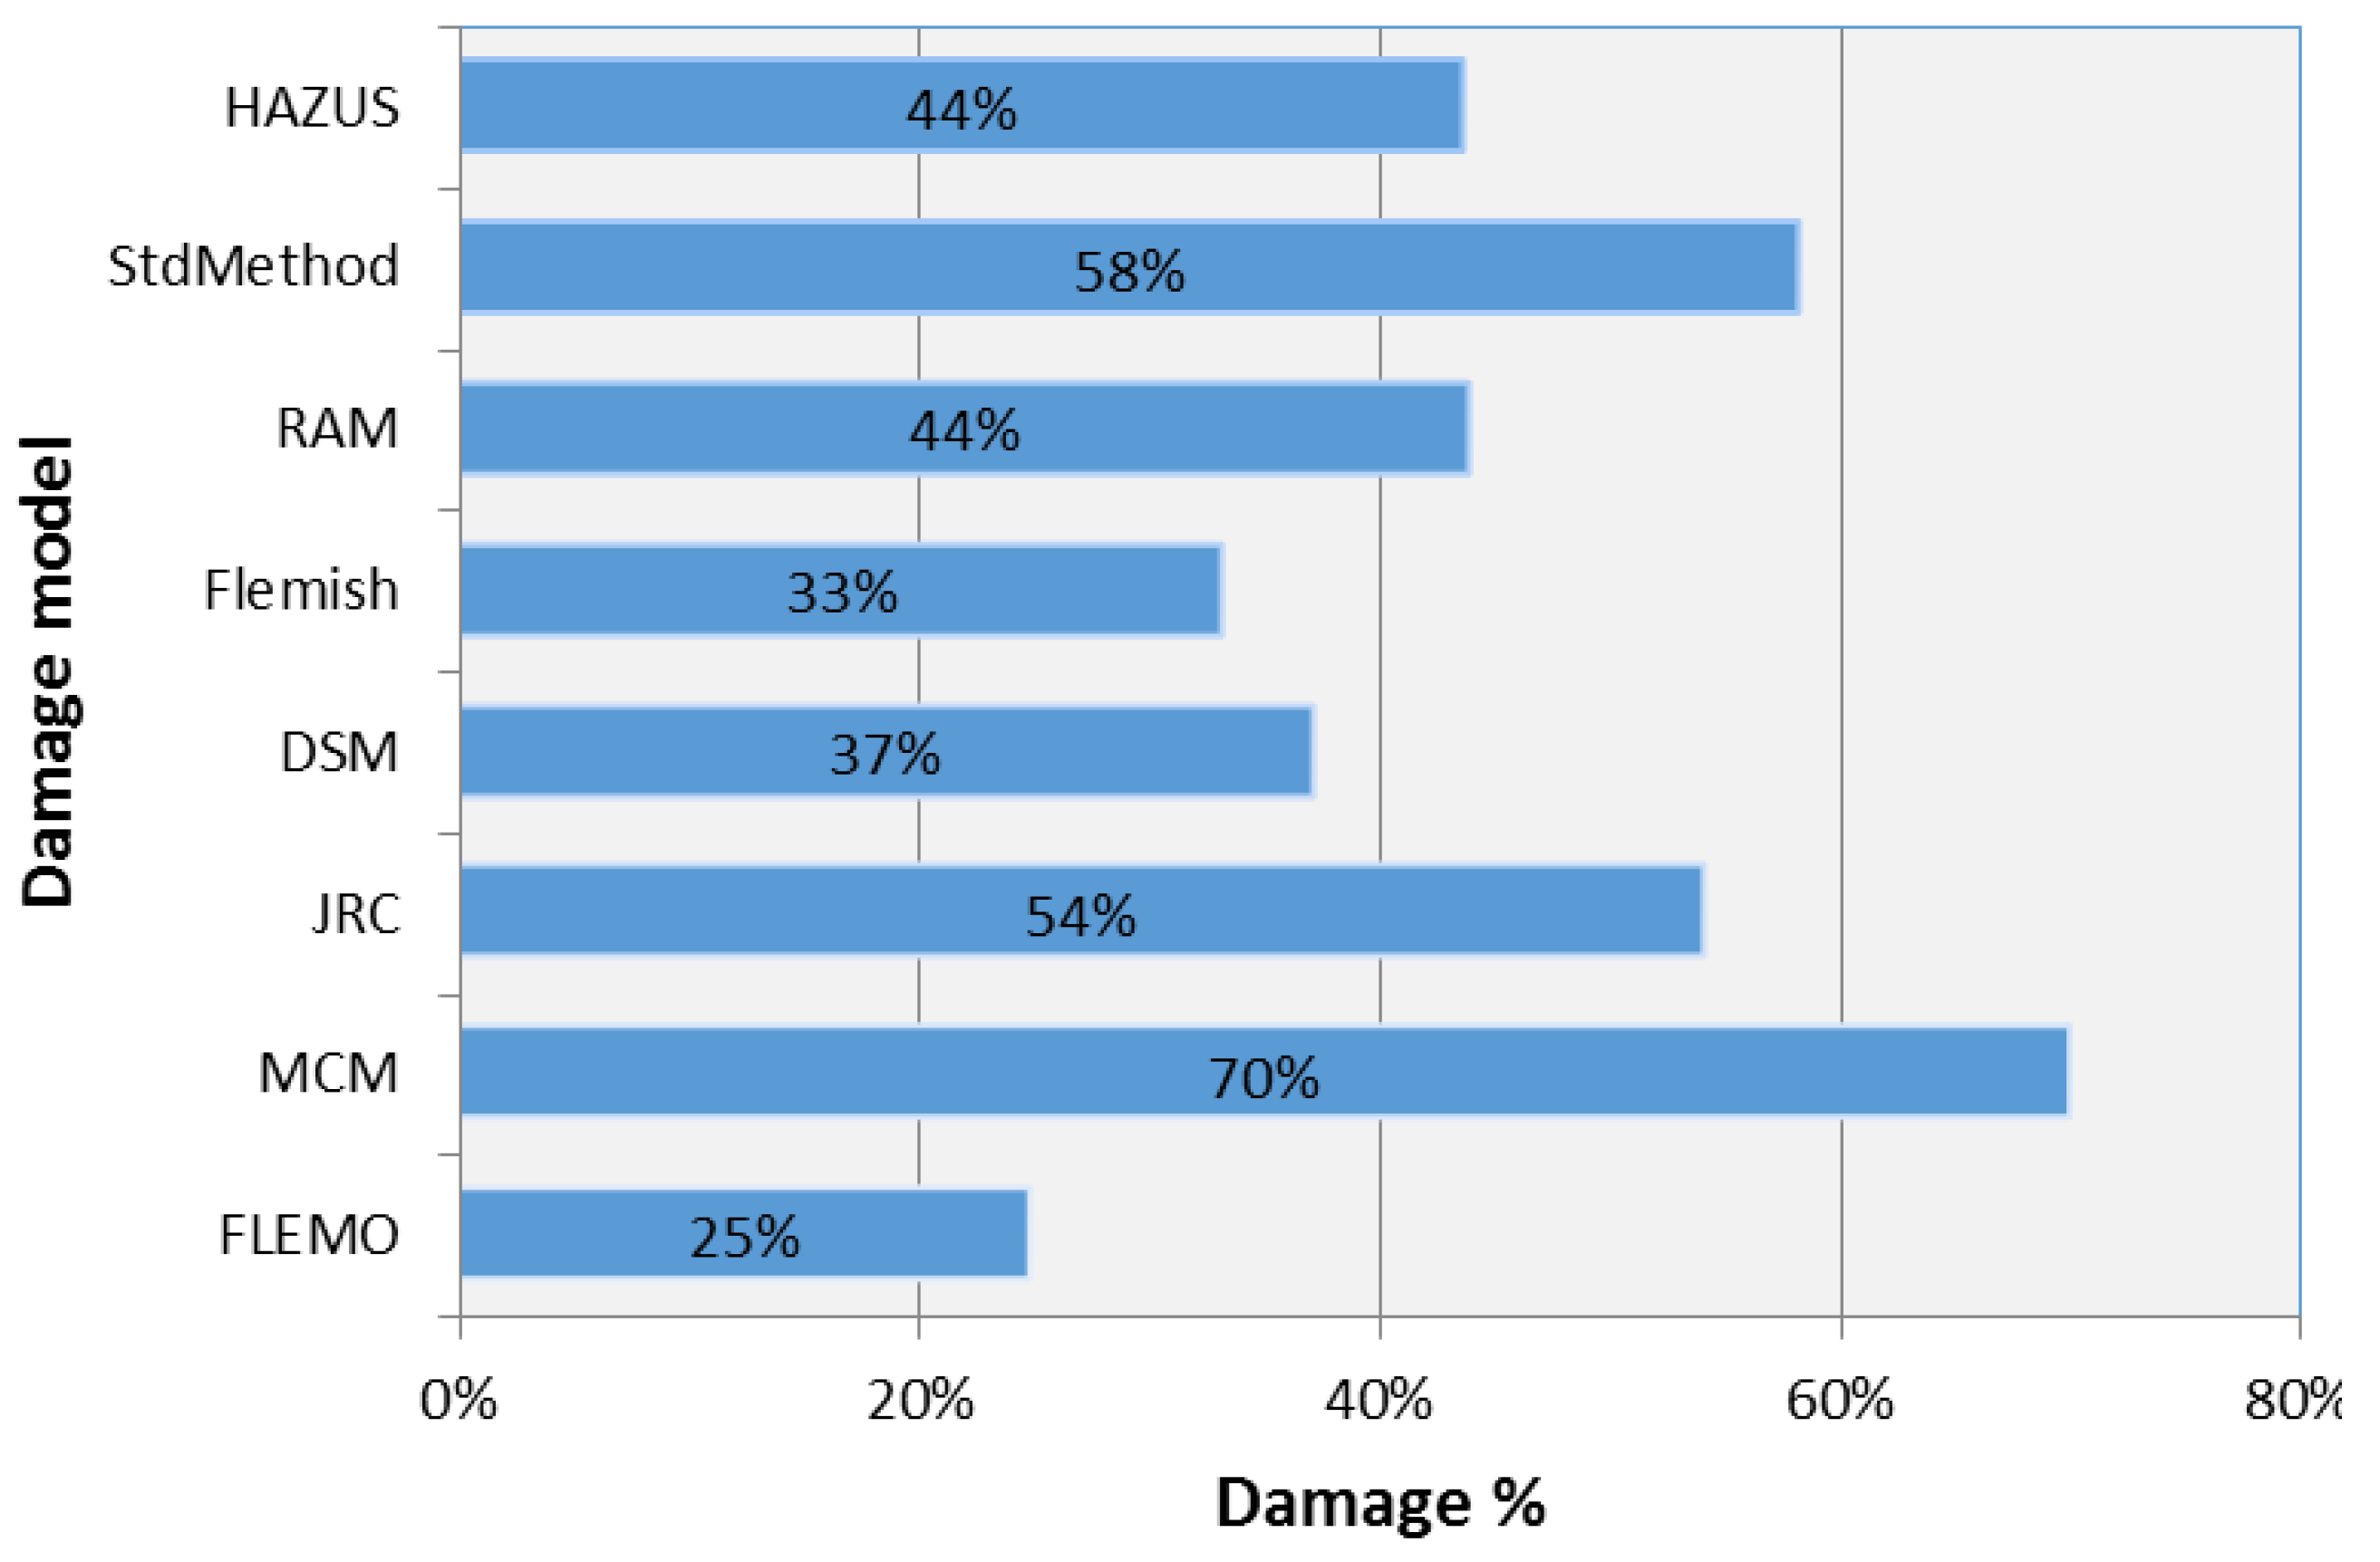
5.2.2. Large Differences in the Application of Several Scientific Flood Damage Models

Although the shift towards more comprehensive and integrated risk management is steered by European policy and legislation, the geographical boundary condition and the initial situation in the various European countries varies significantly between countries and has a profound influence on the adopted flood risk analysis methods and models. Until now, there has been no standard procedure to determine the flood impact resulting from a wide range of flood damage models with substantial differences in their underlying approaches. Hence, the overall applicability and transferability of flood models to other geographical regions is still a major gap in current flood damage modeling, which results in large uncertainties.
With respect to damage estimation, there is uncertainty in the generalization in damage categories (land-use classes or building inventory maps) that can theoretically be improved by using more detailed information on the assets at risk for the location in question. Subdividing residential land-use classes further into more detailed categories and/or using information on the state of individual buildings would allow us to define more detailed depth-damage curves and to better differentiate values at risk. Previous studies, [26,30], show that uncertainty in depth-damage curves can affect the resulting damage estimates more strongly than uncertainty in the applied maximum damage values. To illustrate the effect of model choice on the resulting uncertainty of damage estimates, an application of diverse models to an idealized case study is provided here. With respect to a previous study that performed a meso-scale comparison [26], we quantitatively compared at the micro-scale seven flood damage models developed for simulating direct flood damage (see Table 2): FLEMO (Germany), Damage Scanner (The Netherlands), Rhine Atlas (Rhine basin), Flemish Model (Belgium), Multi Coloured Manual (United Kingdom), HAZUSMH (United States), and the JRC Model (European Commission/HKV).
Table 2. Qualitative properties of the damage models adopted.
Damage ModelCountryScale of ApplicationUnits of AnalysisHydrological CharacterData MethodNum. of Unit ClassRefer.
HAZUSUSALocal RegionalIndividual objects Surface areaDepth, Duration Velocity, Debris Rate of riseEmpirical synthetic>20[42]
Standard MethodNetherlandLocal RegionalIndividual objects Surface areaDepth Flow rateSynthetic>20[43]
Rhine AtlasGermanyLocal RegionalSurface areaDepthEmpirical synthetic10–20[44]
FlemishBelgiumRegional NationalSurface areaDepthSynthetic5–10[45]
Damage ScannerNetherlandRegional NationalSurface areaDepthSynthetic5–10[46]
JRC ModelEuropeRegional National EuropeanSurface areaDepthEmpirical synthetic (Statistical)5–10[47]
MCMEnglandLocal RegionalIndividual objectsDepthSynthetic>20[48]
FLEMOGermanyLocal Regional NationalSurface areaDepth ContaminationEmpirical5–10[49]
Table 3. Qualitative properties of the damage models adopted.
CODEDescription
11100Continuous Urban Fabric (S.L. > 80%)
11210Discontinuous Dense Urban Fabric (S.L.: 50%–80%)
11220Discontinuous Medium Density Urban Fabric (S.L.: 30%–50%)
11230Discontinuous Low Density Urban Fabric (S.L.: 10%–30%)
11240Discontinuous Very Low Density Urban Fabric (S.L. < 10%)
11300Isolated Structures
12100Industrial, commercial, public, military and private units
12210Fast transit roads and associated land
12220Other roads and associated land
12230Railways and associated land
12300Port areas
12400Airports
13100Mineral extraction and dump sites
13300Construction sites
13400Land without current use
14100Green urban areas
14200Sports and leisure facilities
20000Agricultural + Semi-natural areas + Wetlands
30000Forests
40000Wetlands
50000Water bodies
Figure 4. Comparison of total damage for the urban sector obtained with different damage models.
Ijgi 04 02704 g004
The comparison is performed on the data set provided for the workshop on the benchmarking of risk analysis for dam breaks entitled “Computational Challenges in Consequence Estimation for Risk Assessment” (Zenz and Goldgruber). A reclassification of the original categories of the damage models to the Urban Atlas land use classes of the European Environmental Agency (Table 3), which is available for the major cities of Europe, is applied here. We have chosen the Urban Atlas land use classification because it provides pan-European comparable land use and land cover data for Large Urban Zones with more than 100,000 inhabitants as defined by the Urban Audit.
The comparison shows that the choice of the damage model can significantly influence the final result despite using the same input data of hazard and land-use on the some case study (Figure 4). Note that FLEMO, HAZUS, and MCM do not have depth-damage curves for infrastructure and, thus, the comparison does not include an estimate for this class.
Indeed, in accordance with [26,30],we highlight the need of a European methodology that differentiates vulnerability functions among countries; however, it is necessary to homogenize the classification of the different sectors across Europe. On one hand, the depth-damage functions are strongly influenced by the different characteristics concerning assets and susceptibility of the diverse countries. On the other hand, a pan-European approach should associate the depth-damage function to a homogeneous set of land use classifications for the diverse countries to increase the inter-comparison and transferability of methods across Europe.

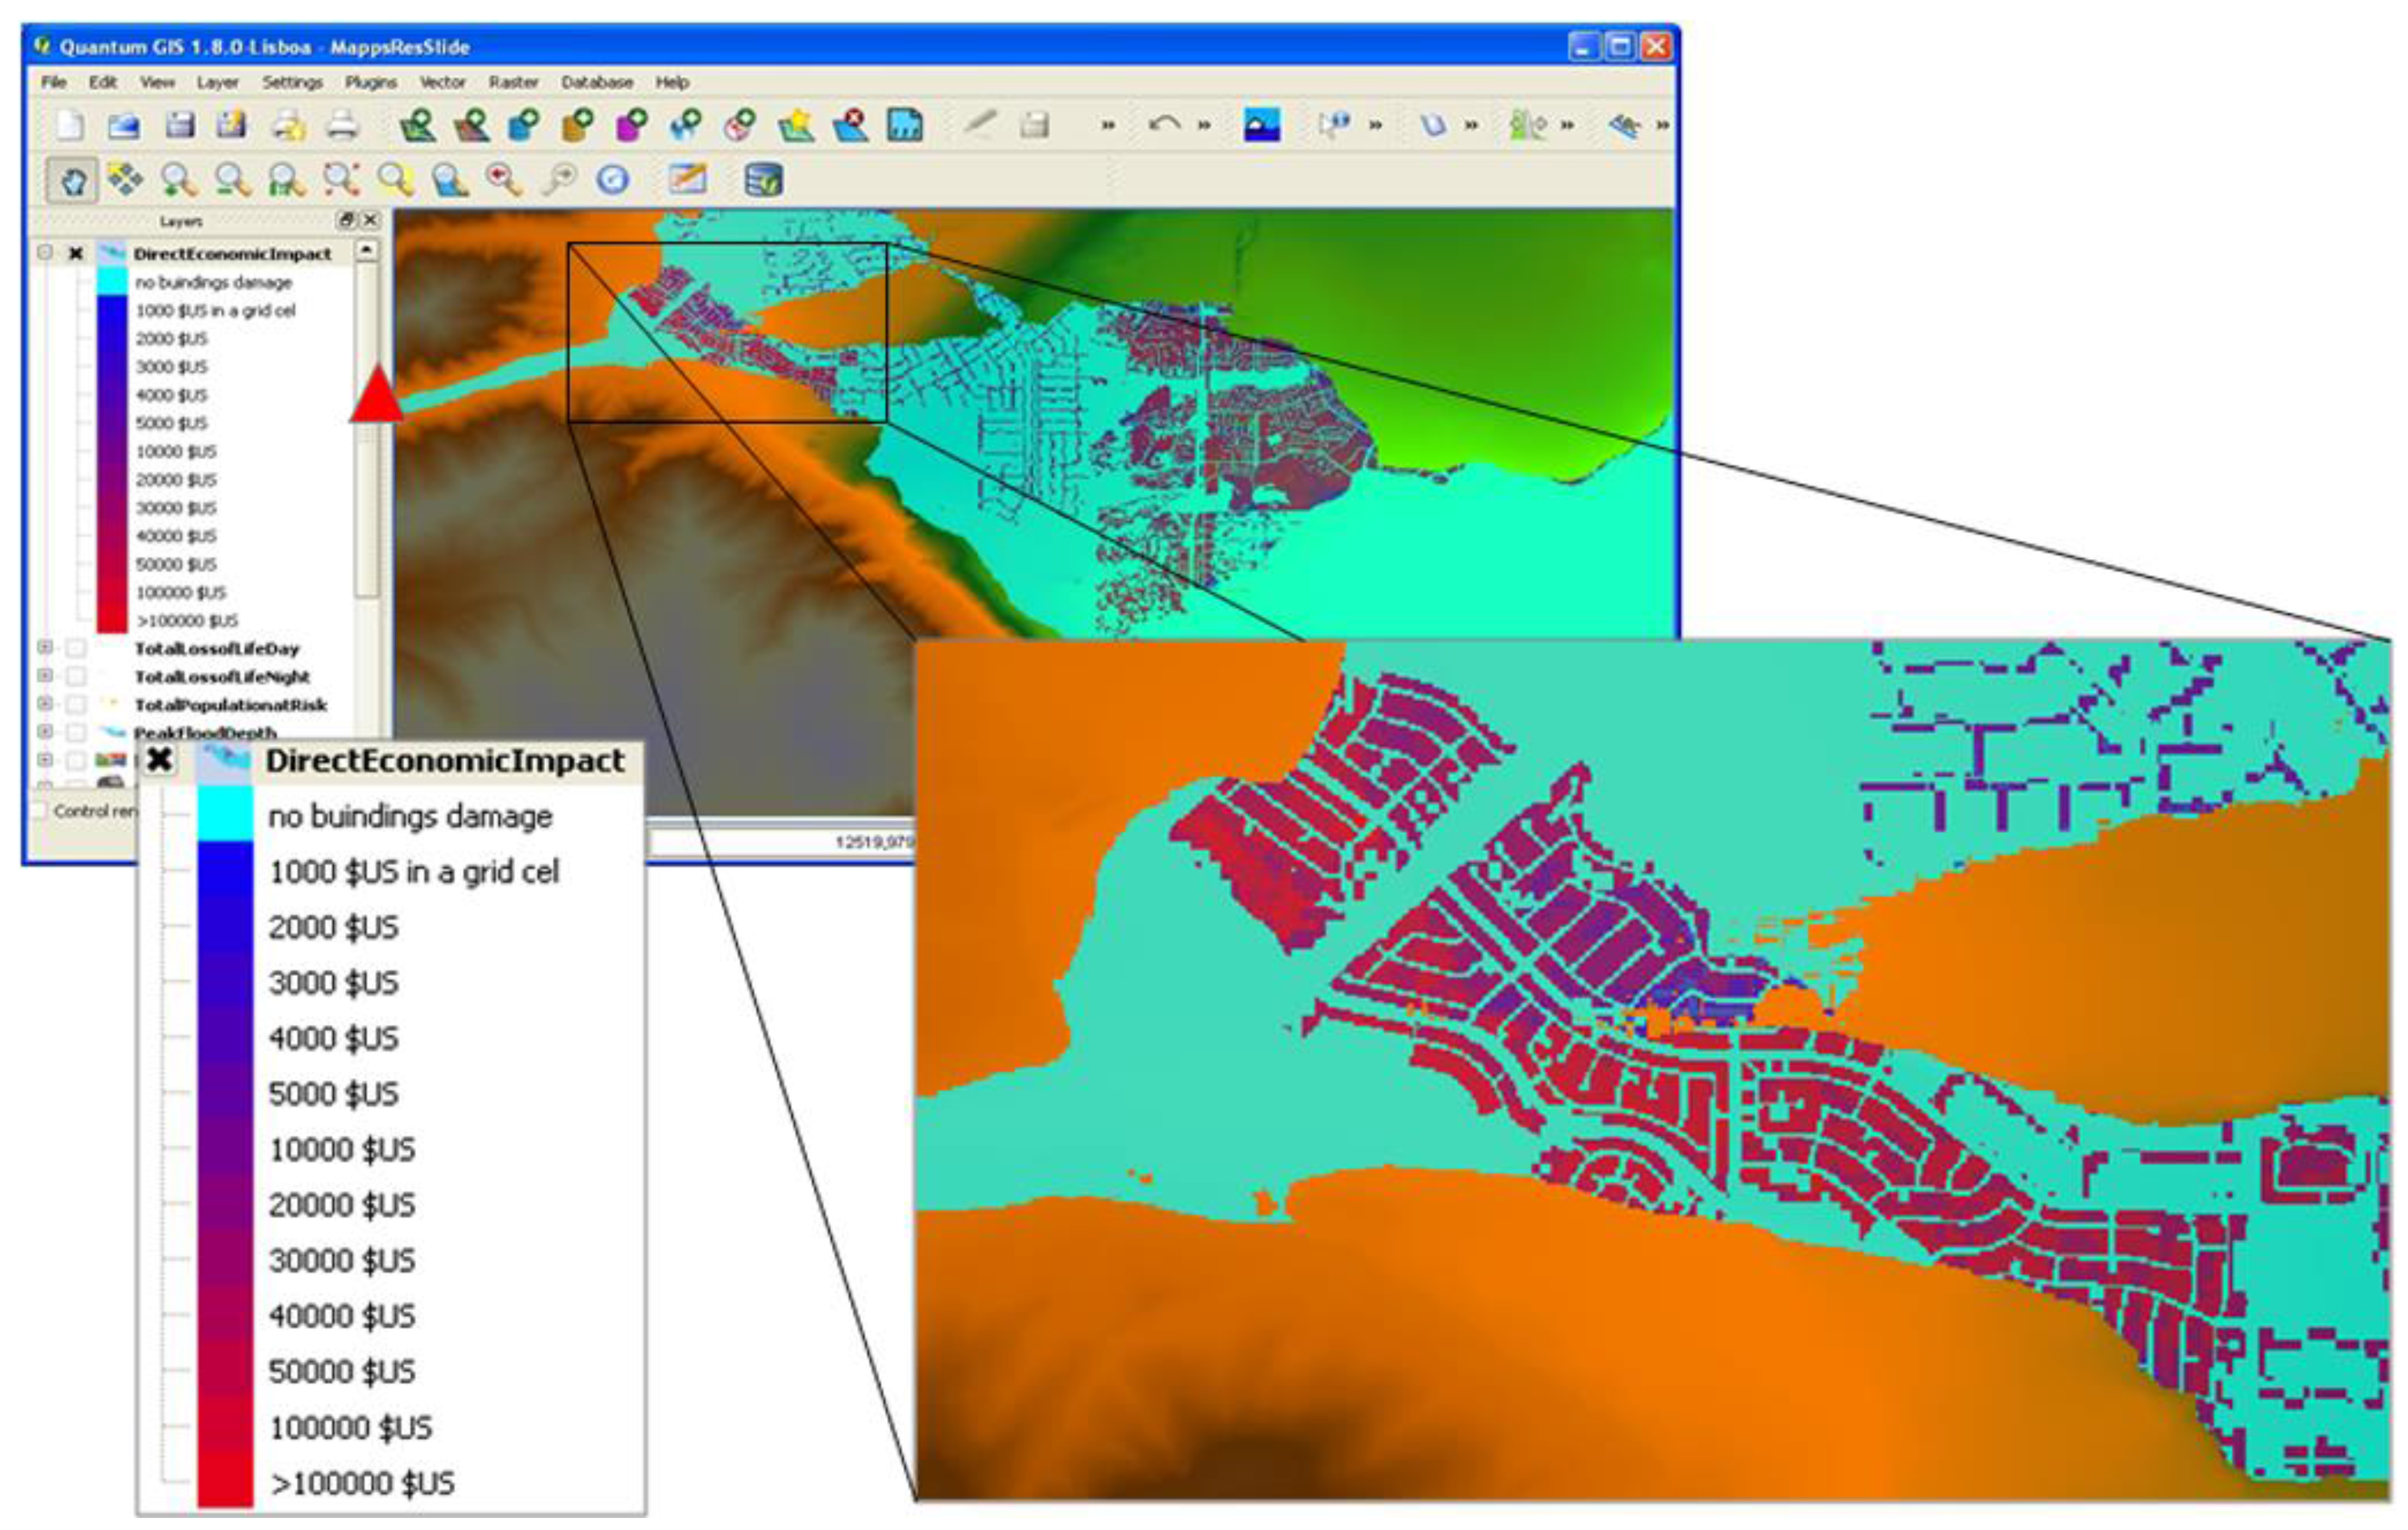
5.3. A (Free and Open-Source) FOSS GIS Risk Analysis Approach

The use of Geographic Information Systems (GIS) is very useful in flood risk assessments since these tools are ideal to manage spatial information, providing adequate spatial processing, and visualization of results. The heterogeneity of hazard, vulnerability, and exposure data require GIS tools to be handled in an appropriate and common way (Figure 2). GIS constitutes a highly useful working tool because it facilitates data interoperability, rendering the great volume of information required and the numerous processes that take part in the calculations easier to handle, thus, speeding up the analysis and the interpretation and presentation of the results.
A Geographic Information System, therefore, records objects (in terms of their location and characteristics), and provides tools (analysis and display) for their modeling, and further models the effects of changes upon the surrounding environment used for geospatial data management and analysis, graphics/map production, and visualization. Due to these advantages, GIS is a very powerful and promising tool in risk analysis and management. GIS could improve the knowledge of spatio-temporal features of a flood risk area (Figure 5). Any system is spatially distributed and the way in which it is distributed can have significant effects. For example, a group of petrochemical industries or a group of disabled people could be concentrated in a single location or be at numerous small sites. The usage of GIS, as a risk-analysis working tool, allows for the realization of data dissemination strategies as well as networking tools for cooperation. The interactive, dynamic and flexible nature of the technology, combined with the immediacy with which information is presented by the map, can facilitate and speed up the process of knowledge acquisition [27]. Maps give a direct and strong impression of the spatial distribution of the flood risk, providing essential information to stakeholders. Moreover, risk maps are used for developing appropriate stakeholder participation processes (e.g., incorporation of local knowledge and preferences, fostering communication and risk awareness).
Significant progress has also been made in developing open source geospatial tools, which are lowering the financial barriers to understanding flood management risks. Open source GIS tools allow for the adoption of innovative and interoperable solutions, which is one of the main advantages of open systems. The source code of FOSS tools is typically published under free and open source software licenses with end-user rights to run the program for any purpose, to study how the program works, to adapt it, and to redistribute copies including modifications. If the system depends on a specific software version and the vendor decides not to support that version anymore, the system must be re-implemented.
The maturity and importance of FOSS geospatial software and the relevance of its applications have led to wide spread use of this software across Europe in the last few years; in particular some OSGeo (Open Source Geospatial Foundation) projects, such as Quantum GIS (http://www.qgis.org) GeoNode (http://geonode.org/), GRASS GIS (grass.osgeo.org), and POSTGIS (http://postgis.net/), have had significant and rapid growth. Another important benefit of FOSS, from a scientific perspective, consists in the right to analyze, modify, and redistribute the source code, increasing the chance to eventually correct bugs and improve the model. Using open data and open source software permits transparent and repeatable calculations are important not only for the credibility of scientists and authorities, but also to facilitate regulation compliance and community collaboration. This concept is the basis of several European Directives such as Directive 2003/4/EC on public access to environmental information, Directive 2003/98/EC on the re-use of public sector information and EU Directive 2007/2/EC, named the INSPIRE directive, that aims to create a European Union (EU) spatial data infrastructure.
In the field of risk management, sharing data and creating open systems among scientists and authorities promotes transparency, accountability, and ensures wide ranges of actors are able to participate in the challenge of building resilience. Risk analysis is not a competitive issue and only freely available and cooperatively developed utilities and tools can lead to better risk management and to further development of a harmonized pan-European model. Over the course of the last few years, progress in FOSS has led to the emergence of numerous software applications in the field of flood risk. Their diffusion in the flood risk field has been guided by the reproducibility, testing, and community-based development process that characterizes free and open source software.
Figure 5. Example of the spatial distribution of the damage in a hypothetical study case.
Ijgi 04 02704 g005
An example of the maturity and relevance of FOSS for the flood risk management field is represented by the products of Deltares (www.deltares.nl), which is an independent institute for applied research in the field of surface and subsurface water. Deltares has developed numerous web and desktop software and tools in the field of flood risk, e.g., Delft3D suite, Aqueduct, and DAM. Other FOSS projects, such as CAPRA (http://www.ecapra.org/) and UNISDR (United Nation Office for Disaster Risk Reduction) GAR, e.g., GAR15 [50], are multi-risk platforms designed, respectively, for probabilistic risk analysis and global flood risk assessment. An innovative and widely utilized method to realize geospatial FOSS tools in the field of flood risk is to develop plugins, i.e., add-ons that add specific features to an existing free and open-source GIS software, such as GRASS and QGIS. These plugins are portable, easy to use and implement, and use the power of existing GIS, because the plugins are integrated with GIS.
Several GRASS and QGIS add-ons have been developed to support flood hazard analysis and to link hydraulic models and GIS to transfer hazard characteristics to GIS with the aim of supporting flood consequence assessment. For example, the GRASS GIS tool r.hazard.flood, [51], is an innovative geospatial tool that uses a simple geomorphologic method to rapidly delineate flood prone areas. In particular, the tool uses a modified topographic index computed from a DEM for the flooding delineation that can be very useful in un-gauged basins and in areas where expensive and time consuming hydrological-hydraulic simulations are not affordable. The tool r.damflood, [52], is an embedded GRASS GIS hydrodynamic 2D model that provides the flooding area due to the failure of a dam, given the geometry of the reservoir and downstream area, the initial conditions, and the dam breach geometry. The tool generates raster time series of water depth and flow velocity. The tool r.inund.fluv allows one to develop a fluvial potential inundation map given a high-resolution DTM of the area surrounding the river and a water surface profile calculated through a 1-D hydrodynamic model. GRASS GIS stores among its add-ons several hydrological tools to support flood hazard assessment:r.hydro.CASC2D, [53], is a physically-based, distributed, raster hydrologic model which simulates the hydrologic response of a watershed subject to a given rainfall field; r.water.fea, [54],is an interactive program that allows the user to simulate storm water runoff analysis using the finite element numerical technique; r.tokapi is a GIS GRASS script for the TOPKAPI (TOPographic Kinematic APproximation and Integration) model, and is a fully-distributed, physically-based hydrological model that can provide high-resolution information on the hydrological state of a catchment; r.sim.water, [55],is a landscape scale simulation model of overland flow designed for spatially-variable terrain, soil, cover, and rainfall excess conditions; HydroFOSS, [56], supports continuous simulations to determine flow rates and conditions during both runoff and dry periods. QGIS manages several plugins for pre- and post-processing of hydraulic modeling, such as Crayfish, QRAS, and RiverGIS, that are able to, for example, transfer depths and velocities from the hydraulics to the GIS flood analysis. Moreover, a newly developed QGIS tool, InaSAFE (http://inasafe.org/), enables communities, local governments, and disaster managers to use realistic natural hazard scenarios for floods, earthquakes, volcanoes, and tsunamis to underpin emergency planning, disaster preparedness, and response activities. InaSAFE’s openness, scalability, and adaptability make it an especially valuable tool for users seeking information about hazards and their impact [34].
The field of flood risk assessment is increasingly driven by open source software and tools. Open models can promote a level of transparency in risk assessment that represents an appealing change from the past, when assumptions, datasets, and methodologies, along with the associated uncertainties, were invisible to the end-user [34].

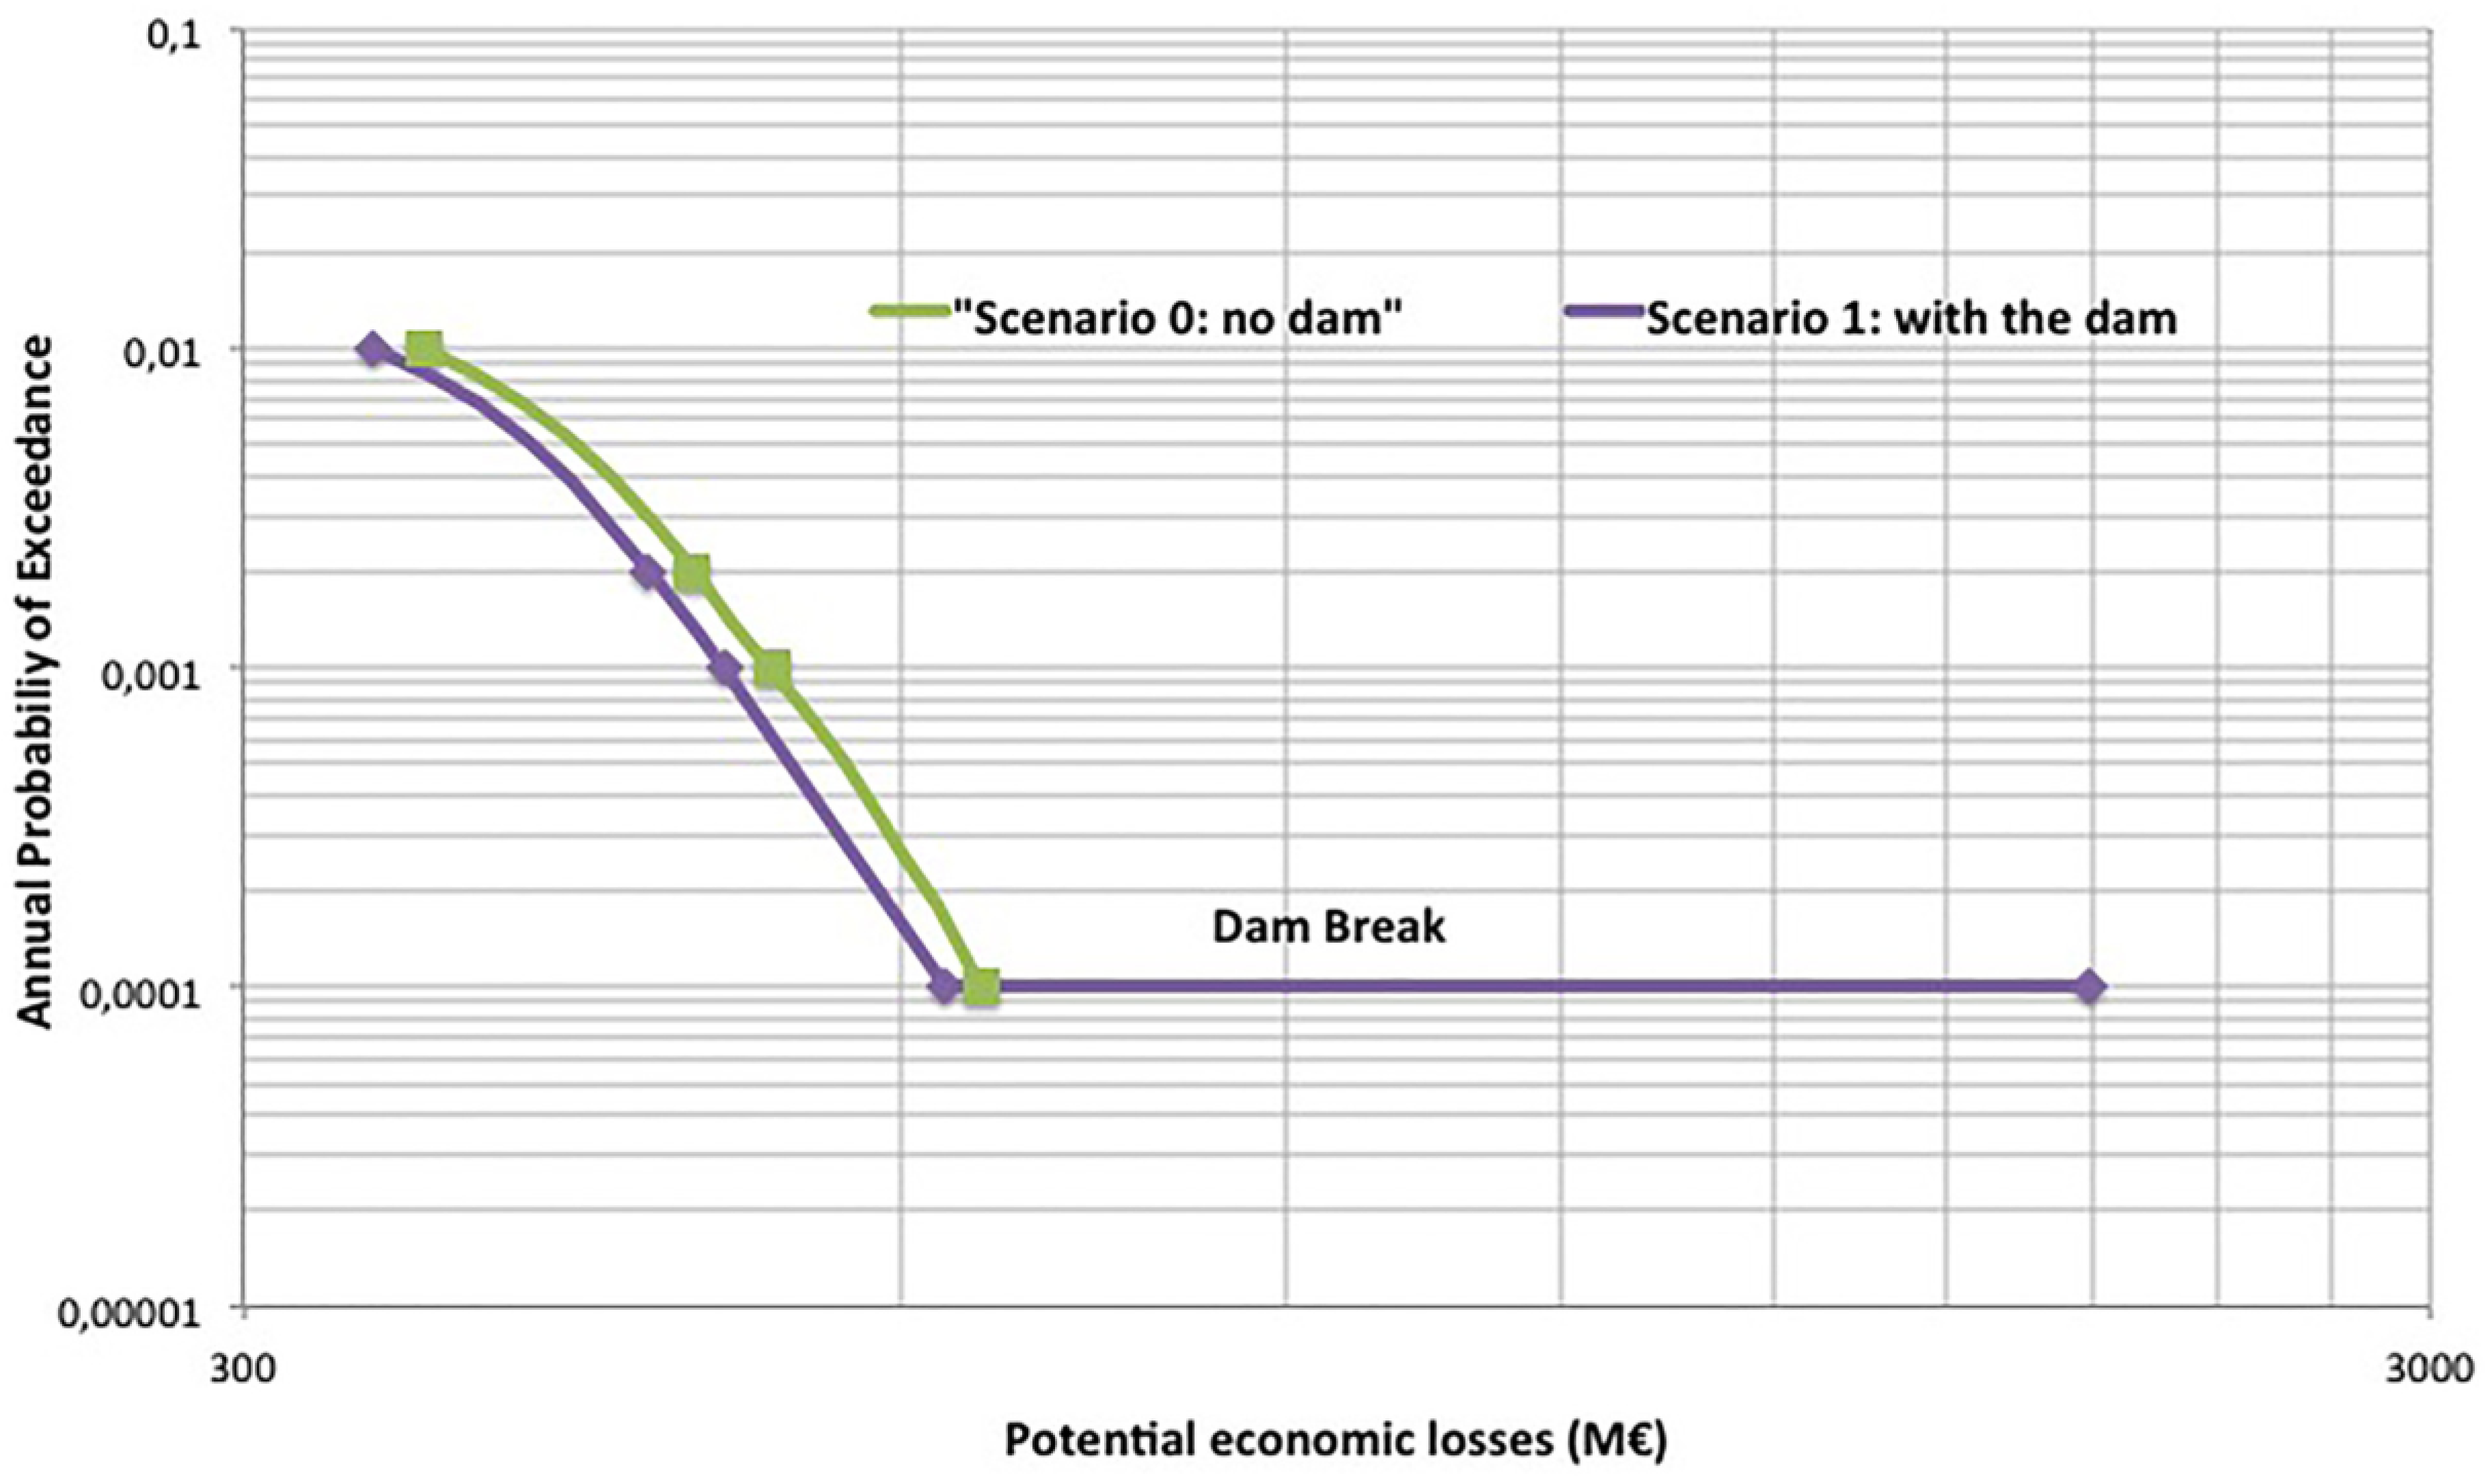
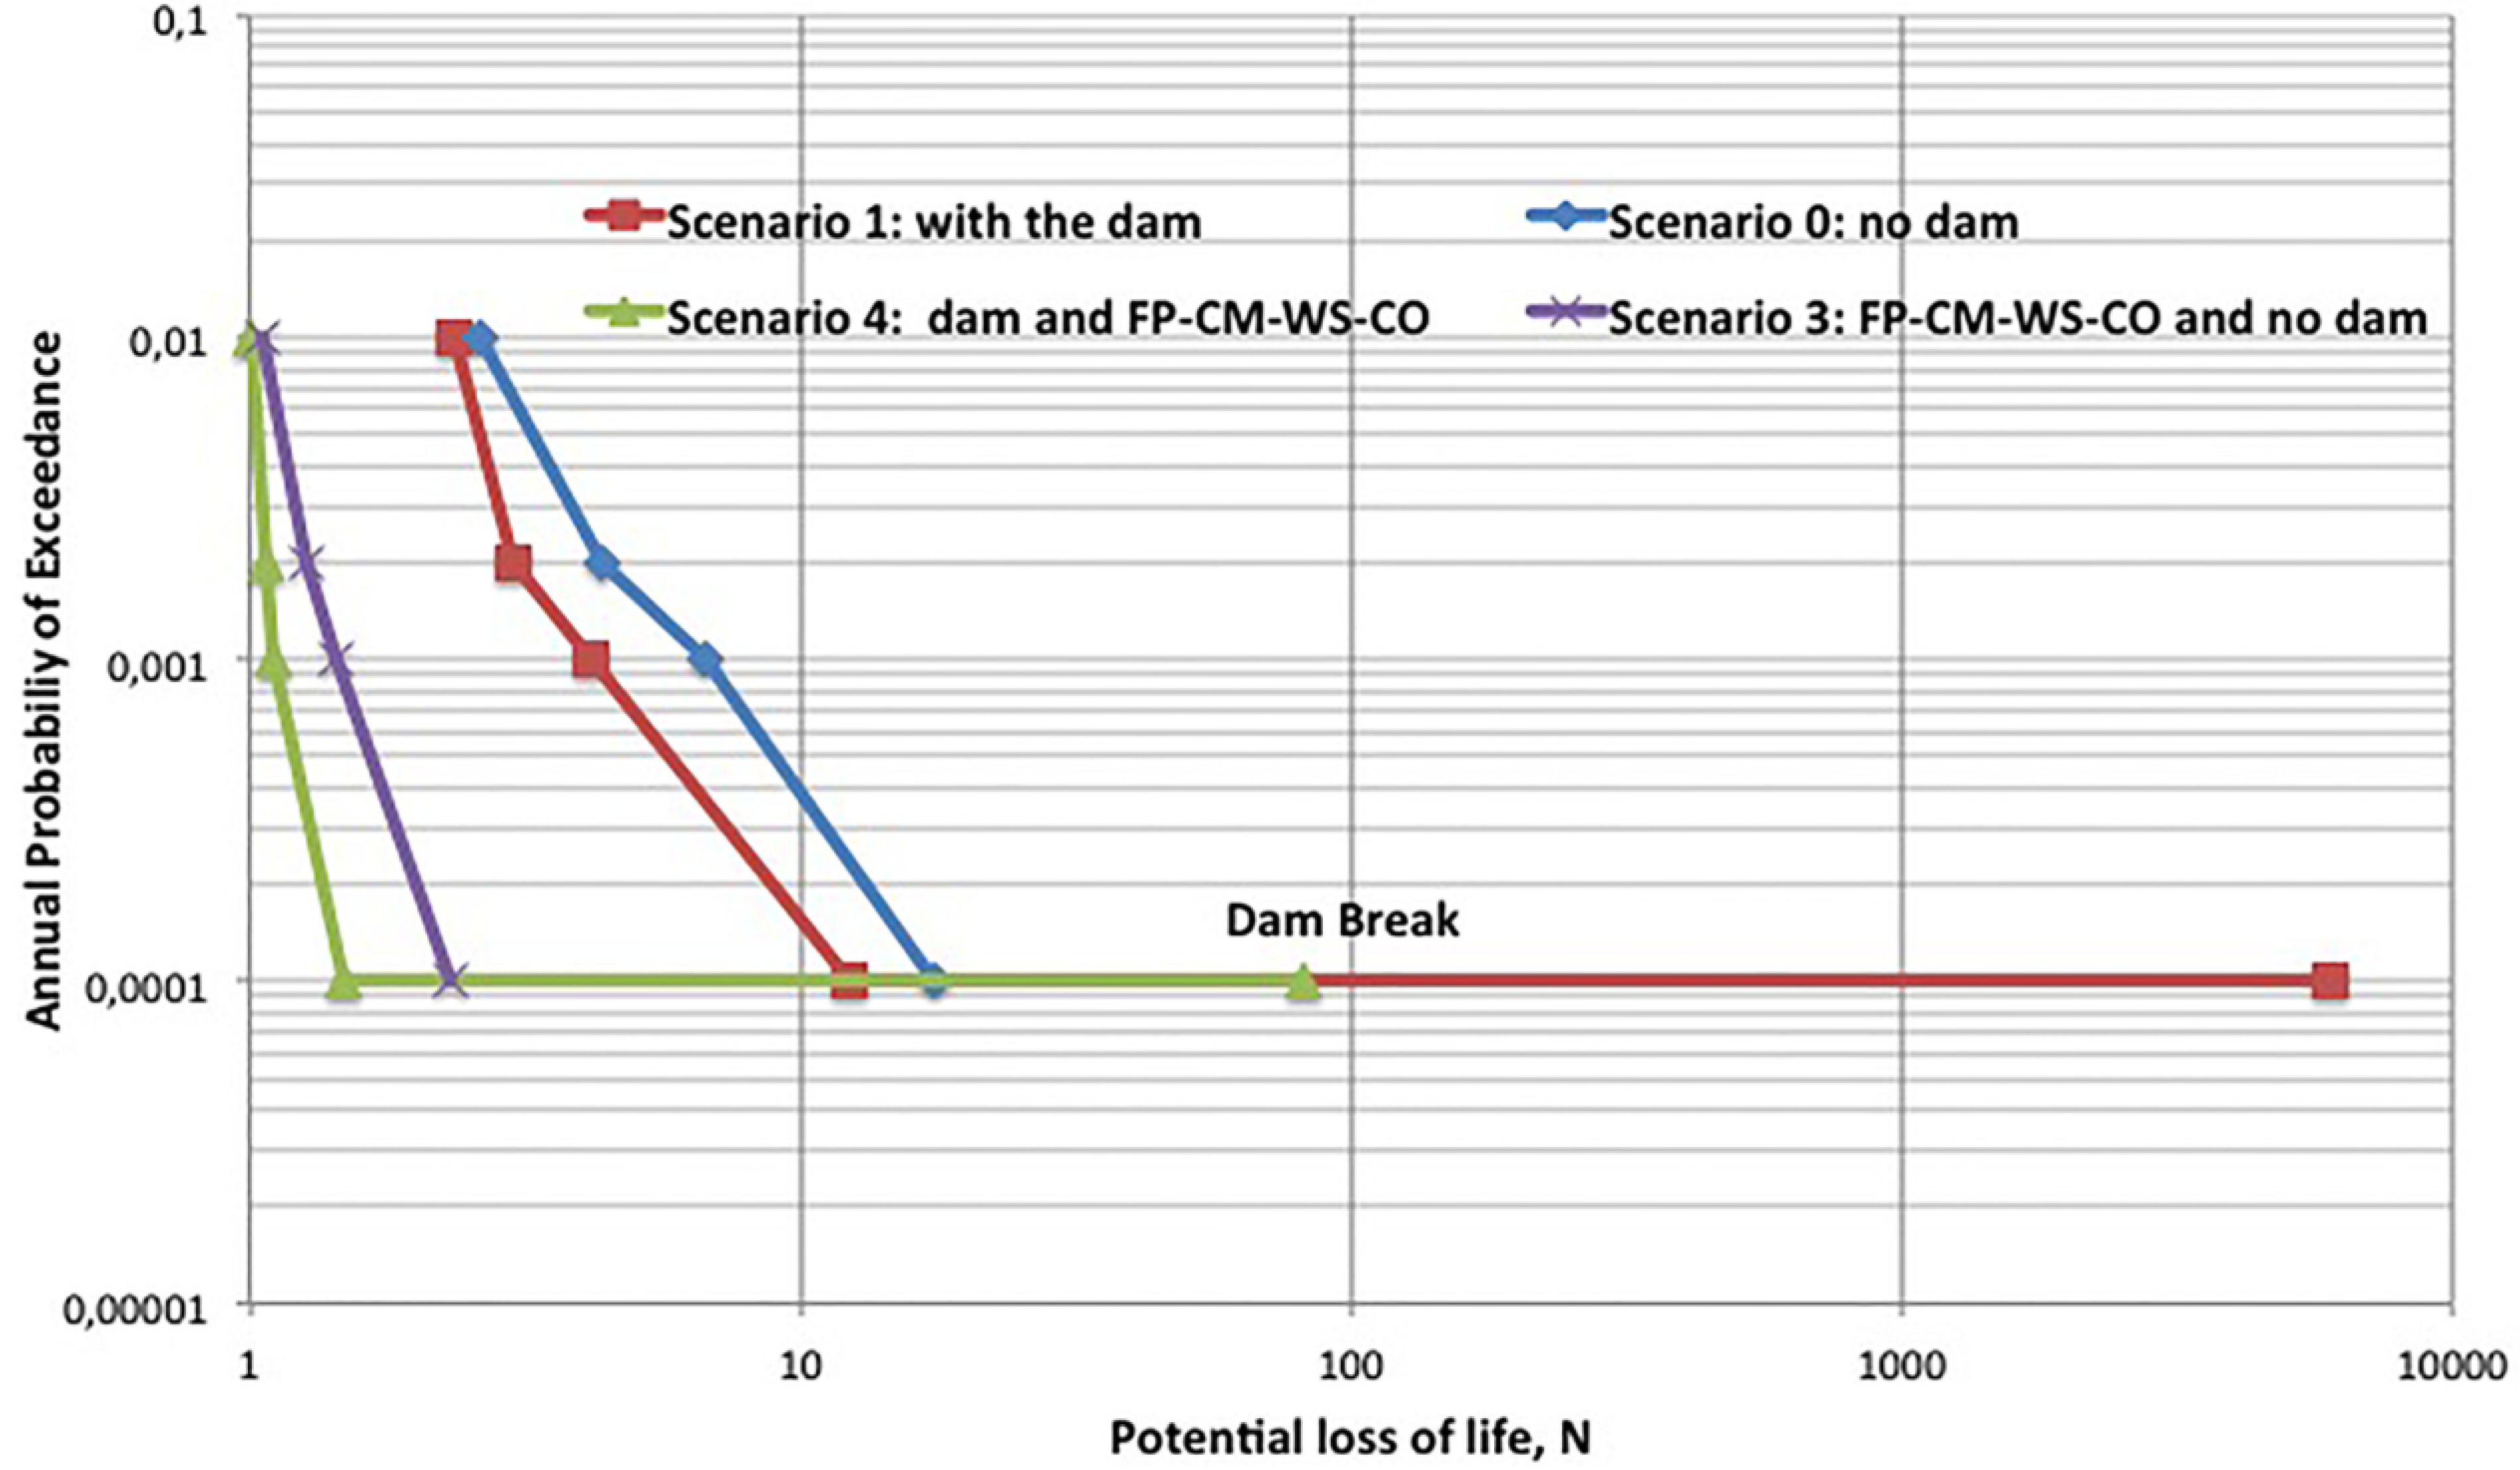
5.4. Outcomes of Flood Risk Analysis and Impact of Different Risk Reduction Measurements to Help Stakeholders in Their Compliance with the Floods Directive (2007/60/EC)

In assessing and comparing mitigation strategies and measures, the damage assessment and economic benefits are obviously important, but not sufficient, criteria. The flood risk analysis models should support a stakeholders’ decision that rests on a wider set of values and priorities than can be condensed into benefit-cost analysis. In theory, it is not sufficient to calculate the expected damages for just one inundation scenario but for all possible floods with the whole range of probabilities of occurrence. The Flood Directive [17] requires the evaluation of the damages for at least three inundation scenarios of different probabilities. In this way one can derive a loss-probability curve, showing the total risk as the area under the curve (annual average damage). These curves can be used to analyze the impact of different measures on the magnitude and frequency of consequences in order to support decision making to improve knowledge of risk management for the delineation of flood management plans prescribed by the Flood Directive [17].
An approach could be to represent the outcomes of risk models by the F-N and F-D curves [33,57]. The F-N or F-D curves represent the annual cumulative exceedance probability of a certain level of consequences; both social and economic risk can be represented in terms of potential fatalities or economic damages, respectively [33]. As an example, Figure 6 and Figure 7 show respectively the F-D and F-N curves of a hypothetical analysis performed on the data set provided for the workshop on the benchmarking of risk analysis for dam breaks entitled “Computational Challenges in Consequence Estimation for Risk Assessment” [58]. This analysis included four different alternatives: (i) the situation without any measurement; (ii) the situation with only structural measurement (e.g., a small dam); (iii) the situation with only non-structural measurements; and (iv) the combination of structural and non-structural measurements. The non-structural measurements, presented in this section, include the combination of public education on flood risk (EP), warning systems (WS), risk communication (CM), and coordination between emergency agencies and authorities (CO).
The curves show a decrease of direct economic damages and loss of life due to the implementation of structural and/or non-structural measurements except for the dam-break event. In this case, the F-N and F-D curves show a large step (see the bottom part of Figure 7). This step represents flood events resulting from failure of the flood defense infrastructure, i.e., in this case a small dam. If failure occurs, then the resulting flooding is, in general, related to a higher number of potential fatalities when compared with the non-failure situation. Therefore, flood events, which include potential failure of flood defense infrastructure, show higher n values than non-failure flood events, but associated with lower probabilities (“low probability-high consequence” flood events).
Figure 6. Example of risk information based on comparison of F–D curves for an idealized case study.
Ijgi 04 02704 g006
These types of quantitative and rigorous methodologies to represent flood risk are meaningful in order to support decision-making by providing information to prioritize risk reduction measures. This prioritization may be based on equity and efficiency principles, [21]. Hence, the limits of this method concerns not taking into account the right of individuals and society to be protected, and the right that the interests of all are treated with fairness, with the goal of placing all members of a society on an essentially equal footing in terms of the level of risk that they face [59]. Tolerability standards based on the use of F-N curves are still under debate and fall outside the scope of this paper. This requires the participation of all stakeholders involved in flood risk management to promote and achieve an integrated and broad vision of risk management towards good flood risk governance.
Figure 7. Example of risk information based on comparison of F-N curves for an idealized case study.
Ijgi 04 02704 g007

6. Conclusions and Further Research

In the first part of this article the main concepts of flood risk analysis and management were presented and discussed. The paper discussed the limitations of the commonly used risk analysis models to support stakeholders in their compliance with the Flood Directive [17]. The paper also explored the need to describe and organize actual knowledge in a workable procedure harmonized for a pan-European approach while providing room for including necessary regional adjustments. This is an ongoing challenge. However, the paper provides fundamental standard knowledge, and specifies key principles for risk analysis to provide guidance for practitioners of governmental authorities and executing bodies. On the one hand, we want to provide guidance to countries just starting with flood risk analysis studies in order to give them a starting point for the development of appropriate procedures to address the requirements of the EU flood directive [17]. On the other hand, we want to address practitioners in countries which already possess some experience in this field and we offer our recommendations to them; we also want to inspire them to improve their assessment methods, for example, by including issues that have traditionally been neglected.
This paper is a first effort to respond to the need for standard and harmonized tools and guidance to support decision-makers in the integration of risk analysis figures into decision-making. The methods used for flood risk analysis assessment vary considerably in Europe in terms of details. Therefore, we outlined recommendations for supporting a FRM pan-European approach that can be applied by different actors in risk management for their context specific aims, which includes all relevant cost types (comprehensive), considers and communicates uncertainties in an appropriate way (transparent) and accounts for changing hazards and risks (considers dynamics), (Figure 8). This vision particularly emphasizes the following aspects, summarized in Figure 8:
Figure 8. The final framework of recommendations for supporting a pan-European flood risk management approach.
Ijgi 04 02704 g008
  • Currently, the understanding of the flood risk analysis process and its use in terms of flood risk assessment usually leads to highly uncertain results. Hence, we recommend following the new EU FRM approach that outlines the importance of identifying sources of uncertainties, of reducing the uncertainties effectively, and documenting those that remain.
  • Increased effort should be devoted to integrate uncertainties in support decision-making tools in order to allow decision-makers and stakeholders to make more informed and better decisions.
  • Currently, sensitivity and uncertainty analyses, as well as validations are rarely carried out. One of the major sources of uncertainty concerns data sources; a framework for supporting data collection at the European level, while ensuring minimum data quality standards, would facilitate the development and consistency of European and national databases. In this way, improved data is expected to lead to a better understanding of the processes causing damages and costs and, hence, to validation and ex ante cost assessment methods for the different cost categories. Damage data also need to be differentiated according to different loss types and regional differences. This could increase the understanding of risk analysis processes to model them appropriately.
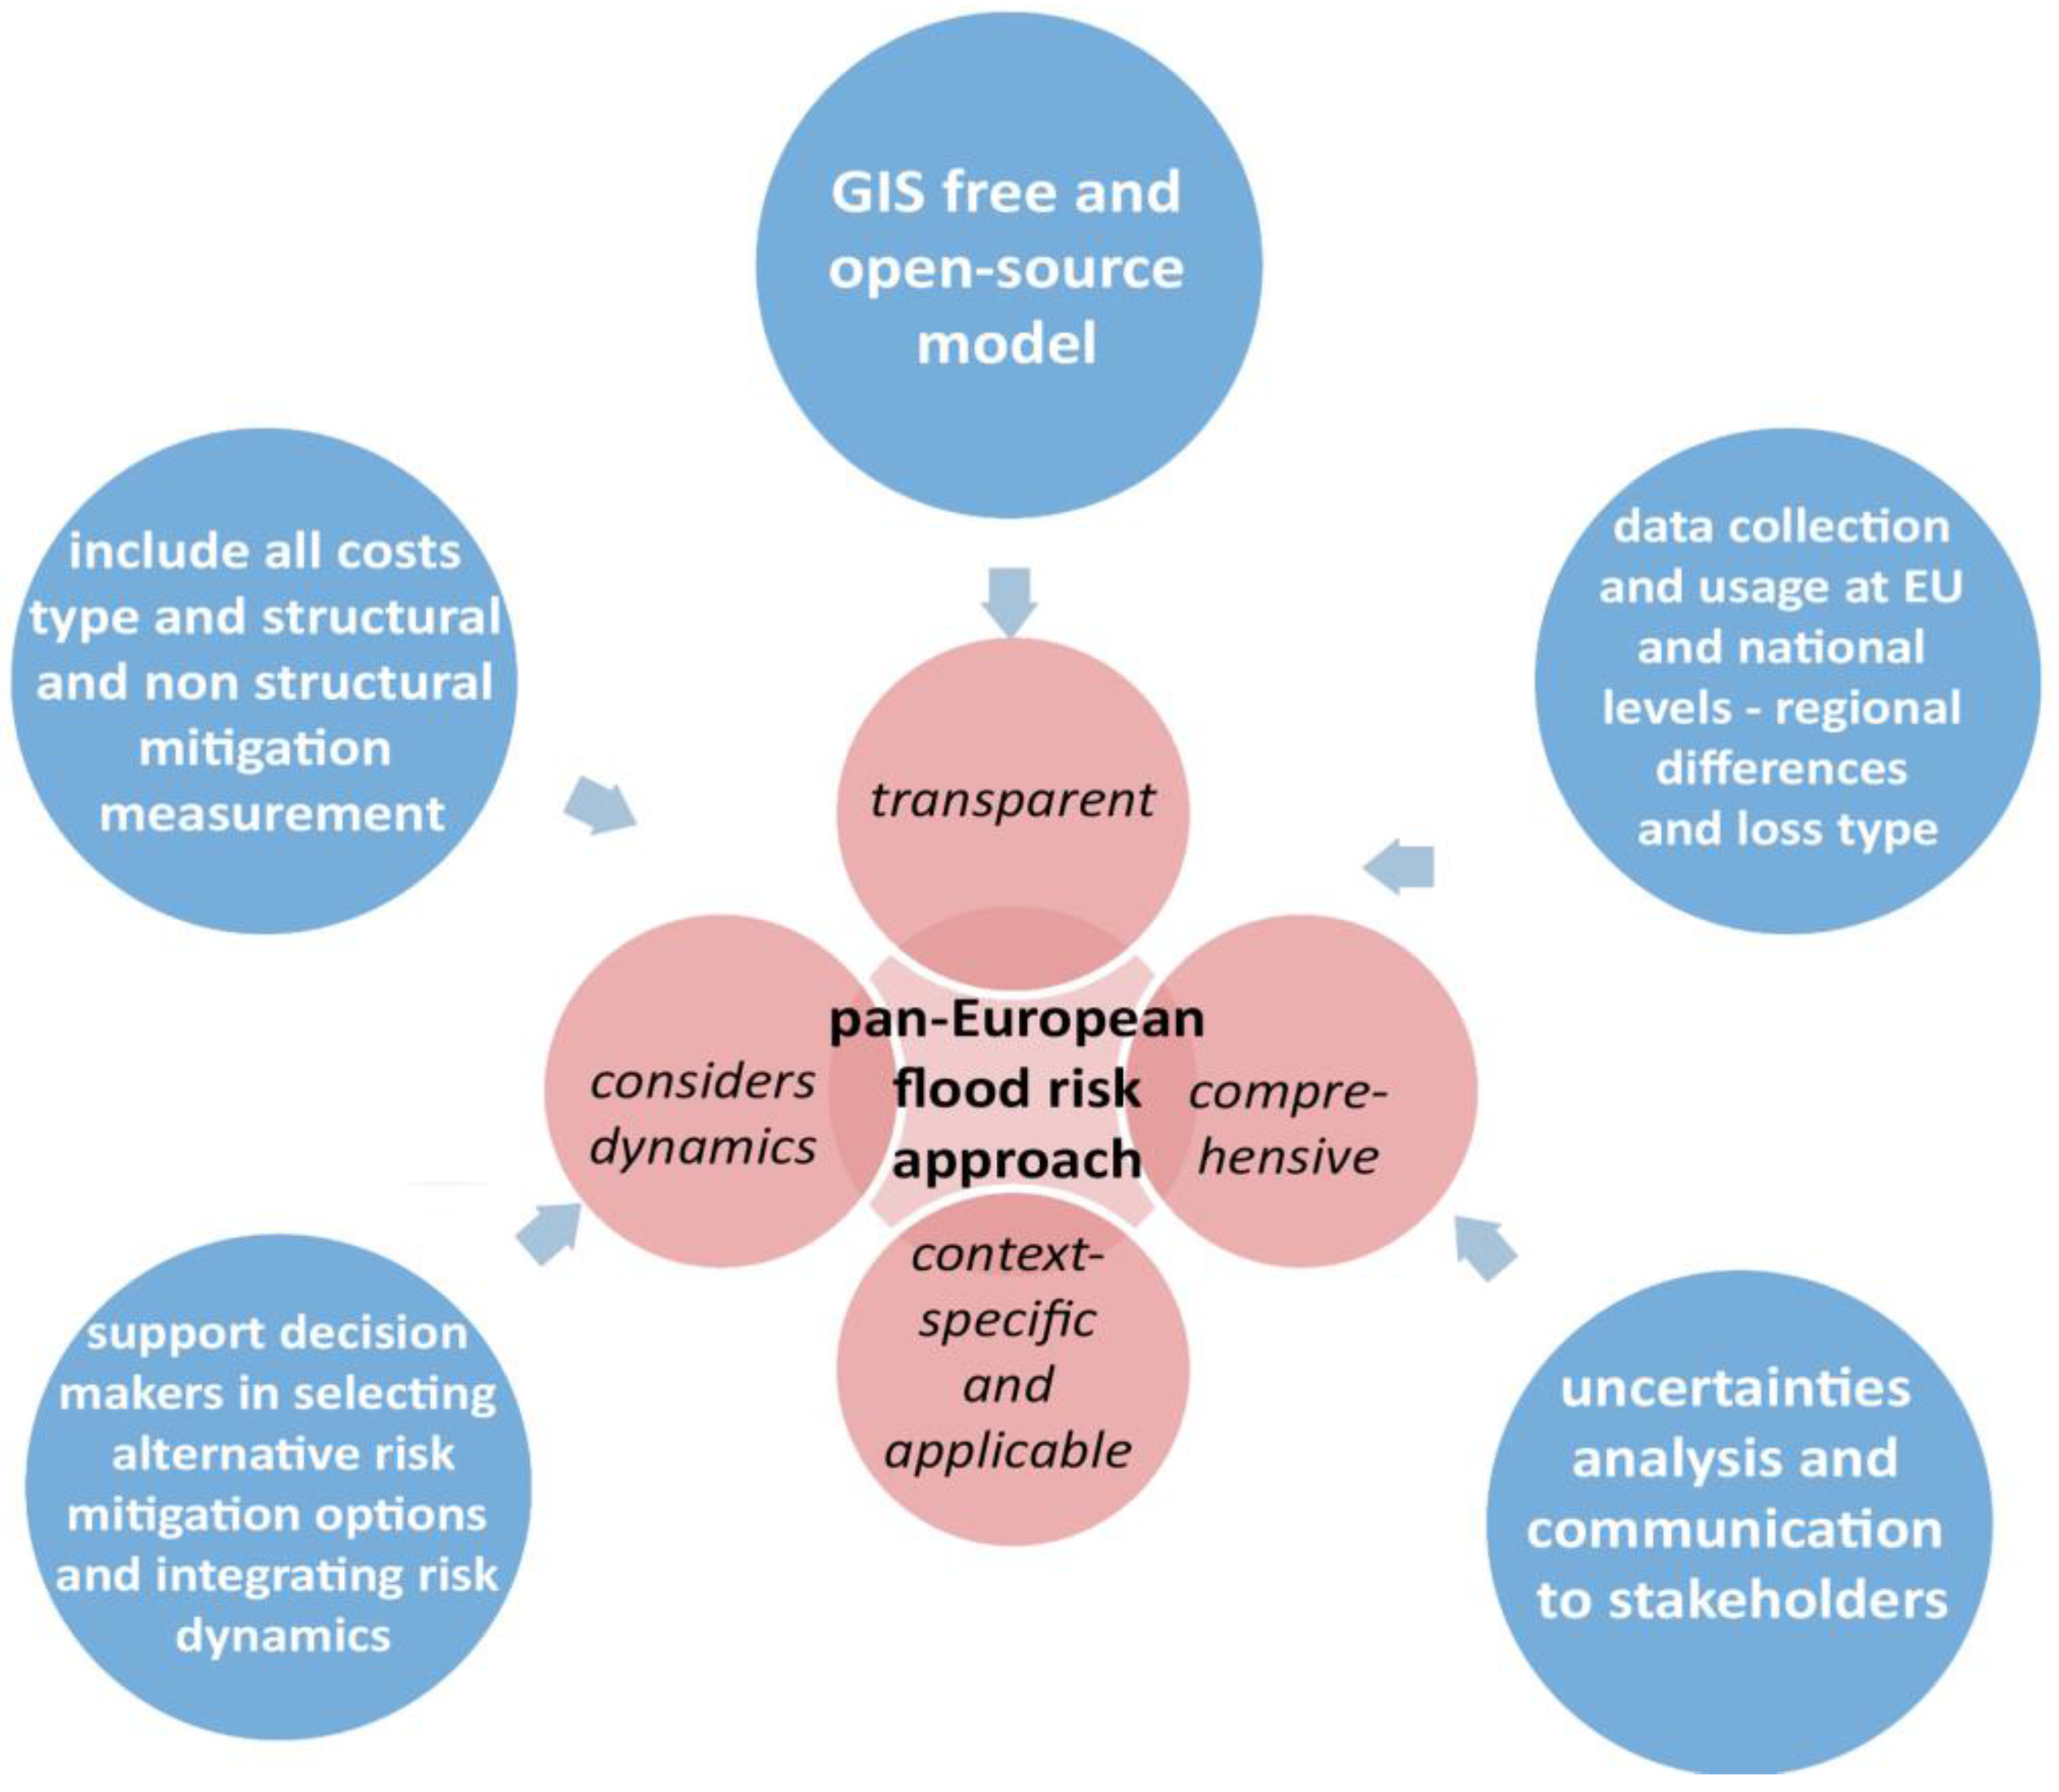
  • In this context, an improvement of models and tools is needed in terms of increasing the transparency and comprehensiveness of methods. A GIS FOSS model approach promotes learning and generates transparent knowledge through a process of guided discovery regarding spatio-temporal flood risk analysis.
  • Due to limited budgets and increasing risks, these models should also include all relevant types of costs, i.e., direct costs, costs due to business interruption, indirect costs, non-market/intangible costs as well as structural and nonstructural mitigation measures. These models aim to support decision makers in selecting alternative risk mitigation options (e.g., cost-benefit analysis) by communicating and providing them with information to prioritize risk reduction measures and integrating uncertainties and dynamics of risk, due to climate and socio-economic change, into their decision making process.

Acknowledgments

This work has been financed by the Research Fund for the Italian Electrical System under the Contract Agreement between RSE S.p.A. and the Ministry of Economic Development—General Directorate for Nuclear Energy, Renewable Energy and Energy Efficiency in compliance with the Decree of 8 March 2006.

Author Contributions

All authors have contributed equally to this work.

Conflicts of Interest

The authors declare no conflict of interest.

References

  1. Munich Re. Topics Geo Annual review: Natural Catastrophes 2005. Available online: http://www.preventionweb.net/files/1609_topics2005.pdf (accessed on day 6 April 2011).
  2. Meehl, G.A.; Tebaldi, C. More intense, more frequent, and longer last in heat waves in the 21st century. Science 2004, 305, 994–997. [Google Scholar] [CrossRef] [PubMed]
  3. Gao, X.J.; Giorgi, F. Increased aridity in the Mediterranean region under greenhouse gas forcing estimated from high resolution simulations with a regional climate model. Glob. Planet. Chang. 2008, 62, 195–209. [Google Scholar] [CrossRef]
  4. Adamowski, K.; Prokoph, A.; Adamowski, J. Development of a new method of wavelet aided trend detection and estimation. Hydrol. Process. 2009, 23, 2686–2696. [Google Scholar] [CrossRef]
  5. Adamowski, J.; Adamowski, K.; Bougadis, J. Influence of trend on short duration design storms. Water Resour. Manag. 2010, 24, 401–413. [Google Scholar] [CrossRef]
  6. Adamowski, K.; Prokoph, A.; Adamowski, J. Influence of the 11 year solar cycle on annual streamflow maxima in Canada. J. Hydrol. 2012, 442–443, 55–62. [Google Scholar]
  7. Nalley, D.; Adamowski, J.; Khalil, B. Using discrete wavelet transforms to analyze trends in stream flow and precipitation in Quebec and Ontario (1954–2008). J. Hydrol. 2012, 475, 204–228. [Google Scholar] [CrossRef]
  8. Nalley, D.; Adamowski, J.; Khalil, B.; Ozga-Zielinski, B. Trend detection in surface air temperature in Ontario and Quebec, Canada during 1967–2006 using the discrete wavelet transform. J. Atmos. Res. 2013, 132–133, 375–398. [Google Scholar] [CrossRef]
  9. Campisi, S.; Adamowski, J.; Oron, G. Forecasting urban water demand via wavelet-denoising and neural network models. Case study: City of Syracuse, Italy. Water Resour.Manag. 2012, 26, 3539–3558. [Google Scholar] [CrossRef]
  10. Araghi, A.; Adamowski, J.; Nalley, D.; Malard, J. Using wavelet transforms to estimate surface temperature trends and dominant periodicities in Iran based on gridded reanalysis data. J. Atmos. Res. 2015, 11, 52–72. [Google Scholar] [CrossRef]
  11. Haidary, A.; Amiri, B.J.; Adamowski, J.; Fohrer, N.; Nakane, K. Assessing the impacts of four land use types on the water quality of wetlands in Japan. Water Resour. Manag. 2013, 27, 2217–2229. [Google Scholar] [CrossRef]
  12. Pingale, S.; Khare, D.; Jat, M.; Adamowski, J. Spatial and temporal trends of mean and extreme rainfall and temperature for the 33 urban centres of the arid and semi-arid state of Rajasthan, India. J. Atmos. Res. 2014, 138, 73–90. [Google Scholar] [CrossRef]
  13. Halbe, J.; Pahl-Wostl, C.; Sendzimir, J.; Adamowski, J. Towards adaptive and integrated management paradigms to meet the challenges of water governance. Water Sci. Technol. 2013, 67, 2651–2660. [Google Scholar] [CrossRef] [PubMed]
  14. Straith, D.; Adamowski, J.; Reilly, K. Exploring the attributes, strategies and contextual knowledge of champions of change in the Canadian water sector. Can. Water Resour. J. 2014, 393, 255–269. [Google Scholar] [CrossRef]
  15. Inam, A.; Adamowski, J.; Halbe, J.; Prasher, S. Using causal loop diagrams for the initialization of stakeholder engagement in soil salinity management in agricultural watersheds in developing countries: A case study in the Rechna Doab watershed, Pakistan. J. Environ. Manag. 2015, 152, 251–267. [Google Scholar] [CrossRef] [PubMed]
  16. Butler, C.; Adamowski, J. Empowering marginalized communities in water resources management: Addressing inequitable practices in Participatory Model Building. J. Environ. Manag. 2015, 153, 153–162. [Google Scholar] [CrossRef] [PubMed]
  17. European Parliament and the Council of the European Union. Directive2007/60/EC on the Assessment and Management of Floodrisks; European Commission: Brussels, Belgium, 2007. [Google Scholar]
  18. Kreibich, H.; van den Bergh, J.C.J.M.; Bouwer, L.M.; Bubeck, P.; Ciavola, P.; Green, C.; Hallegatte, S.; Logar, I.; Meyer, V.; Schwarze, R.; et al. Costing natural hazards. Nat. Clim. Chang. 2014, 4, 303–306. [Google Scholar] [CrossRef]
  19. Krysanova, V.; Buiteveld, H.; Haase, D.; Hattermann, F.F.; van Niekerk, K.; Roest, K.; Martínez-Santos, P.; Schluter, M. Practices and Lessons Learned in Coping with Climatic Hazardsat the River-Basin Scale: Floods and Droughts. Available online: http://www.ecologyandsociety.org/vol13/iss2/art32/ (accessed on day 19 January 2009).
  20. Apel, H.; Aronica, G.T.; Kreibich, H.; Thieken, A.H. Flood risk analyses—How detailed do we need to be? Nat. Hazards 2009, 49, 79–98. [Google Scholar] [CrossRef]
  21. Commission Internationale des Grands Barrage. Risk Assessment in Dam Safety Management: A Reconnaissance of Benefits, Methods and Current Applications; Commission Internationale des Grands Barrage: Paris, France, 2005; p. 276. [Google Scholar]
  22. Klijn, F. Flood Risk Assessment and Flood Risk Management. An Introduction and Guidance Based on Experiences and Findings of FLOODsite; FLOODsite Project: Delft, the Netherland, 2009. [Google Scholar]
  23. Meyer, V.; Becker, N.; Markantonis, V.; Schwarze, R.; van den Bergh, J.C.J.M.; Bouwer, L.M.; Bubeck, P.; Ciavola, P.; Genovese, E.; Green, C.; et al. Review article: Assessing the costs of natural hazards-State of the art and knowledge gaps. Nat. Hazards Earth Syst. Sci. 2013, 13, 1351–1373. [Google Scholar] [CrossRef]
  24. Samuels, P.; Gouldby, B. Language of Risk—Project Definitions (Second Edition); FLOODsite Project: Delft, the Netherland, 2009. [Google Scholar]
  25. Klijn, F.; Mens, M.J.P.; Asselman, N.E.M. Flood risk management for an uncertain future: Robustness and economic efficiency perspectives compared for the Meuse River (Netherlands). Mitig. Adapt. Strateg. Glob. Chang. 2015, 6, 1011–1026. [Google Scholar] [CrossRef]
  26. Jongman, B.; Kreibich, H.; Apel, H.; Barredo, J.I.; Bates, P.D.; Feyen, L.; Gericke, A.; Neal, J.; Aerts, J.C.J.H.; Ward, P.J. Comparative flood damage model assessment: Towards a European approach. Nat. Hazards Earth Syst. Sci. 2012, 12, 3733–3752. [Google Scholar] [CrossRef] [Green Version]
  27. Albano, R.; Sole, A.; Adamowski, J. READY: A web-based geographical information system for enhanced flood resilience through raising awareness in citizens. Nat. Hazards Earth Syst. Sci. 2015, 15, 1645–1658. [Google Scholar] [CrossRef]
  28. Merz, B.; Kreibich, H.; Schwarze, R.; Thieken, A. Review article “Assessment of economic flood damage”. Nat. Hazards Earth Syst. Sci. 2010, 10, 1697–1724. [Google Scholar] [CrossRef]
  29. Green, C.; Viavattene, C.; Thompson, P. Guidance for Assessing Flood Losses—CONHAZ Report. Available online: http://www.mdx.ac.uk/__data/assets/pdf_file/0006/58794/floodsWP_FINALREPORTsept11.pdf (accessed on 9 September 2015).
  30. de Moel, H.; Asselman, N.E.M.; Aerts, J.C.J.H. Uncertainty and sensitivity analysis of coastal flood damage estimates in the west of the Netherlands. Nat. Hazards Earth Syst. Sci. 2012, 12, 1045–1058. [Google Scholar] [CrossRef]
  31. Smith, D.I. Actual and potential flood damage: A case study for urban Lismore, NSW, Australia. Appl. Geogr. 1981, 1, 31–39. [Google Scholar] [CrossRef]
  32. Albano, R.; Sole, A.; Adamowski, J.; Mancusi, L. A GIS-based model to estimate flood consequences and the degree of accessibility and operability of strategic emergency response structures in urban areas. Nat. Hazards Earth Syst. Sci. 2014, 14, 2847–2865. [Google Scholar] [CrossRef]
  33. Escuder-Bueno, I.; Castillo-Rodríguez, J.T.; Zechner, S.; Jöbstl, C.; Perales-Momparler, S.; Petaccia, G. A quantitative flood risk analysis methodology for urban areas with integration of social research data. Nat. Hazards Earth Syst. Sci. 2012, 12, 2843–2863. [Google Scholar] [CrossRef]
  34. World Bank. Understanding Risk in An Evolving World—Emerging Best Practices in Natural Disaster Risk Assessment; World Bank: Columbia, DC, USA, 2014. [Google Scholar]
  35. Jonkman, S.N.; Kok, M.; Vrijling, J.K. Flood risk assessment in the Netherlands: A case study for dike ring South Holland. Risk Anal. 2008, 28, 1357–1374. [Google Scholar] [CrossRef] [PubMed]
  36. Handmer, J. The chimera of precision: Inherent uncertainties in disaster loss assessment. Aust. J. Emerg. Manag. 2013, 18, 88–97. [Google Scholar]
  37. Heuvelink, G.B.M. Error Propagation in Environmental Modelling with GIS; CRC Press: Boca Raton, FL, USA, 1998; p. 146. [Google Scholar]
  38. de Moel, H.; Aerts, J.C.J.H. Effect of uncertainty in land use, damage models and inundation depth on flood damage estimates. Nat. Hazard 2011, 58, 407–425. [Google Scholar] [CrossRef]
  39. Amicarelli, A.; Albano, R.; Mirauda, D.; Agate, G.; Sole, A.; Guandalini, R. A Smoothed Particle Hydrodynamics model for 3D solid body transport in free surface flows. Comput. Fluids 2015, 116, 205–228. [Google Scholar] [CrossRef]
  40. Beven, K.J.; Binley, A. The future of distributed models: Model calibration and uncertainty prediction. Hydrol. Process. 1992, 6, 279–298. [Google Scholar] [CrossRef]
  41. Poeter, E.P.; Hill, M.C. UCODE, a computer code for universal inverse modeling. Comput. Geosci. 1999, 25, 457–462. [Google Scholar] [CrossRef]
  42. Federal Emergency Management Agency. HAZUS-MH MR4 Flood Model Technical Manual, 2009; Federal Emergency Management Agency: Washington, DC, USA, 2009.
  43. Kok, M.; Huizinga, H.J.; Vrouwenvelder, A.C.W.M.; Barendregt, A. Standard Method 2004 Damage and Casualties Caused by Flooding; Road and Hydraulic Engineering Institute: Delft, the Netherlands, 2005. [Google Scholar]
  44. International Commission for the Protection of the Rhine (ICPR). Action Plan on Flood Defence; International Commission for the Protection of the Rhine: Koblenz, Germany, 1998. [Google Scholar]
  45. Vanneuville, W.; Gamanya, R.K.; de Rouck, K.; Maeghe, K.; de Maeyer, P.; Mostaert, F. Development of a Flood Risk Model and applications in the management of hydrographical catchments. In Proceedings of the Cartographic Cutting-Edge Technology for Natural Hazard Management, Dresden, Germany, 20–22 October 2004.
  46. Klijn, F.; Baan, P.; deBruijn, K.M.; Kwadijk, J. Overstromingsrisico’s in Nederland in een veranderend klimaat: Verwachtingen, Schattingenen Berekeningen voor Het Project Nederland Later; Delft Hydraulics: delft, the Netherlands, 2007. [Google Scholar]
  47. Huizinga, H.J. Flood Damage Functions for EU Member States: Flood Risk Mapping Using Corine Land Cover Datasets; European Commission: Brussels, Belgium, 2010. [Google Scholar]
  48. Penning-Rowsell, E.; Viavattene, C.; Pardoe, J.; Chatterton, J.; Parker, D.; Morris, J. The Benefits of Flood and Coastal Risk Management: A Handbook of Assessment Techniques; Flood Hazard Research Centre: London, UK, 2010. [Google Scholar]
  49. Thieken, A.H.; Olschewski, A.; Kreibich, H.; Kobsch, S.; Merz, B. Development and evaluation of FLEMOps—A new flood loss estimation model for the private sector. In Flood Recovery, Innovation and Response; Proverbs, D., Brebbia, C.A., Penning-Rowsell, E., Eds.; WIT Press: Ashurst, UK, 2008; pp. 315–324. [Google Scholar]
  50. De Bono, A.; Chatenoux, B. A Global Exposure Model for GAR 2015, UNEP/Grid-Geneva; UNISDR: Geneva, Switzerland, 2015. [Google Scholar]
  51. Di Leo, M.; Manfreda, S.; Fiorentino, M. An automated procedure for the detection of flood Prone areas: r.hazard.flood. Geomat. Workb. 2011, 10, 83–89. [Google Scholar]
  52. Cannata, M.; Marzocchi, R. Two-dimensional dam break flooding simulation: A GIS embedded approach. Nat. Hazards 2012, 61, 1143–1159. [Google Scholar] [CrossRef]
  53. Rojas, R.; Julien, P.Y.; Johson, B. A 2-Dimensional Rainfall-Runoff and Sediment Model. Available online: http://www.engr.colostate.edu/~pierre/ce_old/Projects/CASC2D-SED%20Web%20site%20082506/Download_files/CASC2D-SED-Reference-Manual.pdf (Accessed on 22 January 2004).
  54. Vieux, B.E.; Bralts, V.F.; Segerlind, L.J.; Wallace, R.B. Finite element watershed modeling:One-dimensional elements. J. Water Resour. Plan.Manag. 1990, 116, 803–819. [Google Scholar] [CrossRef]
  55. Mitasova, H.; Thaxton, C.; Hofierka, J.; McLaughlin, R.; Moore, A.; Mitas, L. Path sampling method for modeling overland water flow, sediment transport and short term terrain evolution in Open Source GIS. In Proceedings of the XVth International Conference on Computational Methods in Water Resources (CMWR XV), Chapel Hill, NC, USA, 13–17 June 2004; pp. 1479–1490.
  56. Cannata, M.; Brovelli, A. An Overview of HydroFOSS, a Novel GIS Embedded Hydrological Model. Available online: http://meetings.copernicus.org/www.cosis.net/abstracts/EGU06/04835/EGU06-J-04835.pdf (accessed on day 12 January 2006).
  57. Jonkman, S.N.; Jongejan, R.; Maaskant, B. The use of individual and societal risk criteria within the Dutch flood safety policy—Nationwide estimates of societal risk and policy applications. Risk Anal. 2011, 31, 282–300. [Google Scholar] [CrossRef] [PubMed]
  58. Seda-Sanabria, Y.; Matheu, E.E.; McPherson, T.N. Computational challenges in consequence estimation for risk assessment. In Proceedings of the ICOLD—12th International Benchmark Workshop on Numerical Analysis of Dams, Graz, Austria, 2–4 October 2013.
  59. Castillo-Rodríguez, J.T.; Escuder-Bueno, I.; Altarejos-García, L.; Serrano-Lombillo, A. The value of integrating information from multiple hazards for flood risk analysis and management. Nat. Hazards Earth Syst. Sci. 2014, 14, 379–400. [Google Scholar] [CrossRef]

