1. Introduction
Protected areas (PAs) are essential for preserving biodiversity. The fulfilment of their conservation objectives depends, among other factors, on the availability of reliable information that can be used to support management and funding decisions. Information on PAs is, however, often incomplete, not harmonized, or not readily accessible, making it difficult for end-users (managers, funding agencies) to reliably compare the characteristics and values of different PAs across sites, countries or regions. These constraints on data availability and comparability are a significant bottleneck in the international initiatives and political targets that aim to improve the PA systems through enhanced support to their management and funding, as well as in the global efforts for PA monitoring and assessment that are required to track progress towards those targets.
Biodiversity loss has continued largely unabated despite increased efforts by the international community and several conservation successes [
1,
2]. The 10th meeting of the UN Convention on Biological Diversity (CBD) thus adopted in 2010 an ambitious Strategic Plan for Biodiversity, including the 20 Aichi Biodiversity Targets, for the 2011−2020 period. Among the targets, Target 11 states “
By 2020, at least 17 per cent of terrestrial and inland water areas and 10 per cent of coastal and marine areas, especially areas of particular importance for biodiversity and ecosystem services, are conserved through effectively and equitably managed, ecologically representative and well-connected systems of protected areas and other effective area-based conservation measures, and integrated into the wider landscapes and seascapes.” The EU has pledged to meet the international biodiversity targets agreed under the CBD by 2020. Because PAs play a key role in biodiversity conservation and the sustainable use of natural resources [
3,
4], these are at the heart of many conservation initiatives such as Natura 2000. This network of PAs is designed to ensure the long-term survival of Europe’s most valuable and threatened species and habitats, listed under the Birds Directive and the Habitats Directive [
5]. Target 6 of the EU Biodiversity Strategy addresses the EU contribution to global conservation and requires that, by 2020, the EU steps up its contribution to avert global biodiversity loss by greening its economy and endeavoring to reduce its pressure on global biodiversity. The 11th meeting of the CBD in Hyderabad, India (2012) further saw The Parties of the CBD agreeing on an overall substantial increase of total biodiversity-related funding for the implementation of the Strategic Plan. The objectives of the Hyderabad commitment included the setting of a preliminary target of doubling total biodiversity-related international financial resource flows to developing countries by 2015 and at least maintaining this level by 2020. This is a substantial effort for the EU considering that EuropeAid, the European Commission’s Directorate for International Cooperation and Development, invested alone already around €1.3 billion in biodiversity-related projects between 2007 and 2013 to support developing countries to meet their targets [
6].
Deploying simple means to assess progress towards Aichi Target 11 can certainly help to identify countries where more conservation efforts are required. Still, identifying PAs which have greatest value in terms of biological resources, and those which are the most threatened by human activities, is even more important to ensure that the most important and/or vulnerable areas are protected. From the perspective of a decision maker, this means that PAs can be compared through appropriate indicators, so that funding can be allocated first to those PAs with the highest biodiversity values and exposed to the highest pressures. Further research would, however, be needed to assess the long-term conservation potential of the PA considering growing threats coming from the competition for land, from potentially increasing PA isolation and from climate change. A science-based conservation strategy requires thus that decision makers have access to a wealth of comparable information across all scales which further need to be summarized into a smaller set of key indicators to support decision making. However, such information is often difficult to find and access, in particular for developing countries.
It is the objective of the Digital Observatory for Protected Areas (DOPA) to support the European Union’s efforts “
to substantially strengthen the effectiveness of international governance for biodiversity and ecosystem services” (EC/COM/2006/0216 final) and more generally for “
strengthening the capacity to mobilize and use biodiversity data, information and forecasts so that they are readily accessible to policymakers, managers, experts and other users” (UNEP/CBD/COP/10/27) [
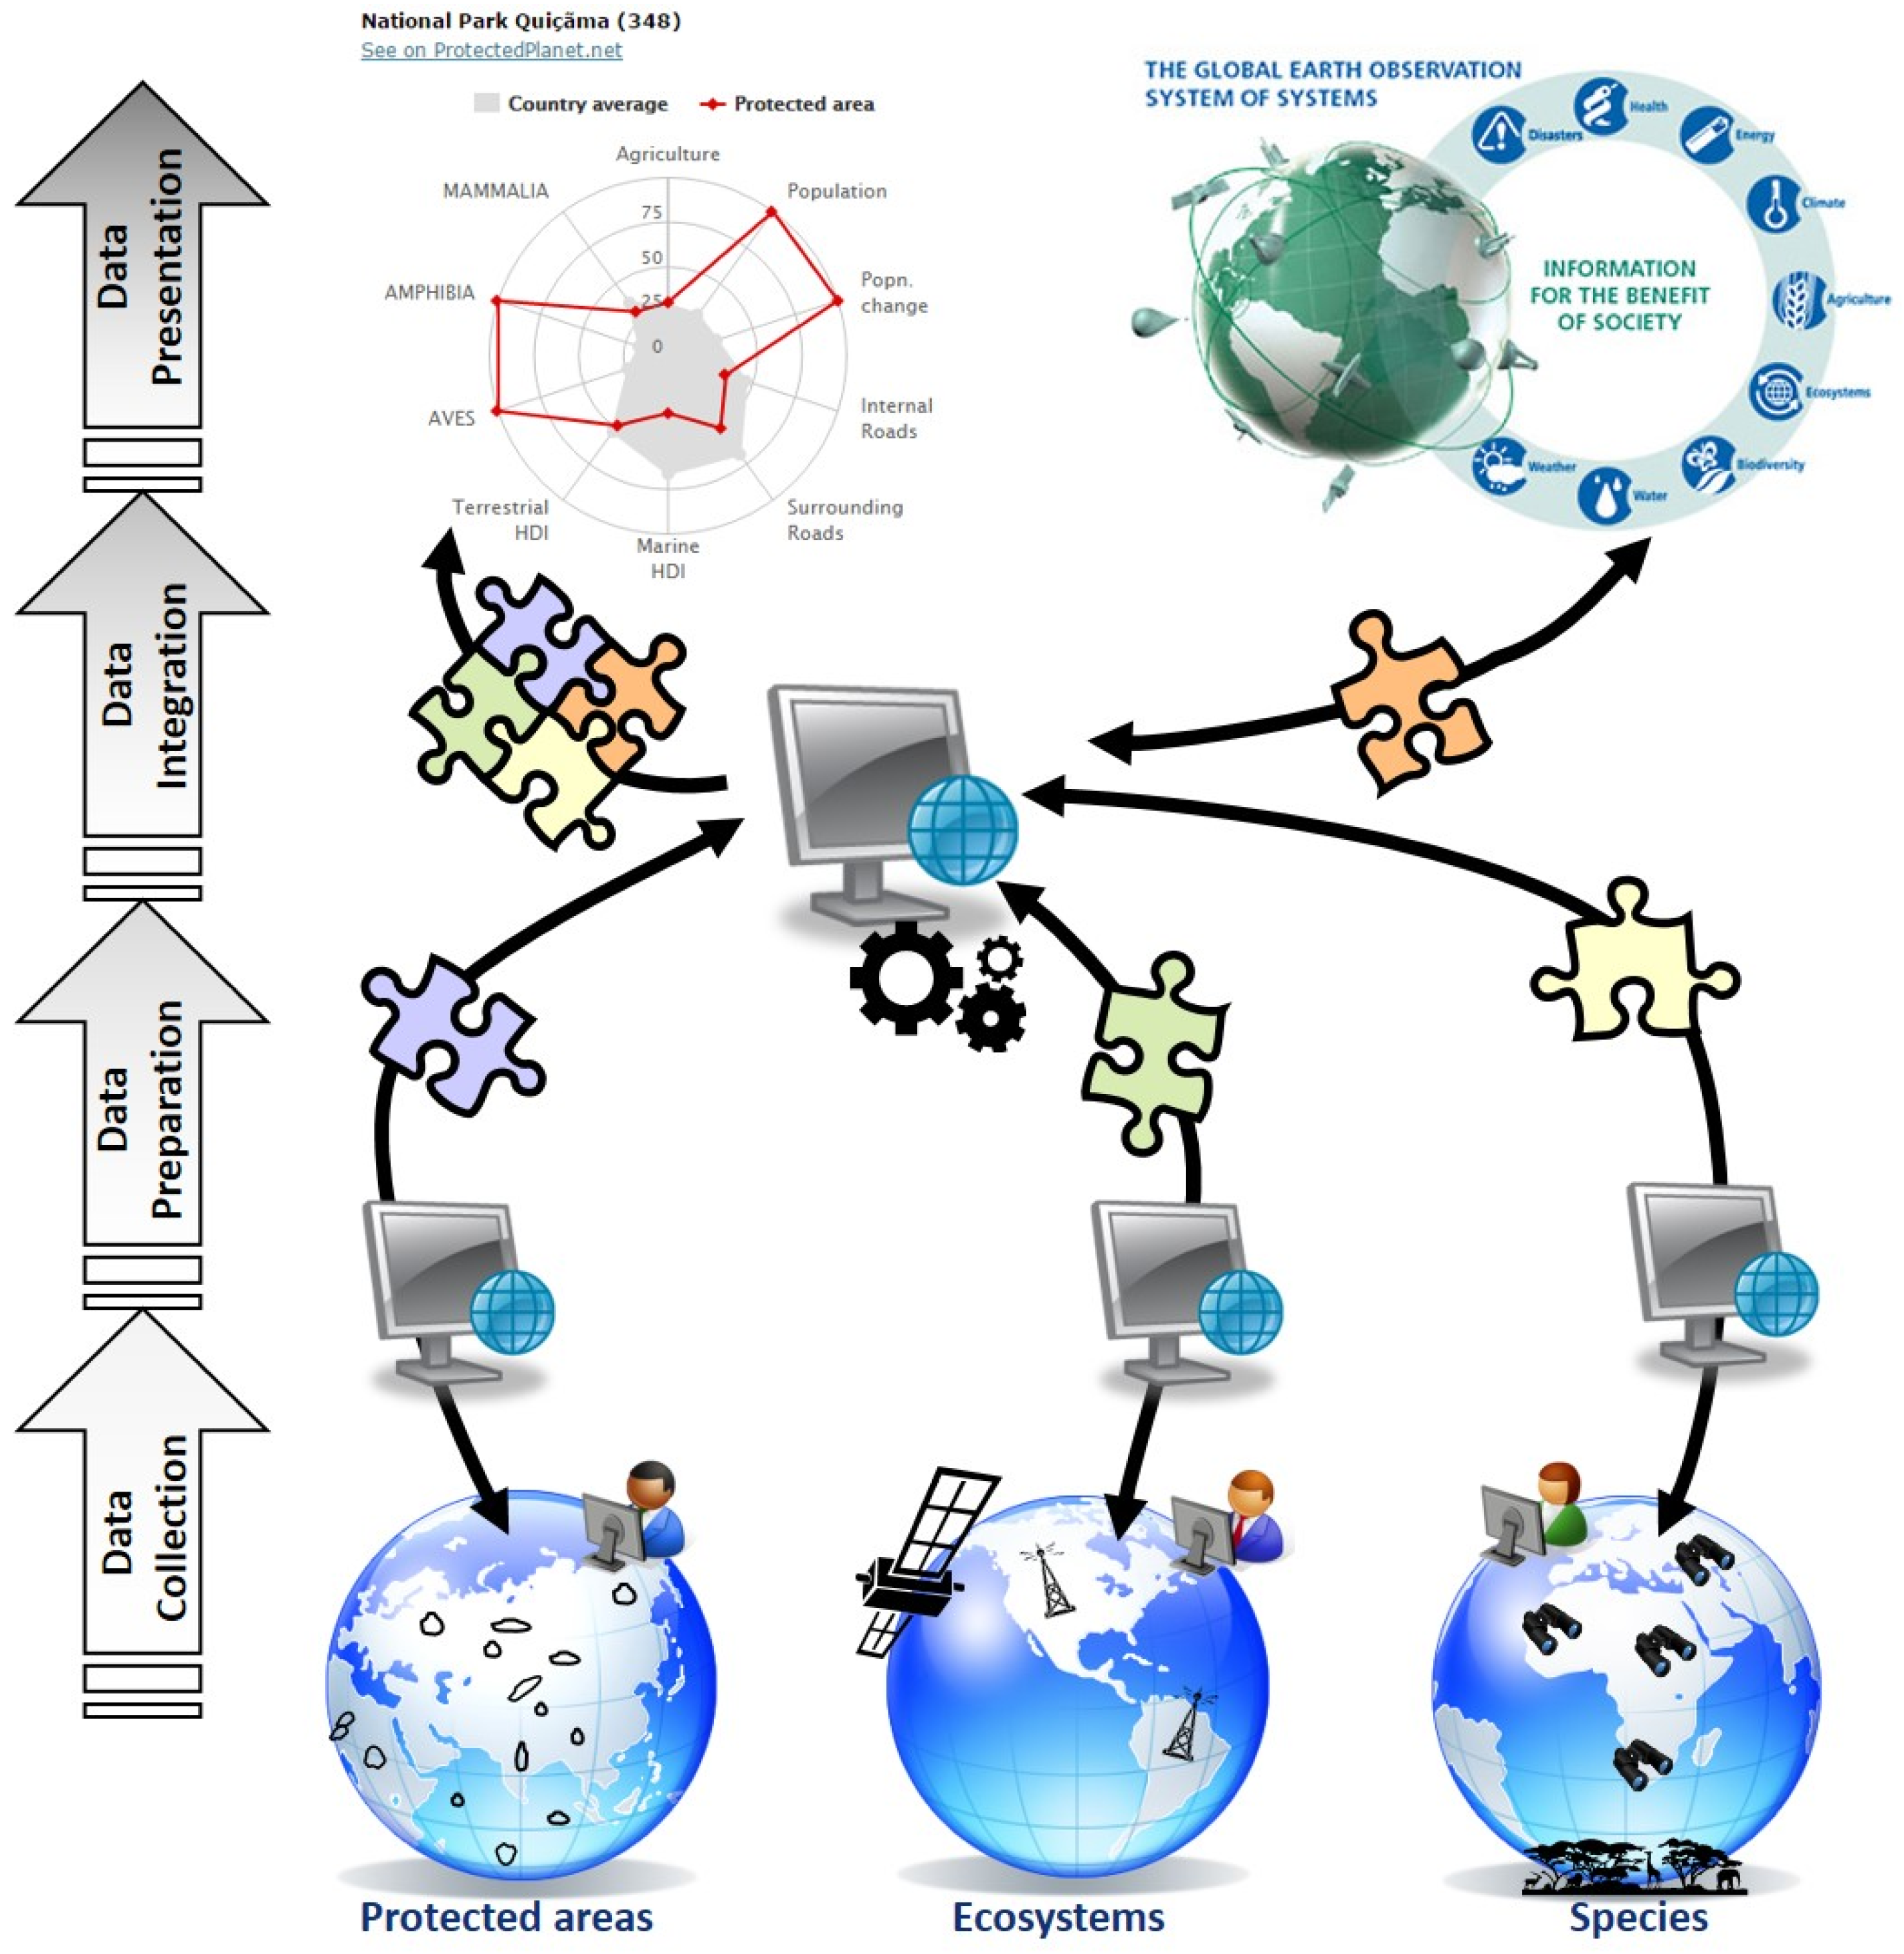
7]. Relying on web-based technologies, the DOPA is pulling together global datasets, most of which are spatial, that are further processed before being integrated into a few key indicators which can then be shared through web applications and web services (
Figure 1) [
7,
8]. The services and applications underpinning the DOPA are designed to provide
- (1)
the best available material (data, indicators, models) agreed on by contributing institutions which can serve for establishing baselines for research, planning and reporting activities such as National Biodiversity Strategies and Action Plans (NBSAPs) and the regional and global Protected Planet Reports [
4,
9,
10];
- (2)
free analytical tools to support the discovery, access, exchange and execution of web services (databases and modeling) designed to generate the best available material but also for research purposes, decision making and capacity building for conservation;
- (3)
an interoperable and, as far as possible, open source framework to allow institutions to develop their own means to assess, monitor and forecast the state of, and pressure on PAs at different spatial levels.
In the following sections, we will first introduce the set of the indicators proposed by the DOPA that are available at country, ecoregion and protected area level, before addressing the technology used to share this information through web services, allowing reuse of the generated data in applications developed by third parties.
2. The Set of Indicators Proposed by the DOPA
As PAs are one of the main instruments for biodiversity conservation [
3], numerous indicators have been developed regarding their coverage, effectiveness and efficiency. Aichi Target 11 does not stipulate national targets nor does it include clear definitions of its various elements (e.g., ecologically representative, well-connected, and areas of particular importance for biodiversity and ecosystem services [
11,
12]). However, a number of global indicators have been developed and used, for example for reporting in the Protected Planet Reports which are published every other year [
4,
9,
10]. The ecoregion coverage statistics published in the last two editions of the Protected Planet Report have been computed by the DOPA and are discussed in a subsequent section. Such assessments can help identify broad gaps at the global scale but more information is required to take action at national and local levels. Wherever possible, the DOPA uses existing indicators from the scientific literature, which we try to update when improved data becomes available. Where no purposefully designed indicators are known to us from the scientific literature, we have developed new indicators, as in the case of PA connectivity (see below).
We have further supported the CBD Secretariat in its capacity-building activities and efforts to encourage Parties to revise, update and implement their National Biodiversity Strategies and Action Plans (NBSAPs) as required by the Convention to ensure that these strategies are mainstreamed into the planning and activities of all those sectors who can have an impact (positive and negative) on biodiversity. For many countries, the NBSAPs work necessitates access to datasets that are not always available locally and/or require some considerable informatics infrastructure to ingest, generate and analyze fundamental datasets. The DOPA therefore delivers an additional set of indicators related to PAs through a number of web-based applications which can further be used by the Parties to assess their PAs individually as well as at the country and ecoregion levels.
2.1. Measuring Progress towards Aichi Target 11 with the Digital Observatory for Protected Areas (DOPA)
To support monitoring and reporting on key elements of Aichi Target 11, the DOPA includes indicators on the PA coverage of countries and ecoregions. In the near future, indicators will be added on PA connectivity at country and ecoregion levels. All these indicators are computed using the World Database on Protected Areas (WDPA) [
13] managed by the UNEP World Conservation Monitoring Centre (UNEP-WCMC) and the International Union for Conservation of Nature (IUCN). UNEP-WCMC is mandated to compile information on the world’s PAs to produce this comprehensive global reference dataset.
The DOPA uses the Global Administrative Unit Layers (GAUL) [
14] and the Exclusive Economic Zones Boundaries (EEZ) [
15] to compute protected area coverage of countries. PA coverage statistics are also calculated for terrestrial and marine ecoregions and pelagic provinces because these represent more meaningful entities within which to analyze the ecological representativeness of the global protected area network. The terrestrial and marine ecoregion boundaries used in the DOPA are provided by WWF, the Nature Conservancy and partners. The Terrestrial Ecoregions of the World (TEoW) dataset identifies 827 ecoregions [
16], the Marine Ecoregions of the World (MEoW) dataset includes 232 near-shore ecoregions (up to 200 m depth) [
17], and the Pelagic Provinces of the World dataset (PPoW) identifies 37 provinces in waters beyond 200 m depth [
18]. These biogeographic classification systems can help ensure that the full range of ecosystems is represented in global and regional conservation and development strategies.
As of September 2016, the DOPA analyses include 197,368 terrestrial and 12,076 marine PAs from the August 2014 version of the WDPA, which together total more than 209,000 sites. These are all sites designated at a national level (e.g., national parks), under regional agreements (e.g., Natura 2000 network) and under international conventions and agreements (e.g., natural World Heritage sites). Following current practice, the UNESCO Man and Biosphere Reserves are not included in the calculations, as many of their buffer areas do not meet the IUCN’s protected area definition [
3,
4]. PAs that are proposed (but not yet fully designated or established) and PAs recorded as points without a reported area are also excluded. In addition, all overlaps between different PA records are removed from the calculations to avoid double counting.
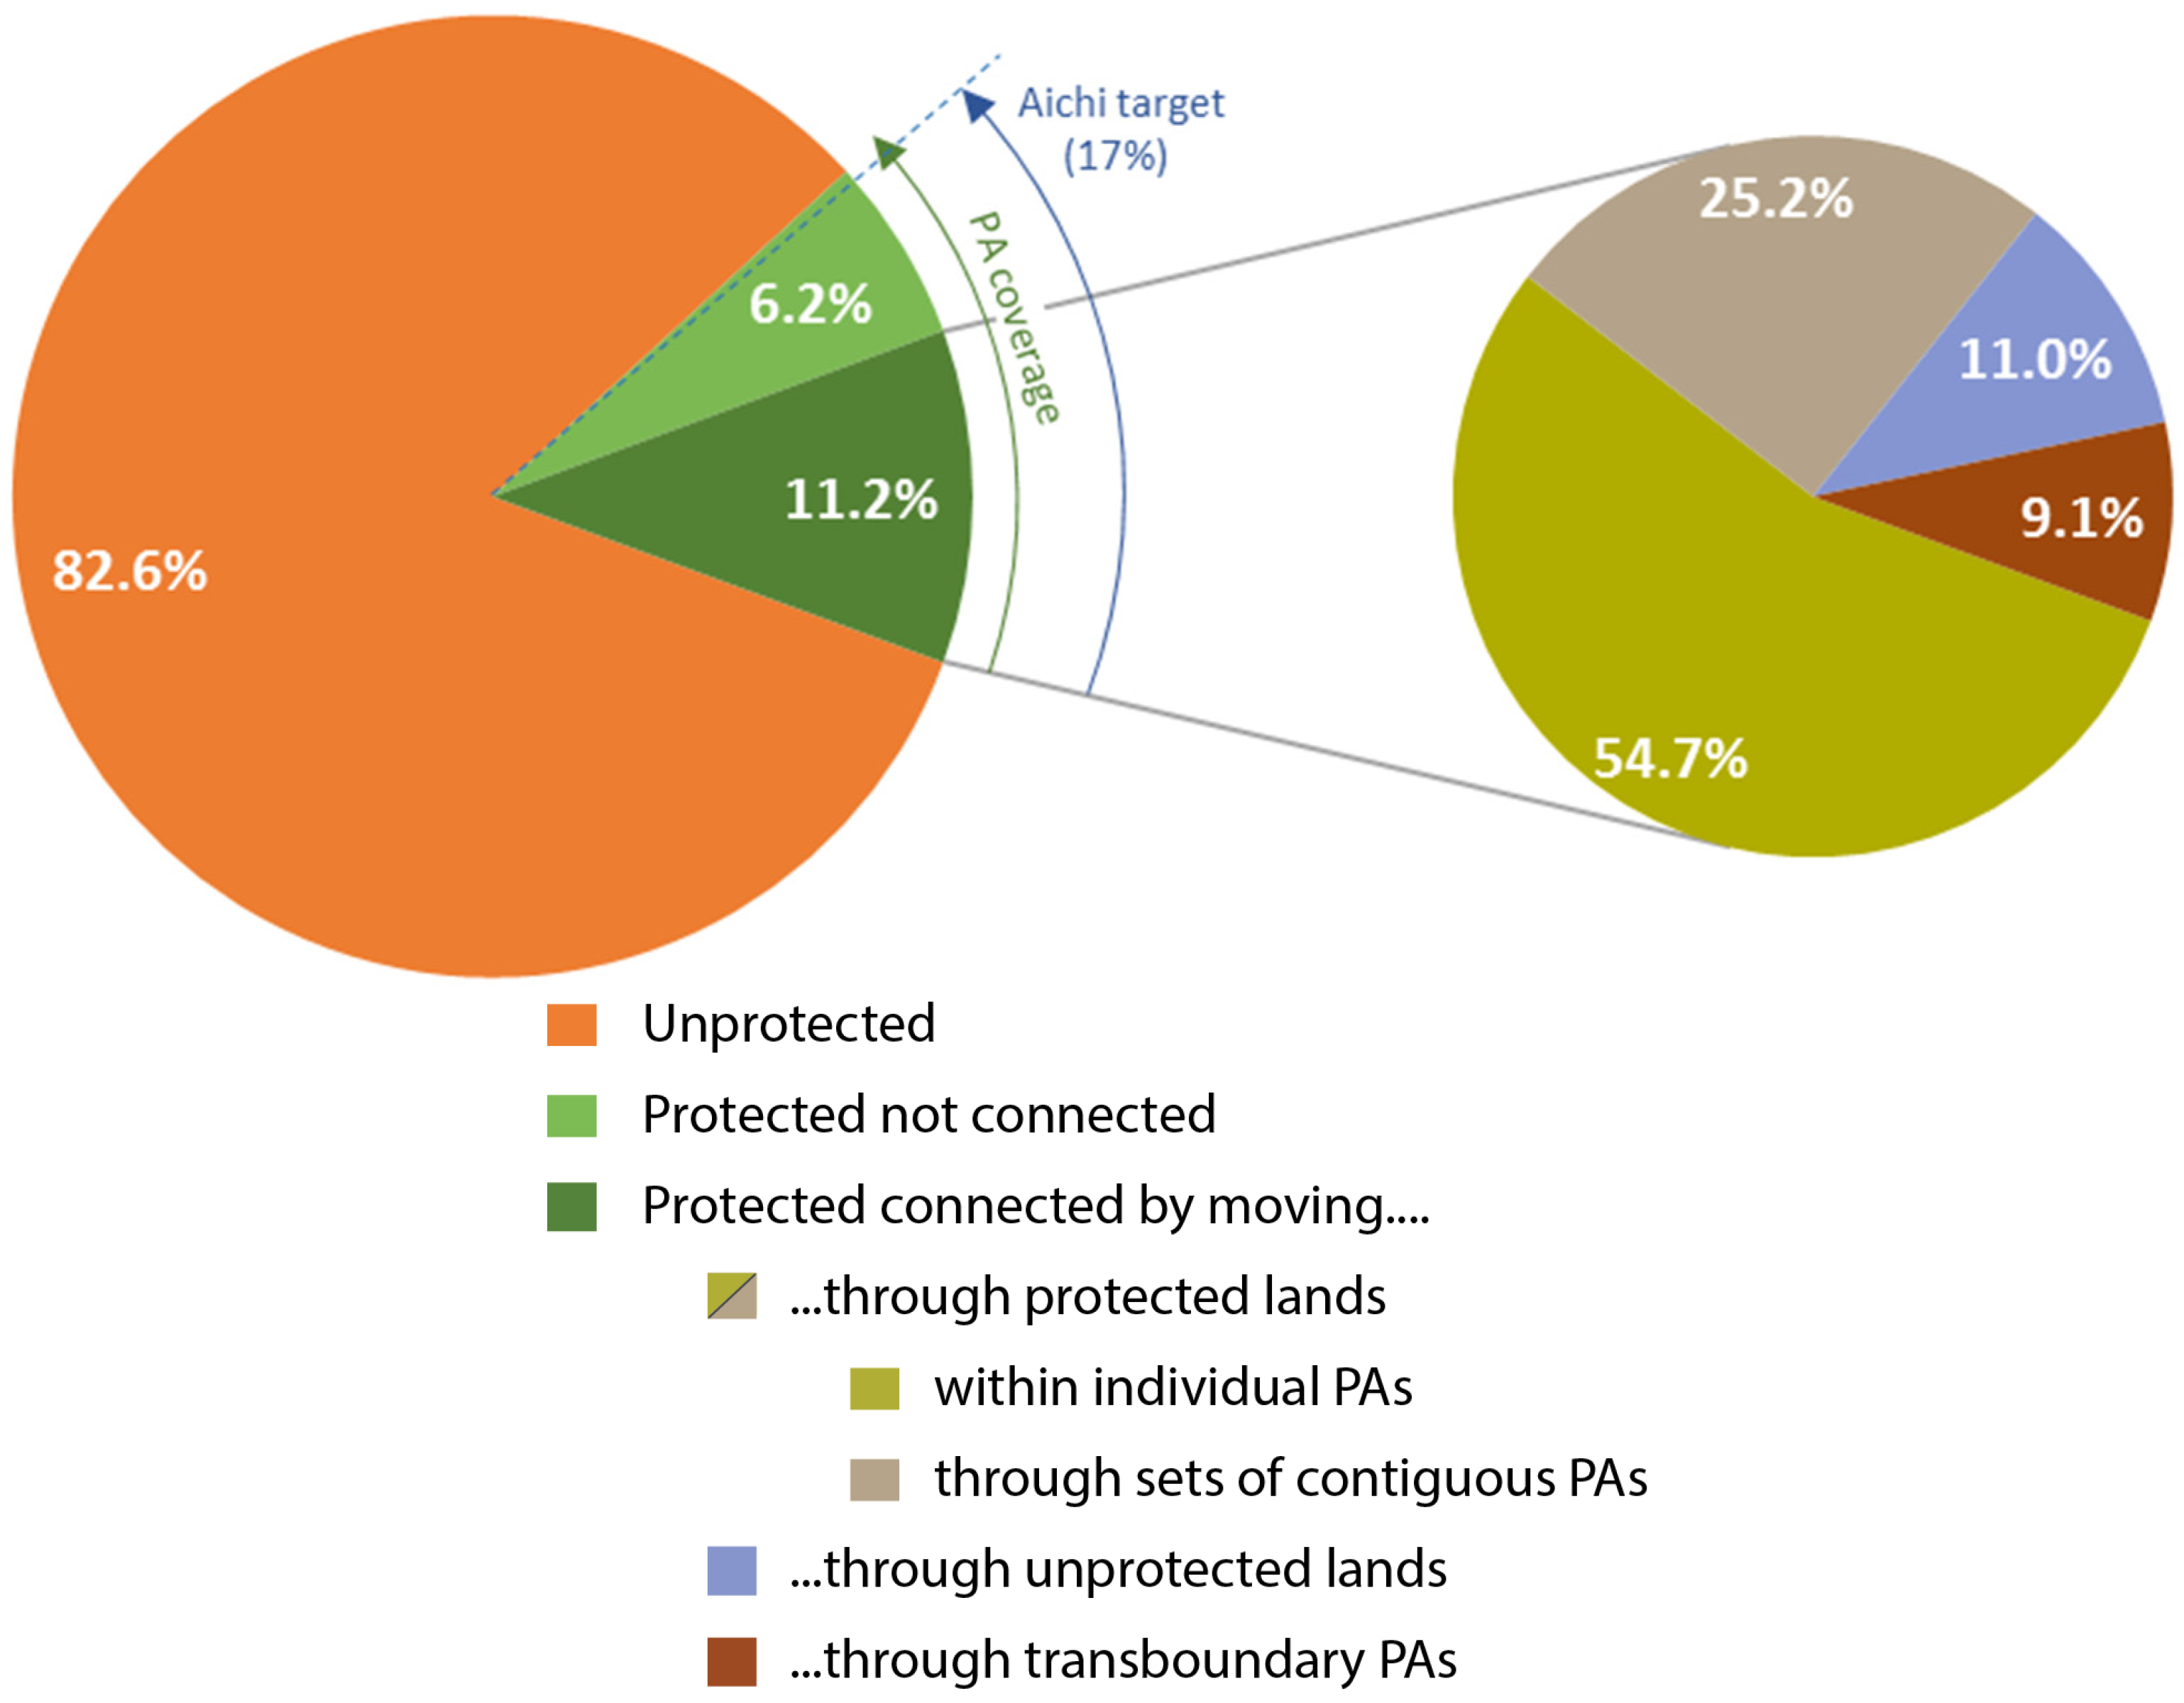
Regarding connectivity, the forthcoming release of the DOPA planned for early 2017 will include the ProtConn indicator, which (i) quantifies the percentage of a country or ecoregion covered by protected connected lands; (ii) can be partitioned in several components depicting different categories of land (unprotected, protected or transboundary) through which movement between protected locations may occur; (iii) is easy to communicate, to compare with PA coverage and to use in the assessment of global targets for PA systems (
Figure 2). This connectivity indicator is presented and described in detail in Saura et al. [
19].
2.2. DOPA Indicators for Assessing, Comparing and Prioritizing Protected Areas
Comparing and ranking PAs based on their biodiversity values and threats can support decision making and help to identify potential priorities for further conservation research, action and funding. Hence the DOPA and its predecessor, the African Protected Areas Assessment Tool (APAAT) [
21] (see
Section 3), were originally developed to provide information support to the EuropeAid in their programming of development aid for biodiversity conservation.
The global datasets used in the DOPA allow for the computation of objective, consistent PA indicators across the whole world; however, the quality (e.g., resolution, regional bias, accuracy and currency) of these global datasets varies greatly and is usually inferior to that of regional and local data. Users of the DOPA need to understand these critical limitations which are noted online and in the DOPA documentation (e.g., [
7,
8]). Thus the DOPA indicators can only be seen as initial indications of the values of and pressures on PAs, which should be supplemented at the local level with both analogous and complementary metrics.
The DOPA provides a broad range of metrics and indicators at the country, ecoregion and PA levels; here, we briefly discuss the core ones used to assess, compare and rank PAs. For the country and ecoregion levels, all PAs are used to compute coverage indicators, and the connectivity indicators have considered those PAs with a size of at least 1 km2 (which retains 99.9% of the total land area covered by all PAs globally). The indicators at the level of individual PAs that are described next are, however, currently only available, due to computational constraints, for the nearly 16,000 PAs with a minimum size of 100 km2.
2.2.1. Species Indicators
Critical information on the biodiversity values of PAs include the number of species present, their threat status, and the degree of their dependence on a particular PA. The species indicators in the DOPA are derived from the IUCN Red List of Threatened Species (RLTS) [
22]. The RLTS is the authoritative source on the conservation status of the world’s species. Global species maps from the August 2014.2 version of the Red List have been processed to produce indicative species lists for the PAs. In summary, the species distribution maps have been rasterized in the DOPA on a 1 km grid and used here in two ways:
(1) the globally assessed taxonomic groups of mammals, birds and amphibians (20,463 species) have been used across all PAs and are the data behind all species indicators used in the DOPA;
(2) other taxonomic groups (e.g., Insecta, Reptilia, Bivalvia, …) from the RLTS which have been assessed mainly locally—an additional set of 15,427 species—have been used to be added to the PA level species lists and used only for descriptive purposes.
Overall, the species distribution maps used cover 35,890 species. These maps invariably represent current, known limits of distribution for individual species within their native historical range. Although these maps have many uses, they generally have a coarse resolution and consequent limitations. The species analyses are computed using the distribution range data for species that are categorized with the following attributes: the presence is either extant or probably extant; the origin is either native or introduced, and the seasonality is breeding, non-breeding or resident.
The Species Irreplaceability Indicator (SII) in the DOPA corresponds to the one developed by Le Saout et al. [
23]. These authors calculated an irreplaceability score for PAs as an aggregated measure of the degree of dependence of species on the PA. This irreplaceability score for each PA is independent of the degree of species coverage within other PAs. Thus, within any given taxonomic group, irreplaceability values can be directly compared across sites worldwide. The SII is dominated by species for which each PA has the most responsibility, with little contribution by species that overlap the site by very small percentages. The SII highlights PAs of particular importance for avoiding the extinction of species (those with relatively high fractions of species ranges within them).
Complementary to the SII, the DOPA proposes an additional indicator, the Species Coverage Index (SCI) (originally called Species Irreplaceability Indicator in [
20] before the publication of [
23]), which is computed for each PA to take into account the number of species and their endemicity. It considers the spatial coverage of the three taxa assessed globally (birds, mammals, and amphibians) derived from 1 km-resolution maps and was calculated as follows: (1) the number of PAs in which a given species occurs (n) is determined; (2) (1/n) is computed and that value is allocated to each PA containing the species; (3) all values for a given PA are summed to yield its final SCI. The higher the value of the SCI, the higher the number of endemic species in the PA and the more important the role of this PA, in the context of the currently protected network of areas, for conserving biodiversity.
2.2.2. The Habitat Diversity Indices (HDI)
The biodiversity values of PAs can also be assessed through information on the diversity and complexity of the habitats present. In the DOPA we thus provide simple indicators of habitat diversity (both terrestrial and marine), and highlight those terrestrial PAs that have unique ecological conditions at the country and ecoregion level because these are more likely to host endemic species. They are also often more vulnerable to loss, considering the small likelihood of finding such ecological conditions elsewhere.
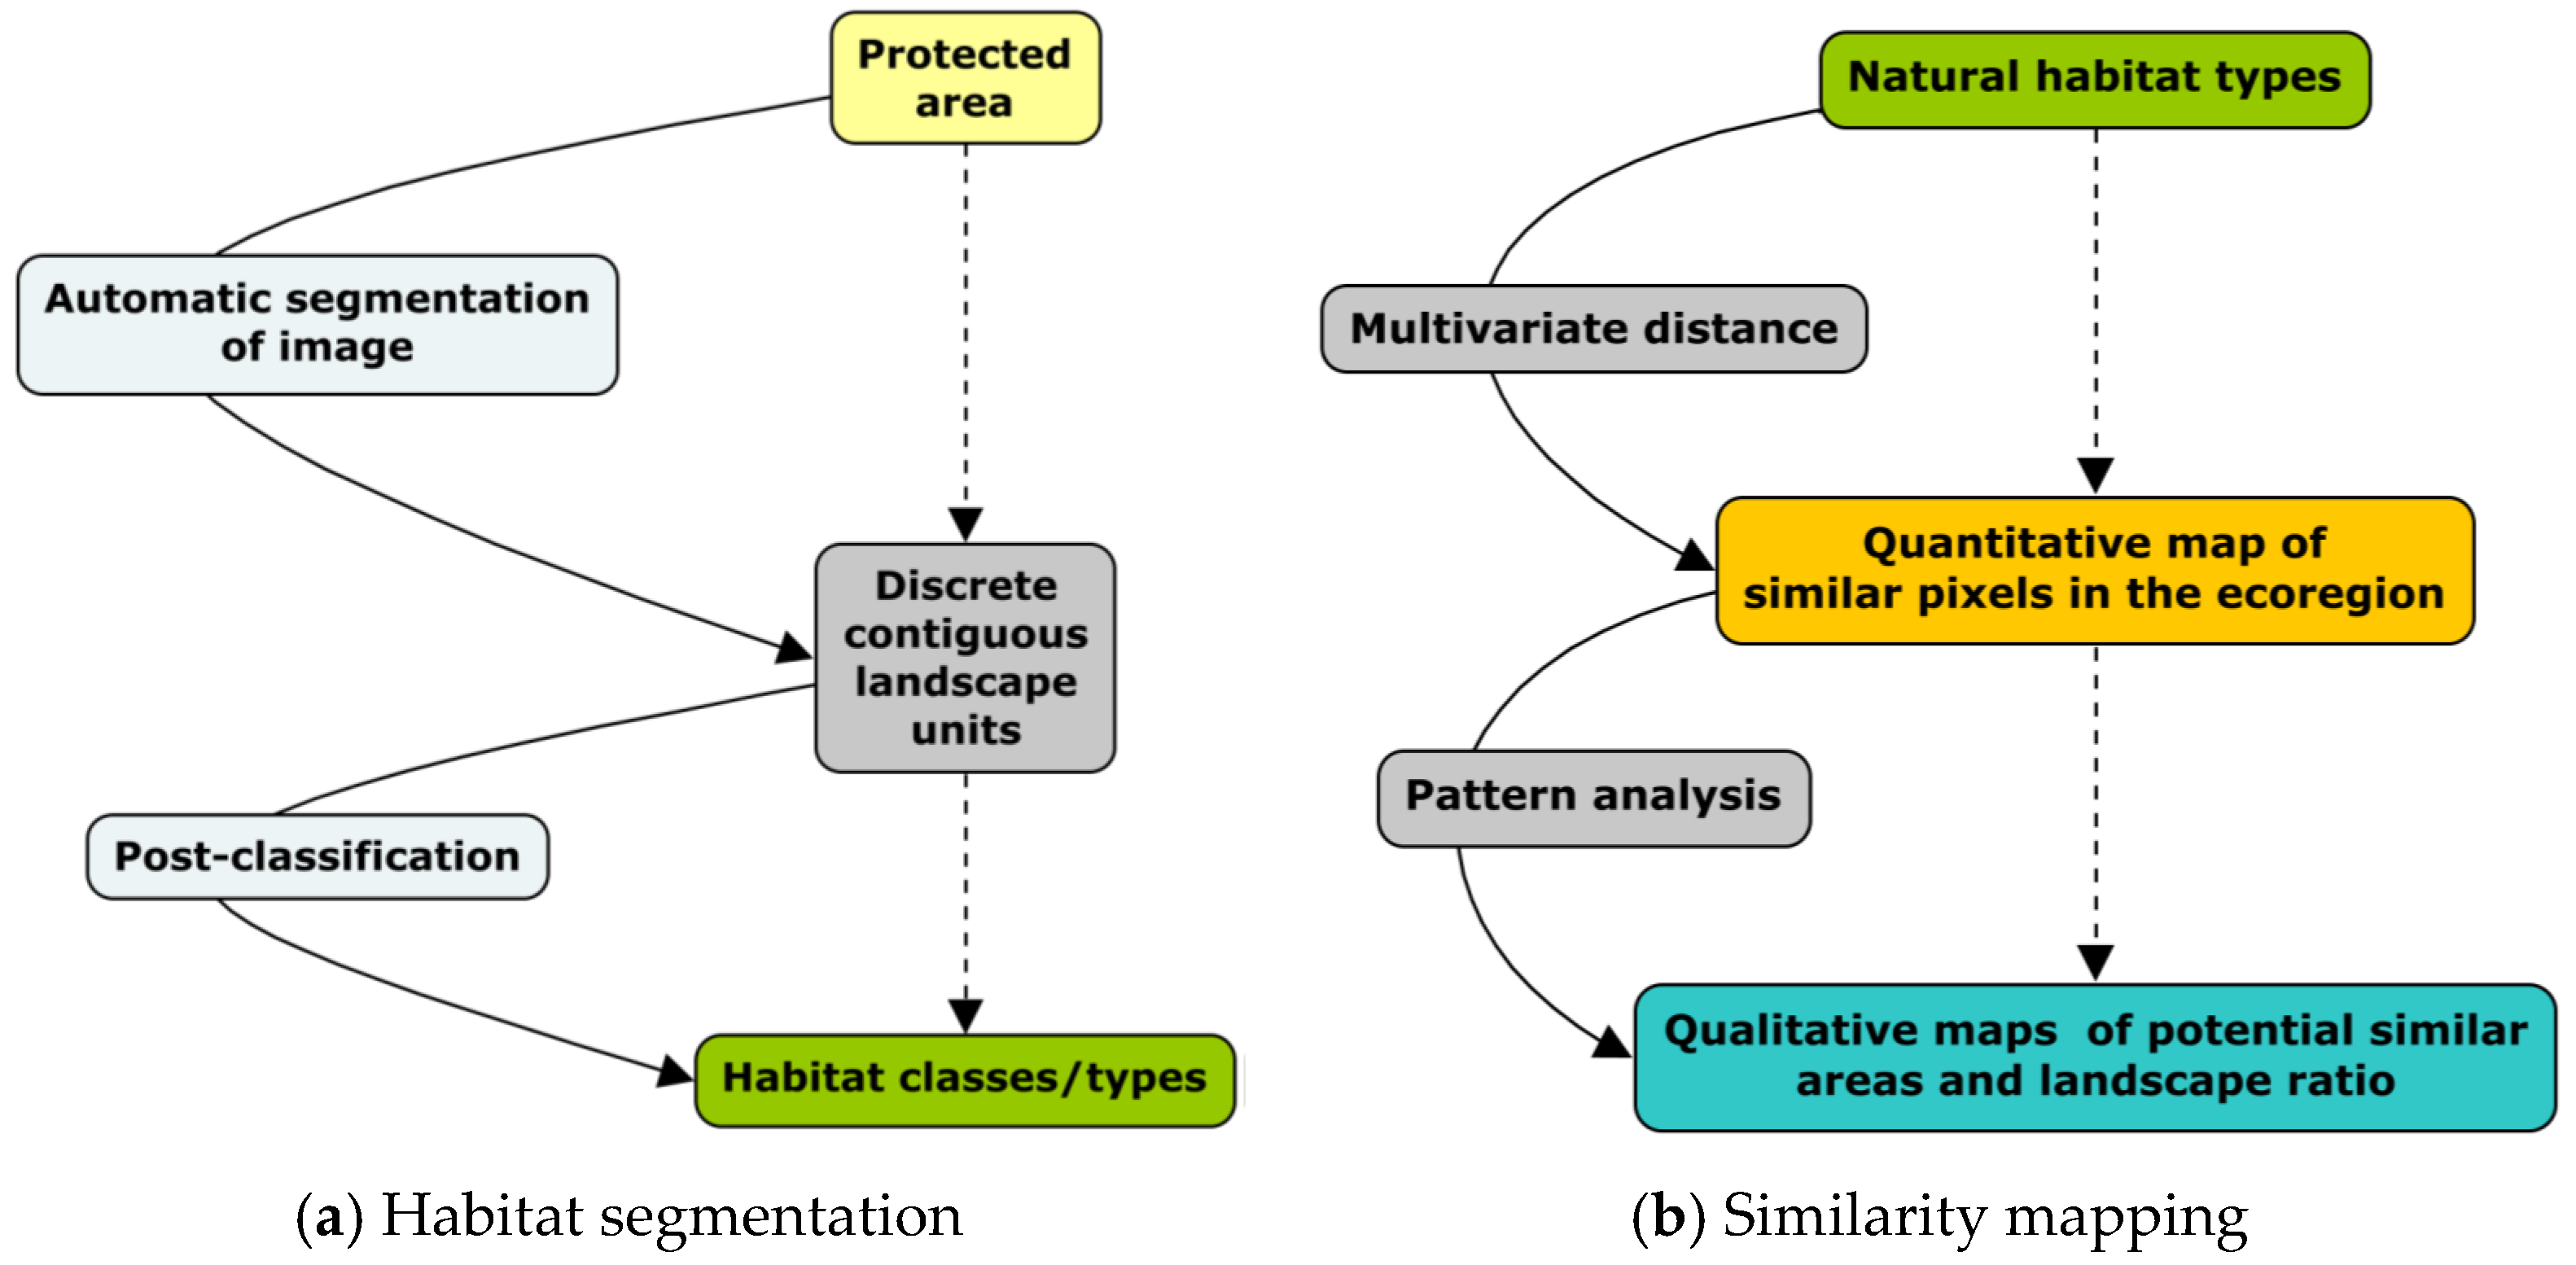
The current approach in the DOPA is based on a segmentation process that automatically decomposes each PA into a set of independent areas, representing homogeneous habitat types, which are then further assessed individually in terms of the probability of finding similar ecological conditions elsewhere (
Figure 3). Computing the probabilities of finding similar ecological conditions for each patch is relatively straightforward by using Mahalanobis distances [
24,
25]. However, the segmentation step required the development of a new analytical procedure [
26]. This approach was applied to all PAs equal to or larger than 100 km
2 and the number of segments are reported in the DOPA Explorer 1.0, an interface of the DOPA presenting most of the indicators discussed here [
8,
27]. We have computed a map of ecological similarities for each segment and this information will be made available in a different interface, the DOPA Analyst, which is currently in development (see Discussion).
To summarize the information provided by the segmentation step in the DOPA, we simply indicate for each PA the number of segments, as a proxy for the habitat types encountered in the PA, and this number can further be used to assess the ecological complexity of the area (e.g., [
28]). A large number of segments alone is not sufficient to highlight the ecological variability of the PA as it indirectly favors large PAs. Therefore, we also provide a terrestrial Habitat Diversity Index (HDI) which is defined as the number of distinct segments or homogeneous habitat types multiplied by 1000 and divided by the square root of the surface of the PA (in m
2) divided by 1000 [
26]. The forthcoming versions of DOPA will implement a new index defined as the square of the number of segments divided by the square root of the protected area (in km
2). This more intuitive index provides more comparable results and allows larger homogeneous areas to be more penalized.
For marine PAs, the marine HDI is defined as the standard deviation of bathymetry. This variable provides information on the vertical relief variability and has been used to identify habitats most likely to support a larger variety of species, since topographic complexity is often considered positively associated to marine biodiversity (e.g., [
29,
30]). The marine HDI value presented in the DOPA has been log-transformed in order to generate meaningful distinctions across a wide range of values.
2.2.3. The Population Pressure Index and Population Change Index
Population pressures on a PA were estimated using the Gridded Population of the World map for the year 2000 (GPW2000) [
31]) and a cost-distance function to quantify accessibility to the PA and a buffer zone around each PA. The GPW2000 version 3 made available by the Socioeconomic Data and Applications Center (SEDAC) depicts the distribution of human population across the globe and provides globally consistent and spatially explicit human population information and data in a raster format. The dataset is constructed from administrative units of varying resolutions and the native grid cell resolution is 2.5 arc-minutes, or ~5 km at the equator, although aggregates at coarser resolutions are also provided.
The cost distance function was derived from information on slopes, roads, rivers, land cover and international boundaries to compute a travel time from each point of the boundary of the PA [
32]. In other words, thematic maps were converted into gridded data where each cell receives a weight reflecting the pressure level on the PA. A land cover map, for example, can be used to derive an accessibility map to a PA by attributing high values to obstacles (rivers, mountains, hills) and low values when the terrain can be easily crossed (e.g., savannahs, grassland). As a result, a buffer area representing three hours of traveling could be delineated around each PA and further used to calculate the average population density. This average population density in the buffer area is the Population Pressure Index, while the Population Change Index is the percentage change in this metric between 1990 and 2000, with the 1990 value as a baseline.
2.2.4. The Agriculture Pressure Index
The Agricultural Pressure Index is based on the average percentage of cropland in 1 km raster cells within a 30 km buffer zone around PAs, aggregated to a single metric using an inverse distance weight function. The IIASA-IFPRI cropland percentage map for the baseline year 2005 [
33] was used to identify the percentage of cropland in each cell within the buffer.
2.2.5. The Road Pressure Indices
Data on roads was derived from the Global Roads Open Access Data Set [
34]. The dataset was rasterized to 500 m resolution and then used to identify roads globally. Road pressures were calculated based on the percentage of cells with presence of roads inside PAs (Internal Roads Pressure Index) as well as within a 30 km buffer zone around PAs (External Roads Pressure Index), using an inverse distance weighted function. The pressure values are normalized by country only, not by ecoregion, due to differences between countries in the density and detail of the road data supplied.
2.3. Comparing and Ranking Protected Areas
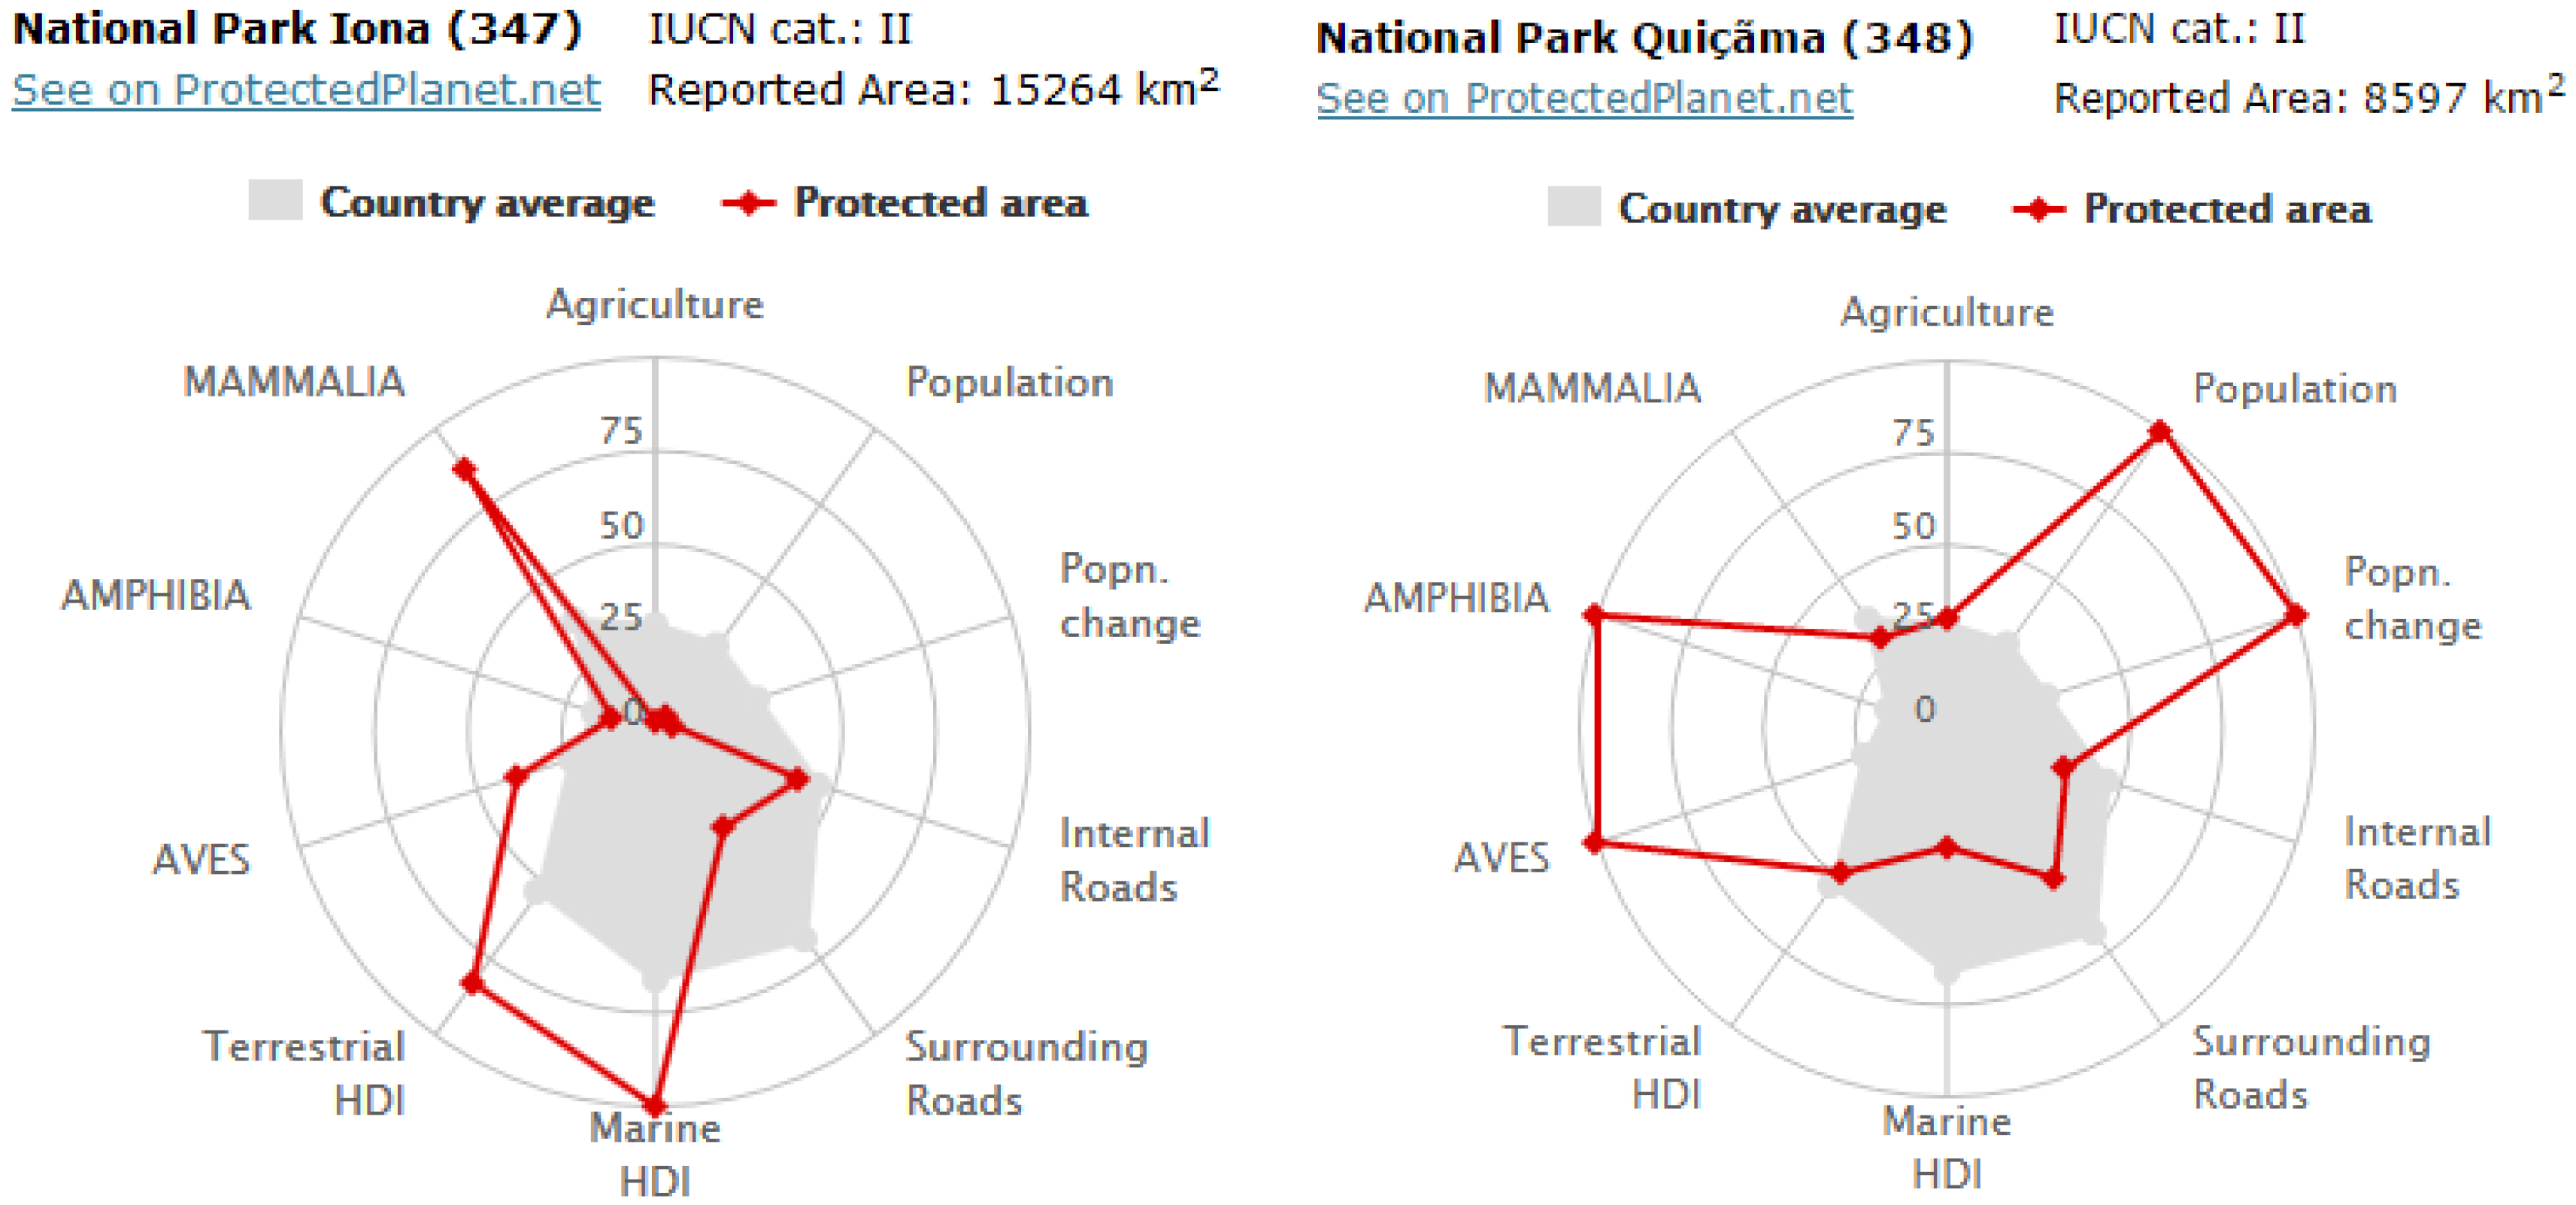
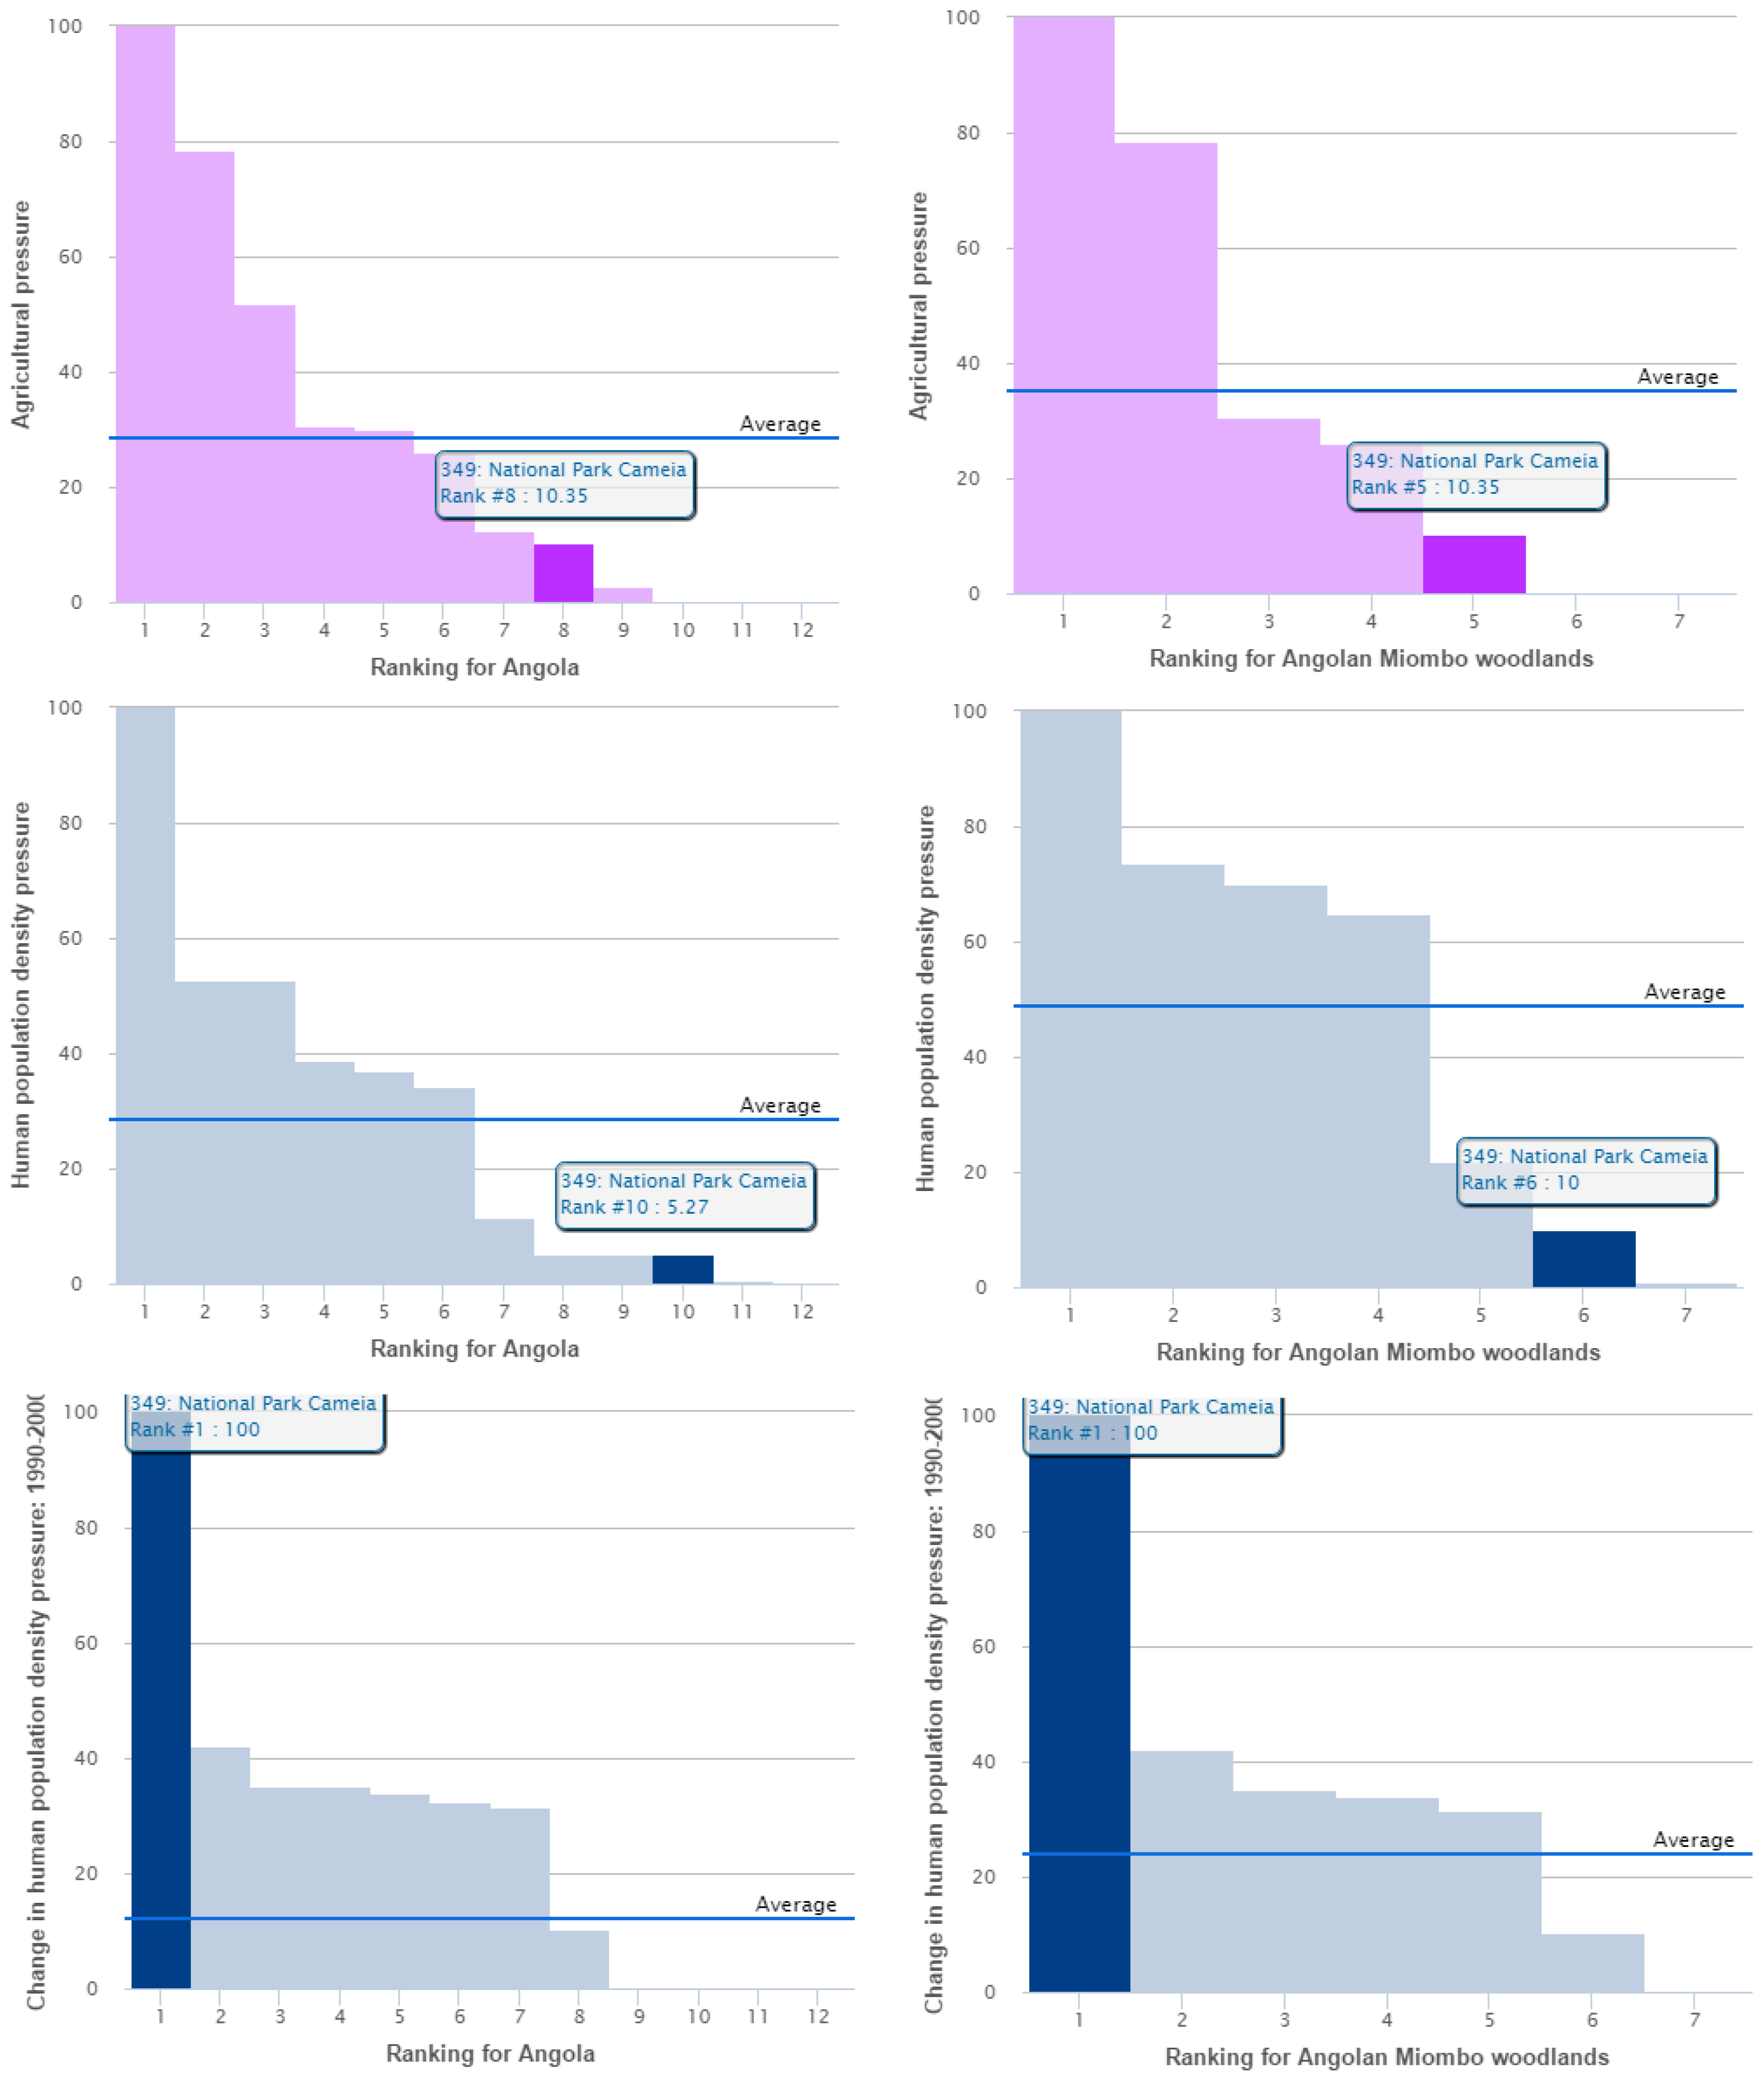
To facilitate comparisons of PAs in the same country or ecoregion, the DOPA summarizes the site level indicators in radar plots, histograms and tables at the country and/or ecoregion level. These formats are easy to use and can be particularly useful to inform decision making on potential priorities for further conservation research, action and funding. For example, in the DOPA, each PA is characterized by a radar plot showing the area’s indicator values against the country average (
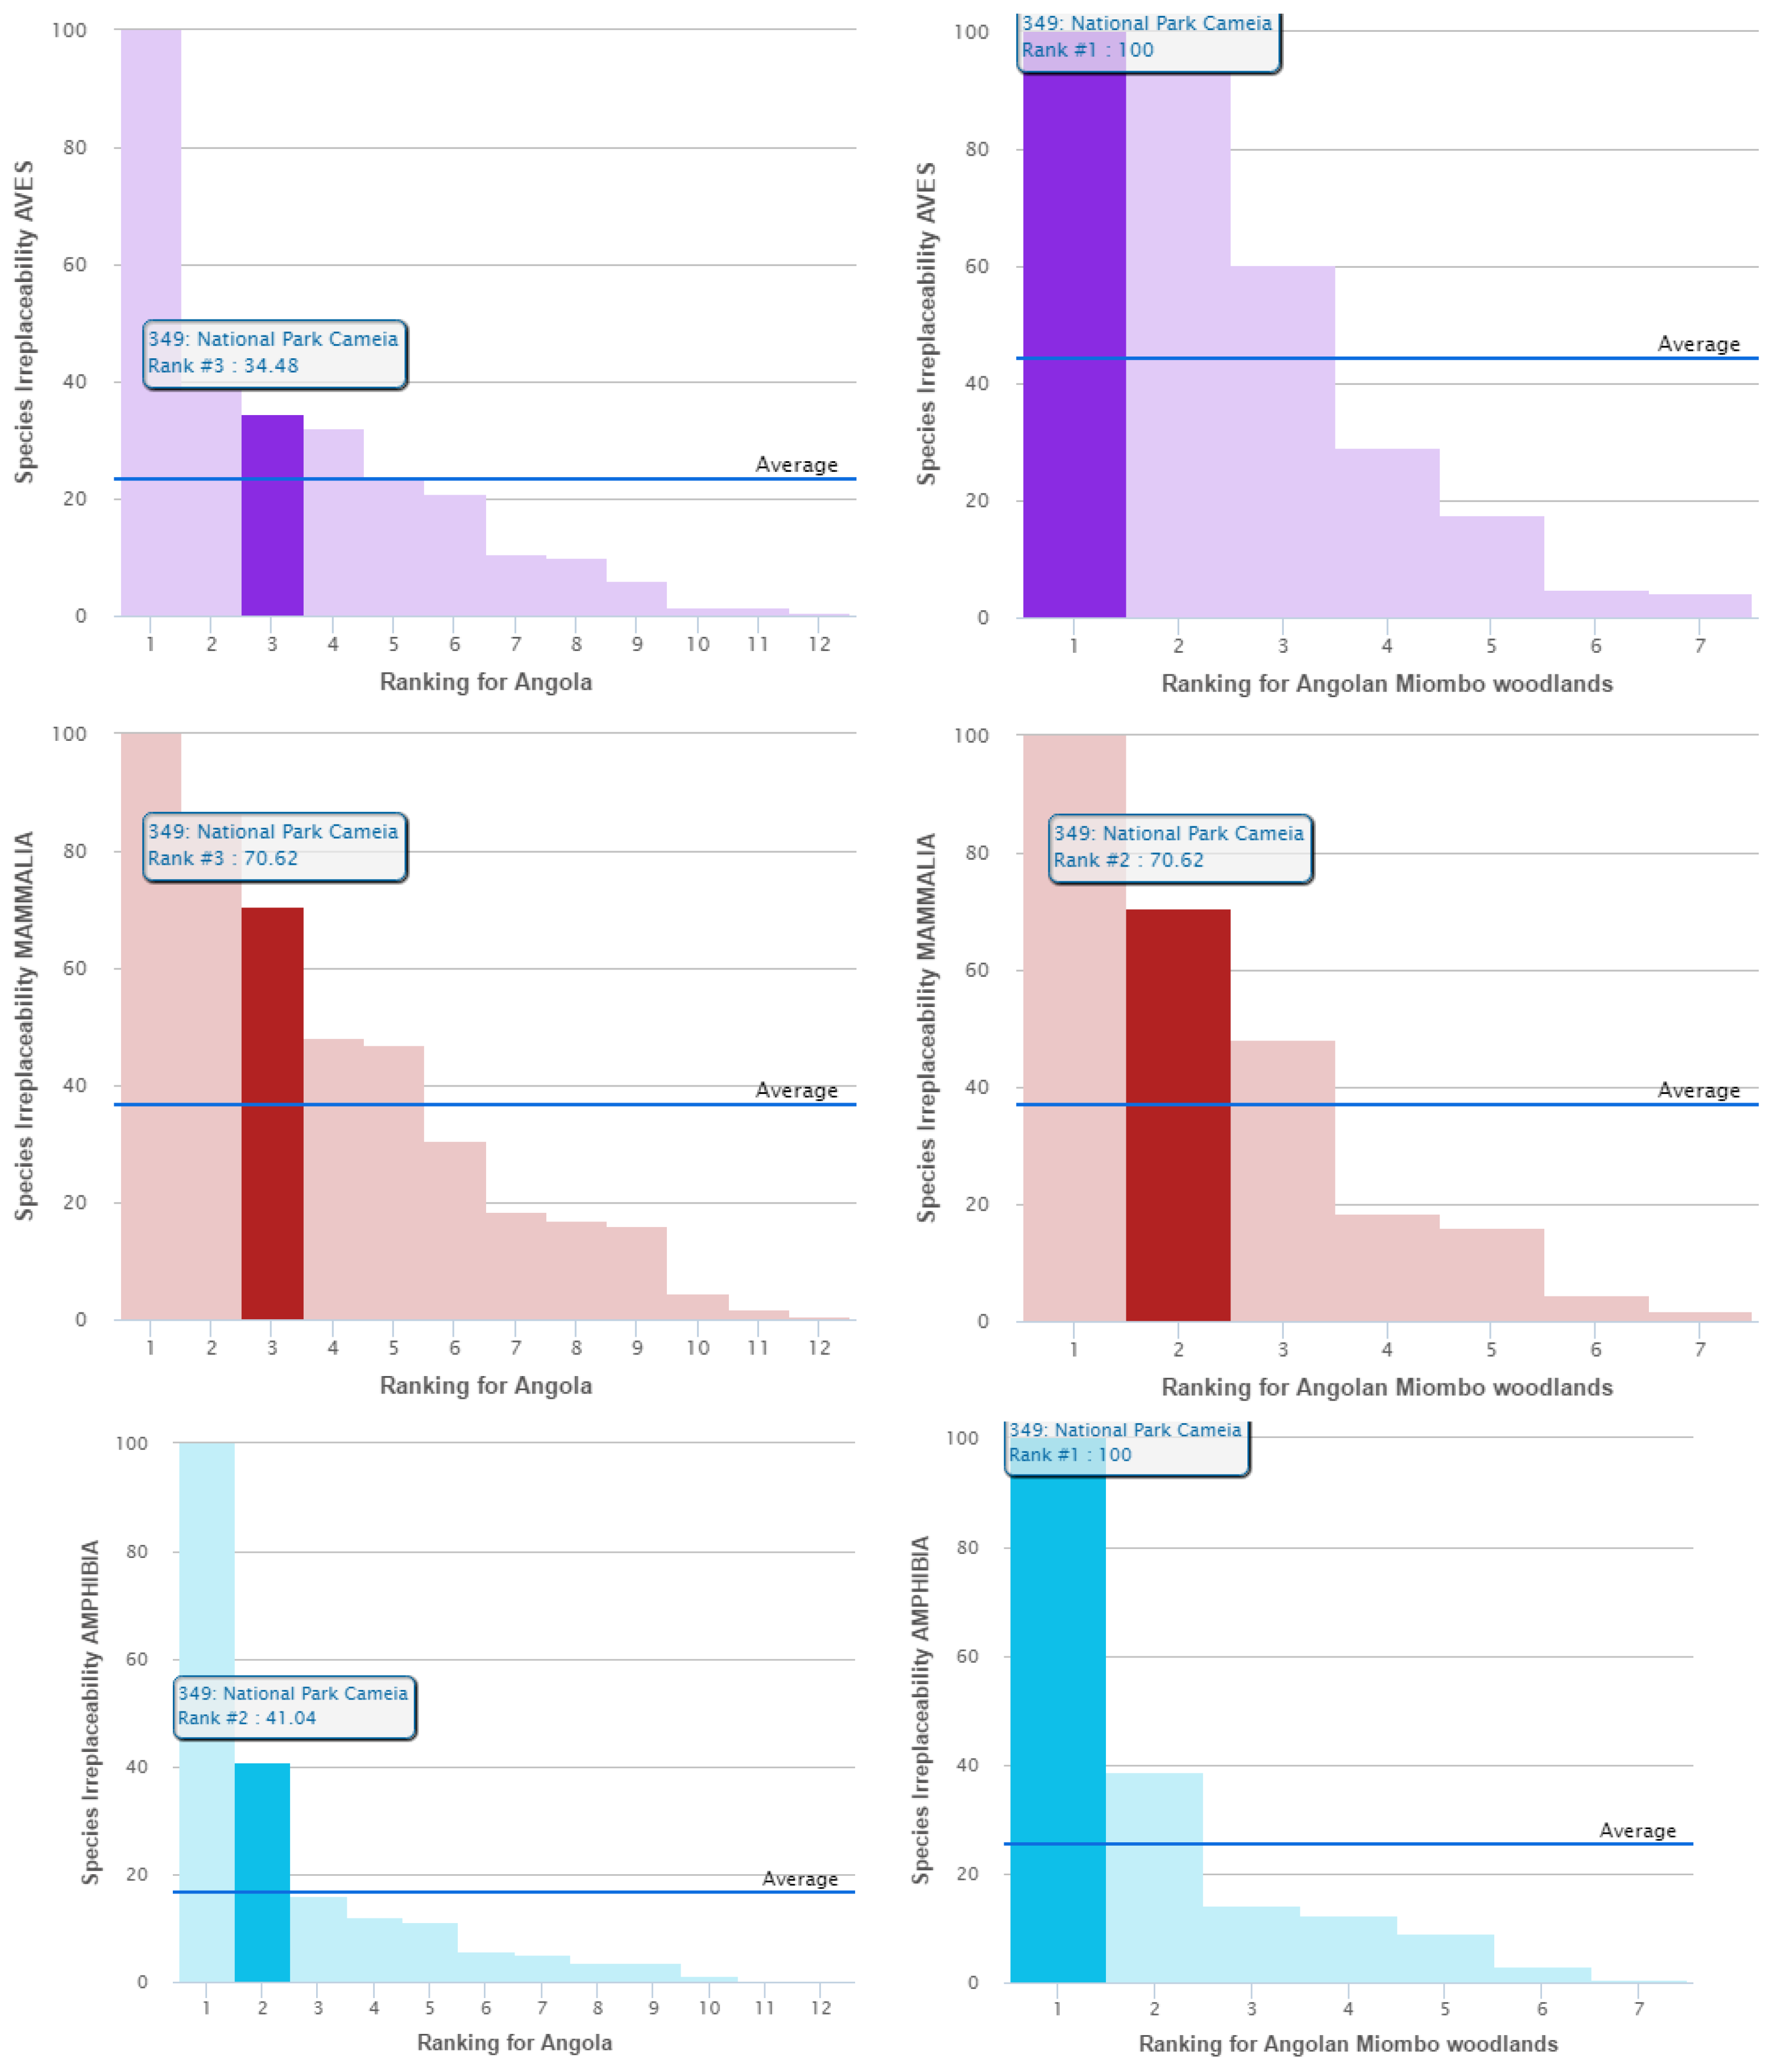
Figure 4), and separate histograms allow the user to compare and rank all PAs in the same country or ecoregion based on their values and pressures (
Figure 5 and
Figure 6). The indicator values for all PAs in a country can also be compared and downloaded in tabular format. The tables include essential context information such as the PAs’ size, IUCN Management Category [
35] and whether the area is terrestrial, marine or mixed.
3. Architecture of the DOPA
Conceived around a set of interacting Critical Biodiversity Informatics Infrastructures (databases, web modelling services, broadcasting services, etc.) hosted at different institutions, the DOPA is designed to provide a large variety of end-users, ranging from park managers, funding agencies to researchers, with means to assess, monitor and possibly forecast the state of, and pressure on, PAs at local, national and global scales.
The DOPA is derived from an earlier effort, the APAAT [
20]. This tool used continent-wide datasets to assess the state of African PAs, and to prioritize them according to biodiversity values and threats, in order to support decision making and funding allocation processes. In contrast to the APAAT, where most of the data was collected only once and then processed to generate a static set of indicators published on a website, the DOPA is built around a set of web services. This architecture greatly eases the overall update of the selected datasets and indicators and allows developers to propose an almost infinite number of web-based tools for different end-users.
3.1. A Service-Oriented Architecture for the DOPA?
While large volumes of data and models were originally collected or developed, maintained, and operated independently, a number of international initiatives have been launched to encourage the scientific community to make existing disparate systems and applications interoperable. The Group on Earth Observations (GEO) that is coordinating efforts to build a Global Earth Observation System of Systems, or GEOSS [
36], was launched in response to calls for action by the 2002 World Summit on Sustainable Development and by the G8 (Group of Eight) leading industrialized countries. Among the main recommendations made by these initiatives, the most commonly encountered when setting up infrastructures involving the exchange, processing and modelling of data are that data should be:
- (1)
managed as closely as possible to its source;
- (2)
collected once and documented to allow their use for many purposes;
- (3)
easily retrievable and accessible by others;
- (4)
interoperable at the syntactic and semantic levels to allow their combination for multiple purposes;
- (5)
scalable, when applicable, to match other scales;
- (6)
shared and, possibly, processed through common, free open-source software tools; and
- (7)
preserved in persistent repositories and accessible for retrieval by future users.
Fourteen years after this call, even though more than 600 million indexed records on species [
37], around 50,000 species distribution maps [
22], and more than 200,000 PAs [
13] have been documented and recorded in databases and made available over the internet, very little has been done to provide the conservation community as well as decision makers with basic tools to go beyond the mere visualization of these individual datasets on a map. Restrictive data licensing issues and the lack of web services to share most of these data are still hindering data from flowing for reuse by third parties.
A few prototypes adopting a Service-Oriented Architecture (SOA) and distributed databases have been initially developed to demonstrate the potential of such an architecture for biodiversity [
38,
39] using, for example, a web-processing service for ecological modeling and forecasting [
25,
40]. Such a Service-Oriented Architecture (SOA) would have been stimulating as much as possible a culture of “quality control” for robust science through the whole data process: from the harvesting of the data to their integration with other sources by different experts when generating new information. A true SOA greatly eases the overall update of the selected datasets and indicators and allows developers to propose an almost infinite number of web-based tools for different end-users who thus require only access to the internet to access millions of records, run models and access the latest information that is available without any need of a local infrastructure.
However, today, most institutions hosting these core datasets do not have interoperable web services, nor do the terms of use of their datasets allow for easy reuse. Therefore, the DOPA had to be developed using local copies of many core databases for further data processing to allow derived products to be reused by web services.
3.2. Design Considerations of Web Services and Applications
The DOPA is designed to encourage a multi-scale, cross-disciplinary approach to biodiversity without being exposed to excessive risks coming from integrating data from undocumented sources and/or with undocumented uncertainties. Biodiversity and Ecosystems Services-related data are particularly difficult to manage at the global scale as the volume of information is huge and at the same time very fragmented. In the following, we will summarize the design considerations which led to the current architecture.
3.2.1. Service-Oriented Architecture (SOA)
As discussed above, if an architecture based on distributed services is unlikely to happen soon, the overall architecture of the DOPA must still support an SOA so that the information services can be loosely coupled and combined easily with few dependencies or external requirements. This makes data integration much easier and provides developers with the ability to quickly develop solutions that integrate data from the proposed services.
3.2.2. Performance and Scalability
Many of the datasets that are used are global in scale and are derived from highly detailed local-scale data. For example, the RLTS species range data is based on detailed polygon data from a world coastline dataset. The result of this is a very detailed dataset where species with large ranges, for example many cetacean species, individually represent almost a complete global coastline dataset. This amount of data makes any kind of spatial intersection a very difficult and time-consuming process. In order to meet the performance requirements, the architecture must support near real-time querying and analyses, and this means sub-second response. For some of the requirements where the spatial dimension is known (for example, summarizing information for a country or a PA), these analyses can be prepared in advance and batch processed. However, for ad hoc queries (e.g., returning a list of species for a user-specified point), this pre-processing cannot be done easily. Therefore, an architecture that supports rapid real-time querying and analyses is required.
Scalability is also an issue in that the volume of data is likely to increase over time and the architecture will need to support this. The current RLTS includes spatial data on more 54,000 species, but it is expected to increase significantly when new taxonomic groups, particularly plants, are assessed [
22].
3.2.3. Support Multi-Scale Analyses
One of the other main requirements is to support spatial analyses at a range of scales. A manager of natural resources would want to know the ecological specificities and species composition of a site as well as the role of this site in a broader context, in the case of transboundary connectivity of PAs, for example.
3.2.4. Support Cross-Dataset Analyses
The architecture must also support the ability to conduct cross-sectorial analyses. The most important of these cross-sector analyses will involve datasets that examine threats to biodiversity and PAs, such as climate change and land cover change. Accessing information relating to agriculture, water, fire, population, land cover, climate, etc. is essential to any integrated assessments at a range of scales.
3.2.5. Support Dynamic Datasets
The global data required for the DOPA come from a broad set of providers and each of these datasets has its own update mechanism and frequency. The architecture will need to accommodate changes in these source datasets into the derived datasets.
3.2.6. Use an Open-Source Approach
Open data refers to the idea that certain data should be freely available for use and reuse. The European Commission’s work in the area of open data focuses on generating value through reuse of a specific type of data—i.e., public sector information, sometimes also referred to as government data. That is all the information that public bodies produce, collect or pay for. This is very much the case for much of the existing biodiversity information, and we adopt the same approach in our technical developments with open-source technology. All of the tools and services need to be published and made available on an appropriate source-code repository for download and use.
3.2.7. Support to Other Projects
Providing open access to our services encourages their use by other projects, in particular where the tools or services may need to be extended or customized for local needs. The services of the DOPA are, among others, currently used to support the regional information systems deployed by the BIOPAMA (Biodiversity and Protected Areas Management in the African, Caribbean and Pacific regions) program [
41].
3.2.8. Incorporate Community-Driven Data Standards
In the same way that the SOA architecture will enable the technical integration of information services, the community-driven data standards will provide the integration of content. What this actually means in practice is that the conservation community have a set of agreed data dictionaries (or standards) that are used to describe entities like species or geographies. These data standards are promoted by organizations like GBIF [
37] and the Taxonomic Database Working Group and need to be included in the overall architecture.
3.2.9. Support for Dataset Versioning and Metadata
The services will need to provide access to various datasets and to their derived products. These will need to be properly documented and version-stamped so that any users of the data can have a full understanding of the sources, process and caveats on the use of the data. They will then be able to establish whether the information is fit-for-purpose. This is particularly important where the data is likely to change regularly (as is the case for the WDPA). Generic metadata standards will be used wherever possible.
3.3. Current Architecture of the DOPA Web Services and Applications
During the design of the information systems for the DOPA, one of the key considerations was for the analyses to be published as soon as they have been created with very little effort on the part of the data analyst. This means that the data made available by the web services need to be pre-processed to be available to end-users in the shortest amount of time. The data that is produced at the end of the pre-processing step is a simple set of files that can be quickly retrieved from a database. The results of such analyses are stored in a spatial relational database (PostGIS) [
42], ready to be published as web services. This pre-processing significantly limits the number of possible operations that can be done by end-users who wish to explore scenarios or extract statistics for hypothetical PAs. Therefore, we are currently exploring the possibilities to benefit from more significant capacities as provided by Hadoop [
43] or by external services (e.g., cloud services, GoogleEarth Engine [
44]).
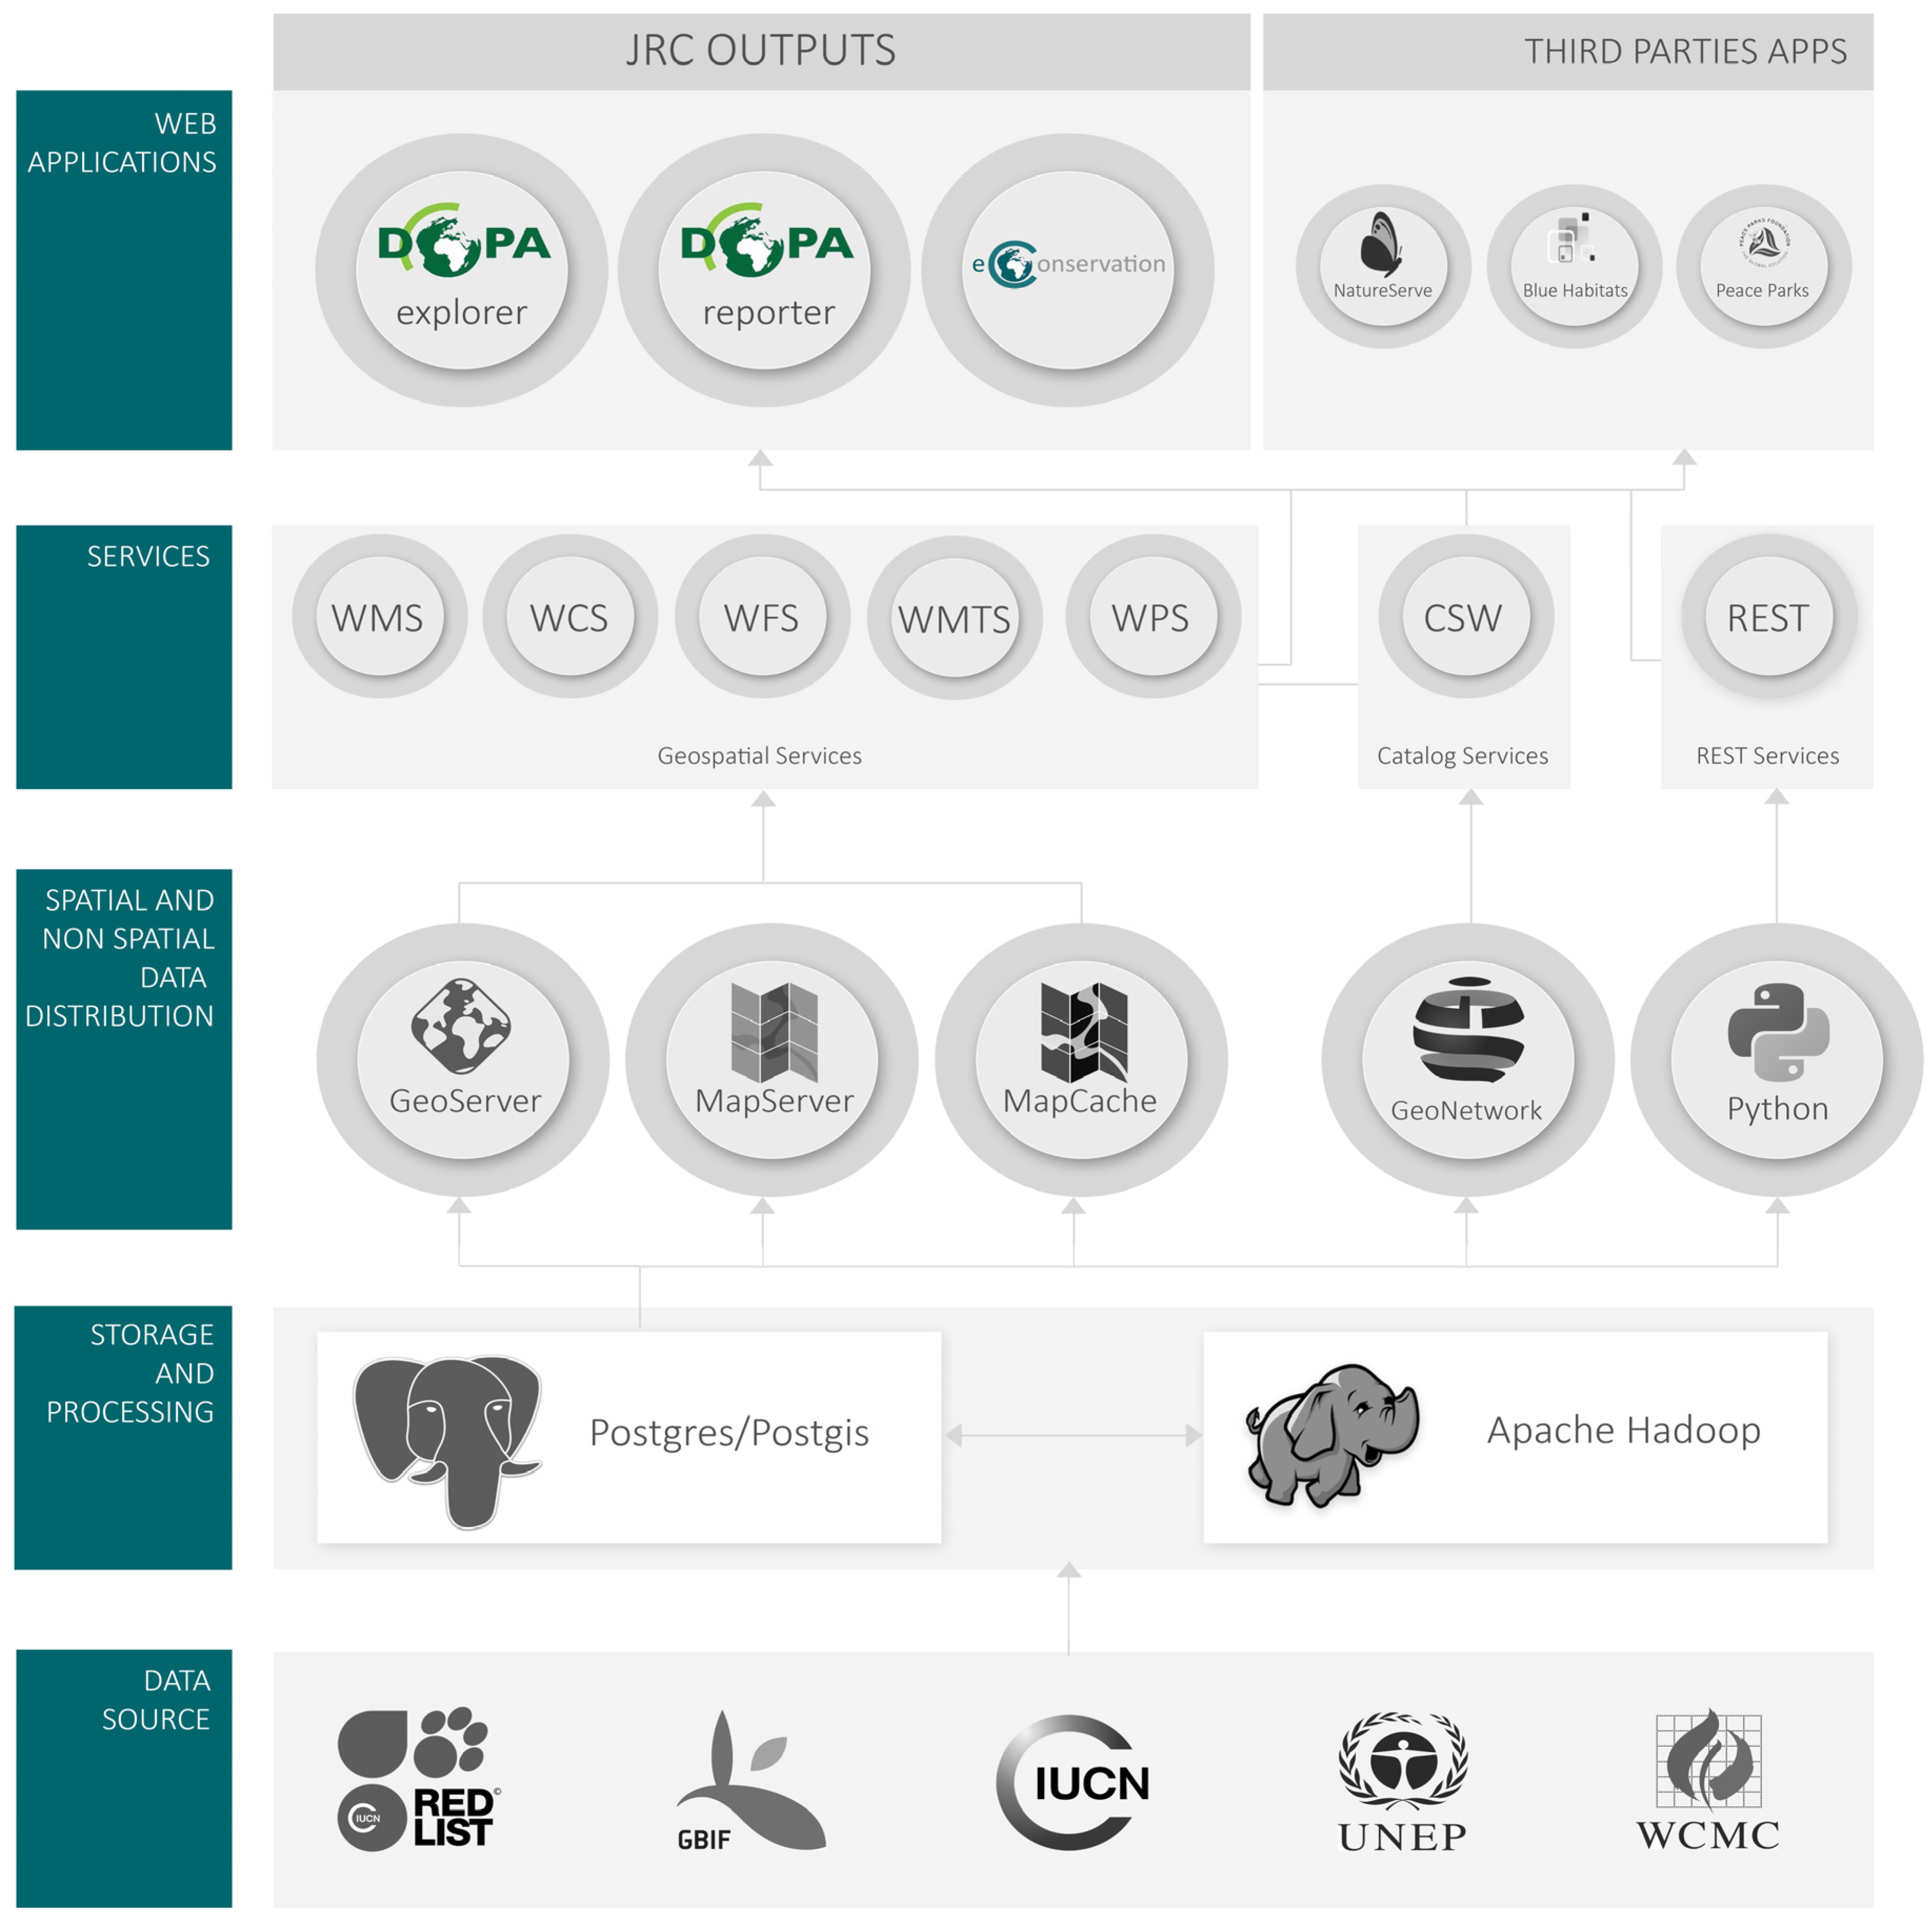
One can distinguish two types of services: spatial and non-spatial web services (
Figure 7).
3.3.1. Serving Spatial Datasets
All spatial products are available as a set of OGC (Open Geospatial Consortium) standard web
services [
45] published through an industry standard system called ‘Geoserver’ [
46].
These services can be consumed in Desktop GIS tools and also incorporated into websites. For more information on using OGC Web Services, see the specific documentation that accompanies the software.
3.3.2. Serving Non-Spatial Datasets
For non-spatial datasets, a custom web server was developed that allows products that have been created to be published simply by creating a query in the database. These resources are then available from an automatically generated set of web pages that publish the products as “REST Services.” REST Services are simply information products that are available to users as a URL— information on what data to retrieve and in which format is all part of the URL (see e.g., [
47] for a review). This makes REST Services very easy to consume in many different types of application and tools, thereby enabling the services to achieve maximum penetration into the conservation community. The services can be used in Desktop tools, e.g., Microsoft Excel, custom websites, and also support delivery of information including SMS, PDF and email. However, in many cases, the actual end points to the REST services are intended to be used for computer-to-computer exchange of data, such as in the creation of a website, rather than for direct reading by a user.
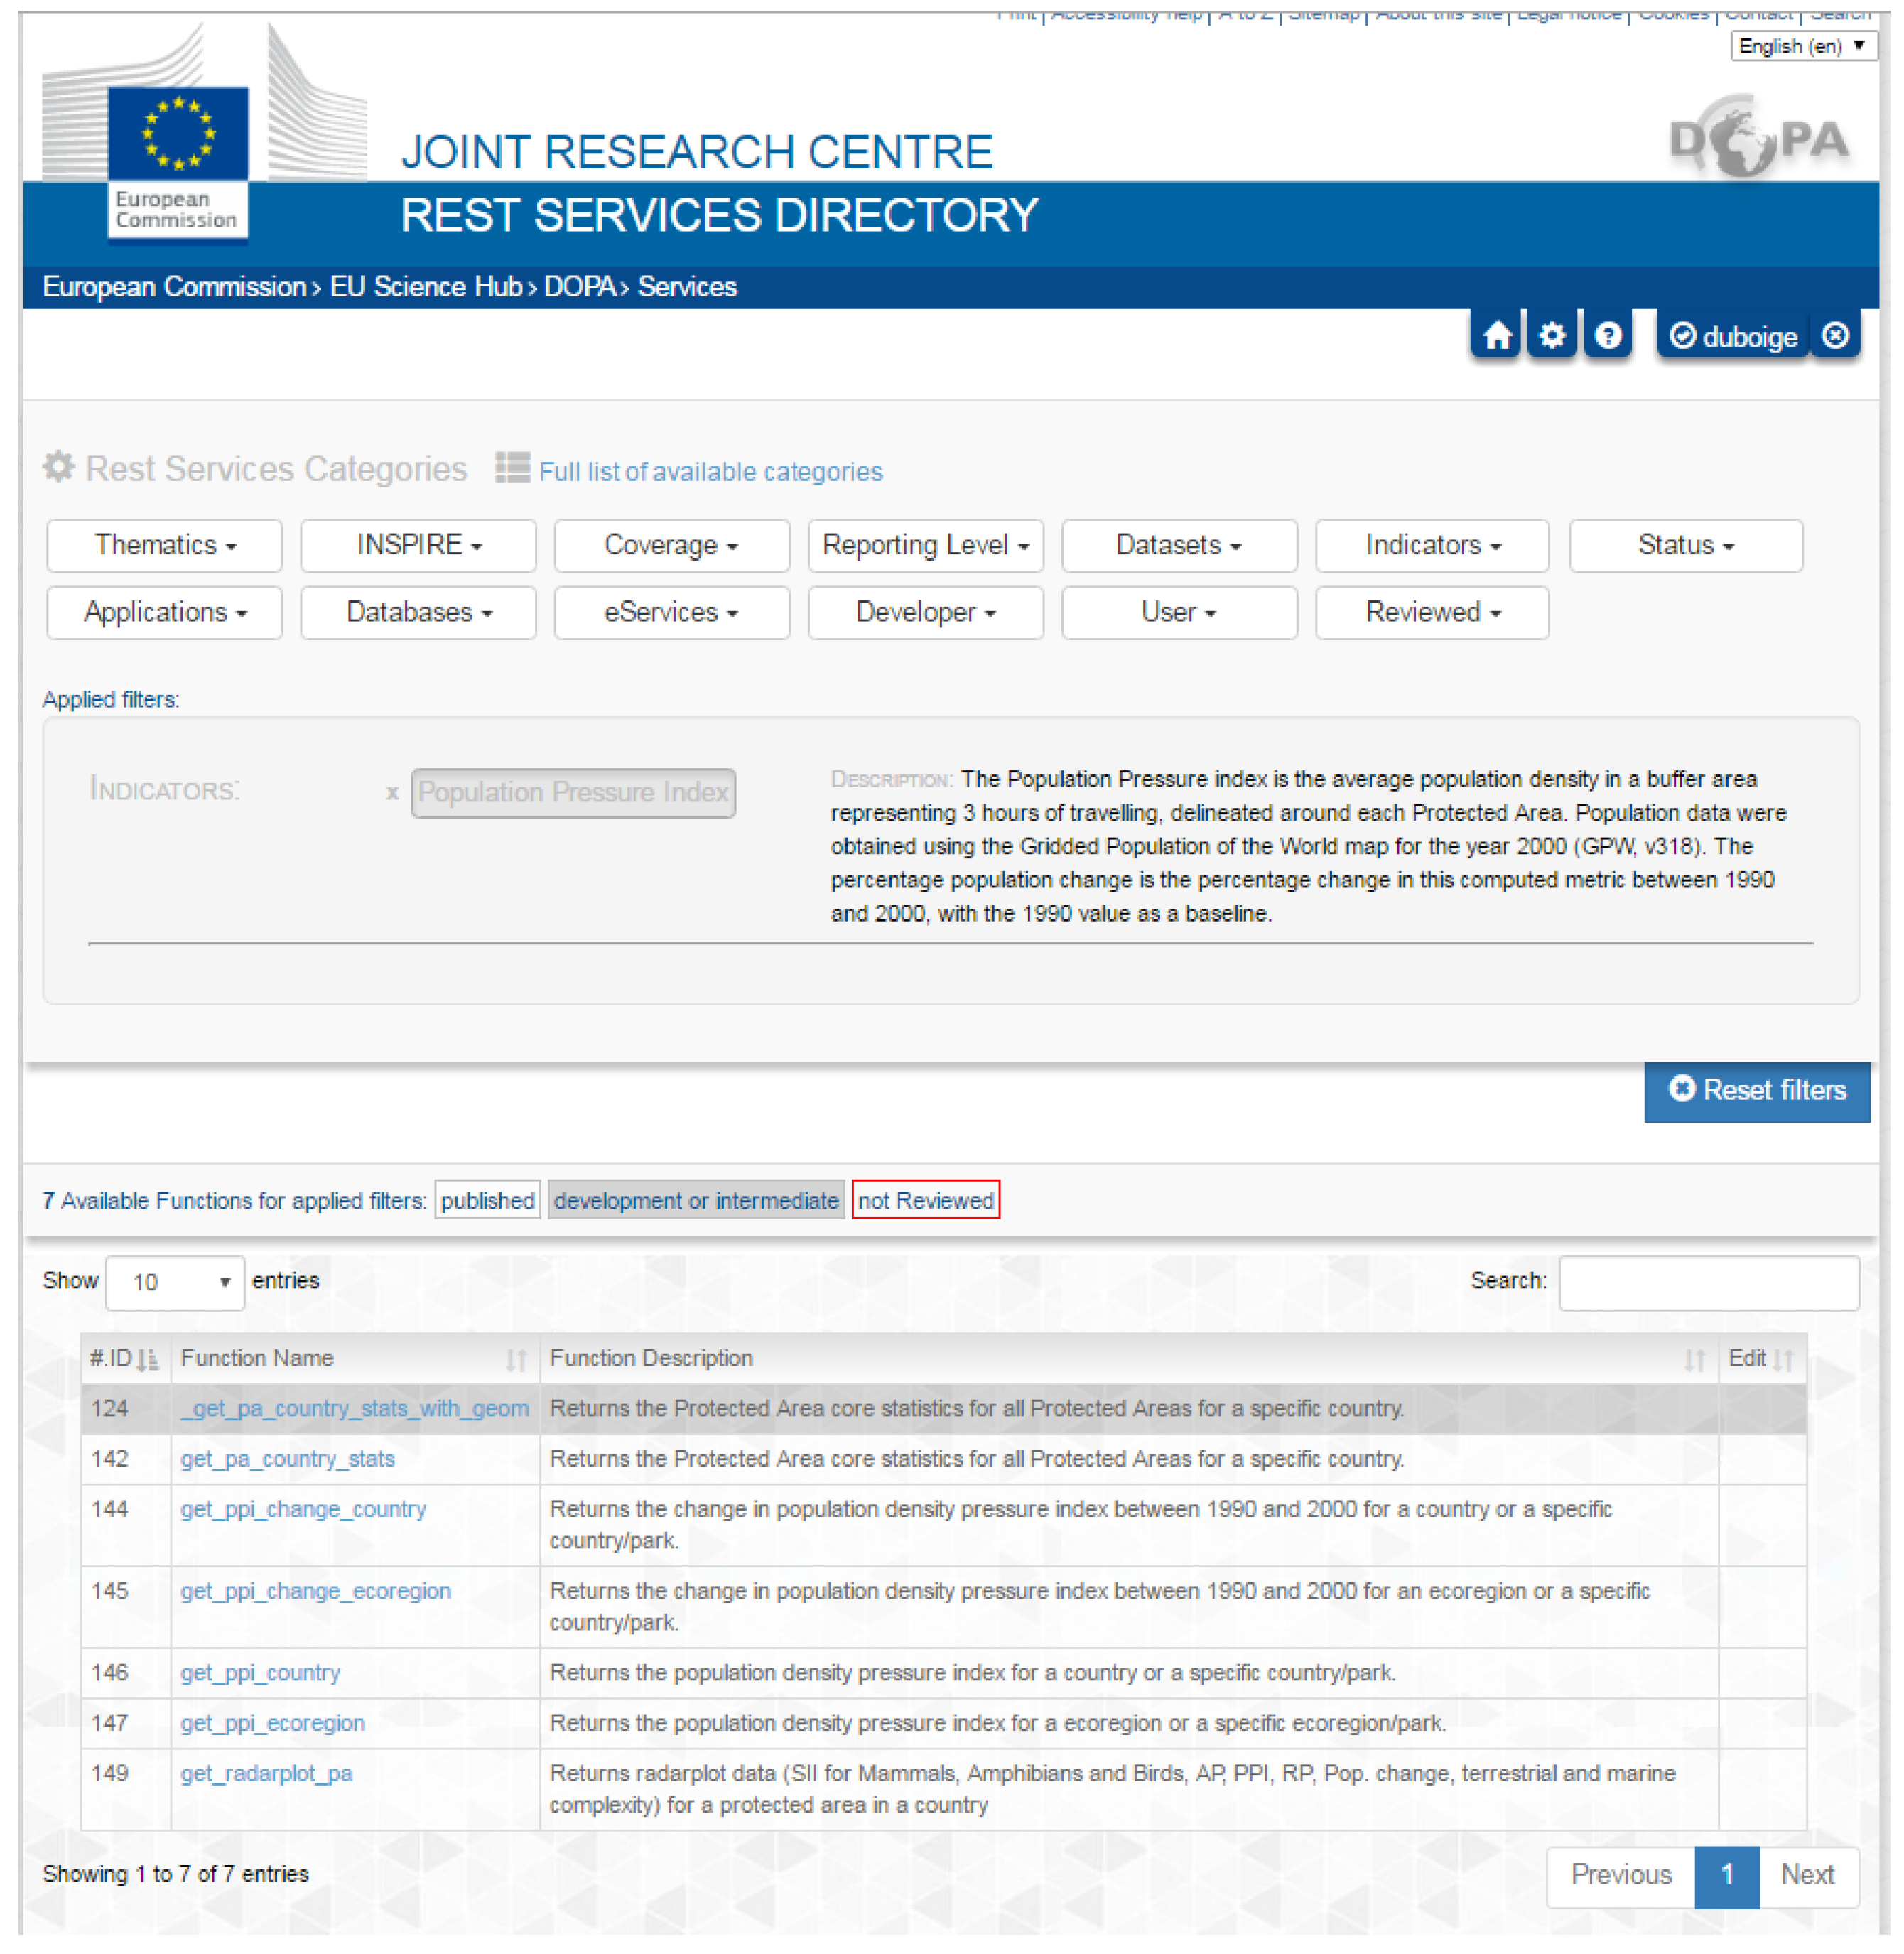
About 150 operational REST Services are available from the DOPA REST Services Directory. This is the main gateway to all the non-spatial web services for the DOPA and new analyses will appear here as and when they are developed and published. The web services are organized into a set of higher level groupings based on their thematic area, coverage, applications, etc. For example, species-related services are available in the eSpecies group. It should be emphasized that the services that are published through the directory are intended for computer-to-computer communication and data exchange. Although the service results can be viewed in a browser, they are targeted at other clients (for example, websites or desktop tools) which can render the results in a better format for viewing and interaction.
The DOPA REST Services Directory can be consulted online (
Figure 8) and is continually updated at [
48] (open access, registration required).
4. Discussion
Only a few initiatives have attempted to make global biodiversity information available over the internet in a format that is suitable for reuse by third parties and for integration with other products. The Biodiversity Virtual e-Laboratory (BioVeL) project [
49], for example, has set up an interface to map existing biodiversity-related web services, as well as an infrastructure upon which scientific workflows can be built online. The landscape regarding the access to global datasets remains however very fragmented and if international initiatives such as GEO-BON [
50], the Group on Earth Observations Biodiversity Observation Network, are trying to coordinate the deployment of a global observation network to support international conservation policy, it is still focusing its efforts on the implementation and adoption of the Essential Biodiversity Variables (EBVs) [
51]. The Digital Observatory for Protected Areas (DOPA) is thus very unique in proposing an operational set of web services that are open source and effectively bringing several global reference datasets together and in delivering a set of indicators for PAs that are relevant to decision makers in the field of biodiversity conservation.
The two main bottlenecks in generating and distributing more effectively the derived indicators proposed by the DOPA are at present: 1) Access to key global biodiversity datasets such as the International Union for Conservation of Nature (IUCN) Red List of Threatened Species, the World Database on Protected Ares, and the World Database of Key Biodiversity Areas whose restrictive licensing terms prevent these datasets from being redistributed over the web; and 2) the effort required in preprocessing most of these datasets before they can be used. Although paving the way towards a global Open Biodiversity Knowledge Management System, initiatives such as the Bouchout Declaration [
52] are still not endorsed by the main institutions hosting key biodiversity information. Concerning the effort put into preprocessing such large datasets, and putting aside the technical challenges encountered in dealing with such large amounts of data, the most time consuming is the cleaning of these data before the geometries can be further used. Practically, this means that the information proposed by the DOPA cannot be updated easily and frequently, especially because several indicators take into account the topology of the overall network of protected areas: a boundary change to a single protected area implies that the indicators for all other protected areas need to be updated as well. One will also highlight the current absence of detailed metadata associated to the proposed indicators and more work is needed to ensure a better documentation of the information presented in the derived applications.
Although global datasets allow for the development of comparable indicators across countries and regions, these also often suffer from higher local uncertainties when compared to national or regional datasets. The current information presented in the various applications of the DOPA need therefore to be used with care when it comes to site-level assessments. In other words, applications such as the DOPA Explorer 1.0 should be seen as a compass rather than a GPS to help decision makers navigate large amounts of biodiversity information that is otherwise difficult to access and manage. Earth observations, on the other hand, become increasingly freely available and portray the world every day with an increasing resolution and frequency. This wealth of additional information that is essential to biodiversity conservation also stresses the need to capture information about PAs directly on the ground, if only to validate the global products. Information that cannot be captured through remote-sensing techniques such as the presence of key species, threats, conservation projects, infrastructure, many land cover types, etc. are critical to assess protected areas and their effectiveness and need to be captured regularly as well. Such data collection can only be achieved by federating and sharing the knowledge of all local actors, from park rangers to local NGOs, researchers and even visitors in a single platform. It is therefore our objective to develop the OpenDOPA (first Beta version planned for end 2017). The OpenDOPA has the ambition not only to become an information exchange system which can bring together actors on the ground, but also to provide a bidirectional communication platform connecting local actors among themselves as well as with the people who are often remotely located but have an impact on the PAs (i.e. funders, as well as decision and policy makers). This is very much the spirit of the Regional Observatories put in place in African, Caribbean and Pacific (ACP) countries by the BIOPAMA program. These observatories are technically supported by the DOPA but also designed to support local needs by capturing and managing local information.
Another component, the DOPA Analyst, will allow at a later stage end-users to benefit more from a modelling infrastructure to compute, for example, the impact of a climate change scenario on the suitable habitat of a selected species [
40] or to dynamically calculate the indicators proposed by the DOPA for any area specified by the end-user. Supported by big data and cloud processing, the DOPA Analyst will also provide a set of ecological data derived from remote sensing to allow end-users to monitor fires, vegetation activity, rainfall, water bodies, etc. in near-real time. Environmental anomalies in the monitored variables can be detected by contrasting current environmental data against historical records every 10 days. These anomalies can be characterized by their strength, their duration and their deviation from their expected occurrence in time, something typical of seasonal changes [
53].
In summary, the DOPA, in its current version and the future ones to be released, provides the most compelling suite of global indicators on protected areas in a transparent and easily accessible manner, which allows for key insights into the characteristics of protected areas worldwide and for their comparison at different scales of analysis. At the same time, the architecture and set of services built in the DOPA demonstrate the feasibility of providing end-users with integrated tools that offer much more benefit for conservation assessments and decisions than what individual indicators or datasets alone can provide. Finally, the DOPA concept and developments highlight the importance of an improved open access to key global biodiversity datasets, which should be further mobilized, harmonized, and interconnected for the benefit of the national and global conservation actors and efforts that depend on and, in many cases, also continue to play a key role in the data collection, development and maintenance of these global datasets.
Acknowledgments
The development and maintenance of the DOPA are supported mainly by the institutional activities of the Directorate for Sustainable Resources at the Joint Research Centre of the European Commission as well as by the Biodiversity and Protected Areas Management (BIOPAMA) programme, an initiative of the African, Caribbean and Pacific (ACP) Group of States financed by the 10th European Development Fund (EDF) of the European Union. We acknowledge the earlier contributions of Jorge Mendes de Jesus, Michael Schulz and Jon Skøien in developing the DOPA.
Author Contributions
G.D. designed the study and coordinated the development of the DOPA. G.D., Lucy, B., B.B., S.S., J.M.L. and M.G. designed the indicators, Lucy, B., A.C., A.M., M.C., Luca, B., J.M.L. and M.B. designed the web services and processed the data, Lucy, B., Luca, B. and M.B. designed the derived applications. All authors read, edited and approved the manuscript.
Conflicts of Interest
The authors declare no conflict of interest.
References
- Butchart, S.H.M.; Walpole, M.; Collen, B.; van Strien, A.; Scharlemann, J.P.W.; Almond, R.E.A.; Baillie, J.E.M.; Bomhard, B.; Brown, C.; Bruno, J. Global biodiversity: Indicators of recent declines. Science 2010, 328, 1164–1168. [Google Scholar] [CrossRef] [PubMed]
- Hoffmann, M.; Hilton-Taylor, C.; Angulo, A.; Böhm, M.; Brooks, T.M.; Butchart, S.H.M.; Carpenter, K.E.; Chanson, J.S.; Collen, B.; Cox, N.A. The impact of conservation on the status of the world’s vertebrates. Science 2010, 330, 1503–1509. [Google Scholar] [CrossRef] [PubMed]
- Watson, J.E.M.; Dudley, N.; Segan, D.B.; Hockings, M. The performance and potential of protected areas. Nature 2014, 515, 67–73. [Google Scholar] [CrossRef] [PubMed]
- UNEP-WCMC; IUCN. Protected Planet Report 2016; UNEP-WCMC: Cambridge, UK; IUCN: Gland, Switzerland, 2016. [Google Scholar]
- Beresford, A.E.; Buchanan, G.M.; Sanderson, F.J.; Jefferson, R.; Donald, P.F. The contributions of the EU nature directives to the CBD and other multilateral environmental agreements. Conserv. Lett. 2016. [Google Scholar] [CrossRef]
- EuropeAid. Available online: http://ec.europa.eu/europeaid/sectors/environment/biodiversity-and-ecosystem-services_en (accessed on 16 September 2016).
- Dubois, G.; Schulz, M.; Skøien, J.; Cottam, A.; Temperley, W.; Clerici, M.; Drakou, E.; van’t Klooster, J.; Verbeeck, B.; Palumbo, I.; et al. An introduction to the Digital Observatory for Protected Areas (DOPA) and the DOPA Explorer (Beta); Publications Office of the European Union: Luxembourg, 2013. [Google Scholar]
- Dubois, G.; Bastin, L.; Martinez-Lopez, J.; Cottam, A.; Temperley, H.; Bertzky, B.; Graziano, M. The Digital Observatory for Protected Areas (DOPA) Explorer 1.0; Publications Office of the European Union: Luxembourg, 2015. [Google Scholar]
- Bertzky, B.; Corrigan, C.; Kemsey, J.; Kenney, S.; Ravilious, C.; Besançon, C.; Burgess, N. Protected Planet Report 2012: Tracking Progress towards Global Targets for Protected Areas; IUCN: Gland, Switzerland; UNEP-WCMC: Cambridge, UK, 2012. [Google Scholar]
- Juffe-Bignoli, D.; Burgess, N.D.; Bingham, H.; Belle, E.M.S.; de Lima, M.G.; Deguignet, M.; Bertzky, B.; Milam, A.N.; Martinez-Lopez, J.; Lewis, E.; et al. Protected Planet Report 2014; UNEP-WCMC: Cambridge, UK, 2014. [Google Scholar]
- Woodley, S.; Bertzky, B.; Crawhall, N.; Dudley, N.; Londoño, J.M.; MacKinnon, K.; Redford, K.; Sandwith, T. Meeting Aichi Target 11: What does success look like for protected area systems? Parks 2012, 18, 23–36. [Google Scholar]
- Butchart, S.H.M.; Di Marco, M.; Watson, J.E.M. Formulating smart commitments on biodiversity: Lessons from the Aichi Targets. Conserv. Lett. 2016. [Google Scholar] [CrossRef]
- The World Database on Protected Areas (WDPA). Available online: http://www.protectedplanet.net (accessed on 16 September 2016).
- Global Administrative Unit Layers (GAUL). Available online: http://www.fao.org/geonetwork/srv/en/metadata.show?id=12691 (accessed on 1 September 2016).
- Marine Regions. Available online: http://www.marineregions.org/ (accessed on 1 September 2016).
- Olson, D.M.; Dinerstein, E.; Wikramanayake, E.D.; Burgess, N.D.; Powell, G.V.N.; Underwood, E.C.; D’Amico, J.A.; Itoua, I.; Strand, H.E.; Morrison, J.C.; et al. Terrestrial ecoregions of the world: A new map of life on Earth. Bioscience 2001, 51, 933–938. [Google Scholar] [CrossRef]
- Spalding, M.D.; Fox, H.E.; Allen, G.R.; Davidson, N.; Ferdaña, Z.A.; Finlayson, M.; Halpern, B.S.; Jorge, M.A.; Lombana, A.; Lourie, S.A.; et al. Marine ecoregions of the world: A bioregionalization of coastal and shelf areas. BioScience 2007, 57, 573–583. [Google Scholar] [CrossRef]
- Spalding, M.D.; Agostini, V.N.; Rice, J.; Grant, S.M. Pelagic provinces of the world: A biogeographic classification of the world’s surface pelagic waters. Ocean Coast. Manag. 2012, 60, 19–30. [Google Scholar] [CrossRef]
- Saura, S.; Bastin, L.; Battistella, L.; Mandrici, A.; Dubois, G. Protected areas in the world’s ecoregions: How well connected are they? Ecol. Indic. 2016. Submitted. [Google Scholar]
- Olson, D.M.; Dinerstein, E. The Global 200: Priority ecoregions for global conservation. Ann. Mo. Bot. Gard. 2002, 89, 199–224. [Google Scholar] [CrossRef]
- Hartley, A.; Nelson, A.; Mayaux, P.; Grégoire, J.M. The Assessment of African Protected Areas; Office for Official Publications of the European Communities: Luxembourg, 2007. [Google Scholar]
- The IUCN Red List of Threatened Species, Version 2014-2. Available online: http://www.iucnredlist.org (accessed on 16 September 2016).
- Le Saout, S.; Hoffmann, M.; Shi, Y.; Hughes, A.; Bernard, C.; Brooks, T.M.; Bertzky, B.; Butchart, S.H.M.; Stuart, S.N.; Badman, T.; et al. Protected areas and effective biodiversity conservation. Science 2013, 342, 803–805. [Google Scholar] [CrossRef] [PubMed]
- Mahalanobis, P.C. On the generalised distance in statistics, for the classification problem. Proc. Natl. Inst. Sci. India 1936, 2, 49–55. [Google Scholar]
- Dubois, G.; Skøien, J.; Schulz, M.; Bastin, L.; Peedell, S. eHabitat, a multi-purpose Web Processing Service for ecological modeling. Environ. Model. Softw. 2013, 41, 123–133. [Google Scholar] [CrossRef]
- Martínez-López, J.; Bertzky, B.; Bonet-García, F.J.; Bastin, L.; Dubois, G. Biophysical characterization of protected areas globally through optimized image segmentation and classification. Remote Sens. 2016, 8, 780. [Google Scholar] [CrossRef]
- The DOPA Explorer 1.0. Available online: http://dopa.jrc.ec.europa.eu/explorer (accessed on 16 September 2016).
- McCoy, E.D.; Bell, S.S. Habitat structure: The evolution and diversification of a complex topic. In Habitat Structure: The Physical Arrangement of Objects in Space; Bell, S.S., McCoy, E.D., Mushinsky, H.R., Eds.; Chapman & Hall: New York, NY, USA, 1991; pp. 3–27. [Google Scholar]
- Thrush, S.F.; Cummings, V.J.; Dayton, P.K.; Ford, R.; Grant, J.; Hewitt, J.E.; Hines, A.H.; Lawrie, S.M.; Legendre, P.; McArdle, B.H.; et al. Matching the outcome of small-scale density manipulation experiments with larger scale patterns: An example of bivalve adult/juvenile interactions. J. Exp. Mar. Biol. Ecol. 1997, 216, 153–170. [Google Scholar] [CrossRef]
- Thrush, S.F.; Hewitt, J.E.; Funnell, G.A.; Cummings, V.J.; Ellis, J.; Schultz, D.; Talley, D.; Norkko, A. Fishing disturbance and marine biodiversity: The role of habitat structure in simple soft-sediment systems. Mar. Ecol. Prog. Ser. 2001, 223, 277–286. [Google Scholar] [CrossRef]
- The Gridded Population of the World. Available online: http://sedac.ciesin.columbia.edu/data/collection/gpw-v3 (accessed on 16 September 2016).
- Nelson, A. Travel Time to Major Cities: A Global Map of Accessibility; Office for Official Publications of the European Communities: Luxembourg, 2008; Available online: http://forobs.jrc.ec.europa.eu/products/gam/download.php (accessed on 16 September 2016).
- Fritz, S.; See, L.; McCallum, I.; You, L.; Bun, A.; Moltchanova, E.; Duerauer, M.; Albrecht, F.; Schill, C.; Perger, C.; et al. Mapping global cropland and field size. Glob. Change Biol. 2015, 1, 1980–1992. [Google Scholar] [CrossRef] [PubMed] [Green Version]
- Global Roads Open Access Data Set (gROADS), v1 (1980–2010). Available online: http://sedac.ciesin.columbia.edu/data/set/groads-global-roads-open-access-v1 (accessed on 16 September 2016).
- Dudley, N. Guidelines for Applying Protected Area Management Categories; IUCN: Gland, Switzerland, 2008. [Google Scholar]
- Global Earth Observation System of Systems (GEOSS). Available online: http://www.earthobservations.org/ (accessed on 16 September 2016).
- Global Biodiversity Information Facility (GBIF). Available online: http://www.gbif.org/ (accessed on 16 September 2016).
- Dubois, G.; Hartley, A.; Nelson, A.; Mayaux, P.; Grégoire, J.M. Towards an inter-operable web service for the monitoring of African protected areas. In Proceedings of the 33rd International Symposium on Remote Sensing of Environment, Stresa, Italy, 8 May 2009.
- Pearlman, J.; Craglia, M.; Bertrand, F.; Nativi, S.; Gaigalas, G.; Dubois, G.; Niemeyer, S.; Fritz, S. EuroGEOSS: An interdisciplinary approach to research and applications for forestry, biodiversity and drought. In Proceedings of the 34th International Symposium on Remote Sensing of Environment, Sydney, Australia, 15 April 2011.
- Skøien, J.; Schulz, M.; Dubois, G.; Fisher, I.; Balman, M.; May, I.; Tuama, É.Ó. Climate change in biomes of Important Bird Areas—Results from a WPS application. Ecol. Inf. 2013, 14, 38–43. [Google Scholar] [CrossRef]
- Biodiversity and Protected Areas Management (BIOPAMA) Programme. Available online: http://www.biopama.org/ (accessed on 16 September 2016).
- PostGIS. Available online: http://postgis.net/ (accessed on 16 September 2016).
- Hadoop. Available online: http://hadoop.apache.org/ (accessed on 16 September 2016).
- Google Earth Engine (GEE). Available online: https://earthengine.google.com/ (accessed on 16 September 2016).
- Open Geospatial Consortium (OGC). Available online: http://www.opengeospatial.org/ (accessed on 16 September 2016).
- GeoServer. Available online: http://geoserver.org/ (accessed on 16 September 2016).
- Costa, B.; Pires, P.F.; Delicato, F.C.; Merson, P. Evaluating REST architectures—Approach, tooling and guidelines. J. Syst. Softw. 2016, 112, 156–180. [Google Scholar] [CrossRef]
- DOPA REST Services. Available online: http://dopa-services.jrc.ec.europa.eu/services/ (accessed on 8 December 2016).
- The Biodiversity Virtual e-Laboratory (BioVeL). Available online: http://www.biovel.eu/ (accessed on 16 September 2016).
- The Group on Earth Observations Biodiversity Observation Network (GEO-BON). Available online: http://www.geobon.org/ (accessed on 16 September 2016).
- Pereira, H.M.; Ferrier, S.; Walters, M.; Geller, G.N.; Jongman, R.H.G.; Scholes, R.; Bruford, M.W.; Brummitt, N.; Butchart, S.H.M.; Cardoso, A.C.; et al. Essential biodiversity variables. Science 2013, 339, 277–278. [Google Scholar] [CrossRef] [PubMed] [Green Version]
- The Bouchout Declaration for Open Biodiversity Knowledge Management. Available online: http://www.bouchoutdeclaration.org/ (accessed on 16 September 2016).
- Nelson, A.; Hartley, A.; Dubois, G.; Punga, M. Geoinformatics for the environmental surveillance of protected areas in Africa. In Proceedings of the StatGIS09: GeoInformatics for Environmental Surveillance, Milos, Greece, 17–19 June 2009.
© 2016 by the authors; licensee MDPI, Basel, Switzerland. This article is an open access article distributed under the terms and conditions of the Creative Commons Attribution (CC-BY) license (http://creativecommons.org/licenses/by/4.0/).


 ,
, 