Review

Global Research on Artificial Intelligence from 1990–2014: Spatially-Explicit Bibliometric Analysis

1
School of Urban and Environmental Science, Xinyang Normal University, Xinyang 464000, China
2
Department of Geography and Earth Sciences, University of North Carolina at Charlotte, Charlotte, NC 28262, USA
3
Center for Applied Geographic Information Science, University of North Carolina at Charlotte, Charlotte, NC 28262, USA
4
School of Resource and Environmental Science, Wuhan University, Wuhan 430079, China
*
Author to whom correspondence should be addressed.
ISPRS Int. J. Geo-Inf. 2016, 5(5), 66; https://0-doi-org.brum.beds.ac.uk/10.3390/ijgi5050066
Submission received: 5 February 2016 / Revised: 3 May 2016 / Accepted: 10 May 2016 / Published: 16 May 2016
(This article belongs to the Special Issue Geographic Information Retrieval)

Abstract

:
In this article, we conducted the evaluation of artificial intelligence research from 1990–2014 by using bibliometric analysis. We introduced spatial analysis and social network analysis as geographic information retrieval methods for spatially-explicit bibliometric analysis. This study is based on the analysis of data obtained from database of the Science Citation Index Expanded (SCI-Expanded) and Conference Proceedings Citation Index-Science (CPCI-S). Our results revealed scientific outputs, subject categories and main journals, author productivity and geographic distribution, international productivity and collaboration, and hot issues and research trends. The growth of article outputs in artificial intelligence research has exploded since the 1990s, along with increasing collaboration, reference, and citations. Computer science and engineering were the most frequently-used subject categories in artificial intelligence studies. The top twenty productive authors are distributed in countries with a high investment of research and development. The United States has the highest number of top research institutions in artificial intelligence, producing most single-country and collaborative articles. Although there is more and more collaboration among institutions, cooperation, especially international ones, are not highly prevalent in artificial intelligence research as expected. The keyword analysis revealed interesting research preferences, confirmed that methods, models, and application are in the central position of artificial intelligence. Further, we found interesting related keywords with high co-occurrence frequencies, which have helped identify new models and application areas in recent years. Bibliometric analysis results from our study will greatly facilitate the understanding of the progress and trends in artificial intelligence, in particular, for those researchers interested in domain-specific AI-driven problem-solving. This will be of great assistance for the applications of AI in alternative fields in general and geographic information science, in particular.

1. Introduction

Artificial Intelligence (AI) is a subject that studies theories, methods, and applications with respect to simulation, extension, and expansion of human intelligence for problem-solving. Application domains of AI include robotics, voice recognition, image recognition, natural language processing, and expert systems [1]. AI, as a branch of computer science, aims to understand the essence of intelligence and design intelligent machines that can act as human behavior. AI has attracted researchers with respect to its theories and principles since the 1956 Dartmouth conference [2,3]. Since the 1960s, AI-related researches have been heavily funded, and many laboratories have been established around the world. However, in the mid-1970s and early 1980s, there are two periods of stagnancy in AI [4]. Until the 1990s, AI achieved its greatest success, which can be confirmed by the scientific articles indexed by the Science Citation Index Expanded (SCI-Expanded) (Figure 1). It is during this period that AI is widely used for logistics, data mining, medical diagnosis, and many other areas throughout industry [2,5]. From the early 21st century, AI research enters a period with numerous research outputs. The success was attributed to several factors: the increasing computational power of computers, a greater emphasis on problem-solving, creation of new ties between AI and other fields working on similar problems, and a new commitment by researchers to solid mathematical methods and rigorous scientific standards [6,7]. Today, AI and its applications play an important role in computer science and its related domains [8].
Bibliometric analysis comprises a series of quantitative and visual procedures or statistics to generalize research patterns, dynamics and trends in scientific publication [9,10,11,12]. In recent years, many bibliometric methods were put forward to estimate the scientific outputs or research trend of authors, journals, institutions, and countries, even to identify and quantify international collaboration [13,14,15]. As the effective method for providing an immediate picture of the actual content of research topics, citation analysis, co-words analysis, and geographic impact factor (GIF) were carried out within the field of bibliometric analysis to enhance the conventional bibliometric methods [16,17,18,19]. Recently, correlation analysis was introduced in bibliometrics to explain the phenomenon of research trends [15].
AI is a research domain that includes many branches and methods. While bibliographic data for AI-related studies are increasingly available, how to discover the research patterns and trends in AI based on these bibliographic data represents a challenging research question. Further, bibliographic data are spatially explicit per se. However, there is a gap between the use of spatially-explicit methods for analyzing these bibliographic data (i.e., retrieval of geographic information from bibliometrics) and advances in Geographic Information Science (GIScience; [20]), which focuses on the development of these spatially-explicit methods. Therefore, in this study we conduct a bibliometric analysis of AI research for the period of 1990–2014. We proposed an alternative and innovative method, with support from geographic information retrieval technologies, to reveal global research correlation between scientific output and the investment of Research and Development (R and D). Our aims include: (1) multi-angle assessment of research productivity by subject category, journal, author, country, institution, and keywords; (2) analyze the significant publication patterns in the domain of AI research; and (3) summarization of the research directions and trends in the field of AI.

2. Data and Methodology

2.1. Data Sources

The data of this study were collected from the database of the Science Citation Index Expanded (SCI-Expanded), Conference Proceedings Citation Index-Science (CPCI-S) online version of Web of Science published by the Institute for Scientific Information (ISI), Philadelphia, USA, because the SCI-Expanded database is deemed as the most influential database and reliable bibliographic source [18,21], and CPCI-S includes many original theory papers. SCI-Expanded and CPCI-S have been widely applied to reveal bibliographic patterns and research trends in a variety of scientific fields [22,23]. Based on previous bibliometric analysis of AI and related researches, “*artificial intelligence*”, which included any word that contain “artificial intelligence”, such as “distributed artificial intelligence”, ”artificial intelligence technique”, was used to search for publication with these words in its title, abstract, or keywords in the database of SCI-Expanded and CPCI-S from 1990–2014 (duplicated records were eliminated). The reported impact factor (IF) of the journals was obtained from 2014 Journal Citation Report (JCR) [24]. The data of R and D (Research and Development) investment was collected from the World Bank and the website Wikipedia.
Publications originating from England, Scotland, Wales, and North Ireland were reclassified as from the United Kingdom (UK) [15], and publications from Hong Kong and Taiwan were separated from those from mainland China because there are different research systems in these territories.

2.2. Methodology

Bibliometric analysis provides support for quantitative analysis of scientific knowledge by employing mathematical, statistical, and visual approaches to generalize research patterns and trends in scientific publication. Most of the analysis can be performed by Microsoft Excel 2010 (Redmond, Washington, USA) and CiteSpace 2.2 R11 (Philadelphia, Pennsylvania, USA), such as scientific outputs, subject categories, and journals. However, scientific publication has a spatial component, such as the location(s) of authors or institutes. The analysis of this spatial component through geographic information retrieval methods may offer more insight into the research pattern and trends across spatial scale (e.g., regional, country, or continental). In this study, we introduced GIS-based spatial analysis into the field of bibliometric analysis for the retrieval and discovery of geographic information in bibliometrics—i.e., spatially-explicit bibliometric analysis. We focus on the use of kernel density analysis and social network analysis here.

2.2.1. Kernel Density Analysis

In order to perform the kernel density analysis, we first introduced kernel density estimation (KDE; see [25]) to visualize the worldwide geographic distribution of authors. We defined the kernel density estimator to represent the worldwide geographic distribution of authors. Let (x1, x2, …, xn) be the spatial coordinates of authors in the field of AI, which is a distribution with unknown density. Its kernel density estimator can be described as follows:
f h ^ ( x ) = 1 n i = 1 n K h ( x x i ) = 1 n h i = 1 n K h ( x x i h )
where K(·) is the kernel, and h is a smoothing parameter often referred to as the bandwidth. By means of the kernel density estimator, we can obtain a continuous surface generated by the quantity of authors all over the world based on the original data. Then the worldwide geographic distribution of authors can be overlaid with the world map to visualize the hotspot area of AI research.

2.2.2. Social Network Analysis

Social network analysis is the method of investigating social structures based on the theory of networks and graphs [26]. In this study, this method is applied into bibliometric analysis to visualize the networks in which nodes are represented as points and edges are represented as lines. These networks are often visualized through structure and relation of such aspects as authors, countries, institutes, and keywords. We performed the social network analysis by defining the following two elements. Nodes can be used to represent the entity in the real world. In bibliometric analysis, it can be the authors, countries, institutes, and keywords. Edges show the relationship or interactions between nodes. For example, edges can explain the collaboration between authors or co-occurrence keywords in the literature. The size of nodes can show the degree of importance of an entity, while the width of edges shows the degree of relationship in the network.
In this study, the method of social network analysis was employed to reveal bibliographic patterns in AI research. The collaboration type was determined by the addresses of authors, where the term “single country/institution” was assigned if researchers were from the same country/institution and the term “international/inter-institutionally collaboration” was assigned if an article was co-authored by researchers from multiple countries/institutions. We geocoded authors, countries, institutes, and keywords using CiteSpace 2.2 R11, and we use the software Ucinet 6 (Irvine, California, USA), one of the prevalent social network analysis software platforms, to measure the relative importance of each individual country/territory in the collaboration network and each word in the co-word analysis.

3. Results and Discussion

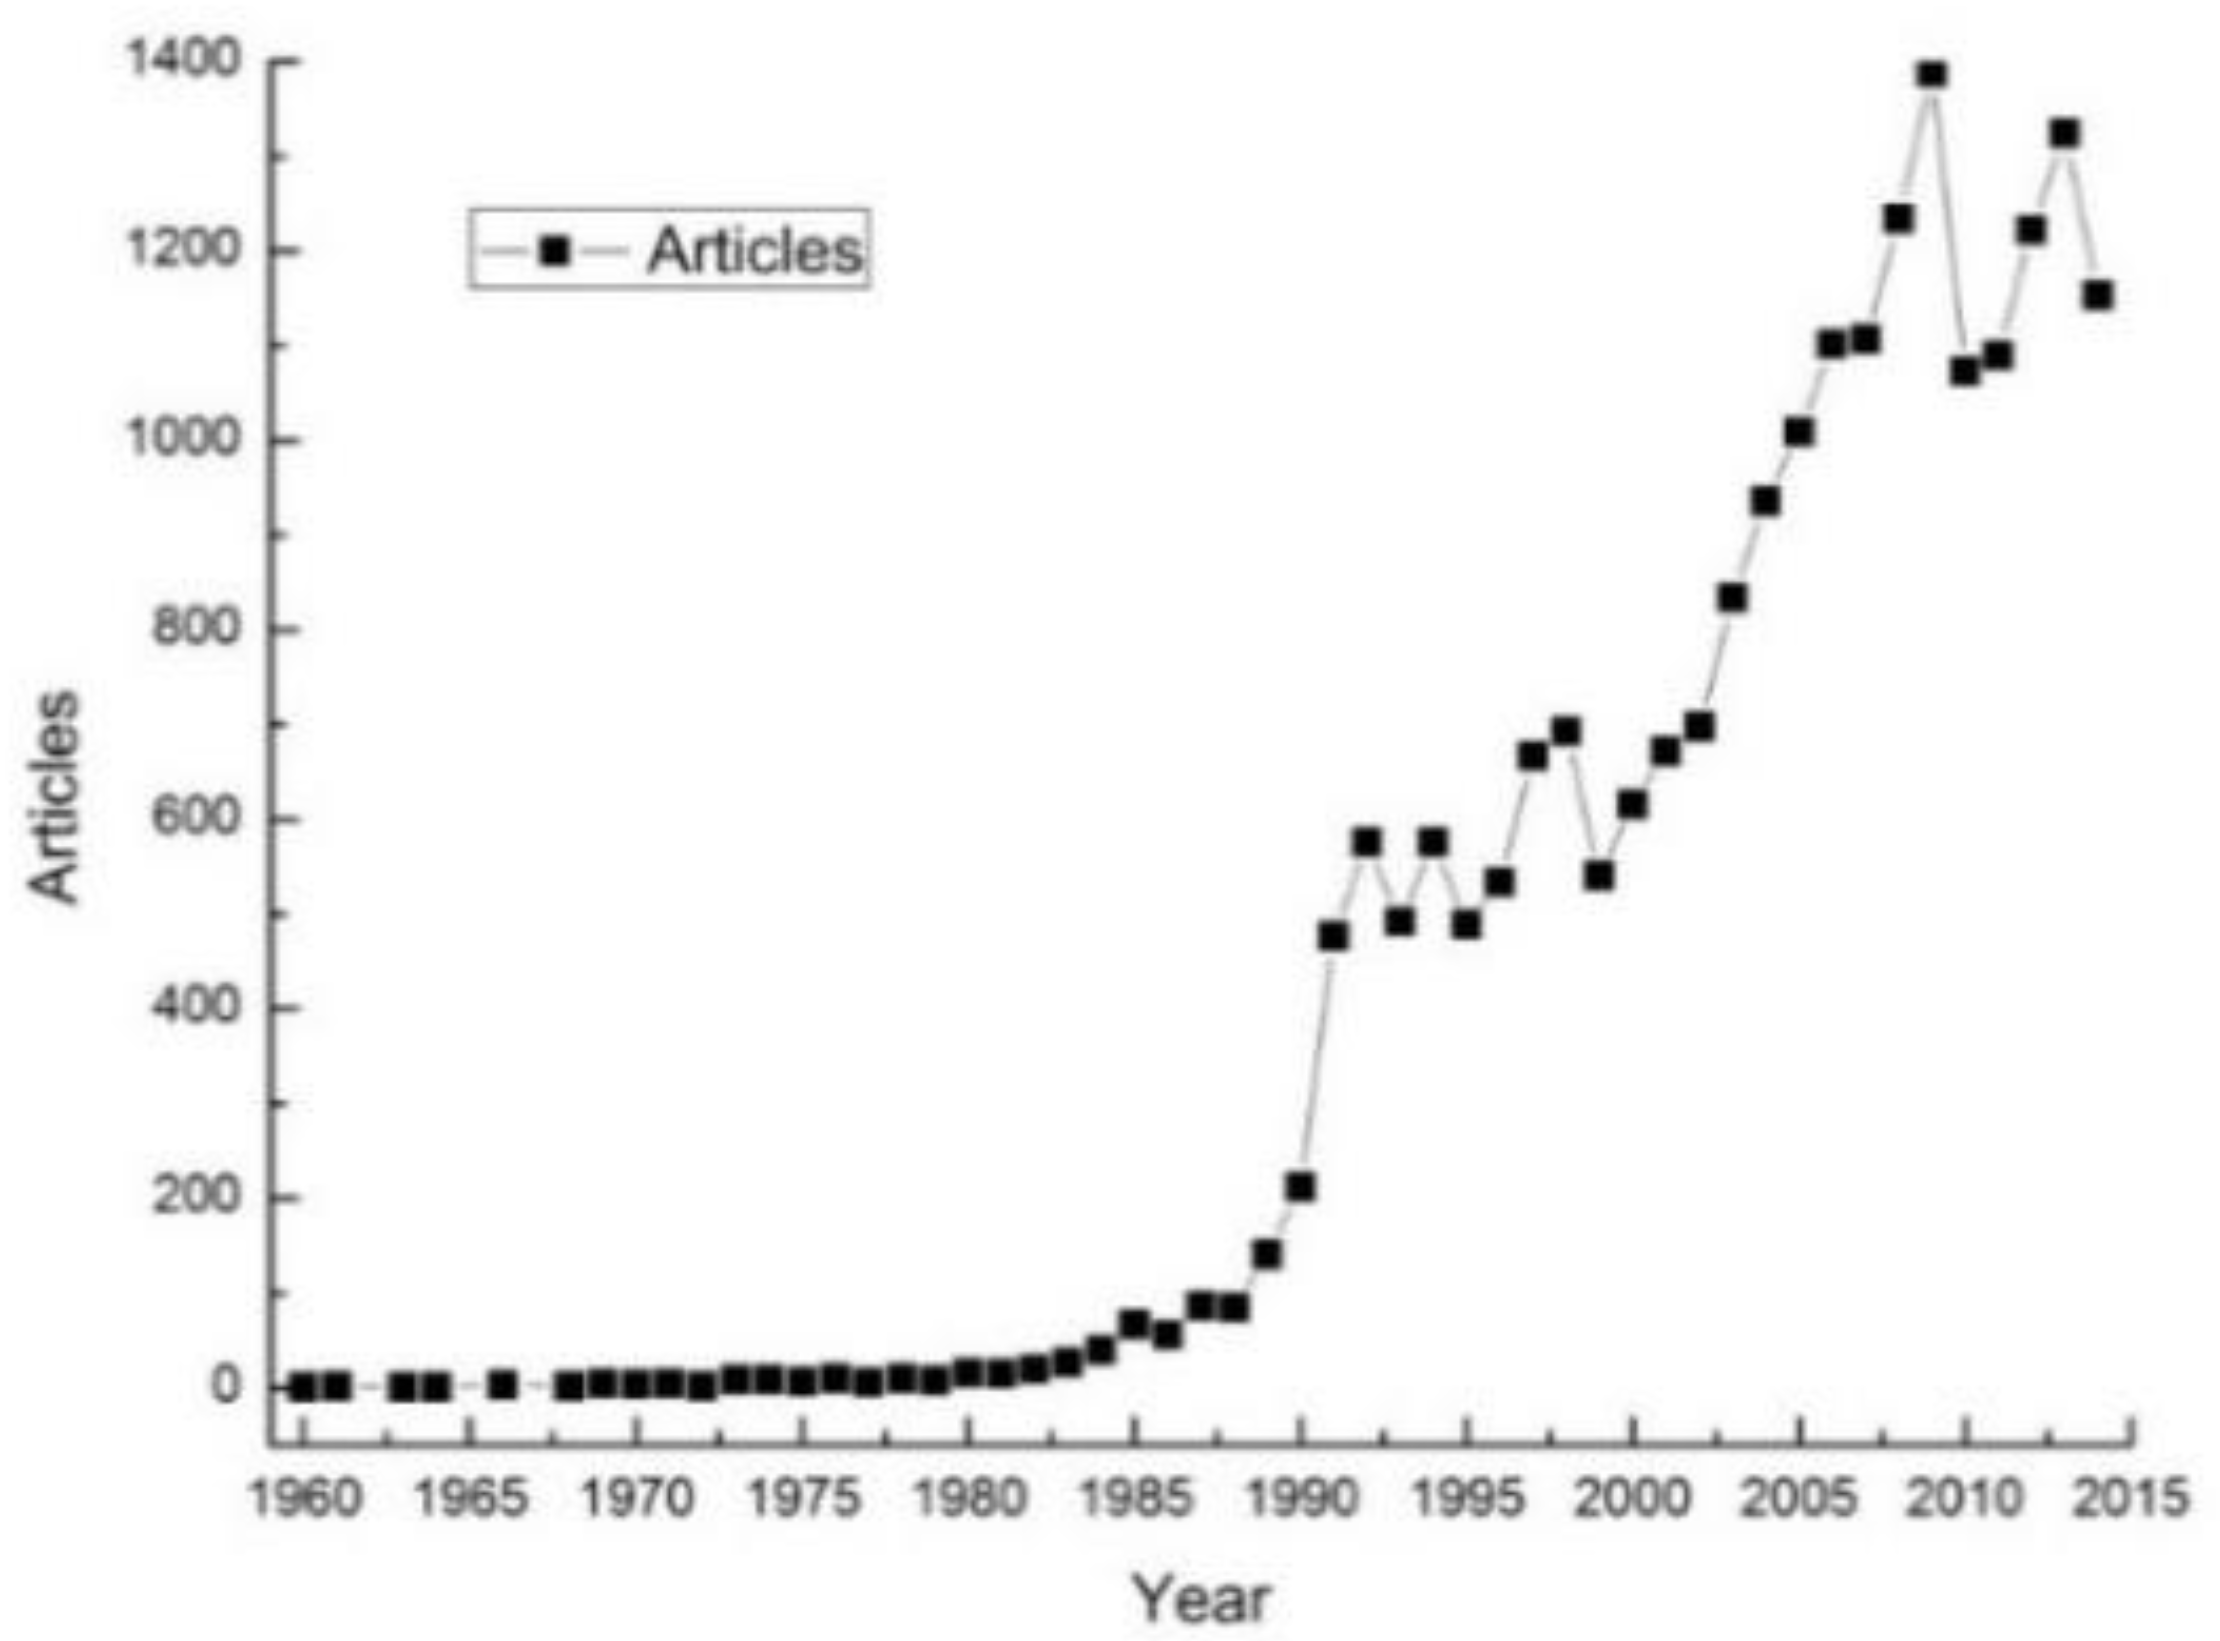
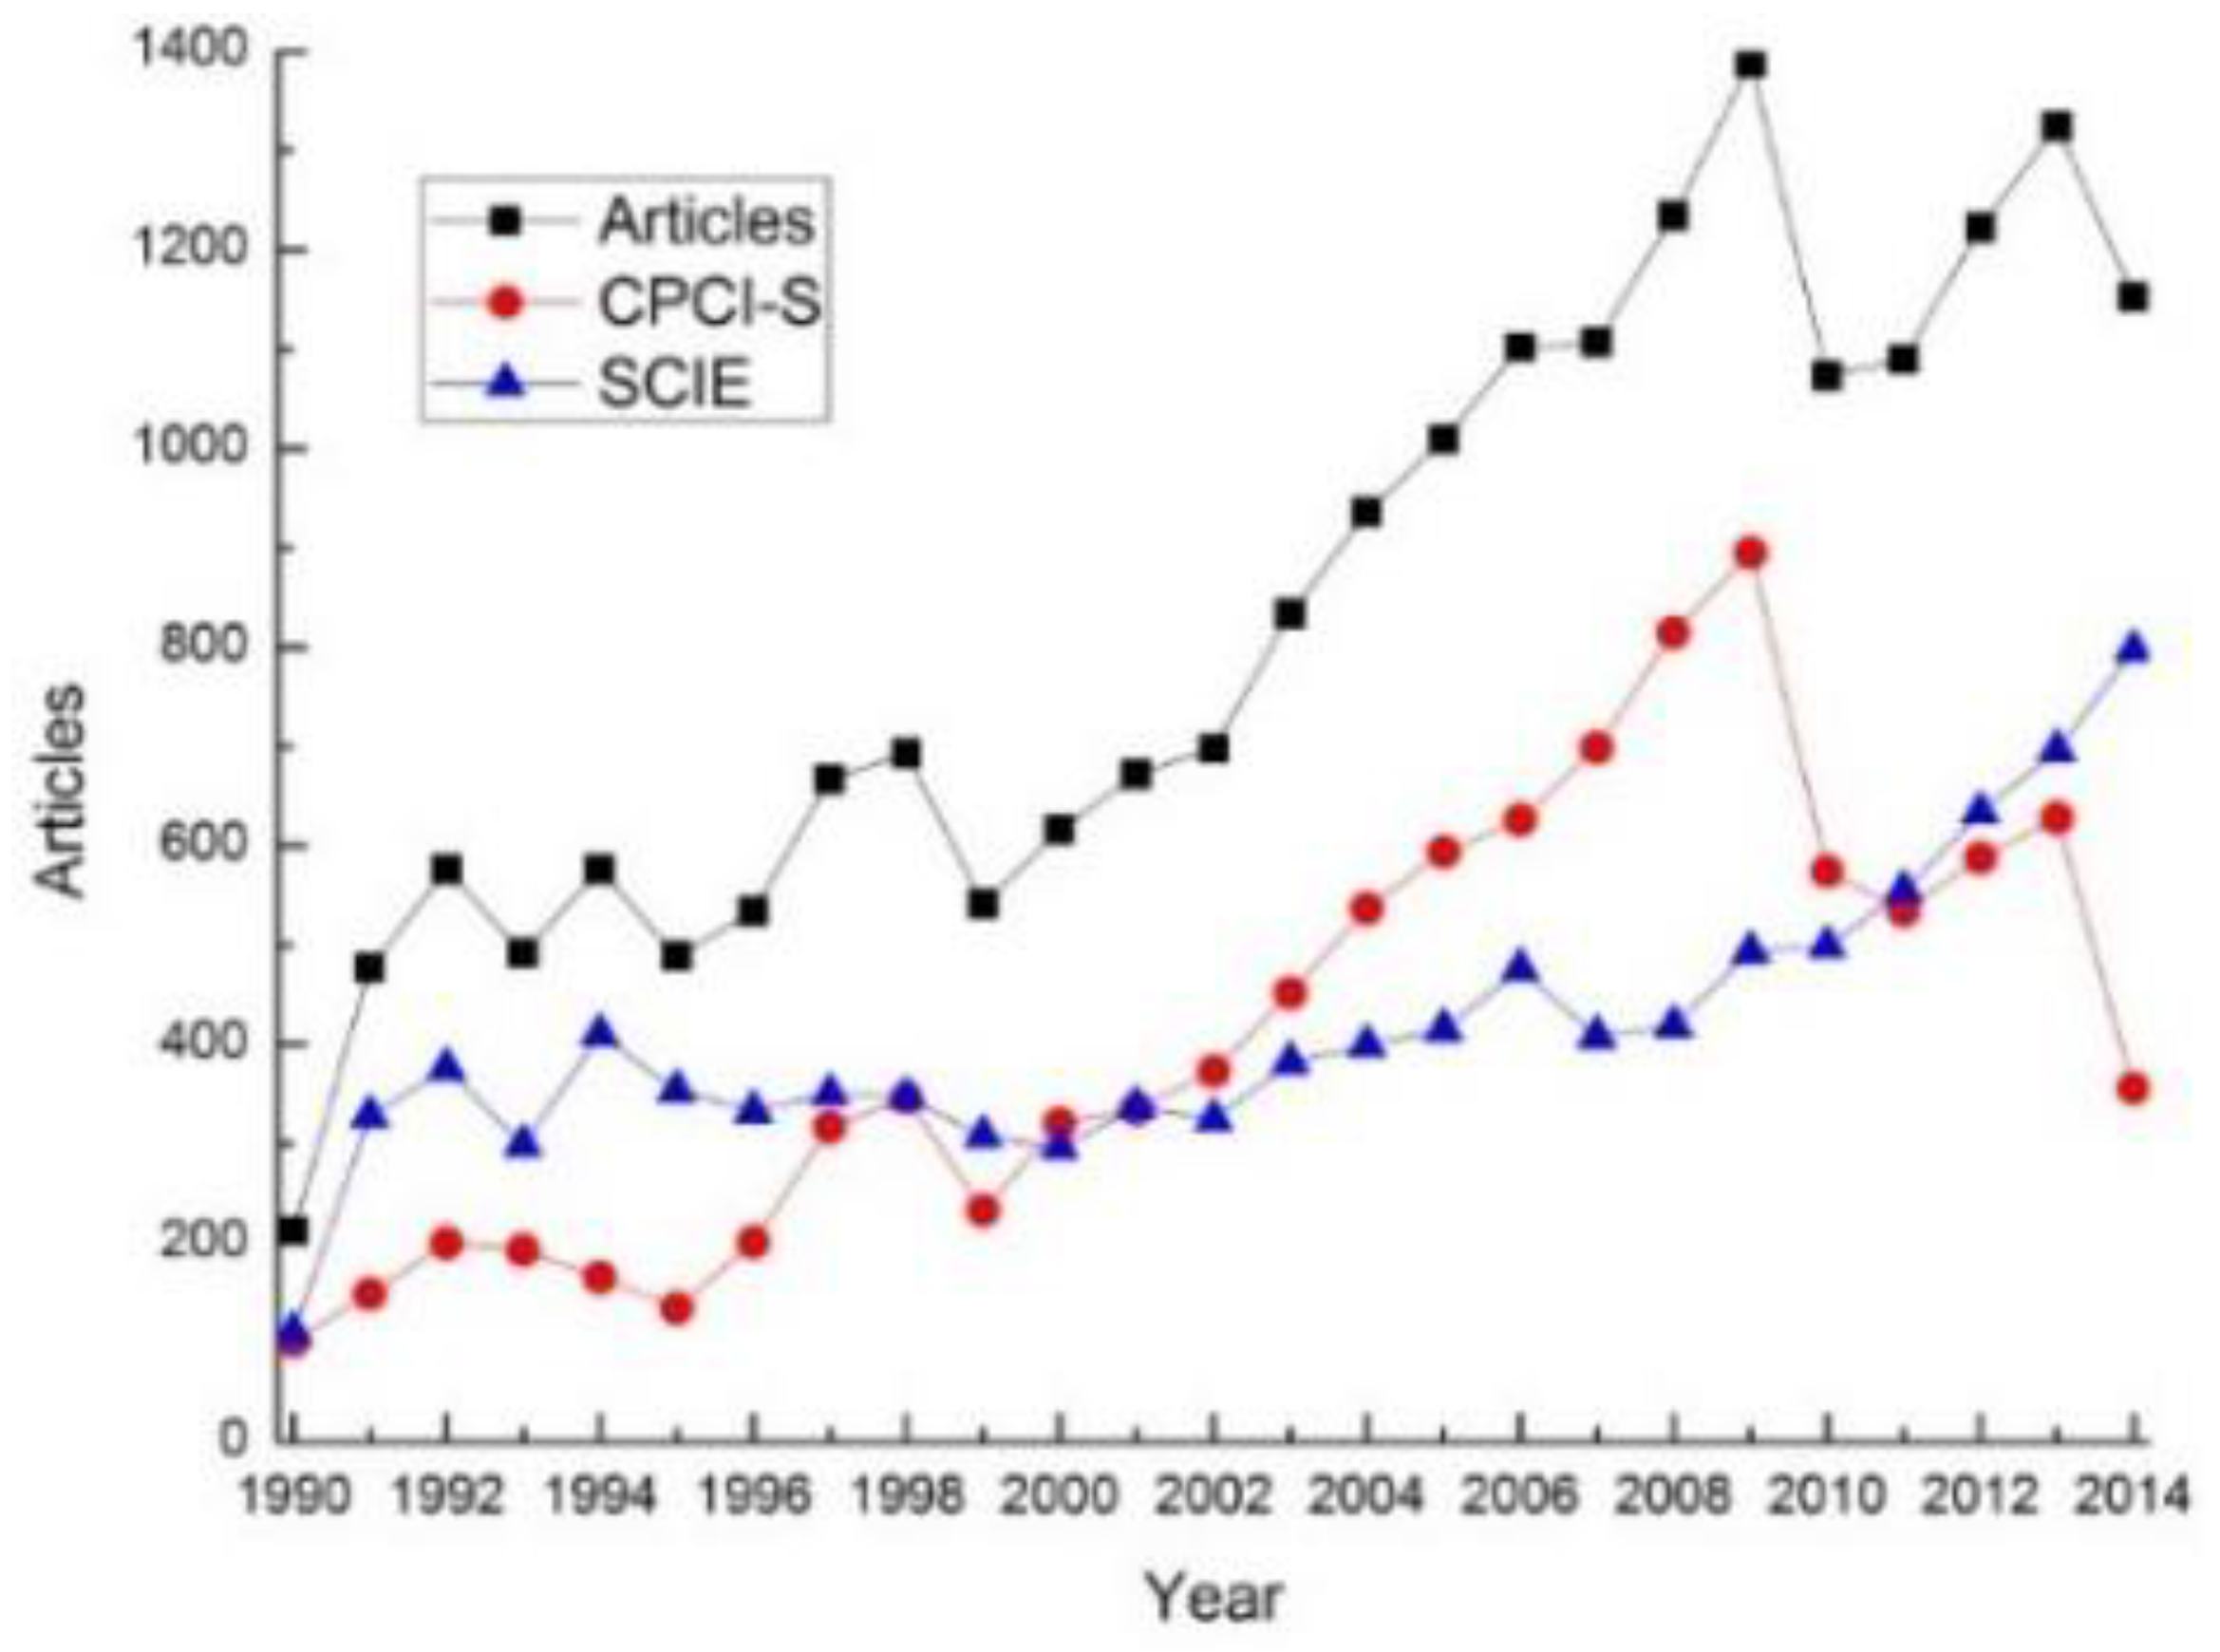
3.1. Publication Outputs

From this study, 21 document types were found in a total of 22,072 publications related to AI issued during the past 25 years. Article (20,715), including the article published as proceeding papers (8806) or book chapters (6), was the most common type (occupying 93.85% of the total publications), followed by reviews (528 or 2.39%) and editorial material (508 or 2.3%). Among these publications, 20,715 articles on AI were further analyzed. 98.49% of all articles were published in English. Twenty-one other languages appeared, the most frequent of which were Chinese (59), Spanish (51), French (51), German (41), and Portuguese (39). The numbers of publications categorized by year were reported in Table 1. The annual publications increased from 212 in 1990 to 1153 in 2014, illustrating a significant increase in AI research over the past 25 years. Meanwhile, articles remained as the dominant type throughout this period.
The artificial intelligence research has experienced a rapid growth over the last decades. Figure 2 shows that AI publications, both indexed by SCI-Expanded and CPCI-S, increased rapidly from early 1990s. However, from 2010, the number of publications in AI is unstable. The most important reason is that the publication indexed by CPCI-S exhibits a decreasing pattern, and the total publication output remains stable. Table 1 provides more information in addition to Figure 2. The number of authors per paper increased from 2.1 to 3.4 in the period of 1990–2014, which is likely caused by the higher quality of research involving more researchers from different fields. Meanwhile, the number of articles cited per paper increased from 9.2 to 34.5, which, as we know, was brought about by more and more research outputs on AI and citing from other related fields. From Table 1, an interesting finding is that the earlier the articles were published, the lower their times of being cited before the 2000s, and after that, another interesting finding is that the later articles were published, the lower their times of being cited. Thus, the less research output limited the number of citations before the 2000s, and after that, the rule of citation does work [27,28].

3.2. Subject Categories and Major Journals

According to the classification of SCI/SSCI subject categories in 2014, AI research covered 138 categories. Top 10 subject categories include computer science (12,575; 35.2%), engineering (7884; 22.1%), automation and control systems (1714; 4.8%), operations research and management science (1185; 3.3%), mathematics (911; 2.5%), telecommunications (714; 2%), materials science (700; 2%), robotics (642; 1.8%), instruments and instrumentation (484; 1.4%), and physics (444; 1.2%). These top categories also suggest AI research is becoming a high-priority theme. The method of AI has been widely used in various applications including games, automation, medical and process control [3]. More and more researchers and scientists began to engage in this hot theme.
Articles on AI were published on 2599 journals and 958 proceedings (see Table 2 for the 20 most productive journals). There was a high concentration of artificial intelligence articles in these journals. These 20 journals (0.6% of 3557 journals) or proceedings accounted for 1,976 articles, or 9.5% of the total articles. Obviously, Expert Systems with Applications published the most articles on AI (344), followed by Engineering Applications of Artificial Intelligence (161), AI Magazine (161), Artificial Intelligence (126), and Knowledge-based Systems (103). AI-related articles published in these journals have received, on average, 13.3 citations, indicating that these articles have substantial influences on these subjects. Furthermore, several journals published a considerable number of highly cited articles, including Artificial Intelligence (126 articles with 7341 citations) and IEEE Transactions on Information Theory (seven articles with 4524 citations).

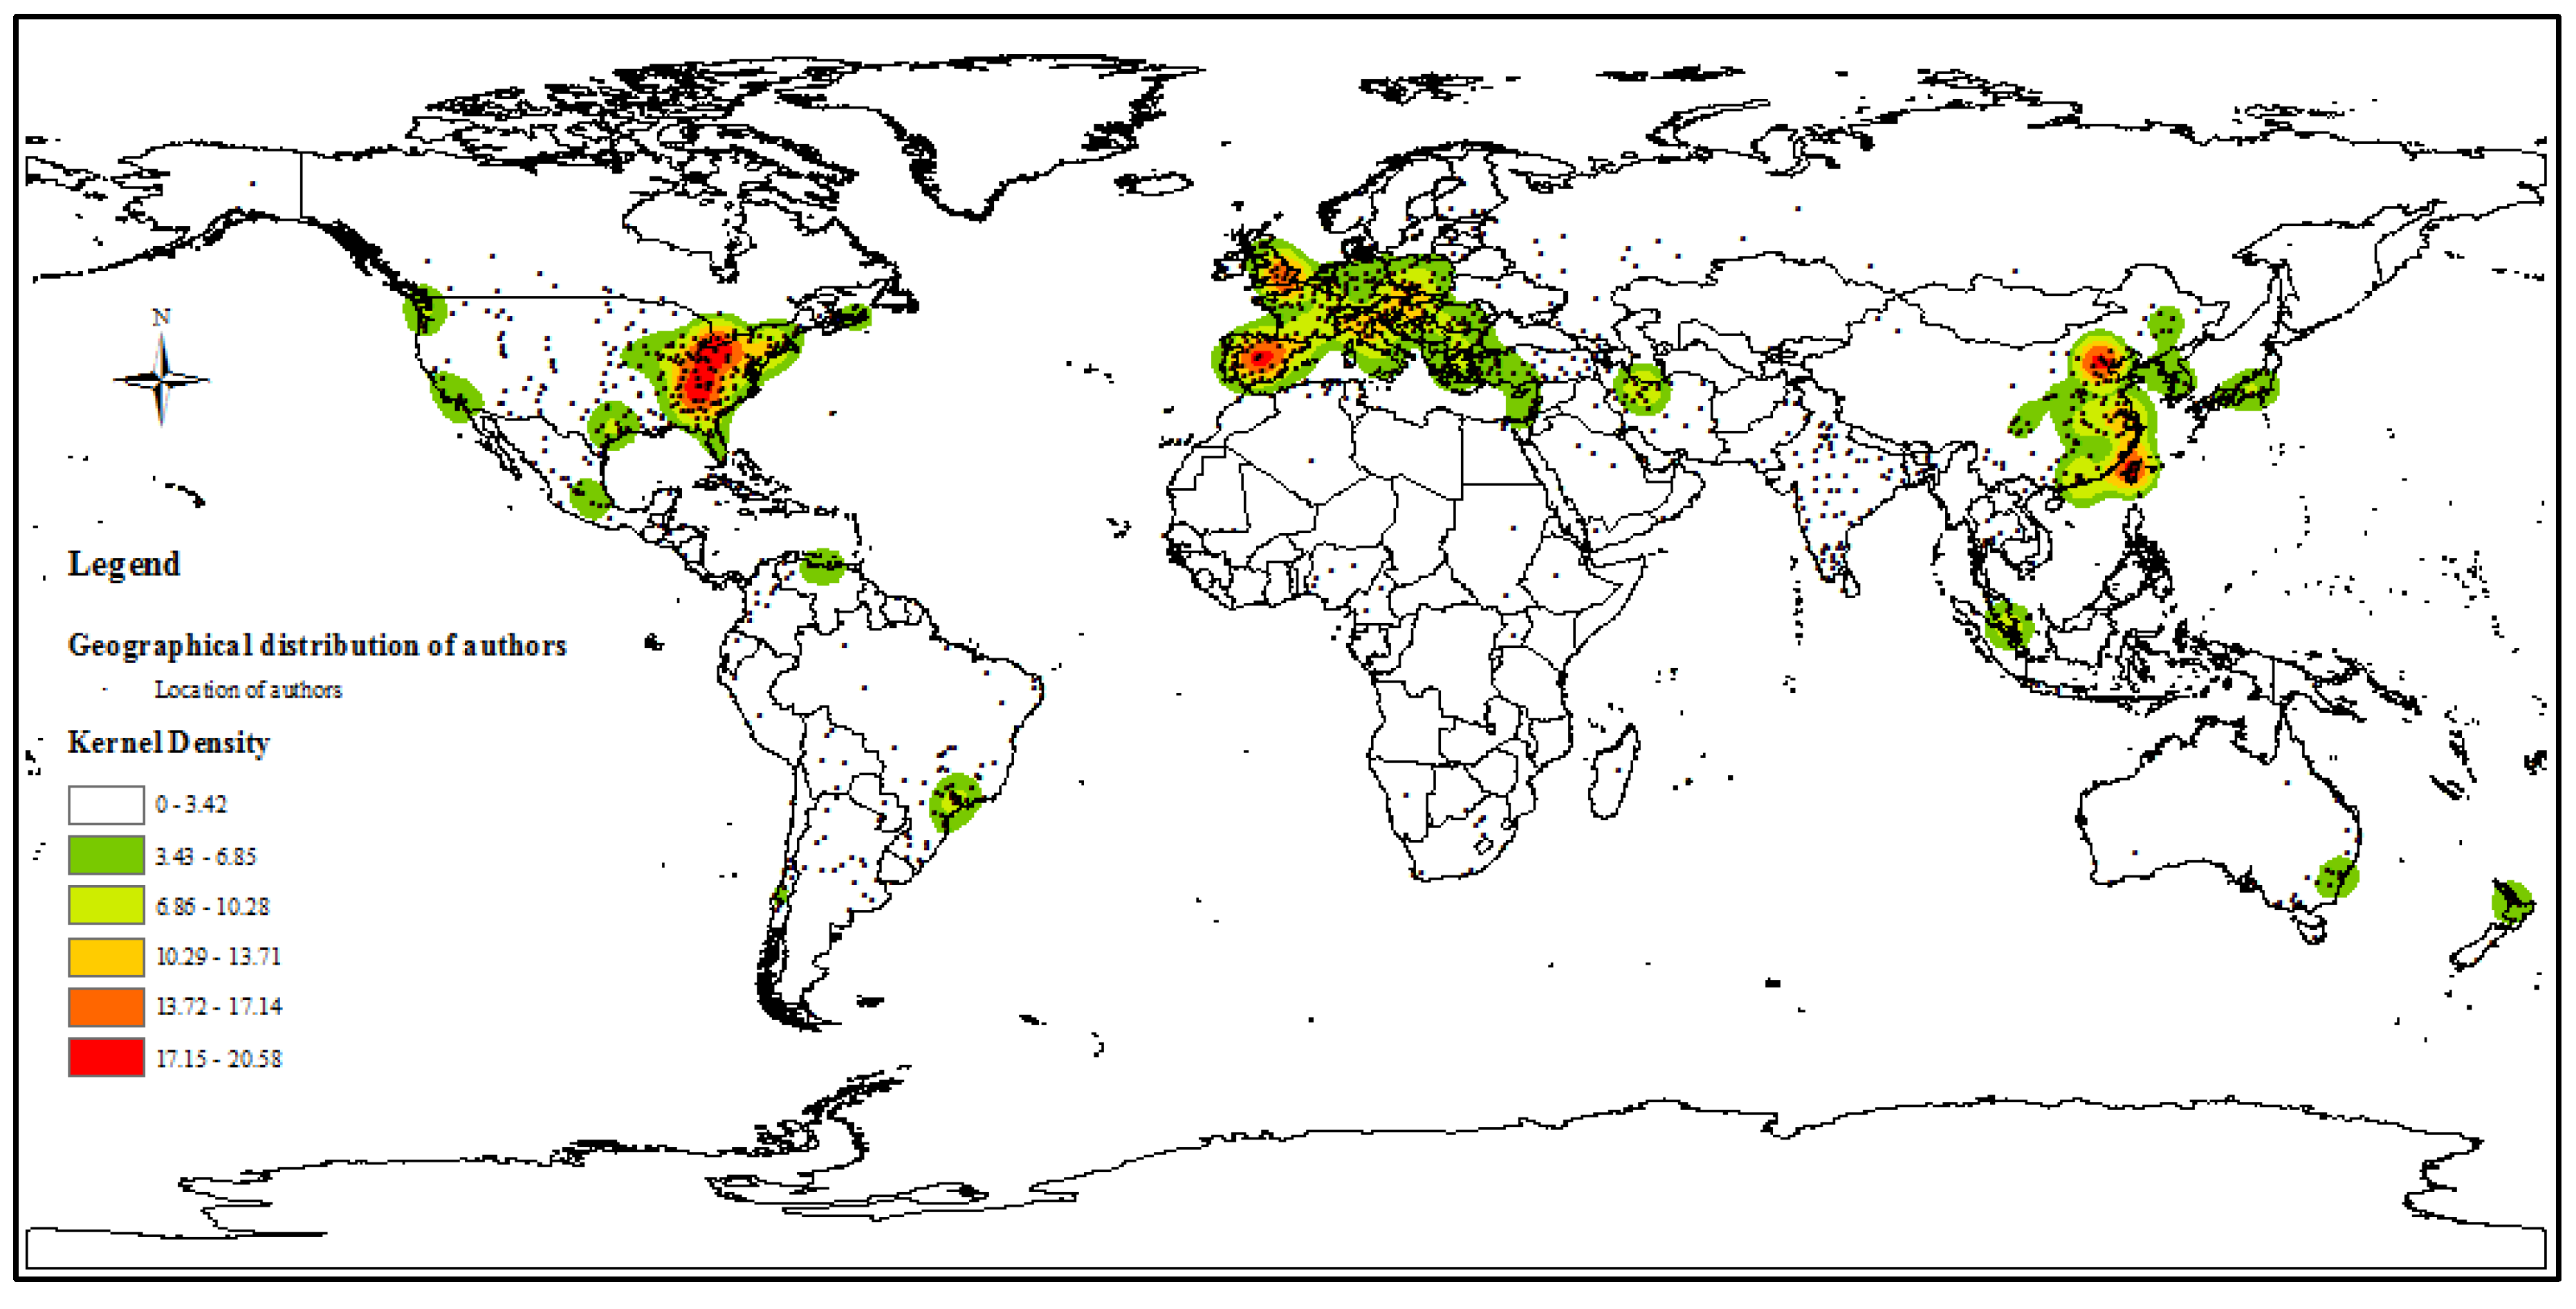
3.3. Author Productivity and Geographic Distribution

Table 3 presents the result of the author productivity analysis. Twenty authors were the most productive during the period of 1990–2014. It is evident that these top productivity authors have made great achievement on AI research. Of these authors, J. Neves produced the largest number (35) of articles [29], but G. Klopman received the highest rate of citations (35.6) [30,31]. For individual authors, it seems that their productivity is negatively related to their academic value. The pursuit for high-level research might be at the cost of research quantity [32]. We found the authors mainly cooperated with colleagues in national-level institutions rather than international cooperation by analyzing the data of authors: M. Ogiela published 14 articles with R. Tadeusiewicz, and G. Klopman has 11 articles with H. Rosenkranz. These data suggest that the cooperation tends to not be prevalent in AI research, and this cooperation is far less than that in other fields [15,33].
We geocoded cities of authors in the database, and mapped the distribution of authors in AI research by using ArcGIS 10.1, a GIS software package. Then, we employed the method of kernel density estimation (KDE) to visualize the geographic distribution of authors (Figure 3). As Figure 3 shows, major spatial clusters of authors are in U.S., Europe, and East Asia. In USA and China, most of the authors were located in east coast instead of west. The clusters of European authors were mainly located in UK, Spain, France, Germany, Italy, Poland, Greece, Netherlands, and Romania. China, Japan, and South Korea were the major distribution areas of authors in East Asia. There are spatial clusters of authors distributed in Canada, India, Brazil, Iran, and Turkey, but an exception is India: distribution of authors did not form a cluster, although there are many authors with productive output. Figure 4 shows the distribution of authors and investment of R and D (also see Table 4). By comparing the two figures, we found there is a strong spatial correlation between the geographic distribution of authors and investment of R and D. Most of the authors are distributed in the developed countries and developing countries with high investment of R and D. In these countries, research institutions and universities receive a significant amount of R and D investment. Therefore, authors in those countries produce more articles. For individual countries, productive authors are clustered in those regions with more universities and research institutes, such as the east part of USA, Beijing in China, Paris in France, London in UK, and Tokyo in Japan. Support in these institutions and universities provide more opportunities for researchers.

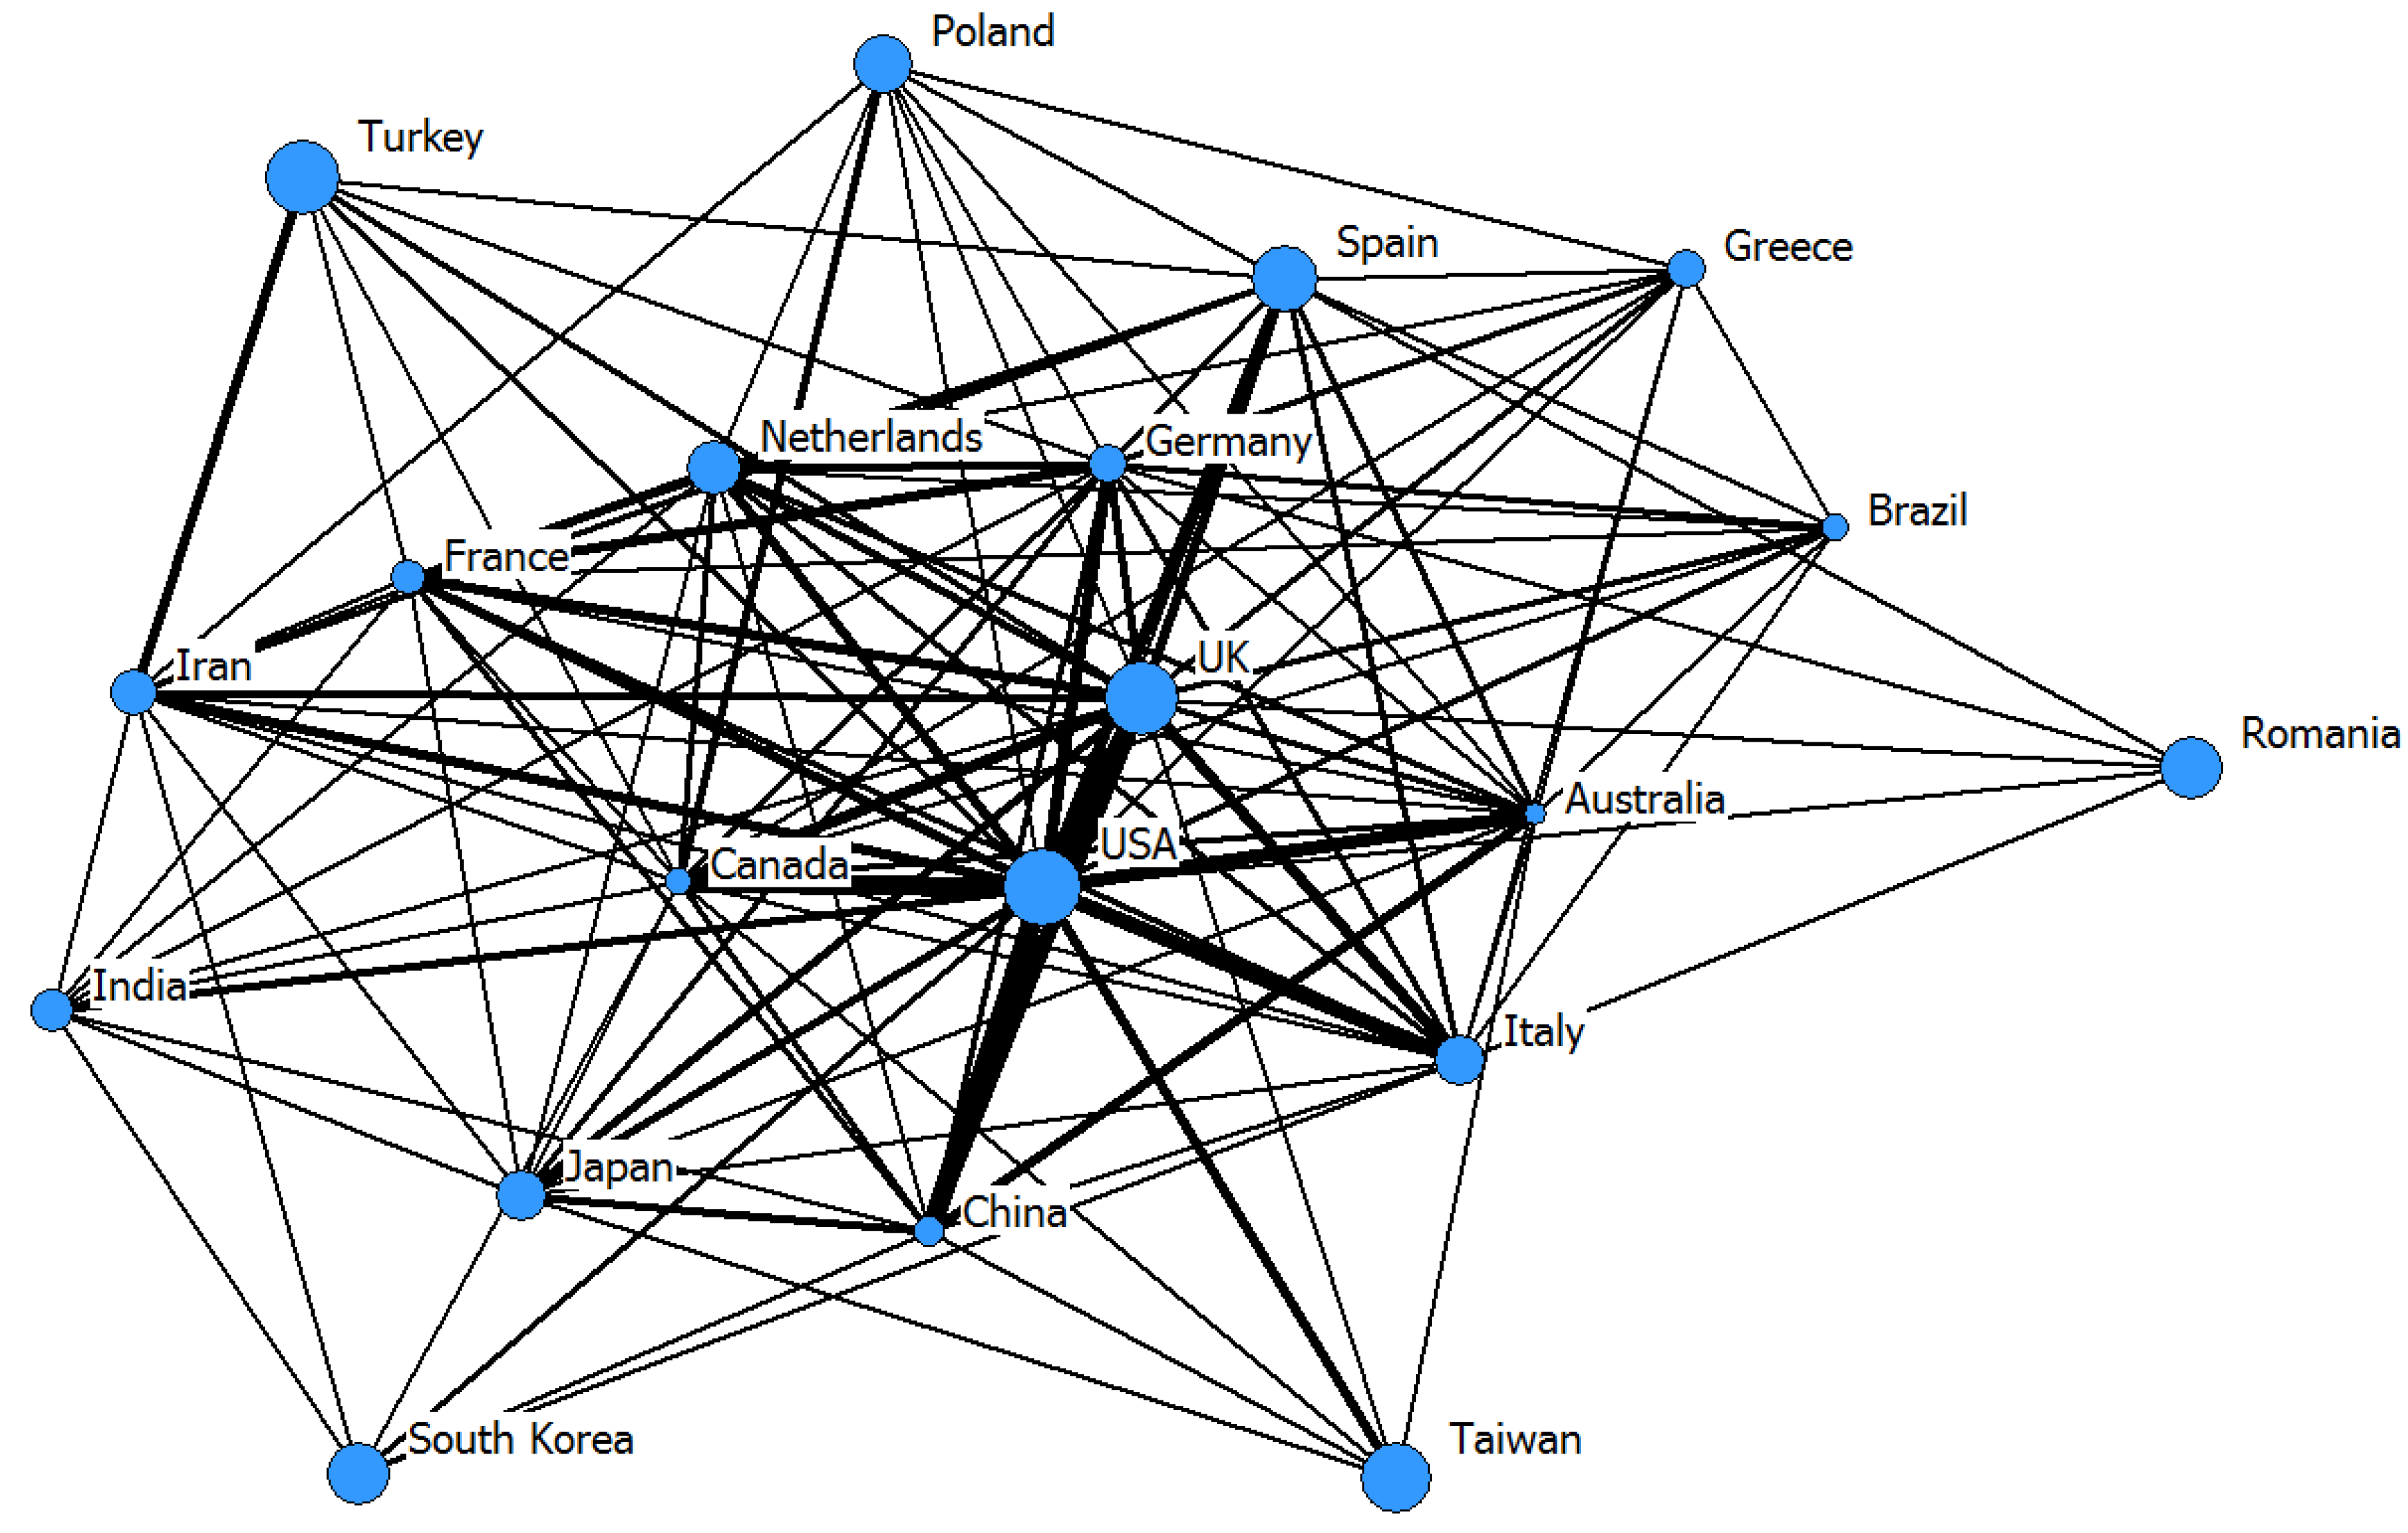
3.4. International Productivity and Collaboration

The total number of articles for the distribution analysis of country and institute publications was 28,565 (2537 articles without author affiliation information were excluded). Based on the analysis of the author affiliation, there were 122 countries/territories participated in AI research. The top 20 countries/territories were ranked based on the total number of articles (Table 4). Out of these 20 countries, nine were from Europe, seven were from Asia, two were from North America, one was from South America, and one was from Oceania. The results are similar to the geographic distribution of authors. Table 4 shows that USA was responsible for the most internationally-collaborative and single-country articles—i.e., USA can be seen as the most productive country for AI studies. In addition to the citation, the ranking of countries was led by USA. China published the second highest number of articles (2392), followed by UK (1718), Spain (1073), France (869), Germany (830), and Canada (823).
To a certain degree, R and D investment can be linked to academic output. Therefore, it is instructive to compare the number of publications per country relative to population and R and D investment. Table 4 also lists the amount of investment of R and D and number of population of top 20 countries/territories. In terms of investment of R and D, USA ranked first, and Iran ranked last. With respect to the article intensity per million inhabitants, Greece ranked first, and India ranked last. Although USA published the largest number of articles, it ranked 17th and ninth among the top 20 after taking population and R and D into consideration. To quantify the relationship between R and D and academic outputs, correlation analysis was performed using the data for top 20 countries. The number of articles is highly correlated with the investment of R and D (r2 = 0.88).
At the country/regional level, 17,969 (86.7%) were single-country articles and 2,746 (13.3%) were internationally-collaborated publications, indicating that independent research dominated in these countries/territories. Highly-cited articles that are internationally-collaborated are more than those from single countries. For example, the citation of single-country articles in 20 most productive countries/territories is 6.7, while the citation of internationally collaborated articles is 14.8. This phenomenon explains that international collaboration can lead to more high-level research achievement and articles.
At the institution level, there were 28,566 research institutes participated in AI research. USA’s dominance in AI research has extended to the institutional level. Among top 20 institutions in Table 5, seven were in USA, and other 13 were from China, Singapore, Canada, Spain, India, Italy, Brazil, Iran, and Greece. Chinese Academy of Sciences led institutional productivity with 123 articles, followed by Massachusetts Institute of Technology (MIT) with 118, and Hong Kong Polytech University with 118. MIT topped in the ranking of citations per single-institution produced articles with 63.2. The University of Toronto has the highest citation rate for inter-institutional collaborations with a CPP of 110.9, while Nanyang Technological University and Chinese Academy of Sciences outperformed regarding single-institutional and inter-institutional levels. Moreover, the average citation rate for articles from a single institution (12.4) was lower than that for institutionally-collaborated outputs (18.2), indicating that inter-institutional collaboration improved the citation rates and the influence of the articles. The results showed that University of Pittsburgh, Islamic Azad University, the Chinese Academy of Sciences, and Georgia Institute Technology are the top four with more single-institutional papers than international collaboration, and the University Alberta, National Technology University of Athens, Nanyang Technological University, and the University Polytechnic of Valencia were the top four with more international collaboration papers than single-institution.
It is apparent that international collaboration was not prevalent in AI research (Figure 5). Among 19,963 articles with address information, 14,798 (74.1%) were independent articles published by single institutions, and the other articles were inter-institutional collaboration work, including both national (16.5%) and international (9.4%) collaborations. Thu, in order to strengthen AI research, cooperation, especially international cooperation, among institutions should be paid more attention.

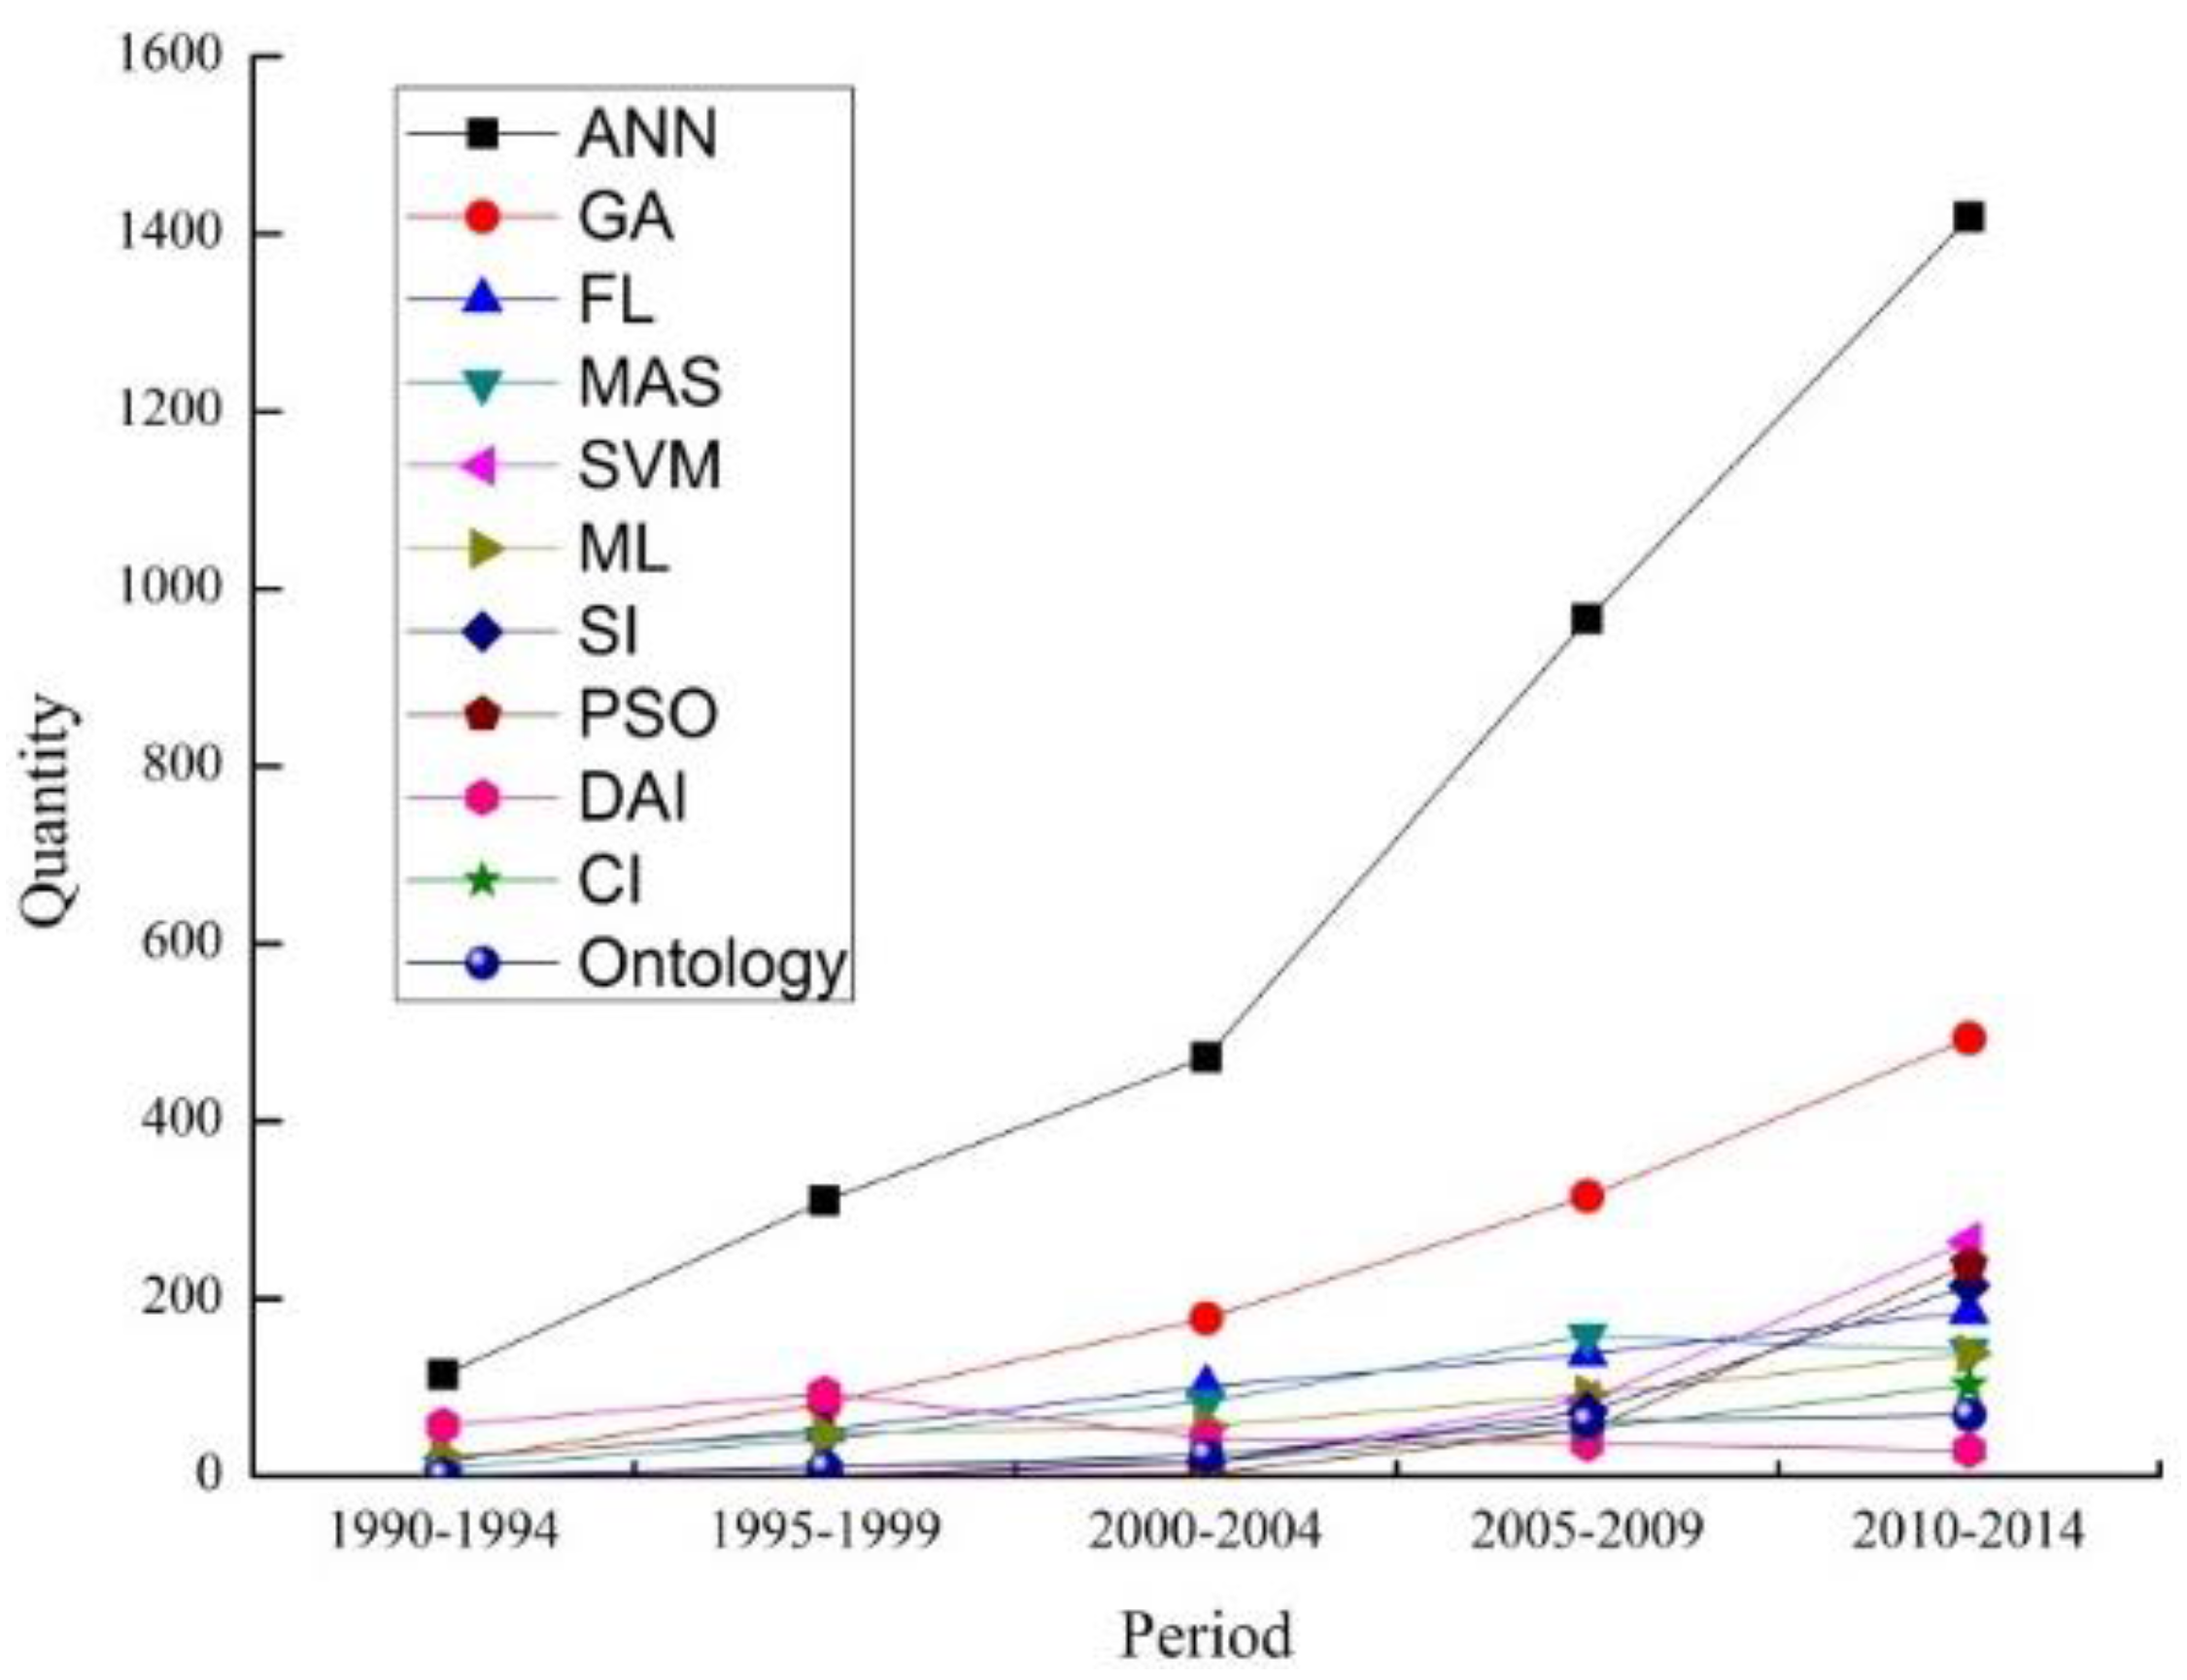
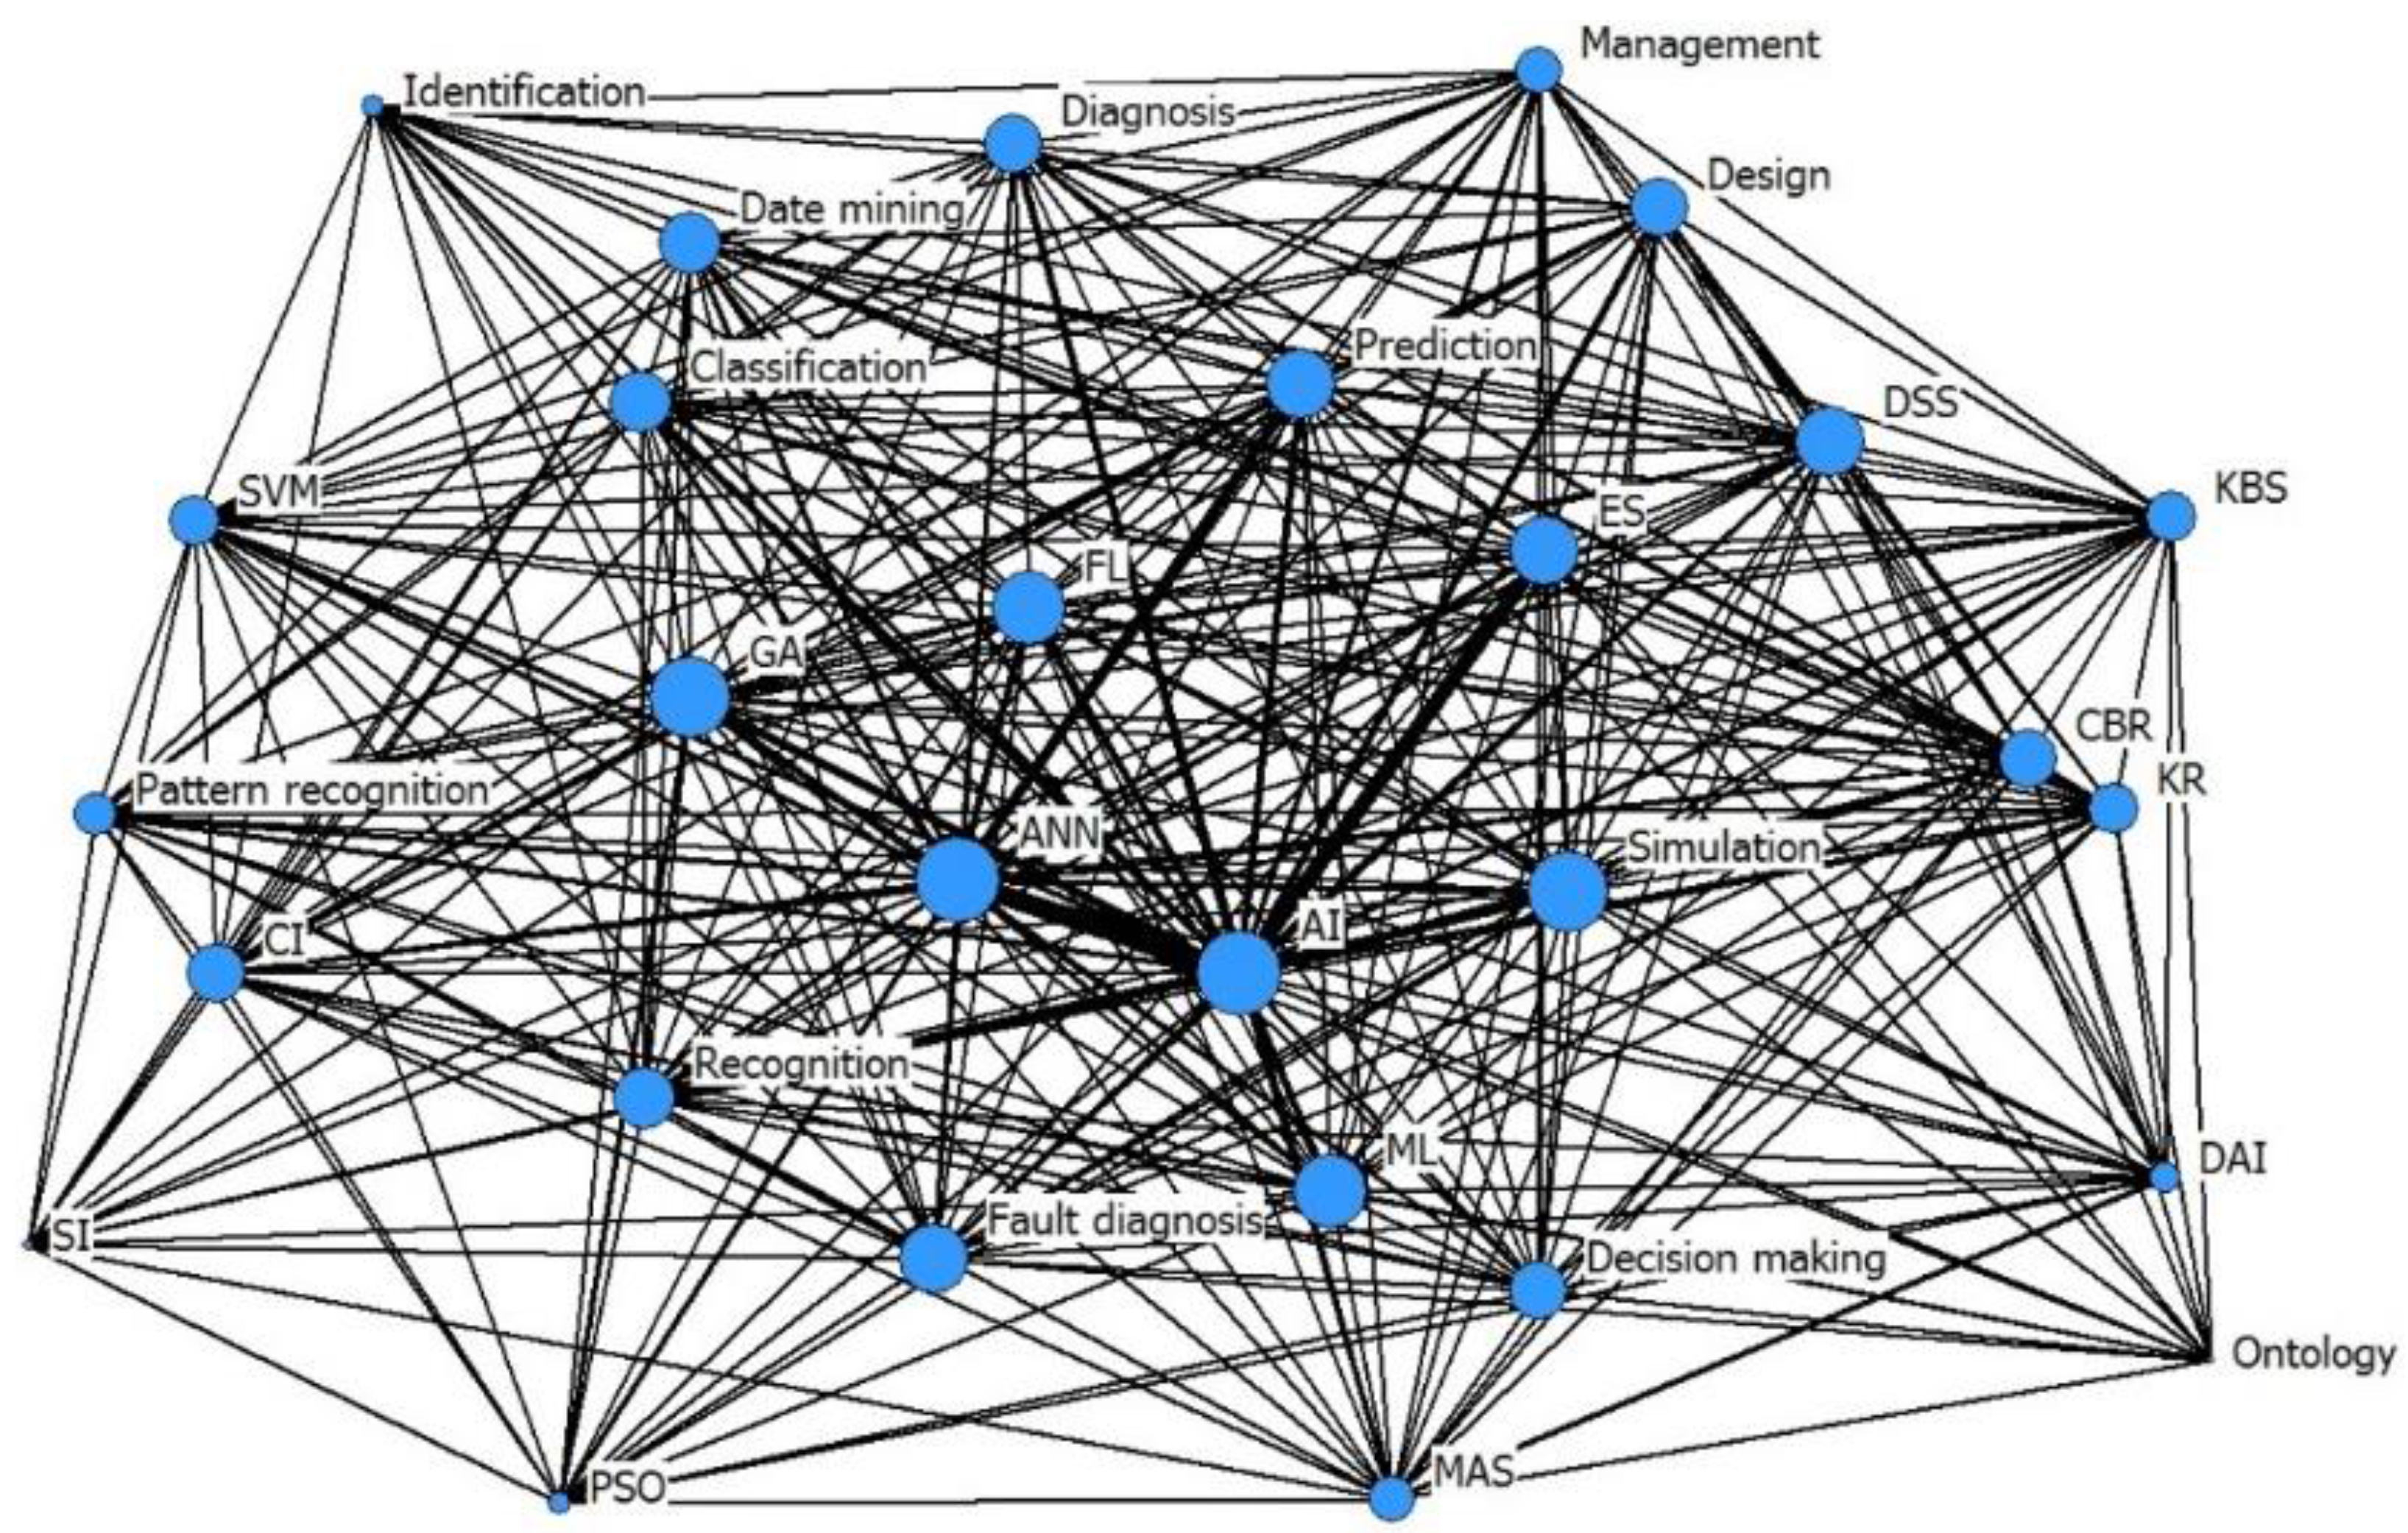
3.5. Key Words, Hot Issues, and Research Trend Analysis

Keyword analysis can be considered as an important tool for analyzing hot topics and research trend. We carried out the keyword analysis by the author keywords and keywords plus. There are 4001 articles without author keywords and keywords plus, and the other articles (16,714) contained 36,049 unique keywords with 108,850 occurrences. However, 25,144 (69.7%) keywords appeared only once. It implied that there are many research fields in AI research, and many scholars study the AI research in various fields with different methods. However, due to various reasons, most scholars lack continuous research [34]. Only 1137 (3.2%) keywords were used over 10 times in articles of AI, and these keywords were considered as the hot topic in AI research. In order to analyze the macroscopic development of AI research, the 25-year period of AI research is divided into five stages with an interval of five years. The results show that, in the past 25 years, the number of keywords increases from 5692 during 1990–1994 to 24,183 during 2010–2014. The top 30 high-frequency keywords were listed in Table 6. We can conclude the hot issues and research trends of AI as follows:
Keywords, except the search word “artificial intelligence”, can be classified into two groups, “method and model” and “applications” in AI research. In order to find the hot issues and research trends, we conducted comparative analysis of each group of keywords in five stages.
First, artificial neural network (ANN), genetic algorithm (GA), fuzzy logic (FL), support vector machine (SVM), machine learning (ML), swarm intelligence (SI), particle swarm optimization (PSO), distributed artificial intelligence (DAI), computational intelligence (CI), and ontology can be organized to the class of “methods and models”. Figure 6 depicts the changes and trends of every five-year article output of the “methods and models” from 1990 to 2014. As an important approach in AI, ANN attracted continual attention. Thus, the frequency of occurrence on ANN is about triple that on GA, and much higher than other keywords throughout the study period [35,36,37]. The article output of ANN maintained rapid growth. This implies that ANN will still deserve extensive research in the future [38]. We noticed that there is a significant growth in mid-2000s with respect to the output of ANN because of advancement in ANNs. One possible reason is the advance in computational resources. Therefore, more and more researchers have opportunities to leverage high-performance computing resources for data handling, analysis, and visualization [39,40]. Another reason is the rise of “deep learning” research in late 2000s as “recurrent neural networks” and “deep feedforward neural networks” (based on the use of many hidden layers, instead of one or two) have been developed. GA is another important method in AI research, but, there are some limited factors on the use of GA, for example, fitness function evaluation, decision problems, and global optimization. As a booming field, AI mainly undeniably relies on numerous methods, such as SVM, SI, CI, and PSO. Albeit these methods do not have a large number of applications, many scholars suggested these methods will have more and more applications, and become more important in AI [41,42,43,44].
Second, AI is an application-driven discipline [45]. So the method and model of AI have been widely applied in many fields [46], such as expert system (ES), optimization, classification, design, prediction, multi-agent system (MAS), simulation, diagnosis, decision support system (DSS), pattern recognition, knowledge-based system (KBS), case-based reasoning (CBR), knowledge representation (KR), management, identification, decision-making, fault diagnosis, recognition, and data mining. Figure 7 shows the trend in the applications of AI research over the past 25 years (five year intervals). AI has great advantage in reasoning, learning [47], data processing and application-specific problem-solving [48,49,50,51]. In addition to these aspects, it has been well acknowledged that AI can solve domain application problems efficiently and effectively [52,53]. Researchers studied the application of AI from two main aspects. (1) designing and realizing the prototype system and experimental system, such as ES, DSS, KBS, MAS, by the method and model to solve the application problems; (2) employing the method, model, or algorithm of AI to solve practical applications in some fields. Based on the analysis of academic output, the number of articles increased substantially in most application fields in which optimization, prediction, classification, and data mining play an important role. On the other hand, although some fields had the highest frequency before the 2000s, fewer and fewer scholars paid attention to these fields in recent years. For instance, the ES-related articles in 2010–2014 are only one-third of the articles from 1990-1994, which is the same as in the field of pattern recognition.
The keywords of articles was dominated by AI, ANN, GA, ES, optimization, and prediction. In order to achieve a deep understanding of the hot issues and patterns of AI research, the method of co-word analysis was performed by using top 30 frequent keywords (Figure 8). It is worth noting that “AI” obtained the high frequencies of co-occurrence with “ANN”, “ES”, “GA”, and “Simulation”, indicating that these keywords are important in the AI research. Another important keyword is ANN, which has high frequencies of co-occurrence with “ES” and “AI”, “prediction”, “GA”, “fuzzy logic”, “SVM”, and “CI”, showing that ANN is the essential and important algorithm in AI research. By using new methods, in recent years, many scholars have been intent to improve ANN and enhance the efficiency of ANN by coupling with other algorithm, such as GA, and fuzzy logic [54,55,56,57,58,59]. In addition, the close relationship of AI with ANN and ES indicates that many scholars are dedicated to related research and published numerous articles.
From the early 2000s, with the resurgence of AI research, more and more methods and models were put forward, such as ant colony optimization (ACO), artificial immune system (AIS), and artificial bee colony algorithms (ABC). These methods and models were applied to more fields, and even some new fields emerged (Table 7). Based on various aspects of ant foraging behavior, ACO was originally proposed for numerical problems, and was used to solve the optimization problem in many fields [60,61]. Currently, there are many studies on the AIS [62] and ABC algorithms [63,64]. These methods and models typically emulate the biological characteristics of response, memory, and learning to domain-specific problem-solving. As an important method in computer science, a rough set has been applied in the field of AI [65,66]. The latest research in AI methods is the artificial endocrine system (AES), which is introduced into the field of AI [6,67,68,69]. It is foreseeable that AES will become an important method of AI in computer science and related domains. In general, these methods are not only applied to solve the problem of AI independently, but also integrated with the existing methods to solve application problems [60,70,71,72]. On the other hand, the theory and method of AI are applied to solve new problems. There have been some studies reported with respect to applications in mobile robot and reinforcement learning since the late 1990s (see Table 7).
In the past decades, AI made rapid progress not only in the theory, method, and model, but also in its application. As mentioned above, AI is an application-driven discipline. Many specific application problems in the field of geoscience (broadly includes a suite of domains, for example, geographic information science, geography, earth science, and environmental science) contribute to the development of AI (e.g., to support spatial optimization, image classification) [36,73]. Scholars of geoscience are engaged in the field of applied research in AI, and this is the case particularly as the emergence of geocomputation in the 1990s [74,75]. We analyzed the 1482 articles related to geoscience in AI research, including 4819 keywords, in which only 219 keywords were used more than five times. In addition to the keyword in Table 8, some keywords, such as land use and virtual reality caught the attention from scholars in recent years. However, the output and status in the field of geoscience do not attract enough attention. The reason may come from two aspects: one is that part of researchers believed AI and its application does not belong to the domain of geoscience; the other reason is that there are many problems needed to overcome in the theory, method, and model of AI. For example, many unresolved issues in AIS limited the applied research. In fact, the lack of research in the field of geoscience has a certain relationship with these two reasons, especially for the latter. With the development of computational hardware and computational power in recent years, many problems of AI have been resolved. A growing number of scholars engaged in interdisciplinary research, especially as vigorous development of Geographic Information Science (GIScience; see [20]) and the blossoming of big data studies [76]. As scholars proposed extensively to carry out the interdisciplinary collaborative research, AI research and related discipline will enter a new era. A number of research problems to which conventional statistical models may be ill-suited, AI (e.g., machine learning) may provide alternative or novel support for the resolution of these problems, in particular, in the face of handling large amounts of data.

4. Conclusions

By employing the method of bibliometric analysis, a clear understanding of the global trends in AI research patterns during 1990–2014 was developed in this study. The amount of AI publication presented a solid growth with an increasing number of articles. This can be seen as a new research upsurge in AI after the rapid development from the 1990s. “Computer science” and “engineering” were the two major subject categories. Artificial Intelligence is the most important journal with the highest number of citations per article. The top 20 productive authors are identified. We noticed a pattern that cooperation was not prevalent in AI research. The geographic information visualization approach is employed to represent the worldwide geographic distribution of authors in AI. Results show the authors are mainly distributed in USA, West Europe, and East Asia, highly correlated with the investment of R and D and population density. From the country/territory and institute level, we analyzed the international productivity and collaboration. USA and Chinese Academy of Sciences produced the largest number of single-country and internationally-collaborated articles. Network analysis suggested that USA was in the central position of international collaboration network. However, based on the analysis on the citation, MIT is the top institute in the research of artificial intelligence. Additionally, both national and international collaboration are not prevalent in AI research. With the keywords analysis, we analyzed the research patterns by categorized the key words into two groups: method and model, application, and the prevalent research topic patterns were also ascertained in these two fields. In terms of co-word analysis, we found several interesting keywords with high co-occurrence frequencies. Based on the recent research in artificial intelligence, we analyzed the future research trends in the field of AI, and more and more methods and models can be applied to solve the application in the future. Our study reveals patterns in scientific outputs and academic collaborations related to AI, and serves as an alternative and innovative way of revealing global research trends. The method and result of this article may serve for future research as an alternative demonstration of research advancements.
In this study, we aimed to reveal the research pattern and trends of AI studies from different perspectives. For future study, we will focus on the improvement of bibliometric analysis. First, we will use more bibliometric indicators to further strengthen the bibliometric analysis. Second, more methods in spatial analysis, geovisualization, and social network analysis will be introduced to bibliometric analysis within a spatially-explicit context. In this study, we used geocoding and KDE as geospatial approaches to support the spatially-explicit bibliometric analysis of AI studies. In future work, we will use, for example, spatial autocorrelation approaches to analyze spatially-dependent characteristics in bibliometric data at alternative levels (e.g., country, state/province). Further, point pattern analysis can be recruited to identify the spatial arrangement of bibliometric data (e.g., clustered, random, or regular). These future directions, as we believe, will further advance the study of bibliometric analysis within spatially-explicit contexts. This need is timely, with the increasing availability of bibliometric data and the rapid and continual development of GIS and spatial analysis.

Acknowledgments

This study is funded by National Sciences Foundation of China (No.41201387, 41001219) and the Key Natural Science Research of Department of Education, Henan, China (No. 15A170012).

Author Contributions

Jiqiang Niu and Wenwu Tang collected the original idea and research method. Yannan Song collected the data and information. Feng Xu and Xiaoyan Zhou were responsible for data processing and Jiqiang Niu carried out the analyses. Jiqiang Niu drafted the manuscript, which was revised by Wenwu Tang. All authors read and approved the final manuscript.

Conflicts of Interest

The authors declare no conflict of interest.

Abbreviations

The following abbreviations are used in this manuscript:
SCI-Expanded
Science Citation Index Expanded
CPCI-S
Conference Proceedings Citation Index-Science
IF
impact factor
KDE
Kernel Density Estimation
JCR
Journal Citation Report
R&D
Research and Development

References

  1. Shi, Z.; Zheng, N. Progress and challenge of artificial intelligence. J. Comput. Sci. Technol. 2006, 21, 810–822. [Google Scholar] [CrossRef]
  2. Pham, D.T.; Pham, P.T.N. Artificial intelligence in engineering. Int. J. Mach. Tools Manuf. 1999, 39, 937–949. [Google Scholar] [CrossRef]
  3. Mohd Ali, J.; Hussain, M.A.; Tade, M.O.; Zhang, J. Artificial intelligence techniques applied as estimator in chemical process systems—A literature survey. Exp. Syst. Appl. 2015, 42, 5915–5931. [Google Scholar] [CrossRef]
  4. Russell, S.J.; Norvig, P. Artificial Intelligence: A Modern Approach; Upper Saddle River: New Jersey, NJ, USA, 2003. [Google Scholar]
  5. Kalogirou, S.A. Artificial intelligence for the modeling and control of combustion processes: A review. Progr. Energy Combust. Sci. 2003, 29, 515–566. [Google Scholar] [CrossRef]
  6. Wei, C.; Qiang, S.; Gao, X.Z.; IEEE. Artificial endocrine system and applications. In Proceedings of the 2006 Chinese Control Conference, Harbin, China, 7–11 August 2006.
  7. Mellit, A.; Kalogirou, S.A. Artificial intelligence techniques for photovoltaic applications: A review. Progr. Energy Combust. Sci. 2008, 34, 574–632. [Google Scholar] [CrossRef]
  8. Corchado, E.; Grana, M.; Wozniak, M. New trends and applications on hybrid artificial intelligence systems. Neurocomputing 2012, 75, 61–63. [Google Scholar] [CrossRef]
  9. Pritchard, A. Statistical bibliography or bibliometrics? J. Doc. 1969, 348–349. [Google Scholar]
  10. Hood, W.W.; Wilson, C.S. The Literature of Bibliometrics, Scientometrics, and Informetrics. Scientometrics 2001, 52, 291–314. [Google Scholar] [CrossRef]
  11. Hsieh, W.-H.; Chiu, W.-T.; Lee, Y.-S.; Ho, Y.-S. Bibliometric analysis of patent ductus arteriosus treatments. Scientometrics 2004, 60, 105–215. [Google Scholar] [CrossRef]
  12. Ho, Y.-S. Bibliometric analysis of adsorption technology in environmental science. J. Environ. Prot. Sci. 2007, 1, 1–11. [Google Scholar]
  13. Glänzel, W.; Schubert, A.; Czerwon, H.-J. A bibliometric analysis of international scientific cooperation of the European Union (1985–1995). Scientometrics 1999, 45, 185–202. [Google Scholar] [CrossRef]
  14. Chiu, W.-T.; Ho, Y.-S. Bibliometric analysis of tsunami research. Scientometrics 2007, 73, 3–17. [Google Scholar] [CrossRef]
  15. Niu, B.; Hong, S.; Yuan, J.; Peng, S.; Wang, Z.; Zhang, X. Global trends in sediment-related research in earth science during 1992–2011: A bibliometric analysis. Scientometrics 2013, 98, 511–529. [Google Scholar] [CrossRef]
  16. Callon, M.; Courtial, J.-P.; Laville, F. Co-word analysis as a tool for describing the network of interactions between basic and technological research: The case of polymer chemsitry. Scientometrics 1991, 22, 155–205. [Google Scholar] [CrossRef]
  17. Ding, Y.; Chowdhury, G.G.; Foo, S. Bibliometric cartography of information retrieval research by using co-word analysis. Inf. Process. Manag. 2001, 37, 817–842. [Google Scholar] [CrossRef] [Green Version]
  18. Liu, X.; Zhang, L.; Hong, S. Global biodiversity research during 1900–2009: A bibliometric analysis. Biodivers. Conserv. 2011, 20, 807–826. [Google Scholar] [CrossRef]
  19. Zhuang, Y.; Liu, X.; Nguyen, T.; He, Q.; Hong, S. Global remote sensing research trends during 1991–2010: A bibliometric analysis. Scientometrics 2012, 96, 203–219. [Google Scholar] [CrossRef]
  20. Goodchild, M.F. Geographic information systems and science: Today and tomorrow. Ann. GIS 2009, 15, 3–9. [Google Scholar] [CrossRef]
  21. Kostoff, R.N. The underpublishing of science and technology results. Scientist 2000, 14, 6. [Google Scholar]
  22. Gu, Y.N. Global knowledge management research: A bibliometric analysis. Scientometrics 2004, 61, 171–190. [Google Scholar] [CrossRef]
  23. Qiu, J.; Lv, H. An overview of knowledge management research viewed through the web of science (1993–2012). Aslib J. Inf. Manag. 2014, 66, 424–442. [Google Scholar] [CrossRef]
  24. Silverman, B.W. Density Estimation for Statistics and Data Analysis; CRC Press: Boca Raton, FL, USA, 1986. [Google Scholar]
  25. Reuters, T. Journals in the 2014 Release of JCR. Available online: http://scientific.thomsonreuters.com/imgblast/JCRFullCovlist-2014.pdf (accessed on 20 July 2015).
  26. Chen, C. Searching for intellectual turning points: Progressive knowledge domain visualization. Proc. Natl. Acad. Sci. USA 2004, 101, 5303–5310. [Google Scholar] [CrossRef] [PubMed]
  27. Campanario, M. Consolation for the scientist: Sometimes it is hard to publish papers that are later highly-cited. Soc. Stud. Sci. 1993, 23, 342–362. [Google Scholar] [CrossRef]
  28. Judge, T.A.; Cable, D.M.; Colbert, A.E.; Rynes, S.L. What causes a management article to be cited—article, author, or journal? Acad. Manag. J. 2007, 50, 491–506. [Google Scholar] [CrossRef]
  29. Cortez, P.; Rocha, M.; Neves, J. Evolving time series forecasting ARMA models. J. Heuristics 2004, 10, 415–429. [Google Scholar] [CrossRef]
  30. Klopman, G. Artificial-intelligence approach to structure activity studies—Computer automated structure evaluation of biological-activity of organic-molecules. J. Am. Chem. Soc. 1984, 106, 7315–7321. [Google Scholar] [CrossRef]
  31. Klopman, G.; Rosenkranz, H.S. Testing by artificial-intelligence—Computational alternatives to the determination of mutagenicity. Mutat. Res. 1992, 272, 59–71. [Google Scholar] [CrossRef]
  32. Guo, K.; Liu, Y.F.; Zeng, C.; Chen, Y.Y.; Wei, X.J. Global research on soil contamination from 1999 to 2012: A bibliometric analysis. Acta Agric. Scand. Section B—Soil Plant Sci. 2014, 64, 377–391. [Google Scholar] [CrossRef]
  33. Wang, M.; Liu, D.; Jia, J.; Zhang, X. Global trends in soil monitoring research from 1999–2013: A bibliometric analysis. Acta Agric. Scand. Section B—Soil Plant Sci. 2015, 65, 483–495. [Google Scholar]
  34. Chuang, K.-Y.; Huang, Y.-L.; Ho, Y.-S. A bibliometric and citation analysis of stroke-related research in Taiwan. Scientometrics 2007, 72, 201–212. [Google Scholar] [CrossRef]
  35. Bishop, C.M. Neural networks and their applications. Rev. Sci. Instruments 1994, 65, 1803–1832. [Google Scholar] [CrossRef]
  36. Mas, J.F.; Flores, J.J. The application of artificial neural networks to the analysis of remotely sensed data. Int. J. Remote Sens. 2008, 29, 617–663. [Google Scholar] [CrossRef]
  37. Momeni, E.; Nazir, R.; Armaghani, D.J.; Maizir, H. Application of artificial neural network for predicting shaft and tip resistances of concrete piles. Earth Sci. Res. J. 2015, 19, 85–93. [Google Scholar] [CrossRef]
  38. Jalal, M.; Ramezanianpour, A.A. Strength enhancement modeling of concrete cylinders confined with cfrp composites using artificial neural networks. Compos. Part B: Eng. 2012, 43, 2990–3000. [Google Scholar] [CrossRef]
  39. Oh, K.S.; Jung, K. GPU implementation of neural networks. Pattern Recognit. 2004, 37, 1311–1314. [Google Scholar] [CrossRef]
  40. Martinez-Zarzuela, M.; Diaz Pernas, F.J.; Diez Higuera, J.F.; Rodriguez, M.A. Fuzzy art neural network parallel computing on the gpu. In Computational and Ambient Intelligence; Sandoval, F., Prieto, A., Cabestany, J., Grana, M., Eds.; Springer-Verlag: Berlin, Germany, 2007; Volume 4507, pp. 463–470. [Google Scholar]
  41. Anifowose, F.; Adeniye, S.; Abdulraheem, A. Recent advances in the application of computational intelligence techniques in oil and gas reservoir characterisation: A comparative study. J. Exp. Theor. Artif. Intell. 2014, 26, 551–570. [Google Scholar] [CrossRef]
  42. Cao, N.T.; Ton-That, A.H.; Choi, H.I. Facial expression recognition based on local binary pattern features and support vector machine. Int. J. Pattern Recognit. Artif. Intell. 2014. [Google Scholar] [CrossRef]
  43. Khokhar, S.; Mohd Zin, A.A.B.; Mokhtar, A.S.B.; Pesaran, M. A comprehensive overview on signal processing and artificial intelligence techniques applications in classification of power quality disturbances. Renew. Sustain. Energy Rev. 2015, 51, 1650–1663. [Google Scholar] [CrossRef]
  44. Zhang, S.; Lee, C.K.M.; Chan, H.K.; Choy, K.L.; Wu, Z. Swarm intelligence applied in green logistics: A literature review. Eng. Appl. Artif. Intell. 2015, 37, 154–169. [Google Scholar] [CrossRef]
  45. Browne, M.; Castelle, B.; Strauss, D.; Tomlinson, R.; Blumenstein, M.; Lane, C. Near-shore swell estimation from a global wind-wave model: Spectral process, linear, and artificial neural network models. Coast. Eng. 2007, 54, 445–460. [Google Scholar] [CrossRef]
  46. Zhang, J.; Chau, K.W. Multilayer ensemble pruning via novel multi-sub-swarm particle swarm optimization. J. Univers. Comput. Sci. 2009, 15, 840–858. [Google Scholar]
  47. Taormina, R.; Chau, K.W. Data-driven input variable selection for rainfall-runoff modeling using binary-coded particle swarm optimization and extreme learning machines. J. Hydrol. 2015, 529, 1617–1632. [Google Scholar] [CrossRef]
  48. Zhang, S.W.; Chau, K.W. Dimension reduction using semi-supervised locally linear embedding for plant leaf classification. In Emerging Intelligent Computing Technology and Applications, Proceedings; Huang, D.S., Jo, K.H., Lee, H.H., Kang, H.J., Bevilacqua, V., Eds.; Springer-Verlag: Berlin, Germany, 2009; Volume 5754, pp. 948–955. [Google Scholar]
  49. Wu, C.L.; Chau, K.W.; Li, Y.S. Methods to improve neural network performance in daily flows prediction. J. Hydrol. 2009, 372, 80–93. [Google Scholar] [CrossRef]
  50. Chau, K.W.; Wu, C.L. A hybrid model coupled with singular spectrum analysis for daily rainfall prediction. J. Hydroinform. 2010, 12, 458–473. [Google Scholar] [CrossRef]
  51. Wang, W.C.; Chau, K.W.; Xu, D.M.; Chen, X.Y. Improving forecasting accuracy of annual runoff time series using ARIMA based on EEMD decomposition. Water Resour. Manag. 2015, 29, 2655–2675. [Google Scholar] [CrossRef]
  52. Hwang, G.-H.; Chen, J.-M.; Hwang, G.-J.; Chu, H.-C. A time scale-oriented approach for building medical expert systems. Expert Syst. Appl. 2006, 31, 299–308. [Google Scholar] [CrossRef]
  53. Bi, C. Memetic algorithms for de novo motif-finding in biomedical sequences. Artif. Intell. Med. 2012, 56, 1–17. [Google Scholar] [CrossRef] [PubMed]
  54. Cho, S.-B. Fusion of neural networks with fuzzy logic and genetic algorithm. Integrated Comput.-Aided Eng. 2002, 9, 363. [Google Scholar]
  55. Tsai, C.-F. Financial decision support using neural networks and support vector machines. Exp. Syst. 2008, 25, 380–393. [Google Scholar] [CrossRef]
  56. Gossard, D.; Lartigue, B.; Thellier, F. Multi-objective optimization of a building envelope for thermal performance using genetic algorithms and artificial neural network. Energy Build. 2013, 67, 253–260. [Google Scholar] [CrossRef]
  57. Martínez-Martínez, V.; Gomez-Gil, F.J.; Gomez-Gil, J.; Ruiz-Gonzalez, R. An artificial neural network based expert system fitted with genetic algorithms for detecting the status of several rotary components in agro-industrial machines using a single vibration signal. Exp. Syst. Appl. 2015, 42, 6433–6441. [Google Scholar] [CrossRef]
  58. González, B.; Valdez, F.; Melin, P.; Prado-Arechiga, G. Fuzzy logic in the gravitational search algorithm for the optimization of modular neural networks in pattern recognition. Exp. Syst. Appl. 2015, 42, 5839–5847. [Google Scholar] [CrossRef]
  59. Farfani, H.A.; Behnamfar, F.; Fathollahi, A. Dynamic analysis of soil-structure interaction using the neural networks and the support vector machines. Exp. Syst. Appl. 2015, 42, 8971–8981. [Google Scholar] [CrossRef]
  60. Rahmani, R.; Yusof, R.; Seyedmahmoudian, M.; Mekhilef, S. Hybrid technique of ant colony and particle swarm optimization for short term wind energy forecasting. J. Wind Eng. Ind. Aerodyn. 2013, 123, 163–170. [Google Scholar] [CrossRef]
  61. Nazari, A.; Sanjayan, J.G. Modelling of compressive strength of geopolymer paste, mortar and concrete by optimized support vector machine. Ceram. Int. 2015, 41, 12164–12177. [Google Scholar] [CrossRef]
  62. Laurentys, C.A.; Palhares, R.M.; Caminhas, W.M. A novel artificial immune system for fault behavior detection. Exp. Syst. Appl. 2011, 38, 6957–6966. [Google Scholar] [CrossRef]
  63. Bansal, J.C.; Sharma, H.; Arya, K.V.; Nagar, A. Memetic search in artificial bee colony algorithm. Soft Comput.—Fusion Found. Methodol. Appl. 2013, 17, 1911–1928. [Google Scholar] [CrossRef]
  64. Song, X.; Gu, H.; Tang, L.; Zhao, S.; Zhang, X.; Li, L.; Huang, J. Application of artificial bee colony algorithm on surface wave data. Comput. Geosci. 2015, 83, 219–230. [Google Scholar] [CrossRef]
  65. Kryszkiewicz, M. Rough set approach to incomplete information systems. Inf. Sci. 1998, 112, 39–49. [Google Scholar] [CrossRef]
  66. Liu, G.; Zhu, W. The algebraic structures of generalized rough set theory. Inf. Sci. 2008, 178, 4105–4113. [Google Scholar] [CrossRef]
  67. Kahramanli, H.; Allahverdi, N. Rule extraction from trained adaptive neural networks using artificial immune systems. Exp. Syst. Appl. 2009, 36, 1513–1522. [Google Scholar] [CrossRef]
  68. Sauze, C.; Neal, M. Artificial endocrine controller for power management in robotic systems. IEEE Trans. Neural Netw. Learn. Syst. 2013, 24, 1973–1985. [Google Scholar] [CrossRef] [PubMed]
  69. Kuo, R.J.; Chiang, N.J.; Chen, Z.Y. Integration of artificial immune system and k-means algorithm for customer clustering. Appl. Artif. Intell. 2014, 28, 577–596. [Google Scholar]
  70. Shiue Kee, C.; Mohamad, M.S.; Salleh, A.H.M.; Yee Wen, C.; Chuii Khim, C.; Deris, S. A hybrid of ant colony optimization and minimization of metabolic adjustment to improve the production of succinic acid in escherichia coli. Comput. Biol. Med. 2014, 49, 74–82. [Google Scholar]
  71. Li, Z.; Wang, W.; Yan, Y.; Li, Z. PS–ABC: A hybrid algorithm based on particle swarm and artificial bee colony for high-dimensional optimization problems. Exp. Syst. Appl. 2015, 42, 8881–8895. [Google Scholar] [CrossRef]
  72. Nahato, K.B.; Harichandran, K.N.; Arputharaj, K. Knowledge mining from clinical datasets using rough sets and backpropagation neural network. Comput. Math. Methods Med. 2015, 2015, 1–13. [Google Scholar] [CrossRef] [PubMed]
  73. Armstrong, M.P. Geography and computational science. Ann. Assoc. Am. Geogr. 2000, 90, 146–156. [Google Scholar] [CrossRef]
  74. Openshaw, S.; Abrahart, R.J. Geocomptuation; Taylor & Francis: London, UK, 2000. [Google Scholar]
  75. Openshaw, S.; Openshaw, C. Artificial Intelligence in Geography; John Wiley & Sons: New York, NY, USA, 1997. [Google Scholar]
  76. Manyika, J.; Institute, M.G.; Chui, M.; Brown, B.; Bughin, J.; Dobbs, R.; Roxburgh, C.; Byers, A.H. Big Data: The Next Frontier for Innovation, Competition, and Productivity; McKinsey Global Institute: Washington, DC, USA, 2011. [Google Scholar]
Figure 1. Growth trend of articles in artificial intelligence from 1990–2014.
Ijgi 05 00066 g001
Figure 2. Temporal patterns of artificial intelligence-related articles.
Ijgi 05 00066 g002
Figure 3. Kernel density estimation for the geographic distribution of authors.
Ijgi 05 00066 g003
Figure 4. Relation between geographic distribution of authors and investment on R and D.
Ijgi 05 00066 g004
Figure 5. Core international collaboration networks.
Ijgi 05 00066 g005
Figure 6. Trends of keywords with respect to method and model.
Ijgi 05 00066 g006
Figure 7. Trend of keywords with respect to application of artificial intelligence (DSS: decision support system; KBS: knowledge-based system; CBR: case-based reasoning; KR: knowledge representation).
Ijgi 05 00066 g007
Figure 8. Co-word network of top 30 high-frequency keywords in artificial intelligence.
Ijgi 05 00066 g008
Table 1. Summary scientific outputs from 1990–2014.
YearTAAUAU/TANRNR/TAPGPG/TATCCPA
19902124372.119489.220179.57063.3
199147710022.1816617.1547711.5702914.7
199257613572.4822614.3606210.554039.4
199349212312.5798516.2521710.643328.8
199457614072.412,57621.812,08221.046678.1
199548911612.410,34421.2625712.8701514.3
199653413352.5948217.8569110.738687.2
199766716762.510,83316.2865313.0794611.9
199869318082.612,93018.7733710.6786811.4
199954113712.511,74221.7637811.8561910.4
200061617132.812,51420.3672210.9693211.3
200167218692.814,53021.6735911.010,49815.6
200269818282.614,19920.3704010.159918.6
200383423542.816,69720.0849110.268308.2
200493627192.919,44220.8949710.182678.8
2005100928262.818,83318.795739.558395.8
2006110232482.923,74821.510,7889.862765.7
2007110731632.923,69221.410,9269.973606.6
2008123435432.926,85721.811,3449.264125.2
200913884104330,76822.212,6859.169065.0
2010107333383.126,87825.011,11110.449284.6
2011109034453.228,42426.111,49810.543914.0
2012122239593.235,03628.712,47610.233762.8
2013132444373.438,57129.113,24110.018241.4
2014115339713.439,78334.513,62311.87670.7
Total20,71559,302/464,204/221,545/141,050/
Average/29653.423,21026.311,07713.770539.7
TA: Total articles; AU: number of authors; NR: cited references; PG page count; TC: total citation counts; CPA: citations per article; TU/TA, NR/TA and PG/TA: average of authors, references, and pages per article, respectively.
Table 2. Most productive journals in artificial intelligence research.
JournalTA (R; %)TC (R; %)CPA (R)IF (R)
Expert Systems with Applications344(1;1.7)3643(2;2.6)10.6(9)2.24(7)
Engineering Applications of Artificial Intelligence161(2;0.8)1650(4;1.2)10.2(11)2.207(9)
AI Magazine161(3;0.8)1220(7;0.9)7.6(15)0.595(17)
Artificial Intelligence126(4;0.6)7341(1;5.2)58.3(1)3.371(2)
Knowledge-based Systems103(5;0.5)1218(8;0.9)11.8(8)2.947(3)
Kybernetes96(6; 0.5)150(20;0.1)1.6(20)0.429(20)
Applied Artificial Intelligence89(7;0.4)562(15;0.4)6.3(18)0.527(19)
European Journal of Operational Research84(8; 0.4)1499(5;1.1)17.8(5)2.358(5)
Minds and Machines81(9; 0.4)375(19;0.3)4.6(19)0.568(18)
Artificial Intelligence Review77(10; 0.4)677(12;0.5)8.8(13)2.111(10)
Artificial Intelligence in Medicine72(11; 0.3)1318(6;0.9)18.3(4)2.019(12)
Journal of Intelligent Manufacturing71(12; 0.3)639(14;0.5)9(12)1.731(14)
Journal of Materials Processing Technology68(13; 0.3)833(11;0.6)12.3(7)2.236(8)
Information Sciences68(14; 0.3)965(10;0.7)14.2(6)4.038(1)
Applied Soft Computing68(15; 0.3)1693(3;1.2)24.9(2)2.81(4)
Computers in Industry64(16; 0.3)663(13;0.5)10.4(10)1.287(16)
Decision Support Systems62(17; 0.3)1151(9;0.8)18.6(3)2.313(6)
Computers & industrial Engineering62(18; 0.3)412(17;0.3)6.6(17)1.783(13)
Neurocomputing60(19; 0.3)404(18;0.3)6.7(16)2.083(11)
International Journal of Advanced Manufacturing Technology59(20;0.3)463(16;0.3)7.8(14)1.458(15)
TA: total articles; TC: total citation; CPA: citations per article; IF: 2014 ISI impact factor; R: rank in the list.
Table 3. Top 20 productive authors from 1990–2014.
Author nameInstituteTotal OutputsFirst AuthorCorresponding Author
TATCCPA (R)FAPTCTC/FAP (R)CPTCCPA (R)
J. NevesUniv Minho35631.3(17)300.0(19)300(16)
G. KlopmanCase Western Reserv Univ301,06835.6(1)1266455.3(1)1469749.8(1)
C. ChenNatl Pingtung Univ Educ2832113.5(7)1111410.4(8)2229513.4(5)
K. ChauHong Kong Polytech Univ2863318.6(6)2660123.1(4)2863322.6(3)
R. TadeusiewiczAGH Univ Sci & Technol261726.6(11)4266.5(12)4328(9)
M. ChengNatl Taiwan Univ Sci & Technol251144.6(14)15714.7(13)100(16)
M. OgielaAGH Univ Sci & Technol221637.4(10)151318.7(10)161378.6(8)
H. RosenkranzUniv Pittsburgh2170233.4(2)45614.0(7)67813(6)
L. LaiCity Univ London1843724.3(4)1035935.9(2)1135932.6(2)
S. ChienCaltech,Jet Propuls Lab18201.1(18)5193.8(15)5193.8(12)
P. NovaisUniv Minho18201.1(18)133.0(17)681.3(14)
Y. XuShanghai Jiao Tong Univ17925.4(12)34816.0(6)5489.6(7)
M. JuholaUniv Tampere17653.8(15)200.0(19)200(16)
U. CortesTech Univ Catalonia1739623.3(5)4164.0(14)4164(11)
O. KisiCanik Basari1720812.7(9)2199.5(9)000(16)
B. ShihNatl Pingtung Univ Educ1621113.2(8)1016616.6(5)000(16)
M. MajewskiKoszalin Univ Technol16231.4(16)3113.7(16)3113.7(13)
B. GoertzelNovamente LLC14141.0(20)530.6(18)1190.8(15)
E. CorchadoUniv Salamanca14664.7(13)6477.8(11)6477.8(10)
Y. HsuChung Hua Univ1436826.3(3)718826.9(3)919521.7(4)
TA: total articles; TC: total citation counts; FAP: number of articles published as the first author; CP: number of articles published as the corresponding author; CPA: citations per article; R: rank in the list.
Table 4. Twenty most productive countries/territories in artificial intelligence research.
TASingle-countryInternationally CollaboratedR&DTA/I(1 million)
SATCCPA (R)SA (%)CATCCPA(R)CA(%)
USA4144343242,23312.3(2)82.871215,03221.1(2)17.2405.313.2
China2392215744322.1(19)90.223522829.7(13)9.8337.51.8
UK1718131211,9969.1(3)76.4406593914.6(5)23.638.427.4
Spain107388842154.7(12)82.818513157.1(18)17.217.222.9
France86965030684.7(12)74.8219320514.6(6)25.242.213.3
Germany83065539786.1(6)78.917517189.8(12)21.169.510.2
Canada82356532375.7(9)68.7258679026.3(1)31.324.324.2
Italy79761533395.4(10)77.2182310917.1(3)22.81913.1
India64357521753.8(15)89.4686759.9(10)10.636.10.5
Japan61351018903.7(16)83.2103120011.7(8)16.8160.34.8
Brazil59352113842.7(18)87.97275910.5(9)12.119.42.9
Australia59043221815.0(11)73.215811307.2(17)26.815.927.1
Taiwan50646137408.1(4)91.14564614.4(7)8.91921.5
Poland47042313833.3(17)90.0473707.9(16)10.06.912.2
Iran41232612603.9(14)79.1864795.6(20)20.90.75.3
Turkey359288420614.6(1)80.2716739.5(14)19.87.34.6
South Korea31727616425.9(7)87.1413909.5(15)12.965.46.5
Greece30725814855.8(8)84.0494859.9(11)16.01.728.4
Netherlands30419614017.1(5)64.5108169615.7(4)35.510.818.1
Romania2702514912.0(20)93.0191166.1(19)7.01.312.3
TA: total articles; TC: total citation counts; SA: single-country articles; CA: internationally-collaborated articles; CPA: citations per article; R and D: investment of research and development, 1 billion; TA/I: number of articles per million inhabitants; R: rank in the list.
Table 5. Top productive institutions in artificial intelligence research.
InstitutionTATCSingle-institutionInter-institution
SITCCPA (R)SI (%)CITCCPA (R)CI (%)
Chinese Acad Sci, China12376945922(17)36.6786778.7(13)63.4
MIT, USA1185684694,35963.2(1)58.5491,32527(4)41.5
Hong Kong Polytech Univ, Hongkong1181302675267.9(10)56.85177615.2(7)43.2
Nanyang Technol Univ, Singapore1111039705868.4(9)63.14145311(10)36.9
Islamic Azad Univ, Iran10436131752.4(16)29.8732863.9(19)70.2
Carnegie Mellon Univ, USA1021547571,04418.3(3)55.94550311.2(9)44.1
Univ Sao Paulo, Brazil10034655751.4(20)55.0452716(17)45.0
Stanford Univ, USA9525264879516.6(4)50.547173136.8(2)49.5
Indian Inst Technol, India94600542905.4(13)57.4403107.8(16)42.6
Natl Univ Singapore, Singapore92790513526.9(12)55.44143810.7(11)44.6
Univ Pittsburgh, USA8824362449620.7(2)27.364194030.3(3)72.7
Univ Toronto, Canada7751873441912.3(7)44.2434768110.9(1)55.8
Univ SO Calif, USA7711004254513(6)54.53555515.9(5)45.5
Univ Politecn Valencia, Spain7632046811.8(18)60.5302398(15)39.5
Natl Tech Univ Athens, Greece767634949710.1(8)64.5272669.9(12)35.5
Univ Genoa, Italy75393441282.9(15)58.7312658.5(14)41.3
Univ Poliecn Madrid, Spain7418433571.7(19)44.6411273.1(20)55.4
Univ Arizona, USA72875322467.7(11)44.44062915.7(6)55.6
Univ Alberta, Canada666883450714.9(5)51.5321815.7(18)48.5
Georgia Inst Technol, USA66605251144.6(14)37.94149112(8)62.1
TA: total articles; TC: total citation counts; SI: single-institution articles; CI: inter-institutionally collaborated articles; CPA: citations per article; R: rank in the list.
Table 6. Temporal pattern of frequently used keywords.
keywordTA(R)CPA(R)
1990–19941995–19992000–20042005–20092010–20141990–2014
Artificial Intelligence(AI)915(1)879(1)950(1)1487(1)1,610(1)5,841(1)6.8(25)
Artificial Neural network(ANN)114(3)310(2)472(2)966(2)1,419(2)3,281(2)8.3(17)
Genetic algorithm(GA)16(18)82(5)178(4)315(3)493(3)1,084(3)9.2(11)
Expert System (ES)399(2)196(3)181(3)170(5)132(14)1,078(4)6.9(23)
Optimization19(15)57(8)92(6)168(6)366(4)702(5)7.9(19)
Prediction13(22)22(20)57(12)132(9)300(5)524(6)9.2(11)
Classification18(16)43(15)60(11)179(4)223(8)523(7)10.6(6)
Design42(10)45(14)79(8)120(11)223(8)509(8)9.9(8)
Fuzzy Logic (FL)20(13)52(12)101(5)138(8)185(11)496(9)8(18)
Multi-agent system(MAS)9(23)42(17)84(7)158(7)141(12)434(10)10.6(6)
Simulation52(6)43(15)69(9)104(12)120(15)388(11)7.2(20)
Support Vector Machine(SVM)0(27)0(29)15(28)86(15)264(6)365(12)7.2(20)
Machine Learning(ML)22(12)48(13)56(13)92(13)138(13)356(13)6.6(26)
Diagnosis46(8)61(7)63(10)72(19)90(18)332(14)13.1(3)
Data mining1(25)11(25)52(14)131(10)118(16)313(15)6.5(27)
Swarm intelligence(SI)0(27)1(28)16(26)73(17)215(10)305(16)15.4(1)
Particle swarm optimization (PSO)0(27)0(29)3(30)52(25)238(7)293(17)11.6(5)
Decision support system(DSS)34(11)53(11)52(14)80(16)65(26)284(18)8.8(14)
Pattern recognition46(8)56(9)36(22)73(17)64(27)275(19)9.4(10)
Knowledge-based system(KBS)68(4)78(6)49(17)41(29)26(30)262(20)6.4(28)
Case-based reasoning(CBR)8(24)39(18)50(16)91(14)74(21)262(20)9(13)
Distributed artificial Intelligence(DAI)57(5)93(4)43(19)37(30)29(29)259(22)7(22)
Knowledge representation(KR)50(7)54(10)49(17)66(20)37(28)256(23)5.6(30)
Management15(20)20(22)38(21)54(23)78(20)205(24)14.7(2)
Identification15(20)17(24)33(23)59(22)80(19)204(25)9.7(9)
Decision making16(18)30(19)23(25)52(25)72(22)193(26)6.9(23)
Fault Diagnosis20(13)21(21)39(20)43(28)66(25)189(27)8.4(16)
Computational intelligence(CI)0(27)11(25)16(26)53(24)103(17)183(28)8.6(15)
Recognition18(16)20(22)15(28)49(27)72(22)174(29)12.1(4)
Ontology1(25)10(27)24(24)62(21)69(24)166(30)6.3(29)
TA: total articles; CPA: citations per article; R rank in the list.
Table 7. New methods, models and applications in artificial intelligence research.
KeywordTypeTA(R)CPA (R)
1995–19992000–20042005–20092010–20141995–2014
Artificial Bee Colony (ABC)Method and model0(5)0(6)5(6)156(1)161(1)14.2(2)
Ant Colony Optimization (ACO)Method and model1(4)5(4)31(4)62(2)99(4)15.5(1)
Artificial Immune System (AIS)Method and model0(5)4(5)37(3)53(3)94(6)9.0(4)
Artificial endocrine system (AES)Method and model0(5)0(6)0(7)4(7)4(7)3.3(7)
Rough setMethod and model5(3)17(2)49(1)32(6)103(3)7.3(6)
Mobile robotApplication9(1)25(1)30(5)33(5)97(5)12.7(3)
Reinforcement learningApplication7(2)14(3)48(2)54(4)123(2)8.95(5)
TA: total articles; CPA: citations per article; R: rank in the list.
Table 8. Most frequently used keywords in geoscience.
Keyword TA(R)CPA(R)
1990–19941995–19992000–20042005–20092010–20141990–2014
River0(5)0(2)2(4)13(2)16(1)31(1)20.8(4)
GIS0(5)0(2)2(4)14(1)12(2)28(2)4.9(9)
Remote sensing1(4)0(2)6(2)9(3)8(3)24(3)14.2(5)
Wastewater treatment2(3)0(2)7(1)9(3)2(7)20(4)28.8(1)
Water quality0(5)3(1)0(7)6(7)8(3)17(5)7.2(7)
Hydrology4(1)0(2)0(7)1(8)6(5)11(6)5.4(8)
Risk assessment3(2)0(2)3(3)0(9)4(6)10(7)12(6)
Rainfall runoff models0(5)0(2)0(7)8(5)2(7)10(7)27.2(2)
Flood forecasting0(5)0(2)1(6)8(5)1(9)10(7)24.1(3)
TA total articles; CPA citations per article; R rank in the list. GIS: Geographic Information Systems.

