2. Materials and Methods
In this section, both the well-established methods and the proposed new centrality method for networks with data are described in detail. The model presented has the main characteristic that can be understood as the merger of two well-established and consolidated models for the calculation of centrality. On the one hand, it takes as a base the APA centrality for networks with data. The great advantage of this model is that it is based on the idea of the PageRank vector, whose essence is the calculation of the dominant eigenvector of an irreducible and stochastic matrix. By choosing this matrix conveniently, its stability, from the numerical point of view, is absolute and there exist efficient numerical methods that obtain results although the networks are very large. On the other hand, the idea of considering the PageRank model as the union of two different layers, such as topological and probabilistic, leads us directly to our approach of incorporating a layer of data in the network as essential when determining the importance of nodes in the same.
Throughout this section, it is described the two approaches on which the new centrality is based and, later, an algorithm to calculate the new measure will be implemented, exposing its main characteristics.
2.1. The Original APA Model Based on Data
The Adapted PageRank Algorithm (APA) proposed by Agryzkov et al. [
27] provides us a model to establish a ranking of nodes in an urban network taking into account the data presented in it. This centrality was originally proposed for urban networks, although it may be generalized to spatial networks or networks with data. It constitutes a centrality measure for networks with the main characteristic that it is able to consider the importance of data obtained from any source in the whole process of computing the centrality of the individual nodes. Starting from the basic idea of the PageRank vector concept, the construction of the matrix used for obtaining the classification of the nodes is modified.
In its original approach, PageRank is based on a model of a Web surfer that probabilistically browses the Web graph, starting at a node chosen at random according to a personalization vector whose components give us the probability of starting at node v. At each step, if the current node has outgoing links to other nodes, the surfer next browses with probability one of those nodes (chosen uniformly at random), and with probability a node chosen at random according to the personalized vector. For the Web graph, the most popular value of the dumping factor is . If the current node is a sink with no outgoing links, the surfer automatically chooses the next node at random according to the personalized vector.
In the APA model, the data matrix is constructed following a similar reasoning from the original idea of the PageRank vector; a random walker can jump between connecting nodes following the local link given by the network or can jump between nodes (not directly connected) with the same probability, regardless the topological distance between them (number of nodes in the walk).
In the algorithm implemented to calculate the APA centrality (see [
27], page 2190), a new matrix
is constructed from the adjacency matrix
A, as
where
represents the sum of the
j-th column of the adjacency matrix.
Algebraically,
may be obtained as
where
is the degree matrix of the graph, that is,
, for
and
, for
. We refer to
as
transition matrix, and it represents, by columns, the probability to navigate from a page to other. In the literature related to this topic the matrix
is also denoted as
P or
, so
,
P or
are the same matrix. Following the notation of Pedroche et al. it will preferably be used
P.
The transition matrix,
has the following characteristics (see [
27]):
The key point of the model is the construction of the so-called data matrix D of size , with its n rows representing the n nodes of the network, and each of its k columns representing the attributes of the data object of the study. Specifically, an element is the value we attach to the data class at node i.
However, not all the characteristics of data may have the same relevance or influence in the question object of the analysis. Therefore, a vector is constructed, where the element that occupies the row i is the multiplicative factor associated with the property or characteristic . With this vector a weighting factor of the data is introduced, in order to work with the entire data set or a part of it.
Then, multiplying
D and
, may be obtained
as
with
.
The construction of vector
allows us to associate to each node a value that represents the amount of data assigned to it. Thus, two different values are associated with every node; on the one hand, its degree, related to the topology and, on the other hand, the value of the data associated to it. For a more detailed description of how the data are associated to the nodes, see [
27,
29].
After normalizing
, denoted as
, it is possible to define the matrix
as
where
is a matrix in which all of its components in the
i-th row are equal to
. The parameter
is fixed and it is related to the teleportation idea. The value that is traditionally used is
.
In practice, vector is repeated (n times) in every column of the matrix V.
The matrix is used to compute the ranking vector for the network.
With these considerations, the APA algorithm proposed in [
27] may be summarized as:
| Algorithm 1: APA |
Let be a primary graph representing a network with n nodes.
- 1
Compute the matrix P from the graph G. - 2
Construct the data matrix D. - 3
Construct the weighted vector . - 4
Compute as . - 5
Normalize , and denote it as . - 6
Construct V as . - 7
Construct the matrix as . - 8
Compute the eigenvector of the matrix associated to eigenvalue . The components of the resulting eigenvector represent the ranking of the nodes in the graph G.
|
The main feature of this algorithm is the construction of the data matrix D and the weighted vector . The matrix D allows us to represent numerically the dataset. Vector determines the importance of each of the factors or characteristics that have been measured by means of D.
The Perron-Frobenius theorem is of great importance in this problem, since it constitutes the theoretical base that ensures that there exists an eigenvector
associated with the dominant eigenvalue
, so that all its components are positive, which allows establishing an order or classification of these elements. In our case, due to the way in which
P and
V have been constructed, it can be seen that
is a stochastic matrix by columns, which assures us of the spectral properties necessary for the Perron-Frobenius theorem to be fulfilled. Therefore, the existence and uniqueness of a dominant eigenvector with all its components positive is guaranteed. See [
8,
35] for further study of spectral and algebraic properties of the models based on PageRank.
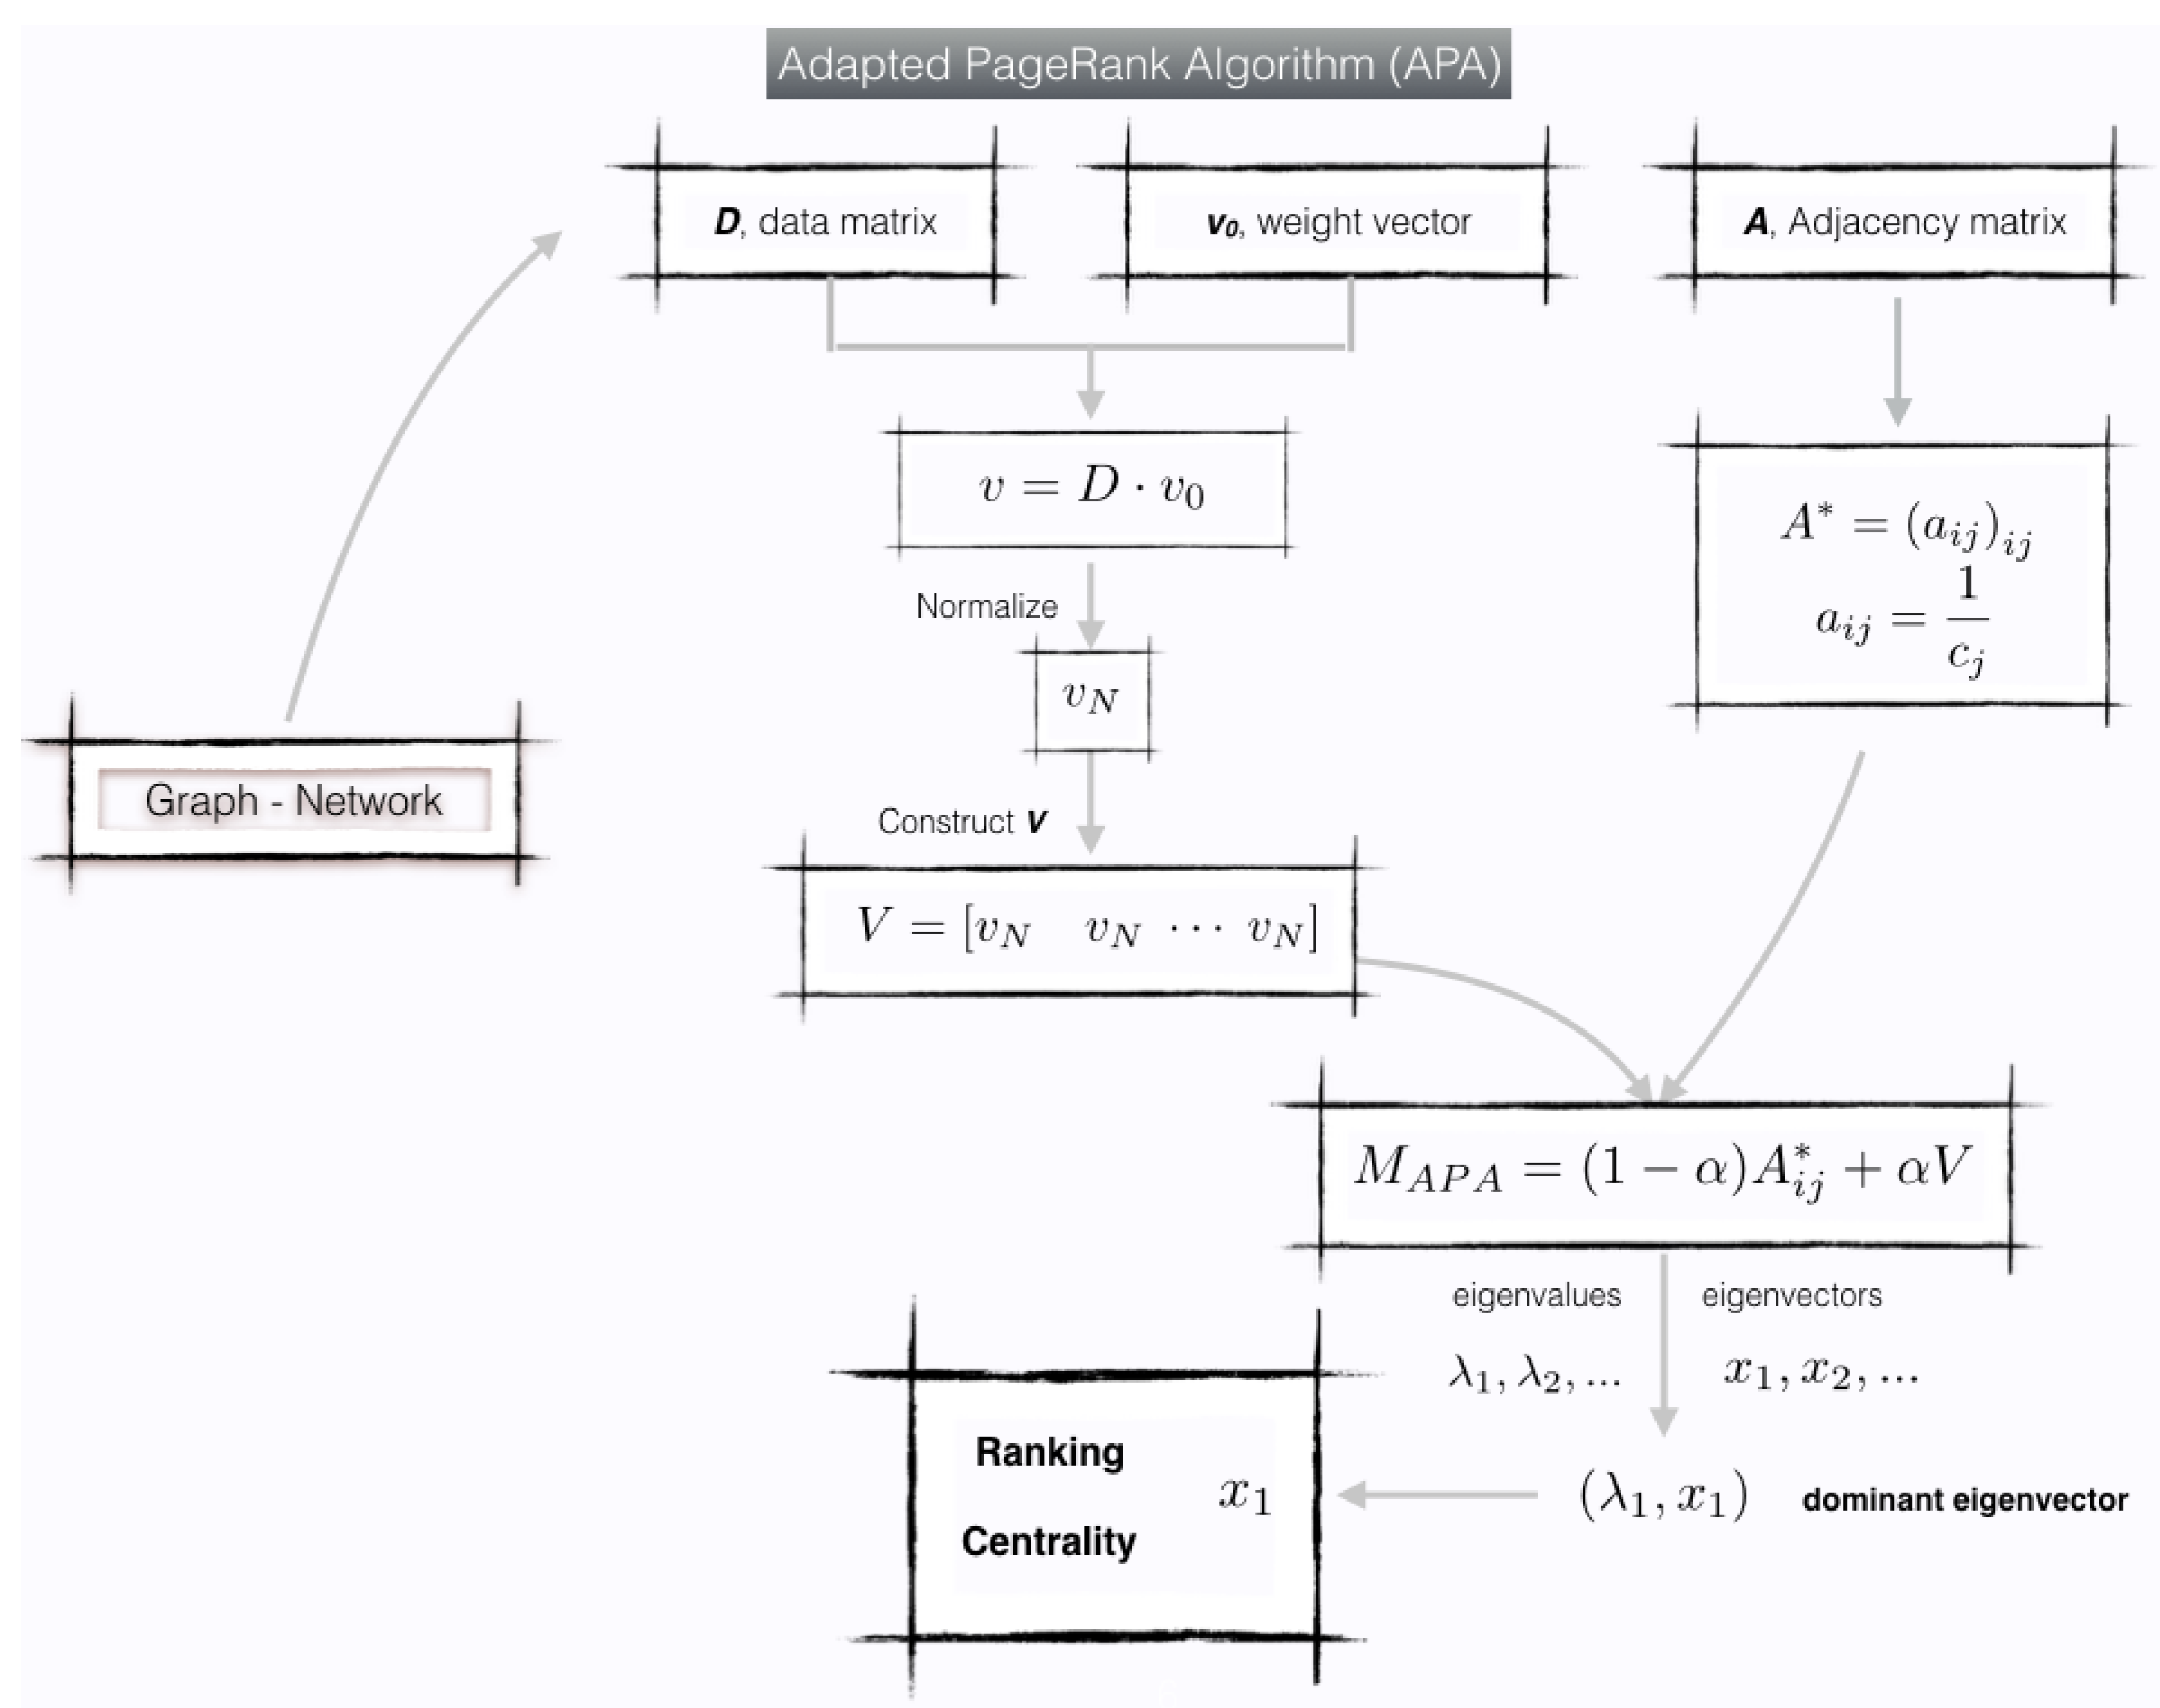
Vector constitutes the Adapted PageRank vector and provides a classification or ranking of the pages according to the connectivity criterion between them and the presence of data.
We can summarize this model in
Figure 1.
2.2. The Two-Layers Approach for Classic PageRank
In practical applications, may be interesting to assign a global measure of importance to each node. If the system contains several types of relations between actors it is expected that the measures, in some way, consider the importance obtained from the different layers. A simple choice could be to combine the centrality of the nodes, obtained from the different layers independently according to some heuristic choice.
Pedroche et al. [
34] proposed a two-layers approach for the classic PageRank classification vector based on the idea that will be explained in this section. The key is to consider the PageRank model as a process divided into two clearly differentiated parts. In the first place, there is a part related to the topology of the network, where the connections of the nodes are basically taken into account by means of their adjacency matrix. Secondly, there is a part regarding to the probability for jumping between two nodes in the network, following a criterion that there is the same probability among all of them.
In [
34], the authors realize that the PageRank classification for a graph
G with personalized vector
can be understood as the stationary distribution of a Markov chain that occurs in a network with two layers, which are
, a physical layer: the network G.
, a teleportation layer: an all-to-all weighted network given by the personalized vector.
Under this perspective, it is easy to construct a block matrix
based on these two-layers where each of the diagonal blocks is associated to a given layer. Therefore,
can be constructed as
where
defines a Markov chain in a network with two layers.
Because of the good spectral characteristics of
(it is irreducible and primitive), Pedroche et al. [
34] arrive to the conclusion that given a network with
n nodes and whose adjacency matrix is
A, the two-layer approach PageRank of
A is the vector
where
is the unique normalized and positive eigenvector of matrix
given by the expression (
4).
The idea of separating the centrality based on the PageRank concept into two layers, differentiating the topological part of the network from the concept of personalization vector, can be extrapolated to multilayer networks, as the authors demonstrate in [
34].
This idea motivates the adaptation of the APA algorithm to the consideration of the division of the process in two different layers, where now the layer related to the topology is not modified, while the layer defined by the personalization vector is replaced by the layer of data in the network. In the following subsections, this idea will be developed and analysed both theoretically and numerically.
2.3. Constructing the APA Centrality by Applying the Two-Layer Technique
Roughly speaking, the idea in which the PageRank classification vector is based in that of a vector of a random walker that can jump between nodes following two basic principles: on the one hand, the walker can use the local links (physical walk) and, on the other hand, the walker can jump to any other node in the network according to the personalised vector (teleportation). This motivates the two-layers approach.
The APA centrality model is also based on the PageRank vector concept. However, the idea of a teleportation layer is replaced by the influence of data present in the network and associated to the nodes. This is motivated by the idea of applying this centrality to spatial or urban networks, where the analysis and the amount of data in the network is more important than the concept of random navigation through the network. It is assumed that in a network with data there is a greater probability that a user will move not randomly but following the data, according to their interests. This idea is what fundamentally differentiates Pedroche et al. and APA models.
Although both models are different, the application of the two-layers PageRank approach model as it was described in
Section 2.2 in the APA centrality model makes sense, as it is explained below. Analysing carefully the construction of matrix
given by Equation (
3), it can be observed that the influence of the data and the topology are measured separately. This is the basis on which it will be possible to build a new centrality based on the two-layers concept with two clearly differentiated layers:
, a physical layer: or topological layer, the network G.
, a data layer: the data present in the network.
Therefore, in this section a new centrality algorithm is described with the primary objective to adapt the two-layers approach to the APA centrality, constructing a block matrix to distinguish in the network both topology and data.
In our case, the basis of the original APA model consists of the construction of a stochastic matrix by columns, where the topology of the network is reflected and the influence of the data, through the matrix V.
Let us develop a similar reasoning as in [
34], in order to build a
block matrix where the first upper diagonal block contains the information referring to the network topology, while the lower diagonal block is associated to the collected data in the network and assigned to each node.
Taking as a reference the APA algorithm, the matrix used to compute the eigenvector associated to the dominant eigenvalue
is given by
following the notation that appears in [
34] regarding to the probability matrix
P.
A new
block matrix is defined as
Note the differences between matrices y . One would expect both to be the same but this is not the case because in the two-layers approach an stochastic by rows matrix is constructed; however, the new centrality proposed is based on the construction of , an stochastic by columns matrix.
Due to the way it has been constructed, Equation (
5) allows us to confirm that
still retains some desirable spectral properties, since
is again irreducible and stochastic by columns. Applying again the Perron-Frobenius theorem it can be said that there exists an eigenvector
such that
with
Then, the centrality is given by the unique normalized vector
given by
The new algorithm proposed to implement the APA centrality following the two-layers approach is given by
| Algorithm 2: APA2f |
Let be a primal graph representing a network with n nodes.
- 1
Compute the matrix from the graph G. - 2
Construct the data matrix D. - 3
Construct the weighted vector . - 4
Compute as . - 5
Normalize , and denote it as . - 6
Construct V as . - 7
Construct the matrix using the expression ( 5). - 8
Compute the eigenvector of matrix associated to eigenvalue . The normalized components of the resulting eigenvector represent the ranking of the nodes in graph G.
|
Algorithm 2 implements a new centrality measure that will be denoted in the following as APA2f. The idea that underlies the construction of the matrix by blocks given by (
5) is to maintain the spectral properties of the original matrix
, in order that the numerical algorithms for determining dominant eigenvalue and eigenvector are stable and fast. Note that the new matrix
have doubled the size of the original matrix.
Let us show a simple example to clarify this process, considering a simple graph with 4 nodes whose adjacency matrix is
and whose data matrix
D and weighted vector
are
From the adjacency matrix it is easy to compute
P as
Now, let us compute
V from
D and
.
Let us normalize
and construct
V as
Now, from
P and
V it is possible to construct
by the expression (
5).
Notice that
, given by (
5), is a stochastic matrix by columns. Therefore,
, provides us the eigenvector associated to eigenvalue
. Once this vector is normalized, the centrality of the nodes is determined. For this example, the result is
3. Results
Some numerical results of the new centrality APA2f calculated running the Algorithm 2 on different networks are presented. All the numerical tests have been carried out by implementing Algorithm 2 in R [
36], a Free Software under the terms of GNU project. It constitutes a language and environment especially efficient for computing and graphics.
More specifically, tests are performed on networks of different sizes whose adjacency matrix has been generated randomly. Another test has been performed taking a small real urban network of the city of Murcia, Spain; finally, the well-known network representing the social relations in Zachary’s karate club has been used to obtain the centrality. Note that in the numerical results we also calculate the APA centrality since it is the basis of the new APA2f centrality, which will allow us to carry out a comparison between them.
The networks used for these first numerical results have been generated randomly although they do not represent well-known models of random networks such as Erdős-Rényi. The graph was generated from a function that constructs the adjacency matrix following a random series of 0 and 1, determining the connectivity of the vertices.
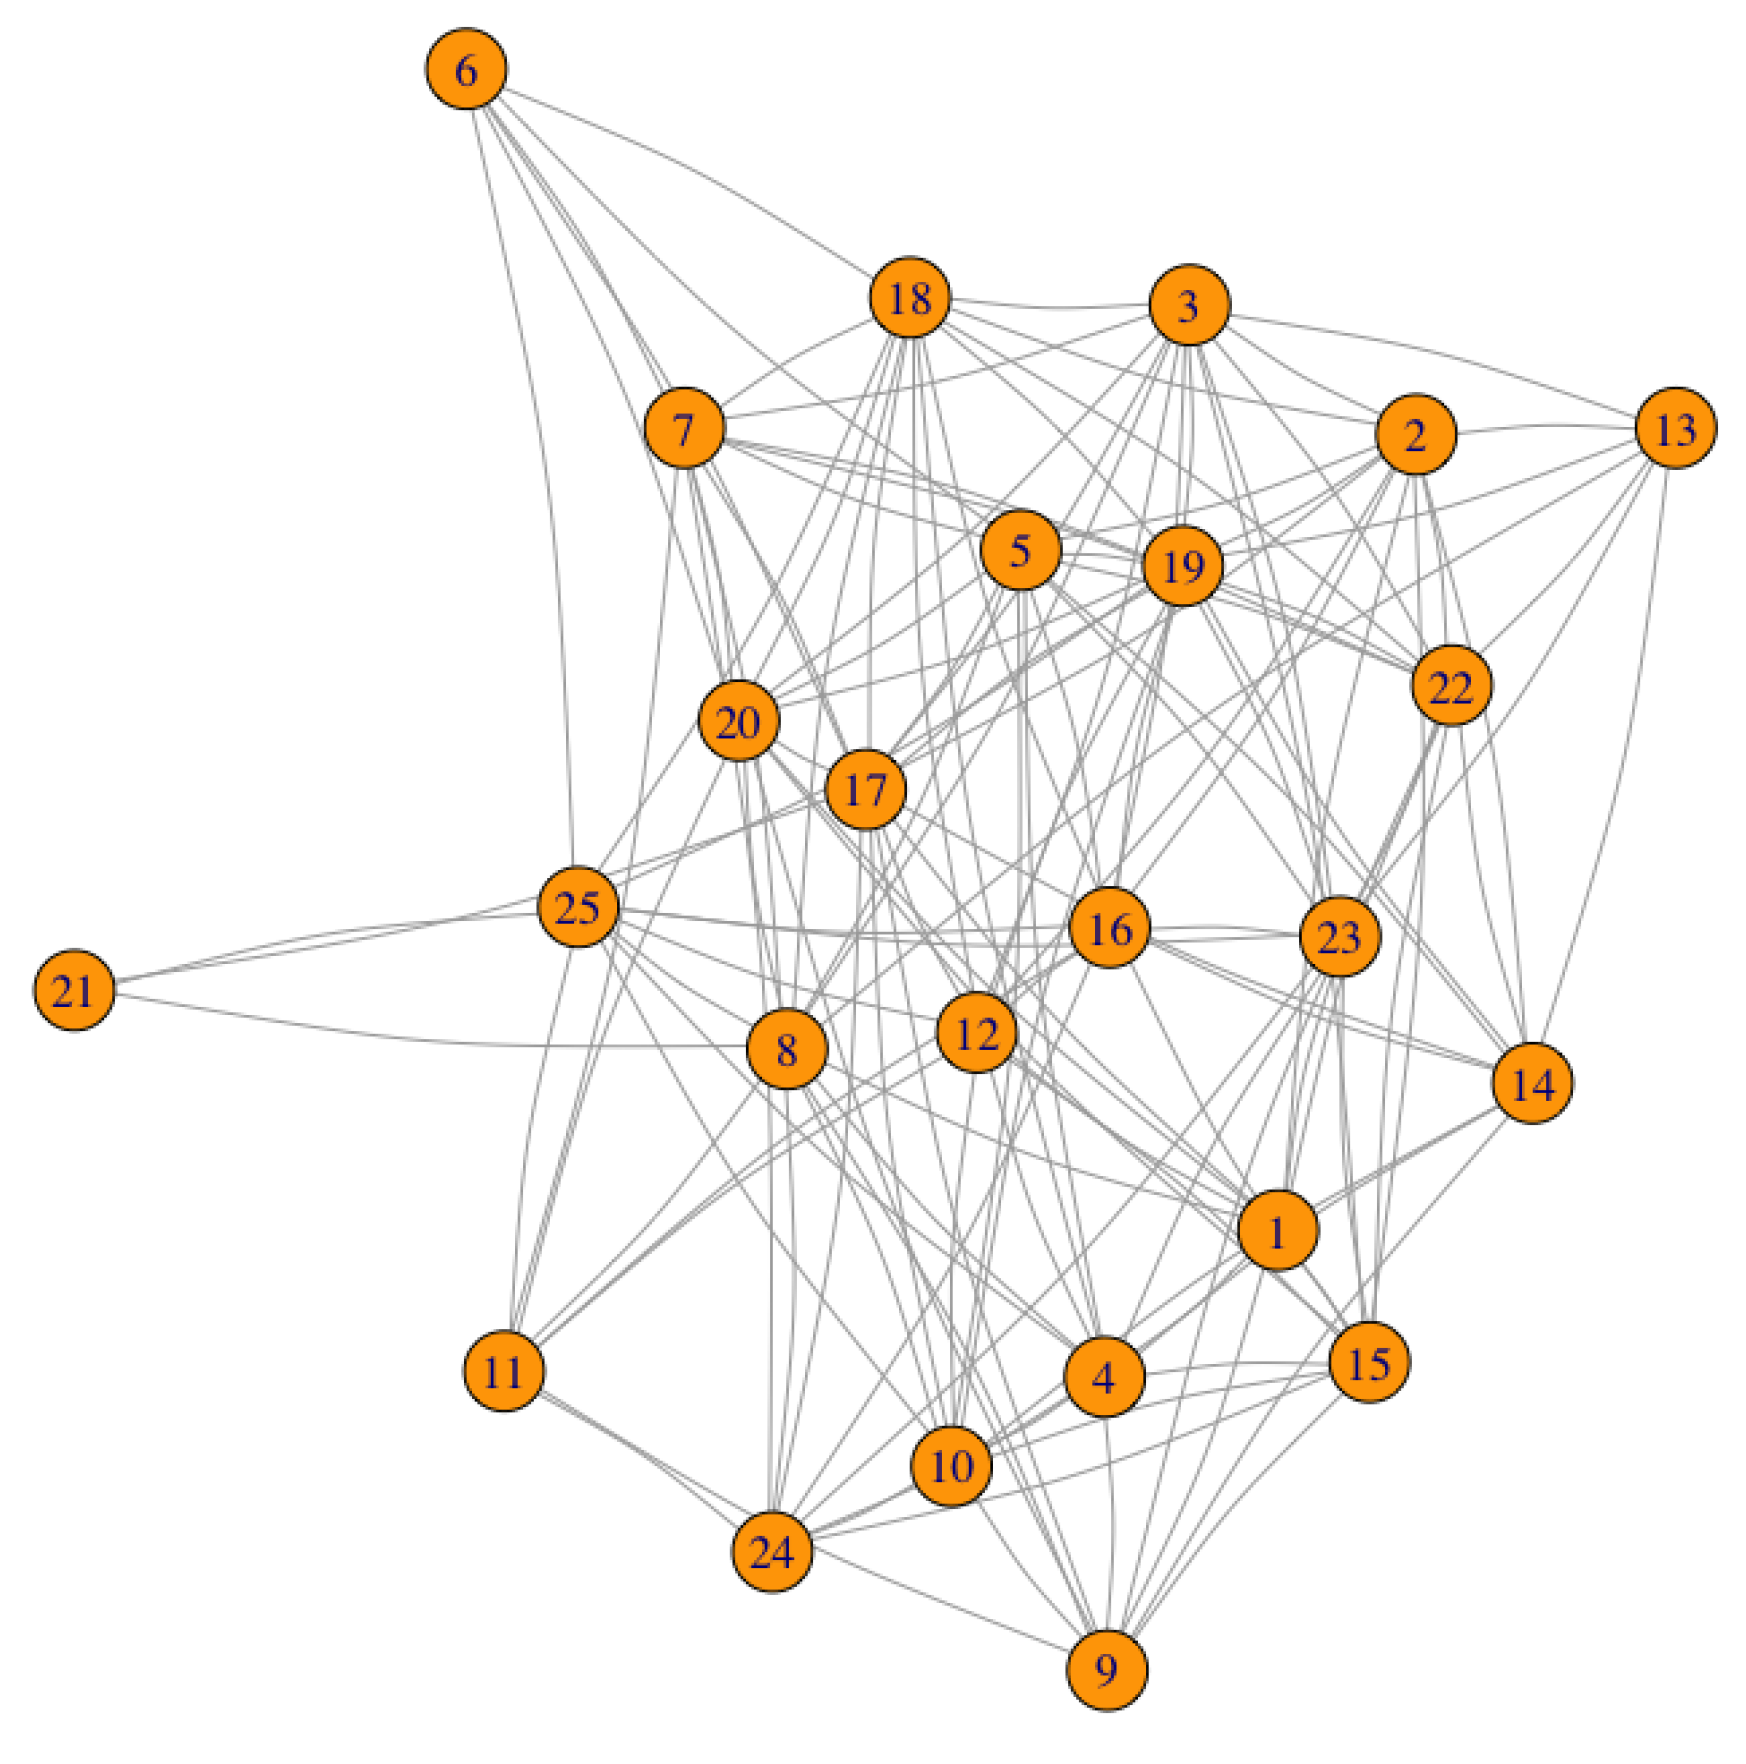
To begin, the small network represented in
Figure 2 is analysed with detail. It has been randomly generated and it has 25 nodes. At first sight, it is observed that the node with the least connectivity is node 21, which has degree 3. The assignment of the amount of data to each node has also been done in a random way, taking values in a range between 0 and 10, both inclusive.
The data vector associated to the 25 nodes is
and the weighted vector is chosen equal to 1.
The APA and APA2f centralities are calculated independently, for this particular network with this data configuration given by D. The main reason to calculate both centralities is twofold: on the one hand, to determine the coherence in the results of the classifications provided by the two measures and, on the other hand, to determine the magnitude of differences in the results of both centralities. This will be discussed in the next section.
The numerical study has been developed for different values of the parameter , which controls the importance that we assign in the calculation of centralities to the topology and data. Remark that the greater the parameter is, the greater importance for data is assumed.
Table 1 summarizes the numerical results for the graph displayed in
Figure 2. In the first column, the identifier of the node is shown; in the second and third column, the numerical values of the degree and the amount of data are displayed, respectively. The rest of the columns summarize the results obtained for the APA and APA2f centralities, taking different values of the
parameter, that is,
. The columns labelled as
Diff represent the difference (in percentages) between the APA and APA2f centrality values. The first three nodes in the classification of both centrality measures are highlighted, (red, blue and green for the first, second and third positions, respectively, in the classification).
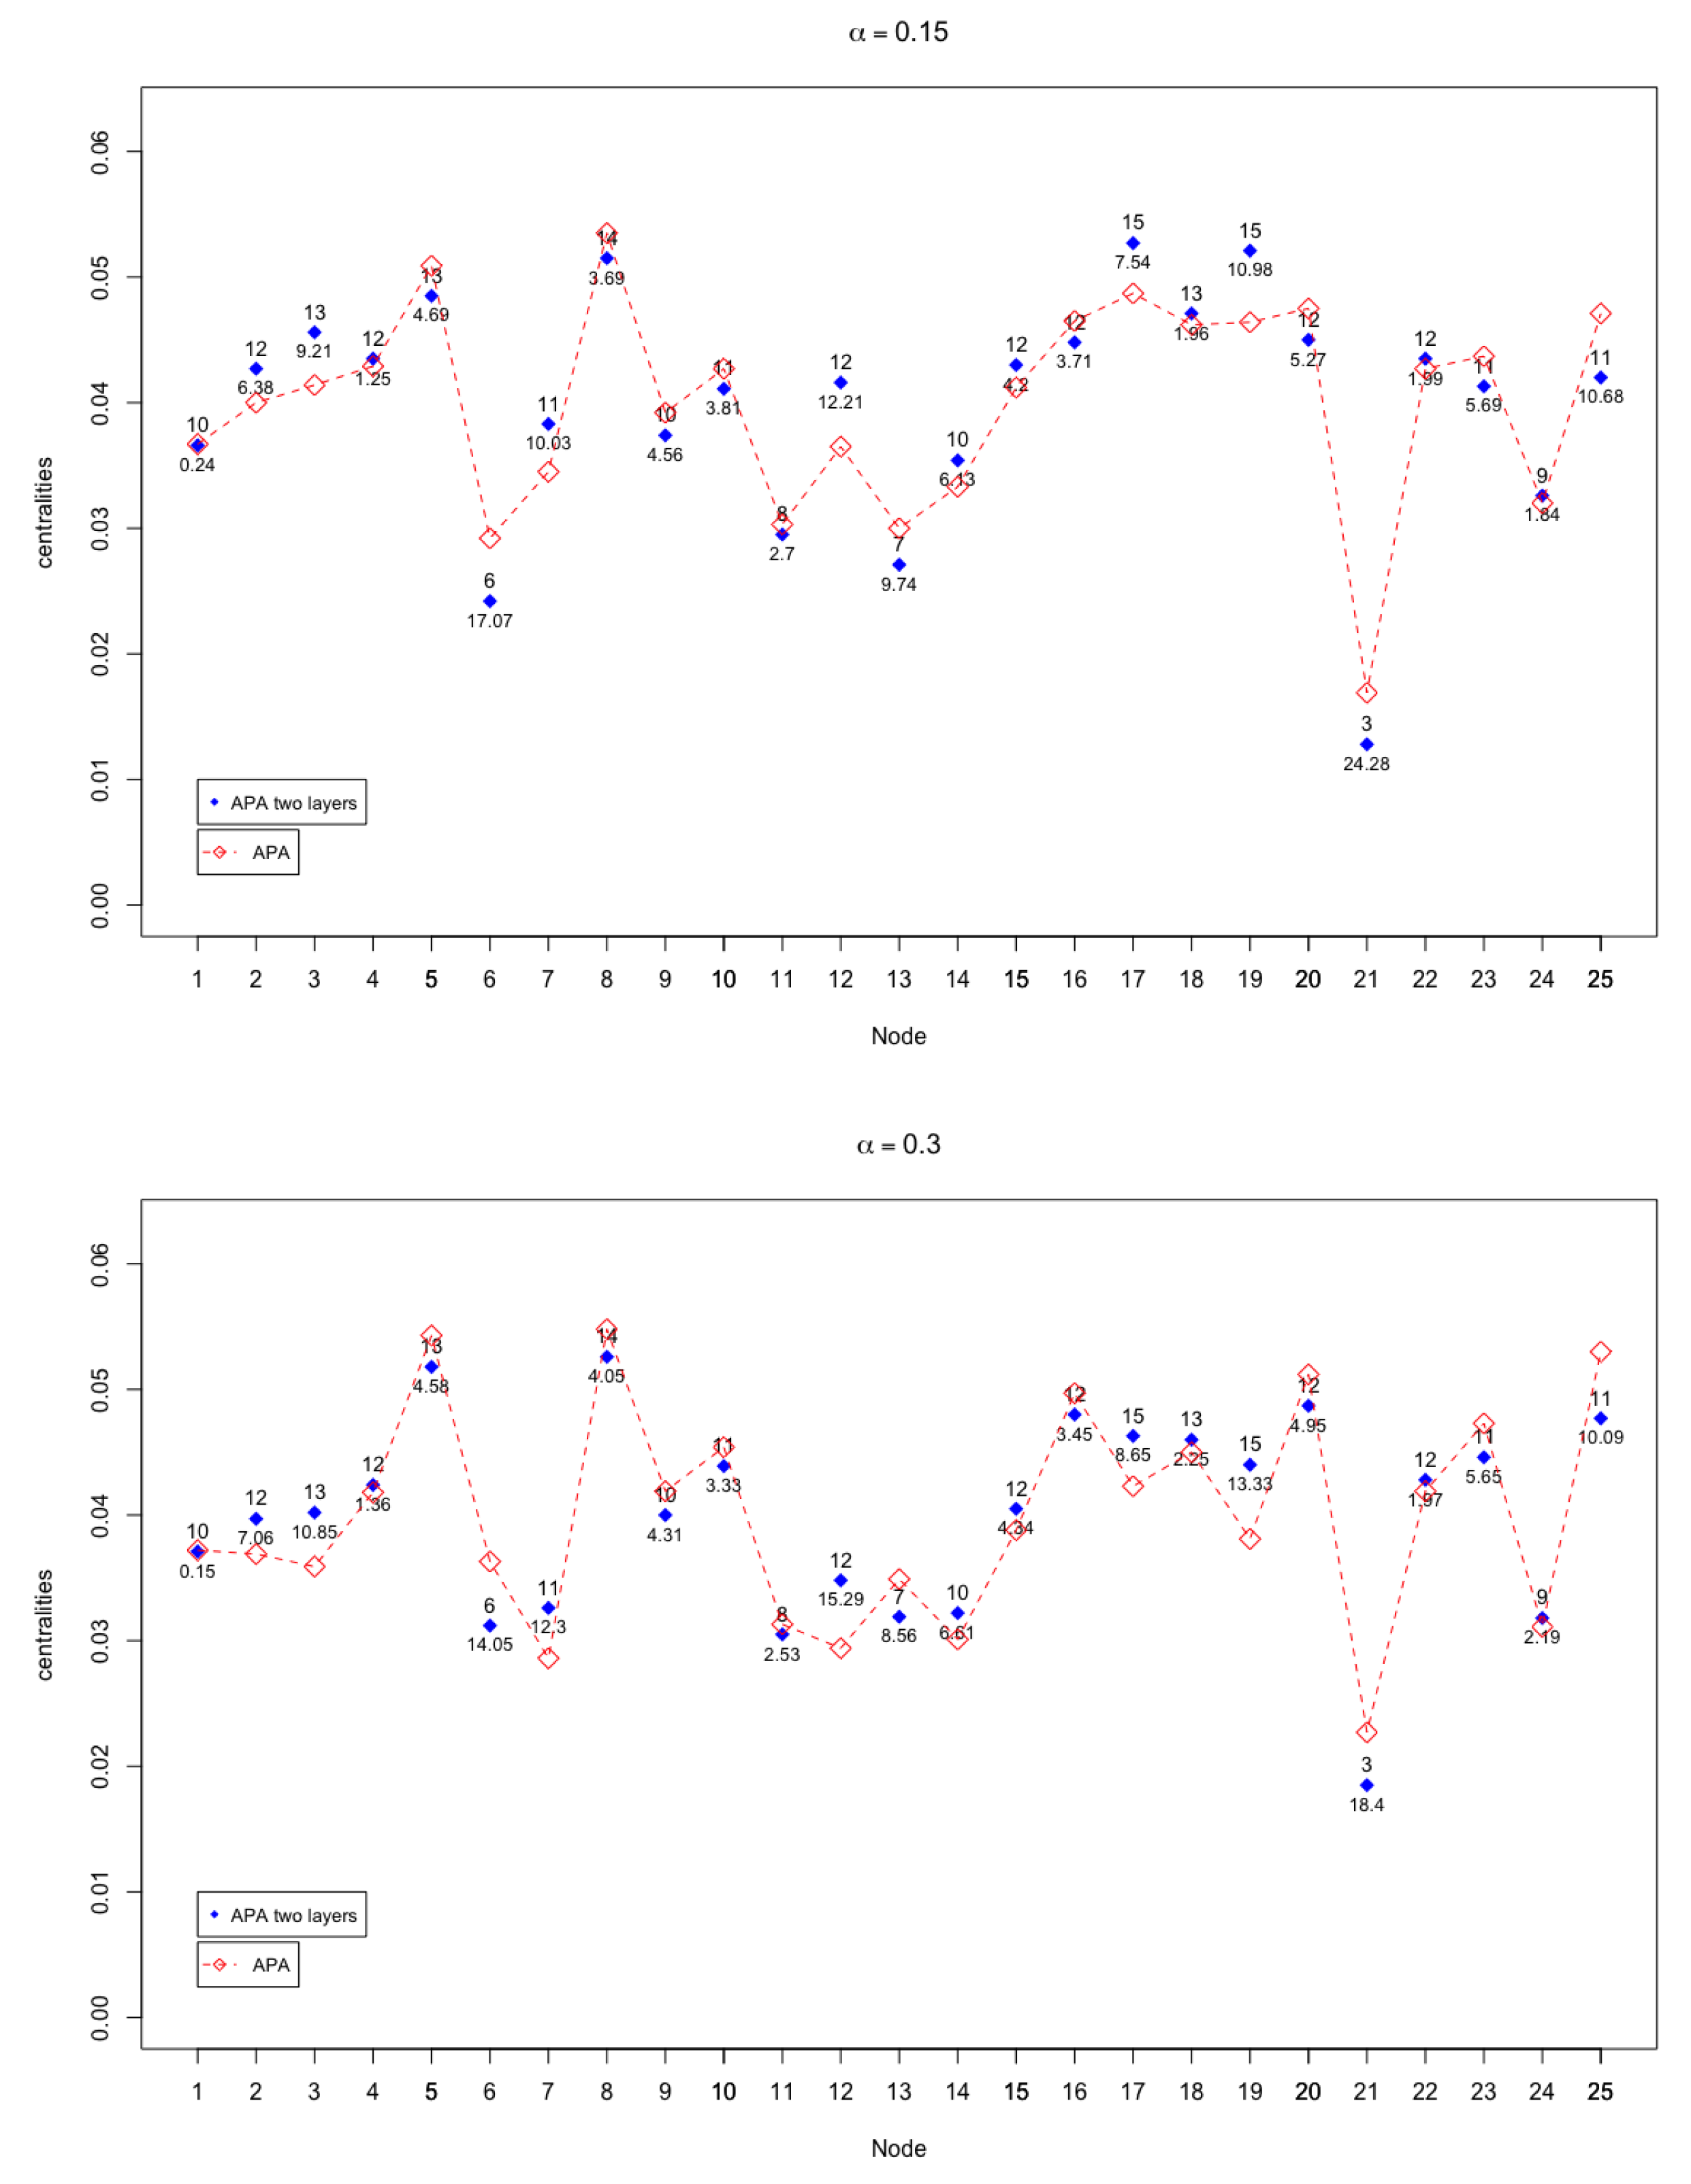
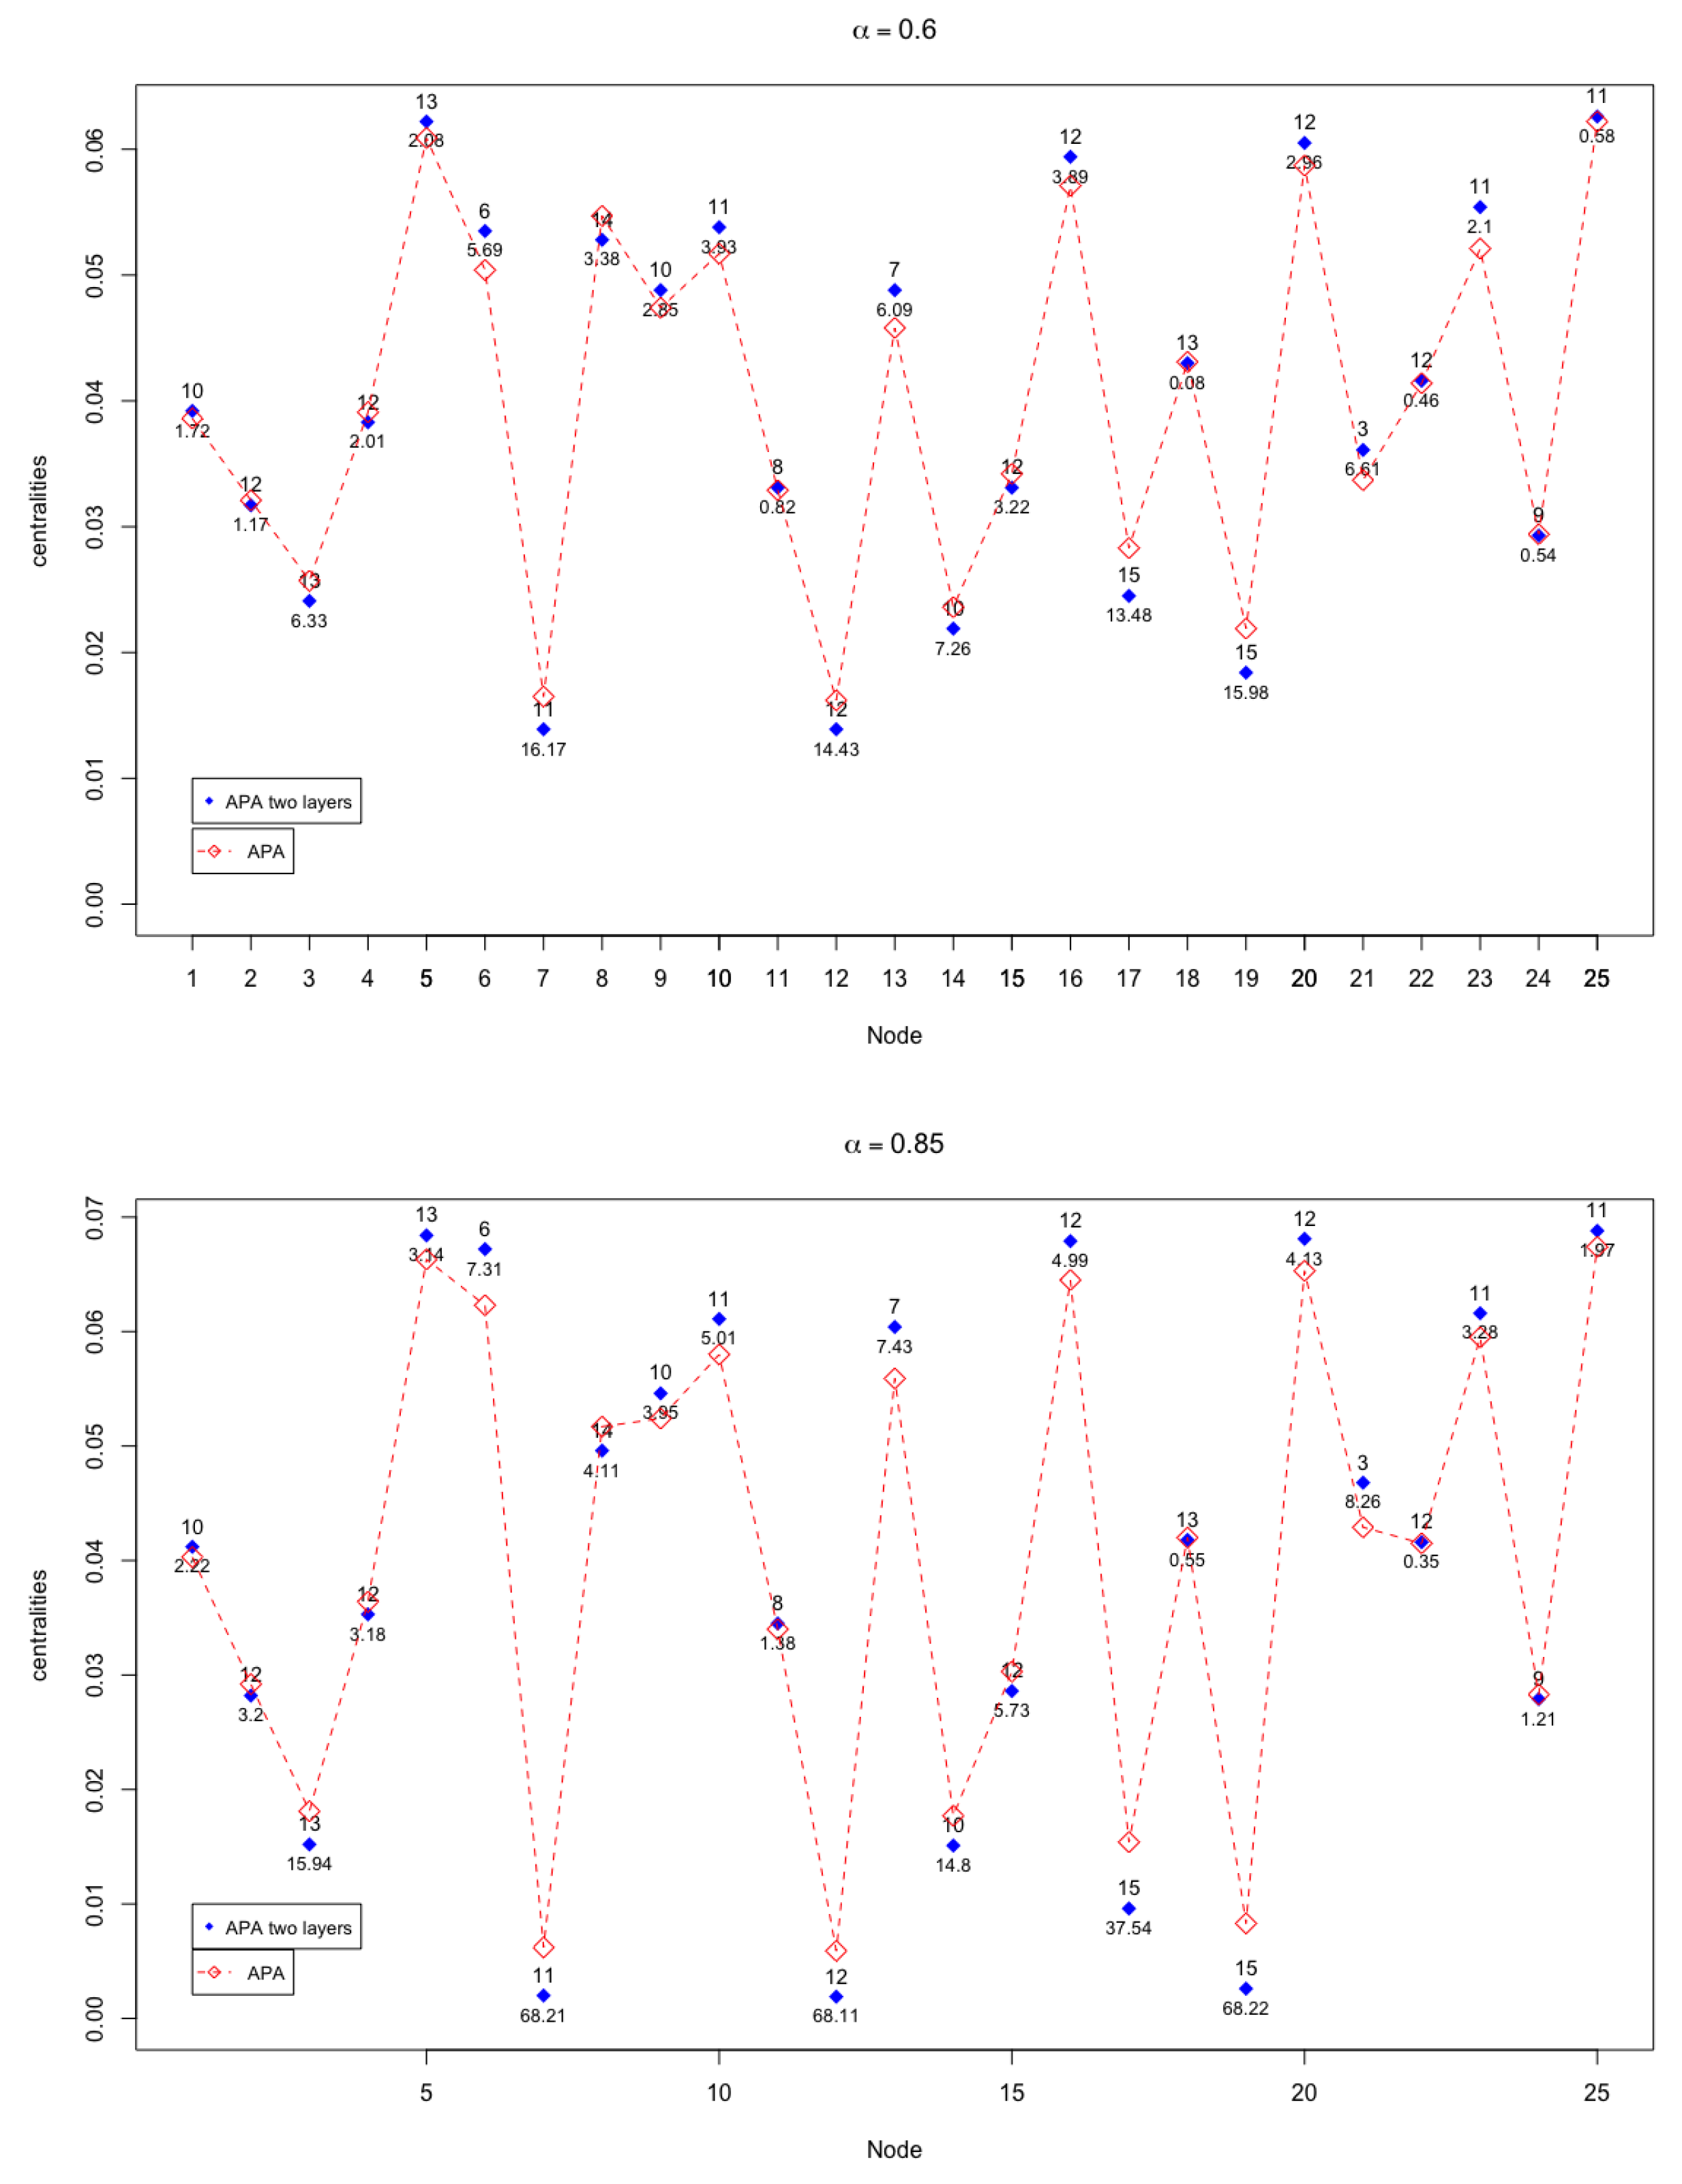
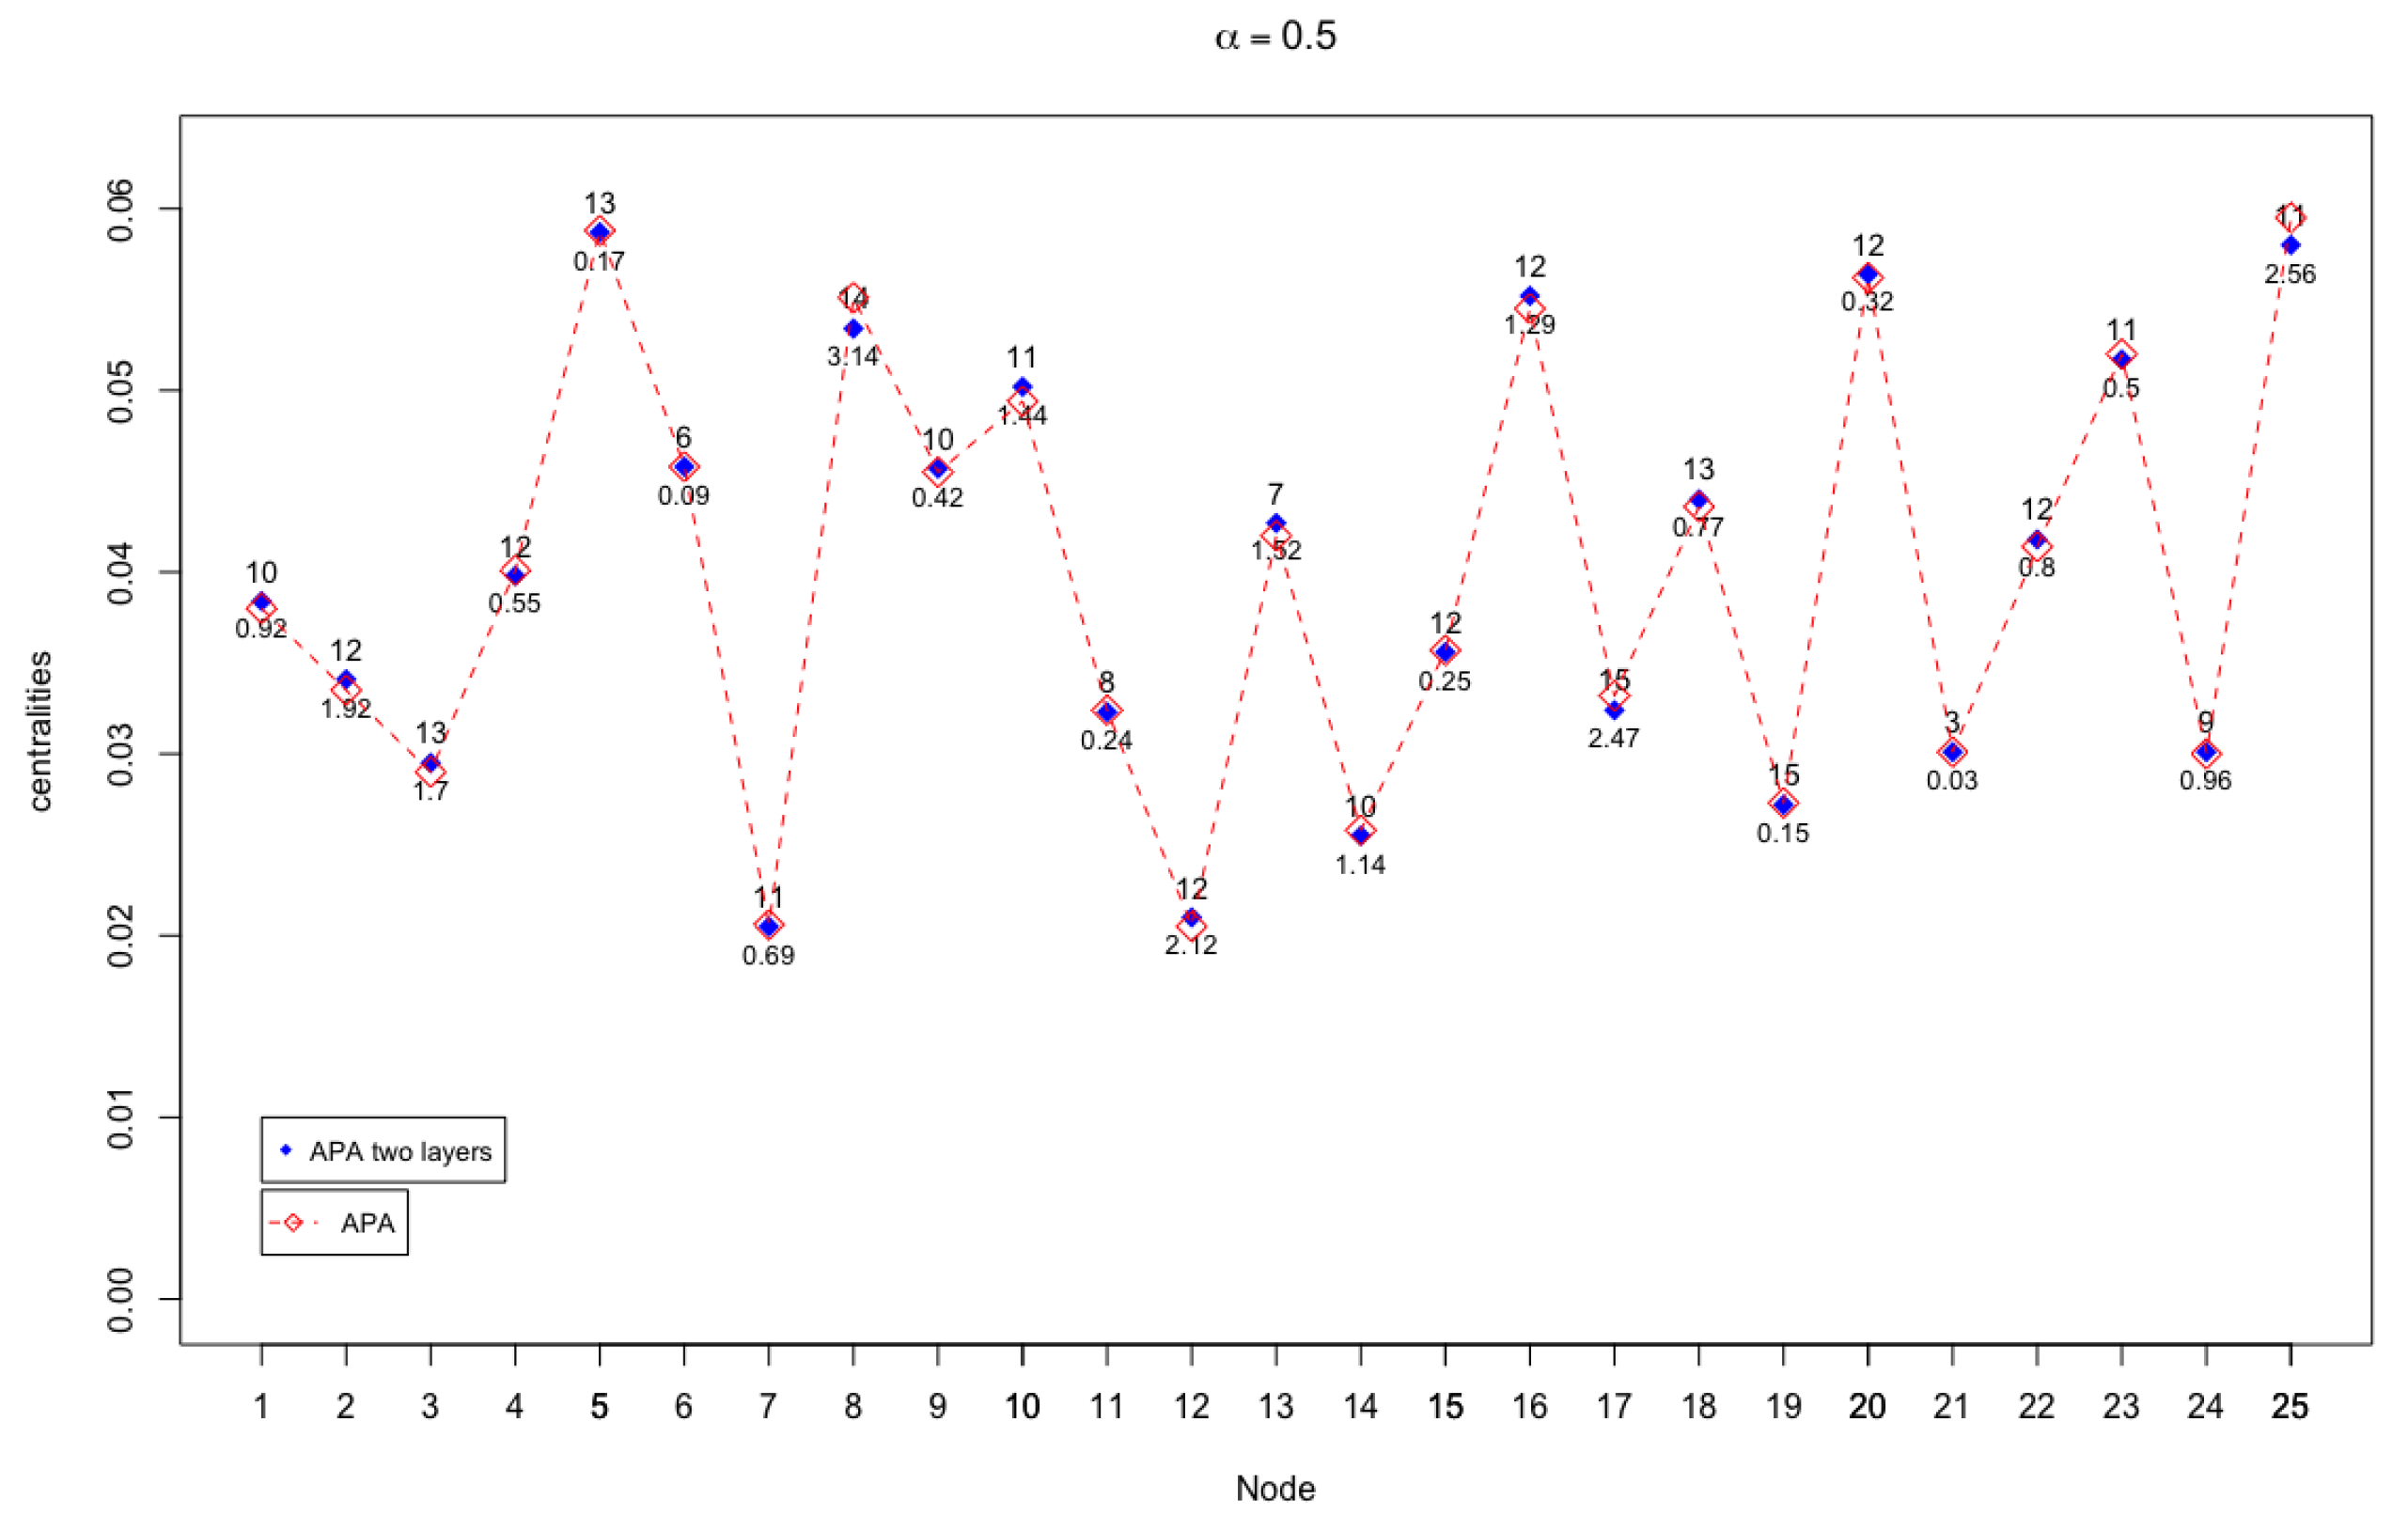
In
Figure 3 and
Figure 4, the APA and APA2f centrality values are displayed, for the 25 nodes of the network, taking different values of the parameter.
The case where there are more notable differences (up to ) occurs when , that is, when the greatest importance to the data present in the network is given.
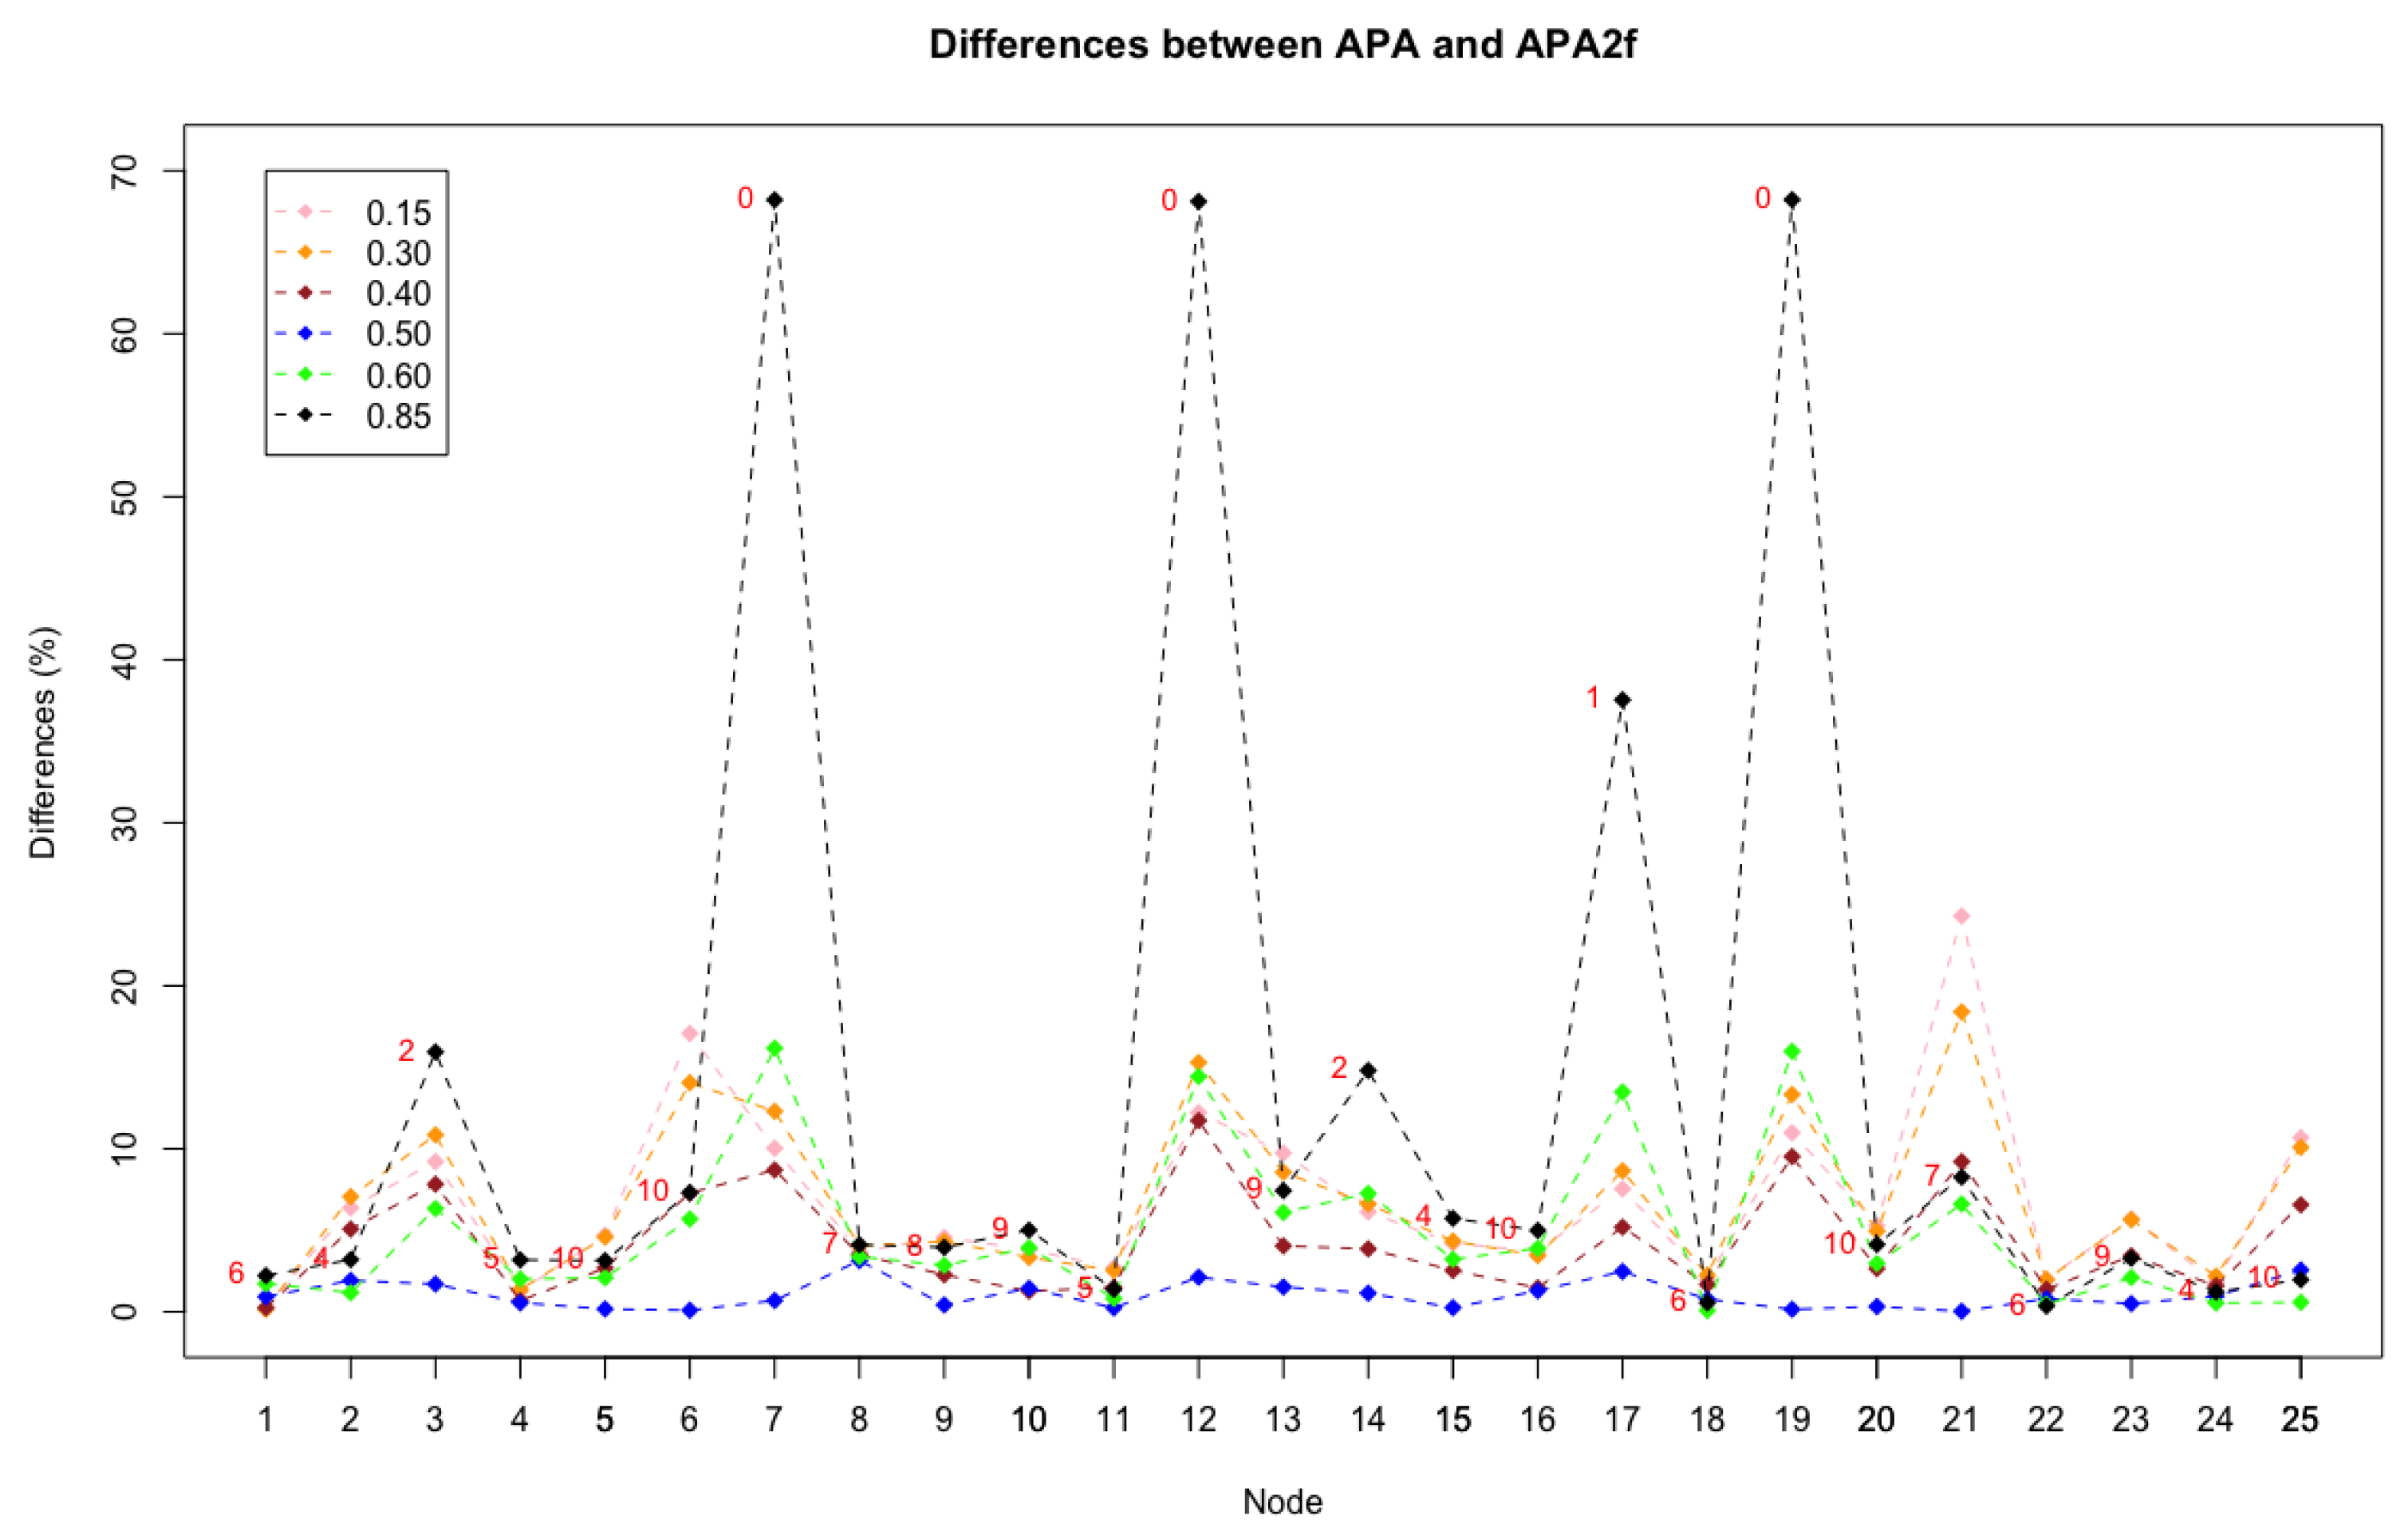
Now, let us study where and when these remarkable differences occur and the reasons for this behaviour. With this purpose, a new figure is constructed where the differences between the APA and APA2f centralities are reflected, for all the nodes in the network and for different values of the parameter.
Figure 5 shows the 25 nodes of the graph on the
X axis and the differences, in percentages, between the APA and APA2f centrality measures on the
Y axis. Lines of different colours are displayed for the chosen values of
that have been studied.
The graphic shows the homogeneity of the line that represents the value , which indicates the minimum differences existing in this case, in which exactly the same importance to the data and the topology of the network is assigned. Remark that the line is almost horizontal. Analysing the cases in which the parameter is kept close to the value , may be observed that the differences increase in some nodes, although they remain at maximum values that do not exceed . Especially significant may be discussing the behaviour and patterns when , which is the case where the greatest differences occur.
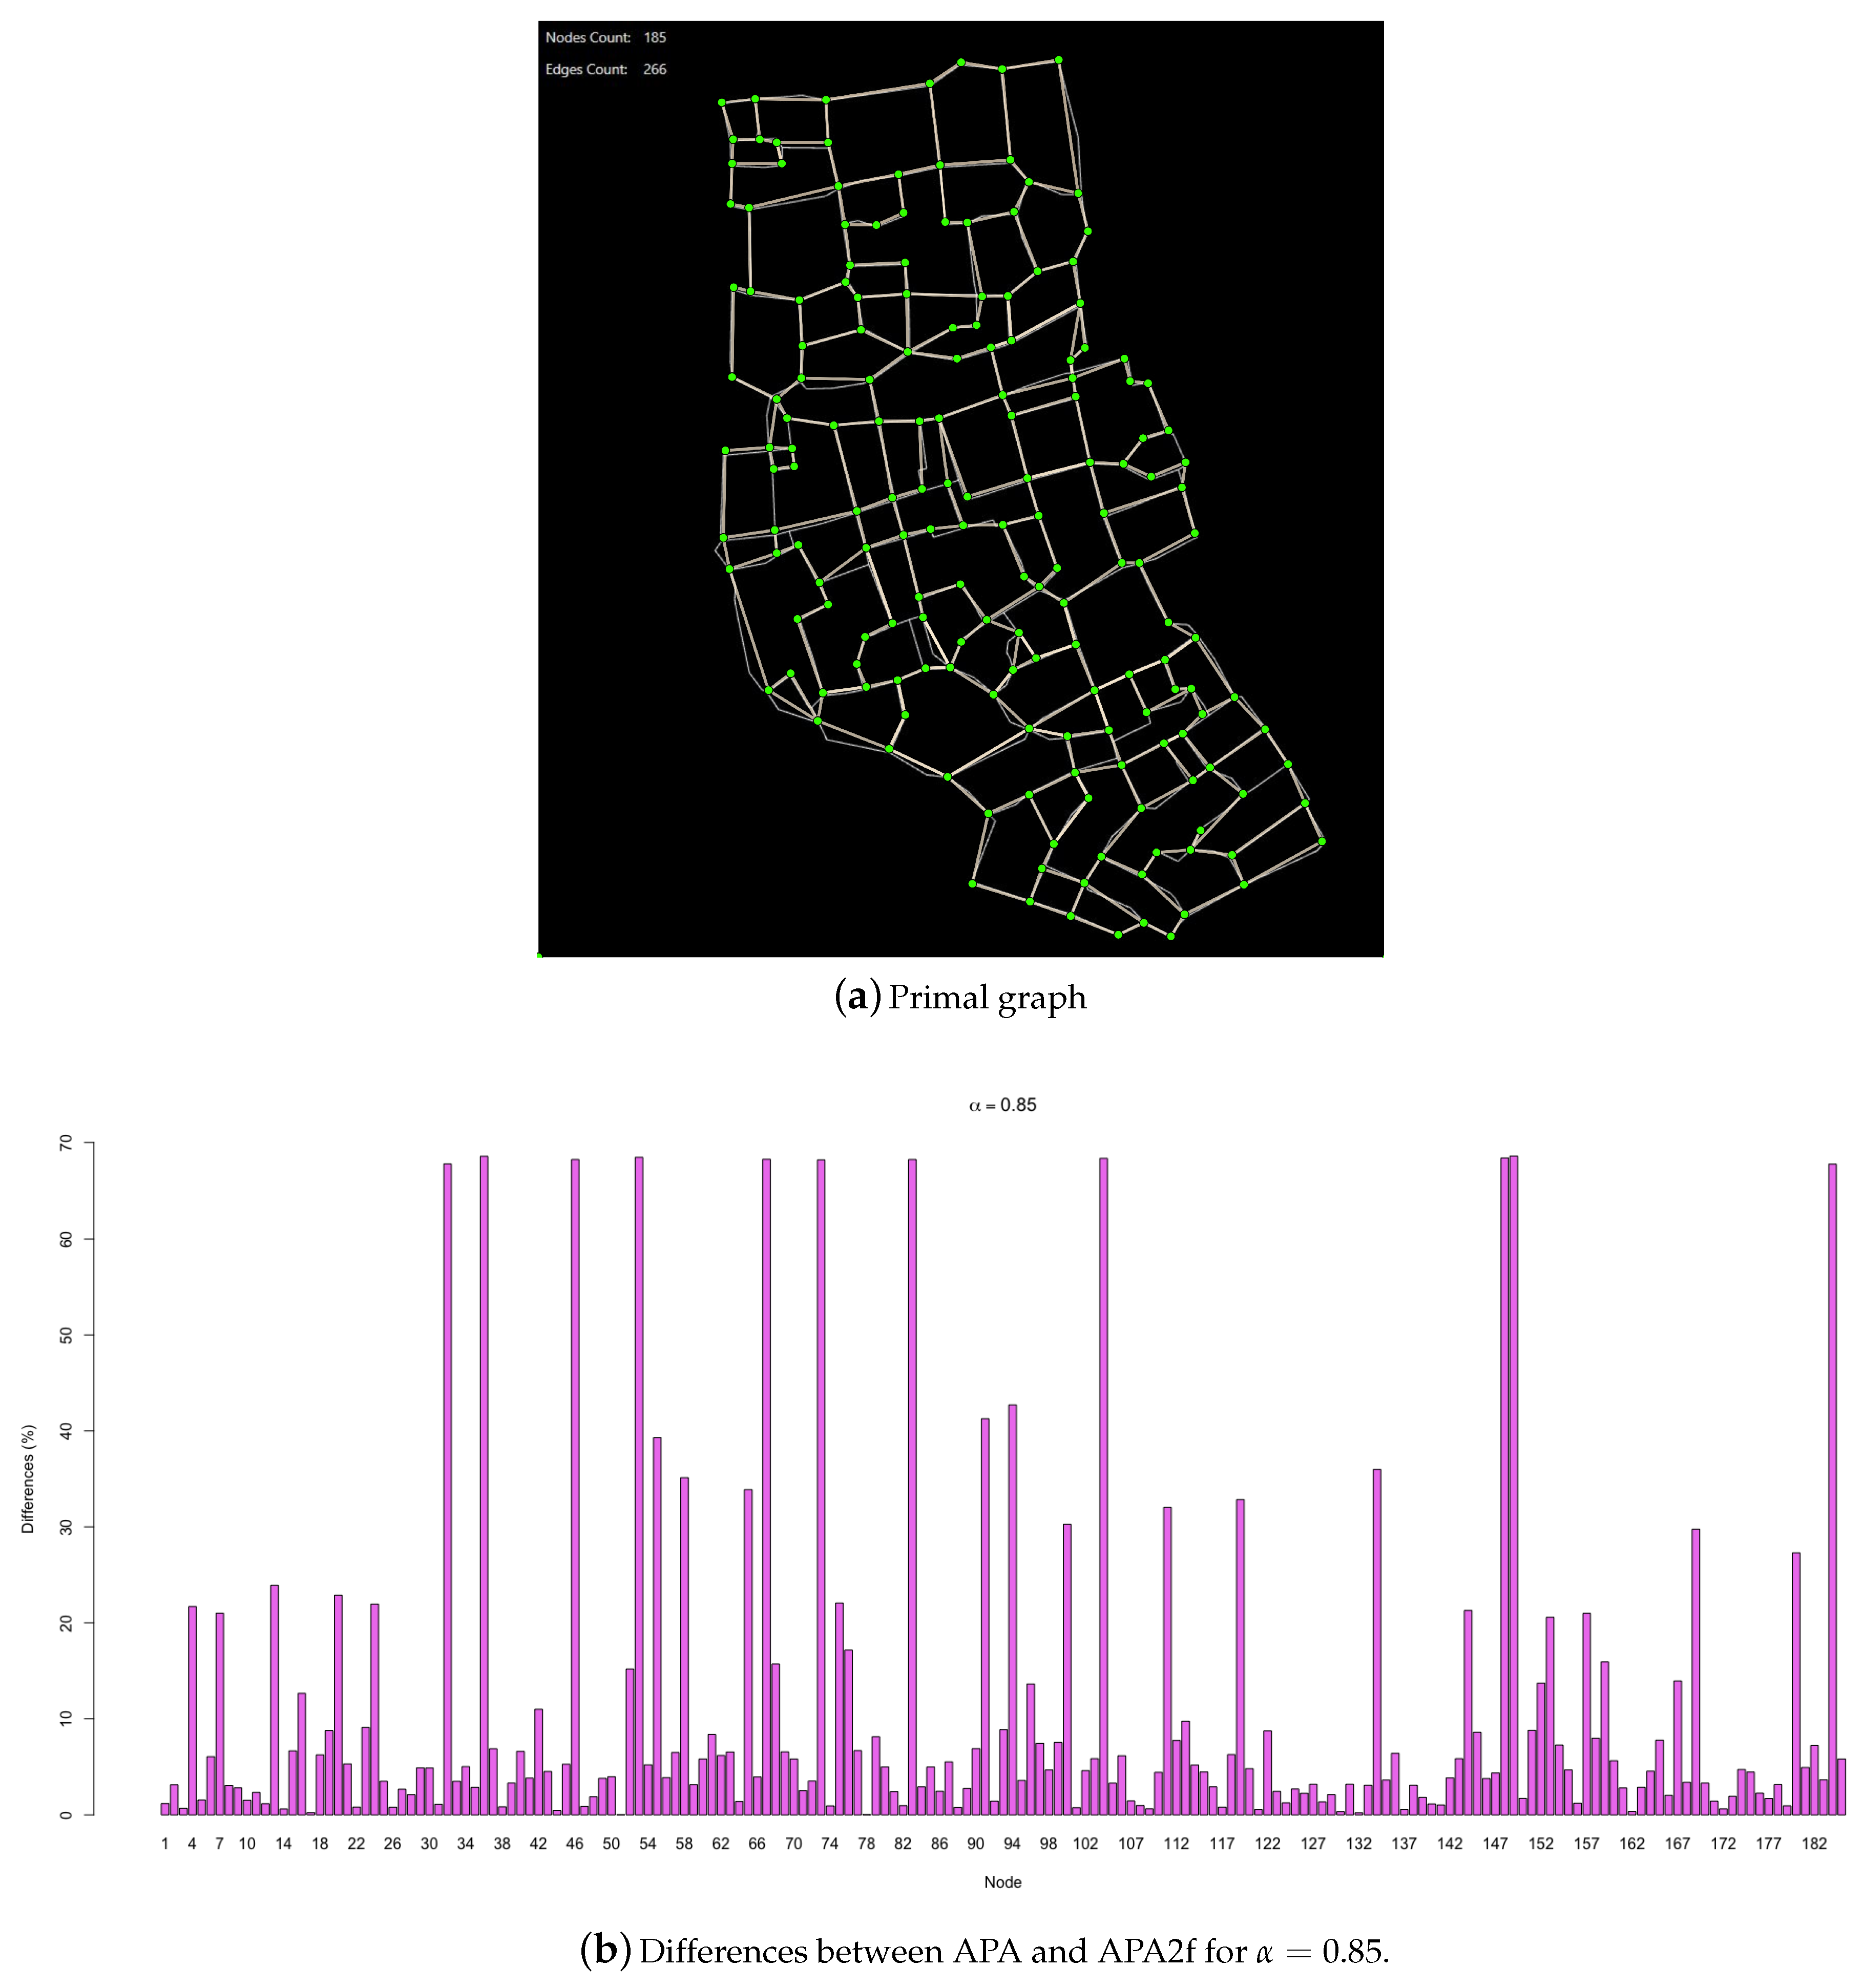
In order to extend the results to other types of networks, a real urban network is studied now to check if the results obtained for this particular type of spatial network follow a similar behaviour as those observed for randomly generated networks. Note that urban networks are characterized for a very uniform node degree distribution, since most of the nodes have degree in a range from 2 to 5. More exactly, the case study is an urban network representing a piece of the historic centre of the city of Murcia, Spain. The primal graph of the urban network is represented in
Figure 6a. The graph has 185 nodes and 266 edges. The data vector associated with the nodes has been generated randomly, in order to carry out the appropriate comparisons.
In
Figure 6b, the differences in the values of both centralities are summarised, for
.
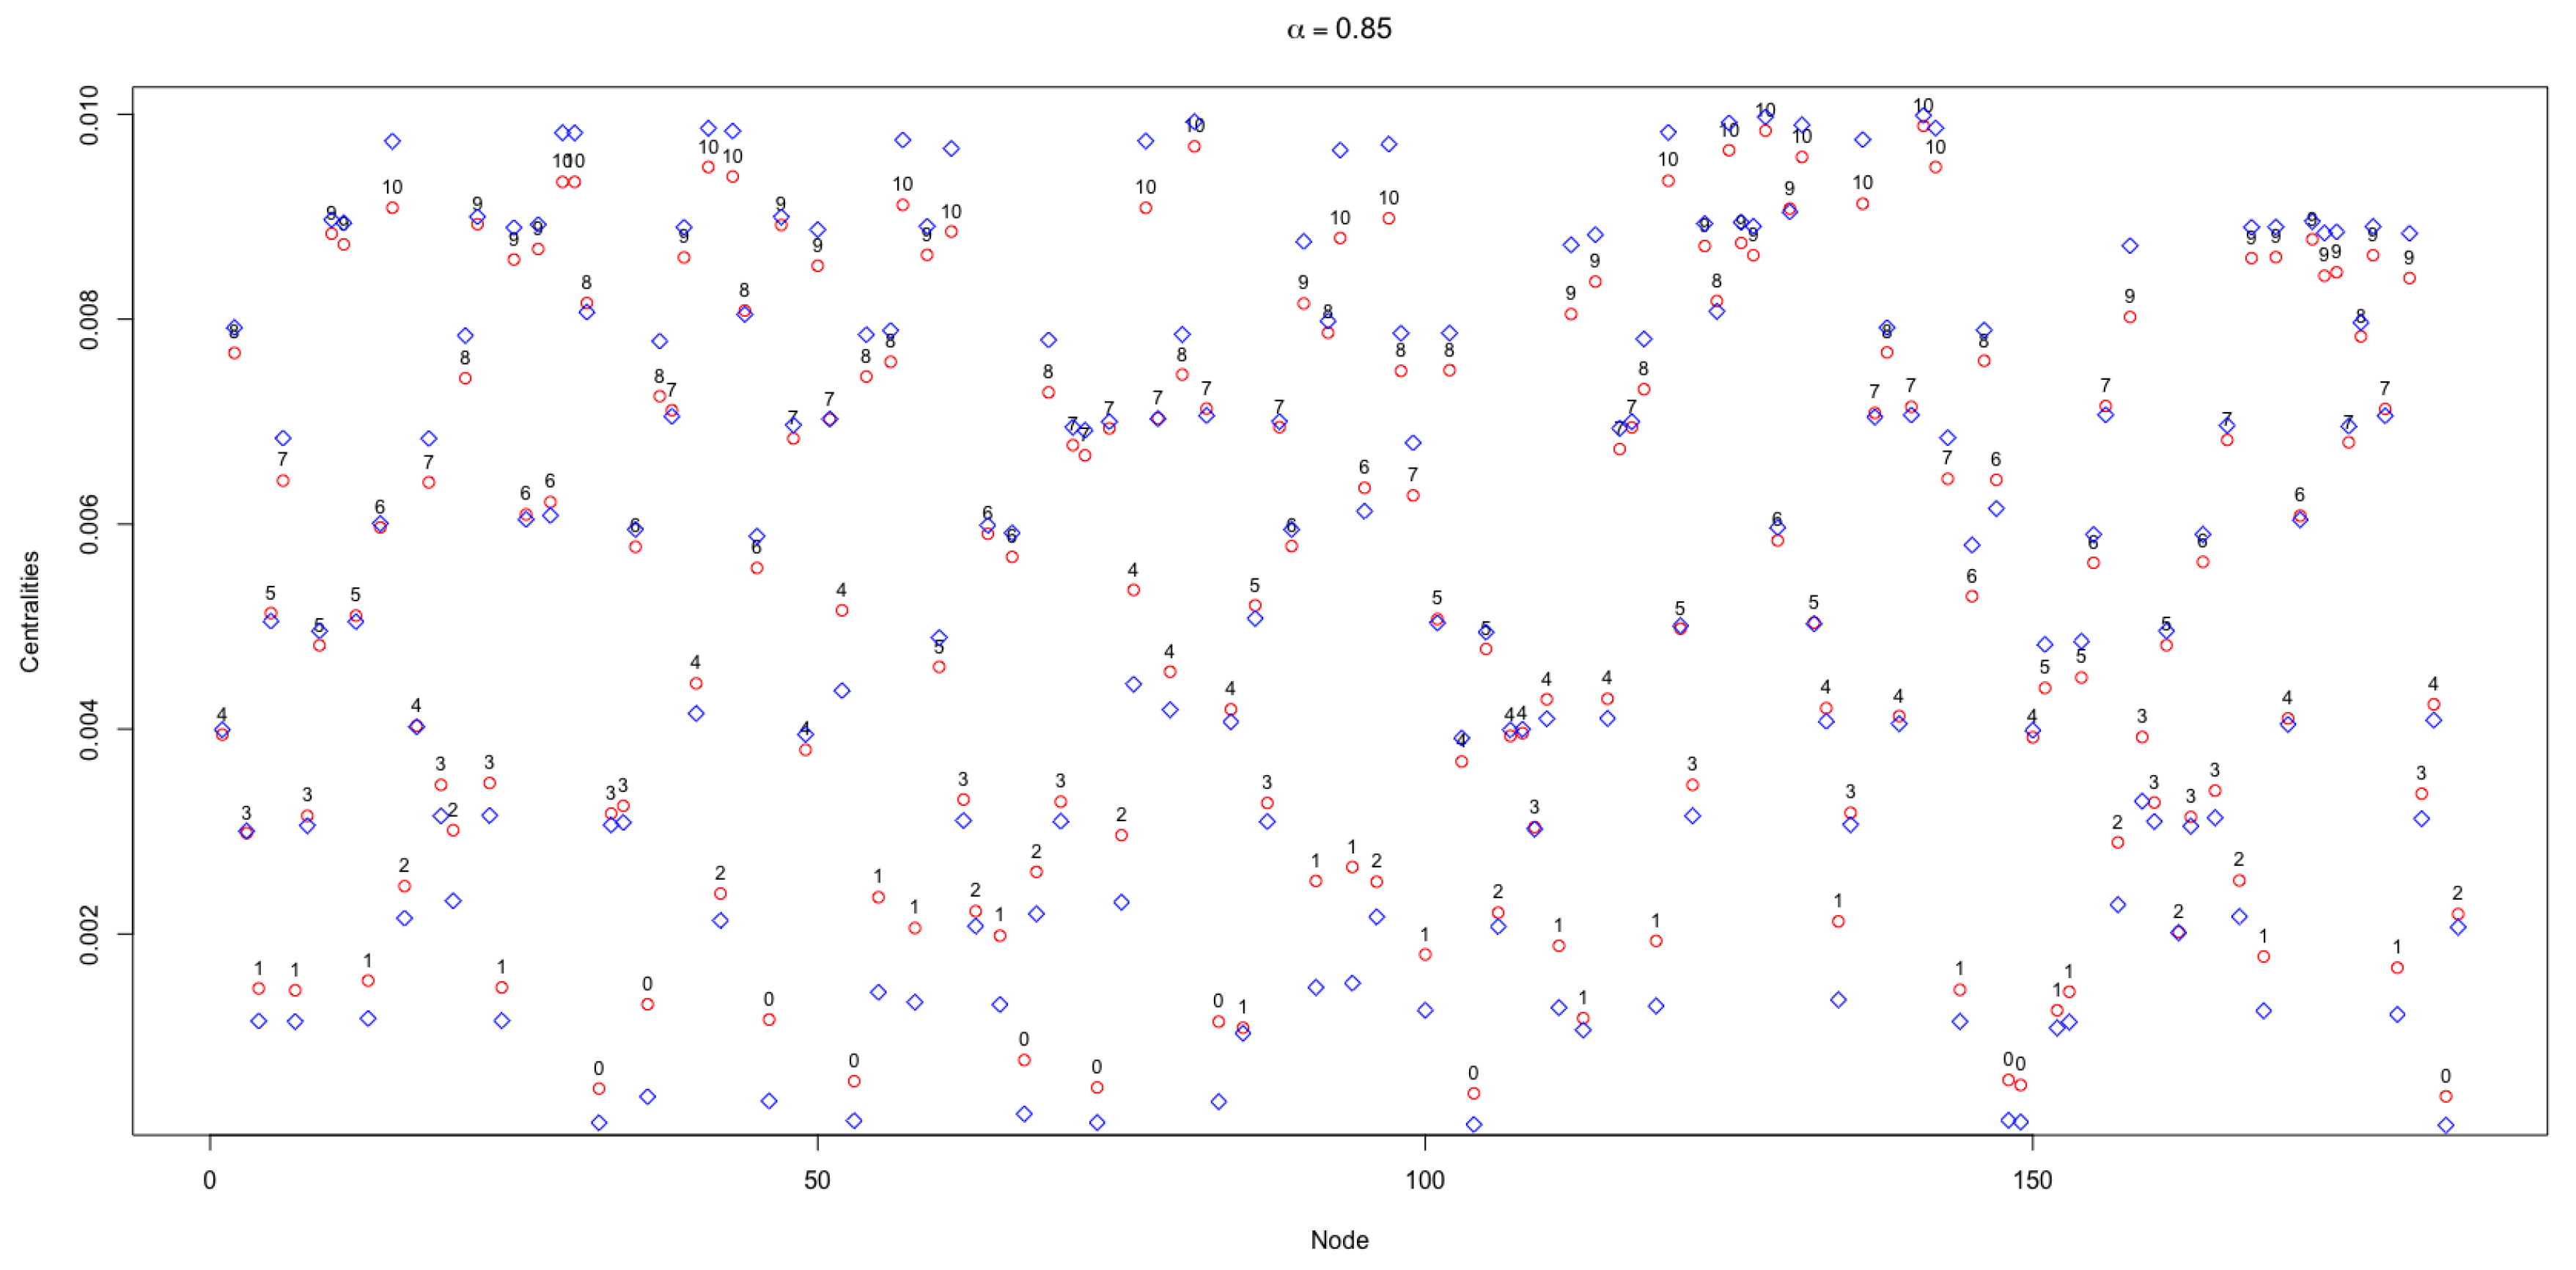
Figure 7 shows the values of the APA and APA2f centralities for the 185 nodes of the urban network object of this study, taking
. The symbols in red colour represent the values of APA, while the symbols in blue colour represent the values of APA2f. In the upper part of the APA centrality the value of the data associated with each node is displayed, which is in a range from 0 to 10.
Likewise, in
Figure 7 several features must be underlined. First, the smallest values of centrality correspond to the nodes that have a very low amount of data, which is reflected in the lower part of the figure. In contrast, in the upper part where the highest values of the centralities are produced, the nodes that have a greater amount of associated data can be found. This is in line with the idea of giving the greatest importance to the data taking, for instance,
.
Another remarkable pattern in this study is that the major differences in the values of the centralities occur in the extreme values, both the maximum and the minimum. For instance, for the nodes that have 0 or 1 data associated, which are those with a lower centrality, it is observed that the greatest differences occur in the APA and APA2f centralities with a well-defined pattern. The values of the APA2f centrality are lower than those of the APA centrality; the same pattern is repeated, that is, the APA2f centrality extend the range of centrality values. However, for the nodes with greater centralities corresponding to the maximum values of the data, APA2f is higher than APA.
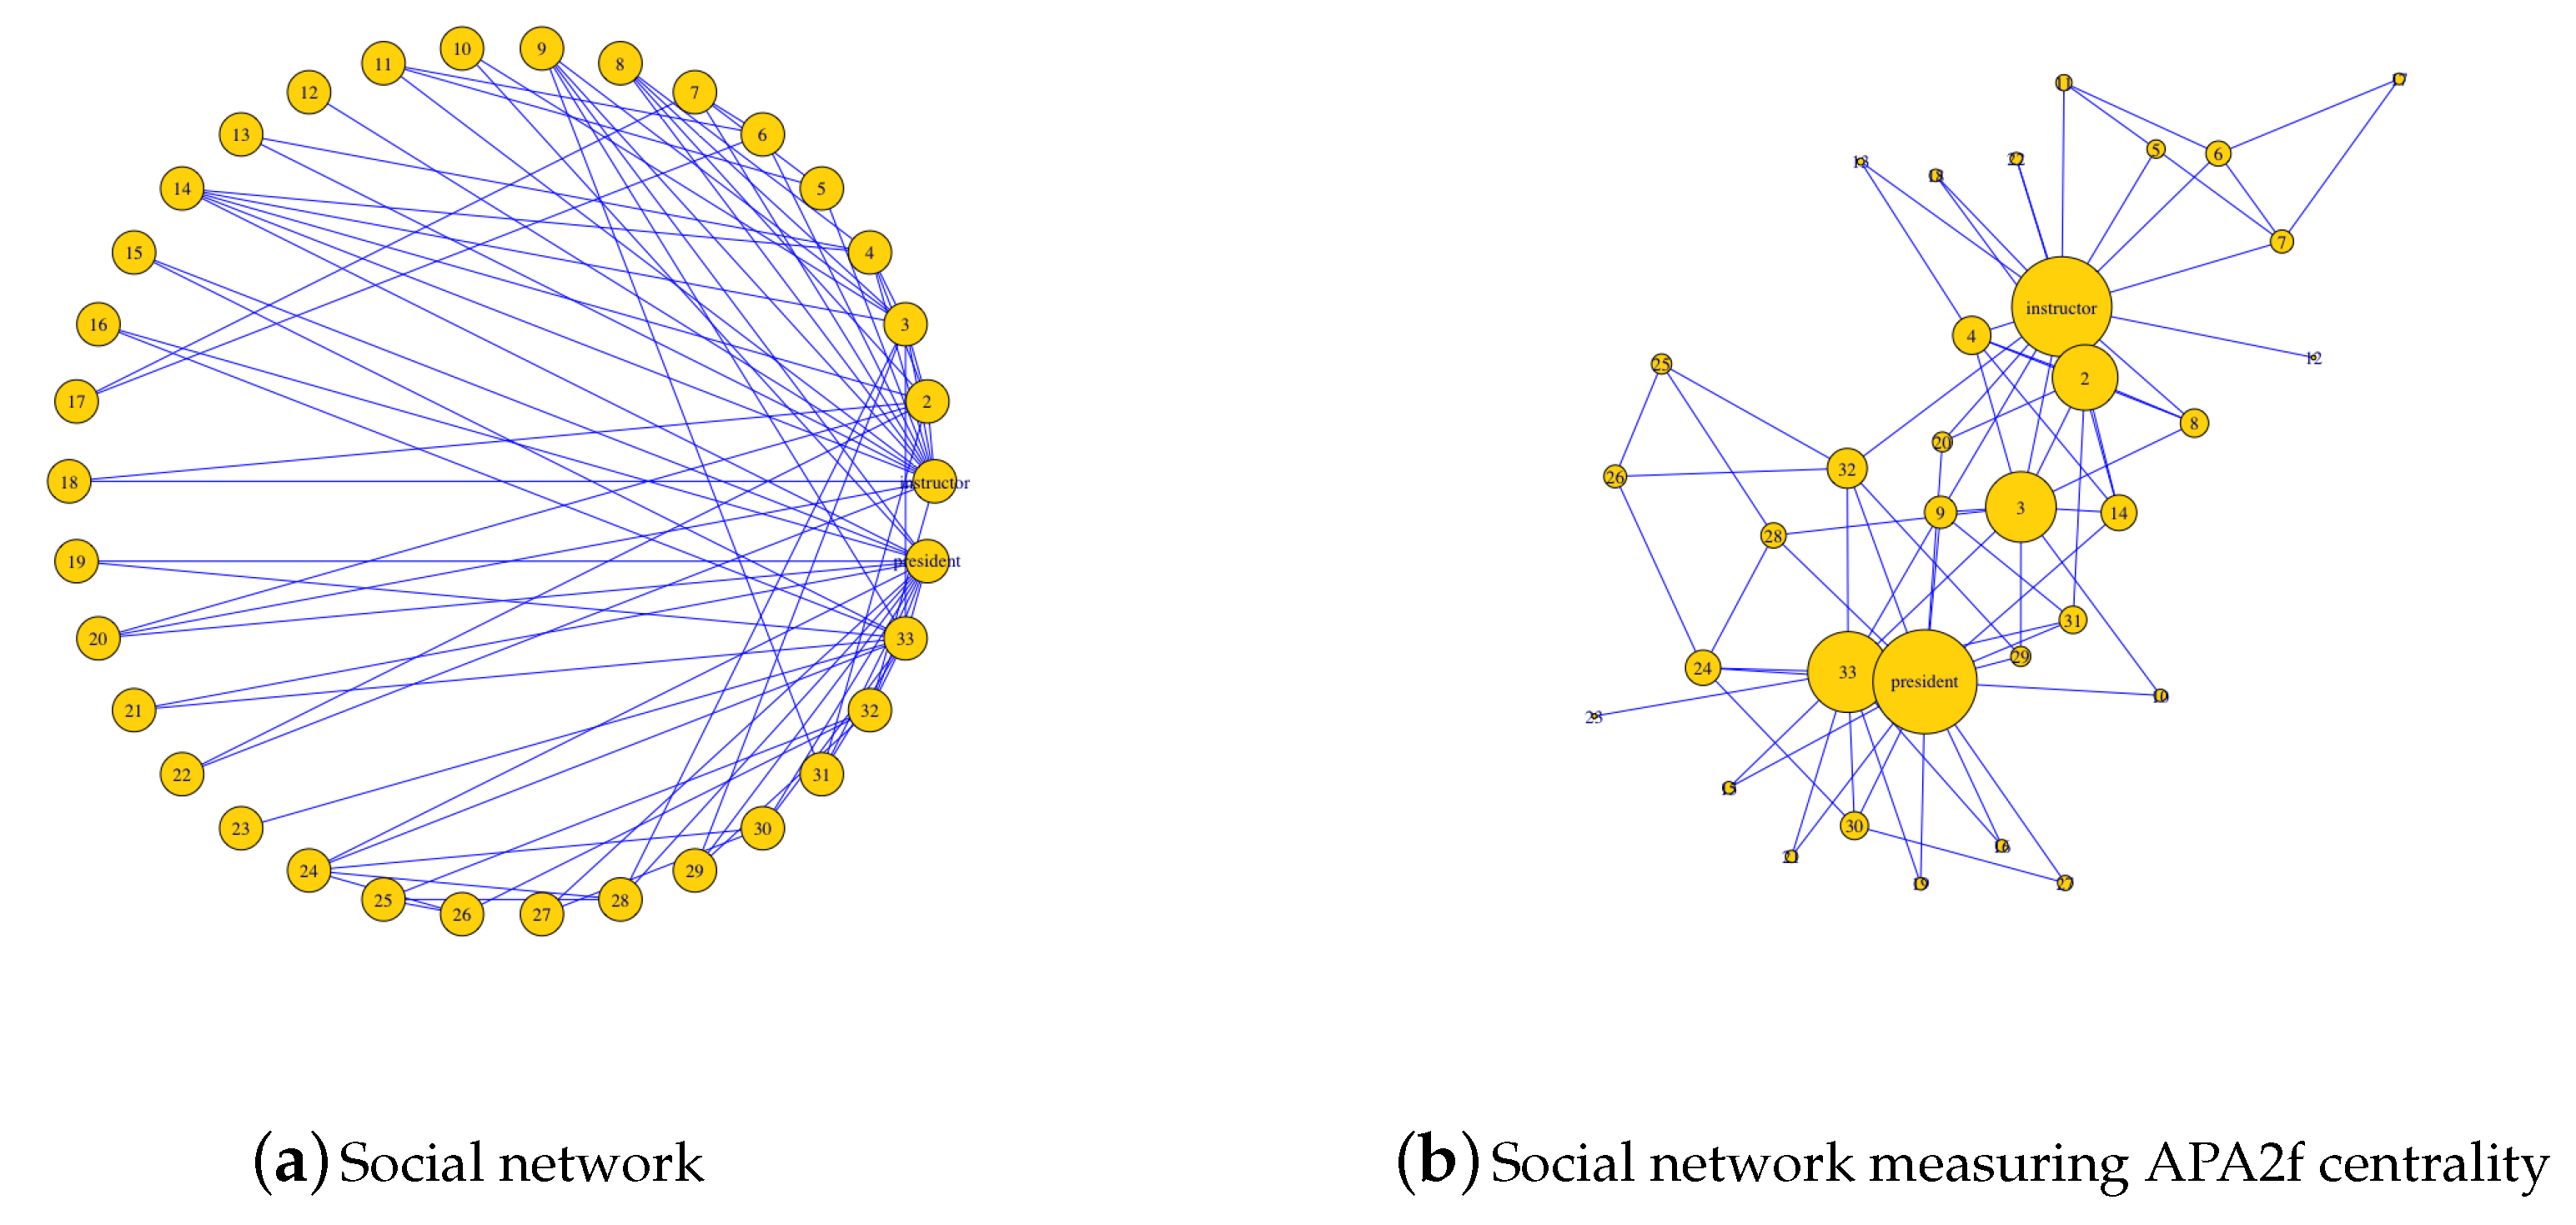
A classic example in network science is the Zachary’s karate club network. It constitutes a well-known social network of a university karate club described in [
37]. The network captures 34 members of a karate club, documenting pairwise links between members who interacted outside the club (see
Figure 8a). During the study of this network by Zachary, a conflict arose between the administrator and instructor, which led to the split of the club into two. Zachary correctly predicted each member’s decision to belong to a certain group except for one member.
The relations between all the members of the club as a social network have been represented in
Figure 8a. As it can be observed, the instructor (node 1) and president (node 34) are those that present a higher degree, that is, they are more connected with the rest of the club members.
To calculate the APA2f centrality a set of data associated with the nodes is required. The data used are fictitious and represent the number of messages that each club member receives on a specific day from the rest of the club members. These data have been generated proportional to the degree of each node, that is, they are in line with the degree of connectivity of each node. Specifically, the data vector used is:
The APA2f centrality has been calculated for this network and the result is the vector:
Notice how the highest values of centrality correspond to the nodes 1 (instructor) and 34 (president), which are the most important people in the club. The centralities of each node have been displayed in
Figure 8b. In this graph, the sizes of the nodes are proportional to the values of their centrality, resulting in the nodes with greater size the instructor and the president. Notice how two differentiated groups are observed in the club, according to the connections that each node has with the two main nodes.
4. Discussion
In this section, a general discussion of the results shown in the previous section by applying the APA2f centrality to different networks is carried out, paying special attention to the main findings and their implications as well as indicating the limitations of the proposal.
4.1. Comparing APA and APA2f
An essential point that must be addressed in the comparison between both measures is that there exists a coherence in the results that they offer when are applied to the same network. When talking about consistency in the results, it should not be understood that they must be exactly the same. The central issue is that APA and APA2f measures offer us a ranking of the network nodes, that is, a classification of the nodes in the network according to its importance within it. Therefore, the comparison should focus on two fundamental issues. On the one hand, the positions of the nodes in both rankings should not differ excessively. On the other hand, the results should not differ markedly because APA2f is based on APA. Therefore, may be interesting to carry out a numerical study about the differences that occur in both centralities when they are applied to graphs of different sizes.
The first objective raised with the comparison of both centralities is to check the coherence in the results obtained by measuring both centralities in any network. The coherence can be demonstrated by checking that both measures present a high correlation, in the sense that high values of one centrality correspond to high values of the other. Obviously, it would be a problem if a certain node were very important according to the APA centrality and irrelevant when the APA2f centrality is considered.
The discussion in the comparison should focus on the exhaustive analysis of the first numerical example of 25 nodes.
Table 1 shows a coherence in the results between the two centralities, from the point of view of the classification of the nodes. The values computed by the two centralities are similar, except in some specific cases that will be analysed later.
Except for minor non-significant variations, the most important nodes are repeated in both centralities. No node with a high APA centrality has a low APA2f centrality and vice versa, the nodes with very low centralities according to the APA2f classification still have a very low centrality applying the APA model. For the validation of this new centrality APA2f, the behaviour of the correlation is very important.
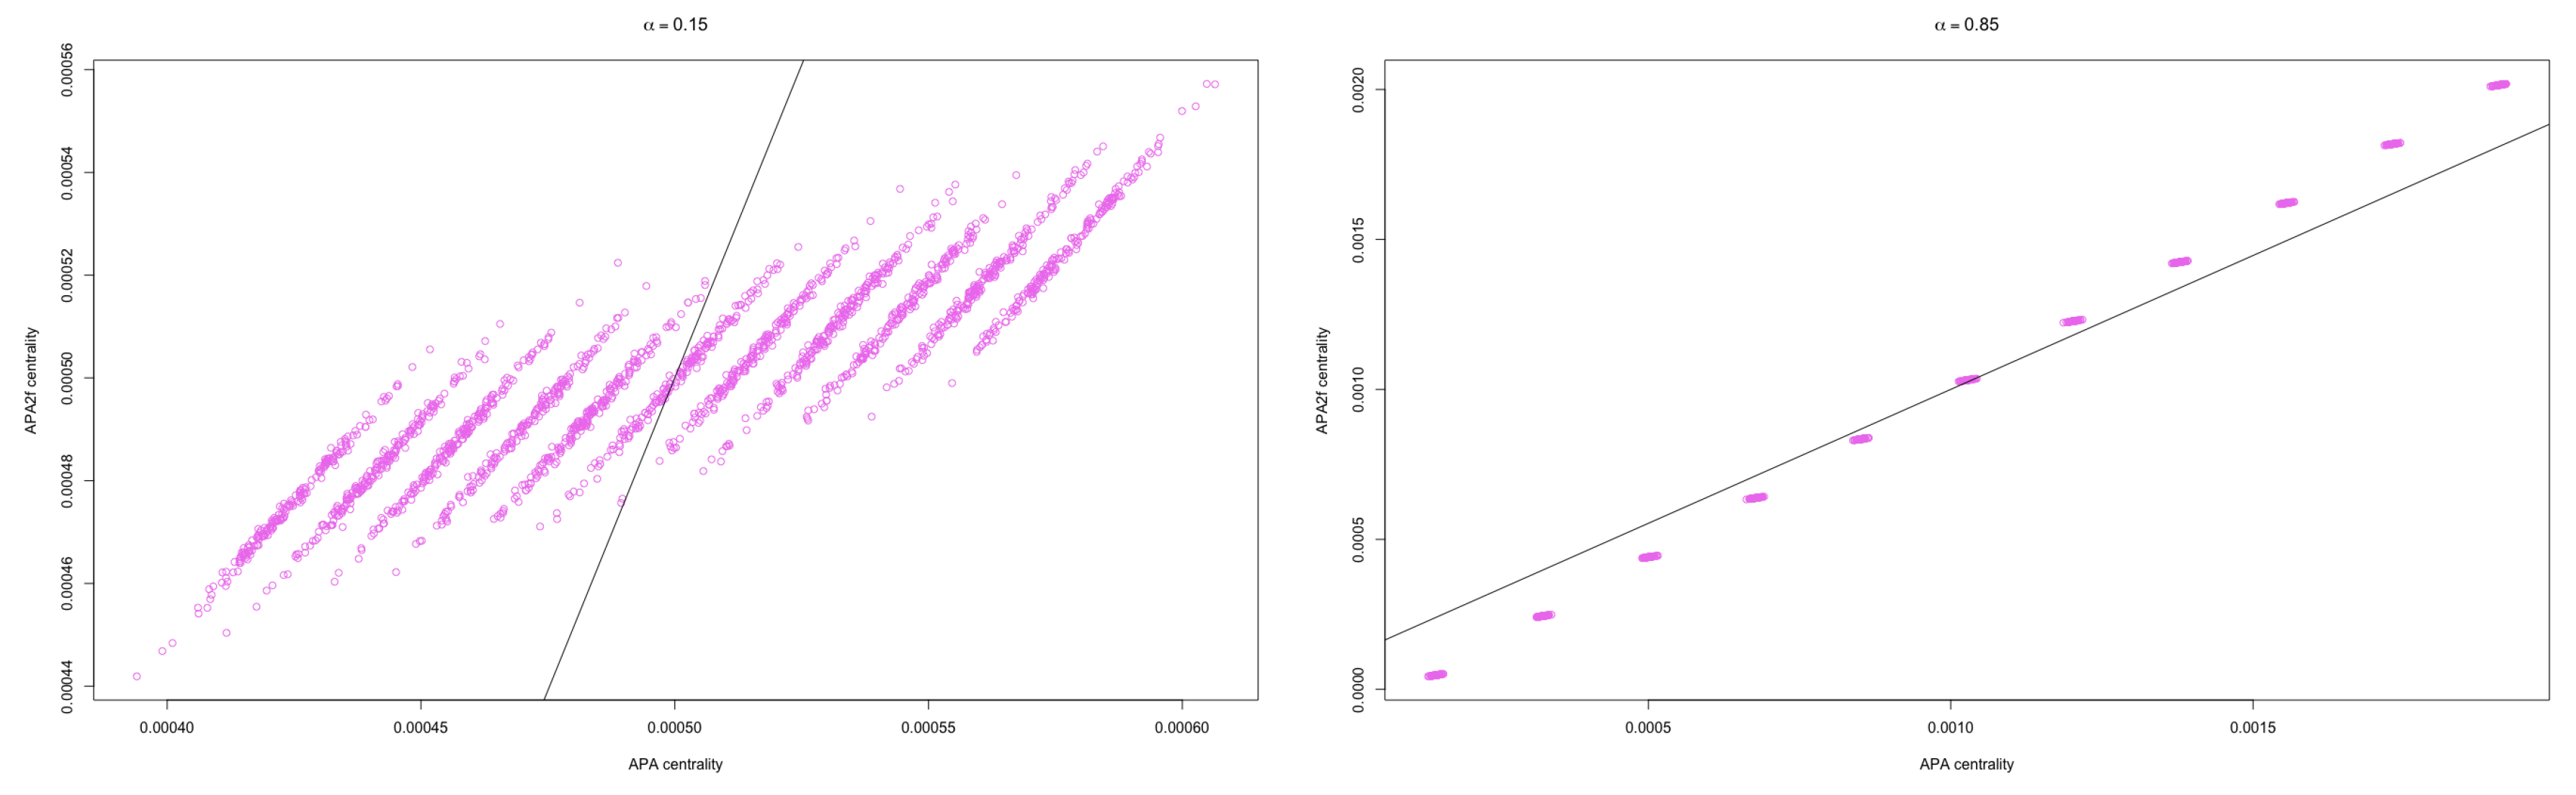
To check the consistency of the results, the Spearman’s rank correlation (denoted by ) is chosen, taking as variables the measures of the centralities APA and APA2f, respectively. Spearman’s correlation is a non-parametric measure of rank correlation, that is, a coefficient that measure the statistical dependence between the rankings of two variables. A perfect Spearman’ correlation will produce a coefficient . Intuitively, the Spearman’s correlation between two variables will be high when observations have a similar or identical rank between the two variables, and low when observations have a dissimilar rank between the two variables.
Some tests calculating the Spearman’s correlation have been developed, taking different values of the
parameter and sizes of the network (see
Table 2).
The results can be summarized in these key points:
The values of the lowest Spearman’s correlation between both variables occurs when , regardless of the size of the matrix; these values are between and .
The correlation when is , which indicates a total correlation between the two centralities.
When , the correlation presents values higher than for any size of the network.
In
Figure 9, the APA versus APA2f Spearman’s correlation for networks randomly generated with 2000 nodes have been displayed, for different values of the parameter:
(on the left) and
(on the right).
The second objective in the comparison of both centralities was to analyse the magnitude of the differences in their values. To perform this task, let us carefully analyse
Figure 3 and
Figure 5, as well as
Table 1. There exist differences in the measures only for exceptional cases, especially when
. However, these differences do not modify substantially the order or classification of the nodes in terms of their importance within the network. This pattern is carefully analysed.
It may be remarked that for
the coincidence in the results offered by both centralities is almost absolute. Analogously, as shown in
Table 1, the first three most important nodes are the same. The differences found in the values of the centrality of these first three nodes are very small, which is not significant in their classification in order of importance.
When the parameter
moves away from the value
, let us notice that the differences in the values of both centralities increase progressively, although the differences are only significant for some nodes. Analysing the cases in which the parameter is kept close to the value
, it is observed that the differences increase in some nodes, although they remain at maximum values that do not exceed
. In
Table 1, the greatest differences in percentage for each value of the parameter have been highlighted in red colour.
Especially significant may be analysing the case when
, where the greatest differences occur. The cases with a highest difference (up to
) occurs when
in nodes
. According to the APA design,
means that the greatest importance to the data present in the network is given. The fact that these maximum differences occur in these nodes has an explanation by observing a pattern common to all of them. This pattern refers to the fact that these nodes do not have assigned data, so they can be considered as particular or singular nodes (especially when the data is given the greatest importance). As can be seen in
Table 1, the next largest difference occurs in node 17, where the difference already drops to
. Note that node 17, the only that has associated 1 data (a very low value) is precisely the next one that presents notable differences.
According to this pattern, the biggest differences in the centralities occur with nodes that do not have data or have very few associated data and, in addition, the alpha parameter is close to 1.
It is important to remember that, although there are significant differences in the values of the centralities, for very specific cases with well-defined patterns, this does not imply an alteration in the classification of the nodes themselves. Analysing the numerical results it can be observed that the APA2f centrality extend the range of values of the measure.
Numerical results carried out with larger networks show us the same pattern that we have described for this example (see
Table 2). The conclusion is that the results do not depend on the size of the matrix, as they are systematically repeated.
Regarding the example of the real urban network, it must be said that the behaviour of APA and APA2f centralities with respect to this real urban network does not differ with the networks studied previously. There exists a total coherence in the values of the centralities and the differences follow a similar pattern to that described for random networks. Again, the minimum differences occur when , that is, when the topology and data are as important in the network. Similarly, the maximum differences are given when (greatest importance to data).
The graph shows how there is a group of nodes whose differences shoot around a concrete and constant value, such as . Analysing the characteristics of this group of nodes, the same pattern as in the example studied is found: they all have 0 data associated. This correspondence is absolute, since there is no other node in the urban network with 0 data associated and that does not experience this maximum value of the difference of centralities. Let us emphasize again that the highest differences in the centrality values do not represent significant changes in the order or classification of the network nodes. Those nodes with maximum differences are also, as expected, the nodes with lower centralities.
Following with the same previous patterns, it is noteworthy that the following values in the differences fall to approximately . Thus, for example, the nodes that have a single data associated, which represents a very low value, are found in the graph in the group that has differences between 30 and 40 percent.
The example of the karate club developed at the end of
Section 3 presents a numerical behaviour similar to that analysed in other examples. The APA2f centrality allows us to establish a classification of the nodes according to their importance within the network. Moreover, the values of the new centrality are coherent with those of the APA centrality, establishing a Spearman’s correlation coefficient of
between both measures.
4.2. The APA2f Centrality
The comparison between the APA and APA2f centralities has allowed us to establish some properties and essential characteristics of the proposed new centrality.
Taking the main characteristics of APA centrality and the idea of understanding PageRank centrality by a two-layers approach, a new centrality is designed that presents the following positive aspects:
It is possible to determine the centrality of a network considering a set of data present in it as determinants when assessing the importance of network nodes.
The model is based, from the mathematical point of view, on the calculation of the dominant eigenvector of an irreducible and stochastic matrix by columns, for which its numerical stability is assured. In addition, the spectral properties of the matrix allow us to use the well-known Power Method for the calculation of the dominant eigenvector.
The numerical results show that the range of values of APA2f centrality increases with respect to the values provided by the APA centrality. Especially, for spatial networks such as the example of the urban network; this represents an advantage in the aspect of the visualization of the network, since it will allow us a graphical representation with greater contrast when carrying out an interpolation of the values and their corresponding colour in the chosen gradient.
The main limitation we can find when working with this centrality is related to the characteristics and size of the
matrix. The APA centrality is based on the construction of a matrix of size
from which we obtain the dominant eigenvector that provides us the classification of the network nodes in order of importance. However, the two-layers approach to the PageRank model involves the construction of a block matrix whose size increases to
. This means that it is necessary to calculate the dominant eigenvector of a matrix double in size as in the case of the original PageRank. Consequently, for very large networks (hundreds of thousands of nodes) the computational requirements can be very high. In this case, a parallelization of the algorithm could be interesting, following the example of Migallón et al. [
26]. However, the scope of application in which our research is developed is that of spatial networks, especially urban networks. This means that the size of networks when we represent cities by primal graphs is not too large (thousands of nodes).
Given that the new centrality is based on APA centrality and inherits from it certain positive characteristics related to numerical stability and the possibility of introducing data in the network, there are two aspects that must be taken into account for assess the use of the APA2f measure against APA. One of these aspects is related to the problem of data visualization. Our scope of application of complex networks focuses on spatial networks, mainly urban networks, where both the data and the positions of the nodes are geolocated. These networks present a limitation when it comes to visually representing centrality. The low degree distribution of the nodes means that the range of values of centrality is low, which hinders their visualization by means of basic interpolation techniques. However, as already mentioned, the APA2f centrality extends that range of values, especially in spatial networks with data. This should improve the final visualization of the network. Even more, it would be interesting to use, only for the visualization of the centrality, the eigenvector obtained directly from the matrix, without normalizing, which will suppose to extend the range of centrality values notably.
Secondly, the centrality APA2f offers us a construction technique that may be used to design and implement new measures of centrality in multilayer networks. This centrality for multilayer networks would continue the initial idea of the APA model to consider networks with data, although the construction technique would be based on the APA2f model. All this is part of our future research lines.
When we consider the scope and possible beneficiaries of a model like the one proposed, the field is very broad and diverse. As an example, let us think about the example of Zachary’s karate club. This network shows the relationships between the people who make up a karate club. Let us analyse the application of the APA2f centrality to this case. The model allows us to establish the importance of the nodes not only in terms of their connections or links but in terms of a set of data that can be diverse and from different sources. In our example, a dataset consisting on the set of messages received by each member of the club in one day has been considered. But it is possible to study their relationships under other perspectives by taking another dataset. Let us use a dataset associated with these members referring to their social or economic position, for instance, and consider the relationships between them in relation to this dataset. Or let us take data from different social networks and study their relationships.
This adaptability to data and the possibility of working with real or virtual data is the great advantage of a model like this. Let us also think about the possibilities that it offers us in terms of simulating the behaviour of the whole network when we make small or large variations in the data. Following with the karate club network, It is arguable that the members in the club in the best economic position relate more to each other? As another example, suppose an urban network and consider the commercial activity developed in the city. Take food stores and supermarkets as dataset. It is possible to study the commercial activity of the city from these data. However, it is also possible to perform simulations by modifying the dataset. For instance, let us introduce a new supermarket in a geolocated position in the city and study how the commercial network is affected by this new data.
5. Conclusions
Everyday life of most people is characterised by the use of common or compatible technology for a wide range of personal, social, educational and business activities, and by the ability to transmit, receive and exchange digital data rapidly between places irrespective of distance. Therefore, if something defines our current society, it is the amount of data that is produced. This means that most of the complex networks that are studied or analysed are linked in an inseparable way to some type of data. This motivates the need to have measures of centrality to evaluate the importance of the nodes of a network so that they consider the inclusion of the data in it and its importance in the calculation of it.
Based on the APA centrality capable of measuring the importance of the nodes in a network with data following the idea of importance that applies the well-known PageRank centrality, we design and implement a new centrality measure APA2f that incorporates the idea of understanding the PageRank model as two-layers, that is, the physical or topological layer and the teleportation layer. In our case, we replace the teleportation layer with the layer where the data associated with the network are distributed.
The numerical results and experiments carried out with networks of different types and sizes make it possible to verify the coherence of APA2f with respect to the APA original, in the sense that the classifications of nodes in order of importance offered by both measures are similar. Given that the model has its origin in the PageRank vector concept, the alpha parameter that is inherited from this model now allows us to control the importance that is given in the calculation of the centrality to the two layers separately, that is, we can determine the importance of network connections and the influence of data itself simply by varying this parameter. A detailed study is performed for different .
The numerical results also show that the APA2f centrality extends the range of values of APA for all the cases studied. Due to this numeric characteristic, from the point of view of visualization, APA2f allows us to carry out a clearer and more precise visualization of the networks following any of the usual techniques of interpolation. Another positive aspect of APA2f is that it also allows us to understand any network with data as a network composed of two separated layers, so there is a possibility of extension to multilayer networks.


