1. Introduction
The station-free bike sharing system (BSS), also known as the free-floating or fourth generation BSS, is a new type of public bike system that has been widely deployed in China since 2017 and expanded to other countries. In this system, bikes can be selected using private apps and parked in the appropriate places. Comparing the traditional station-based BBS, the station-free BSS can expand the bike sharing service with lower cost as the high initial capital investment required for the docking stations is not needed. Due to the freedom and convenience the BSS provides, it has attracted a large number of consumers requiring “last mile” transportation.
However, rapid growth has vastly outpaced the immediate demand and overwhelmed Chinese cities, where infrastructures and regulations were not prepared to handle a sudden flood of millions of shared bikes [
1]. In many cities, adequate parking facilities for bikes are not available, city officials lack the regulation experience for this mode of transportation, and normal social behaviors have not been established [
2]. It is very common to have more than one operating company for the station-free BSS in a city. From an operational perspective, the most important goal is to occupy the market, which is why many companies would prefer to provide more bikes and exceed the demand [
3]. On the other hand, large bike fleets are associated with a waste of resources because many bikes would remain idle for long periods, making the system inefficient.
In response to these problems, more and more Chinese cities such as Shanghai, Hangzhou, Guangzhou, Shenzhen, have banned the addition of further shared bikes [
4]. A series of strict regulations for bike share providers are being implemented in China and European countries, including orderly parking, quality and timely maintenance of the bikes, license system for operators and fleet size control [
5,
6]. However, a fundamental unsolved problem is determining how many station-free bikes are sufficient to effectively meet the needs of users?
The Bike Sharing Planning Guide provides guidelines for the fleet size of a station-based BSS, which are 10–16 stations per km
2, 10–30 bicycles for every 1000 residents within coverage area, and 202.5 docking spaces for every bicycle [
7]. However, they are for the station-based BSS, not the station free BBS. Moreover, these quantities are rough indications and mainly depend on the characteristics of city built-environment, such as land use, population density, and road conditions.
To determine the optimal fleet size and distribution of station-free BBS, this paper proposes a heuristic bike optimization algorithm (HBOA) considering the efficiency of bike cycling. It can be an objective basis for city related departments to issue the total control policy and be applied to design the layout of bikes in small-scale spatial units to improve the system’s efficiency.
2. Literature Review
In past decades, many studies have focused on three main issues related to public bike systems with docking stations: the spatial structure of a city [
8,
9,
10,
11], the inflow and outflow of vehicles at each station [
12,
13,
14], and the rebalancing of the vehicles among stations [
15,
16,
17,
18]. In a station-based BSS, the supply of the vehicles must be compatible with the scale of the fixed stations. Once the construction of the stations is complete, the system is difficult to change. Therefore, extensive research on station-based BSSs has focused on the locations and capacities of stations to optimize the efficiency of these systems [
19,
20,
21,
22].
Station-free BSSs completely differ from station-based BSSs. The characteristics of a station-free BSS allow the system scale to be enlarged by providing many vehicles without station capacity constraints. Because vehicle parking is scattered and the spatial distribution is changing all the time, the demand for rebalancing might increase in some cases, and predictions of potential imbalances are relatively complex. There are no predetermined stations in these systems, so scheduling schemes are often unclear, even if the real-time parking distribution is known. Furthermore, sometimes relocation occurs based on spur-of-the-moment changes without following a specific strategy [
23].
Most research on relocation in station-free BSSs has extended the ideas and methods applied to stationed-based BSSs, and studies have focused on the effects of urban features [
24,
25], spatiotemporal patterns of biking behavior [
26,
27], and relocation or rebalancing of shared bikes [
28,
29,
30,
31]. For example, by setting virtual traffic zones, each traffic area is treated as a bike sharing station, and the first distribution and relocation scheme of the BSS are designed according to the demand model combined with the vehicle outflows and inflows in the traffic zone. Some studies have proposed algorithms to achieve efficient relocation strategies for stationed-based BSSs from both static and dynamic perspectives [
32,
33]. Other studies used OD matrix data from bike sharing companies to analyze and simulate bike sharing travel patterns [
34]. In another study, the demand was forecasted with deep learning methods to predict the gap between the inflow and outflow of sharing bike trips at a TAZ [
35]. These studies based on virtual stations have helped simplify the analysis process, but they fail to take full advantage of the unique use characteristics of free-floating BSSs to a large extent. First, due to the randomness of parking with no docking stations, it is difficult to set a fixed TAZ for relocation. In the division of virtual traffic zones, zones that are too large may not reflect the reality of operation, and zones that are too small will make relocation complicated. Second, a very important difference between a stationed-based BSS and station-free BSS is that the chain of travel can more easily occur at a smaller scale because of the spontaneous usage in the station-free BSS.
Due to the large number and usage frequency of shared bikes, the randomness of shared bikes movement and spacing is high. From the perspective of complex systems, the behaviors of users can be regarded as a self-organizing process. On the one hand, the hidden reasons behind user behaviors are worth studying compared to the inherent system randomness. On the other hand, it is important to identify which factors in the complex system are critical to the self-organizing process. For example, Chen et al. simulated the interactions between supply and demand based on agent-based modeling and suggested that the key aspects of the sustainable development of the bicycle-sharing market are twofold: the reliability of the supply must be improved, and the uncertainty in the demand must be reduced. Standardizing the distribution of shared bikes and fixing their locations could solve the disorder issue associated with excessive supply [
36]. Vazifeh et al. proposed a solution to address the minimum fleet-size problem at the urban scale for the general case of taxi trips based on the demand mobility [
37]. This study combined applied mathematics and graph algorithms from computer science field and transformed the minimum fleet problem into a minimum path coverage problem based on the directed graphs, which led to breakthroughs in operational efficiency. If the chain of travel is considered, it is possible to optimize and simplify the relocation of bikes and improve the efficiency of the station-free BSS. However, unlike taxis, the principle of shared bikes is that individuals can use bikes “as-needed” by finding the surrounding bikes instead of dispatching vehicles on demand. Taxi drivers can actively choose the optimal route, but a shared bike must be selected by a user according to the location and parking time and is controlled by the user.
Therefore, based on the construction of a shared bike trip chain with actual riding data for a certain period of time, this paper develops a heuristic algorithm to determine the optimal demand for public bikes with little operation intervention required. This method is then applied for multi-company cycling data analysis in the megacity of Shenzhen, China. The results indicate that the algorithm can reveal the mobility patterns of shared bikes and provide useful information for shared bikes to improve the use efficiency at the city scale.
3. Methodology
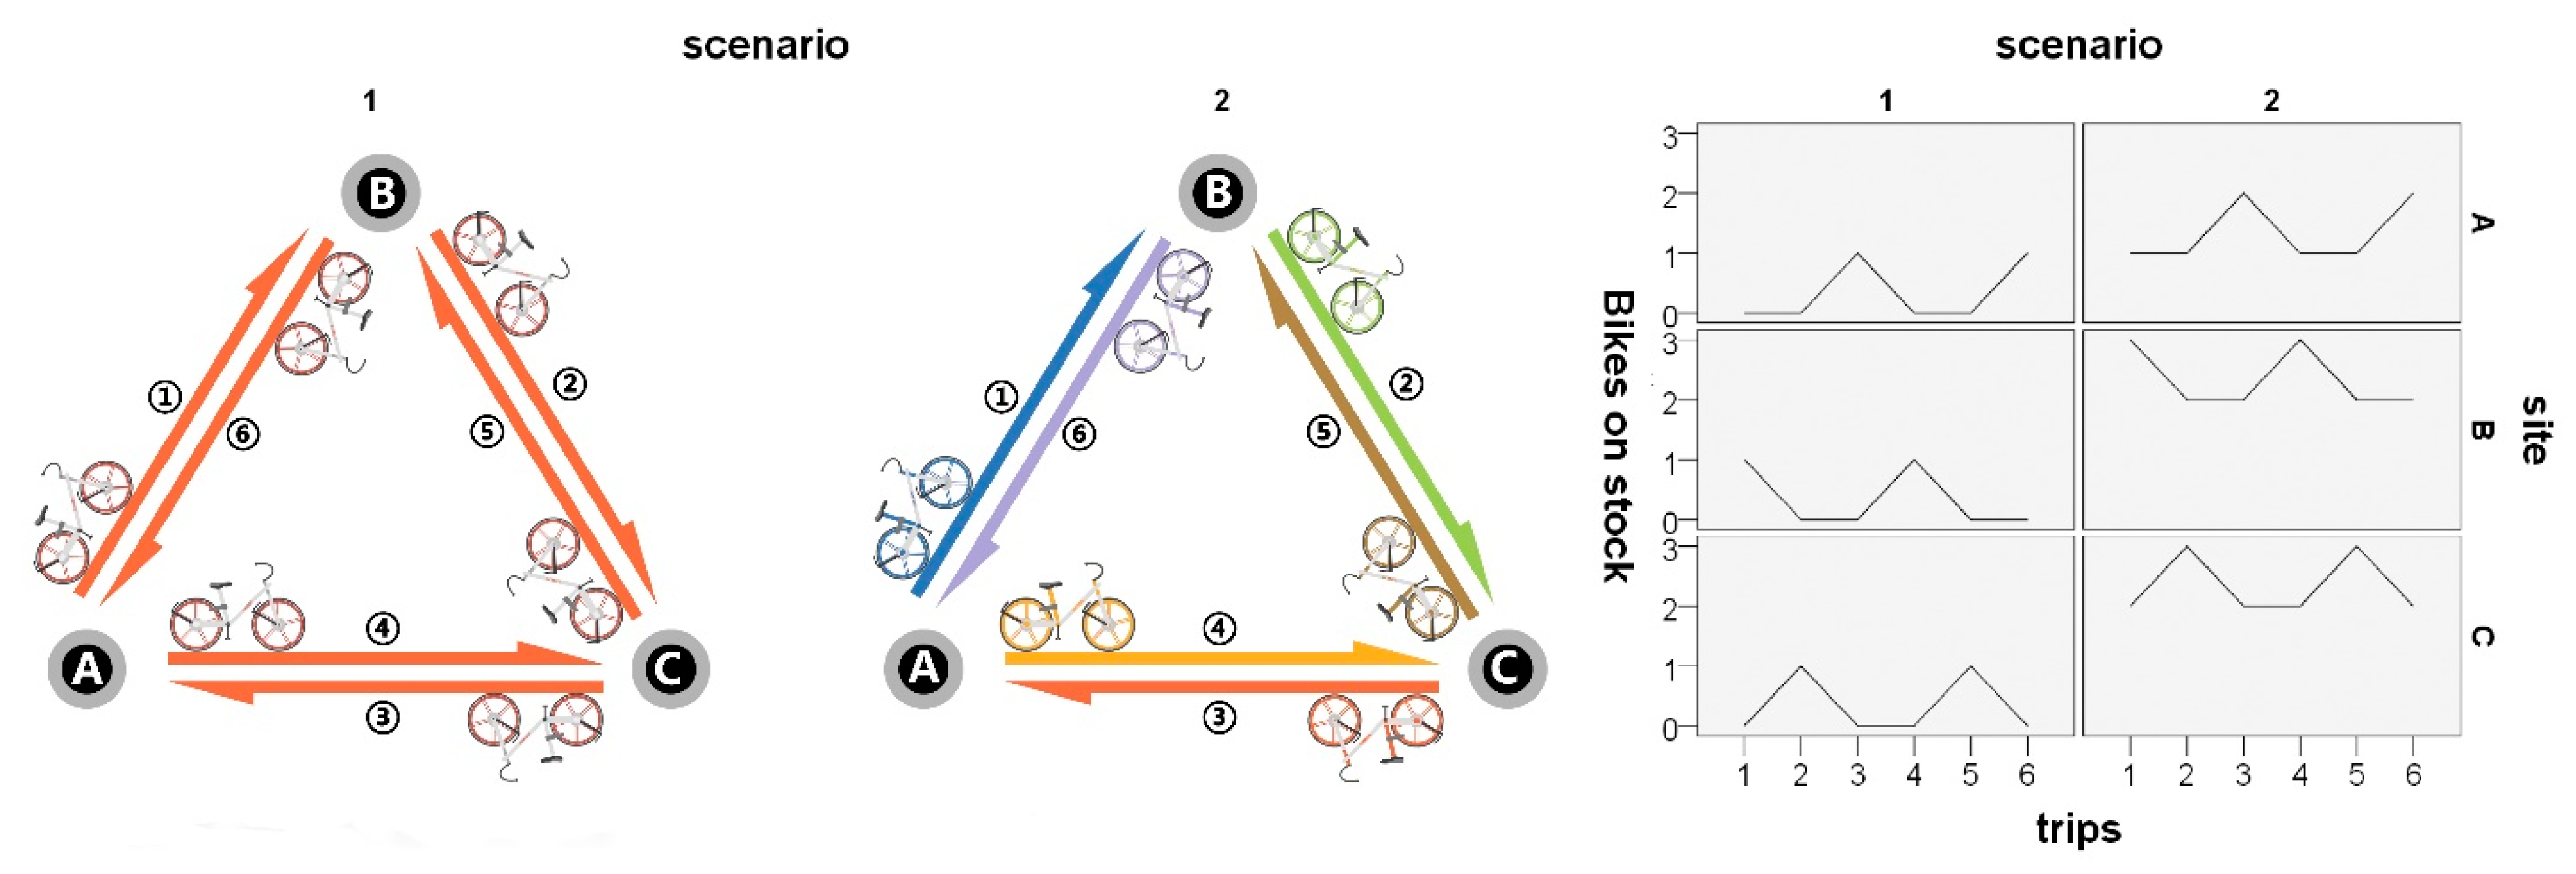
Similar to the solution for the minimum fleet-size problem, the purpose of this study is to improve the operational efficiency of a shared bike system by constructing a shared bike trip chain. In areas with high cycling requirements, it is not always necessary to supply more bikes. If the number of cycling-in bikes is always greater than the number of cycling-out bikes, then it means that the demand does not exceed the supply. The more bikes there are in a system, the greater the inefficiency of the shared bikes. As shown in
Figure 1, there are six consecutive cycling trips among the three sites. In the ideal scenario, one bike at site A is sufficient for all trips. However, in the oversupply scenario, for example, two bikes are required at each site, and the six trips may be completed by up to six different bikes. However, no matter how many different bikes are being used, the bike stock at site A is always greater than 1, and the numbers of bikes at sites B and C are always greater than 2. When the volume of shared bikes is greater than the cycling requirement, bikes will remain unused, and road space will be wasted. Within a certain time interval and space range, the number of bikes in stock is always greater than zero, regardless of the possibility of damage to the bikes; therefore, the supply is greater than the demand, and there are no more bikes potentially needed. The key to improving the self-organization process of cycling is to fix the initial positions of the shared bikes at the optimal positions.
Fixed boundaries are not suitable for shared bikes because of the random nature of user behavior and the unrestricted parking of station-free bikes. Therefore, we propose a heuristic bike optimization algorithm (HBOA). The core concept of the HBOA is to use the fewest number of bikes to meet all cycling requirements. The principle of using shared bikes is “first come, first served”. If the ending position of one trip is close to the starting position of another trip, the ending time of the last trip and the starting time of the next trip can be continuous in time; thus, in theory, the same bike can be used for both trips.
To obtain a more reasonable number of optimized bikes, we set the minimum time interval for cycling requirements between the ending time of the last trip and the starting time of next trip to 10 min, and the maximum Euclidean distance between the ending position of the last trip and the starting position of the next trip is 100 m. That is, after completing the last trip, the optimized bike would service the closest trip at that time within 100 m of the ending position. Finally, the number of optimized bikes could be considered the ideal delivery scale of shared bikes in meeting all cycling requirements. The initial positions of these bikes can also be considered an optimal configuration for delivering or dispatching the shared bikes.
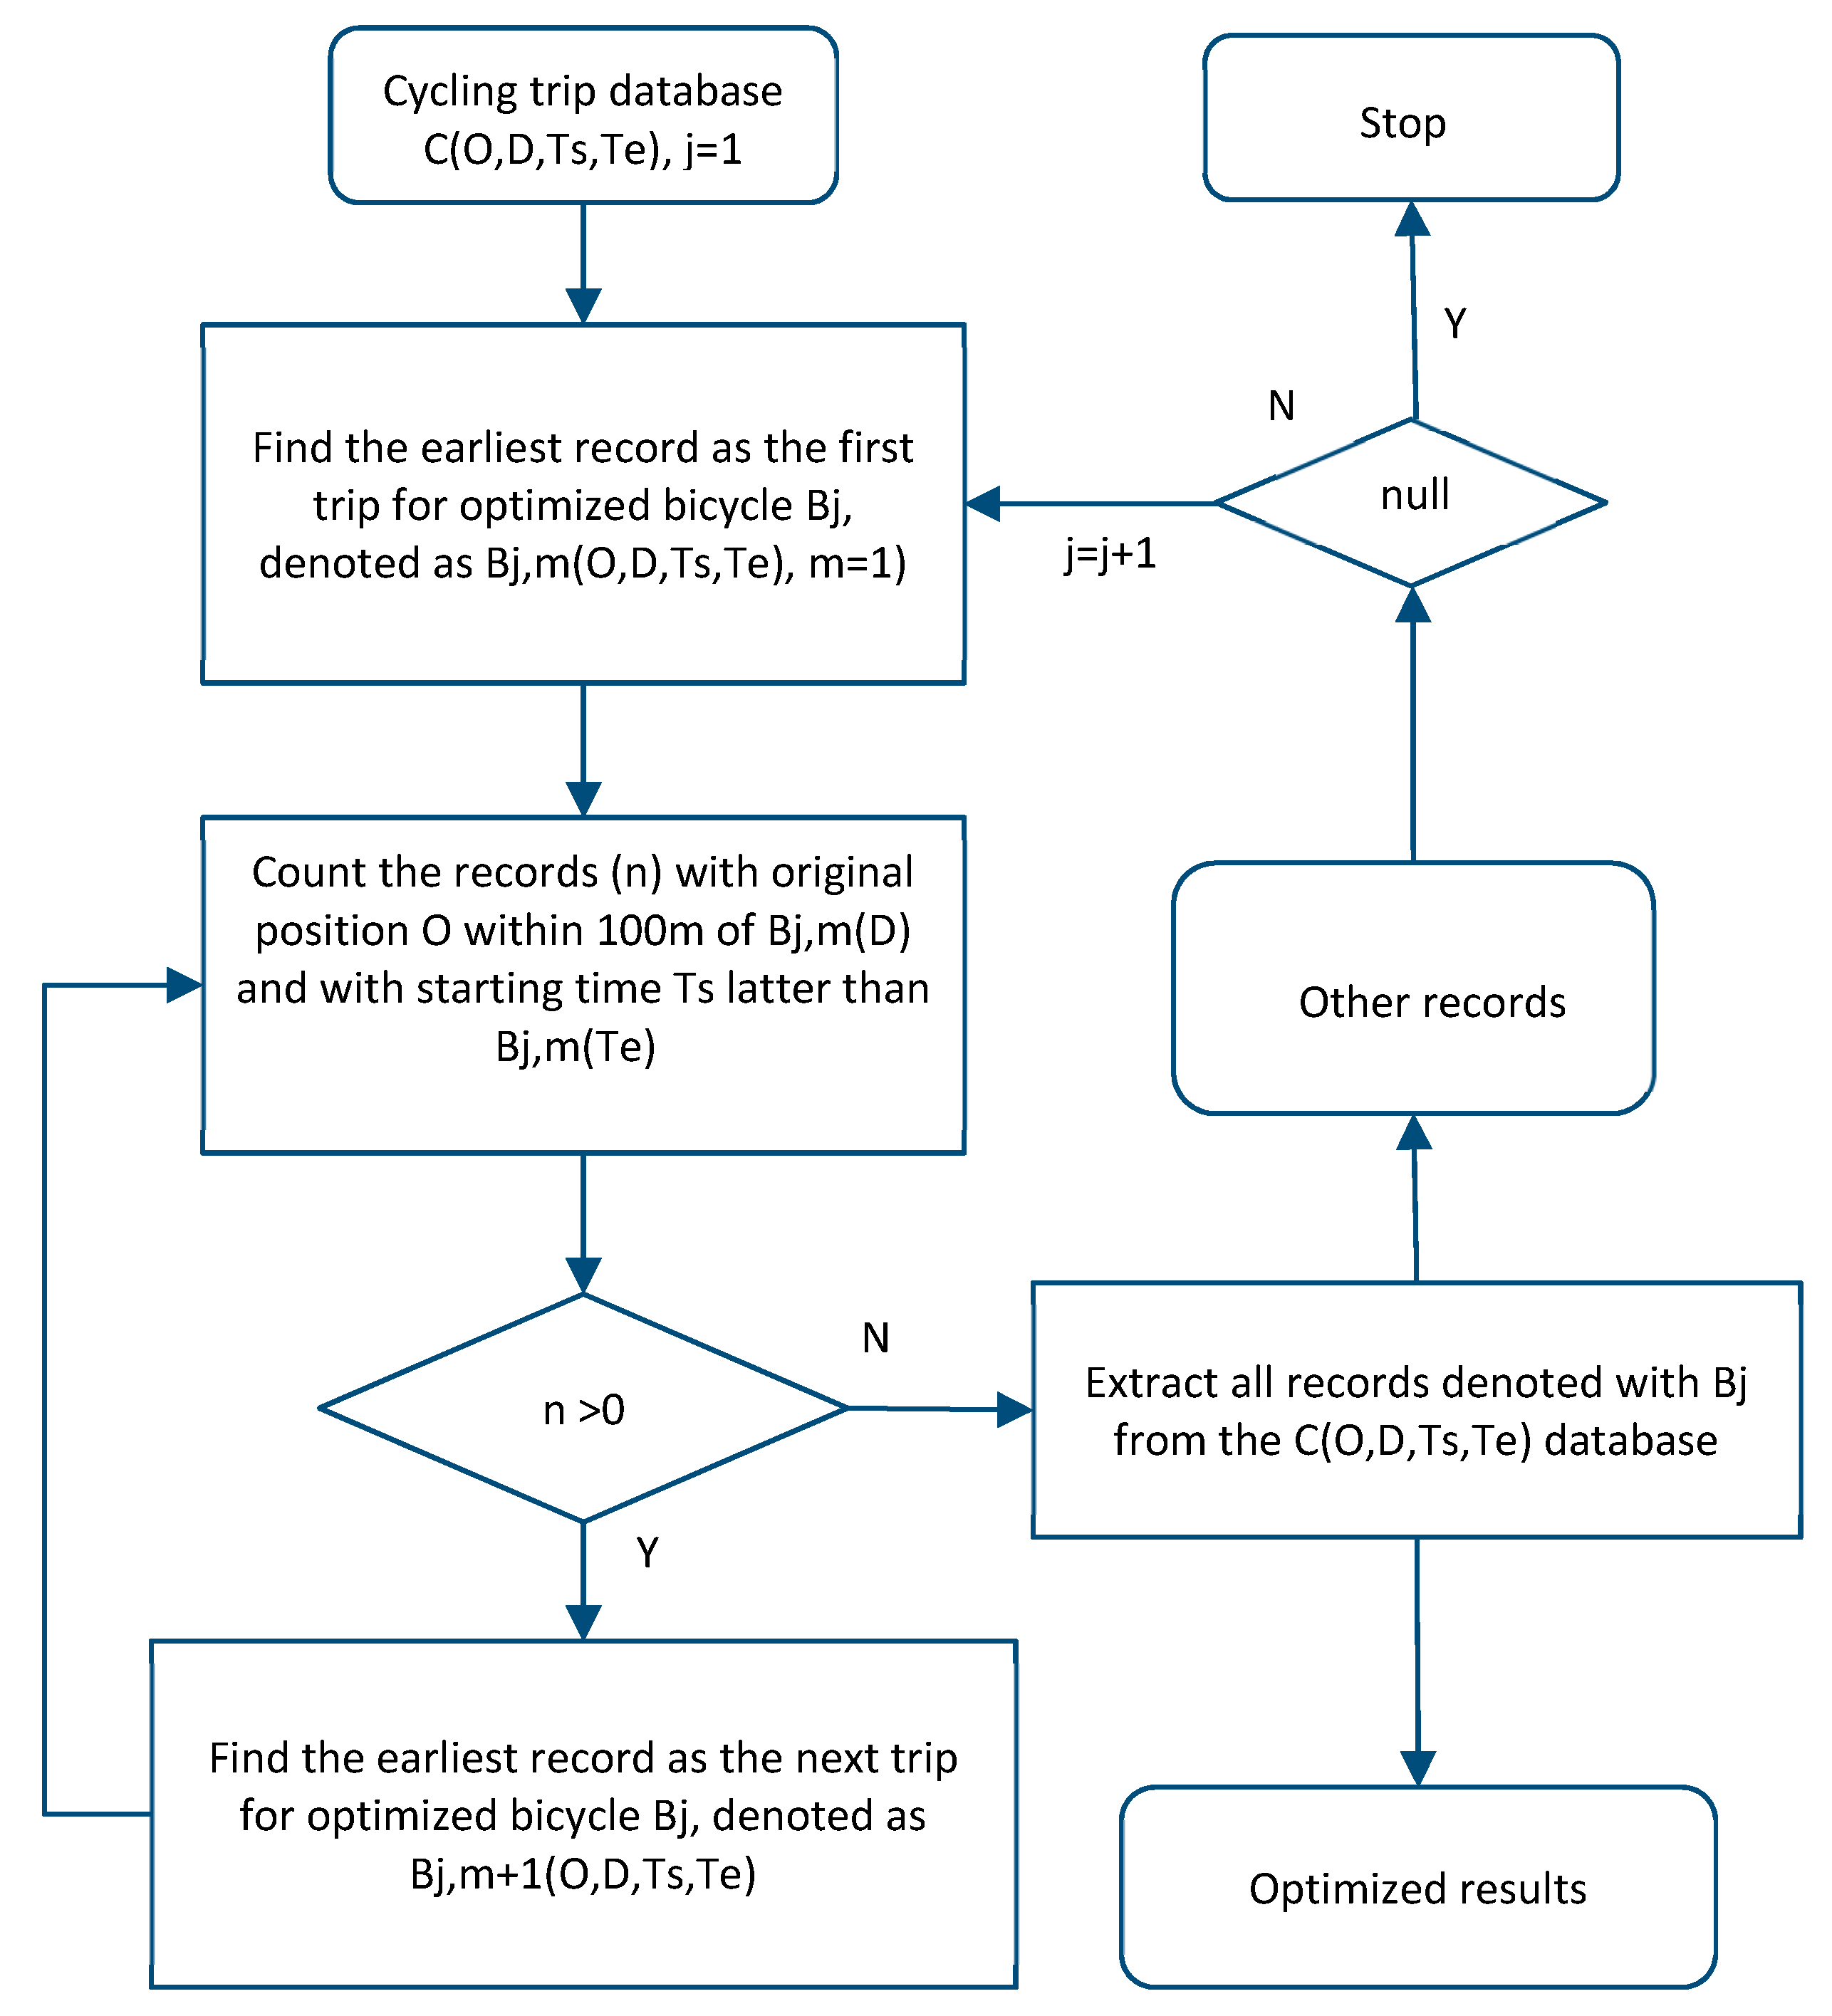
The calculation process of the HBOA is shown in
Figure 2. We set all the data from valid cycling trips as data set C, including O, D, Ts, and Te information. O is the original position of trip Ci, D is the destination position of trip Ci, Ts is the starting time of trip Ci, and Te is the ending time of trip Ci. First, one of the earliest cycling trips is selected randomly and recorded as the first trip for optimized bike Bj,m(O, D, Ts, Te), where (j = 1, m = 1). Then, the trips within 100 m of Bj,m(D) are searched, and the closest trip at given starting time is identified as the next trip Bj, m + 1. This process continues until it is impossible to identify another trip for this optimized bike. The search for the earliest cycling trips in the unmarked cycling data set continues. The first trip for a new optimized bike is identified as Bj,m(O, D, Ts, Te), where (j = j + 1, m = 1). All subsequent trips are also analyzed. The process of searching is repeated until each trip is marked as one trip for an optimized bike. Obviously, the result of this algorithm is not unique. However, considering the size of the data set and the aim of the HOBA, the result does not need to be the best solution to improve the usage efficiency of shared bikes. The time-space distribution characteristics of these optimized bikes can be used as a configuration reference for initial bike delivery.
4. Study Area and Data Preprocessing
Shenzhen, the youngest megacity in China, was founded only 40 years ago. By the end of 2017, the city had 12.52 million people in an area of 1997.27 km
2 [
38]. According to a report, there were approximately 10 shared bike companies in Shenzhen with approximately 890 thousand shared bikes in the market in August 2017. In September, a new shared bike policy was released by the Shenzhen government that suspended the launch of new shared bike systems in the city [
39].
Through the API ports of shared bike apps, the positions of all vacant bikes are given in real time. Therefore, we scanned the positions of vacant bikes for two companies, Ofo and Mobike, which account for more than 80% of the shared bike market. Limited by the app client, we only obtained 2 days of scanning data from 6–7 May 2018. These dates fall on a Sunday and Monday, representing non-working and working days. The weather conditions were similar on these two days, with sporadic light rain. We found approximately 306 thousand different Mobike bikes and 434 thousand Ofo bikes by scanning the entire city, accounting for over 80% of the total number of shared bikes.
Because it took approximately ten minutes to scan the entire city, the time interval of scanning was ten minutes. By comparing the positions of the vacant bikes at different times, it can be determined whether a bike moved, and the origin-destination positions and trip times can be obtained. Correspondingly, we can obtain the Euclidean distance and speed of these trips. However, there may be two types of data errors. The first type of error is equipment error. According to an actual test, the error of the GPS for a vacant bike returned to the same position can reach approximately 100 m. The second type of error is inference error. For example, some shared bike companies use motor vehicles to manually dispatch bikes, and the speed of cycling trips is too fast in these cases. Additionally, it is also possible that some bikes are missed during the scanning process, resulting in a long trip time. Therefore, data cleaning was performed for the original data. First, trips with Euclidean distances less than 200 m were considered invalid, or walking was considered a more reasonable alternative. Second, trips with an average speed greater than 25 km/h may involve the manual dispatching of bikes by motor vehicles instead of normal cycling. Other trips with low speeds are indistinguishable and were retained for use in the HBOA. After cleaning, only 640 thousand available movements remained, and the average usage time of each bike was less than one. Nearly 340 thousand shared bikes did not move in two days.
In addition, two types of databases were used in this paper, as shown in
Figure 3. One database includes the transportation routes in Shenzhen 2018, as well as the metro stations and bus stations. The other database includes building information from 2015, such as outline and usage information for residential buildings, urban village buildings, industrial buildings, commercial buildings, official buildings, and others. Among these buildings, urban village buildings are a special type of low-cost residential building in Shenzhen. These data will help us further analyze the temporal and spatial distribution characteristics of optimized bike use. Urban area in Shenzhen has gradually transformed from a belt shape within the original Special Economic Zone (including Luohu, Futian, Nanshan and Yantian districts) into an outward radial shaped city in the past three decades, which, to some extent, deviates a multi-center development pattern [
40]. Six central areas are selected to compare with the spatial distribution of shared bikes. Three of them are public service centers, including Baoan center area, Futian center area and Luohu center area. Two commercial centers are Nanshan center area and Huaqiang center area. One is an official employment center, High-tech center area in Nanshan district.
5. Results and Discussion
5.1. Optimized and Actual Bike Availability
The HBAO indicated that only 137,216 bikes were needed to complete all valid trips on 6 May 2018, and 154,625 bikes were needed on 7 May 2018. The average usage number of an optimized bike on each day was 4.6 and 4.2. Overall, less than 1/5 of all shared bikes were used.
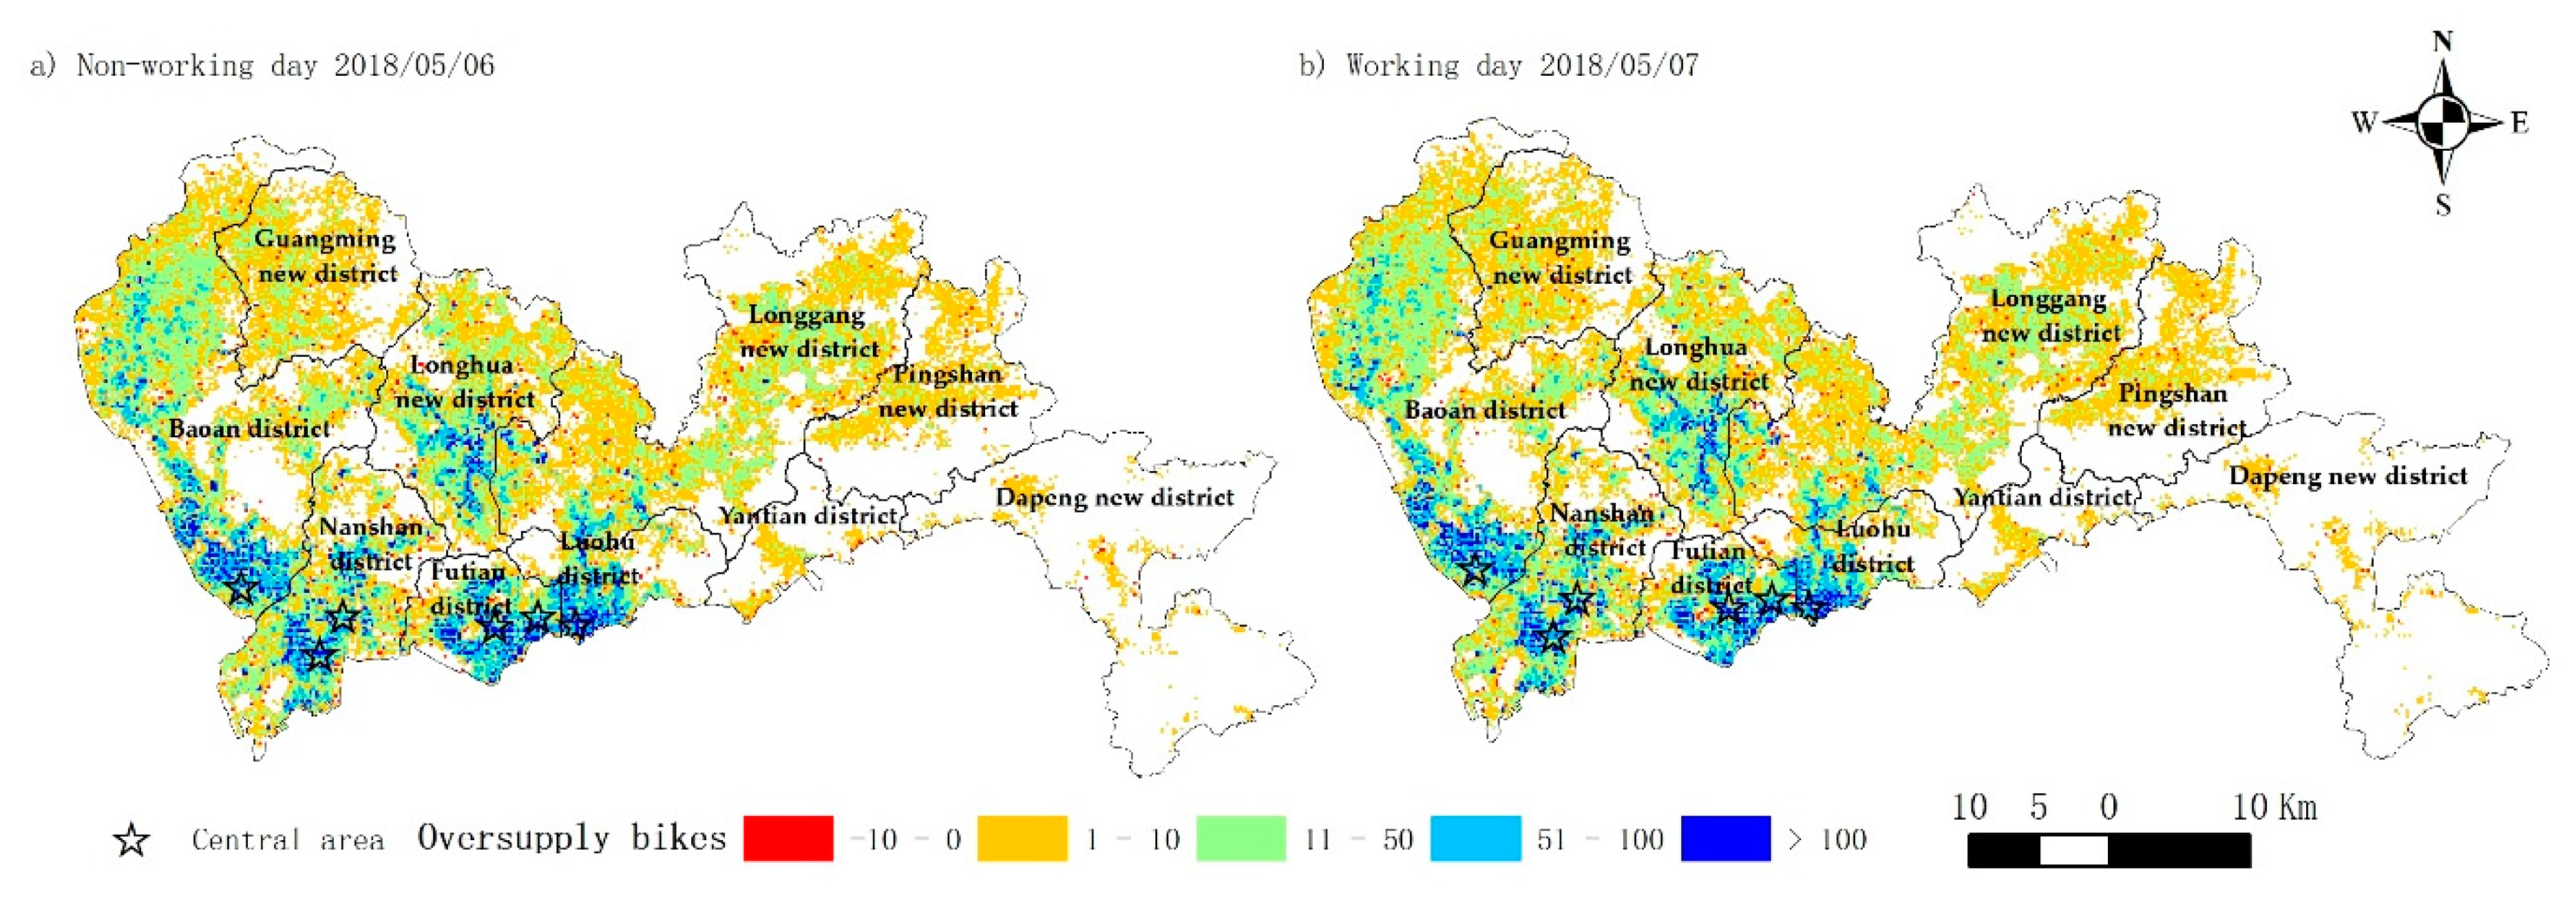
As shown in
Figure 4, there are bikes in almost every land unit (200 m * 200 m) in Shenzhen built environment. However, over 99% of these units, the actual number of bikes is higher than the number of optimized bikes, which indicates that the supply is higher than the demand. In particular, the number of bikes in the central area exceeds the number of optimized bikes by more than 100.
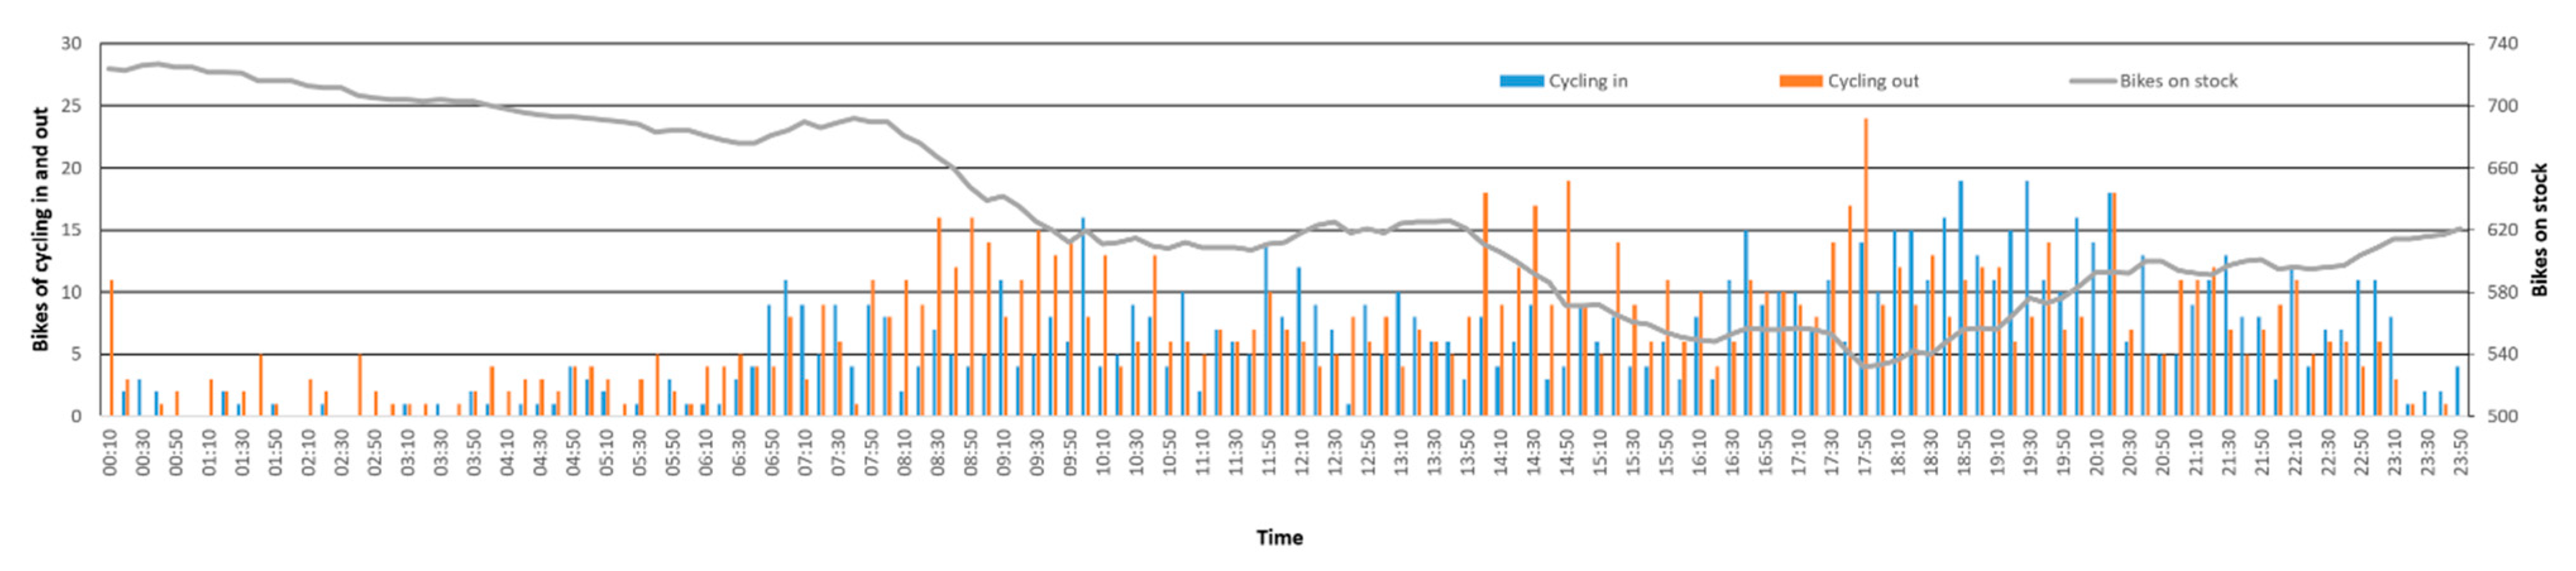
We took all the exits of the Houhai metro station as an example, Houhai metro station is located the central area of Nanshan district of Shenzhen, which is surrounded by commercial and residential buildings, and close to some popular public spaces, such as Shenzhen Bay Stadium, Shenzhen Bay Park and Shenzhen Talent Park. We counted the shared bikes within 100 m of the metro station exits which cycling in or out every 10 min on 6 May 2018. There were 883 cycling-in and 997 cycling-out bikes. The initial number of shared bikes around this station was 735 at 0:00 a.m., and there were always more than 500 bikes available in 24 h. As shown in
Figure 5, this station had a serious oversupply issue.
The result of the HOBA showed that only 219 optimized bikes are needed around Houhai station exits. The idling of a large number of bikes is a waste of resources and road space. High cycling requirements do not necessarily correspond to the need for more bikes, especially in areas where the cycling requirements re self-balanced by user activities. Shared bicycle companies tend to delivery more bikes in high cycling requirement area to occupy the market. However, for areas with a higher frequency of use, if the cycling in and out could reach equilibrium, more delivery means less efficiency. It is more worthwhile to see where the bikes heading to these areas come from. As mentioned earlier, the key to improving the self-organization process of cycling is to fix the initial positions of the shared bikes at the optimal positions. Therefore, we would compare the high requirements space of cycling and the spatial distribution of optimized bikes’ initial positions in the next section.
5.2. Spatial Requirements of Cycling and Spatial Distribution of Optimized Bikes’ Initial Positions
We used the kernel density estimation to compare the requirement space and the ideal supply space of shared bikes. We defined the origin positions distribution of all valid trips as the requirement space of cycling, and the initial positions distribution of all optimized bikes as the ideal space of supply demand. As shown in
Figure 6, we find that the requirement spaces are similar on working days and non-working days, and the correlation coefficient was 0.942 (
p < 0.001). The supplying demand spaces optimized bikes on working days and non-working days has a high correlation coefficient too (0.862,
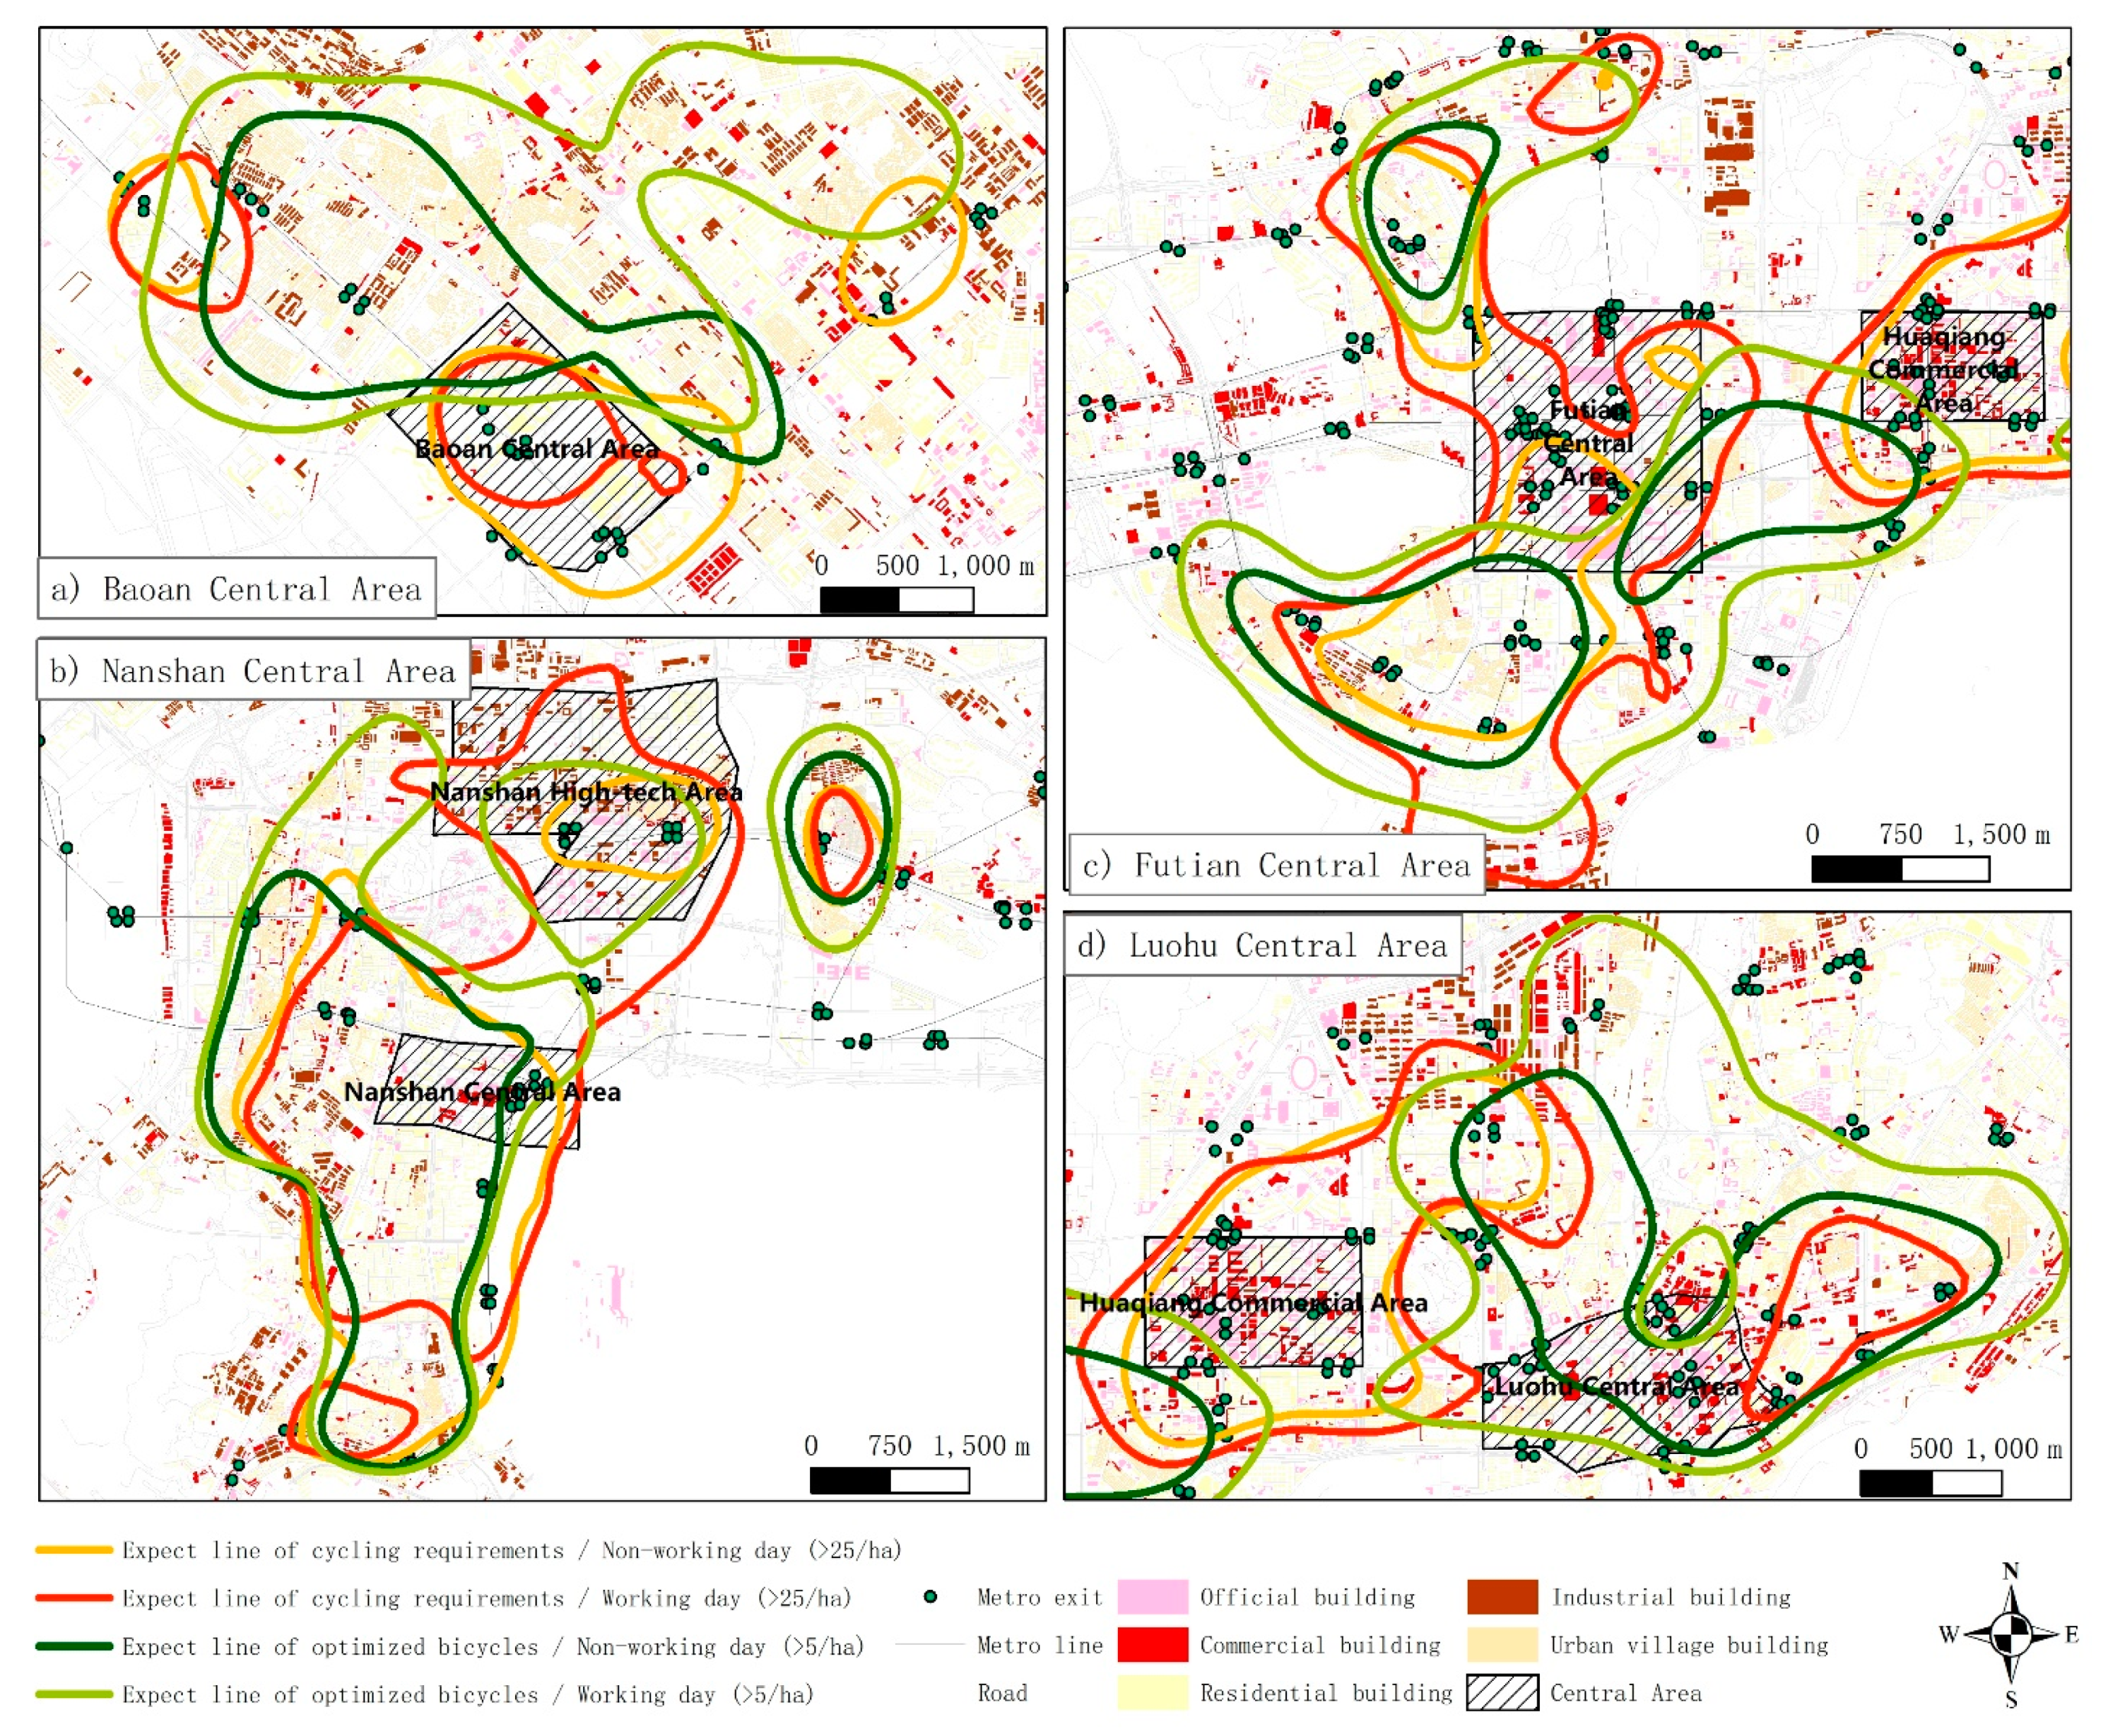
p < 0.001). We picked the areas with expected values of greater than 25 uses per hectare as high requirement areas and those with expected values of greater than 5 bikes per hectare as the high supply areas for optimized bikes. It can be seen that these areas are consistent or adjacent to the central areas of each district in Shenzhen.
Overlay analysis is applied for these spaces, including overlays of the transportation and building data (
Figure 7). The overlay results suggest that: (1) the area with high requirement for cycling is more consistent with the central areas of the city. Except for the central area of Luohu, other high requirement areas basically contain the central areas; (2) most of areas with high requirement for cycling are not necessarily consistent with high supply-demand space, but adjacent, such as Baoan and Futian central areas; (3) There are also some very stable areas with high demand and supply both in working or non-working days, especially in Nanshan district. It is easy to understand that the central areas often bring a lot of cycling requirements because of its high vitality. And due to its non-residential properties and attractive features to the surrounding area, a large number of cycling in bikes could meet the cycling requirements without the need of a large supply of shared bikes. One of the distinguishing features of the Nanshan District, which is different from other central areas, is that the number of metro stations and lines through it are less than those of other districts. But it is still difficult to explain why some areas have higher stability of supply demand than others. And these areas should be our most noteworthy space, because the initial bikes in these areas would result in higher efficiency. In the next section, we will focus on the initial position of each optimized bike and its surrounding traffic and the built environment.
5.3. The Temporal and Spatial Characteristics of the Initial Position of Each Optimized Bike
In this section, the temporal and spatial characteristics of the initial positions of all optimized bikes are discussed. There are two main reasons for assigning an optimized bike: the departure time of cycling out is relatively early, or the numbers of cycling in bikes couldn’t meet the demand for cycling out. Therefore, finding the initial departure time and its surrounding built environment of these optimized bikes could help us better understand their supply needs. In order to easy statistics, we set a simple proximity priority for optimized bikes. First of all, the optimized bikes closest to the public transport facility are considered as demand of transfer. Among the remaining optimized bikes, public transportation is preferred too. Metro connections are assumed for those bikes within 100 m of all metro station exits. Bus connections are assumed for those within 50 m of all bus stations. Finally, the closest building to each remaining unused bike is assumed to be related to the use of that bike.
As shown in
Table 1, about 45% of optimized bikes are closest to residential buildings and urban village buildings. This is because most of the first trip in one day starts from the residence. What’s interesting is that the area nearby industrial buildings also a significant need for optimized bikes. Although the metro stations have higher cycling requirements as mentioned by other literature [
41], only 5% of optimized bikes is needed within 100 m of all metro stations. The previous analysis in
Section 5.1 also proved it.
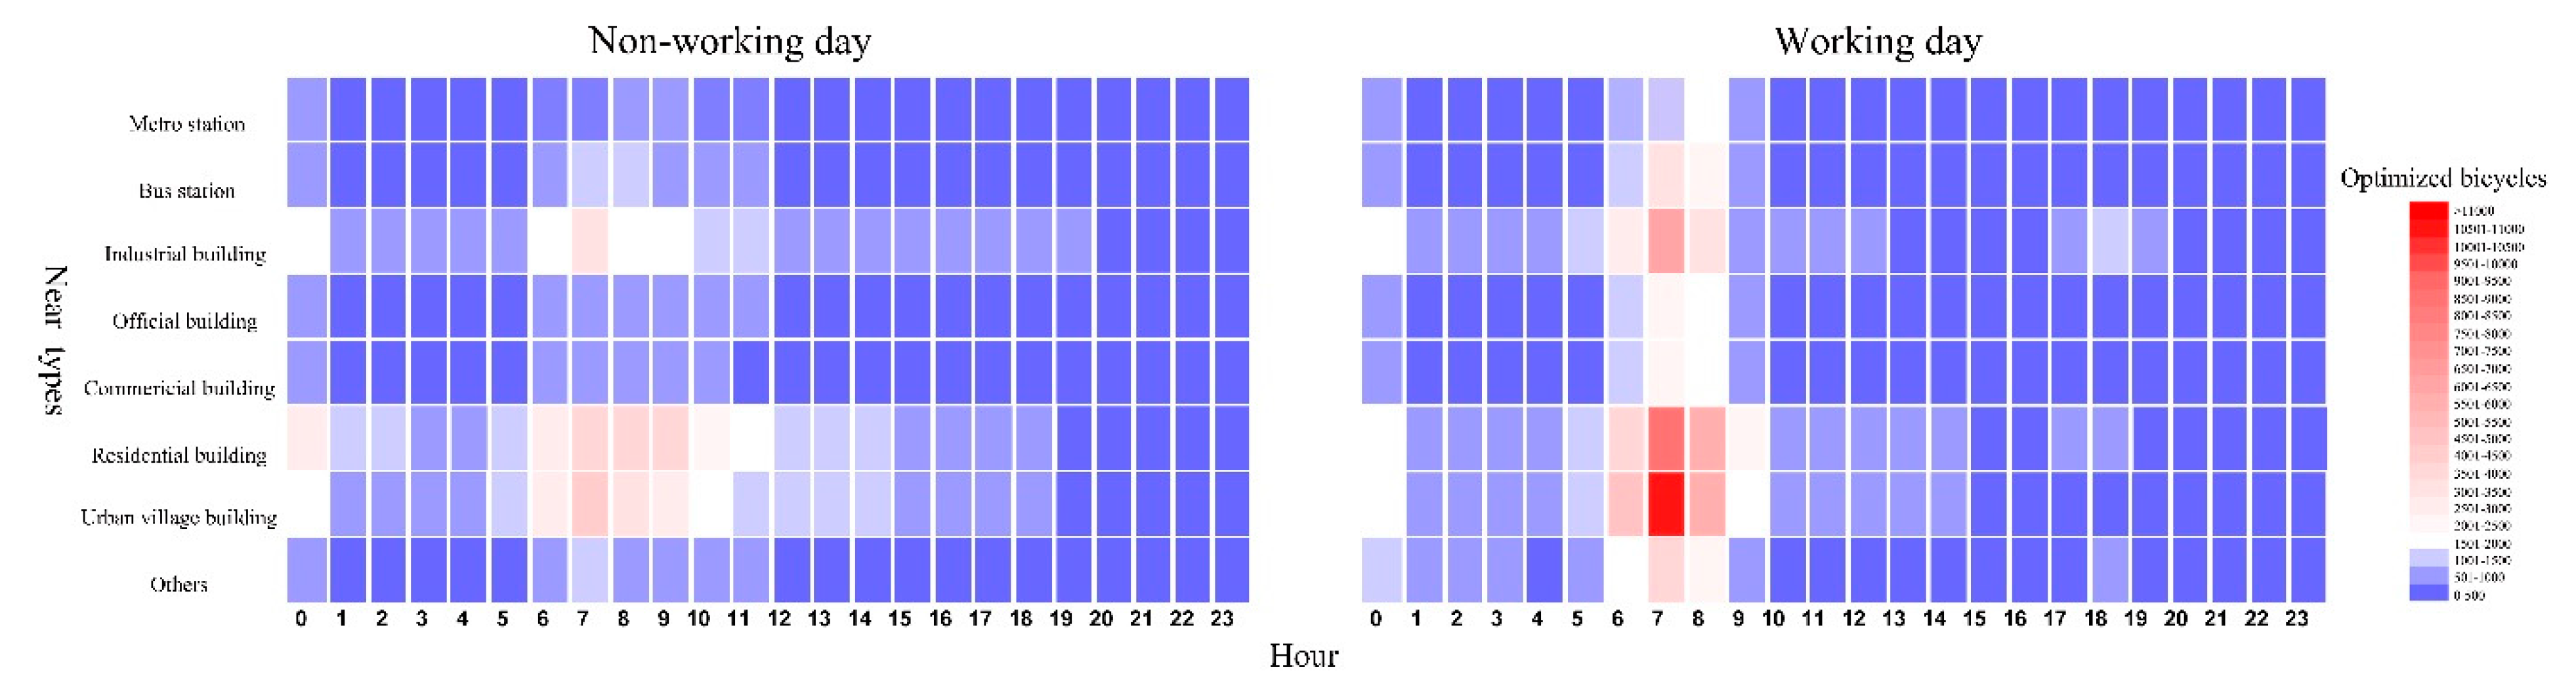
Combining the nearby spatial characteristics and temporal characteristics of the first trip for all optimized bikes, we obtained
Figure 8. In addition to the early peak at 7–9 a.m., there is also a small peak during the night from 0:00 to 1:00 a.m. This peak is partially because the algorithm searches for the earliest trip starting at 0:00 a.m., another reason may be the public transportation stoppage and high taxi prices during the nighttime. Another finding is that industrial buildings, like living buildings, have the same night peaks and early peak demand both on working and non-working day. One possible explanation is that these factories implement a three-shift switching working system which resulted in higher demand for optimized bikes at midnight and early peak time. In general, the distribution of optimized bikes is mainly in areas where the first trip of cycling out earlier or the number of cycling in bikes is less than the demand for cycling out. Correspondingly, major destinations for cycling in, such as commercial buildings and official buildings have less demand for optimized bikes.
Furthermore, we compare the spatial distributions of optimized bikes in various nearby areas to identify the specific characteristics of the spatial demand for optimized bikes.
As shown in
Figure 9, on working and non-working days, the spatial distribution of optimized bikes near public transportation facilities displays some spatial characteristics. The metro stations around the central areas have relatively high optimized bike demands on both working and non-working days, especially in Nanshan district. Our study found that 53.3% of the employed population in Nanshan high-tech area lives within 5 km. However, the layout of metro lines in Nanshan district is seriously mismatched with the commuter corridor [
42]. The bus line has similar problems, mainly along the east-west strip, while the commuter corridor in Nanshan district is north-south. The high demand for optimized bikes at these public transportation facilities shows that the direct accessibility of public transportation is poor and require more transfer in the last mile.
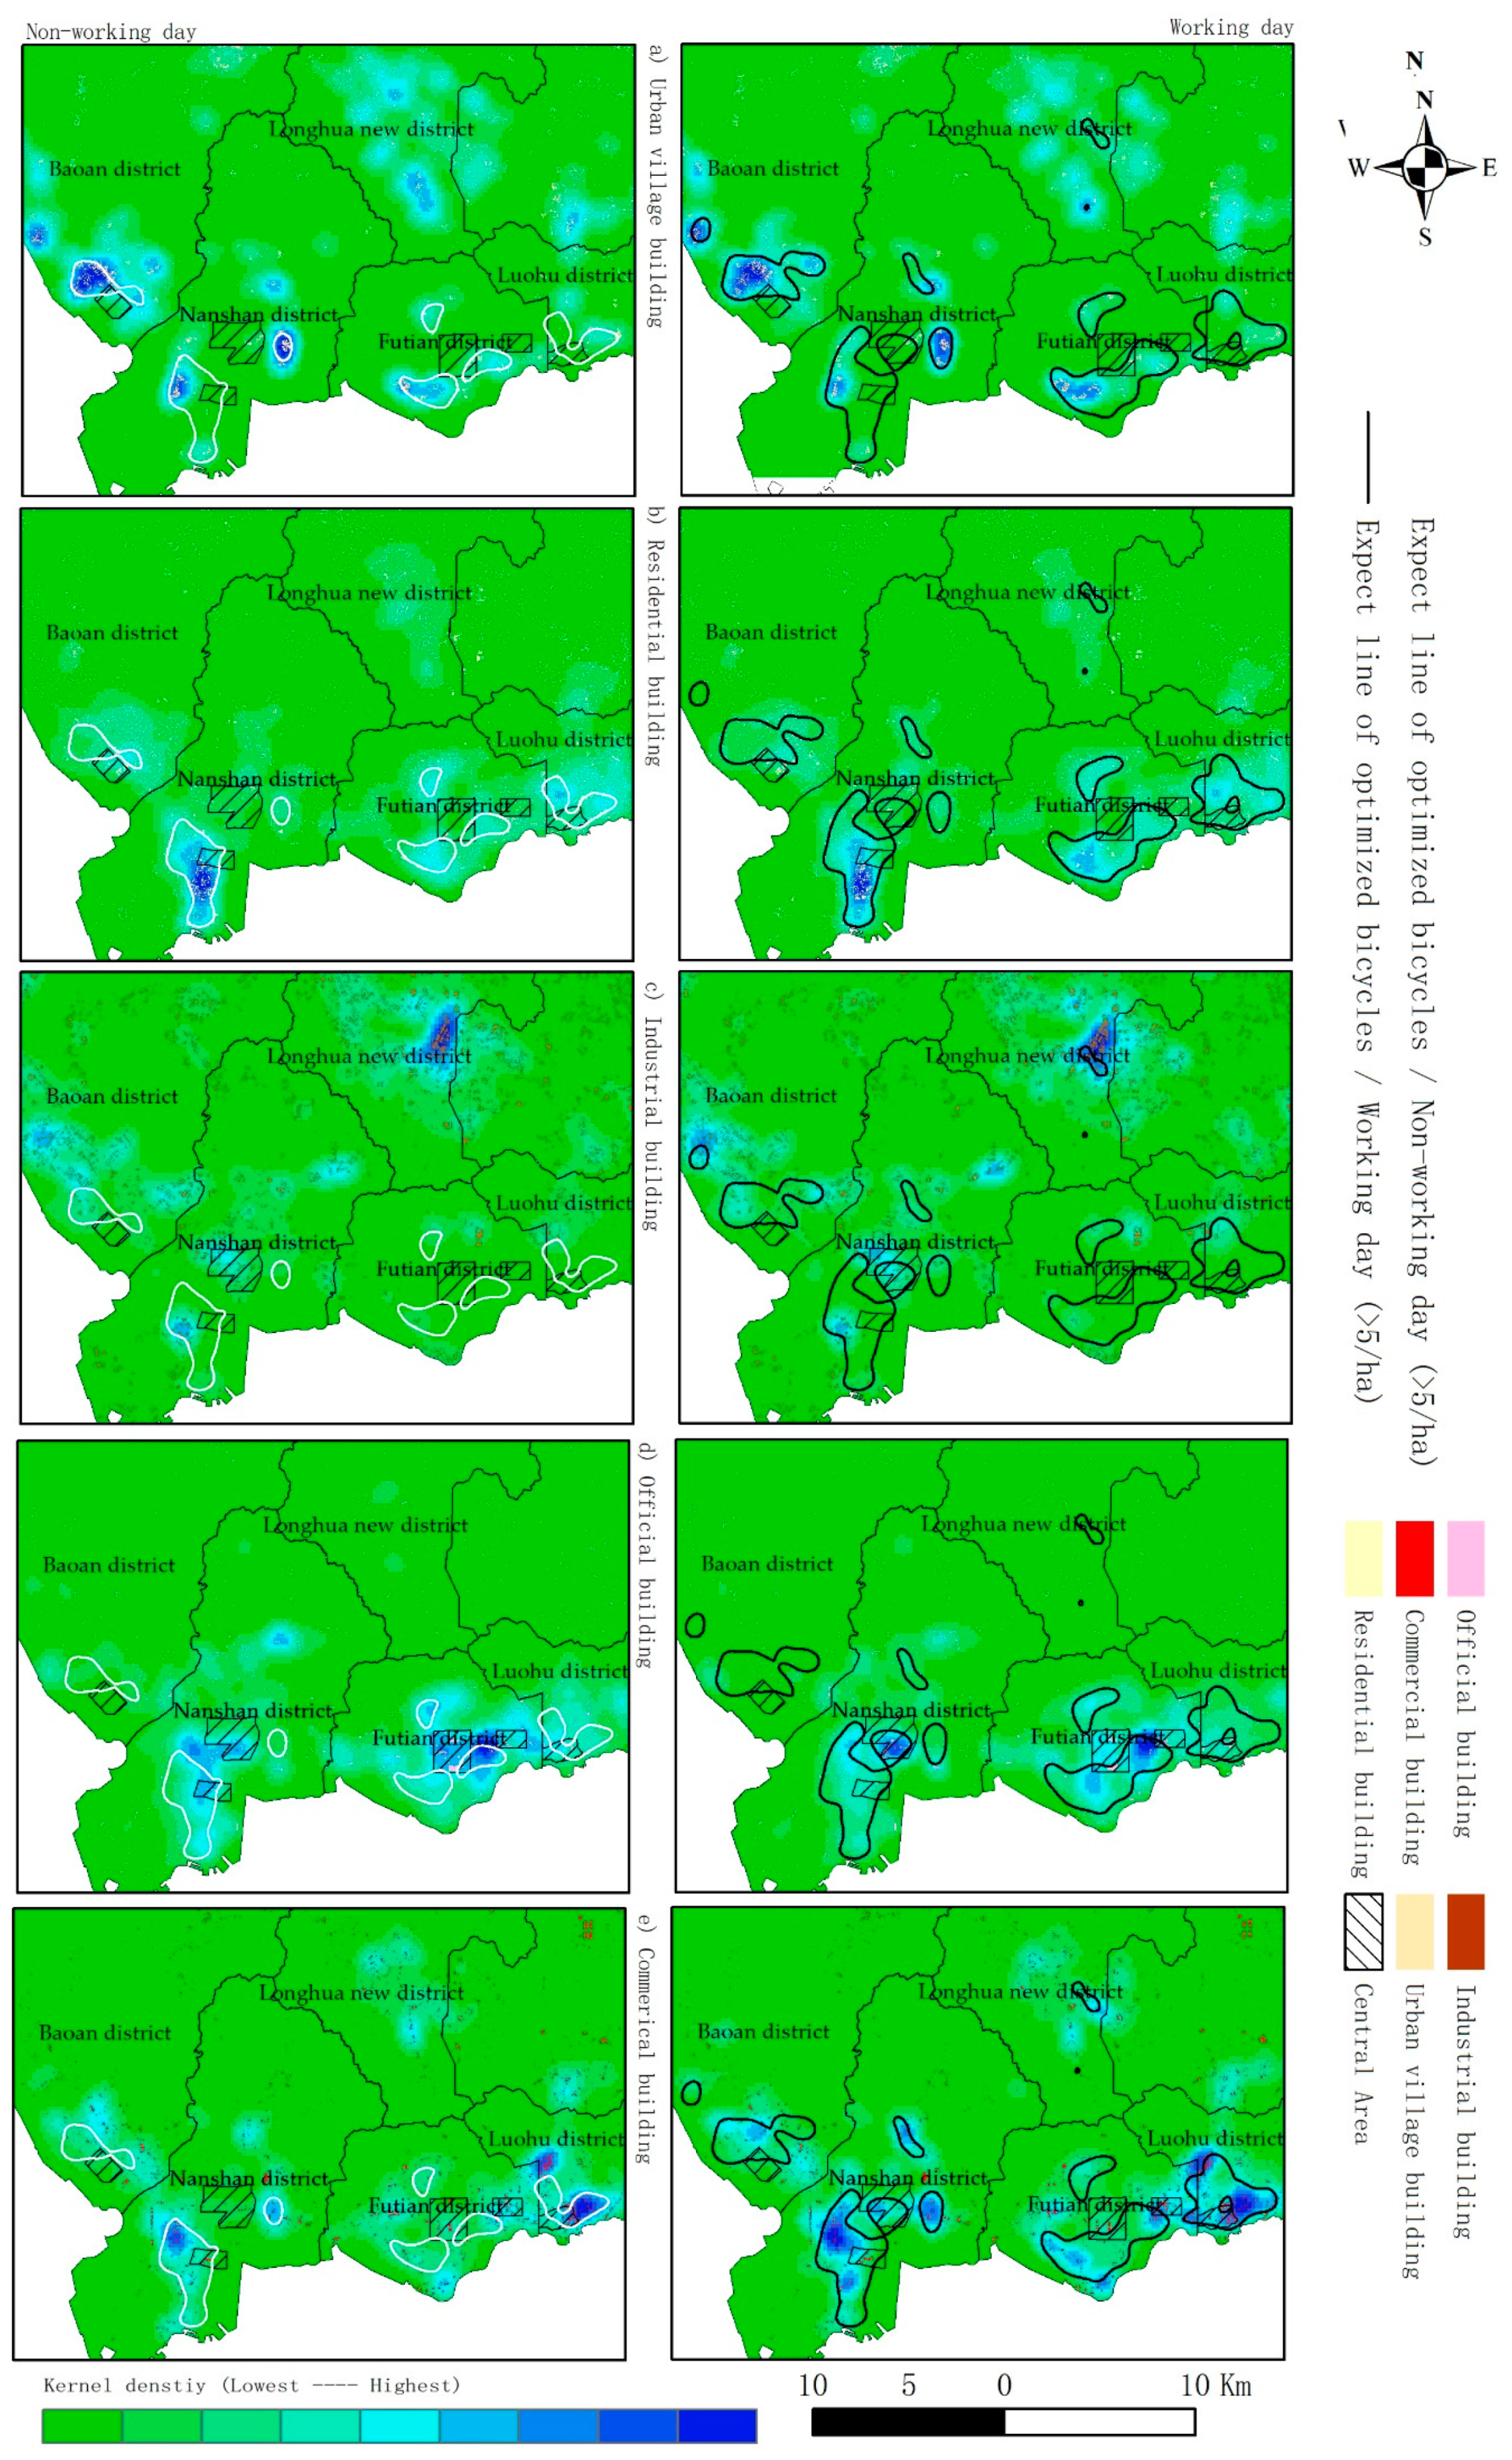
Similar to the previous analysis, we compared the spatial distribution of optimized bikes in adjacent buildings to find these relatively stable areas with high demand for shared bikes. As shown in
Figure 10a), urban village buildings next to the central areas have a significantly high demand for optimized bikes. There is no such obvious spatial characteristic in residential buildings (
Figure 10b), except for the buildings in Nanshan District. Among the industrial buildings, Bantian industrial zone in Longhua District is very special area which is an industrial production base for electronic information, biotechnology and new materials in Shenzhen (
Figure 10c). Whether the three-shift working system generally occurs here needs further investigation. For official and commercial buildings, there are also some such particularly stable areas with relatively high demand for optimized bikes both on weekdays and non-working days (
Figure 10d,e).
Due to data limitations, we only analyzed the spatial distribution of optimized bikes on two days and found that the results exhibited high consistency on both working and non-working days. If the proposed algorithm was applied to a long-term data, more spatial characteristics may be identified to help us understand the complementary relationship between public transportation and shared bikes or direct shared bikes for more scientific and effective delivery.
6. Conclusions
The boom of station-free BSSs has increased customer convenience but also caused inefficiency due to the excessive supply of bikes. It presents regulation challenges for city officials. What is the optimal fleet size of the station-free BSS which can fully meet the needs of users and make bicycles be used efficiency as well? How should these bikes be spatially distributed on this supply scale? This paper, which is based on actual travel data from the station-free BSS in Shenzhen, proposes an algorithm to construct a travel chain and determine the optimal bike demands in different spatial units.
Our results show that in Shenzhen city, only one-fifth of shared bikes is needed to meet the current usage demand if the bikes are used efficiency. With a population of 12.52 million in Shenzhen in 2017, the average number of bikes per 1000 people is 13 vehicles, which is in the range of 10–30 vehicles/1000 people recommended by the Bike Sharing Planning Guide. Correspondingly, our optimized results increase the average usage number of each bikes from below 1 to above 4, which greatly improved the efficiency of shared bikes.
Our results also identify some areas with the high spatial requirements of cycling and the ideal spatial distribution of optimized bikes’ initial positions. If the initial distribution is established according to this demand, the trips that occur throughout the day can be completed with as few bikes as possible without reducing the level of user satisfaction. Obviously, the spatial distribution of bikes will change dramatically at the end of the day. In response to this situation, the operator can relocate the bikes to the initial distribution using a static strategy at night. Thus, this approach establishes both a benchmark for the layout of station-free bikes and a target strategy for relocation.
The proposed HBOA is simple in principle, and the calculations are convenient to perform. Although the calculation results may not be optimal at all times, this information can be used to significantly improve the use efficiency of shared bikes. Thus, the results could be used by companies to meet the maximum coverage demand with the smallest number of bikes and as a tool for urban planners to scientifically manage the station-free BSS. From the perspective of the city as a whole, the total supply of shared bicycles should be kept at an optimal level to improve the overall operational efficiency of the urban traffic system. In this sense, it is necessary to break the barriers between different operators of the overall station-free BSS and enable users to rent and return bikes among different station-free BSSs. The two-day analysis results reflected the stability of bike use patterns and some specific differences between working and non-working days. If long-term data from more companies could be analyzed, the results would be more reliable and further improve the system efficiency by minimizing the size of the shared bike with the HBOA. In this case, additional physical infrastructure is not needed, but the current infrastructure could be more intelligently managed.


