1. Introduction
Enhancing social participation of people with disabilities (PWD) is a challenging issue for all societies. According to the United Nation’s convention, “
persons with disabilities include those who have long-term physical, mental, intellectual or sensory impairments which in interaction with various barriers may hinder their full and effective social participation on an equal basis with others” [
1]. According to Statistics Canada [
2], 22% of the population aged over 15 years lives with a type of disability, representing 6.2 million Canadian citizens. A recent study on activity limitations, chronic diseases, and aging suggests that 33% of Quebec residents have some form of functional limitation and this percentage increases to more than 57% among people aged 65 or over [
3].
Mobility is one of the most important life habits of PWD and has a great impact on their social participation (e.g., going to school, going to work). The concept of mobility is defined according to different scales of locomotion such as daily walking, postural transfers, driving a car, and using public transportation [
4]. Improving the mobility of PWD may significantly contribute to their social participation.
In this study, we are particularly interested in improving the mobility of people with motor disabilities (PWMD) who use wheelchairs in indoor environments by leveraging the potential of smart technologies. Recent advances in geospatial and communication technologies (e.g., smartphones, navigation, positioning technologies, sensor networks, actuators, Internet of Things, etc.) [
5,
6,
7,
8] allow us to design and develop more adapted and inclusive environments to facilitate the mobility of PWMD by guiding them to their destination and providing them pertinent information such as obstacles and facilitators on their path. The design and development of such inclusive environments necessitate the consideration knowledge on the perception, capabilities, experiences, and preferences of these people in their mobility and interactions with the environment. For instance, the ways PWMD that use wheelchairs for their mobility interact with objects such as stairs, doors, ramps, and other people, are very different than the general population. Hence the perception of these people on the complexity and legibility of the environment may not only differ from those of the general population but also among the PWMD themselves. The legibility of an environment is a key factor that influences the mobility performance of PWMD. In general, the legibility of an indoor or outdoor environment is defined as “
the ease with which its parts can be organized into a coherent pattern” [
9]. It contributes to the construction of a cognitive map, that is, a mental map of the environment which is used for navigation tasks [
10].
In the scientific literature [
11,
12], several factors are used to assess the legibility of an indoor environment including the level of connectivity, and the complexity of the indoor layout which can be measured using indicators such as the interconnected density (ICD) [
13]. However, other factors such as the level of the accessibility of the environment and the presence of landmarks (based on the location, color, and size) and informative elements (e.g., signage inside buildings) may significantly influence the legibility of the indoor environment for PWMD [
14,
15,
16,
17]. In addition to the environmental factors, the mobility of PWMD also depends on personal factors including their capabilities and experiences. To our knowledge, there are very few studies that explicitly take into account the personal factors when assessing the legibility of an environment for people with disabilities [
17,
18].
The research questions that are addressed in this paper are: (a) what are the most important factors to be considered for personalized legibility assessment for PWMD? (b) Is it possible to assess a personalized legibility for an indoor environment? In order to reply to these questions, we hypothesized that the legibility level of an indoor environment is significantly different for people with motor disabilities and can be personalized by considering the role of personal factors in the computation of each legibility factor (e.g., accessibility level).
This paper proposes a new framework for the assessment of the personalized legibility of indoor environments to better support the mobility of PWMD. For this purpose, relevant environmental and personal factors that influence the legibility of the environment for PWMD are considered. Our framework for the personalized legibility assessment for PWMD is based on the Disability Creation Process (DCP) model proposed by Fougeyrollas et al. [
19], as well as the notion of affordance that helps to better consider the role of personal factors in such a process. Personalized legibility assessment can provide indicators that lead to better designs and development of more accessible and legible environments using smart technologies (sensors and actuators) and can allow PWMD to better move and interact with their indoor environment.
The remainder of this paper is organized as follows. In
Section 2, recent studies on the legibility of the environment are reviewed. Next, we propose a framework for modeling the personalized legibility of the environment that considers both environmental and personal factors in
Section 3. Following this, in
Section 4, the personalized legibility estimation approach is proposed. Then, to illustrate the proposed method for legibility modeling of an indoor environment, an experiment is carried out in Quebec City Convention Centre, one of the most complex buildings in Quebec City. Finally, discussions and conclusions are presented and future works are stated.
2. Literature Review
The legibility of the environment provides a link between human perceptions and the physical environment that influences the performance of wayfinding behavior. Lynch [
9] conducted a study of environmental legibility in support of wayfinding. He showed how distinct landmarks can affect the legibility of a city. His idea was introduced as the amount of suppleness that is necessary to recognize a coherent pattern from the surrounding environment. O’Neill [
12] proposed a conceptual model for legibility that introduced a cognitive map as an intermediary between the designed physical environment and wayfinding performance. A cognitive map is understood to be the mental representation of the environment that serves to indicate spatial and topological relations between connected places [
20].
Generally, over the past several decades, researchers have been working on legibility of the environment using either qualitative or quantitative approaches [
21]. In the qualitative approaches, surveys and experiments are performed to statistically explore correlations between subjective assessments of legibility. For instance, O’Neill [
12] recruited 63 participants to determine the correlations between an environmental design factor (spatial and topological attributes of the building) and wayfinding performance mediated via the cognitive map. In earlier research, Günes [
22] evaluated the influence of environmental design elements, including signage, landmarks, the presence of an information desk, asking somebody, and familiarity, on the legibility of a shopping mall using self-reported data and qualitative experiments regarding wayfinding performance. On the other hand, quantitative approaches aim to model and simulate legibility within a more objective perspective. Most of the research works in this category have applied space syntax principles (e.g., visibility graph analysis (VGA)) in order to model legibility in wayfinding applications [
11,
23]. Recently, the visual saliency of images captured in indoor environments was used to quantify the legibility of indoor subway spaces using a deep learning approach [
21]. The focus of this research was the integration of both visuo-spatial and non-spatial attributes of the environment for legibility analysis.
Several legibility and complexity analyses of physical environments have also been reported in recent years in support of wayfinding applications. In general, the legibility factors addressed included: (1) visual access, (2) the level of connectivity, and (3) the level of complexity of the environmental layout. Low environmental visibility makes it more difficult to find the location of a destination. Benedikt [
24] used the isovist method for assessing the visual access of an environment. The level of connectivity is the degree of integration between convex spaces within a building. An axial map can be applied to measure the pattern of line-of-sight connections between spaces [
25]. Finally, the level of complexity is usually calculated based on the ICD, that is, the amount of complexity of a planar network structure. In fact, ICD represents the average degree of connectivity for each node over the whole network. Li and Klippel [
11] have applied these factors to suggest where the environment is more understandable. They integrated these factors into a definition of legibility.
There are other factors that influence the legibility of environments. Saliency is one of the factors that was mentioned in [
20]. Saliency concerns the distinction of prominent features with respect to other features. Saliency may include perceptual saliency, cognitive saliency, and contextual saliency. Perceptual saliency refers to the sensory predominance (e.g., visual, auditory, olfactory) and may include factors such as location-based attention (e.g., color, intensity), object-based attention (e.g., size, shape), and sensory context such as prevailing topological relationships. Cognitive saliency is related to human memory and experience, while the contextual saliency is changed in the different contexts. For example, when a person looks at a book in a library, books are more salient than other objects.
Furthermore, landmarks have been mentioned in several studies as important elements to create better linkages between survey and route knowledge [
26,
27,
28,
29,
30,
31]. In fact, landmarks are distinctive features that serve as reference points for navigation so as to orient users based on the surrounding environment. Although landmark saliency is assessed based on the performance of wayfinding of people in the environment [
20], it has not been integrated so far with other factors such as visibility, connectivity, and complexity to evaluate the legibility of indoor environments. Indeed, saliency of an object is among the important characteristics that help people to identify them as landmarks. It allows landmarks to be distinguished from their context and used as reference points during navigation tasks.
Regarding the consideration of personal factors in legibility analysis, especially for PWD capabilities, a few studies have been carried out, but most of them were focused on people with visual impairments. As an example, Belir and Onder [
18] investigated the spatial organization of an indoor shopping mall and how this was influenced by structural and sensory landmarks (e.g., corridor entrances and odors coming from trash bins, respectively). They concluded that these landmarks influenced the legibility of a place, especially for people with visual impairments. In their research, integration using axial line relationships (number of intersections) and connectivity using visibility graphs (number of connected points) were used to verify the legibility of landmarks by people with visual impairments. The researchers found out that the high integration and connectivity between structural and sensory landmarks significantly impacted on the cognitive maps of people with visual impairments.
To the best of our knowledge, modeling the legibility of indoor environments for PWMD has not been studied, even though the related issue of accessibility has been addressed in both outdoor and indoor environments. Accessibility is the degree to which an object can be reached or approached [
32]. Like legibility, the level of accessibility of an environment may impede the mobility behavior of people using wheelchairs or, alternatively, may facilitate their movement. According to the Americans with Disabilities Act Accessibility Guidelines (ADAAG) [
33], for accessibility analysis, indoor spaces are classified into: (1) primary path segments, (2) secondary path segments, (3) closed space-like rooms, (4) open space-like corridors, (5) doors, (6) stairways, (7) elevators, (8) ramps, and (9) furniture. Most recently, Yaagoubi et al. [
34] proposed a new method based on the Voronoi data structure to obtain a navigational network for PWMD using ADAAG classes and IndoorGML standards [
35]. Additionally, Park et al. [
36] similarly investigated the accessibility of the navigational networks of two shopping malls using a new extension of IndoorGML. According to the American Disabilities Act (ADA) and the Barrier-Free Certification System (BFCS), they classified indoor spaces and their accessibility attributes into: (1) corridors (area, width, slope, and level change attributes), (2) elevators (area, passing width, and control buttons), (3) escalators (with ramp), (4) stairways (with wheelchair lift and ramp), (5) ramps (width, slope, turning width, and handrail), and (6) doorways (directions including push and pull, the existence of automated functions, width, height, and sill-like flats).
We consider that the aforementioned elements may have a significant impact on the legibility of an indoor environment for PWMD based on their personal experience and interaction with the environment. Hence, in the following section, we propose a novel framework for the analysis of the legibility of an indoor environment for the mobility of PWMD.
3. A New Conceptual Framework for the Assessment of Personalized Legibility for PWMD
We consider that the legibility of an environment is affected not only by environmental factors but also by personal factors such as personal capabilities and preferences. As mentioned earlier, several factors such as the degree of visual access, the connectivity, and ICD as a measure of the complexity of an indoor environment are already presented in the literature [
11]. However, these factors should also be considered based on the interaction of personal factors (e.g., personal capabilities, experiences, and perceptions). For example, for a blind person who has no ability to see, legibility of an environment in terms of visibility will be null. Indeed, for a person with visual disabilities, a visibility graph or isovist methods [
37] cannot be used for legibility assessment. In addition, for a person with motor disability using a wheelchair, the visibility may change based on the wheelchair height and hence the person will have a very different visual perception of the environment and consequently the legibility will also be different. Hence, legibility should be considered as a two-way factor computed in interaction between personal and environmental factors.
Legibility is perceived by PWMD based on their interactions with the environment, their individual sensory capacities, impairments, identities, and their confidence while they move in the environment. For instance, although PWMD do not usually have problems with sensory inputs, their point of view can vary based on factors such as the height of their wheelchair seat. In this case, visibility may be confined to some directions. Regarding identity factors, such as age, education, etc., these factors could affect the significance of different environmental factors. Finally, path accessibility may have an impact on stress levels of PWMD, thereby affecting the legibility and complexity of the environment.
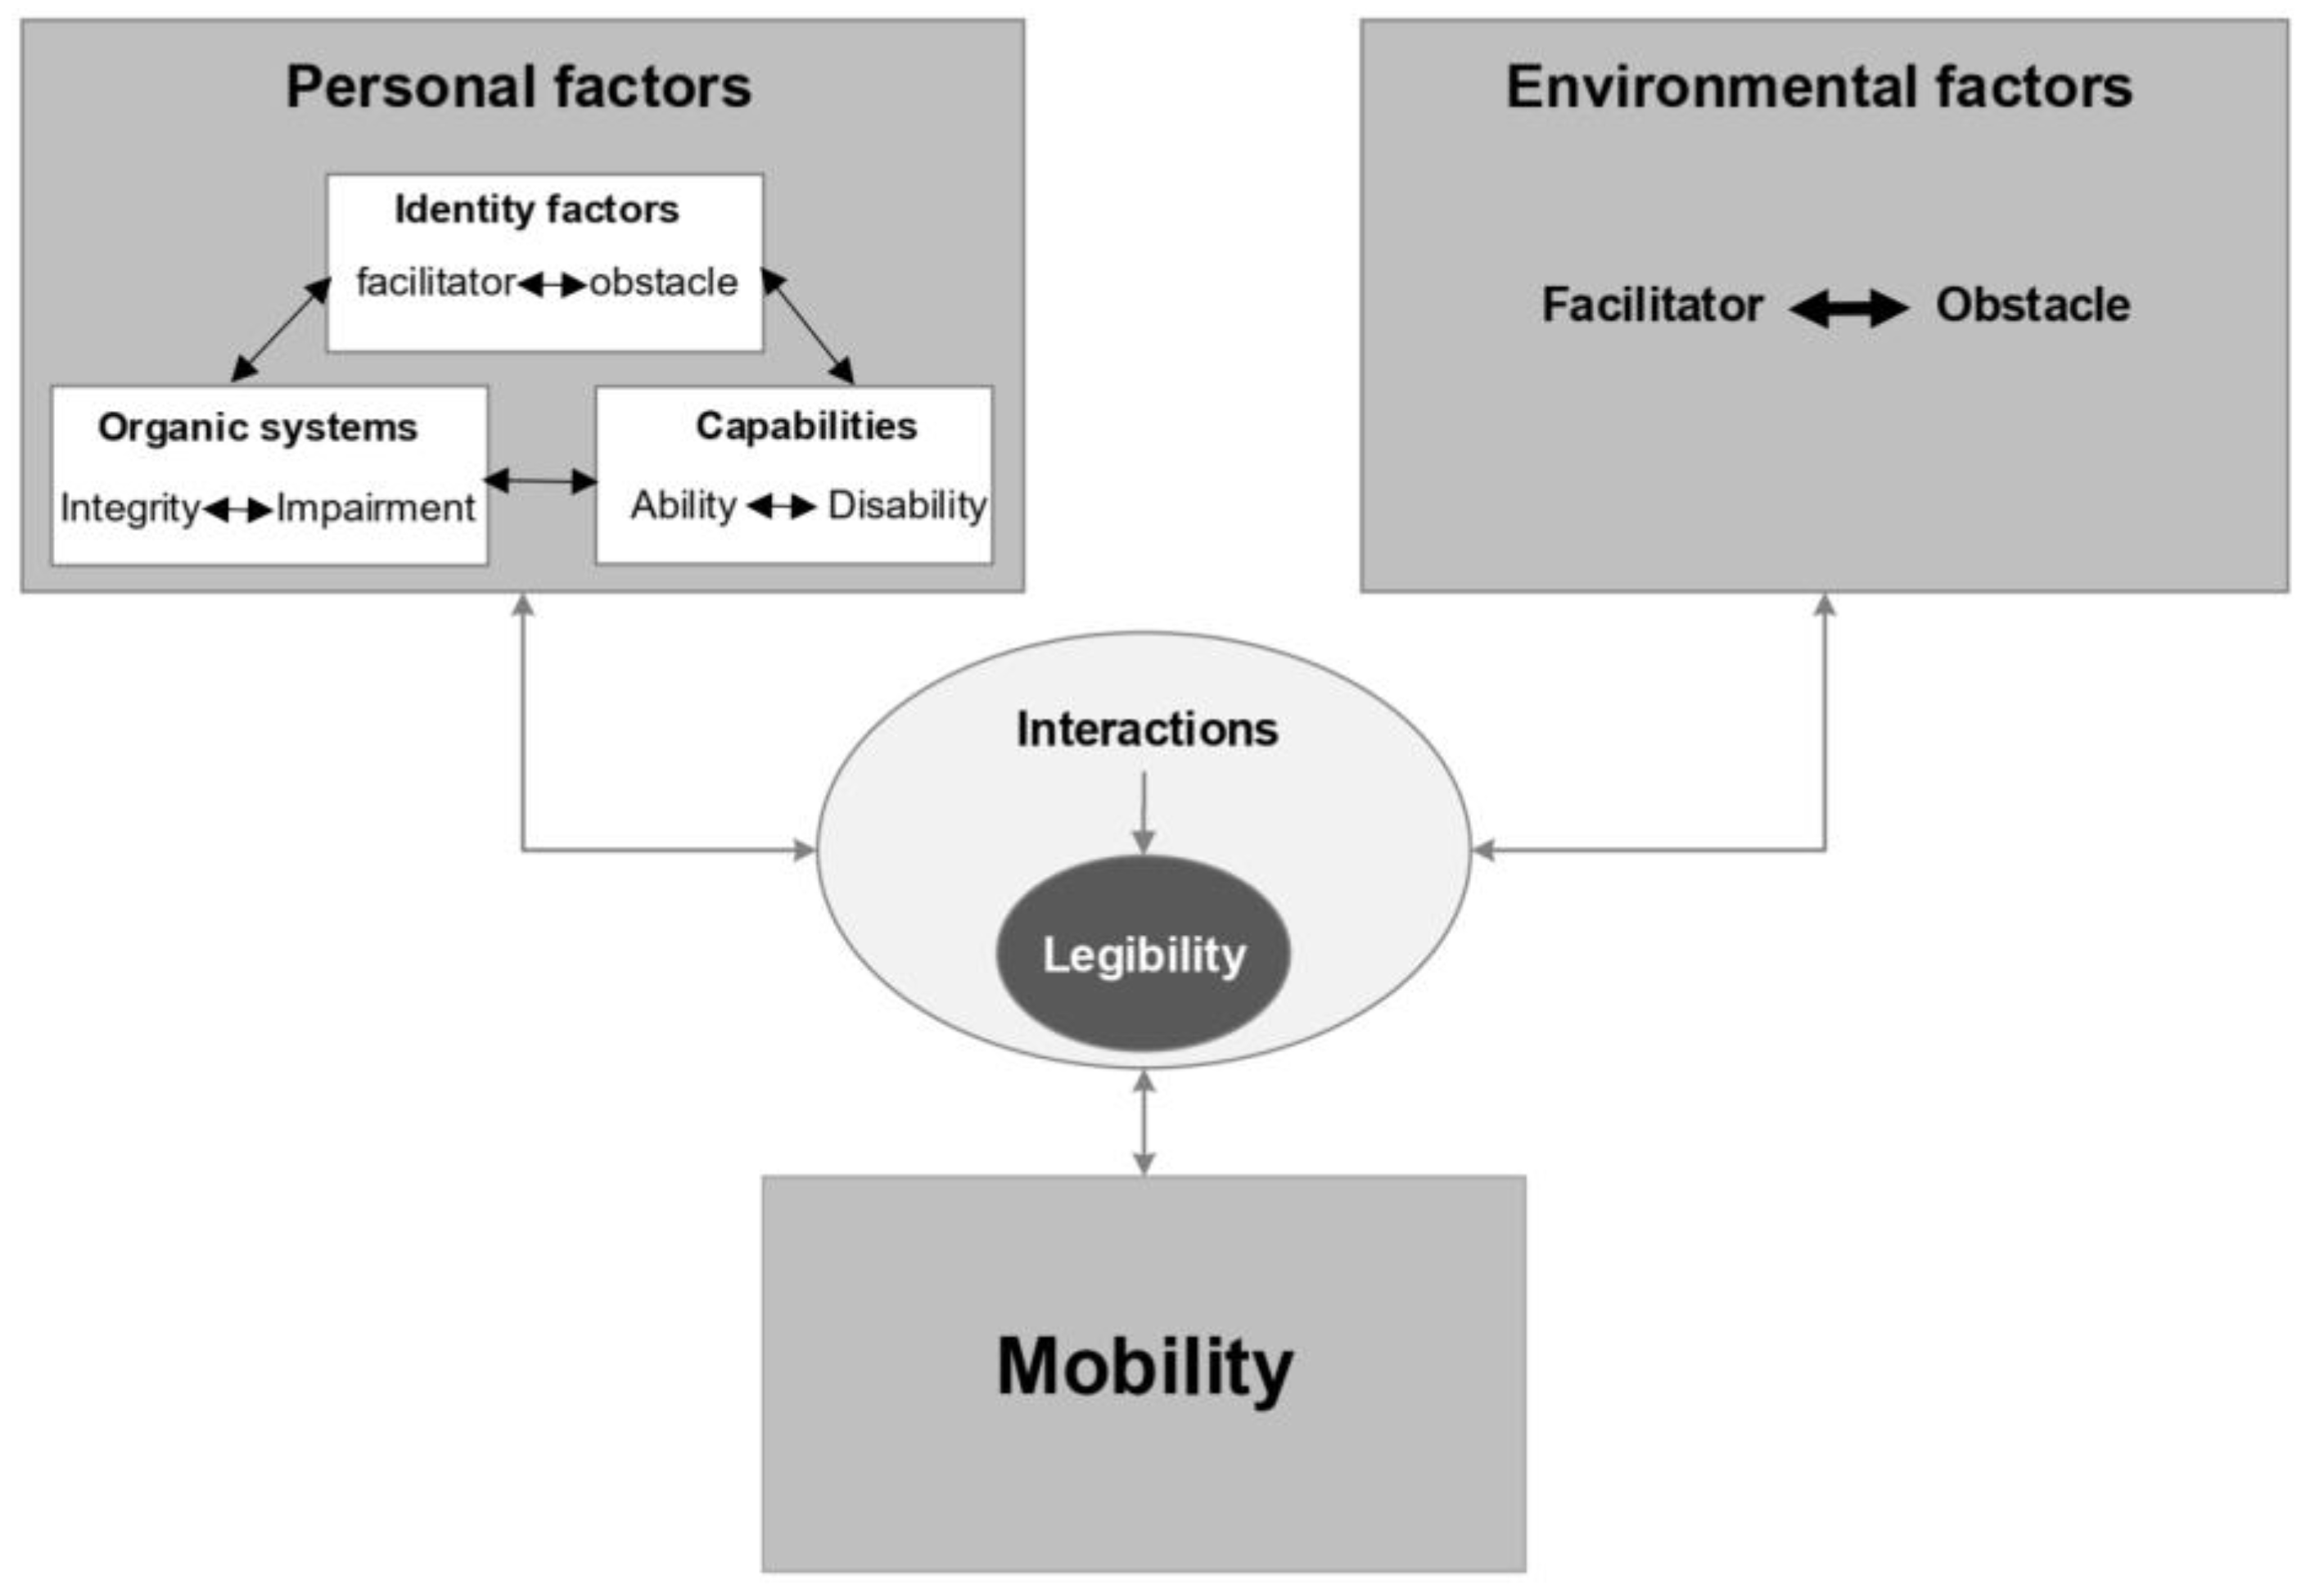
Our framework for assessing the legibility of the environment integrates the Disability Creation Process (DCP) model proposed by Fougeyrollas et al. [
19] as well as the notion of affordance to help better consider the personal factors in such a process, especially for PWMD. According to the DCP model, disability is defined as a result of interactions between people and their environment. This model incorporates multiple environmental factors, from fully facilitating to fully impeding, in interaction with personal factors. Personal factors include identity, the health status of a person’s organic systems, and capabilities that are scaled from facilitating to impeding, integral to impairment, and ability to disability. The notions of obstacles and facilitators are defined based on the interactions between personal and environmental factors. For instance, a stairway can be considered as an obstacle for PWMD based on their capabilities. Hence, we argue that legibility can be considered as a result of interactions between people and their environment, which is oriented towards a specific purpose (i.e., carrying out a life habit such as mobility).
Figure 1 illustrates our main idea of integration of the legibility concept into the DCP model for mobility purposes.
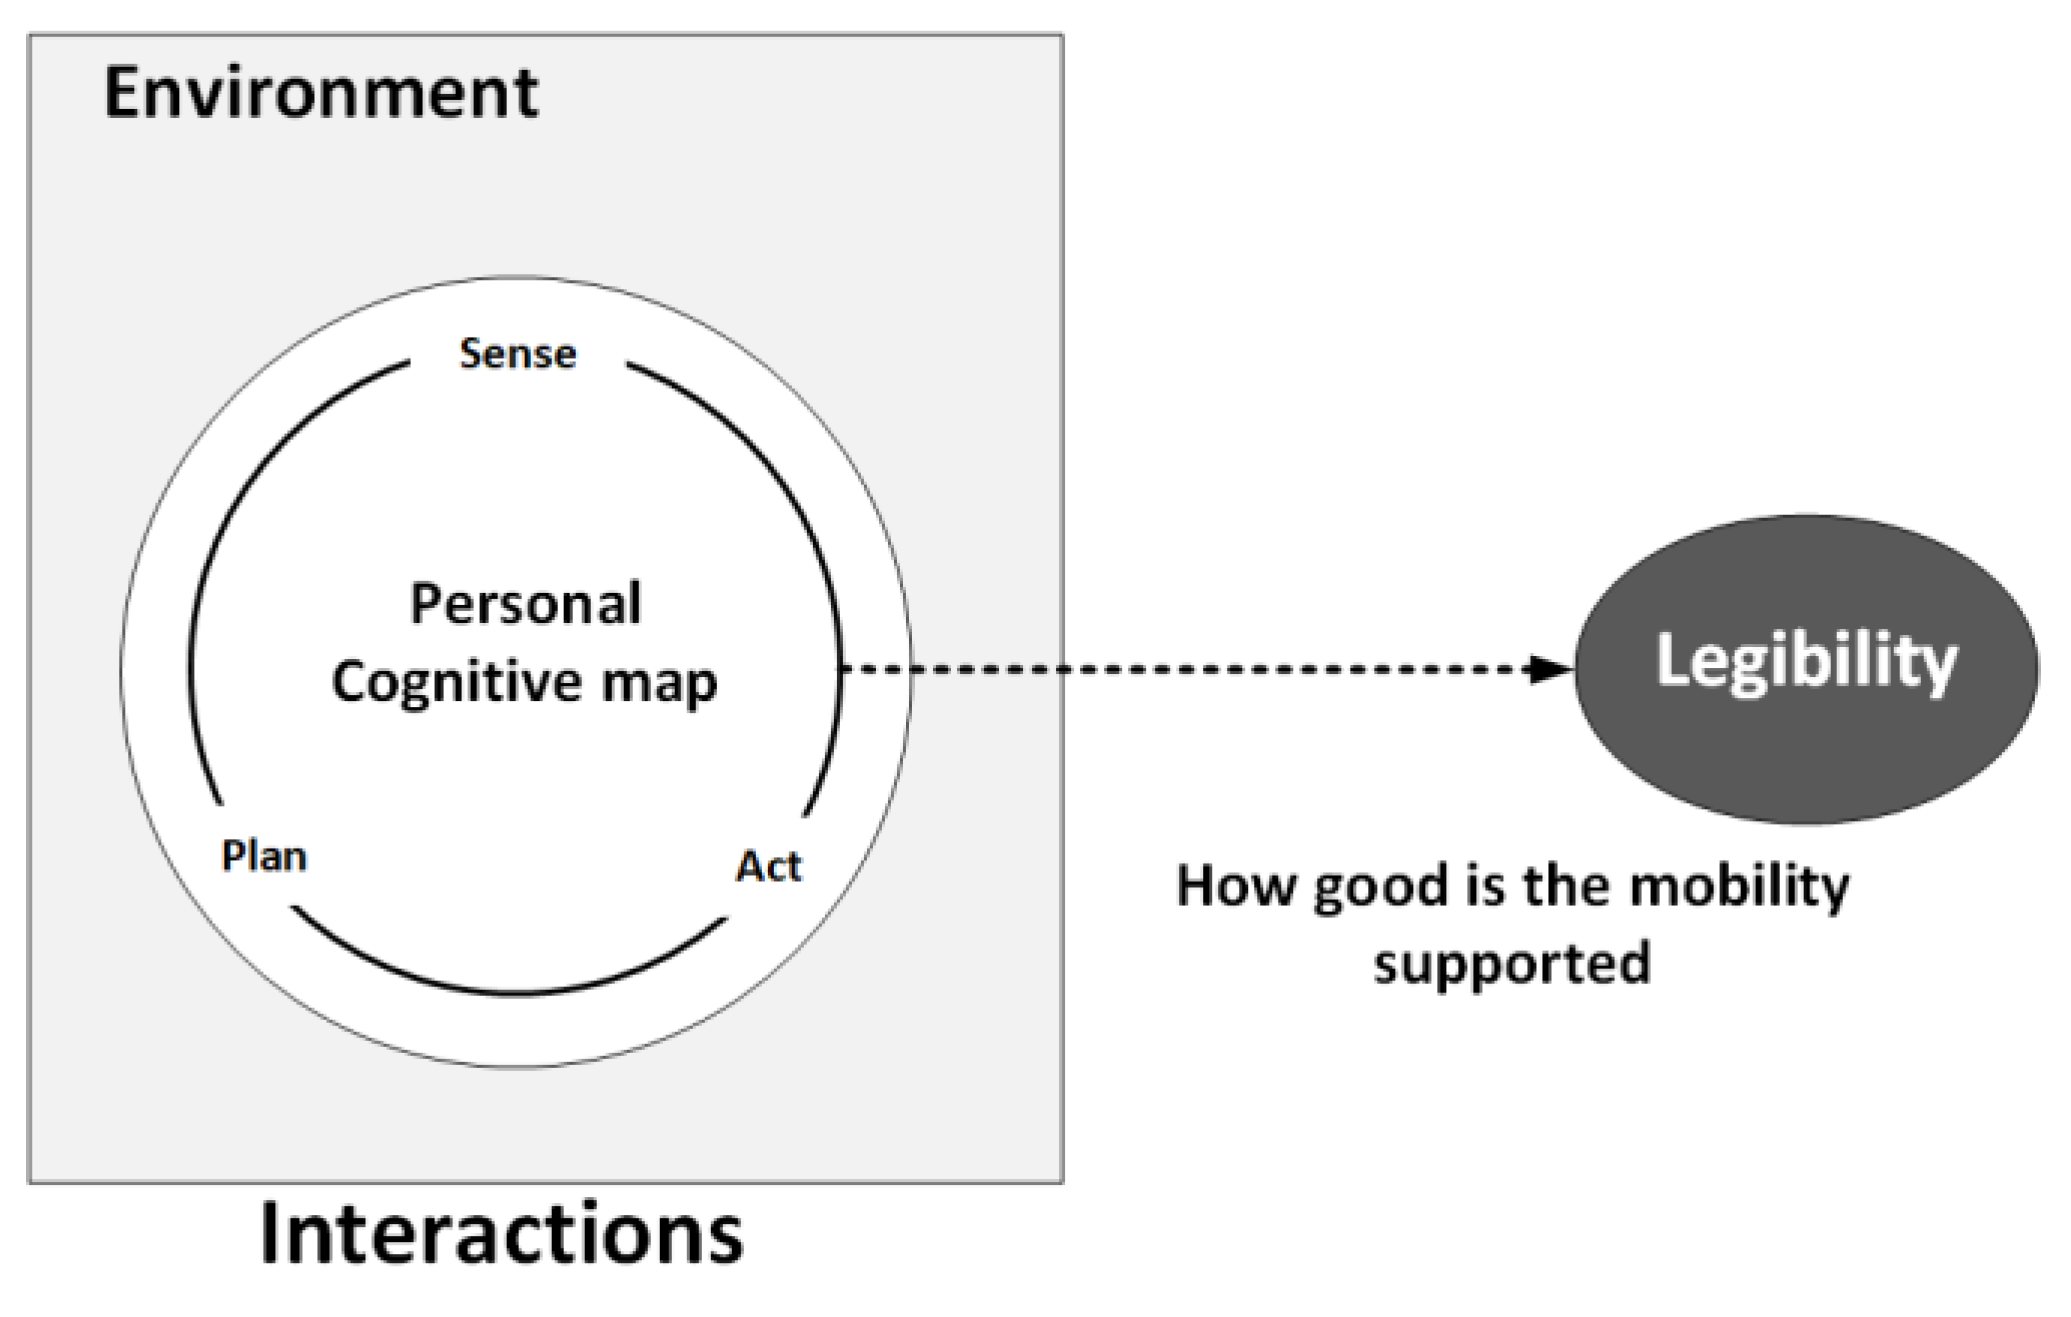
Mobility performance is then related to the level of legibility of the environment and depends on the diverse interactions of a person with this environment. Several attempts in computer science (e.g., agent models) and psychology (e.g., cognitive models) have been undertaken to measure how a person interacts with his/her surrounding environment [
38,
39]. For instance, sense–plan–act is one of the frameworks that has been proposed in the robotics field to define the interaction between an agent with its surrounding environment [
40].
According to this approach, a person has the ability to sense and perceive the environment and its dynamics and to extract the required information for subsequent plan and action. This process iteratively defines the interactions of the person with his/her environment and contributes to the creation of a cognitive map of the environment and its update, which provides a personal sense of legibility of the environment in support of the mobility task (
Figure 2).
Regarding the process of planning and acting in wayfinding behavior, affordance and information processing are the two main aspects that help people to choose the right way among alternatives [
41]. Based on Gibson’s theory [
42], affordance consists of how environmental elements offer the possibility of action. For example, in the wayfinding domain, corridors offer “go-to” affordances. Information, on the other hand, reflects knowledge of the destination from orientational aids and informative signs in a building. People with this knowledge are better able to find their destination in a short time, via accessible ways, and with low cognitive load. According to Niesser’s model [
43], the appropriate information is picked up based on schemas registered in people’s minds. Hence, it is necessary to include semantic data to estimate the legibility of the environment for each individual who strolls around inside the building. According to our proposed framework and the relevant literature on legibility, factors that should be taken into consideration include the level of visual access, the level of connectivity, the level of complexity of building layout, and the level of accessibility (facilitators/obstacles):
Level of Visual Access: one indicator that influences the estimation of legibility is visual access. Generally, better visual access to a location implies better legibility. Based on Niesser’s theory [
43], perception leads to mental representation via a person’s visual schemas. In the creation of such schemas, the location of people, the orientation of their head, and their visual competency are used as the person’s situation awareness. In addition, obstacles such as walls and furniture may lead to limitations in visual access. Although visual access is a common factor that influences legibility for most people, for PWMD, however, this may be significantly different as they have different and, in some cases, restricted visual access to the environment. This is partly because they use wheelchairs for their mobility and hence perceive the environment from a different angle compared to a person who walks.
Level of Connectivity: another key factor in determining legibility is the connectivity between the spaces. This is also called the degree of spatial integration [
25]. This factor actually indicates the degree to which people come together in one place from other places. Legibility is inversely related to the degree of connectivity. The more people converge into one space, the more they may become anxious and confused about their goals. The number of axial connections between convex spaces can provide a way to calculate the degree of connection of spaces, especially in indoor environments. This factor is commonly important for both people with and without disabilities. Intersections of the corridors are among the most important decision points in indoor environments during the mobility task. However, in terms of personal capabilities and spatial reasoning skills, as well as personal factors such as age, this can differ from one person to another.
Level of Complexity of Building Layout: the complexity of a building’s layout was initially determined by O’Neill to contribute to the legibility of indoor environments. Complexity can be characterized based on the result of the analysis of topological/neighbor relations between the interior spaces (rooms, corridors, etc.) of a building. For this purpose and based on graph theory, a path is divided into several sub-components between decision points. Several studies in the past decade have focused on automated methods to segment and categorize indoor environments, with emphasis on: (1) skeletons (medial axis transformation) [
44], (2) regular tessellations [
45], (3) irregular tessellations [
46], (4) visibility graphs [
47], and (5) variable density networks [
48]. Although most of these methods have sought to create navigational graphs for the general public, the AccessVOR [
34] method has been adapted to address the accessibility issues of PWMD based on the ADAAG standards. The graph density at each point determines the degree of its complexity indicated by ICD that should be considered in the legibility assessment. The complexity factor may also impact the legibility of the indoor environment differently from the perspective of PWMD. For instance, the number of corridors intersecting at a point may imply a more significant presence of people moving in different directions and hence create a mobility obstacle for the PWMD, which may be less constraining for other people without disabilities in the same situation.
Level of Accessibility (Obstacles/Facilitators): The main factor for determining the legibility of the environment, for PWMD, is related to their level of accessibility to such an environment. Facilitators such as elevators and obstacles such as stairs have a large salient impact on a person who uses a wheelchair compared to other environmental elements. In general, each object in the environment offers some level of obstruction or facilitation with regard to mobility performance. Several studies classify environmental entities for assessing the accessibility of a path for PWMD in indoor environments. For instance, a path with specific slope, width, and level change attributes can appear as an obstacle for PWMD. Most recently, Park et al. [
36] classified indoor spaces and their accessibility attributes into:
Corridors (area, width, slope, level change)
Elevators (area, passing width, and control button)
Escalators (with ramp)
Stairways (with wheelchair lift and ramp)
Ramps (width, slope, turning width, and handrail)
Doorways (directions including push and pull, the existence of automated functions, width, height, and the presence of sill-like flats)
Based on the characteristics of obstacles and facilitators, the degree of accessibility and legibility of the environment for PWMD are determined. There is an index accessibility assessment approach [
14] that considers facilitators (e.g., ramp) and obstacles (e.g., high slope) based on the confidence level of PWMD on the path. This approach is proposed based on the route knowledge. However, for assessing the legibility, the survey knowledge is also significant. For instance, when a person with a wheelchair encounters an obstacle, he/she must look for another path, especially a path that uses facilitating elements such as a ramp and not an escalator. Hence, the presence along the way of these elements with different affordances for an individual with or without disabilities affects the legibility of the environment.
There are other embedded elements such as landmarks and informative elements in the environment by which the mobility performance is facilitated. Landmarks and informative elements play a significant role in this performance. Landmarks facilitate the route-finding process because they are prominent objects in the environment that enrich knowledge about routes [
9]. Landmarks are objects that are more easily identified than other objects. Their distinctiveness is based on their size, color, and location within the human mental representation. Landmarks are categorized into visual (extended to sensory [
18]), structural, and cognitive landmarks [
49]. Regarding sensory landmarks, other than the objects themselves associated with paths (structural) and mental representation (cognitive), smells and features sensed by other means could be used as referents during navigation. What is considered a landmark varies among people based on their experience and interactions. According to several studies on spatial cognition, landmarks have a significant role to play in creating a cognitive map [
20]. In general, landmarks can be captured from a person’s in situ perspective view or via a two-dimensional overview of a given route (using a map) as a set of references for the route. The first of these is called the egocentric frame and the second is the allocentric frame [
39]. In general, regardless of which frame is adopted, the presence of landmarks in human visual, linguistic, and spatial memory plays a significant supportive role in navigation.
Informative elements as other facilitators are divided into two categories: orientation aids and informative signs [
50]. Orientation aids include information desks, maps, and site plans, whereas informative signs consist of identification signs (indicating pertinent names and symbols) [
51] and directional signs (indicating the direction that people need to move using arrows and pictograms) [
52]. The presence of these elements is vital to understanding the environment, especially in unfamiliar locations. Not only these elements need to provide accurate and sufficiently detailed information on the environment and directions, but they must also be easily recognizable via their colors and locations. In our study, the focus is mainly on the detection of the signs and their locations as well as their visual saliency, not on their content.
Visual saliency is one of the attributes that can be used to measure the level of differentiation of an object from its surroundings [
20]. With this attribute, the degree of differentiation of landmarks and signs as mobility facilitators and other obstacles can be assessed for each person according to his/her position. This degree of differentiation varies depending on the individual, the location, the time, and the context. This personalized degree can be calculated by considering the person, using the wheelchair’s location, and the image perceived, based on his/her position. In general, visual saliency “[…]
is the distinct subjective perceptual quality which makes some items in the world stand out from their neighbors and immediately grab our attention” [
53]. Hence, the visual saliency measure aims to highlight the regions in an image that would attract a person’s attention. Generally, the human visual system involves a selection process that does not include all the visual information in an image. Many studies have focused on developing models of visual attention [
54,
55,
56,
57,
58,
59,
60]. These models are divided into top-down and bottom-up methods. Top-down models are related to human cognition and view attention as a task-dependent behavior, based on memory, reasoning, etc., whereas bottom-up models are based on the scene attributes that attract attention in terms of motion, contrast, intensity, color, orientation, etc. On one hand, the first group considers which part of a scene is “relevant” based on the task and motivation. On the other hand, “saliency” is considered to be stimulus driven from external objects. The bottom-up models have attracted a lot of interest in many studies over the past decade as a means to quantify human visual attention and visual saliency within image processing.
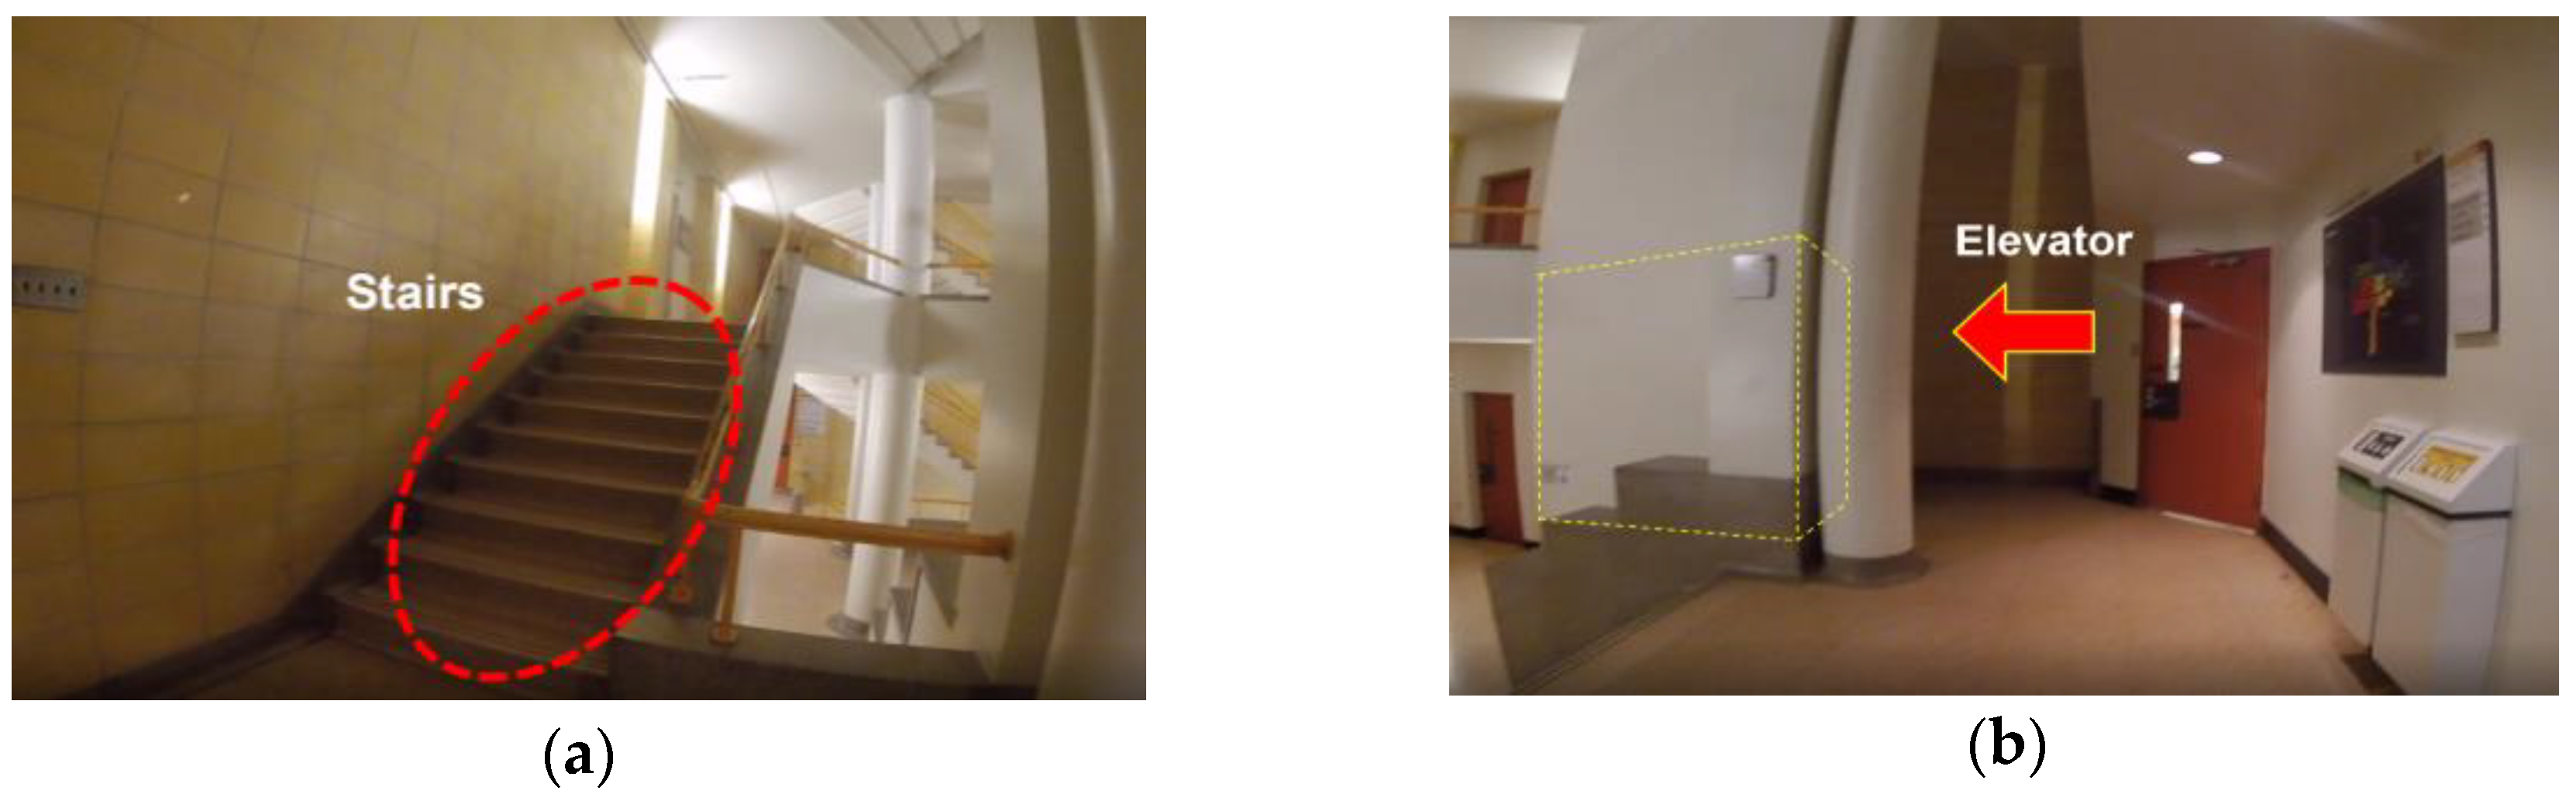
Hence, the visual saliency attribute needs to be added to the category mentioned by Park et al. [
36] for measuring the level of accessibility of obstacles and facilitators. As can be seen in
Figure 3, the staircase is viewed as an obstacle with high visual saliency by a person with a wheelchair while the elevator is not visually salient. The level of accessibility is one of the most important factors that needs to be considered, especially for PWMD, as the obstacles and facilitators may limit or help their mobility, respectively. Hence, this factor plays an important role in personalizing the legibility assessment of an indoor environment.
To sum up, in this section, the legibility was conceptualized based on the interactions between a person and the environment. These interactions, based on the iterative sense–plan–act process, generate a supportive cognitive map for mobility performance. Hence, the factors that have an impact on the legibility of the environment for PWMD were introduced. Following this, the legibility for PWMD, based on these contributing factors, is estimated in the next section.
4. Estimation of the Personalized Legibility for PWMD based on the Proposed Framework
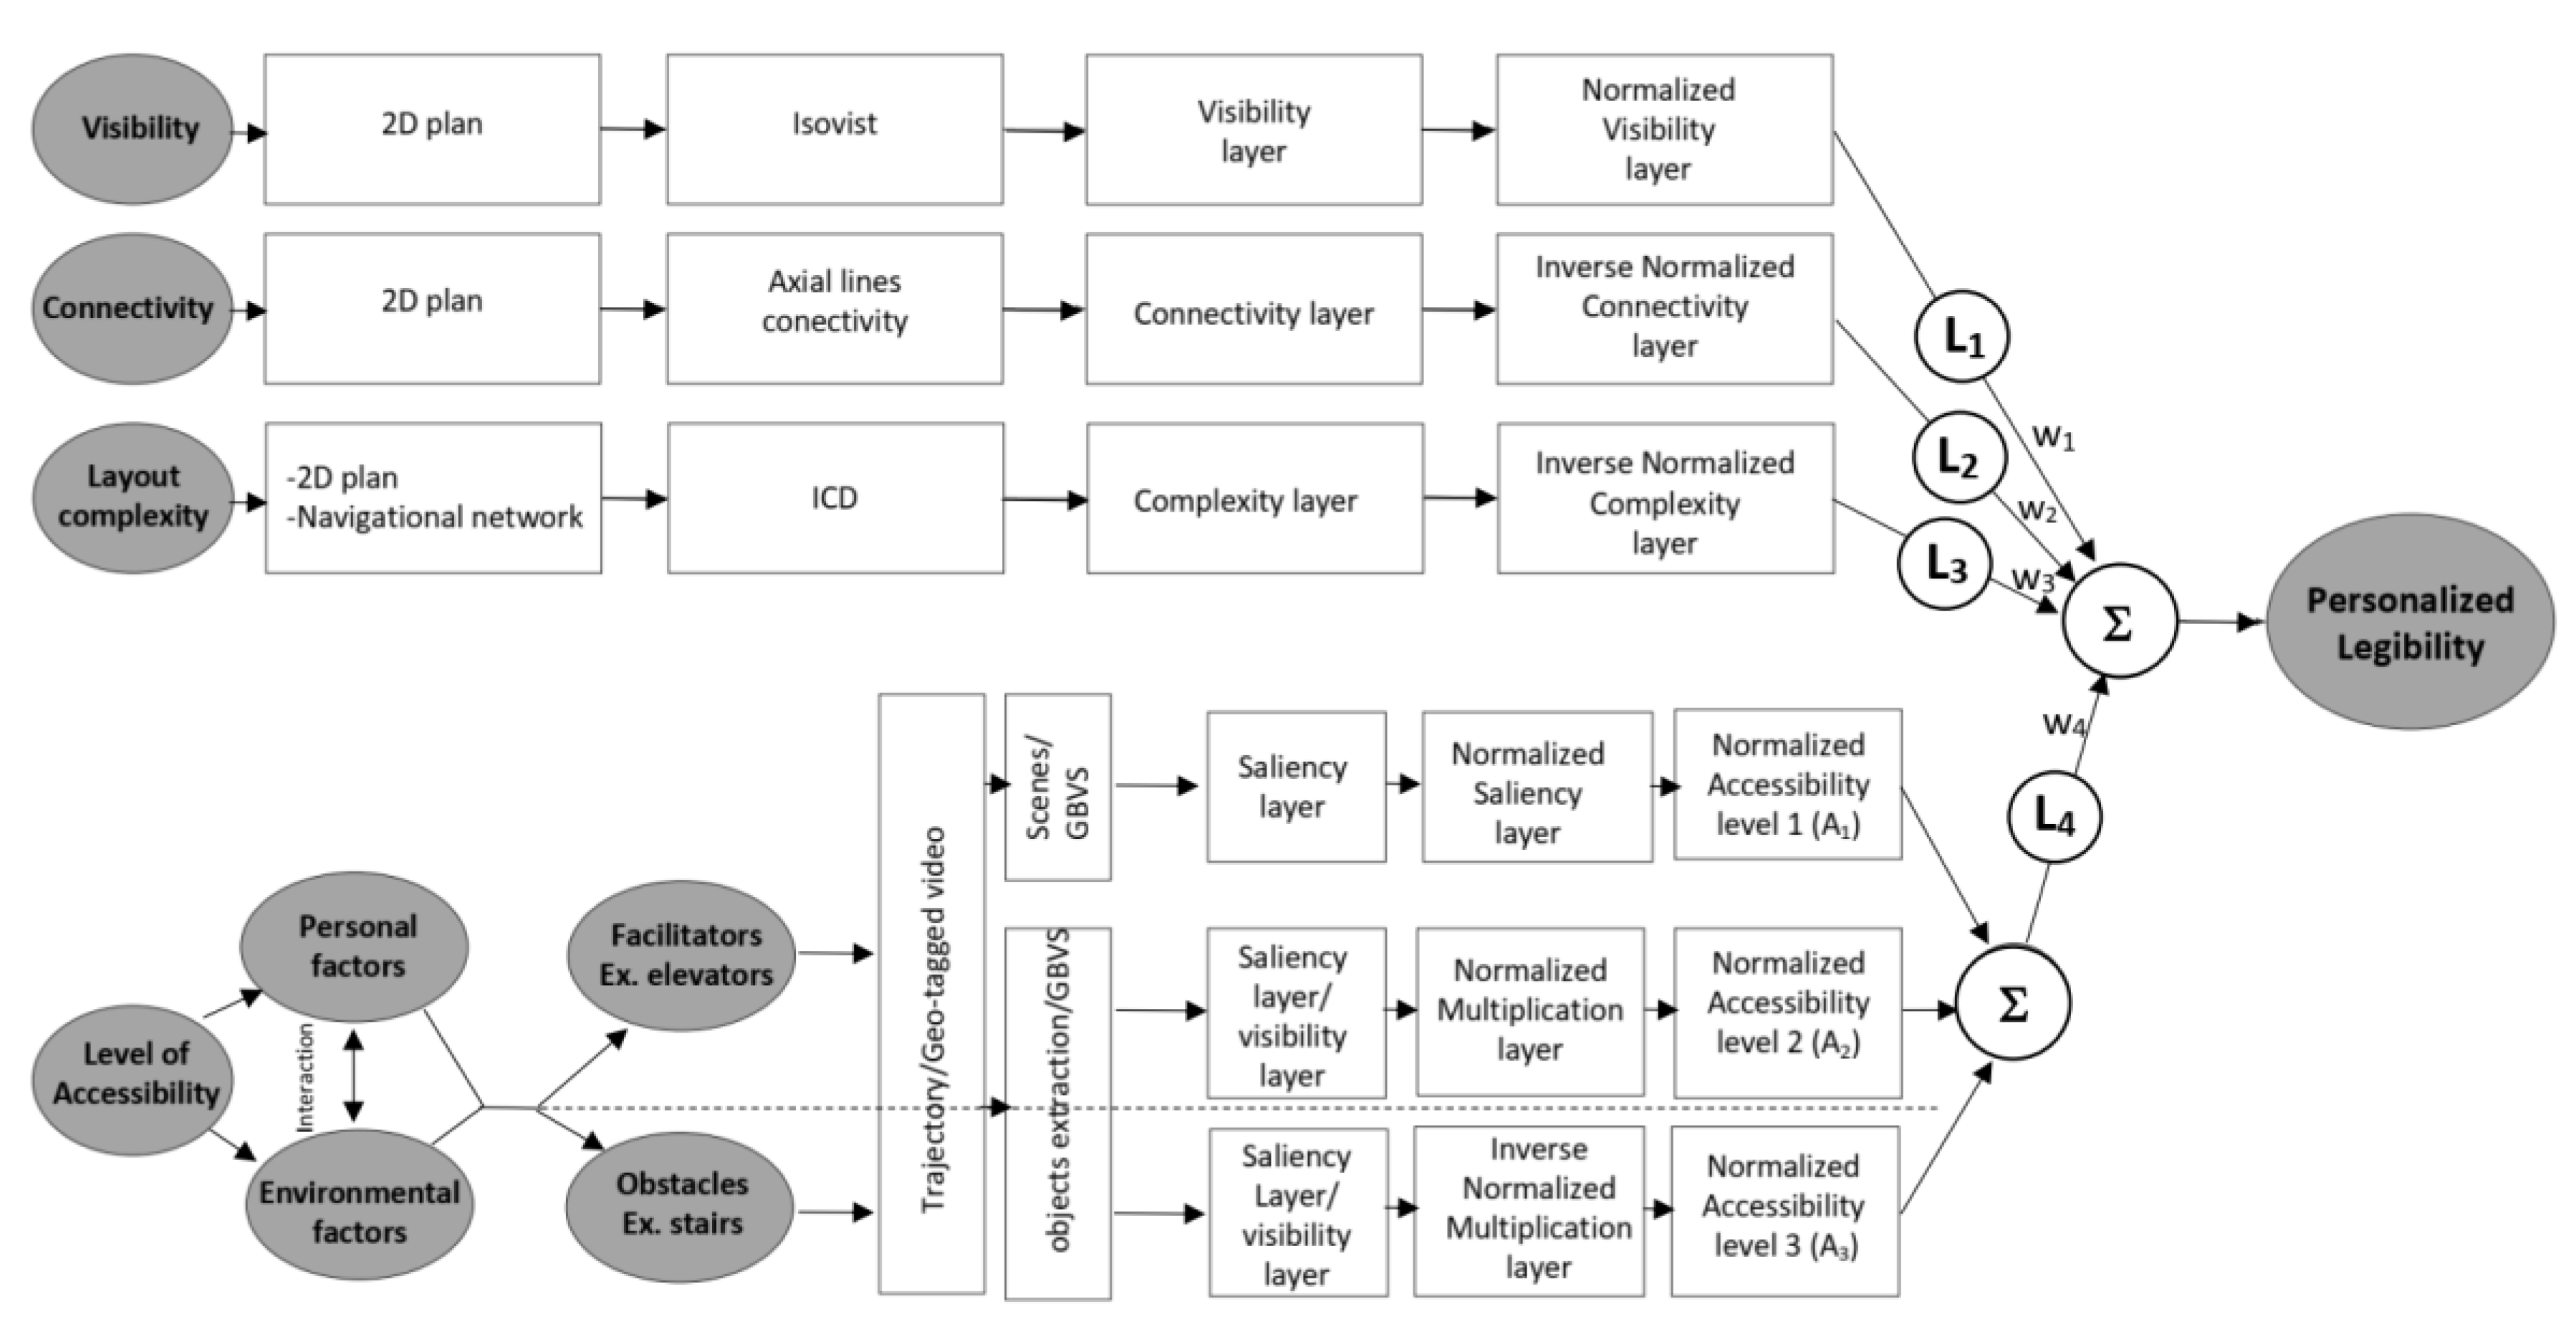
According to the proposed framework for legibility assessment of PWMD, a legibility estimation approach is developed to consider the legibility factors. The legibility estimation approach utilizes the level of visibility access, the level of connectivity, the level of complexity of building layout, and the level of accessibility (facilitators/obstacles) factors to model the legibility of an indoor environment for PWMD (
Figure 4). The inputs for each factor include a 2D building plan, a navigational network, a trajectory, and a geo-tagged video. Among these inputs, the trajectory and geo-tagged video are determined based on the mobility of PWMD. The trajectory and geo-tagged video are used for visual saliency calculation with respect to location and direction of a person with motor disability. The effective methods for the estimation of visibility access, connectivity, complexity, and level of accessibility (facilitators/obstacles) factors and integration are stated in the following steps.
The following paragraphs briefly present the computational aspect of our method.
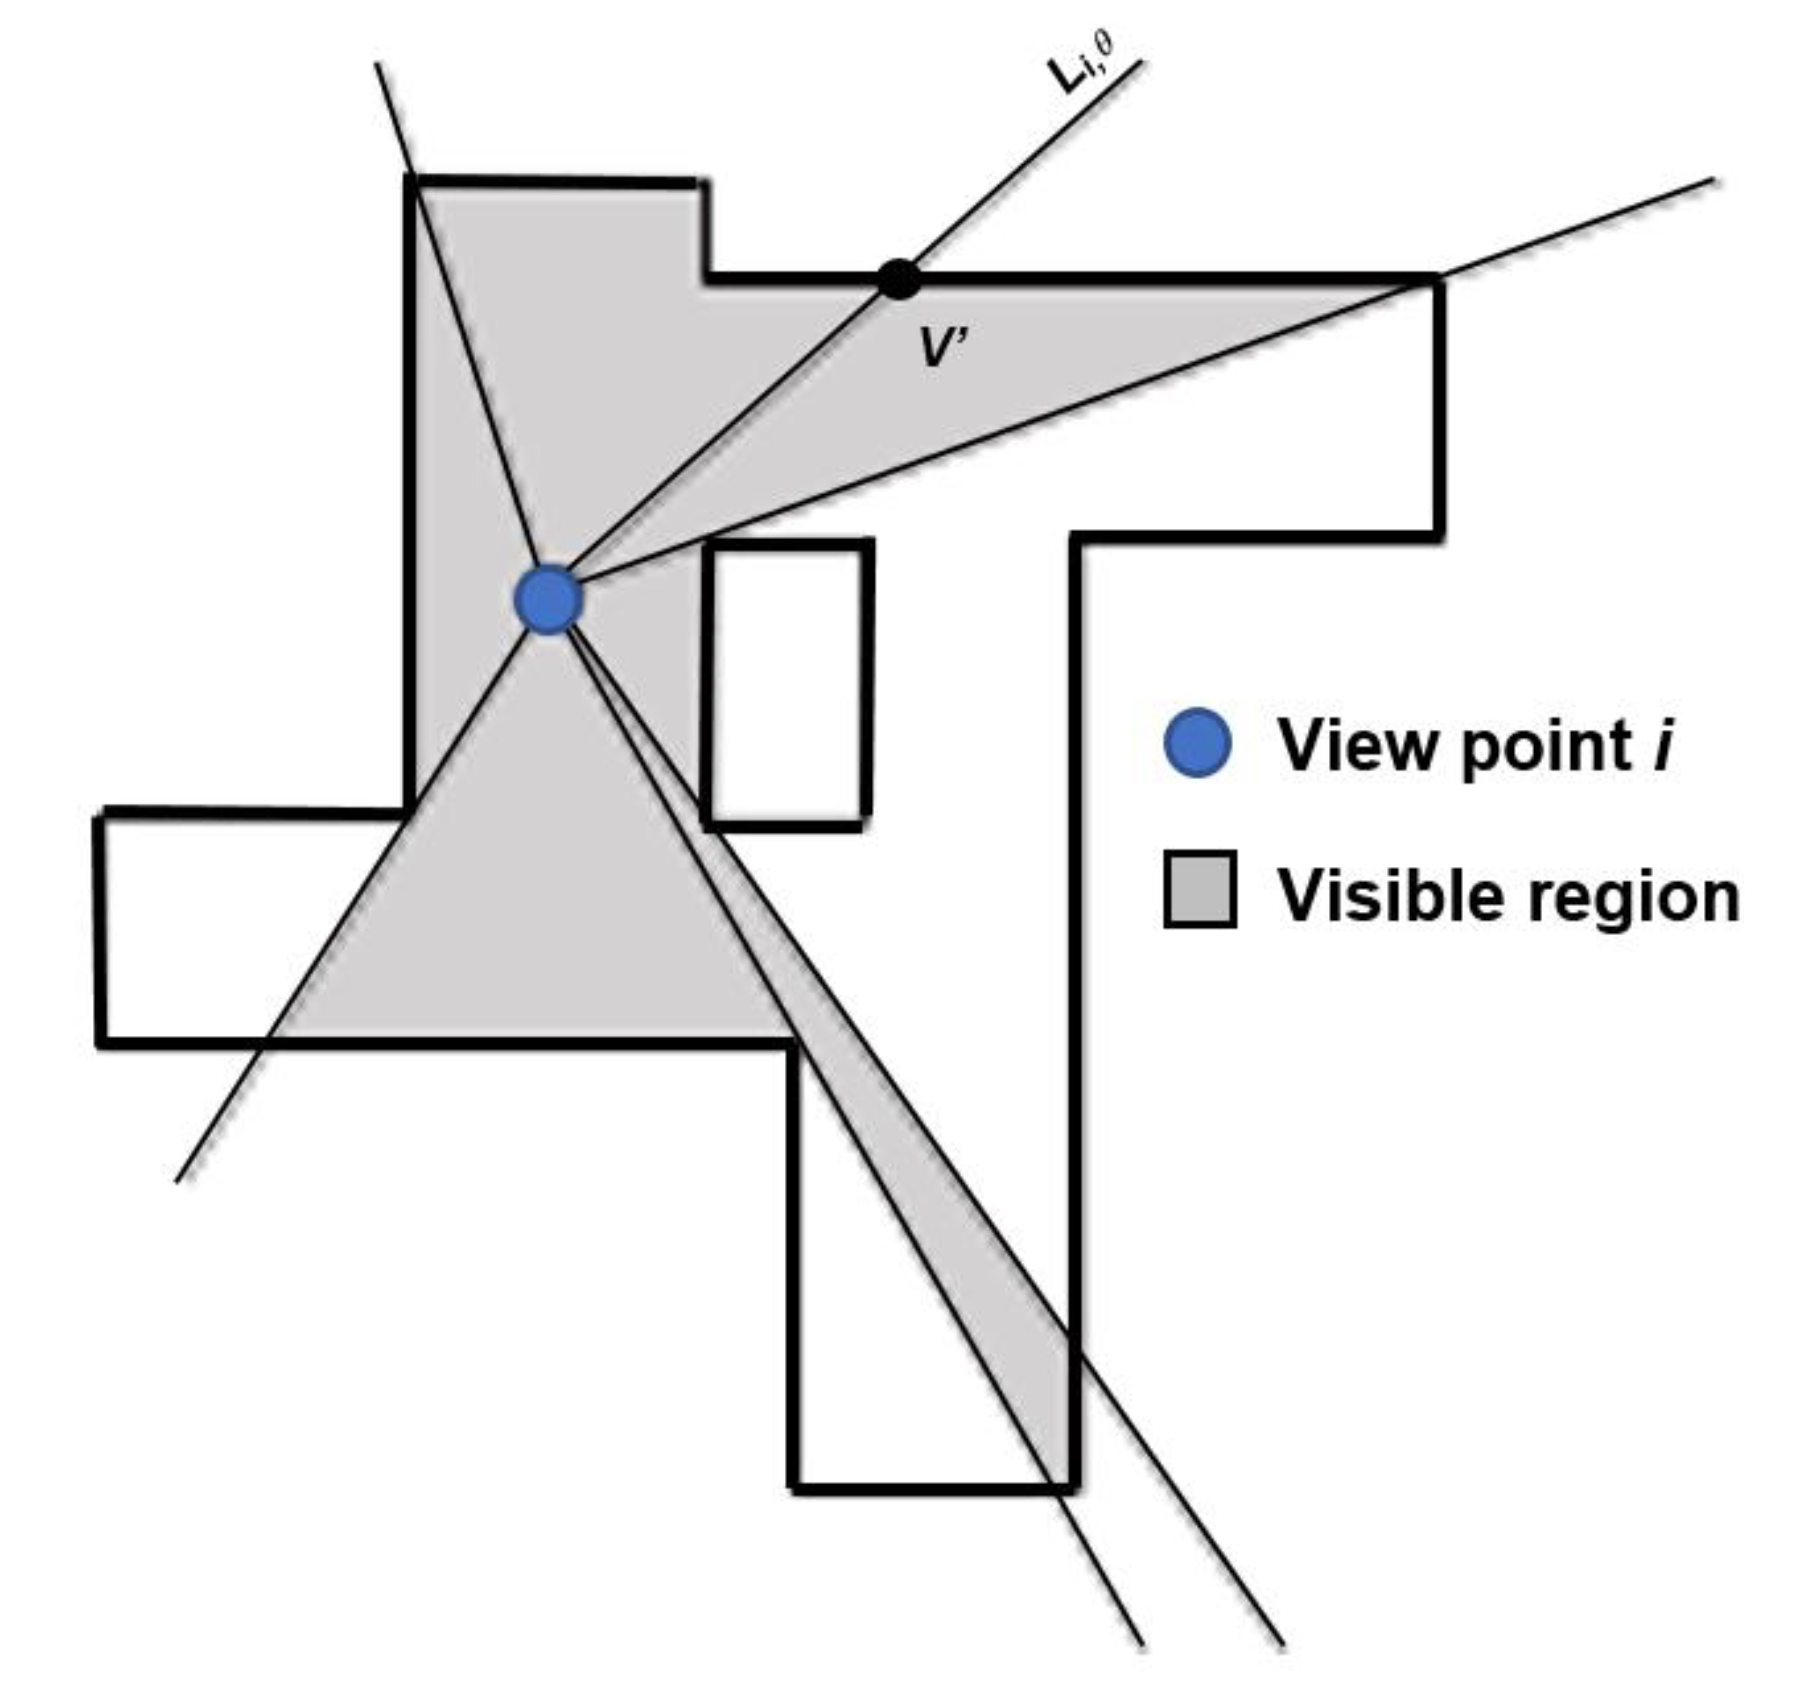
(a) In order to calculate the visibility access, a visibility layer is created using a 2D plan. Then, the isovist method [
24] is used to indicate different levels of visibility in any location on the map. Isovist refers to the calculation of the visible region of the environment from a given viewpoint (
Figure 5).
The area of such a visible region is considered as
Isovist for each viewpoint. A 2D building plan includes the walls and obstacles that obscure the lines of sight. The visible area for viewpoint
i and
Isovist are calculated as follows:
where
v is any visible point in
R (2D space) from viewpoint
i and
v′ is the visible boundary points that can be determined based on the ray tracing boundary
Li,
θ from viewpoint
i.
Isovist_layer is the
Isovist value of all grids in the whole area.
L1 denotes the first normalized legibility factor. The normalization is done so that the data are shifted and rescaled in a range of 0 to 1. This normalization process leads the maximum and minimum of data being converted into 1 and 0, respectively.
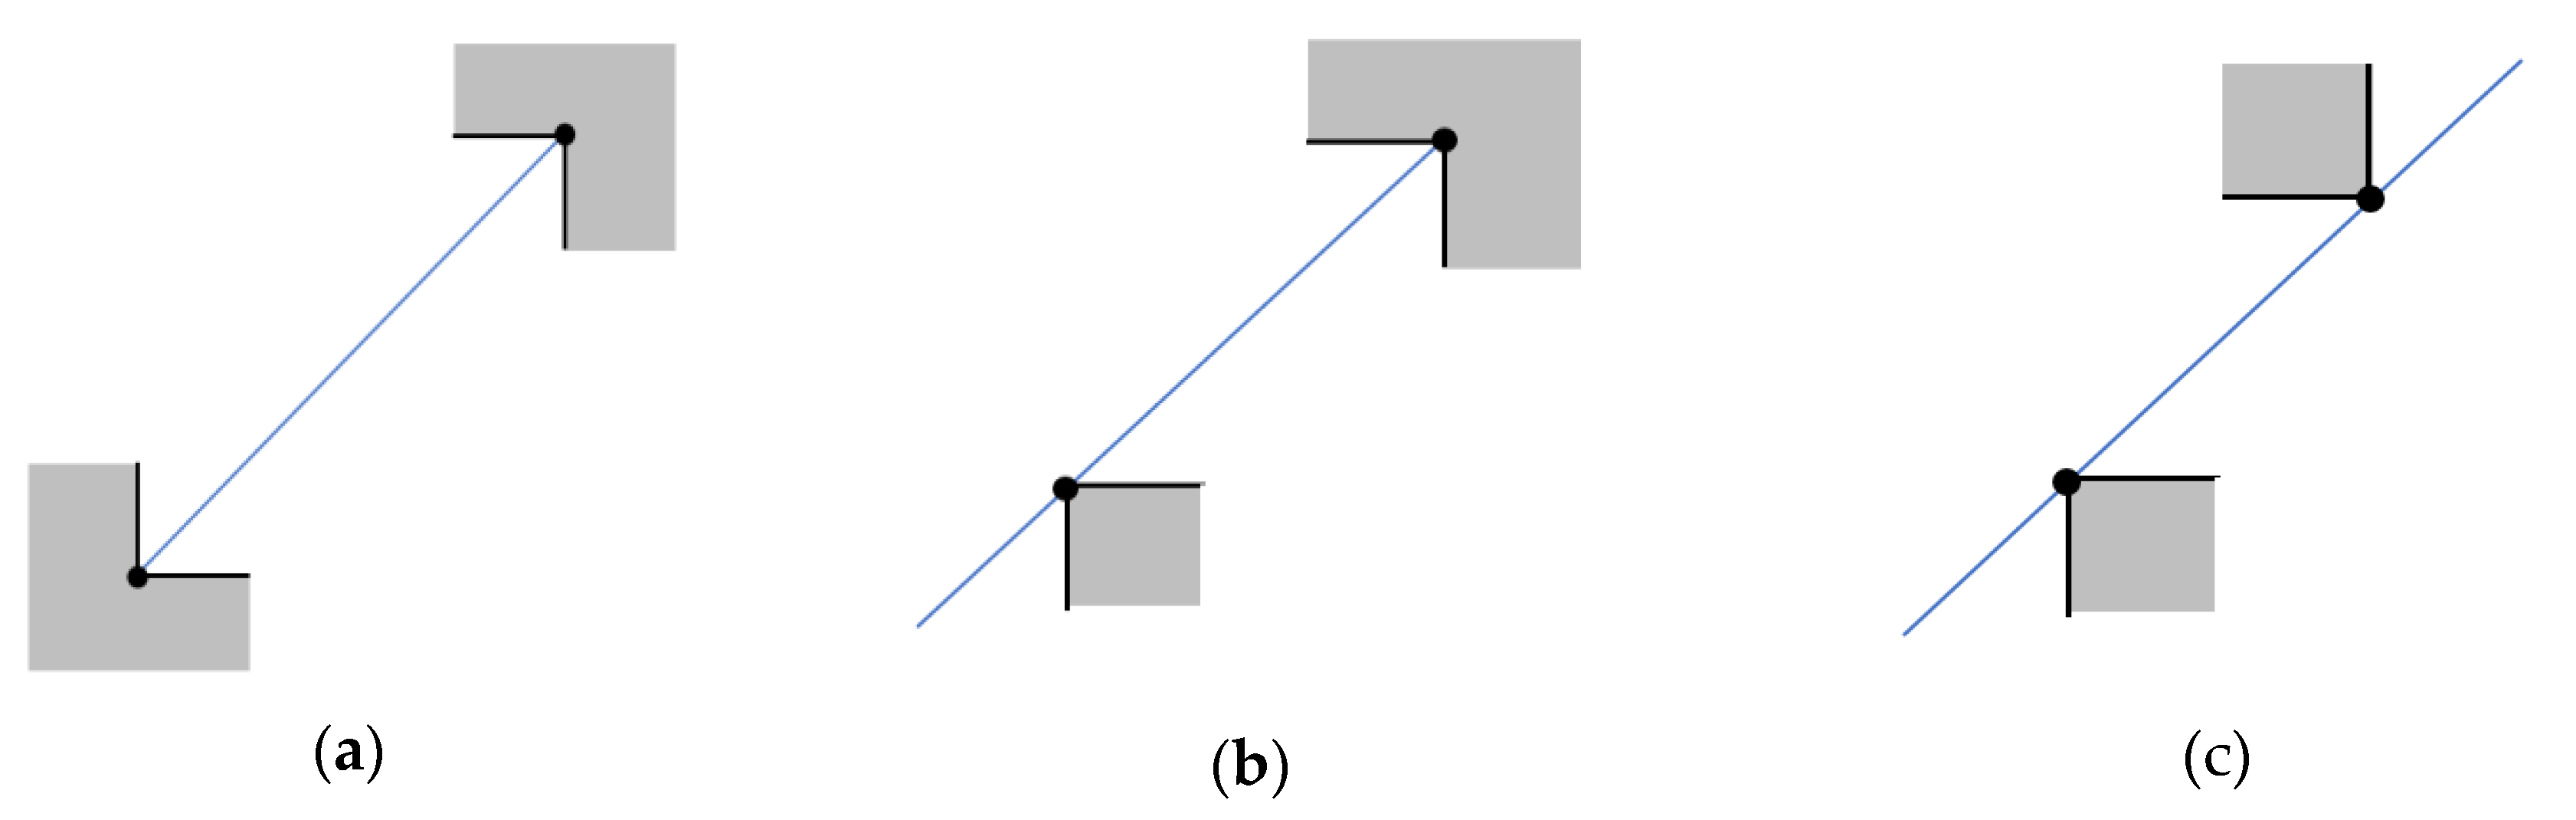
(b) The level of connectivity is calculated based on the axial lines. An axial line is any line that links two inter-visible vertices inside a space (
Figure 6). Through the number of intersections among these lines, the connectivity between spaces is determined. There are three cases to generate these lines: (1) both vertices are convex, (2) one is convex and another is reflex by where the line can be extended through the space, (3) both are reflex as the line is extended from both vertices (
Figure 6). With all of these lines, the connectivity is calculated based on the number of intersections of an axial line with the other axial lines.
where
Connectivityi is the number of intersections of the nearest
axial_line to point
i and other
axial_lines and
L2 denotes the second inverse normalized legibility factor that includes the connectivity values of all grids in the whole area. The inverse normalization is done so that the data are shifted and rescaled in the range of 1 to 0. This function converts the maximum and minimum of data into 0 and 1, respectively. The inverse process is chosen because of the negative impact of the connectivity on the legibility.
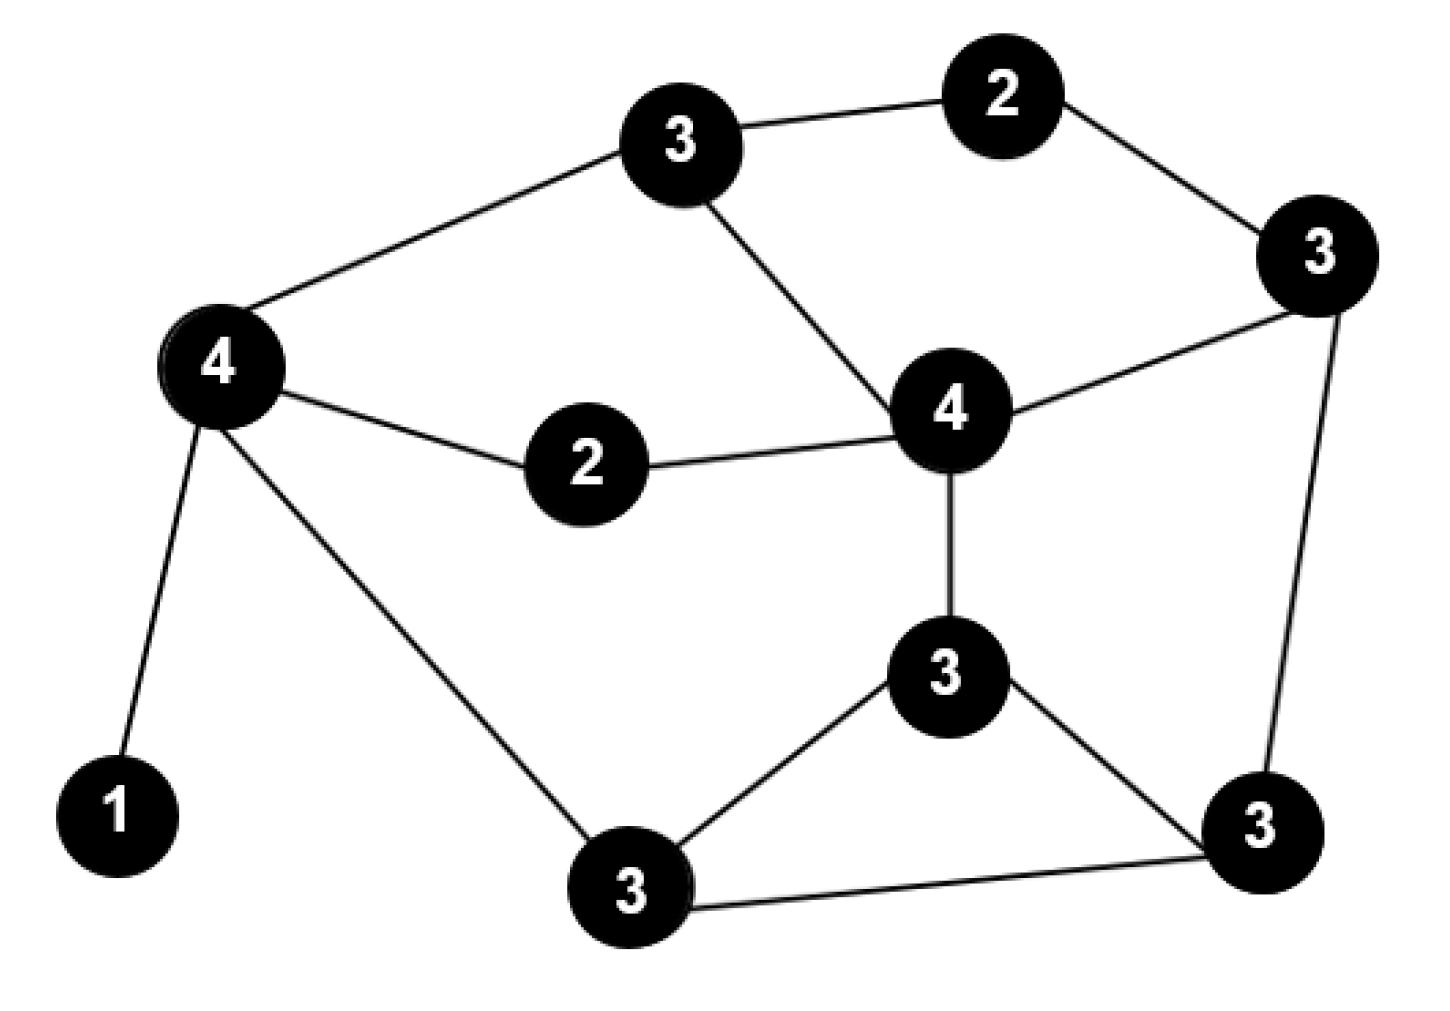
(c) The complexity of building layout is calculated based on the interconnected density (ICD) of a navigational graph. The ICD of a vertex of a graph is the number of edges that reach to the vertex. For example, as illustrated in
Figure 7, the ICD varies from 1 to 4 for each vertex. The higher ICD shows the higher complexity of the graph in each vertex, which also indicates the complexity of the building layout.
where the
ICDi is the complexity of the layout calculated based on the degree of the nearest node of the navigational graph to point
i.
L3 denotes the third inverse normalized legibility factor. The inverse is chosen because the complexity has a negative effect on the legibility.
(d) The level of accessibility is calculated based on the facilitators and obstacles according to the interactions between PWMD and the environment. In addition to object classification into facilitators and obstacles, the visual saliency of the environment (each scene) perceived and attended by a PWMD in situ is a facilitator for him/her, which increases the legibility of environment.
The visual saliency of scene calculation is carried out for each frame of a geo-tagged video on a trajectory using visual attention models (
Figure 8). Borji and Itti [
61] divided the visual attention models into eight classes: (1) Bayesian: learning based on past experience to find target features, (2) cognitive: use of band-pass filtering such as via a difference of Gaussians (DOG) algorithm that corresponds to attention as measured by psychological experiments [
54], (3) decision theories: these models are based on people’s decision-making processes, they are a combination of top-down and bottom-up models of human attention (e.g., Gao and Vasconcelos [
55]), (4) graphical: probabilistic models that estimate the dissimilarity probability for each region in relation to other regions such as the graph-based visual saliency (GBVS) algorithm [
56], (5) information theoretic: based on the most informative part of an image [
57], (6) pattern classification: these models employ a machine learning process to extract the salient parts of a new image based on eye fixation datasets and labeled salient areas in image databases as training datasets [
58], (7) spectral analysis: converting the image into the frequency domain and capturing salient parts in this domain [
59], and (8) other categories [
60]. According to Sharma [
16], of the eight categories, the GBVS algorithm (#4) gives the best results observed without training datasets, based on correlations between image features and observed eye saccades obtained for humans. As a consequence, this result led us to consider this algorithm for the visual saliency analysis. Based on the GBVS algorithm, the visual saliency of each position on the trajectory is formalized with the ratio of the sum of pixel saliency to the number of pixels in a frame.
where
Sk is saliency array of Frame
k and
n is the number of frames recorded for a geo-tagged video in Equation (9). In Equation (10),
SPk is the saliency of position
k on a trajectory,
i,
j show the position of pixels, and
m1 and
m2 are the frame’s width and height, respectively.
A1 is the first normalized factor for the accessibility assessment.
In order to assess the accessibility level of each segment of a route for legibility assessment for PWMD, firstly, we need to identify and detect all environmental factors affecting the mobility of these people. These factors may include both obstacles (e.g., slopes, steps, etc.) as well as facilitators (e.g., signs, elevators, etc.). It is important to mention that the concepts of obstacles and facilitators are not absolute characteristics of objects and may vary from one person to another depending on the nature of the interactions that people have with those objects. In this work, these elements are identified based on their visibility and visual saliency inside each frame of the geo-tagged video. Based on our team previous work [
14], the accessibility level of the route segment is estimated using a confidence-based approach. This means that we ask PWMD to indicate their confidence level to carry out a mobility task in the presence of an obstacle (e.g., ramp with a certain slope value, steps, etc.) or facilitators (e.g., signs). Of course, the level of the confidence of people to do such an action is dependent on their capabilities, experiences, and personal skills. Hence, the accessibility level for a segment of a route is evaluated based on the results of the interactions between personal factors and the environmental factors and varies from one person to another. The level of accessibility in the presence of obstacles and facilitators is then scaled from 0 to 1 (Equations (12) and (13)).
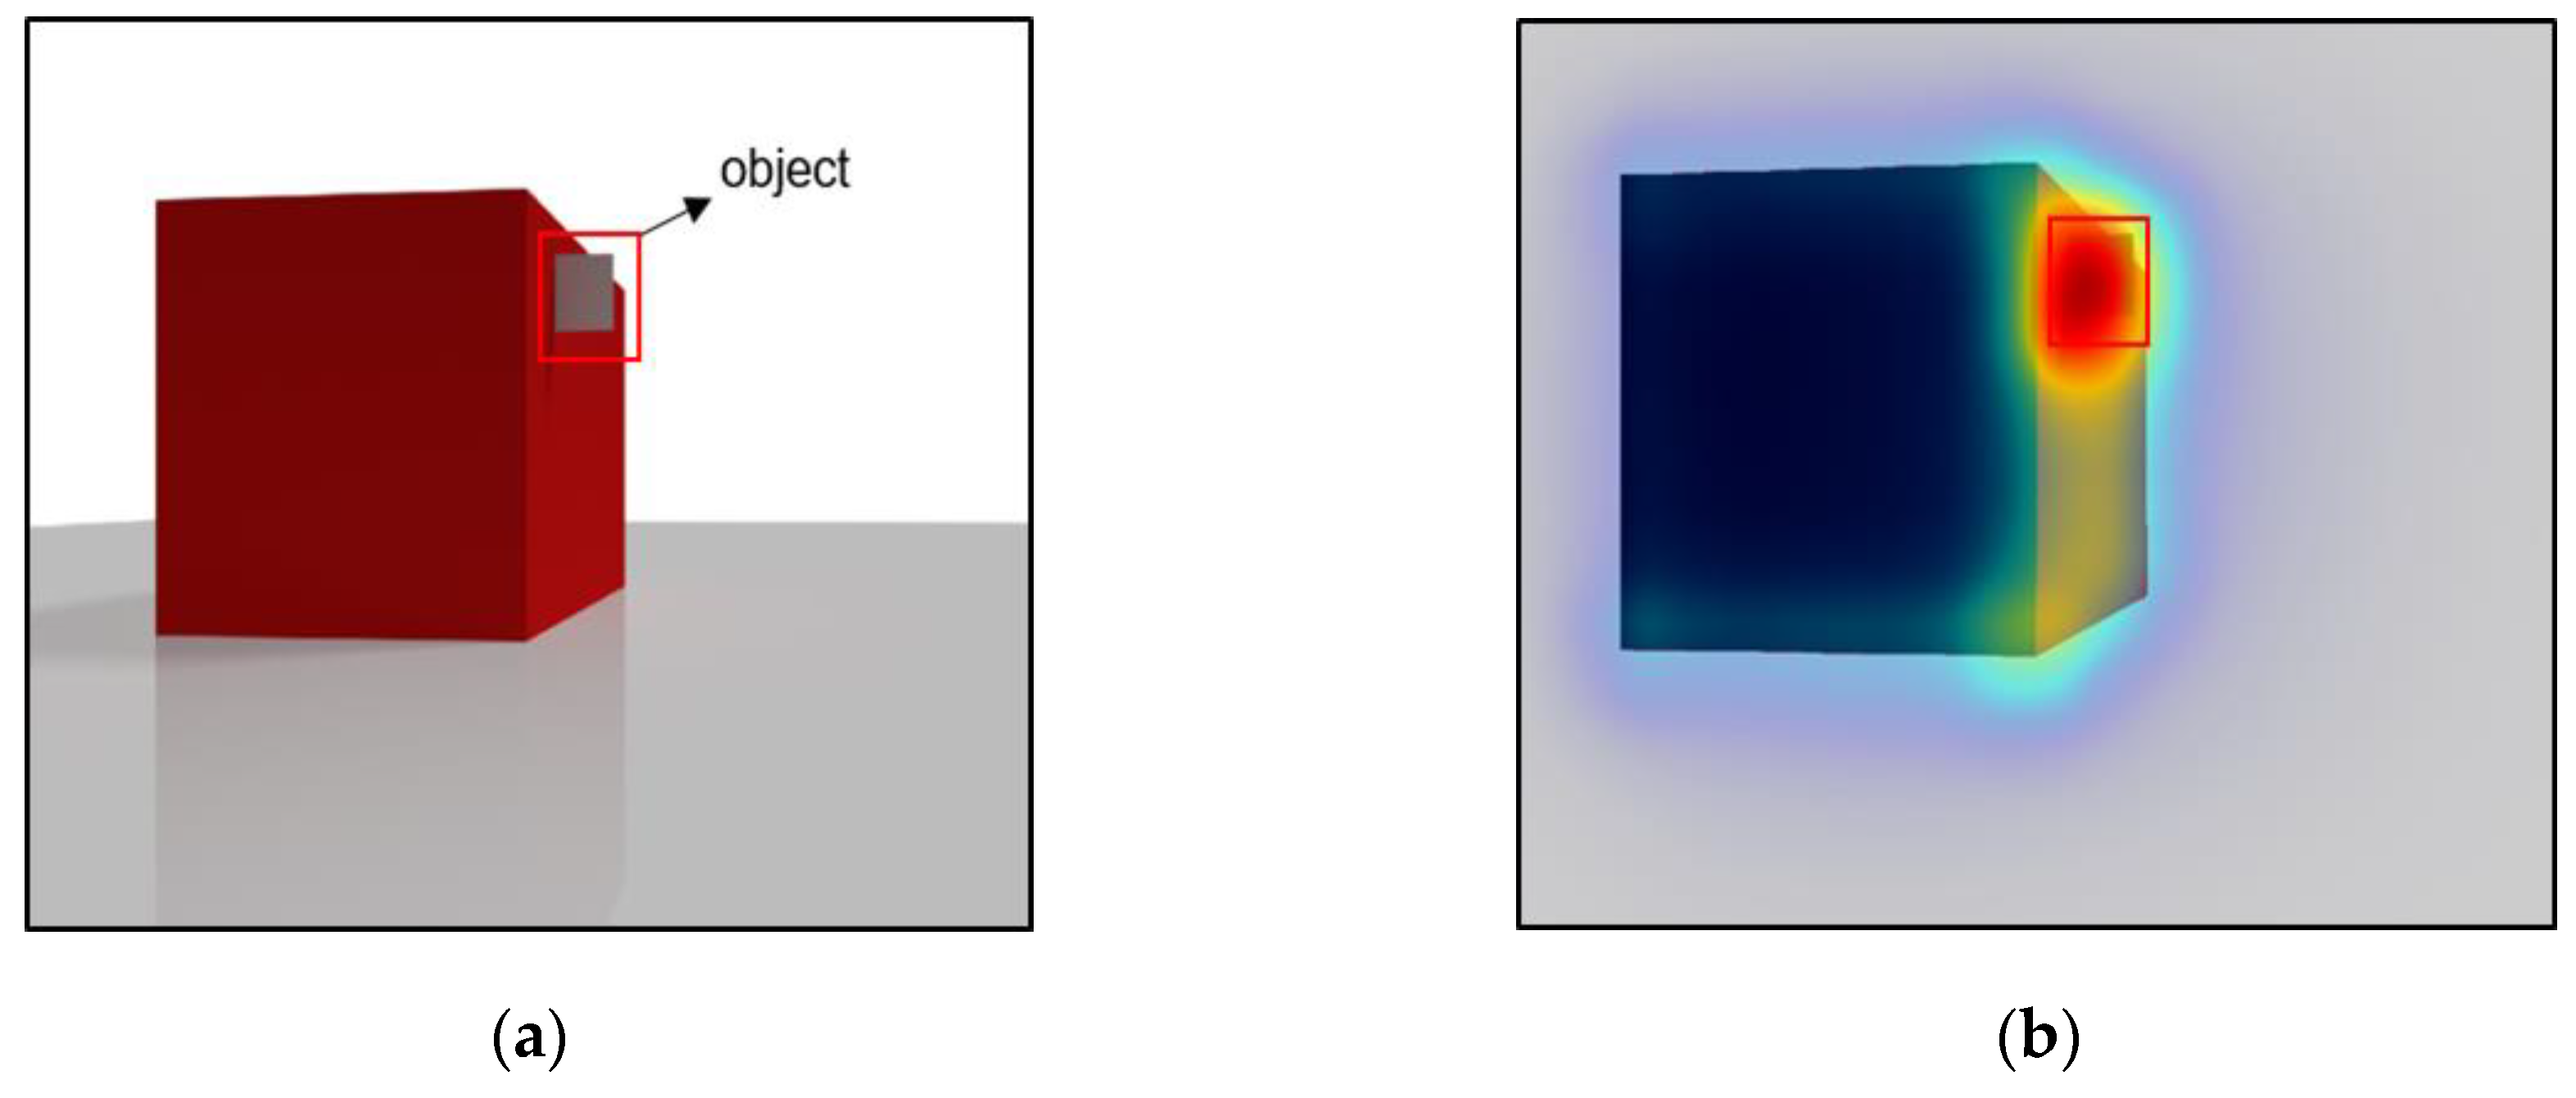
Secondly, the visual saliency of each frame is calculated based on the GBVS algorithm (
Figure 9b) (Equation (10)). Thirdly, the ratio of object pixels to the total number of pixels in the frame is calculated as visibility (Equations (16) and (17)). Then the sum of visual saliency of object pixels over the number of object pixels in the frame is estimated as saliency (Equations (14) and (15)). For each position on the trajectory, the visibility and saliency of each object are determined. In order to integrate the visibility and saliency, they are normalized (facilitators) or inverse normalized (obstacles) and multiplied by each other to measure the accessibility level of each object for each position on the trajectory (Equations (18) and (19)). In the last step, all of these accessibility levels are integrated to create a layer that shows the accessibility level of facilitators and obstacles at each location of the building layout.
where
Fk and
Ok are the layers in the range between 0 and 1 that show which pixels are and are not part of a given object, with the indication the accessibility level assessed based on the confidence level of PWMD (
confidence level is scaled between 0 and 100%). For instance, the confidence level of a PWMD to move with a wheelchair in a segment with the presence of a sign as a facilitator is 90%, a slope as an obstacle is 70%, and a step as an obstacle is 0%. These confidence levels may have different values for another PWMD with regard to his/her own personal capabilities, experiences, and skills.
SaliencyFk and
SaliencyOk are the layers that indicate the visual saliency of facilitators and obstacles.
VisibilityFk and
VisibilityOk are the visibility layers of facilitators and obstacles.
where the
A2 and
A3 denote the level of accessibility of facilitators and obstacles, respectively.
L4 is the normalized level of accessibility as the fourth legibility factor that is calculated by the sum of the accessibility levels in the presence of facilitators (scenes and objects) and obstacles.
Finally, all generated layers are normalized because of the different scales of factors, and afterward integrated. The integration of visibility, connectivity, complexity, and level of accessibility after normalization is conducted using a weighted sum function. This final layer indicates the legibility value of the indoor environment based on the PWMD capabilities.
where
Li denotes each legibility factor layer and
Wi is the significance weight of each legibility factor. The sum of weights in this equation is equal to one. For the implementation in the next section, we consider equal weights for these factors.
5. Case Study
To illustrate and evaluate the proposed approach for legibility assessment, the Quebec City Convention Centre was used as a case study. The Convention Centre is one of the largest buildings in the old city, with several floors connected via numerous stairs and elevators. It also links two large hotels and houses several shops and restaurants, as well as a large public parking lot. Over 200 events are held annually in the center and more than 200,000 people visit this center each year. This building is, for the most part, accessible to anyone using a wheelchair. According to the standards of the National Building Code of Canada and the American Disabilities Act, the Kéroul group (a non-profit organization in the province of Quebec that promotes accessible tourism) has certified the convention center as an accessible indoor building for PWMD.
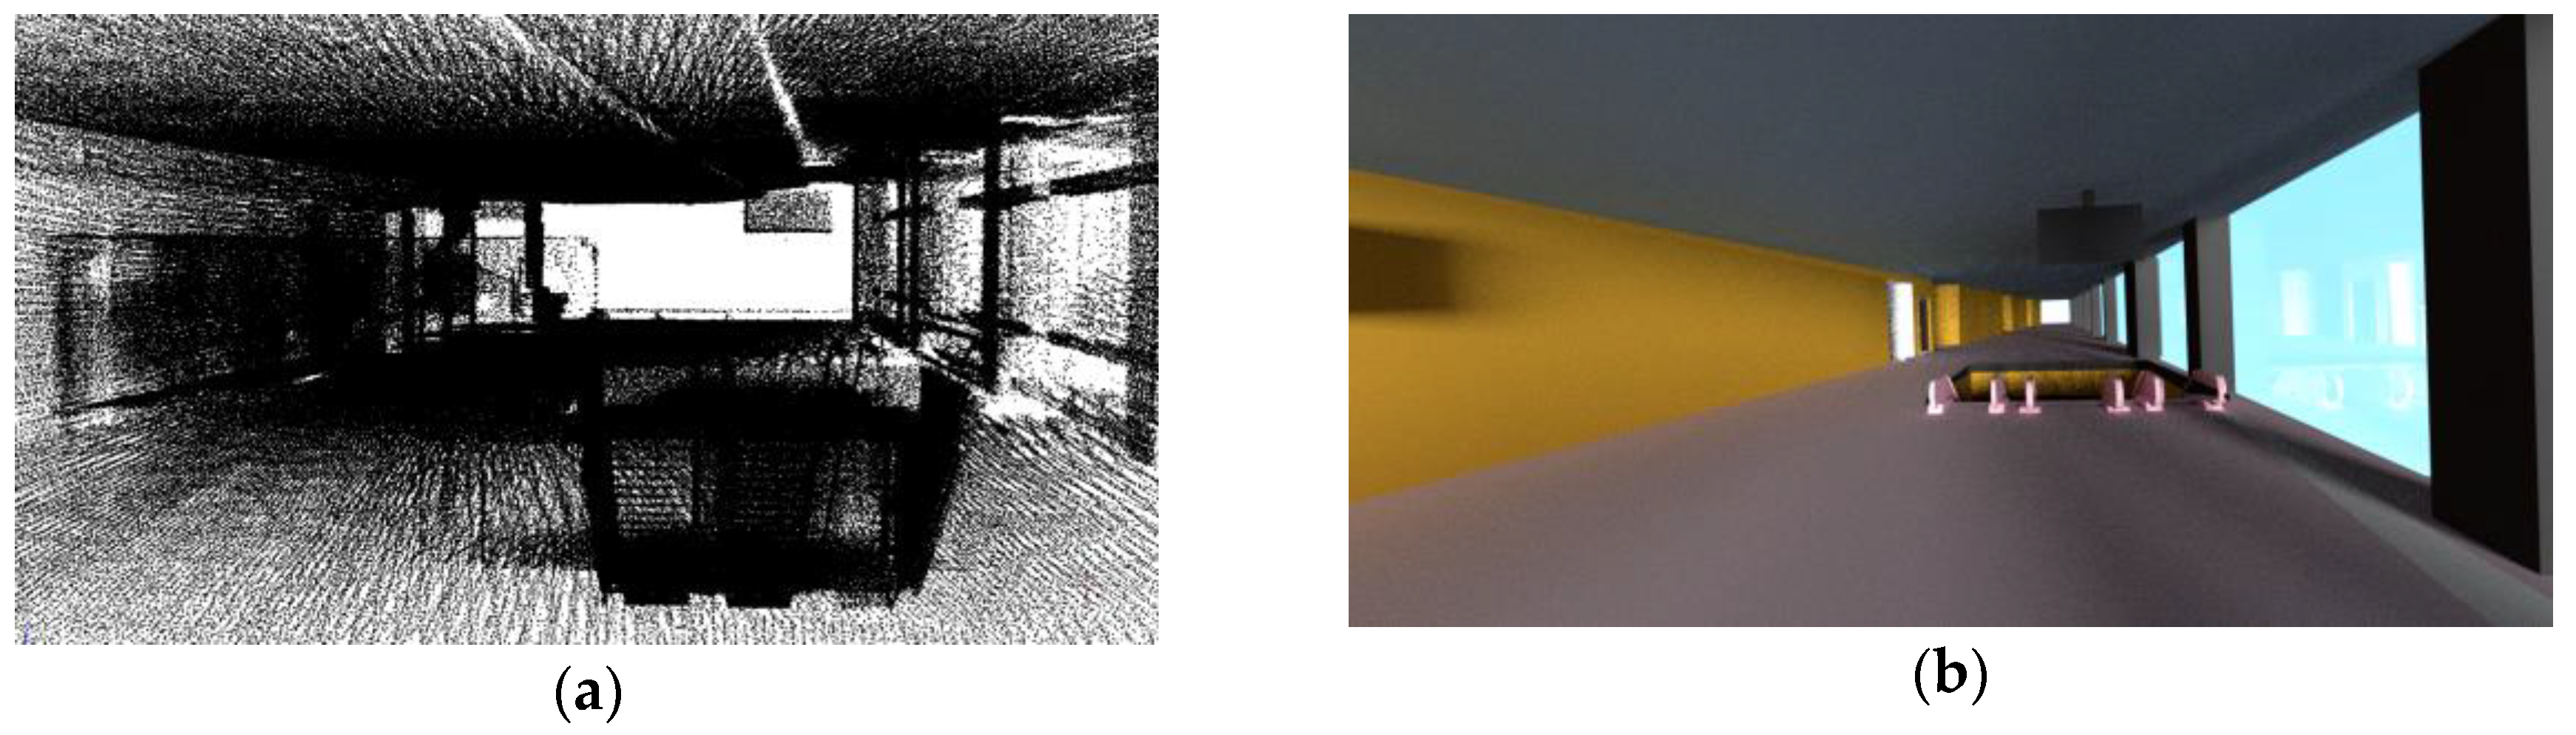
In order to measure the building’s legibility, we created a 3D model of the building. For this purpose, we collected 3D point clouds using lidar data.
Figure 10b shows the 3D model of this building constructed from the point clouds (
Figure 10a). For this task, a GeoSLAM laser scanner (ZEB revo model) and a built-in camera designed for collecting indoor 3D points were used. Then, we extracted a 3D model from the point cloud as well as a 2D plan of the building.
For visibility calculation, the isovist tool of Depthmap software [
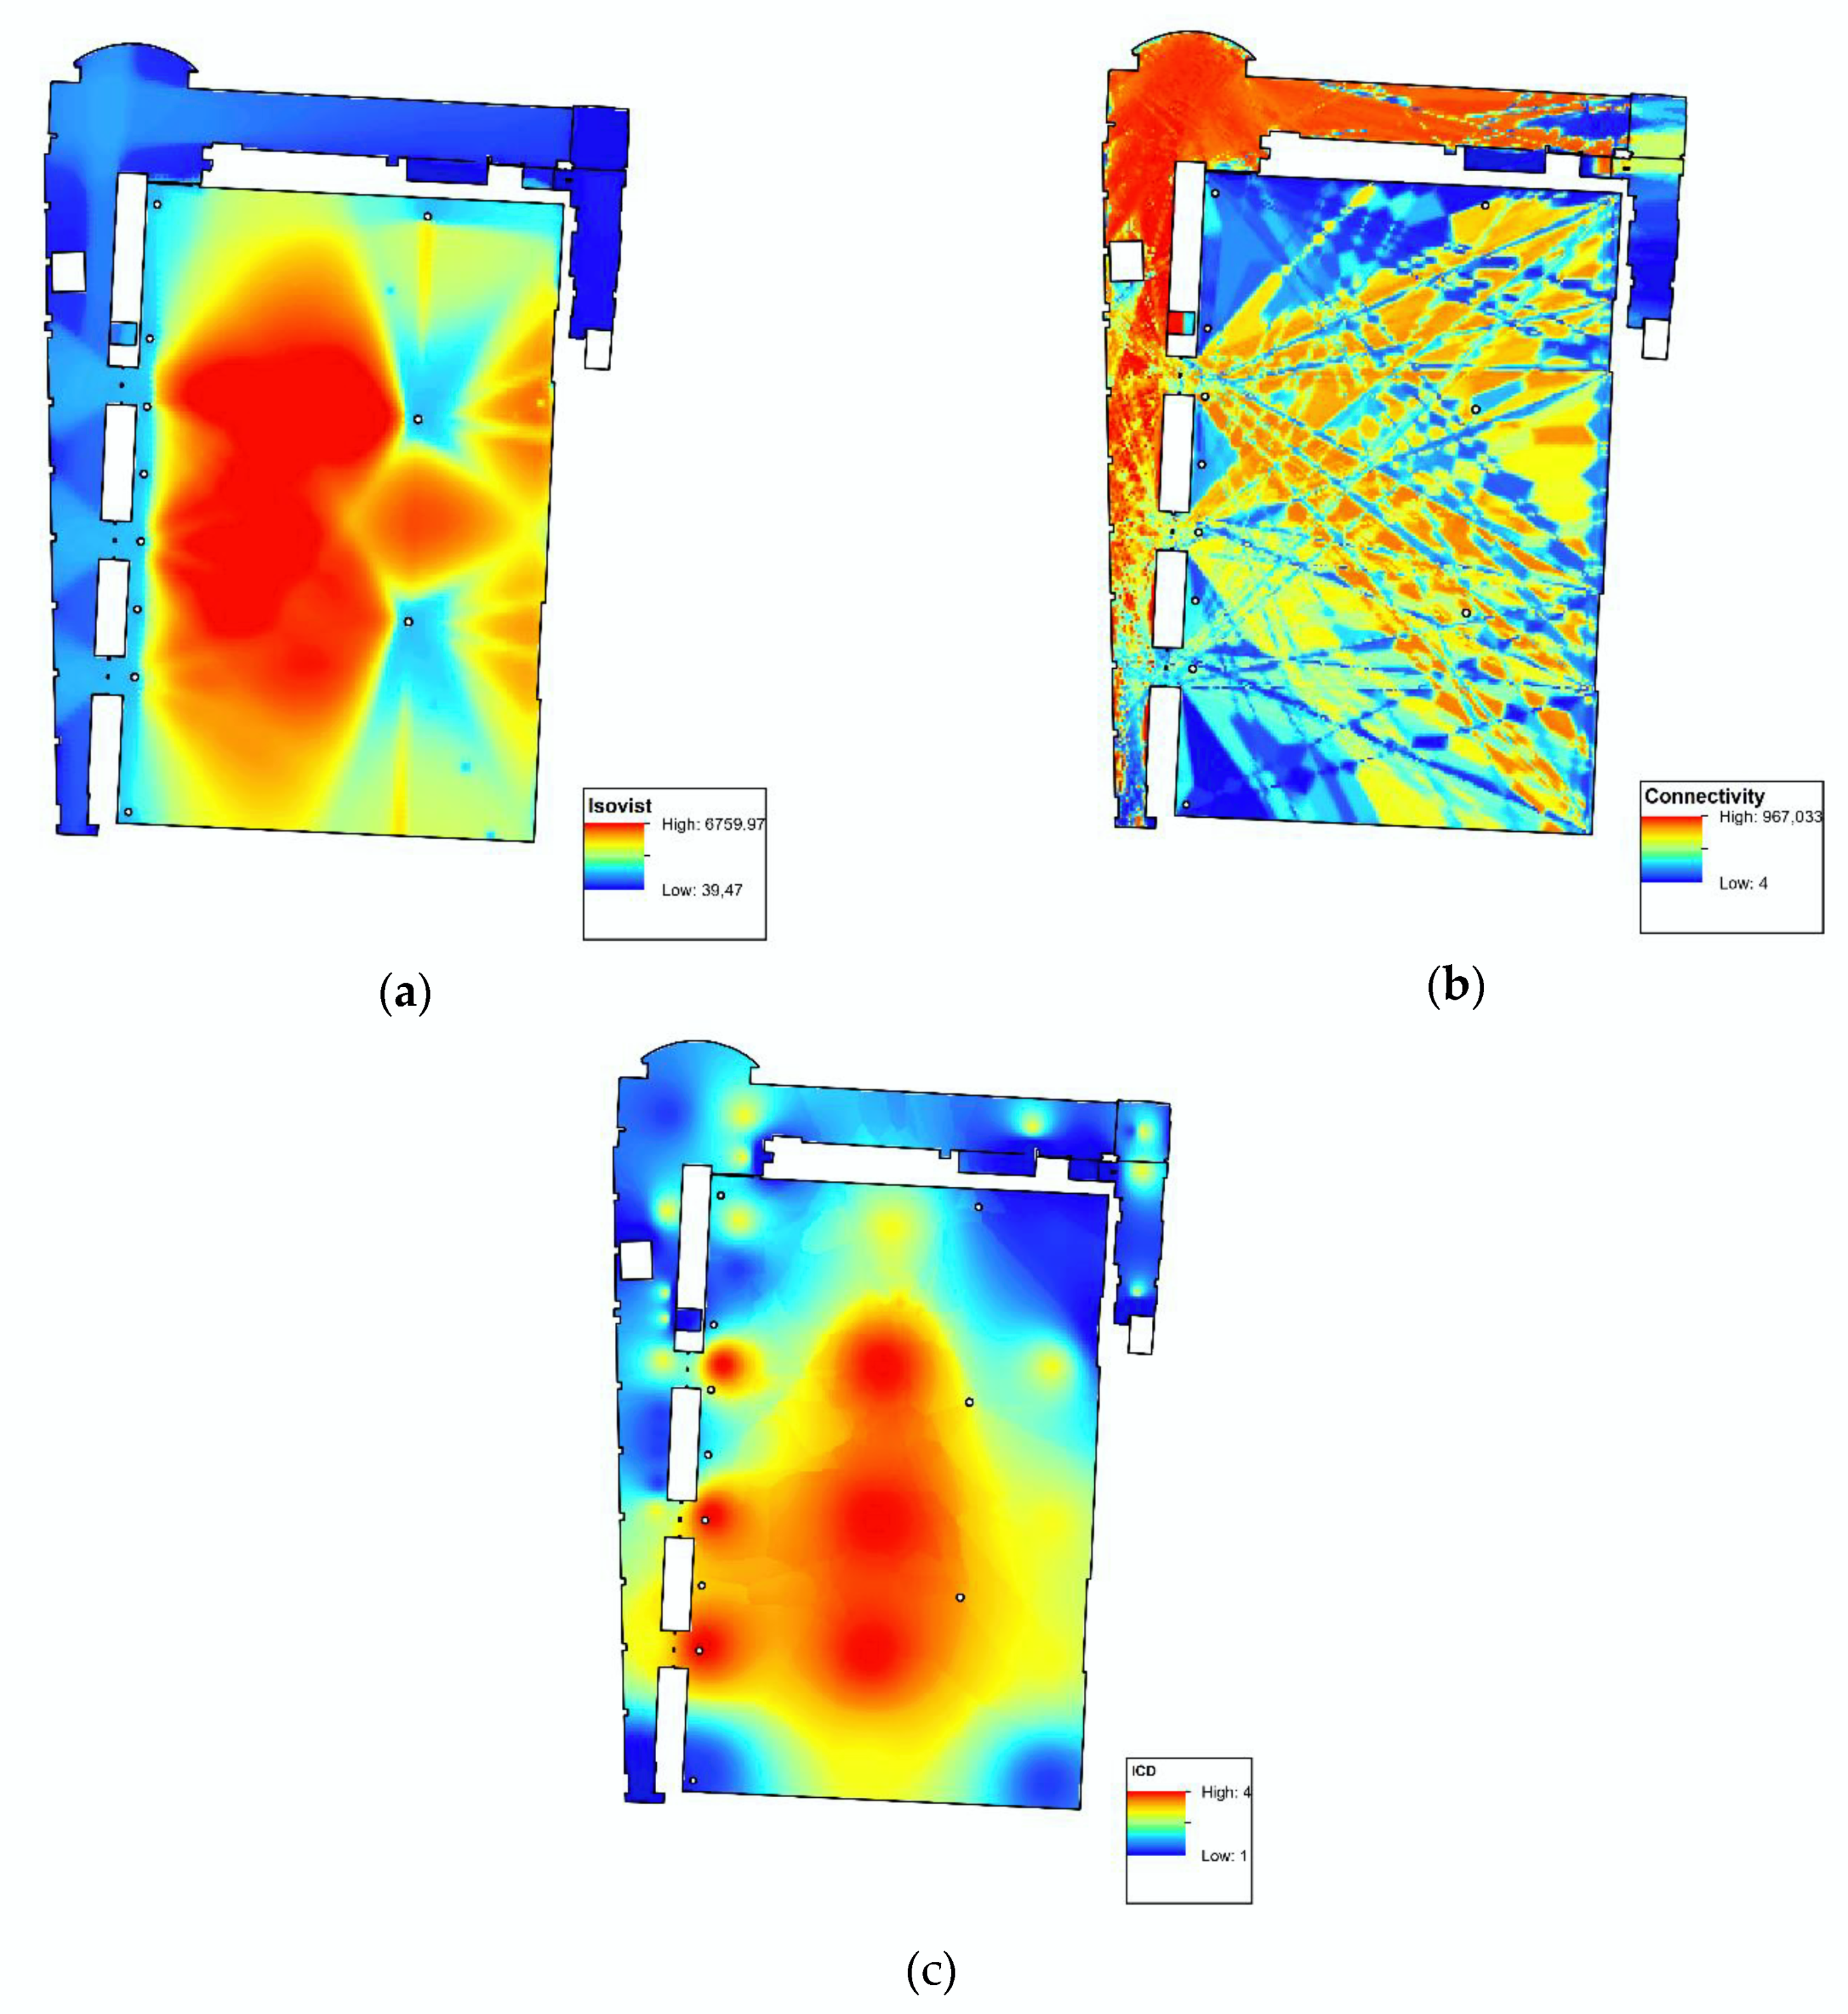
37] was used to extract the visibility layer. To achieve this calculation, floor spaces were divided into a grid. From each cell within the grid, the visible areas were considered to estimate the visibility level of each cell and the results were saved as a raster layer.
Figure 11a shows the output visibility layer. The places with high visibility are considered to be more legible compared to the other cells.
The level of connectivity suggested by O’Neill [
12] was also applied to model this component of legibility. This factor was calculated based on the axial map method. For this, we used Depthmap software to create a layer with multiple axial lines on the building floor. Every line was then given a numeric label determined by the number of connections with other axial lines. Inside the building, on the fourth floor, the maximum number of connections was calculated as 967, and the minimum was four connections (
Figure 11b).
The ICD was another factor used to characterize the complexity of the environmental layout based on the navigational graph created for the building’s fourth floor (
Figure 11c). ICD values were estimated as 4, 3, 2, and 1 for the structure of this building. The average ICD for this floor was computed as 2.7, demonstrating a moderately high level of complexity for the building.
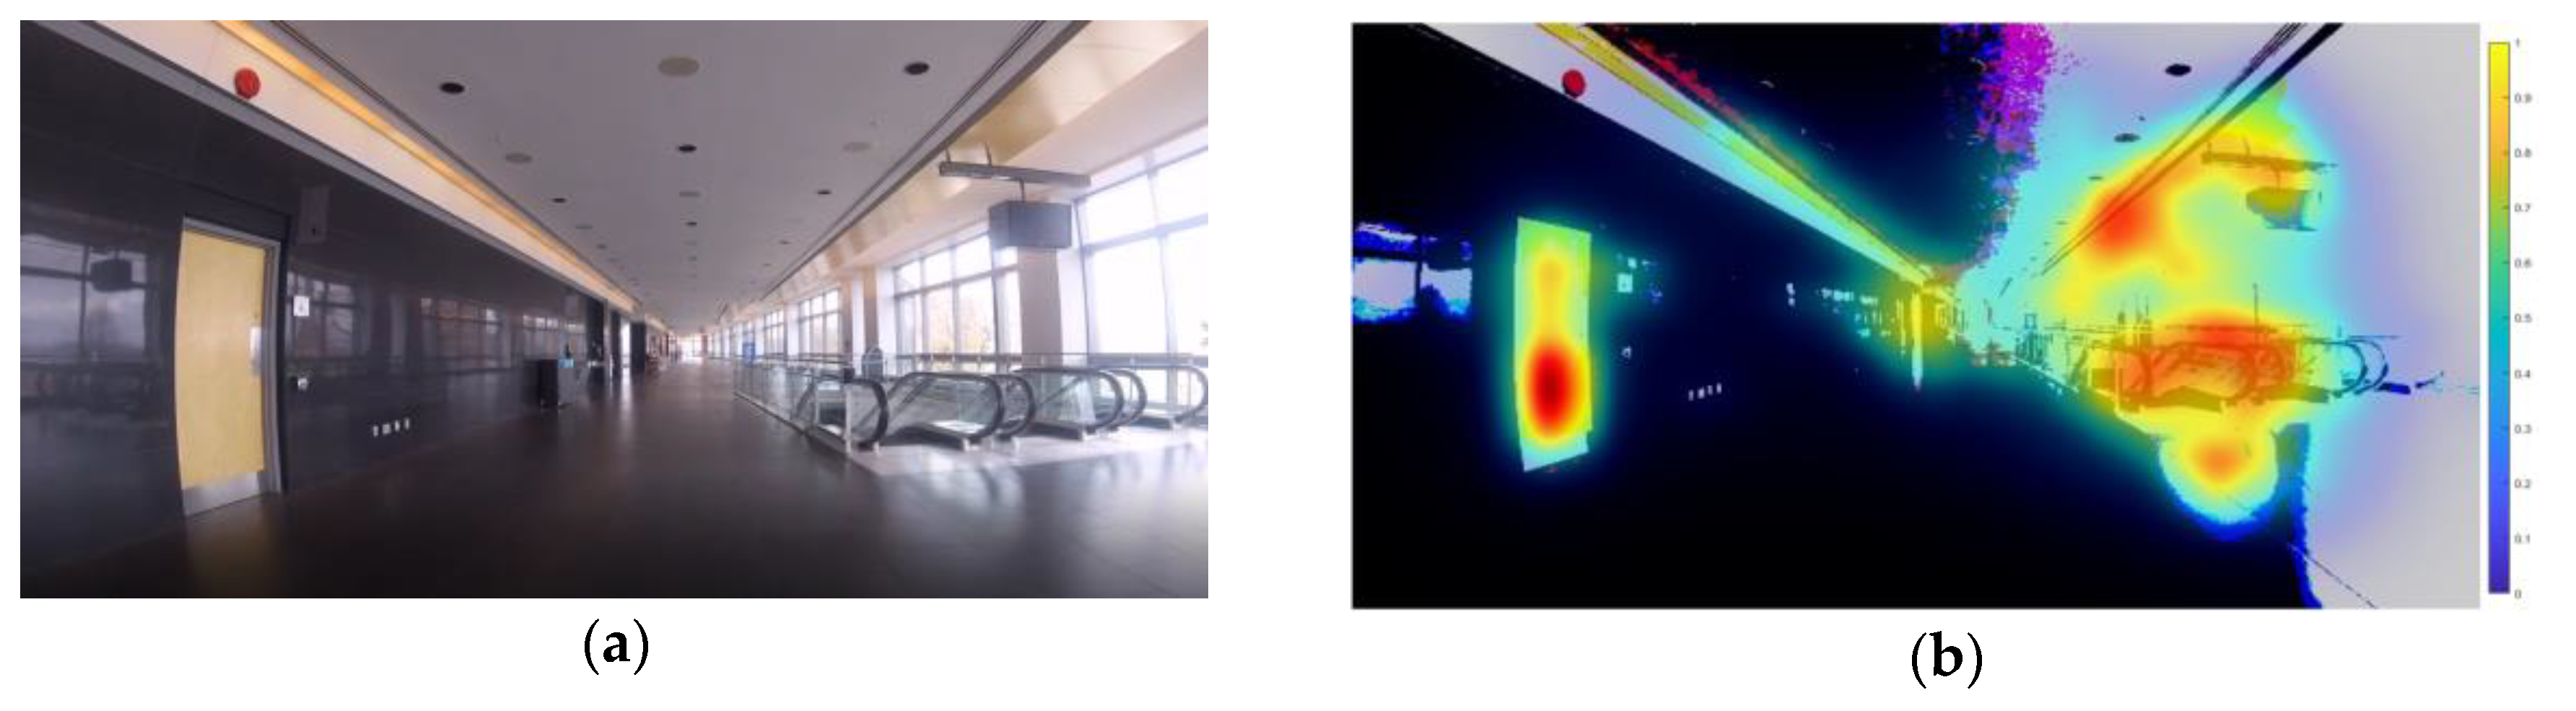
To estimate the level of accessibility facilitators (scenes) in our study area, we determined the visual saliency of geo-tagged video frames obtained inside the building using the GBVS algorithm [
16] in terms of color, ambient light intensity, orientation, and contrast (
Figure 12b shows the visual saliency of one frame (
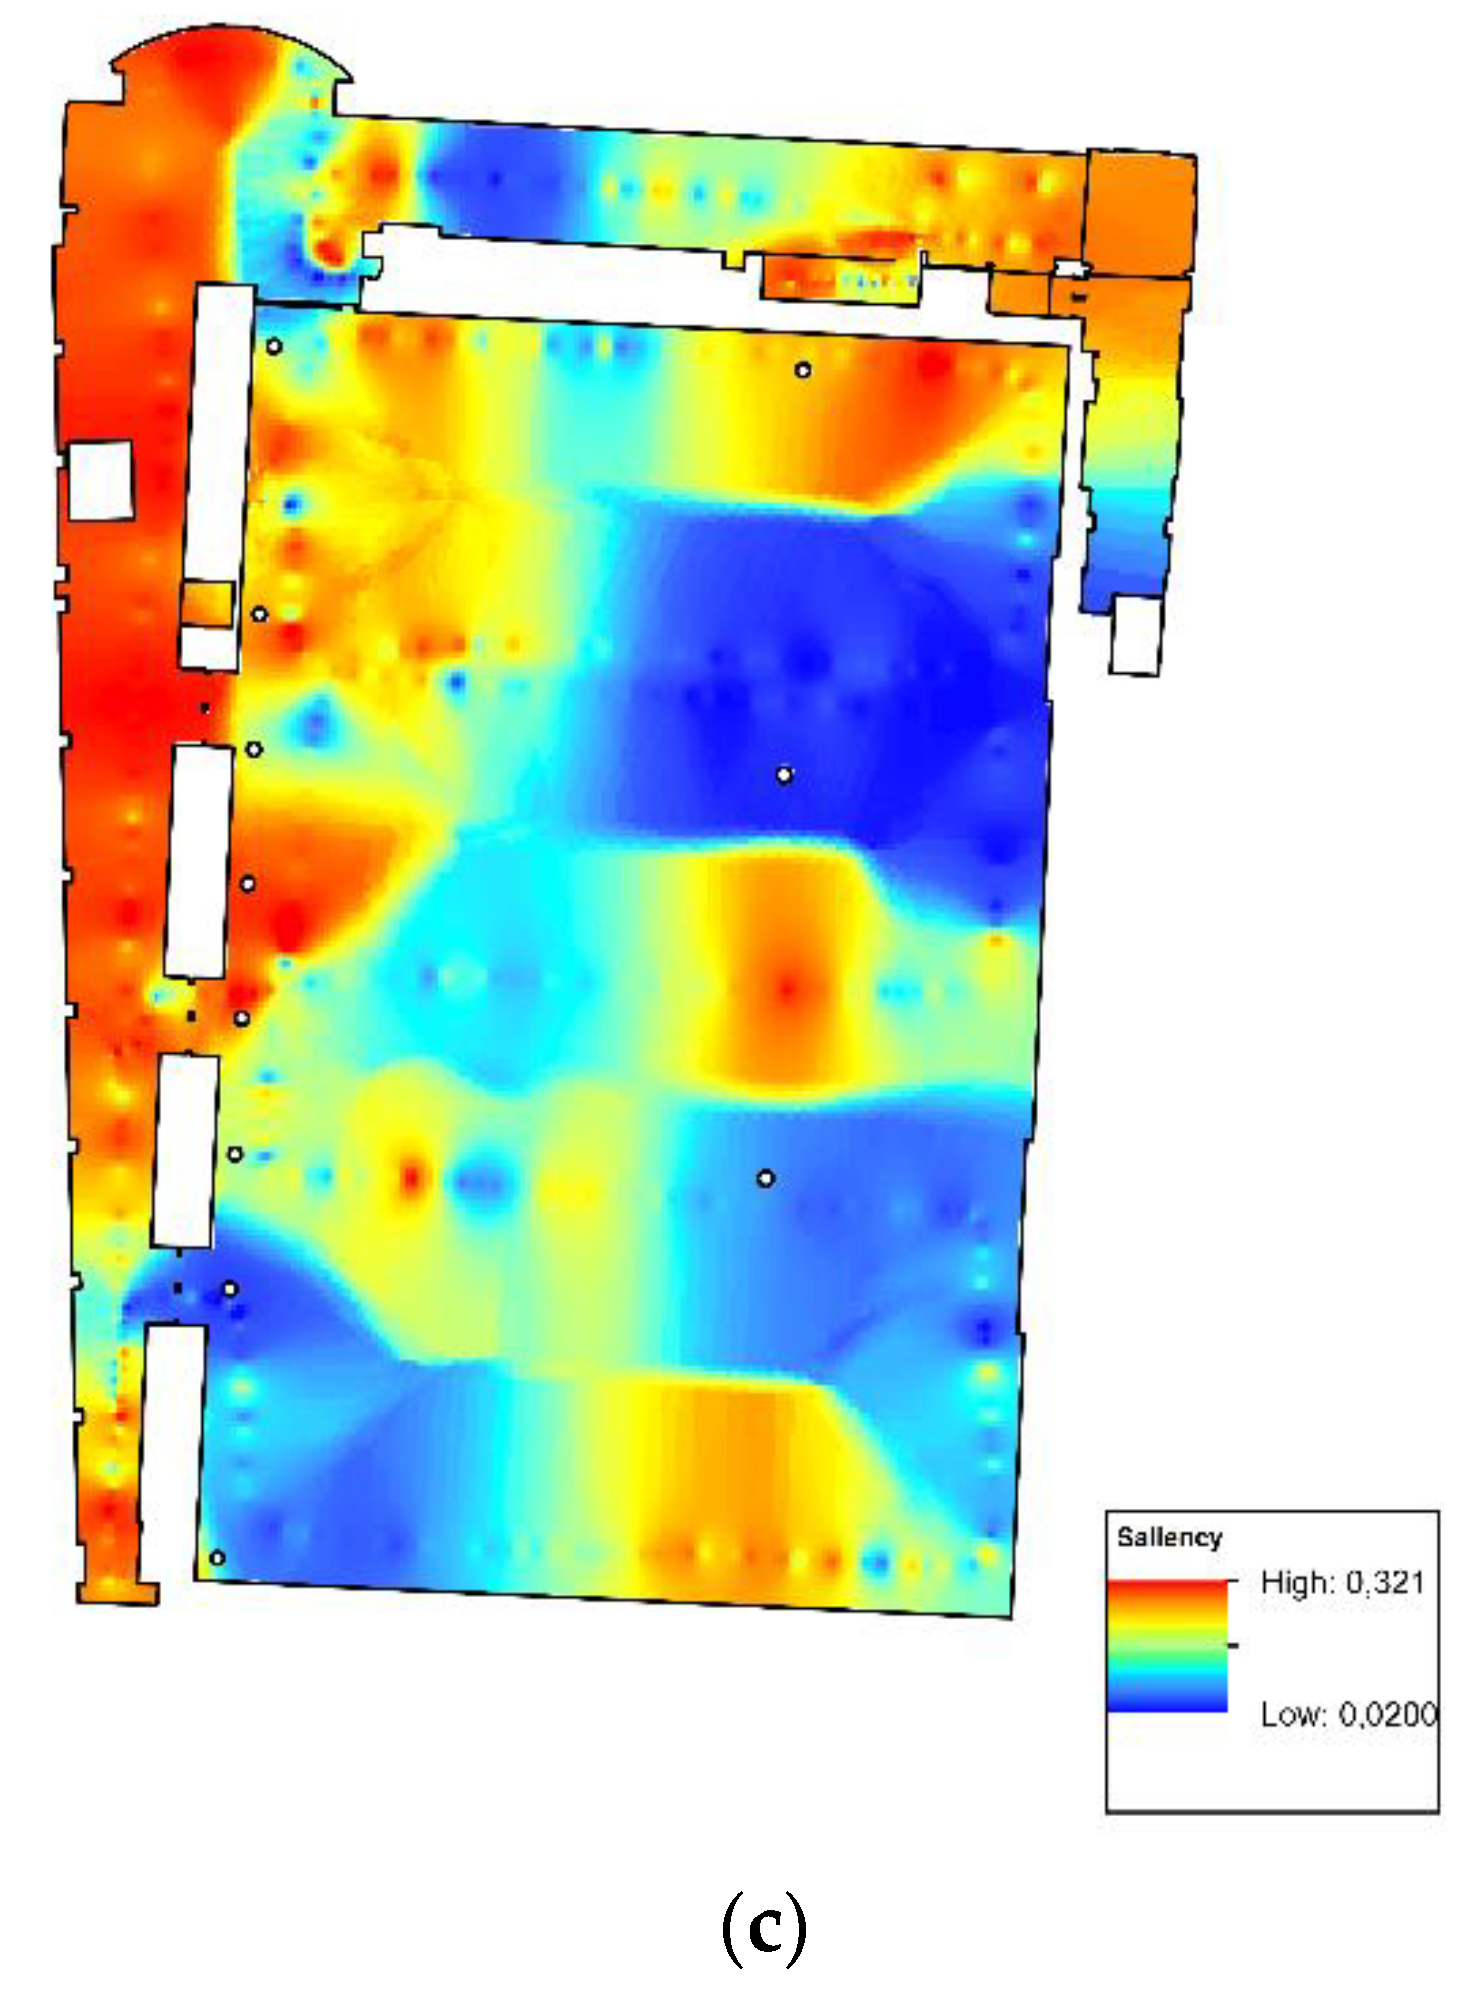
Figure 12a) captured inside the Convention Centre). Following this, we interpolated the saliency data to create a layer based on the color and intensity of the light, the orientation of entities and their contrast with neighboring areas.
Figure 12c illustrates the results of the interpolation of the saliency data of each frame of the geo-tagged video. To better take into consideration the visibility constraints of PWMD, we captured the geo-tagged video from a wheelchair’s height.
In order to measure the effect of obstacles and facilitators (objects) on the environment for assessing the level of accessibility, we considered the visibility and visual saliency assessments of the obstacles and facilitators from the geo-tagged video frames. As previously mentioned in the conceptual framework section, we classified the obstacles and facilitators in the building according to the method proposed by Park et al. [
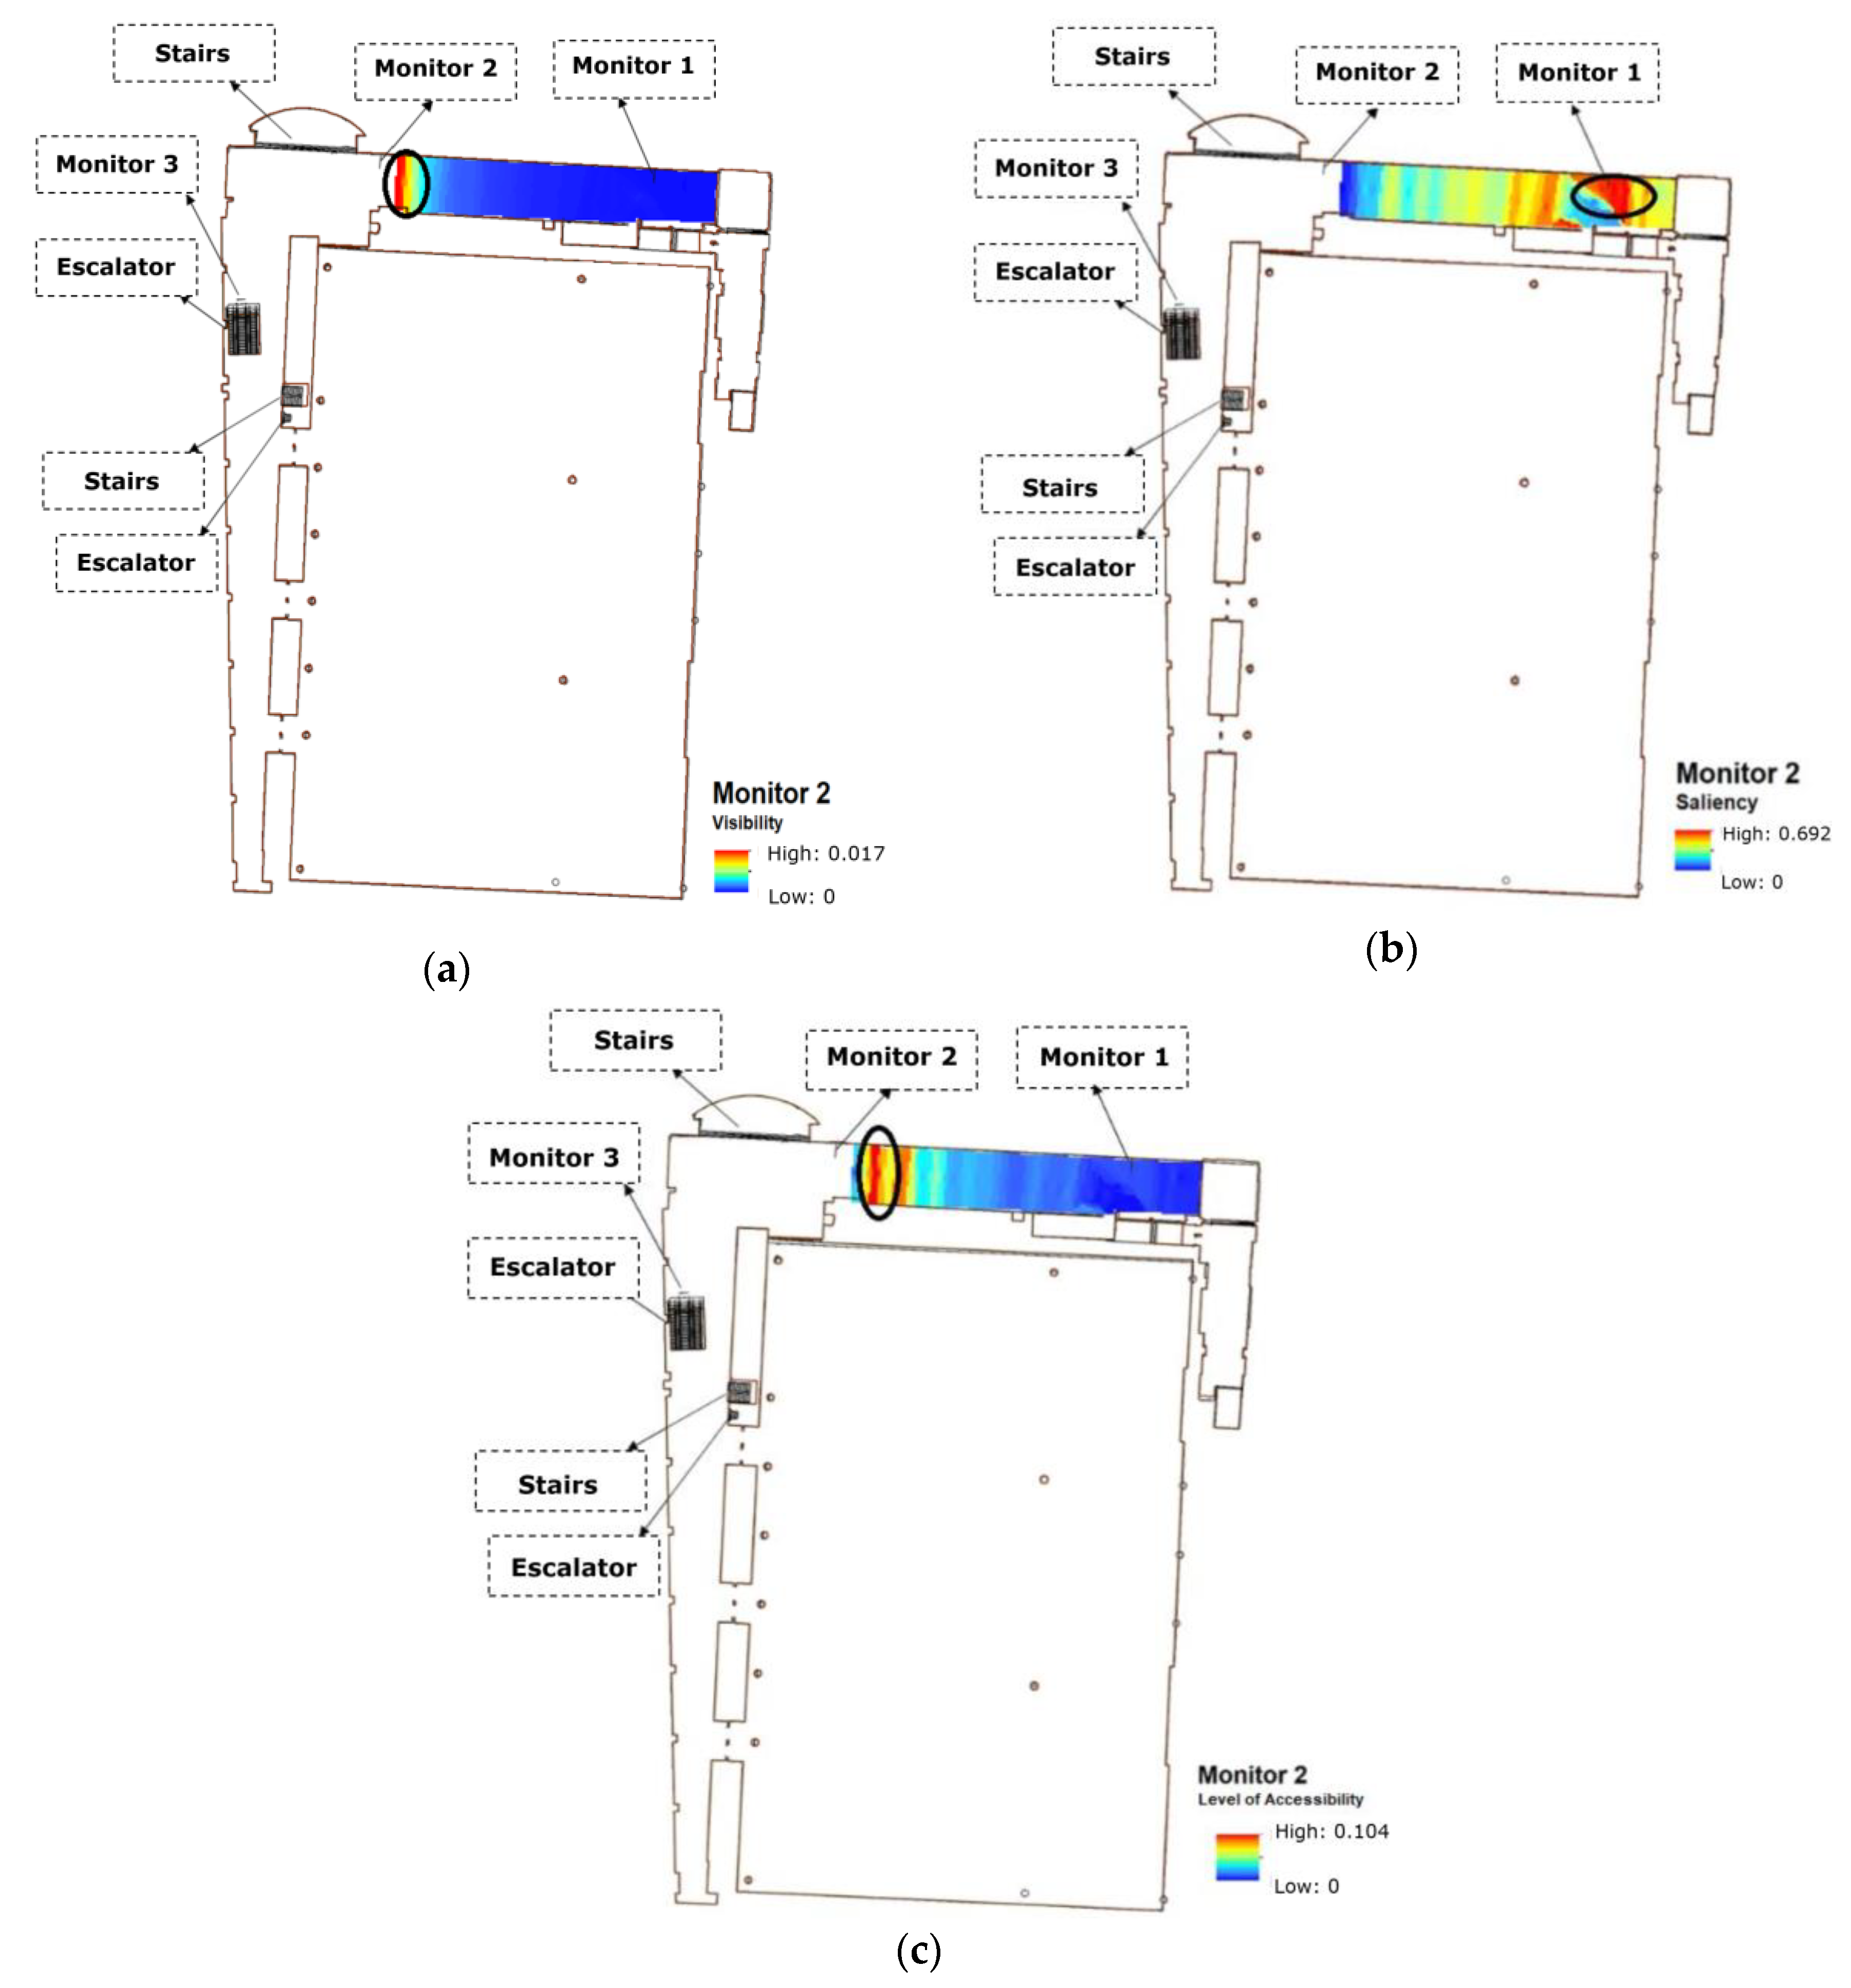
36], that is, into: (1) monitors (dynamic signs to aid navigation as facilitators), (2) stairs (obstacles), (3) elevators (facilitators), and (4) escalators (obstacles). A person’s confidence level when moving in the presence of each aforementioned objects is assumed to vary between 0 and 100%. Then, in order to calculate the accessibility level of these obstacles and facilitators, the visibility of each class in each frame was calculated based on the ratio of the number of pixels of that class to the total number of pixels of the frame. Additionally, the saliency of each class in each frame was determined by measuring the visual saliency of the class pixels using the GBVS method. The accessibility level of a class in the frame was calculated by multiplying the visibility and the visual saliency.
Figure 13 shows the visibility of monitor 2 inside the building. Additionally, this figure shows that the closer one gets to monitor 2, the greater the probability of viewing the monitor. However, the maximum visual saliency is in a place far from the monitor. The accessibility level indicates that the location near the monitor is the most affected, which is not in the highest visibility area near the monitor.
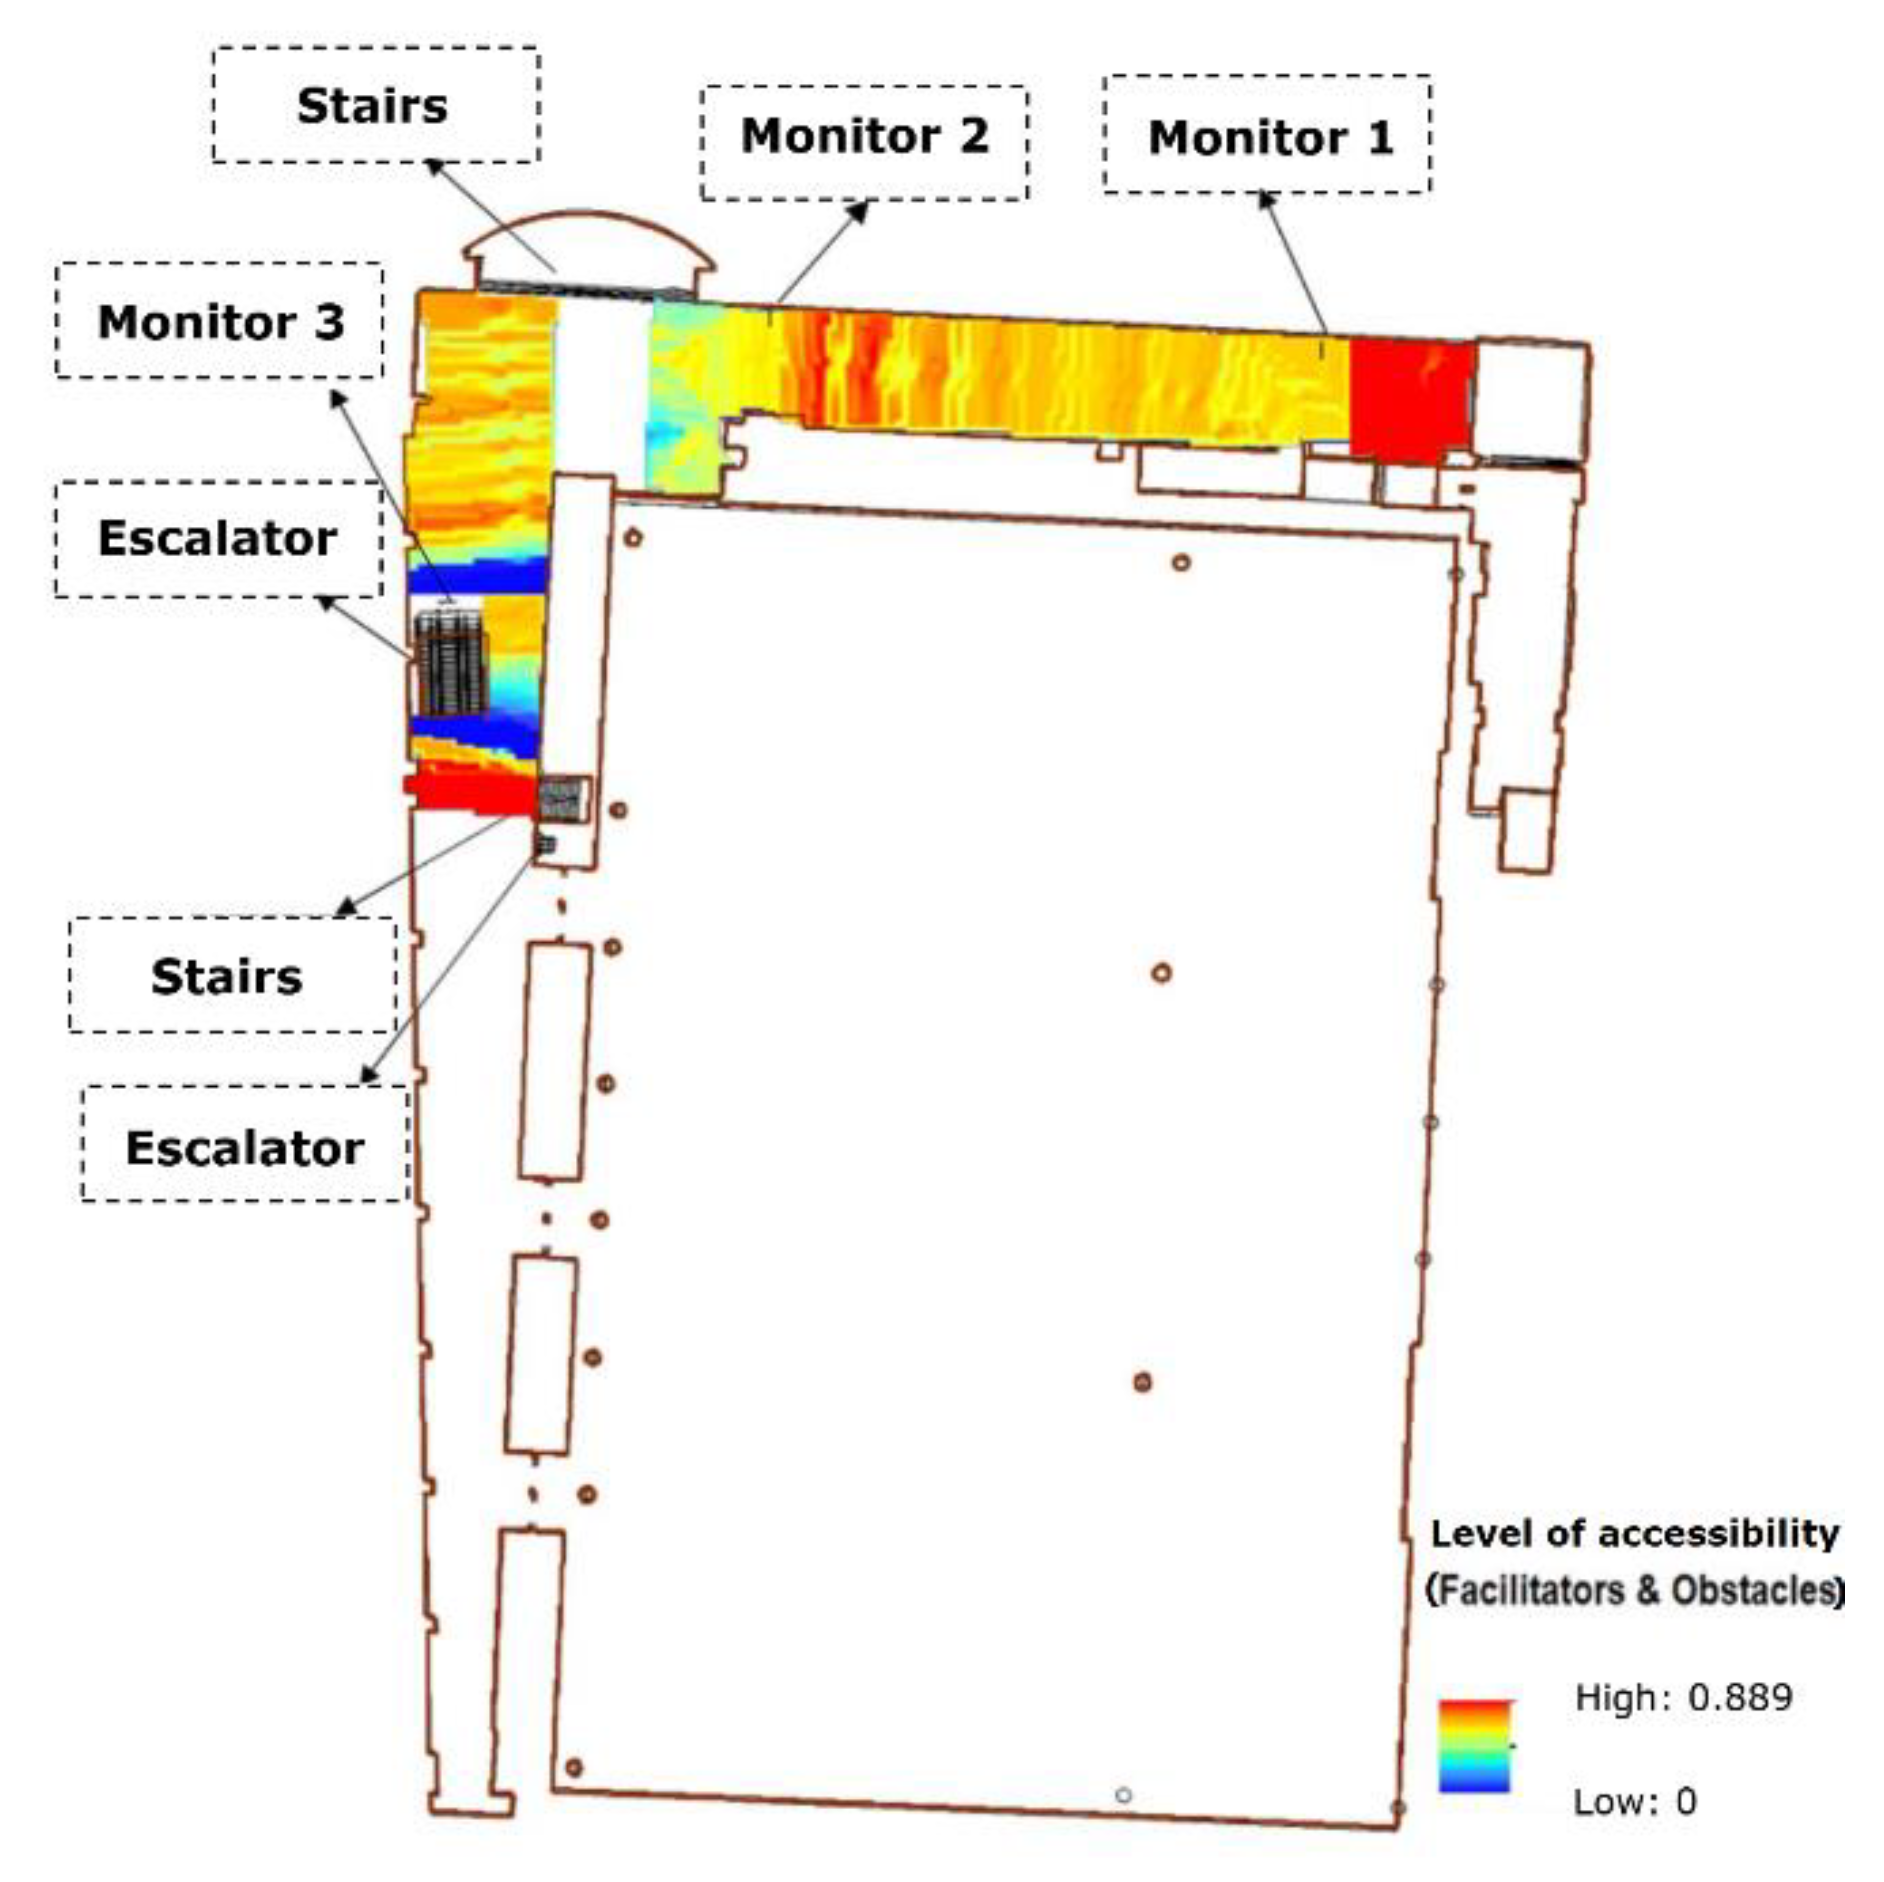
This process was conducted in order to calculate the accessibility level of other obstacles and facilitators from the point of view of a PWMD. Finally, these levels of accessibility of the environment were measured by overlaying the accessibility level of all obstacles and all facilitators.
Figure 14 shows that the lowest of accessibility occurs near the escalator. In general, these considerations will influence the legibility for PWMD. In fact, when decreasing the accessibility level, the decision time is increased for people who want to find suitable and accessible paths.
Finally, the legibility layer of the building was obtained by overlaying all the layers corresponding to each factor based on our proposed estimation approach (
Figure 15).
Figure 15 shows that the corners of the main hall on the fourth floor of the Convention Centre building have the highest legibility (regions 5, 6, and 7 in
Figure 15). The lowest legibility within the building’s main aisles is found close to the main intersection and just before the second decision point concerning whether to choose the stairway or go straight (region 3). Additionally, the entrance (region 4) to the main hall is less legible than other parts of the building. This final estimated legibility value is better adapted to the needs of PWMD, because (1) the trajectory is generated according to the movement of a person with a motor disability, (2) the geo-tagged video is recorded on the trajectory of a person with a motor disability (with consideration of his/her wheelchair’s height), and (3) facilitators (e.g., elevators) and obstacles (e.g., stairs) are extracted based on the PWMD’s capabilities.
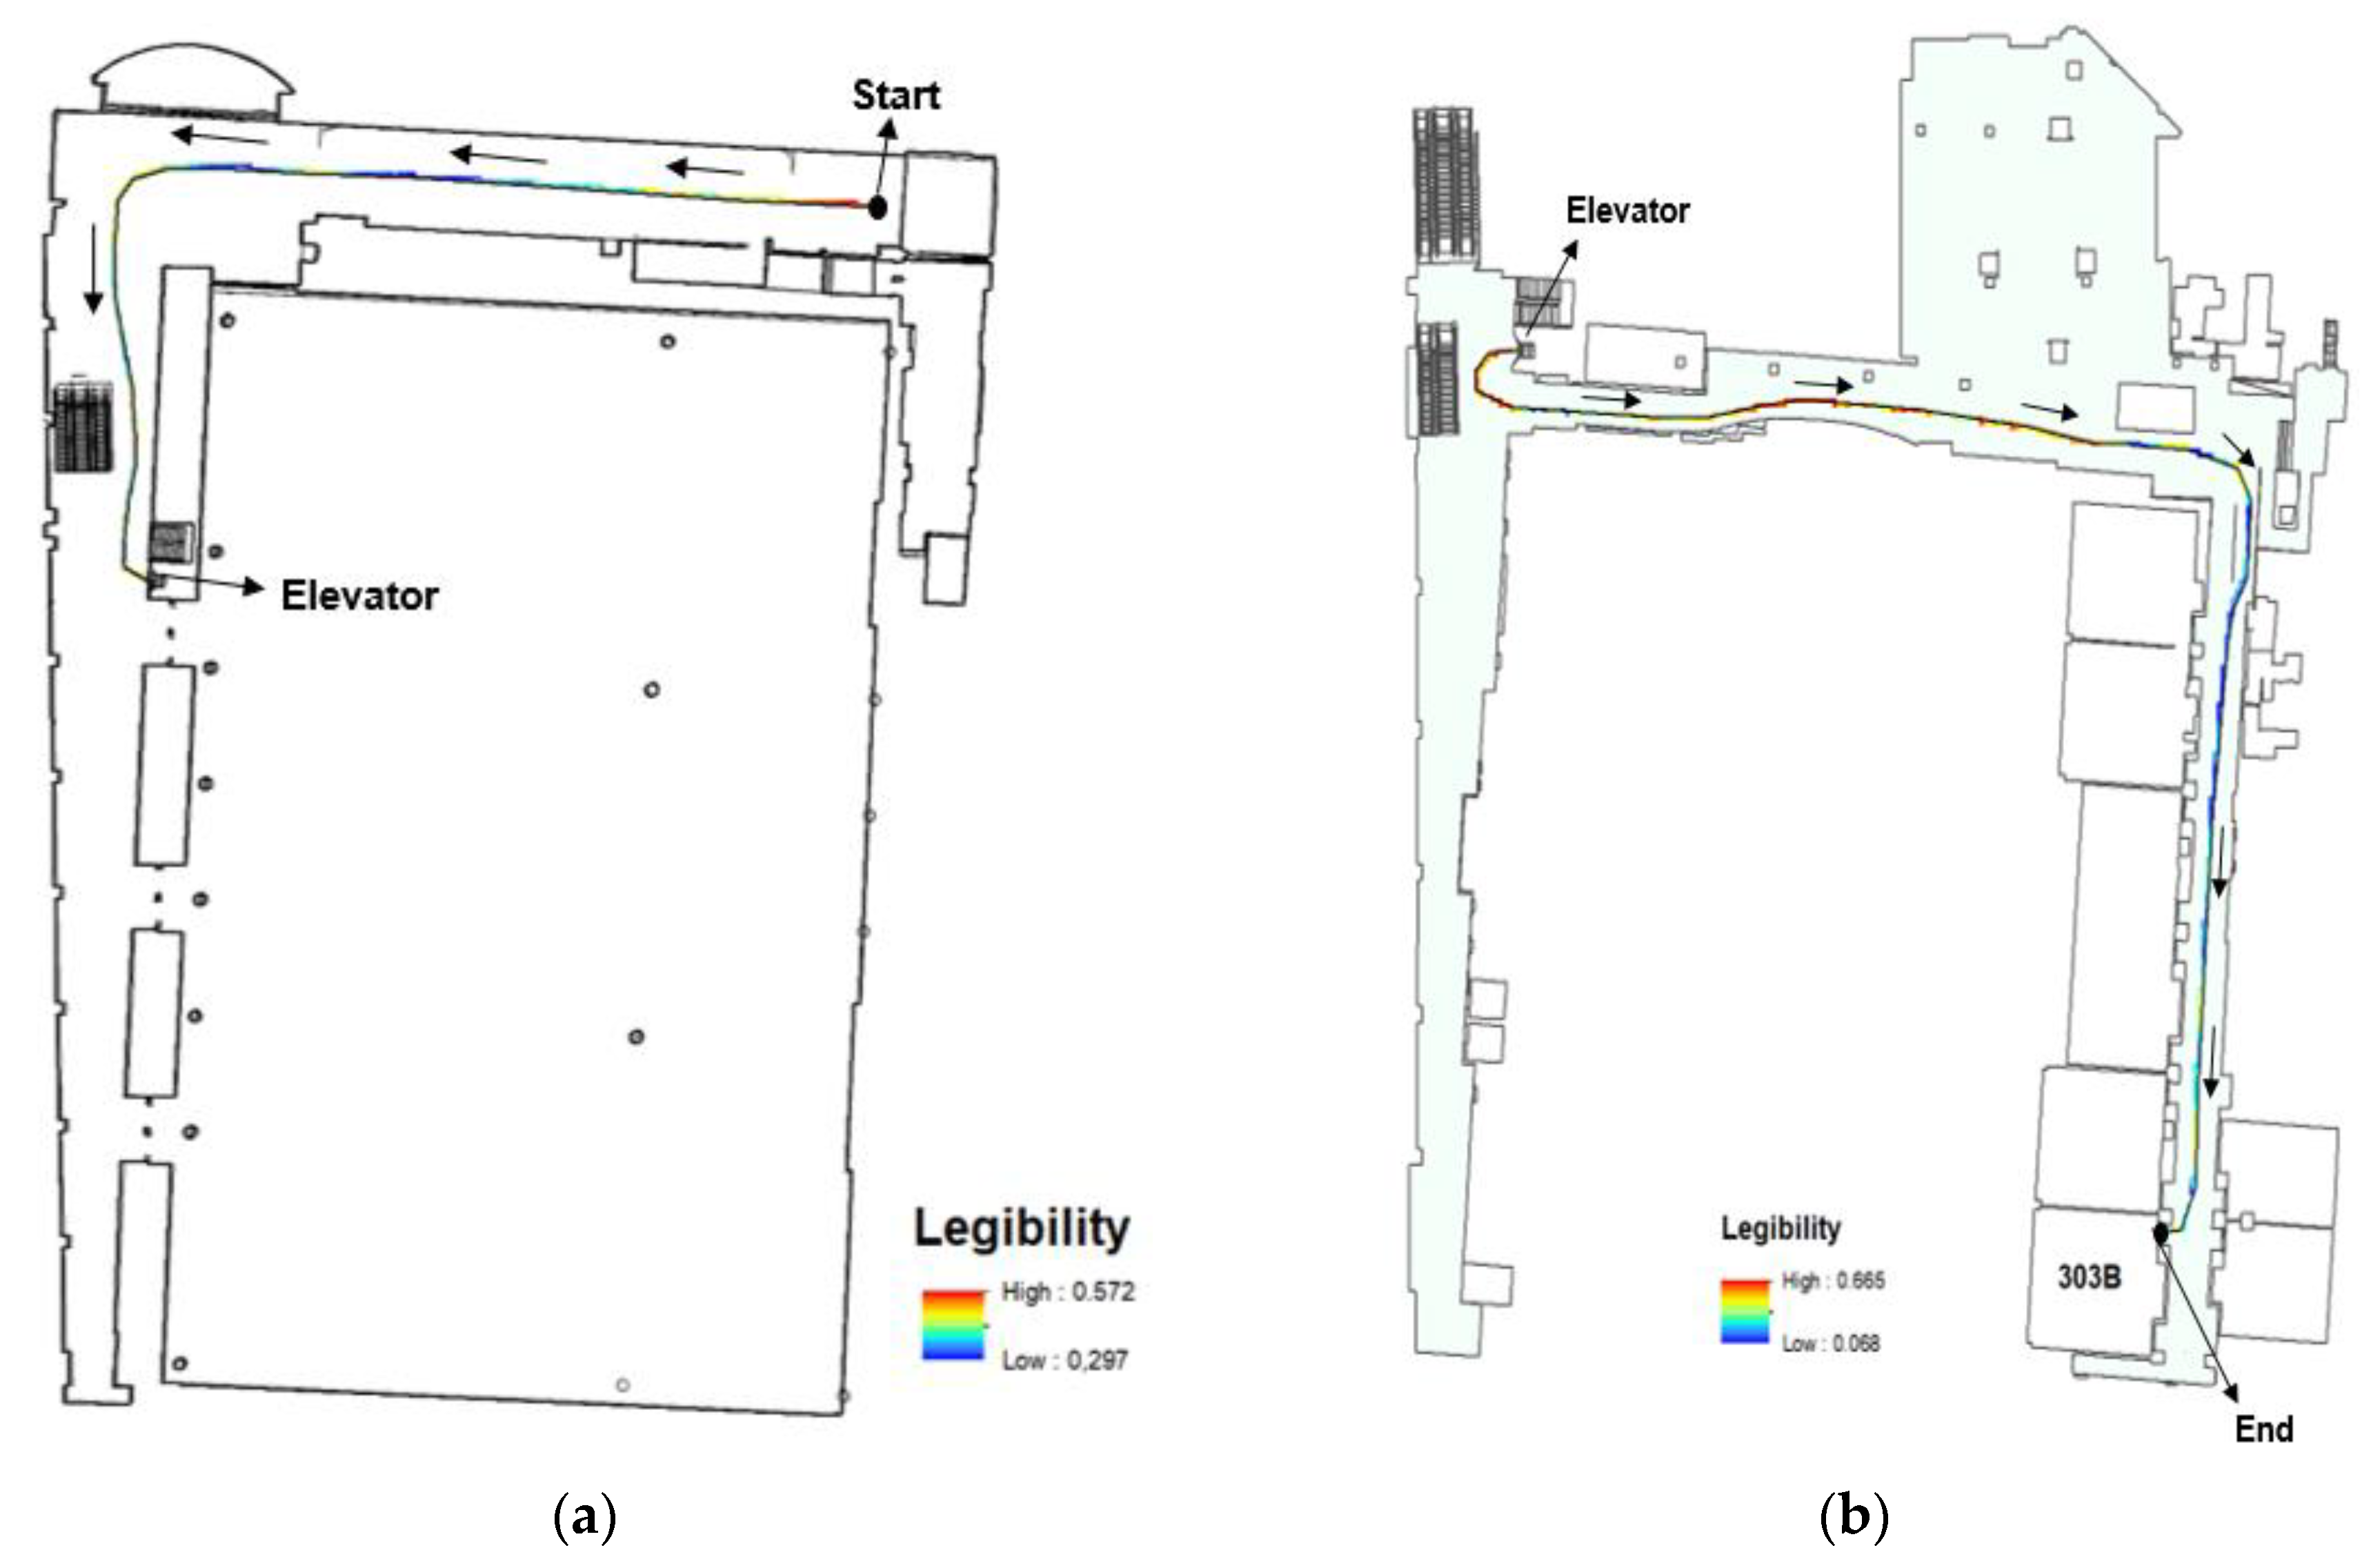
As a scenario, in order to calculate the legibility of a trajectory for PWMD for a particular location inside the Convention Centre building, we studied a sample trajectory from the 4th floor (the ground floor) to the 3rd floor (one level below the ground floor). The output of this step is based on our proposed method for legibility assessment that determined the level of legibility for each segment of this trajectory.
Figure 16 shows the path legibility using different colors from blue (low legibility) to red (high legibility).
This color-coded, segmented trajectory based on legibility calculation could be applied to develop a path planning strategy for navigation applications. In addition, the result could likewise be utilized to create a smart environment to guide people during their mobility tasks and to avoid areas that pose difficulties (low legibility in this case) or provide them with relevant information to ensure their security during their navigation tasks. Furthermore, the legibility calculation could be adjusted for different disability profiles. Hence, we propose to use this output for developing an adaptive method for optimizing sensor placement to improve the navigation guidance, especially in the places where legibility is low [
62].
6. Discussion
In this paper, we have proposed a novel framework for the assessment of the personalized legibility of indoor environments based on the Disability Creation Process (DCP) model. We argued that the legibility of an environment is the result of the interactions between personal factors and environmental factors, highlighting the importance of the consideration of personal perceptions, capabilities, experiences and skills in the evaluation of the legibility of an indoor environment. This has been done with the aim of designing smarter and more accessible indoor environments, leveraging the potential of advanced navigation and communication technologies to help PWMD in their mobility.
In the proposed model, we have considered different factors affecting the legibility of indoor environments, starting with factors such as visual access, connectivity, and complexity of building layout and extending the concept to include the accessibility level as one of the most important factors in the evaluation of the legibility of an environment, especially for PWMD. We argued that the level of the legibility of the environment should be personalized as the perception, capability, and experience of each individual, which are different. Although the difference in legibility level for the general population may not be significant, however, depending on the severity and type of disability, the difference of legibility may be very significant for PWMD.
In line with personalization process, we argued that all of the factors, such as visual access, connectivity, and complexity, result from the interactions of humans with their environments. However, in previous works, they are often estimated based on geometric characteristics of the environment and are rarely personalized for the legibility assessment. In addition, we found that the legibility can be explicitly linked with the accessibility level. We argued that the measurement of the visual saliency and visibility of facilitators and obstacles are key elements that should precede accessibility assessment. Indeed, these objects should first be perceived by people for legibility assessment, especially in an unfamiliar environment. In terms of accessibility level, we have reported that for PWMD, obstacles contribute to an increase in the risk of falling or accidents during a mobility task. Hence, the presence of obstacles decreases the legibility of the environment, whereas the perception of facilitators helps to increase the legibility of the environment. Considering these elements in the development of assistive navigation technologies would help to personalize routes and instructions for PWMD based on their personal capabilities. It is worth mentioning that the concepts of obstacles and facilitators are not absolute, and an object can be an obstacle for an individual and be considered as a facilitator for others. This needs further investigation so that the environment can be adapted to accommodate different needs in a more optimal approach.
In our experiment, and for the sake of simplicity, we made several assumptions in our experiment to produce the presented results. For instance, we have computed more generic legibility values for the whole population with and without disabilities that need to be further specified in the future experimentation for PWMD. In addition, for the purpose of this paper, we did not define specific weights for each factor based on its significance. In fact, our results in the case study were obtained with the assumption that the weights of the proposed legibility factors are equal. However, the importance of the legibility factors can be changed according to an individual’s profile. Hence, in order to specifically determine the weight of each legibility factor, it is necessary to evaluate the mobility performance of PWMD (with different profiles) in the environment. This will be further investigated in the next step of our research.
Finally, the proposed model needs further validation efforts. An alternative option for the validation of the legibility layer would be to carry out an experiment with the participation of a group of PWMD as well as a group of people without disabilities for comparison purposes. According to Li and Klippel [
11], by recruiting people, in this case PWMD, we may measure the ability of these people to reach their destination by assessing indicators such as the number of mistakes to reach their destinations, the time taken and the additional distance traveled with respect to the shortest path from origin to destination. With these indicators, we can correlate the calculated legibility layer with the mobility performance of PWMD. In addition, we may estimate the significance of the legibility factors using these indicators.
7. Conclusions and Future Work
In this paper, we have proposed a novel conceptual framework for the assessment of the personalized legibility of indoor environments for PWMD. First, the legibility was conceptualized as the result of interactions between a person with motor disability and the environment, based on the disability creation model proposed by Fougeyrollas et al. [
19] and affordance theory. We argued that the personalized legibility of the environment results from the perception of the environment by each individual and depends on the mental representation that the person has from the environment. We also argued that this mental representation is enriched according to the sense–plan–act paradigm for each person. Legibility concerns how easily this map is understood and how well it supports mobility of PWMD in an indoor environment.
We argued that legibility is affected by several factors derived from the integration of personal and environmental factors for a specific task. We proposed factors including physical characteristics of the environment and the consideration of obstacles and facilitators, which affect PWMD more significantly than the general population, but will also impact the latter. We suggested that in addition to the interconnected density or ICD, visibility, and connectivity factors, legibility is affected by the level of accessibility, including the visual saliency of scenes (e.g., color, intensity, contrast, and orientation of the visual field) and the facilitators and obstacles with consideration of their visibility and visual saliency.
Based on the legibility factors and the proposed estimation approach of legibility for PWMD, the legibility layer was calculated inside the Quebec Convention Centre building, on the 4th floor. As a result, this legibility layer shows that the lowest legibility is located near the building escalator, whereas the highest legibility is located near the walls and corners of the main hall.
This approach allows architects and engineers to get a better estimation of the level of legibility and facilitates subsequent actions to increase the legibility of indoor environments, especially for PWMD. Furthermore, this approach may help to create a smart environment where sensors and actuators are optimally located to support better wayfinding. It may also help to improve navigation systems by suggesting more adapted and legible paths instead of shortest paths for PWMD.


