Fractal-Based Modeling and Spatial Analysis of Urban Form and Growth: A Case Study of Shenzhen in China


Department of Geography, College of Urban and Environmental Sciences, Peking University, Beijing 100871, China
*
Author to whom correspondence should be addressed.
ISPRS Int. J. Geo-Inf. 2020, 9(11), 672; https://0-doi-org.brum.beds.ac.uk/10.3390/ijgi9110672
Submission received: 7 October 2020
/
Revised: 8 November 2020
/
Accepted: 11 November 2020
/
Published: 13 November 2020
Abstract
:Fractal dimension curves of urban growth can be modeled with sigmoid functions, including logistic function and quadratic logistic function. Different types of logistic functions indicate different spatial dynamics. The fractal dimension curves of urban growth in Western countries follow the common logistic function, while the fractal dimension growth curves of cities in northern China follow the quadratic logistic function. Now, we want to investigate whether other Chinese cities, especially cities in South China, follow the same rules of urban evolution and attempt to analyze the reasons. This paper is devoted to exploring the fractals and fractal dimension properties of the city of Shenzhen in southern China. The urban region is divided into four subareas using ArcGIS technology, the box-counting method is adopted to extract spatial datasets, and the least squares regression method is employed to estimate fractal parameters. The results show that (1) the urban form of Shenzhen city has a clear fractal structure, but fractal dimension values of different subareas are different; (2) the fractal dimension growth curves of all the four study areas can only be modeled by the common logistic function, and the goodness of fit increases over time; (3) the peak of urban growth in Shenzhen had passed before 1986 and the fractal dimension growth is approaching its maximum capacity. It can be concluded that the urban form of Shenzhen bears characteristics of multifractals and the fractal structure has been becoming better, gradually, through self-organization, but its land resources are reaching the limits of growth. The fractal dimension curves of Shenzhen’s urban growth are similar to those of European and American cities but differ from those of cities in northern China. This suggests that there are subtle different dynamic mechanisms of city development between northern and southern China.
1. Introduction
A study on cities begins from description and ends at understanding. To describe an urban phenomenon, we have to find its characteristic scales. Traditional mathematical methods and quantitative analysis are based on a typical scale, which is often termed characteristic length [1,2,3]. Unfortunately, spatial patterns of cities have no characteristic scale and cannot be effectively described by conventional measures such as length and area. At this scale, the concept of characteristic scales should be substituted with scaling ideas. Fractal geometry provides a powerful mathematical tool for scaling analysis of urban form and growth. From remote sensing images, the urban form resembles ink splashes, usually presenting a highly irregularity and self-similarity at several different scales [4,5]. It implies that it does not obey Gaussian law and traditional measures and mathematics models cannot effectively describe it [6,7]. Fractal geometry provides a proper quantitative approach in this aspect [8,9]. The fractal dimension, especially multifractal parameter spectra, can be utilized to characterize spatial heterogeneity and explore the spatial complexity [10]. Ever since Mandelbrot [11] developed fractal geometry in 1983, the theory has been applied to geographical research for nearly forty years. Urban geography is one of the biggest beneficiaries of fractal ideas [12].
Since the 1980s, some pioneering studies about urban form and growth based on fractal geometry have been published. Those early research studies mainly focus on two aspects of urban form. On the one hand, they measure the fractal dimension of urban forms by using the box-counting method, area-radius scaling, or perimeter-area scaling, and then compare the fractal dimension values of different time series in the same region or different regions at the same time to realize the analysis of urban form and growth (e.g., [5,13,14,15,16,17,18,19,20]). Some of those research results were summarized by Batty and Longley [21] and Frankhauser [22] in 1994, which draw the conclusion that urban form and growth can be regarded as a fractal object and the average value of the fractal dimension is around 1.7. On the other hand, they simulate the process of urban growth based on the iterative models and the theories of chaos or self-organizing to try to find the formation mechanism or reasons for the fractal structure of urban form (e.g., [4,20,23,24,25,26,27,28,29,30,31,32,33,34,35,36]). In particular, Batty et al. [24,27,28] used the fractal model and diffusion-limited aggregation (DLA) to simulate the process of urban structure and growth, respectively. Benguigui et al. [4,29,30,31] used the aggregation model to simulate the urban form of Petah Tikvah and introduced the concept of leapfrogging as one of the fundamental processes that generates urban fractality. Thomas et al. [34] reported the relationships between fractal cities and self-organization.
Nowadays, analysis of urban form and growth based on fractal theory and exploration of the mechanism of the emergence of fractal features of urban form have become increasingly important topics in both urban science and complexity science. Recently, there are more studies of urban form and growth based on fractal dimension as the validity indicator (e.g., [35,36,37,38,39,40,41,42,43]) and multifractal models (e.g., [44,45,46,47,48,49,50,51]). Compared with the simple fractal model, the calculation of multifractal models is more complex but can better reflect the heterogeneity and local characteristics of urban form distribution [45]. Encarnação et al. [52] developed the technology of fractal cartography by using the box-counting method and programming, thus enabling the visualization of fractal dimension distribution of urban form. Furthermore, a discovery was made that the fractal dimension curves of urban growth take on the squash effect and can be modeled with sigmoid functions [53]. The fractal dimension growth curves of urban forms in Europe and America satisfy the common logistic function, while those of northern Chinese cities such as Beijing meet the quadratic logistic function [6,54]. Those studies (e.g., [6,53,54]) mainly focused on theoretic modeling an appropriate time series of the fractal dimension values of a city or region and found that there was difference in the types of logistic functions between Western countries and northern China. However, the case of southern Chinese cities and some specific possible reasons for this phenomenon were seldom related.
Different types of logistic functions indicate different spatial dynamics. Now, we want to investigate whether other Chinese cities, especially cities in South China, follow the same rules of development, and the possible reasons for this phenomenon. Shenzhen city in southern China is a special, notable case. It is not only a new, fast-growing city planned by the government but also an experimental city for government tests on the operation of a market economy. Nowadays, it has achieved surprising economic development and population growth and led the development of the Chinese economy since China’s reform and opening up. Taking Shenzhen as an example of southern China, we can discuss another type of fractal city in mainland China, which differs from many cities in other parts of China, except for the southeast coastal area of China. Therefore, this paper is devoted to exploring the fractal dimension growth curves of the city of Shenzhen and attempts to further analyze the reasons. We first divide Shenzhen city into four study areas and then use the box-counting method and least squares regression for extracting spatial data and estimating the fractal parameters. Then, we utilize sigmoid functions to model fractal dimension curves of urban growth in Shenzhen region. Through this study, we can not only reveal the North–South differences of city development in China but also reflect the similarities and differences of urban evolution between China and the West.
2. Methods
2.1. Box-Counting Method
Owing to the scale-free properties of urban form, conventional measures should be replaced by fractal parameters. The box-counting method in this paper was employed for estimating the fractal dimension of the urban form of four study regions in Shenzhen, from 1986 to 2017. With the advantages of simple understanding and operation, it has become a method widely applied by many researchers (e.g., [18,19,21,52,55]) to measure the fractal dimension in 2-dimensional images. Its basic procedure, in general, is to recursively superimpose a series of regular grids of declining box sizes over a target object and to then record the object count in each successive box, where the count records how many of the boxes are occupied by the target object. According to Benguigui et al. [18], in a 2-dimensional space, the object is covered by a grid made of squares of size ε, and the number N(ε) of squares in which a part of the object appears is counted. Then, changing the side length of boxes ε, leads to a change in non-empty boxes number, N(ε). If the object turns out to be fractal, then
where N1 is the proportionality coefficient, D is the urban form fractal dimension value, and the logarithmic form is
Thus, a logarithmic plot of ln N(ε) versus ln (1/ε) yields a straight line with a slope equal to D. In this paper, the first value ε is the half-size of the box; the next value is equal to ε/4. The ith value is ε/2i; the highest value of index i is 9. The tools of create fishnet, spatial adjustment, and overlay in ArcMap10.2 were utilized for implementation the segmentation box and rotation box and obtaining the ith value of N(ε).
2.2. Fractal Dimension Growth Curve and Power Law
In order to investigate the rules of urban evolution of Shenzhen city, we modelled fractal dimension values of time series of four study areas in Shenzhen by using logistic function modeling. According to Chen’s [53] elaboration, the logistic function of fractal dimension evolution can be expressed as
where t is time order (0, 1…); n is the year; n0 is the initial year; D(t) or D(n) denote the fractal dimension in the tth time or the year of n; D0 is the fractal dimension in the initial year; Dmax ≤ 2 indicates the maximum of the fractal dimension; A refers to a parameter; k is the original growth rate of fractal dimension. The parameter and variable relationships are as follows
Equation (3) can be made into a logarithmic transform, and the result is
Equation (5) is concerted to a log-linear equation, and the values of A and K are simple to estimate by linear regression analysis if the parameter of Dmax value is known. Here, the goodness-of-fit search (GOFS) parameter estimation method was selected for estimating the parameter, which has been introduced particularly by Chen [53].
Capturing the driving force factors through the mathematical model plays an important role in trying to explain the reasons of the emergence of fractal structure of urban form. An urban form is a typical complex system [56,57]. Stable urban form and growth are the result of long-term continuous interaction of various factors; those associations can be captured by the power function [58,59]. For a city system, the relationship between two measured elements representing the city, such as population, area, and GDP, usually satisfy the statistical power law. We thus captured the driving factors of urban form evolution and growth using the power law function, which is expressed as
where Xt and Dt represent, in a given t year, fractal dimension value and the total number of driving factor, respectively; k and β are constants to fractal dimension. The linearized model of Equation (6) is
where lnk and β are constants terms to be estimated.
2.3. Study Area and Datasets
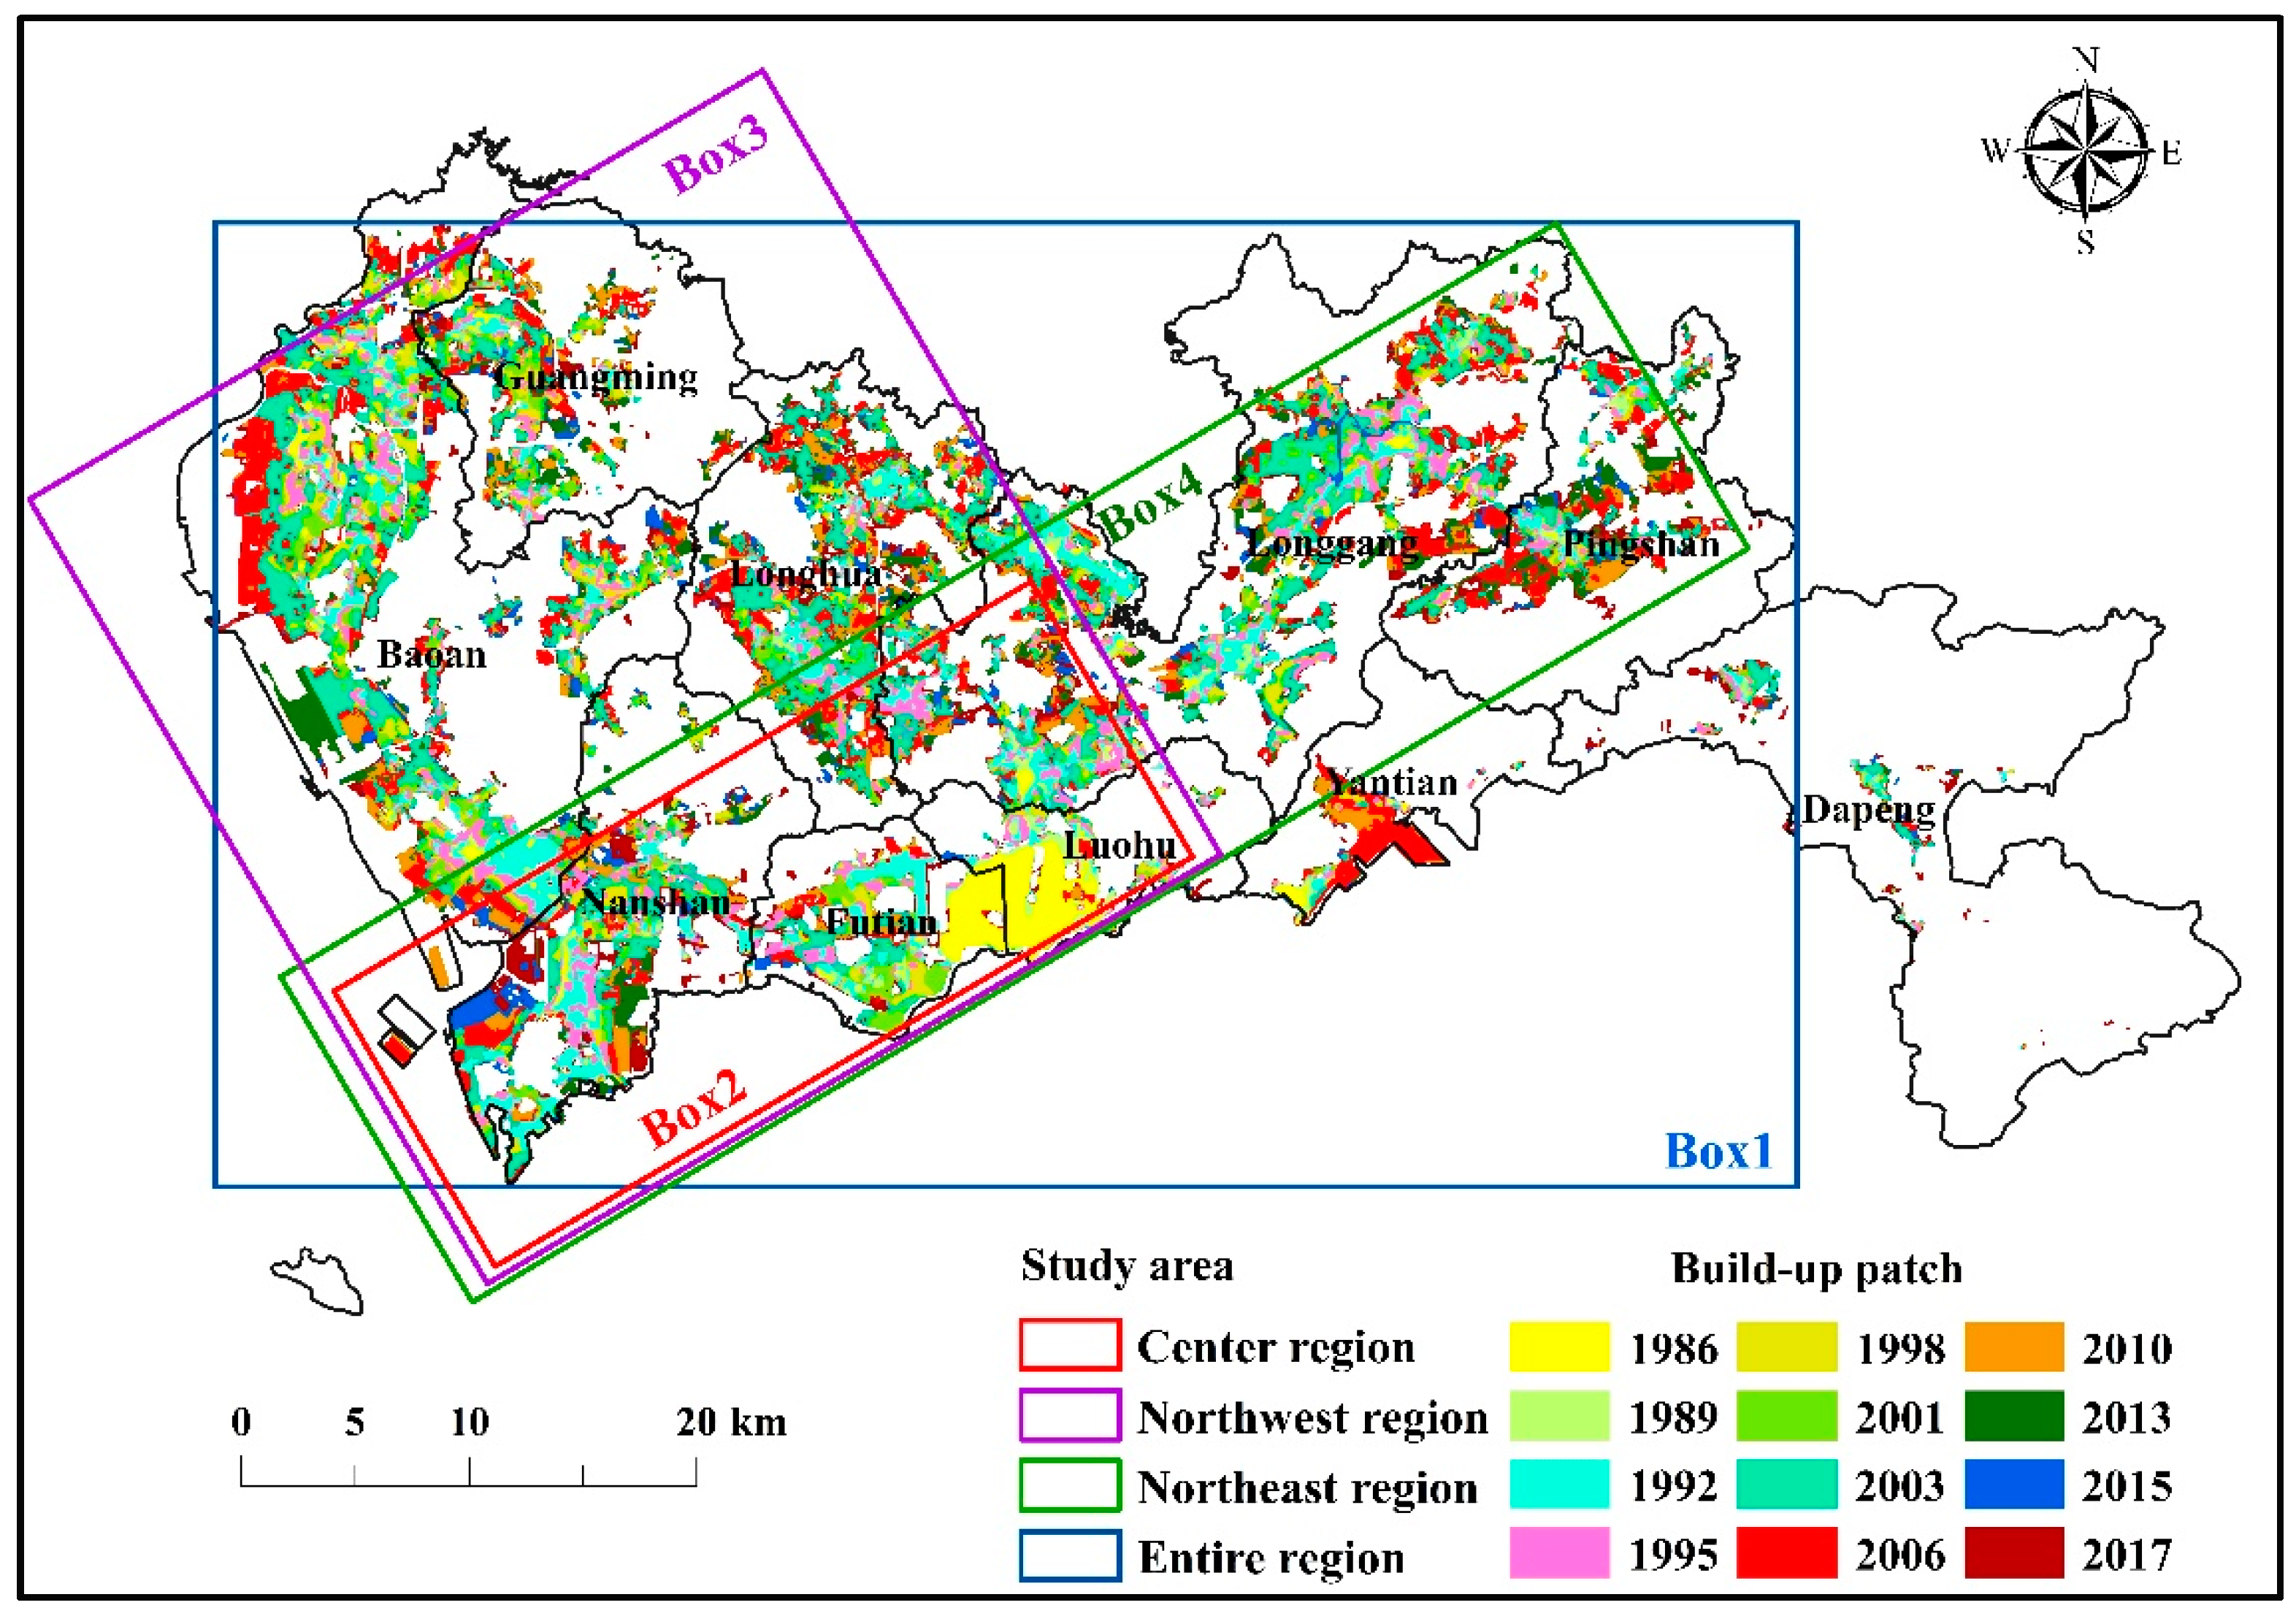
Shenzhen (22°27′–22°52′ N, 113°46′–114°37′ E), as China’s first special economic zone, lies along the cost of the South China Sea and adjacent to Hong Kong. Before China’s reform and opening-up policy in late 1978, it was just a sleepy border town of some 30,000 inhabitants that served as a custom stop into mainland China from Hong Kong. Now, Shenzhen has become an international metropolis with a total population of 13.0366 million [60]. The mean annual temperature is around 22.4 °C and annual rainfall is about 1948 mm [61]. The shape characteristics of the administrative region of Shenzhen are narrow and long, and the east–west span is over 49 km, while the north–south span is only about 7 km [62]. In the southeastern part of Shenzhen is a hilly topography; in the northwestern part, it is relatively low. In this paper, four boxes were drawn as the study areas (Figure 1). The first box area is the entire region of Shenzhen, which covers almost the entire built-up patch of Shenzhen. The second box area is a major center region, which mainly includes Futian District, Luohu District, and Nanshan District. The third and fourth box areas are the northwest part and northeast part, respectively. The reason for including them is because the built-up areas in these two areas visually seem to have the expansion and development trends. It is quite useful to fully assess the spatial–temporal evolution characteristics of the urban form and growth.
The processing of the four boxes mainly includes box segmentation and box rotation. On the platform of ArcMap10.2, we firstly used the tool of create fishnet to generate regular grids of different scales based on the box-counting method. Secondly, we rotated the four boxes representing the four study areas with the editor tool and then matched other boxes of different scales to the four rotated boxes with the tool of spatial adjustment. In addition, the built-up areas’ data (Figure 1) were extracted from Landsat TM 4 and 5 and OLI 8 images with 30-m resolution for twelve years: 1986, 1989,1992, 1995, 1998, 2001, 2003, 2006, 2010, 2013, 2015, and 2017. They were all collected from United States Geological Survey (USGS) Earth Explorer website (http://earthexplorer.usgs.gov/), with less than 10% cloud cover. In general, the methods of object-oriented supervised classification and visual interpretation post-classification are employed for extracting built-up areas’ data, and its process can be divided into three parts. First, we employed the toolbox of example-based feature-extracting workflow in ENVI 5.3 software to generate twelve periods’ land use and land cover (LULC) classification maps; here, we roughly divided land types into four categories that are water body, vegetation, bare, and built-up areas, and chose the support vector machine (SVM) classification method. Secondly, we selected the class of urban area form for each resulting vector datum in ArcMap10.2 software. Finally, and most crucially, we conducted a visual interpretation of each of the 12 periods’ built-up area maps. It included removing the noisy patches by setting a threshold value and adding, removing, and modifying the misclassification of the built-up areas by using the editor tool and other toolboxes in ArcMap 10.2, Google Earth and multi-period false color composite of remote sensing images.
3. Results and Analyses
3.1. Fractal Dimension Analysis of Urban Form
The double logarithm linear regression based on the least square method can be employed to estimate fractal parameters. Fractal modeling involves two types of parameters. One is inferential parameters and the other is descriptive parameters. The former includes fractal dimension and proportionality coefficient, and the latter includes goodness-of-fit and standard error [63,64]. Fitting results based on the box-counting method showed that from 1986 to 2017, the four study areas all exhibit a strong linear association between ln N(ε) and ln (1/ε), with fractal dimension values between 1 and 2, and the goodness-of-fit R2 values are all above 0.98. It is powerful proof that indicates that the urban form in Shenzhen, both its entire and part regions, are indeed statistically fractals during 1986–2017. The detailed results of the fractal dimension estimates of the urban forms of the four regions in Shenzhen from 1986 to 2017 are presented in Table 1. They all increased over time gradually, but the entire region is slightly smaller than other three subregions—the center region, the northwest region, and the northeast region.
In fact, fractal dimension D has now become a validity index of assessing the space-filling extent, spatial complexity, and spatial homogeneity or compactness of urban land. A larger value signifies urban sprawl—urban spatial structure becomes more complicated and homogeneous [65]. In 2-dimension digital maps, indicates that one has a homogeneous spatial distribution of the object in the plane; the other extreme limit is , which suggests a high local concentration [4]. It is obvious from above results, for the past 40 years, that the urban form in entire Shenzhen has been in a state of continuing growth and expansion in space. Meanwhile, its spatial structure has been becoming more and more complex and homogeneous over time. Considering the land-type distribution in the real world, it is inevitable that there exist other land types, such as ecological land and water bodies, in the four study areas. They may actually belong to the land types that are protected by the authorities and not allowed to be available for urban construction in Shenzhen. In 2017, in particular, the fractal dimension values of the four regions—the entire region, the central part, the northwest part, and the northeast part—reached their highest value, which was 1.7604, 1.8467, 1.8189, and 1.8294, respectively (Table 1). Not least because these values are close to 2, but there are probably no more other land types allowed to be available for urban development within each study area. We, thus, may speculate that Shenzhen will probably encounter the situation of urban land approaching saturation in the near future.
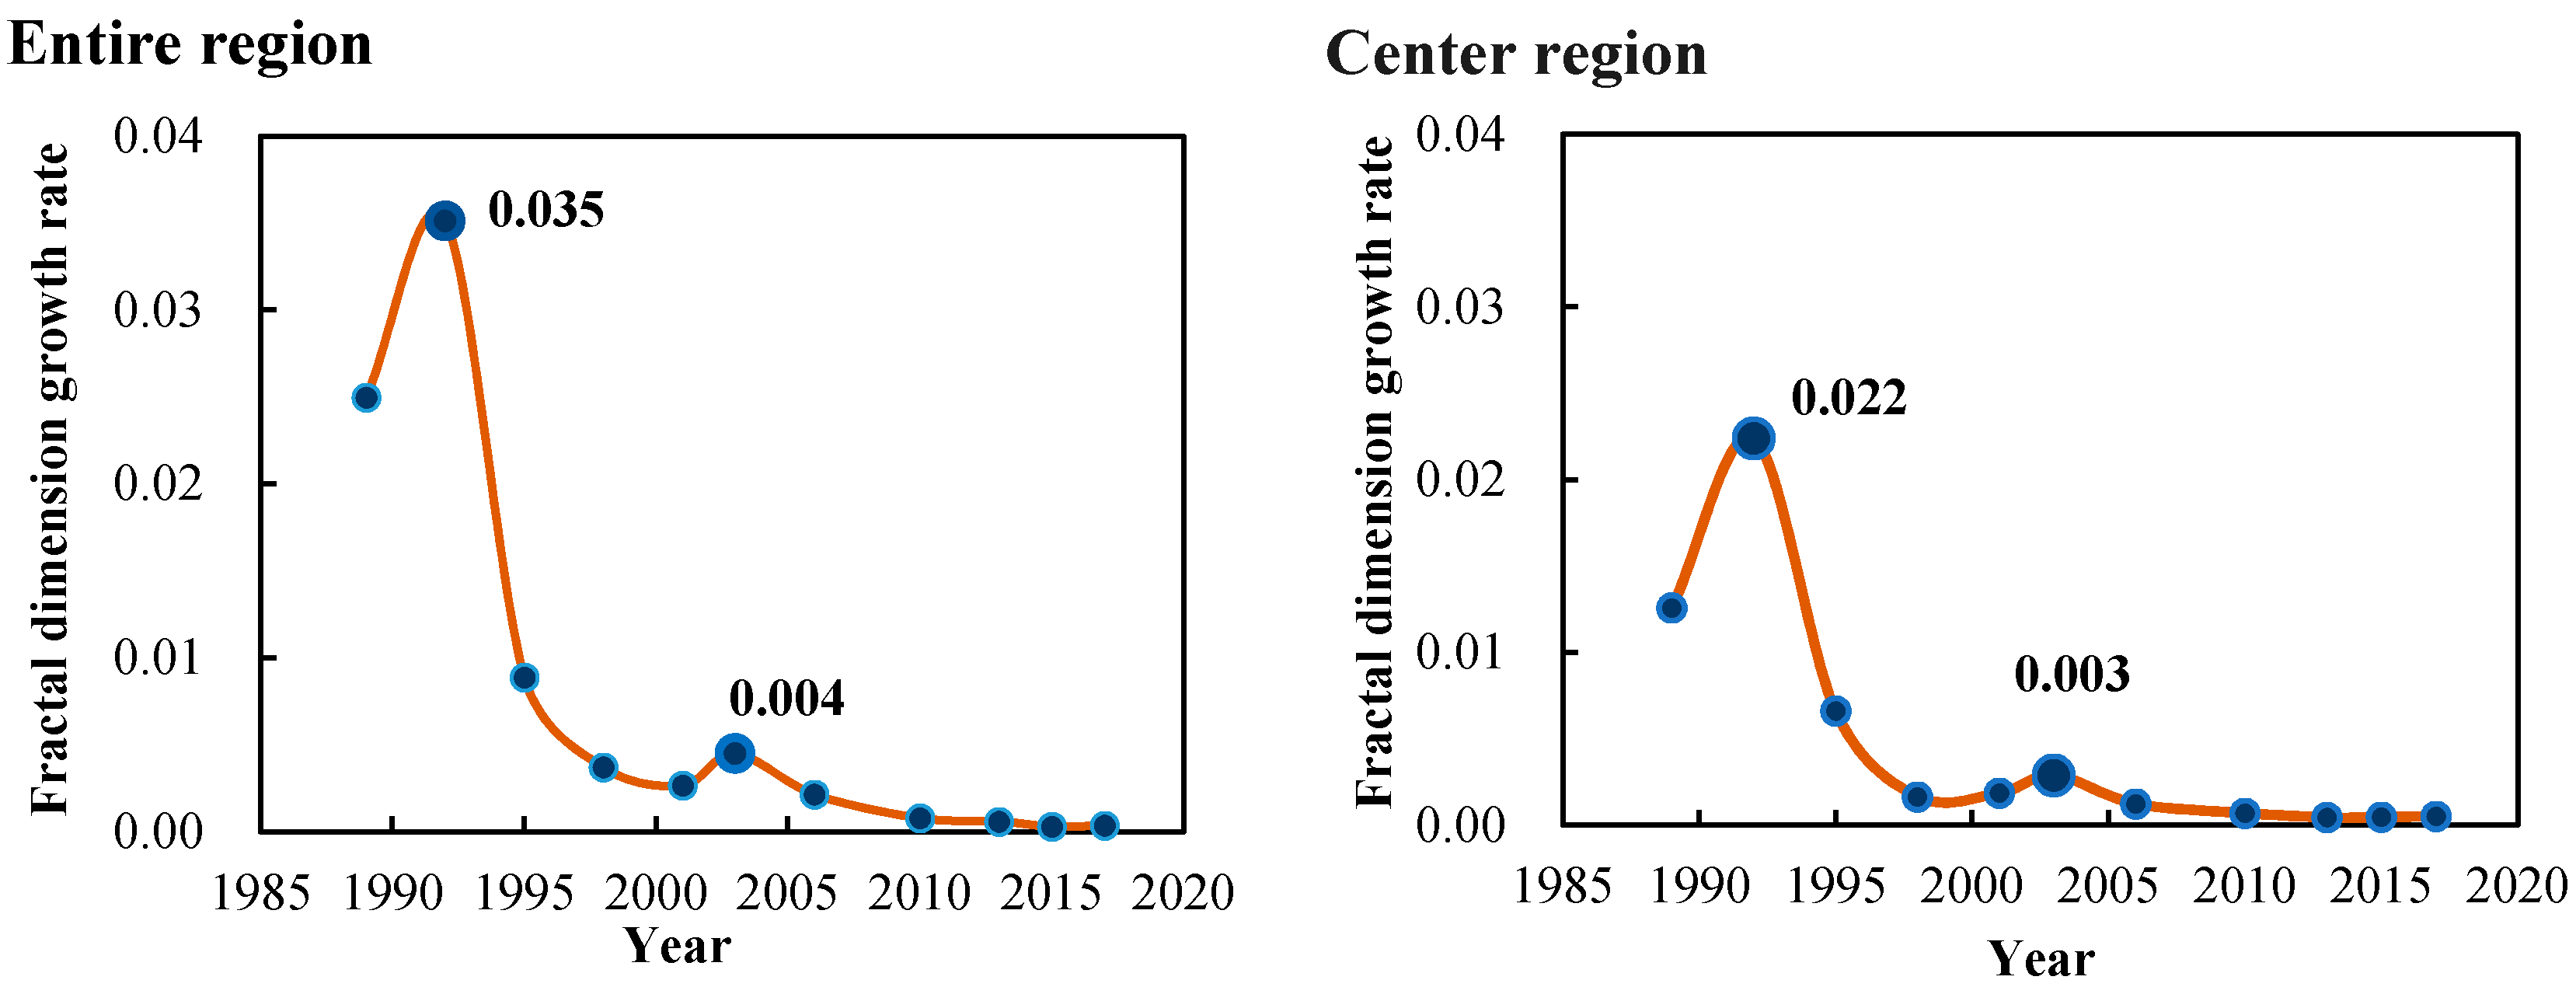
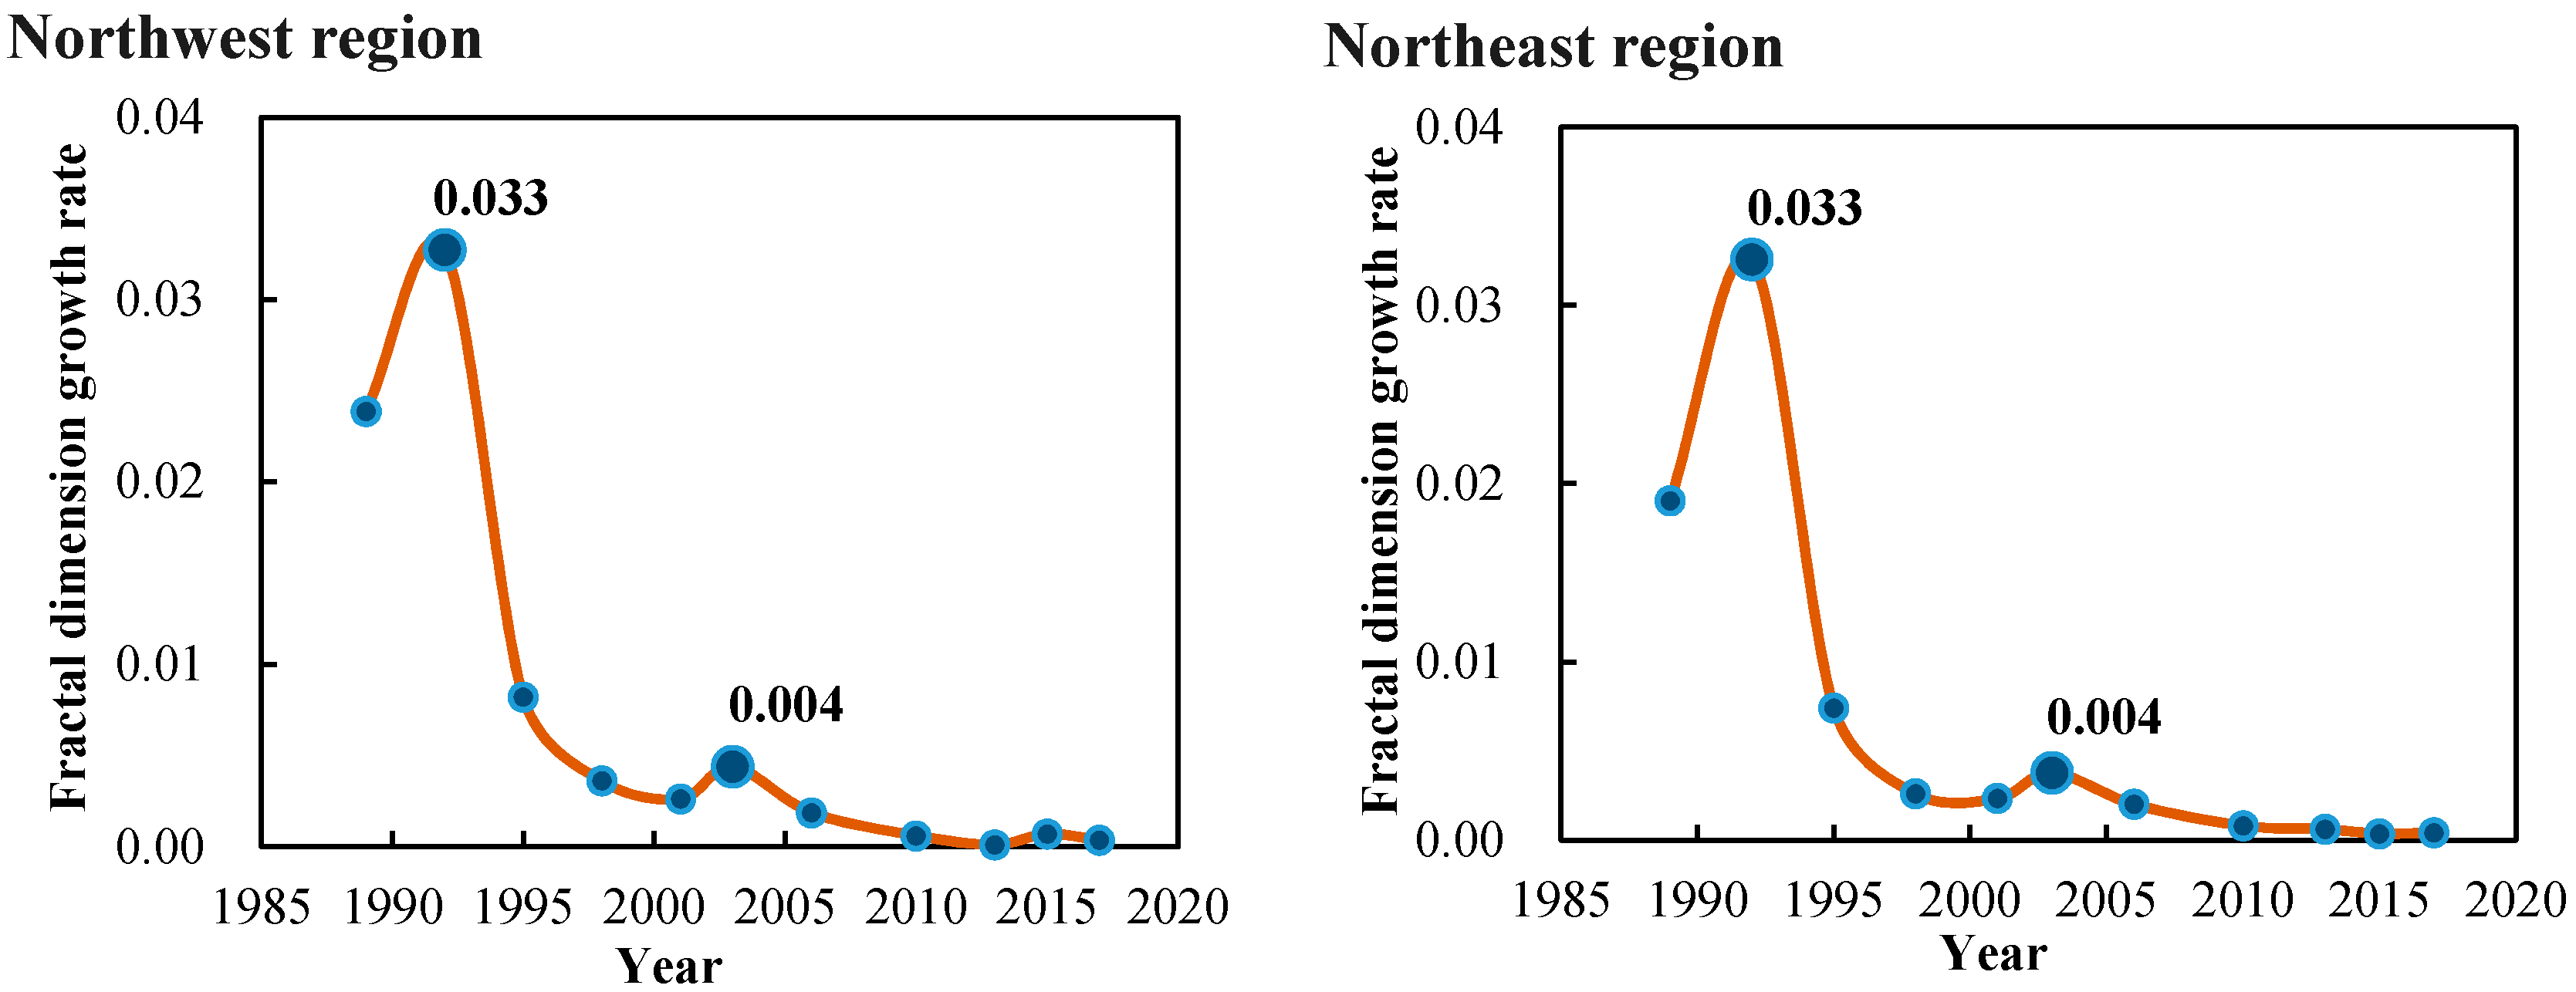
In addition, we can obtain other further information by calculating the data in Table 1. The average speed of urban space-filling degree in the four study areas can be calculated using . The calculation result values are 0.0202, 0.0133, 0.0189, and 0.0177, respectively. In terms of area, the entire region is the largest region among four study regions and its value of average speed of urban space-filling degree is also the largest. It suggests that Shenzhen experienced conversion of a large number of other land types to urban land in this period, and the fastest growth and expansion of urban land occurred in the northwest part, followed by the northeast part and central part. Moreover, as shown in Figure 2, it is clear that Shenzhen city had two peaks of urban sprawl during 1986–2017, which were in 1992 and in 2003, but the extent of urban expansion in 1992 was significantly higher than in 2003. In 1992, the northwest and northeast regions of Shenzhen had the same urban land-use development level; by contrast, the central region had a slower development, but in 2003, these three subregions had basically the same urban land-use development level.
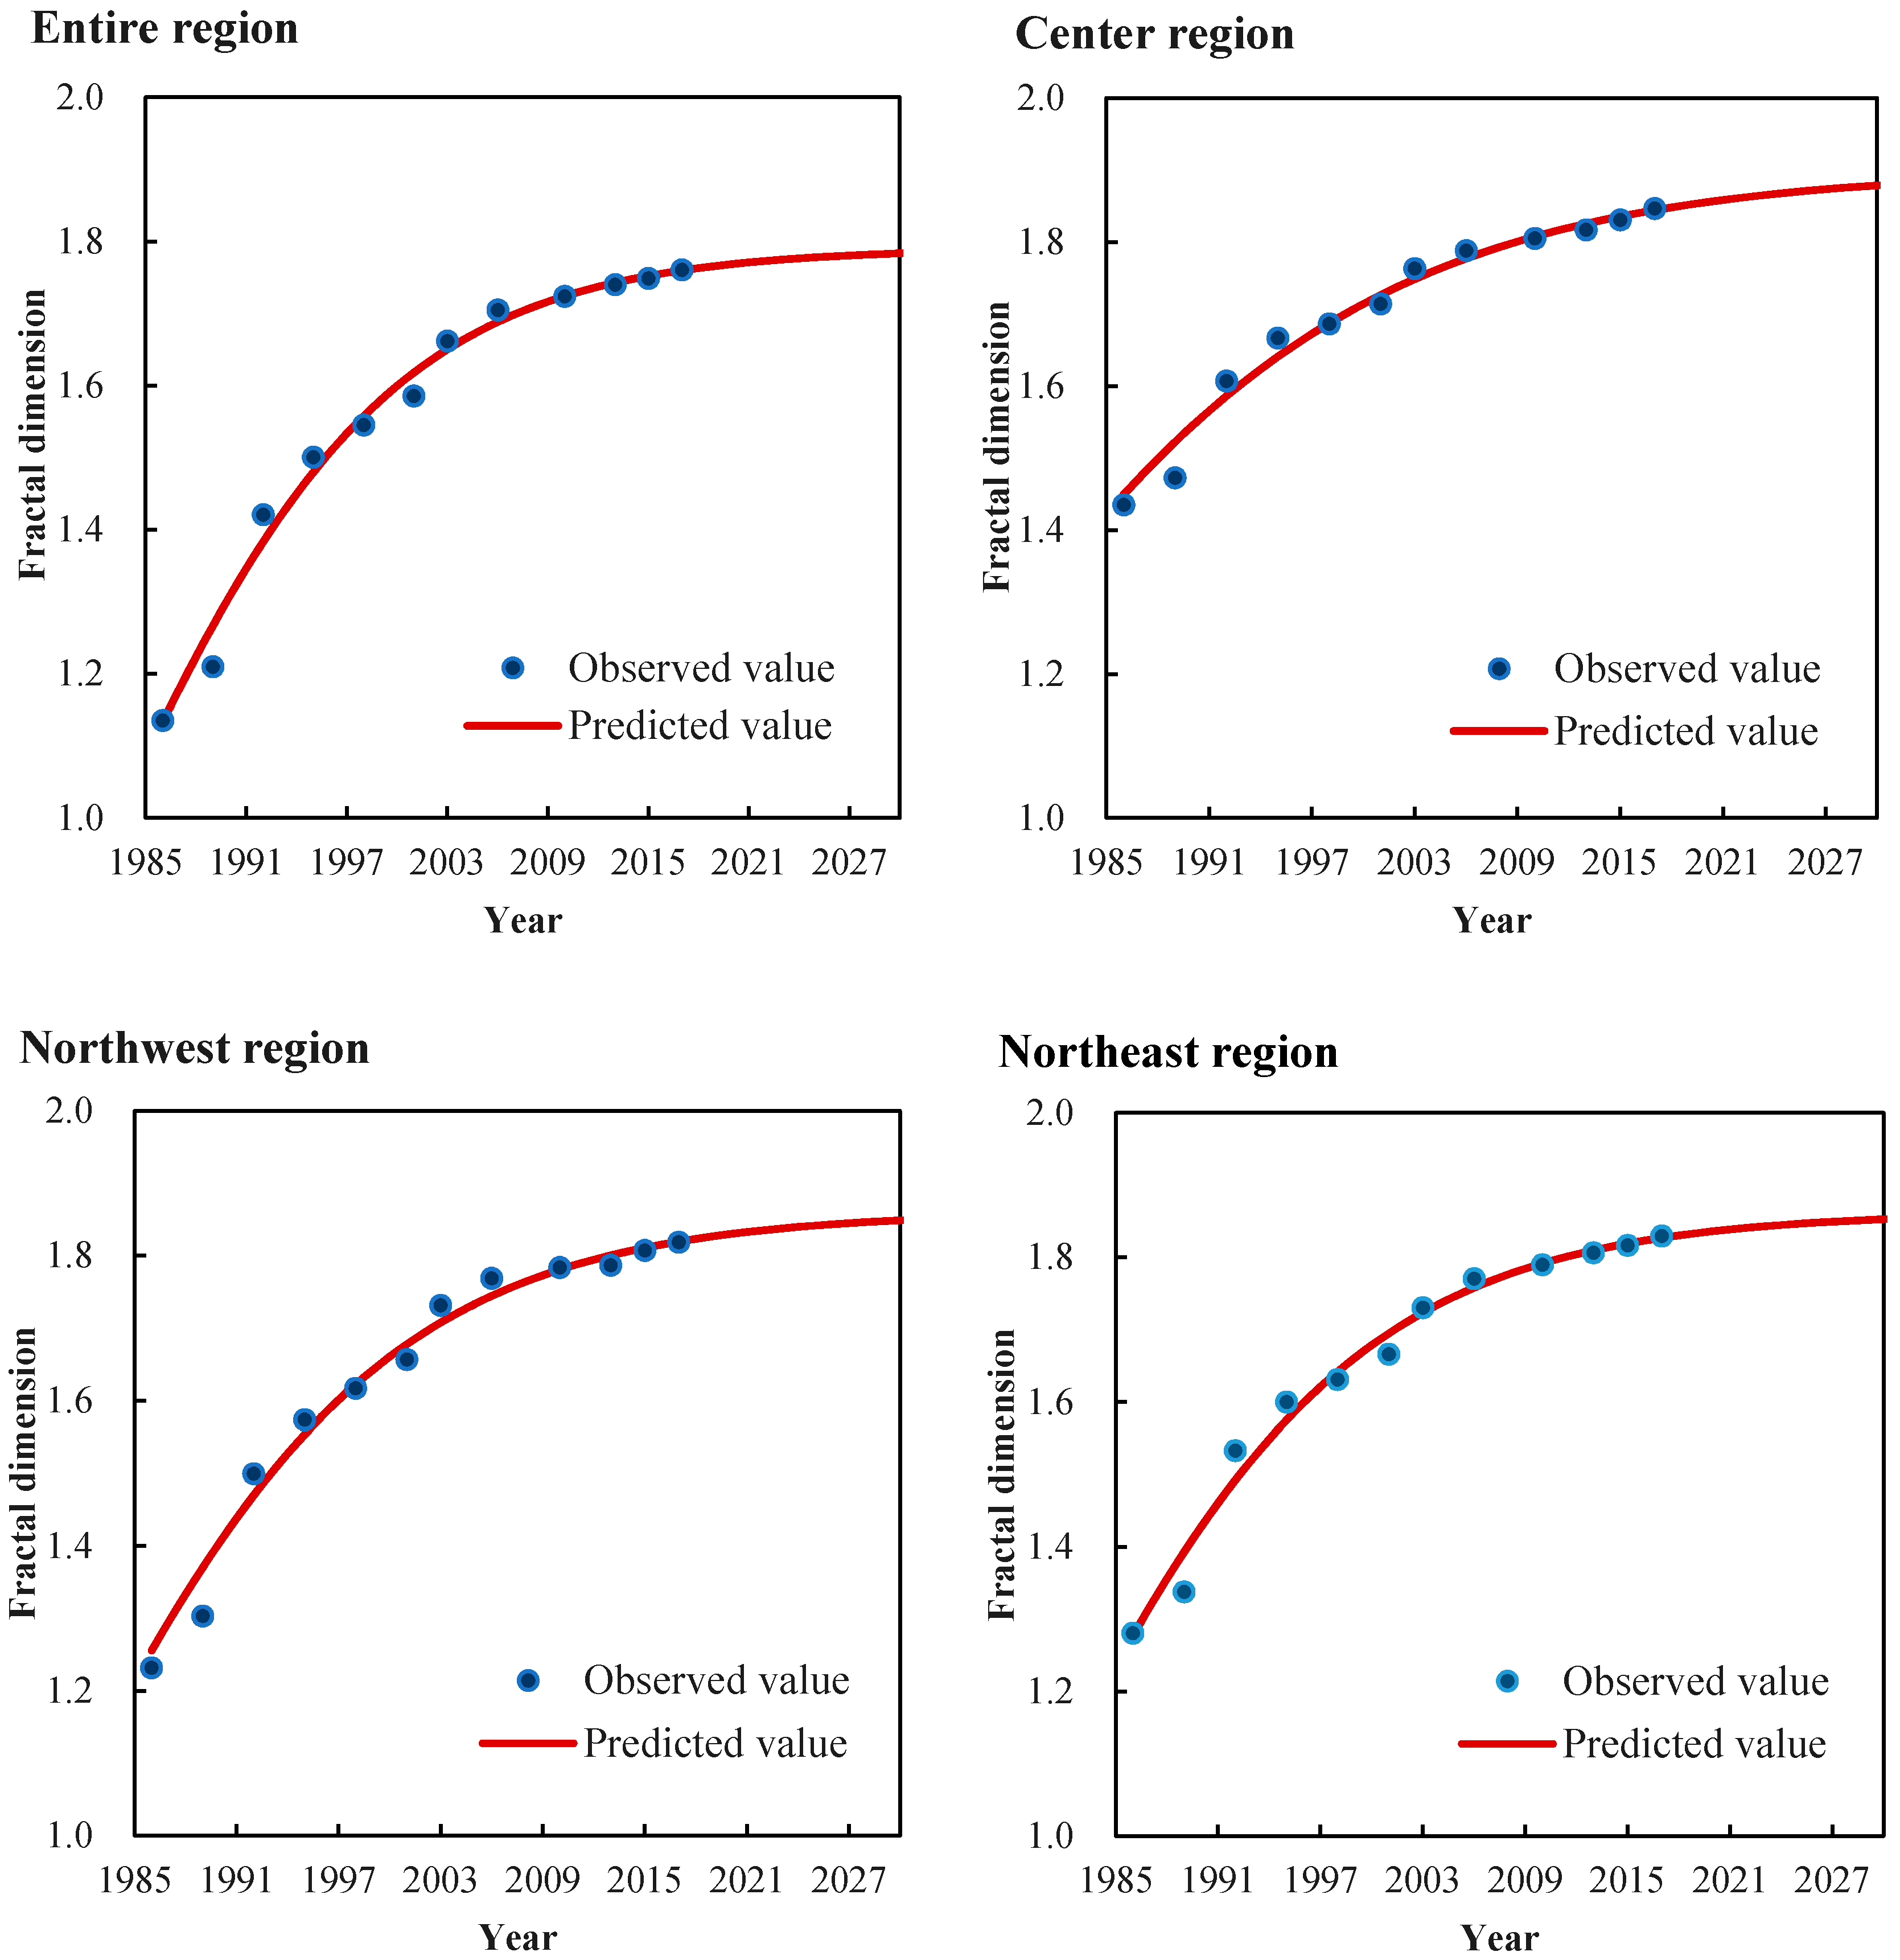
3.2. Fractal Dimension Growth Curves
The results of the four regions’ fractal dimension sets to fit the logistic model by ordinary least square (OLS) estimation and goodness-of-fit search (GOFS) are shown in Figure 3. It is obvious that fractal dimension growth curves of the four regions in Shenzhen can all be very well fitted by first-order logistic function. The specific first-order logistic expressions and relevant parameters are shown in Table 2; the goodness-of-fit R2 of first-order logistic expressions for each region is very high. Meanwhile, we can also simply obtain the maximum capacity fractal dimension and predict the year of reaching maximum capacity by the logistic expression of each region. As shown in Table 2, the maximum capacity fractal dimension of space of the four study regions—entire, center, northwest, and northeast—in Shenzhen is 1.7905, 1.9, 1.86, and 1.8621, respectively, and the corresponding years of reaching above values are 2072, 2197, 2085, and 2082, respectively. It is simple to see that the center region in Shenzhen has both the largest maximum capacity fractal dimension of space and the longest time to reach the year of reaching above the value. However, connecting with the practical situation, those values, in fact, are overvalued, as within study areas, land that is completely inhospitable to humans, such as rivers and high mountains, is included.
3.3. Power Law Analysis
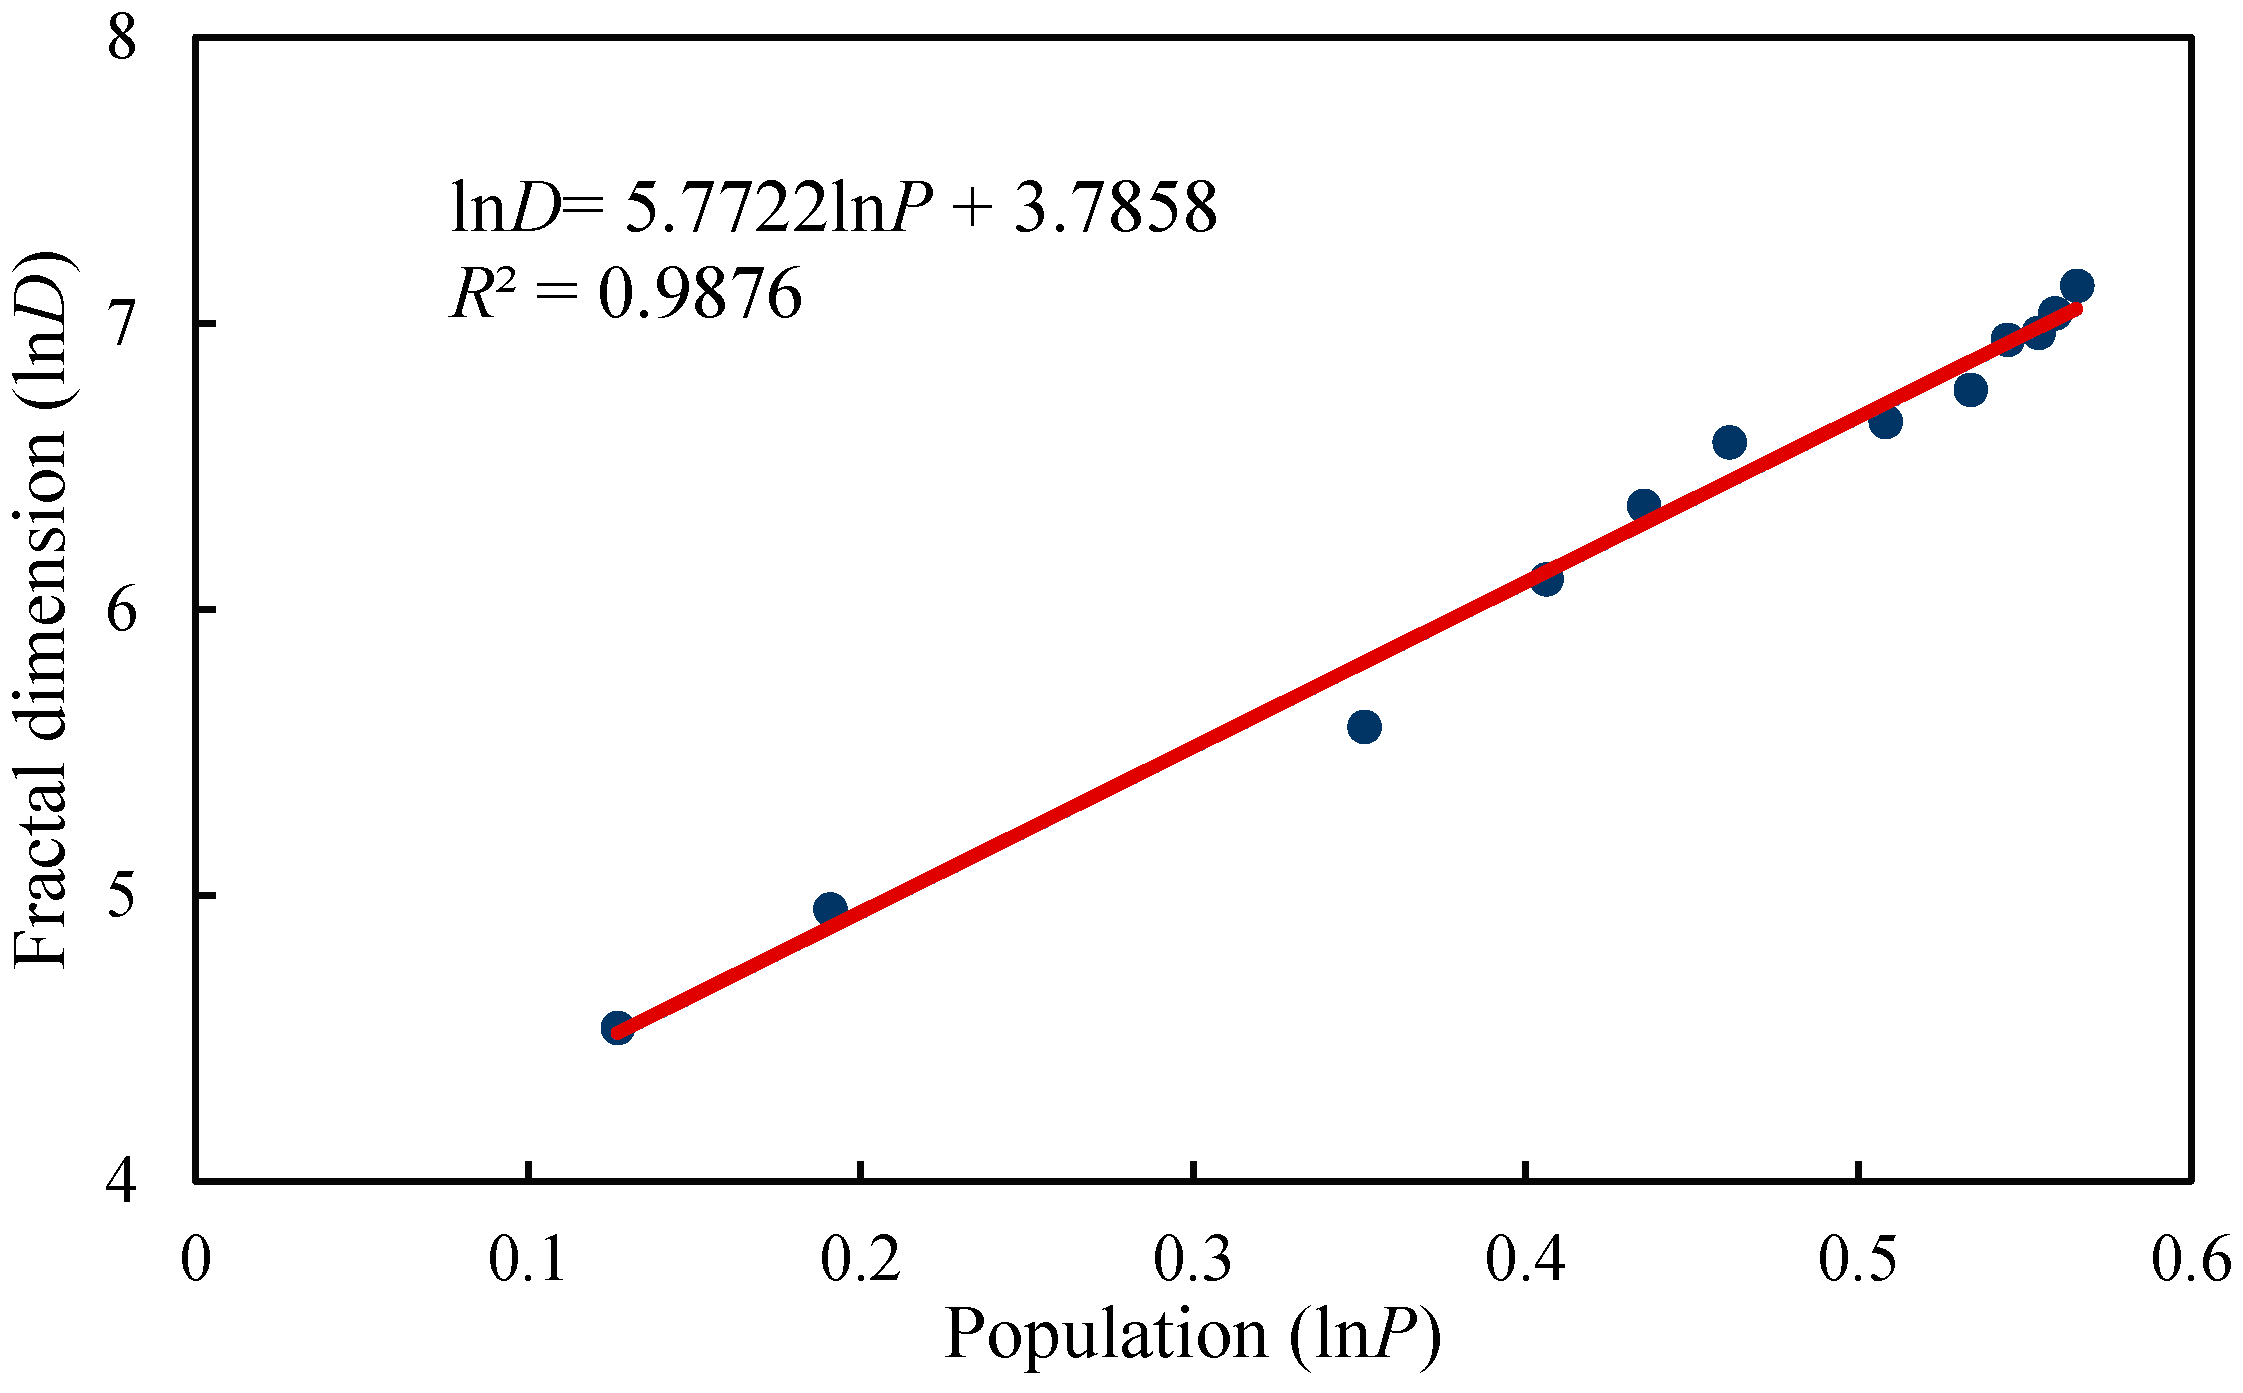
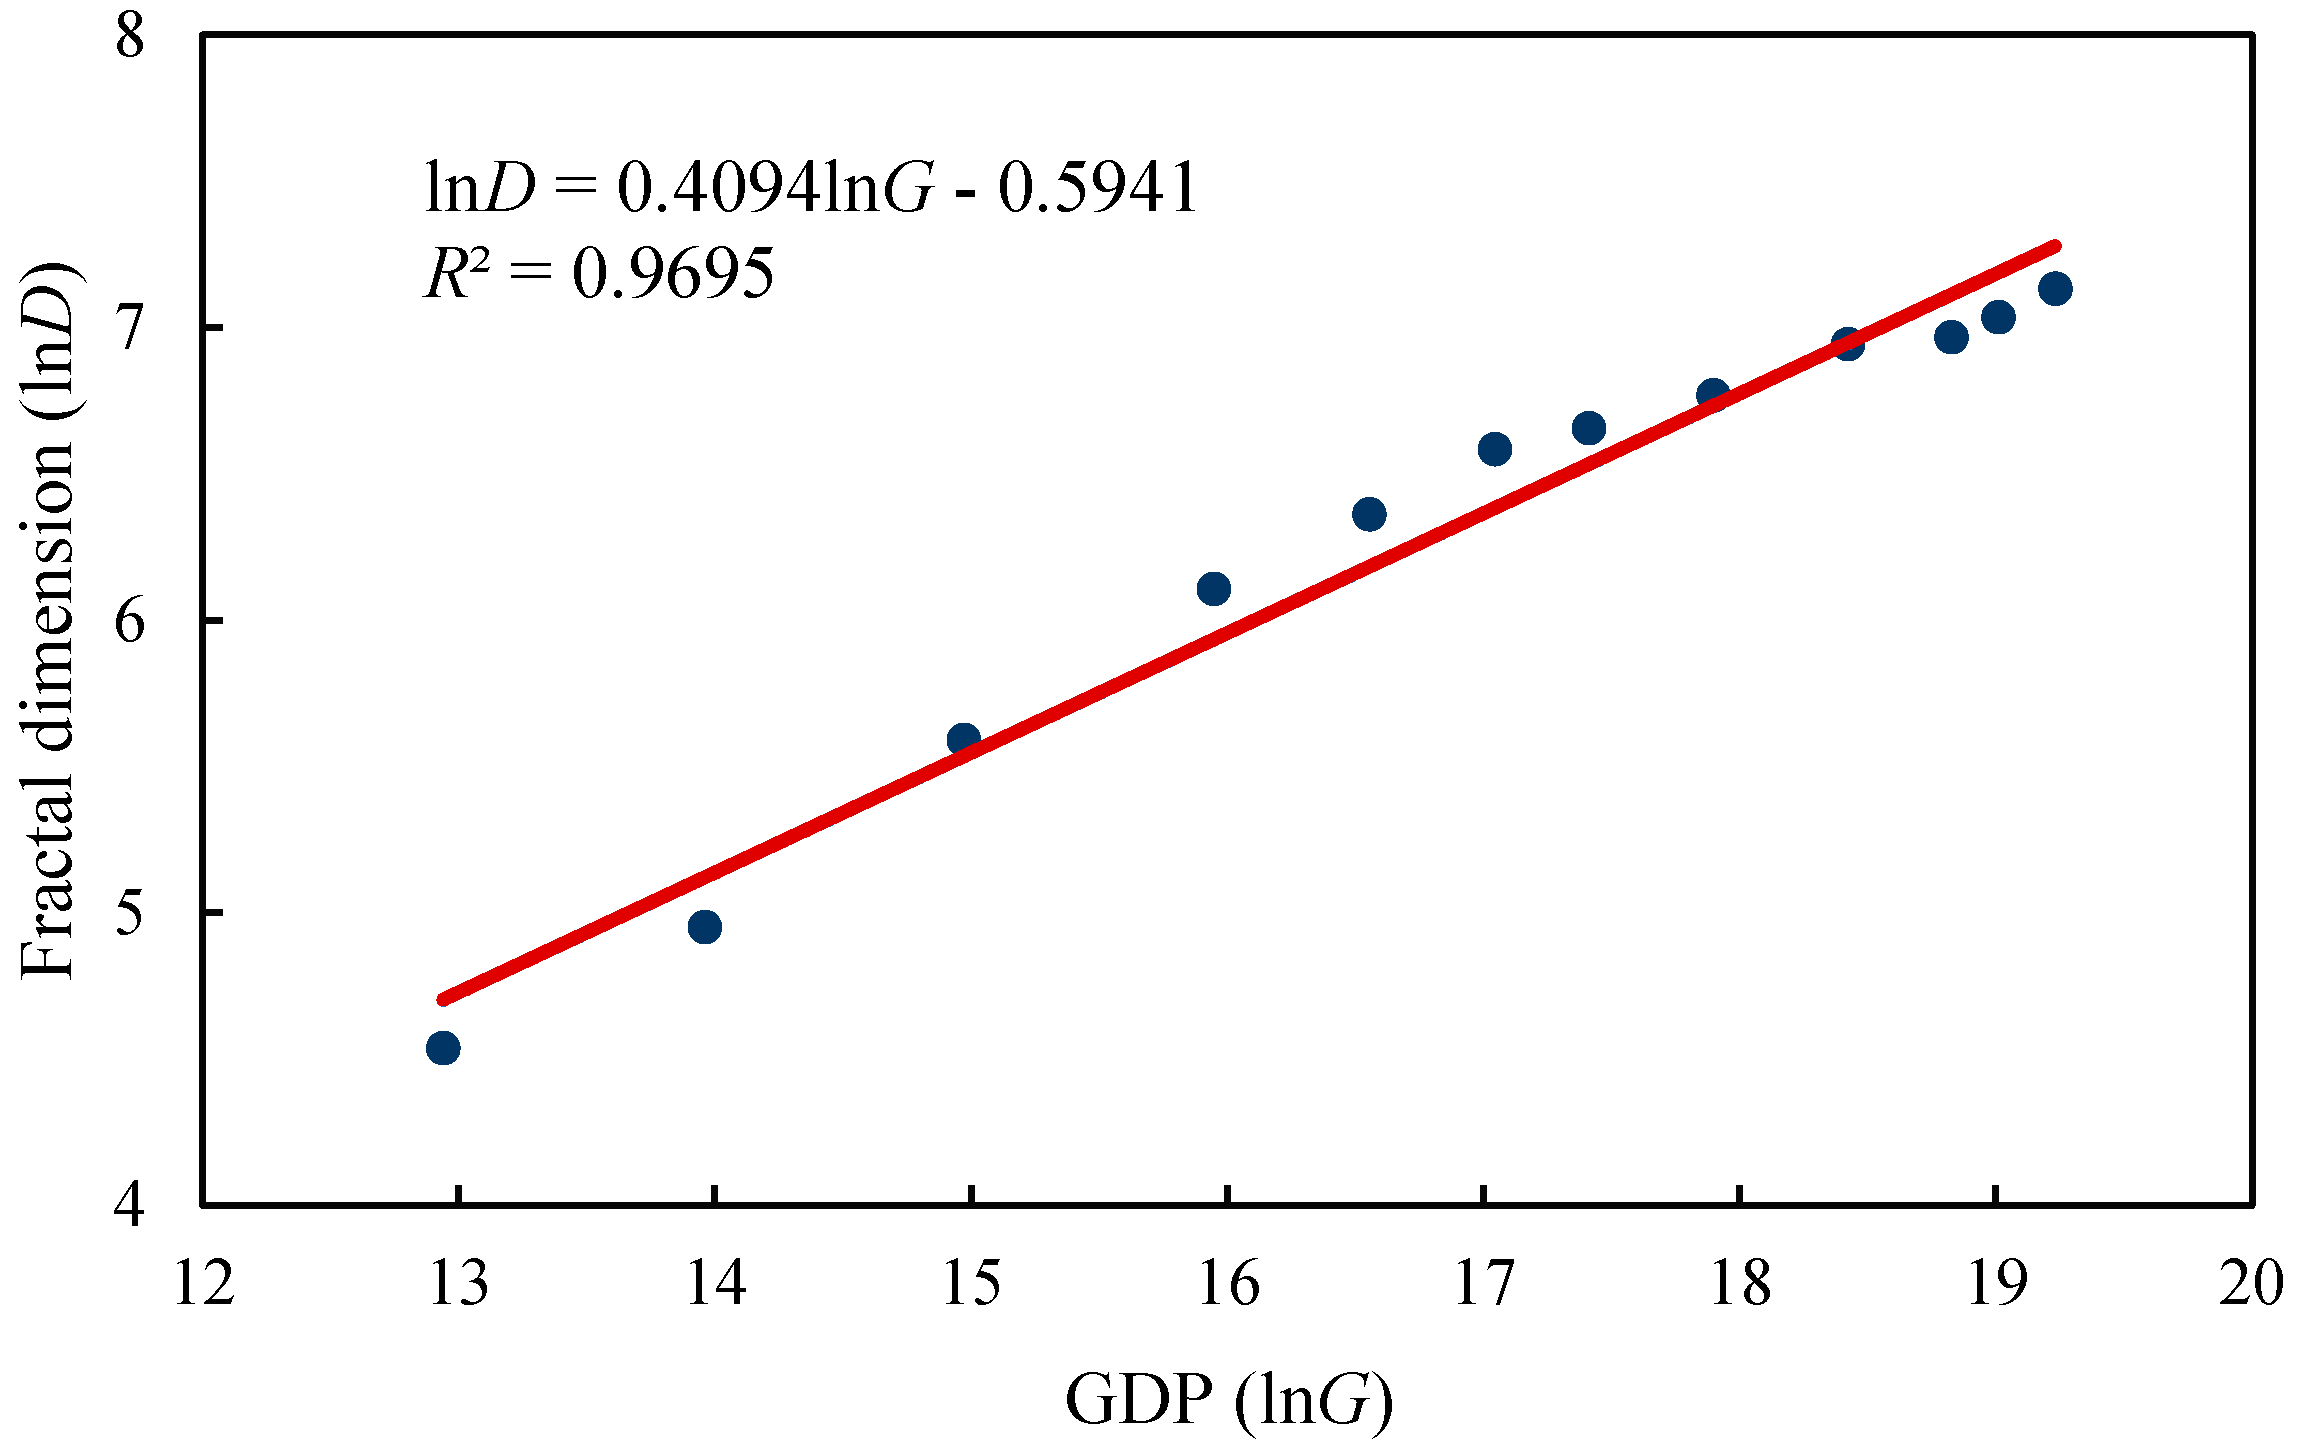
The results of the population size, GDP, and fractal dimension values of the entire Shenzhen from 1986 to 2017 are shown in Figure 4 and Figure 5. Between population size, GDP, and fractal dimension exist significant law relations, and the values of goodness-of-fit R2 are quite high—all above 0.96. The increase in fractal dimension with time usually indicates the urban sprawl. It usually relates to the factors of population size and the level of economic development [66]. It implies that both population size and GDP are the driving factors of promoting the urban sprawl in Shenzhen from 1986 to 2017. However, the accelerating role of population regarding urban expansion is much greater than GDP in terms of their respective power exponents, which indicates that Shenzhen city has no need to boost its economic development at the expense of urban expansion. It is also worth considering the problem of whether or not both individual behavior and public policy play key roles in the population and economic growth for a city. It will be discussed in Section 4 of this paper.
4. Discussion
By means of the calculation and analysis of fractal parameters, we can obtain a lot of new knowledge about the city of Shenzhen. Some knowledge can be generalized to explain the spatio-temporal evolution of other cities. Where city fractals are concerned, Shenzhen differs from many cities in northern China [6]. It is similar, to an extent, to cities in Europe and American cities [53,54]. This is revealing for us to understand city development. The main points of the above studies can be summarized as follows (Table 3). First, the urban form of Shenzhen possesses a fractal structure. This suggests that the spatial order of this city has emerged by self-organized evolution. Second, different subareas of the study take on different fractal dimension values. This indicates spatial heterogeneity of Shenzhen’s urban form, and spatial heterogeneity suggests multifractal scaling of city development. Third, the fractal dimension values seem to descend from the center of city to the suburbs and exurbs. Especially at the early stages (1986–2001), the fractal dimension values of the center region were significantly higher than the fractal dimension values of the northwest region and the northeast region (Figure 1; Table 1). This suggests a hidden circular structure of city development. The circular structure behind irregular urban forms can be revealed by fractal dimension changes [20]. Fourth, the goodness-of-fit for fractal dimension estimation ascended over time. From 1986 to 2017, the R square value went up and up until it was close to 1 (Table 1). This suggests that the fractal structure of Shenzhen became better and better, gradually, through self-organized evolution. Fifth, the fractal dimension growth curves of urban form can be modeled by conventional logistic function. This differs from the fractal dimension growth curves of cities in northern China but is similar to those of the cities in Western developed countries. This, perhaps, resulted from the bottom-up urbanization process of southern cities in China, dominated by self-organized evolution, which is associated with market mechanism. Sixth, the fractal dimension values approached the capacity parameters. All the fractal dimension values in 2017 are close the maximum value, Dmax. This suggests that the urban space of Shenzhen is filled to a great degree, and there are not many remaining spaces for future development.
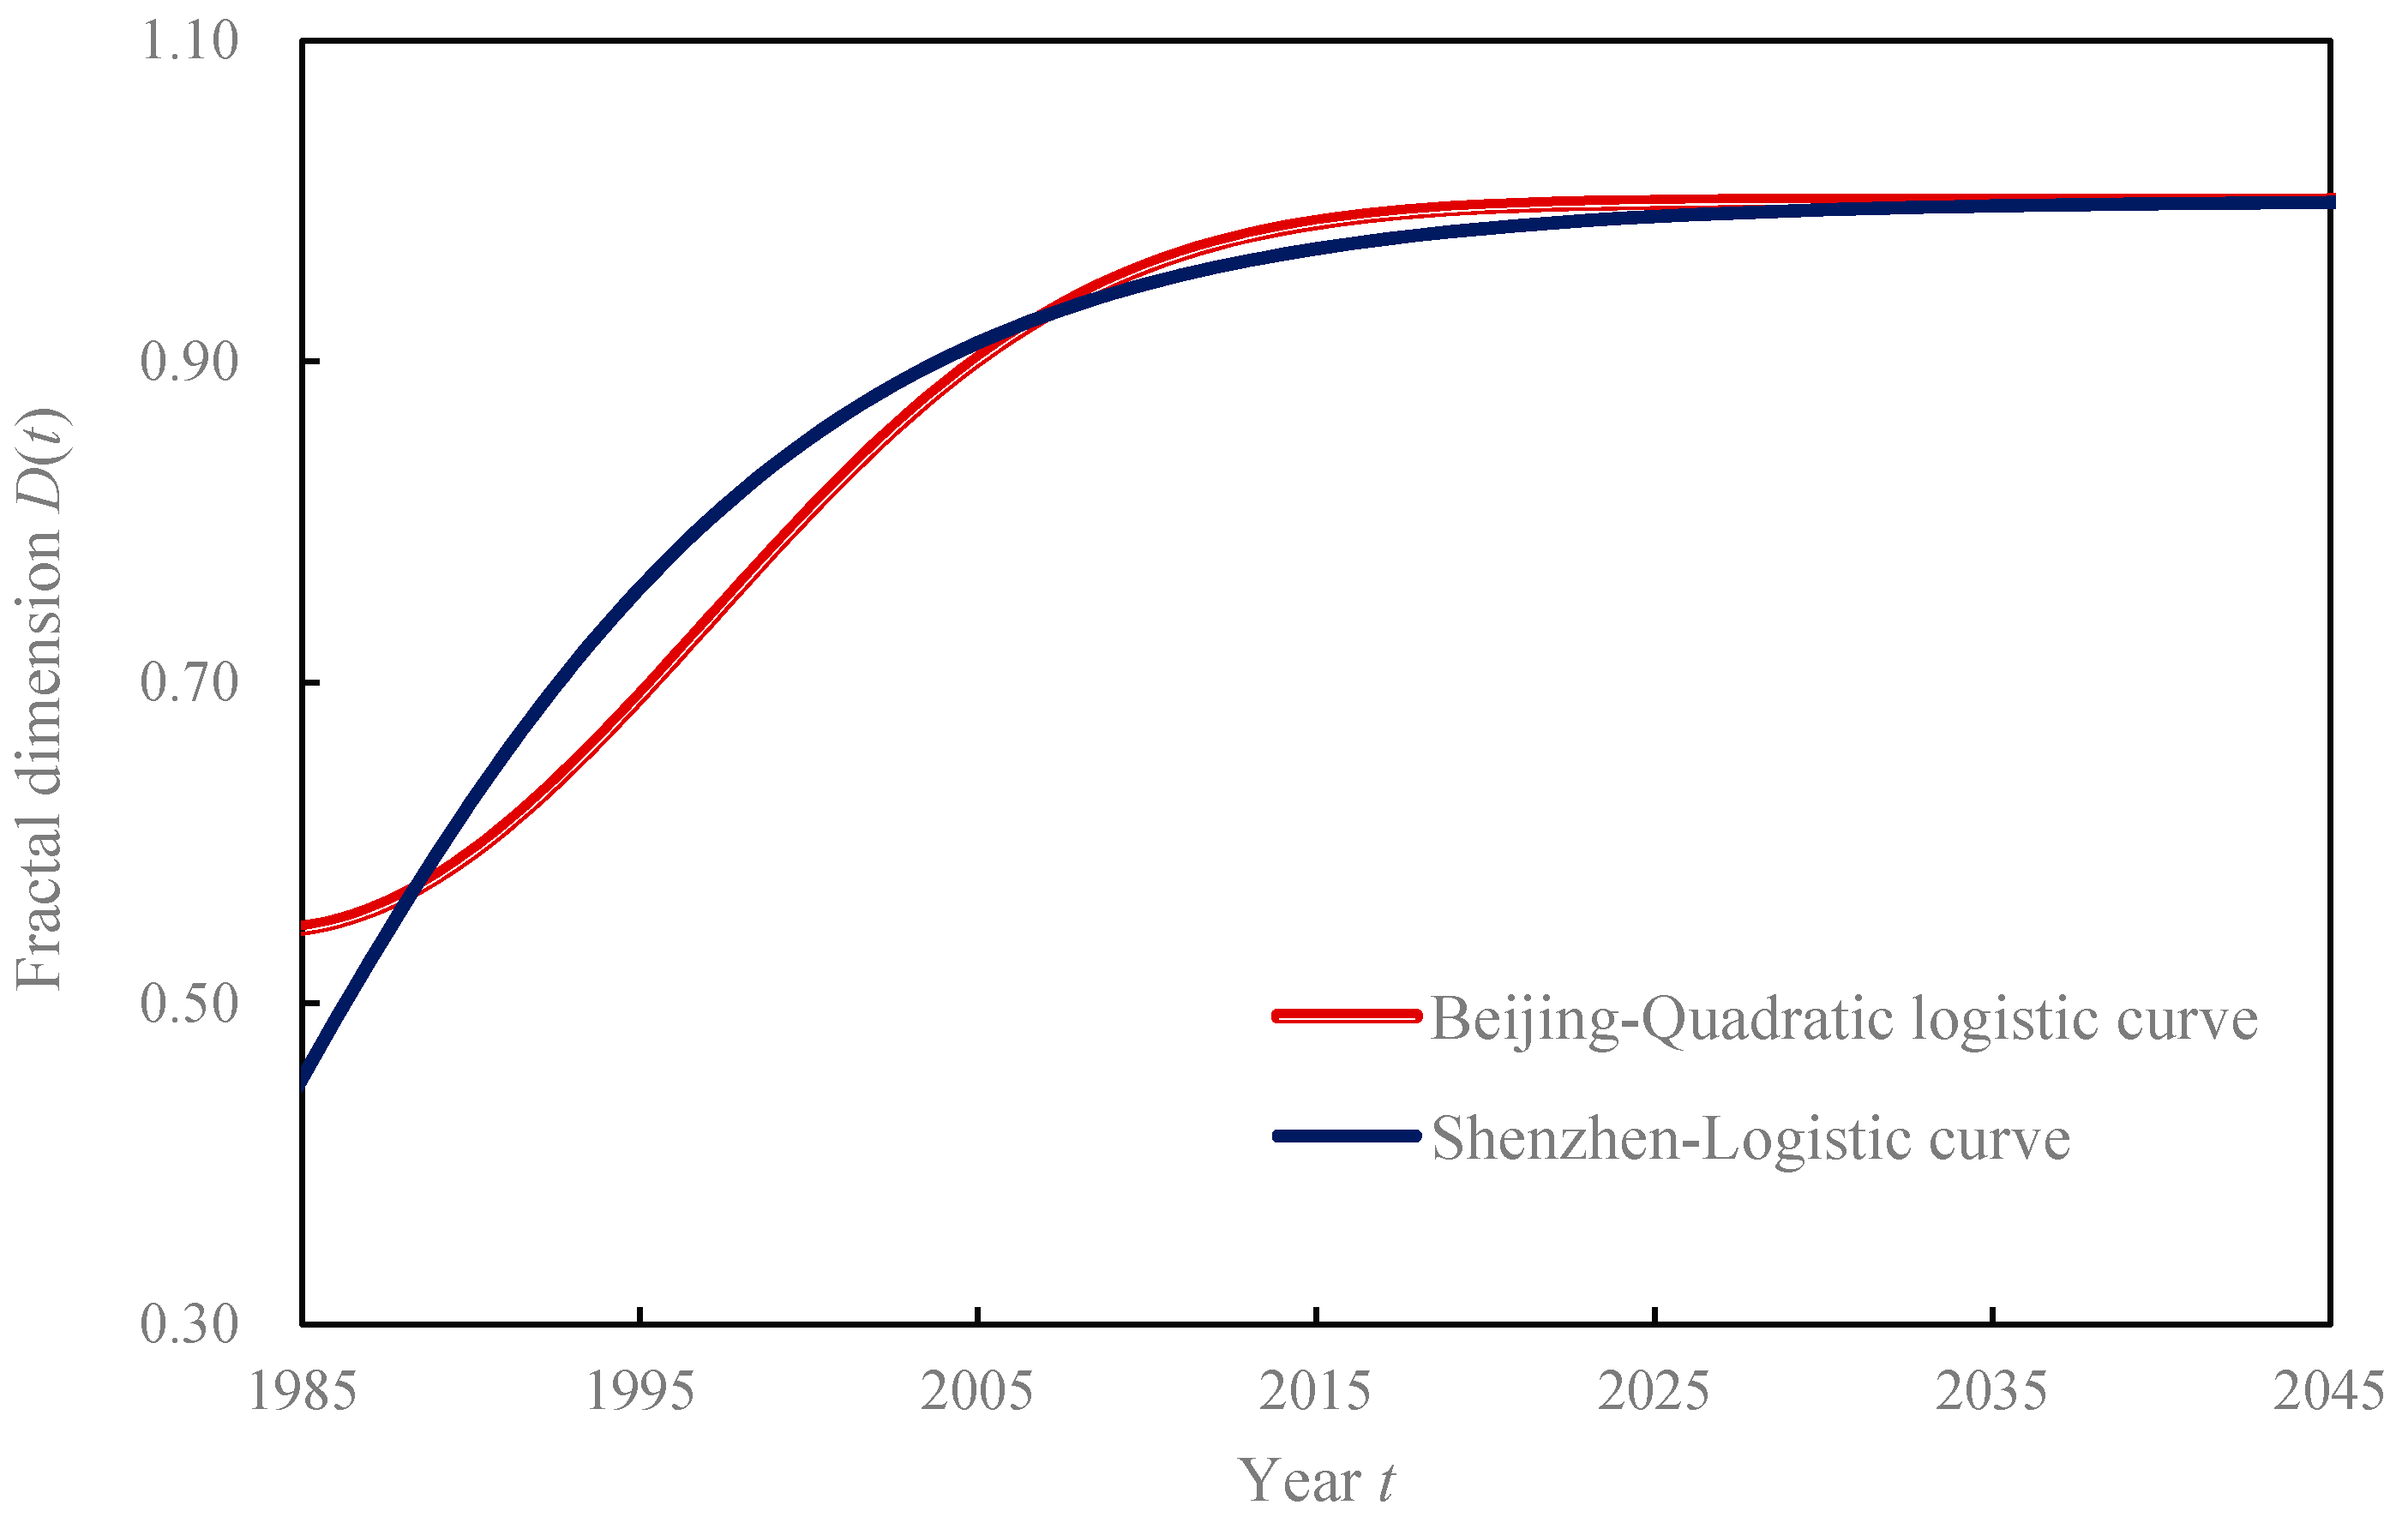
The fractal dimension growth curves of urban form in the four study regions of Shenzhen can be very well modeled with first-order logistic function (Figure 3), which is the same with some Western cities, such as London (UK), Tel Aviv (Israel), and Baltimore (USA) [53,54], but different from northern cities of China, such as Beijing. The biggest difference between logistic curve and quadratic logistic curve is the rate of growth before the curve reaches the maximum capital value; the logistic curve is much slower than the quadratic logistic curve (Figure 6). Urban form and growth are associated with urbanization, and the process of urbanization of a region seems to impact the development of urban morphology. Urban form is one of important components of urbanization [67]. The model of fractal dimension curve of urban growth is always consistent with the urbanization curve in a country or a region [53]. Urbanization falls into two types: one is bottom-up urbanization, and the other, top-down urbanization [68]. Bottom-up urbanization is associated with market economy and chiefly dominated by the well-known “invisible hand” of free competition, while top-down urbanization is associated with command economy and is mainly dominated by the visible hand of administrative intervention [69]. Different economic mechanisms and corresponding urbanization types have their own advantages and disadvantages. Bottom-up urbanization corresponds to self-organized evolution of cities. All cities can be treated as self-organized cities [33]. However, self-organization processes of cities are influenced by the political and economic systems of a nation or a region. The fact is that China’s southeast coastal areas opened earlier and their economic development has been more strongly affected by the international community. This fact may account for the fractal dimension growth curves of Shenzhen’s urban form.
Most cities in in northern China were often deeply impacted by planned economy for a long time. The planned economy in China, also known as the command economy, is generally referred to as a kind of economic system in which production, resource allocation, and consumption are planned and decided by the government in advance. Especially in the early years of China’s development, before the reformation and opening, land development could be regarded as a special product under the planned economy system and its development and utilization were all dominated by the government. Such an urban development pattern led to the rapid expansion of Chinese urban forms in a certain period of time, and time series of the fractal dimension values can be well fitted as the formal features of like Beijing quadratic logistic curve in Figure 6. Until the 1990s, China began reforming and opening up, built a socialist market economy, and set up some cities as special economic zones or as the testing ground for developing the market economy. That way, the land development also gradually changed from the original government-lend mode to the mode of enterprise participation. Shenzhen, China, is one of such representative cities [70]. In spite of Shenzhen being a typical case with the characteristics of both the market economy and planned economy, according to Table 2, it illustrates that market economy in Shenzhen has a bigger impact than public policy, or market economy dominates the development of Shenzhen rather than public policy. However, the role of public policy is irreplaceable in Shenzhen. It is, perhaps, precisely such development patterns that quickly enabled its surprising economic development and population growth, becoming China’s forefront of reform and opening up, leading the development of Chinese economy.
The novelty of this work lies in two aspects. One is the investigation of different subareas. Shenzhen was divided into three overlapped subareas. Then, we examined fractal structure and fractal dimension growth of the entire study area and three subareas. Although a similar way was once used by [18], the studied area division of this paper bears its characteristics. The other is the modeling fractal dimension curves of urban growth by conventional logistic function. This results in a new discovery that the fractal growth of southern cities differs from that of northern cities in China. This discovery leads to a new understanding that the mode of urban growth corresponds to the mode of urbanization, and urbanization dynamics are dominated by the structure of the economic system. The main shortcomings of this studies are as below. First, the data before 1986 were absent. We only found remote sensing images from 1986 and beyond. Thus, we cannot identify the time in which the real peak of urban growth appeared. In fact, after 1986, the peak of the growth rate of urban land use in Shenzhen had passed. Second, the definition and division of study area lack sufficient objective bases. The principal criteria of the study area and subareas are empirics and research objective. Third, only the box-counting method was used. This method is suitable for measuring and estimating global fractal dimension. The local fractal dimension can be calculated with the cluster growing method, that is, by radius-area scaling [9,20]. The cluster growing method can yield radial dimension [71]. The radial dimension can be used to reflect urban growth from another angle of view.
5. Conclusions
The scale-free spatial analysis of urban form revealed the fractal structure and evolution characteristics of Shenzhen city. This analysis is not only helpful for deeply understanding the city of Shenzhen but is also useful for understanding the regularities and dynamic mechanisms of urban evolution in different regions and even in different countries. The main conclusions of this study can be drawn as follows. Firstly, the urban form of Shenzhen city has a significant fractal feature. However, the spatial distribution of urban land has heterogeneity, as different subareas of urban region show different fractal dimension values at the same time, which suggests multifractal scaling. The fractal dimension decays from the center to the edge, indicating the circular structure of urban form. Secondly, the fractal dimension curves of the urban growth of Shenzhen bear S-shape characteristics and can be modeled by the conventional logistic function, which differs from the fractal dimension curves of cities in northern China. Different logistic functions suggest different types of urbanization dynamics. The conventional logistic function indicates bottom-up urbanization, while the quadratic logistic function suggests top-down urbanization. Thirdly, the fractal structure of the urban form of Shenzhen shows a clear evolutionary process. Fractal dimension is a parameter of inference which can be used to judge fractal structure. Meanwhile, fractal structure can be evaluated by the parameter of description, i.e., the goodness of fit. The R square value of Shenzhen’s fractal modeling went up and up over time until it approached 1. This suggests the fractal structure become optimized through self-organization. Fourthly, the fractal dimension of the urban form in Shenzhen is approaching its limit, and the past urban development patterns seem to be no longer sustainable. Fractal dimension values are tending towards the maximum value, which suggests that the space-filling of Shenzhen is already near its limit, and there are few land resources available within the study area. It has to occupy precious ecological resources or water resources if it continues to expand and extend. Thus, for Shenzhen city, a new mode of development is needed in future. Finally, fractal dimension is the indicator of urban sprawl. Population plays a significant role for the urban growth of Shenzhen city rather than GDP. Shenzhen city needs no to boost its economic development at the expense of urban expansion.
Author Contributions
Xiaoming Man contributed reagents/materials/analysis tools; Yanguang Chen conceived and designed the experiments; Xiaoming Man performed the experiments; Xiaoming Man and Yanguang Chen analyzed the data; Xiaoming Man wrote the original draft; Yanguang Chen reviewed and edited the draft. All authors have read and agreed to the published version of the manuscript.
Funding
This research was sponsored by the National Natural Science Foundation of China (Grant No. 41671167).
Acknowledgments
We would like to thank the two anonymous reviewers whose constructive comments were helpful in improving the quality of this paper.
Conflicts of Interest
The author declares no conflict of interest.
References
- Hao, B. Fractals and fractal dimensions. Science 1986, 38, 9–17. (In Chinese) [Google Scholar]
- Liu, S.; Liu, S. Solitary Wave and Turbulence; Shanghai Scientific and Technological Education Publishing House: Shanghai, China, 1994. (In Chinese) [Google Scholar]
- Takayasu, H. Fractals in the Physical Sciences; Manchester University Press: Manchester, UK, 1990. [Google Scholar]
- Benguigui, L.; Czamanski, D. Simulation analysis of the fractality of cities. Geogr. Anal. 2004, 36, 69–84. [Google Scholar] [CrossRef]
- Frankhauser, P. Comparing the morphology of urban patterns in Europe. In European Cities—Insights on Outskirts, Report COST Action 10 Urban Civil Engineering, Structures; Borsdorf, A., Zembri, P., Eds.; Université de Bourgogne Franche-Comté: Dijon, France, 2004; Volume 2, pp. 79–105. [Google Scholar]
- Chen, Y.; Huang, L. Modeling growth curve of fractal dimension of urban form of Beijing. Phys. A Stat. Mech. Appl. 2019, 523, 1038–1056. [Google Scholar] [CrossRef] [Green Version]
- Salat, S. A systemic approach of urban resilience: Power laws and urban growth patterns. Int. J. Urban Sustain. Dev. 2017, 9, 107–135. [Google Scholar] [CrossRef]
- Chen, Y.; Wang, J.; Feng, J. Understanding the fractal dimensions of urban forms through spatial entropy. Entropy 2017, 19, 600. [Google Scholar] [CrossRef] [Green Version]
- Frankhauser, P. The fractal approach: A new tool for the spatial analysis of urban agglomerations. Population 1998, 10, 205–240. [Google Scholar]
- Jevric, M.; Romanovich, M. Fractal dimensions of urban border as a criterion for space management. Procedia Eng. 2016, 165, 1478–1482. [Google Scholar] [CrossRef]
- Mandelbrot, B. The Fractal Geometry of Nature; W.H. Freeman and Company: New York, NY, USA, 1983. [Google Scholar]
- Dauphiné, A. Fractal Geography; Wiley-ISTE: Hoboken, NJ, USA, 2013. [Google Scholar]
- Arlinghaus, S. Fractals Take a Central Place. Geogr. Ann. Ser. B Hum. Geogr. 1985, 67, 83–88. [Google Scholar] [CrossRef]
- Batty, M.; Longley, P. Fractal-based description of urban form. Environ. Plan. B Plan. Des. 1987, 14, 123–134. [Google Scholar] [CrossRef] [Green Version]
- Batty, M.; Longley, P. Urban shapes as fractals. Area 1987, 19, 215–221. [Google Scholar]
- Batty, M.; Xie, Y. Preliminary evidence for a theory of the fractal city. Environ. Plan. A 1996, 28, 1745–1762. [Google Scholar] [CrossRef]
- Chen, Y.; Wang, Y. A fractal study on interaction between towns in urban systems. Bull. Sci. Technol. 1997, 13, 233–237. (In Chinese) [Google Scholar]
- Benguigui, L.; Czamanski, D.; Marinov, M.; Portugali, Y. When and where is a city fractal? Environ. Plan. B Plan. Des. 2000, 27, 507–519. [Google Scholar] [CrossRef] [Green Version]
- Shen, G. Fractal dimension and fractal growth of urbanized areas. Int. J. Geogr. Inf. Sci. 2002, 16, 419–437. [Google Scholar] [CrossRef]
- White, R.; Engelen, G. Cellular automata and fractal urban form: A cellular modelling approach to the evolution of urban land-use patterns. Environ. Plan. A 1993, 25, 1175–1199. [Google Scholar] [CrossRef] [Green Version]
- Batty, M.; Longley, M. Fractal Cities—A Geometry of Form and Function; Academic Press: London, UK, 1994. [Google Scholar]
- Frankhauser, P. La Fractalité des Structures Urbaines (The Fractal Aspects of Urban Structures); Economica, Anthropos: Paris, France, 1994. [Google Scholar]
- Allen, P. Cities and regions as evolutionary, complex systems. Geogr. Syst. 1997, 4, 103–130. [Google Scholar]
- Batty, M.; Longley, P. The fractal simulation of urban structure. Environ. Plan. A 1986, 18, 1143–1179. [Google Scholar] [CrossRef]
- Batty, M.; Longley, P. The morphology of urban land use. Environ. Plan. B Plan. Des. 1988, 15, 461–488. [Google Scholar] [CrossRef]
- Batty, M.; Kim, K. Form follows function: Reformulating urban population density functions. Urban Stud. 1992, 29, 1043–1069. [Google Scholar] [CrossRef]
- Batty, M.; Longley, P.; Fotheringham, S. Urban growth and form: Scaling, fractal geometry, and diffusion- limited aggregation. Environ. Plan. A 1989, 21, 1447–1472. [Google Scholar] [CrossRef]
- Fotheringham, A.; Batty, M.; Longley, P. Diffusion-limited aggregation and the fractal nature of urban growth. Pap. Reg. Sci. Assoc. 1989, 67, 55–69. [Google Scholar] [CrossRef]
- Benguigui, L. Aggregation models for town growth. Philos. Mag. Part B 1998, 77, 1269–1275. [Google Scholar] [CrossRef]
- Benguigui, L.; Czamanski, D.; Marinov, M. City growth as a leap-frogging process: An application to the Tel-Aviv Metropolis. Urban Stud. 2001, 38, 1819–1839. [Google Scholar] [CrossRef]
- Benguigui, L.; Czamanski, D.; Marinov, M. The dynamics of urban morphology: The case of Petah Tikvah. Environ. Plan. B Plan. Des. 2001, 28, 447–460. [Google Scholar] [CrossRef]
- Chen, Y. A new model of urban population density indicating latent fractal structure. Int. J. Urban Sustain. Dev. 2009, 1, 89–110. [Google Scholar] [CrossRef] [Green Version]
- Portugali, J. Self-Organization and the City; Springer: Berlin/Heidelberg, Germany, 2000. [Google Scholar]
- Thomas, I.; Frankhauser, P.; Biernacki, C. The morphology of built-up landscapes in Wallonia (Belgium): A classification using fractal indices. Landsc. Urban Plan. 2008, 84, 99–115. [Google Scholar] [CrossRef]
- Triantakonstantis, D. Urban growth prediction modelling using fractals and theory of chaos. Open J. Civ. Eng. 2012, 2, 81–86. [Google Scholar] [CrossRef] [Green Version]
- Haken, H.; Portugali, J. A synergetic approach to the self-organization of cities and settlements. Environ. Plan. B Plan. Des. 1995, 22, 35–46. [Google Scholar] [CrossRef]
- Chen, Y.; Feng, J. A hierarchical allometric scaling analysis of Chinese cities: 1991–2014. Discret. Dyn. Nat. Soc. 2017, 2017, 1–15. [Google Scholar] [CrossRef]
- Lagarias, A.; Prastacos, P. Comparing the urban form of South European cities using fractal dimensions. Environ. Plan. B Urban Anal. City Sci. 2020, 47, 1149–1166. [Google Scholar] [CrossRef]
- Li, Z.; Liu, B.; Wang, R.; Li, Z. Study on fractal characteristics of hilly city. J. Appl. Sci. Asian Netw. Sci. Inf. 2013, 13, 1155–1159. [Google Scholar]
- Rastogi, K.; Jain, G. Urban sprawl analysis using Shannon’s entropy and fractal analysis: A case study on Tiruchirappalli city, India. Int. Arch. Photogramm. Remote Sens. Spat. Inf. Sci. 2018, 42, 761–766. [Google Scholar] [CrossRef] [Green Version]
- Shreevastava, A.; Rao, P.; McGrath, G. Emergent self-similarity and scaling properties of fractal intra-urban heat islets for diverse global cities. Phys. Rev. E 2019, 100. [Google Scholar] [CrossRef] [PubMed] [Green Version]
- Sidqi, Y.; Thomas, I.; Frankhauser, P.; Retière, N. Comparing fractal indices of electric networks to roads and buildings: The case of Grenoble (France). Phys. A Stat. Mech. Appl. 2019, 531. [Google Scholar] [CrossRef]
- Tucek, P.; Janoska, Z. Fractal dimension as a descriptor of urban growth dynamics. Neural Netw. World 2013, 23, 93–102. [Google Scholar] [CrossRef] [Green Version]
- Ariza-Villaverde, A.; Jiménez-Hornero, F.; Ravé, E. Multifractal analysis of axial maps applied to the study of urban morphology. Comput. Environ. Urban Syst. 2013, 38, 1–10. [Google Scholar] [CrossRef]
- Chen, Y.; Wang, J. Multifractal characterization of urban form and growth: The case of Beijing. Environ. Plan. B Plan. Des. 2013, 40, 884–904. [Google Scholar] [CrossRef]
- Frankhauser, P.; Tannier, C.; Vuidel, G.; Houot, H. An integrated multifractal modelling to urban and regional planning. Comput. Environ. Urban Syst. 2018, 67, 132–146. [Google Scholar] [CrossRef] [Green Version]
- Huang, L.; Chen, Y. A comparison between two OLS-based approaches to estimating urban multifractal parameters. Fractals 2018, 26. [Google Scholar] [CrossRef]
- Ni, C.; Zhang, S.; Chen, Z.; Yan, Y.; Li, Y. Mapping the spatial distribution and characteristics of lineaments using fractal and multifractal models: A case study from northeastern Yunnan Province, China. Sci. Rep. 2017, 7. [Google Scholar] [CrossRef]
- Nie, Q.; Xu, J.; Liu, Z. Fractal and multifractal characteristic of spatial pattern of urban impervious surfaces. Earth Sci. Inform. 2015, 8, 381–392. [Google Scholar] [CrossRef]
- Song, Z.; Yu, L. Multifractal features of spatial variation in construction land in Beijing (1985–2015). Palgrave Commun. 2019, 5, 1–15. [Google Scholar] [CrossRef] [Green Version]
- Song, Z.; Chen, Y.; Li, Y. Comparative studies on Evolutionary Spatial Multifractal Mechanism for built-up lands in Zhengzhou from 1988 to 2015 with the characteristics of Beijing. J. Clean. Prod. 2020, 269. [Google Scholar] [CrossRef]
- Encarnação, S.; Gaudiano, M.; Santos, F.; Tenedório, J.; Pacheco, J. Fractal cartography of urban areas. Sci. Rep. 2012, 2, 257. [Google Scholar] [CrossRef] [PubMed] [Green Version]
- Chen, Y. Logistic models of fractal dimension growth of urban morphology. Fractals 2018, 26. [Google Scholar] [CrossRef] [Green Version]
- Chen, Y. Fractal dimension evolution and spatial replacement dynamics of urban growth. Chaos Solitons Fractals 2012, 45, 115–124. [Google Scholar] [CrossRef] [Green Version]
- Mandelbrot, B. How Long Is the Coast of Britain? Statistical Self-Similarity and Fractional Dimension. Science 1967, 156, 636–638. [Google Scholar] [CrossRef] [PubMed] [Green Version]
- Batty, M. The Size, Scale, and Shape of Cities. Science 2008, 319, 769–771. [Google Scholar] [CrossRef] [Green Version]
- Batty, M. Complexity and emergence in city systems: Implications for urban planning. Malays. J. Environ. Manag. 2009, 10, 15–32. [Google Scholar]
- Bettencourt, L. The origins of scaling in cities. Science 2013, 340, 1438–1441. [Google Scholar] [CrossRef] [Green Version]
- Keuschnigg, M.; Mutgan, S.; Hedström, P. Urban scaling and the regional divide. Sci. Adv. 2019, 5, eaav0042. [Google Scholar] [CrossRef] [PubMed] [Green Version]
- Shenzhen Statistics Bureau (SSB). Shenzhen Statistics Yearbook 2019; China Statistics Press: Beijing, China, 2019.
- Li, W.; Wang, Y.; Peng, J.; Li, G. Landscape spatial changes associated with rapid urbanization in Shenzhen, China. Int. J. Sustain. Dev. World Ecol. 2005, 12, 314–325. [Google Scholar] [CrossRef]
- Ng, M. Shenzhen. Cities 2003, 20, 429–441. [Google Scholar] [CrossRef]
- Chen, Y. Fractal Modeling and fractal dimension description of urban morphology. Entropy 2020, 22, 961. [Google Scholar] [CrossRef]
- Shelberg, M.; Moellering, H.; Lam, N. Measuring the fractal dimensions of empirical cartographic curves. Auto Carto 1982, 5, 481–490. [Google Scholar]
- Islam, Z.; Metternicht, G. Fractal dimension of multiscale and multisource remote sensing data for characterising spatial complexity of urban landscapes. Int. Geosci. Remote Sens. Symp. 2003, 3, 1715–1717. [Google Scholar]
- Rozenfeld, H.; Rybski, D.; Andrade, J.; Batty, M.; Stanley, E.; Makse, H. Laws of Population Growth. Proc. Natl. Acad. Sci. USA 2008, 105, 18702–18707. [Google Scholar] [CrossRef] [PubMed] [Green Version]
- Knox, P.; Marston, S. Places and Regions in Global Context: Human Geography, 5th ed.; Prentice Hall: Upper Saddle River, NJ, USA, 2009. [Google Scholar]
- Zhou, Y. Exploration in Urban Geography; The Commercial Press: Beijing, China, 2010. (In Chinese) [Google Scholar]
- Chen, Y. The evolution of Zipf’s law indicative of city development. Phys. A Stat. Mech. Appl. 2010, 443, 555–567. [Google Scholar] [CrossRef] [Green Version]
- Hao, P.; Geertman, S.; Hooimeijer, P.; Sliuzas, R. Spatial analyses of the urban village development process in Shenzhen, China. Int. J. Urban Reg. Res. 2013, 37, 2177–2197. [Google Scholar] [CrossRef]
- Frankhauser, P.; Sadler, R. Fractal analysis of agglomerations. In Natural Structures: Principles, Strategies, and Models in Architecture and Nature; Hilliges, M., Ed.; University of Stuttgart: Stuttgart, Germany, 1991; pp. 57–65. [Google Scholar]
Figure 1.
The built-up area map in Shenzhen city from 1986 to 2017. Note: The built-up areas were extracted from Landsat TM 4 and 5 and OLI 8 images with 30-m resolution downloading from United States Geological Survey (USGS) Earth Explorer website (http://earthexplorer.usgs.gov/). The four boxes, 1–4, are the study areas, representing the entire region, the major business center region, the northwest region, and the northeast region of Shenzhen, respectively.

Figure 2.
The graph of the growth rate of fractal dimension of four regions from 1986 to 2017.


Figure 3.
The logistic patterns of fractal dimension growth of the four study regions, 1986–2017.

Figure 4.
Log-log plot between population (lnP) and fractal dimension (lnD) in Shenzhen, 1986–2017. Source: Population data from Shenzhen Statistical Yearbook—2019.
Figure 4.
Log-log plot between population (lnP) and fractal dimension (lnD) in Shenzhen, 1986–2017. Source: Population data from Shenzhen Statistical Yearbook—2019.

Figure 5.
Log-log plot GDP (lnG) and fractal dimension (lnD) in Shenzhen, 1986–2017. Source: Population data from Shenzhen Statistical Yearbook—2019.
Figure 5.
Log-log plot GDP (lnG) and fractal dimension (lnD) in Shenzhen, 1986–2017. Source: Population data from Shenzhen Statistical Yearbook—2019.

Figure 6.
Two types of fractal dimension increase curves of urban form: logistic curve and quadratic logistic curve. Note: The logistic curve is based on the time series of Shenzhen’s box dimension values, while the quadratic logistic curve is based on the time series of Beijing’s box dimension values. The fractal dimension values of Beijing come from Chen and Huang [6]. For comparability, the fractal dimension values are normalized by maximum and minimum fractal dimension values [54].


Table 1.
Fractal dimension estimates of the urban form of four regions in Shenzhen, 1986–2017.
| Year | Entire Region | Center Region | Northwest Region | Northeast Region | ||||||||
|---|---|---|---|---|---|---|---|---|---|---|---|---|
| σ | σ | σ | σ | |||||||||
| 1986 | 1.1352 | 0.9886 | 0.0460 | 1.4353 | 0.9921 | 0.0483 | 1.2320 | 0.9914 | 0.0434 | 1.2808 | 0.9912 | 0.0455 |
| 1989 | 1.2101 | 0.9908 | 0.0442 | 1.4730 | 0.9950 | 0.0395 | 1.3037 | 0.9947 | 0.0358 | 1.3379 | 0.9934 | 0.0411 |
| 1992 | 1.4208 | 0.9971 | 0.0289 | 1.6073 | 0.9991 | 0.0186 | 1.4999 | 0.9984 | 0.0228 | 1.5333 | 0.9982 | 0.0245 |
| 1995 | 1.5008 | 0.9983 | 0.0235 | 1.6668 | 0.9995 | 0.0136 | 1.5739 | 0.9991 | 0.0175 | 1.5999 | 0.9985 | 0.0233 |
| 1998 | 1.5454 | 0.9989 | 0.0193 | 1.6866 | 0.9996 | 0.0135 | 1.6174 | 0.9994 | 0.0154 | 1.6311 | 0.9987 | 0.0225 |
| 2001 | 1.5856 | 0.9992 | 0.0171 | 1.7145 | 0.9997 | 0.0121 | 1.6568 | 0.9994 | 0.0149 | 1.6662 | 0.9990 | 0.0200 |
| 2003 | 1.6619 | 0.9995 | 0.0144 | 1.7636 | 0.9998 | 0.0103 | 1.7315 | 0.9997 | 0.0122 | 1.7304 | 0.9993 | 0.0176 |
| 2006 | 1.7050 | 0.9996 | 0.0125 | 1.7884 | 0.9998 | 0.0096 | 1.7691 | 0.9997 | 0.0106 | 1.7705 | 0.9995 | 0.0151 |
| 2010 | 1.7239 | 0.9997 | 0.0117 | 1.8053 | 0.9998 | 0.0106 | 1.7838 | 0.9997 | 0.0110 | 1.7898 | 0.9995 | 0.0145 |
| 2013 | 1.7401 | 0.9998 | 0.0104 | 1.8174 | 0.9998 | 0.0097 | 1.7871 | 0.9998 | 0.0103 | 1.8063 | 0.9996 | 0.0131 |
| 2015 | 1.7489 | 0.9998 | 0.0098 | 1.8309 | 0.9999 | 0.0082 | 1.8076 | 0.9998 | 0.0095 | 1.8166 | 0.9997 | 0.0124 |
| 2017 | 1.7604 | 0.9998 | 0.0089 | 1.8467 | 0.9999 | 0.0075 | 1.8189 | 0.9998 | 0.0088 | 1.8294 | 0.9997 | 0.0115 |
Table 2.
Four regions logistics equation information table in Shenzhen, 1986–2017.
| Region | Logistics Equation | R2 | Capacity Parameter Dmax | Year |
|---|---|---|---|---|
| Entire region | 0.9909 | 1.7905 | 2072 | |
| Center region | 0.9868 | 1.9000 | 2097 | |
| Northwest region | 0.9819 | 1.8600 | 2085 | |
| Northeast region | 0.9801 | 1.8621 | 2082 |
Table 3.
The main results and findings of fractal studies and corresponding inferences or conclusions about Shenzhen city.
Table 3.
The main results and findings of fractal studies and corresponding inferences or conclusions about Shenzhen city.
| Results and Findings | Inferences about Shenzhen |
|---|---|
| Urban form bears fractal structure | Spatial order emerging from self-organization |
| Different parts bear different fractal dimension values | Possible multifractal structure |
| Fractal dimension values decay from center to edge | Hidden circular structure |
| Goodness of fit ascended over time | Fractal structure become optimized by self-organized evolution |
| Fractal dimension curves of urban growth meet logistic function | Bottom-up urbanization dynamics |
| Fractal dimension approached the maximum value | Space-filling of urban development is close to its limit |
Publisher’s Note: MDPI stays neutral with regard to jurisdictional claims in published maps and institutional affiliations. |
© 2020 by the authors. Licensee MDPI, Basel, Switzerland. This article is an open access article distributed under the terms and conditions of the Creative Commons Attribution (CC BY) license (http://creativecommons.org/licenses/by/4.0/).
Share and Cite
MDPI and ACS Style
Man, X.; Chen, Y. Fractal-Based Modeling and Spatial Analysis of Urban Form and Growth: A Case Study of Shenzhen in China. ISPRS Int. J. Geo-Inf. 2020, 9, 672. https://0-doi-org.brum.beds.ac.uk/10.3390/ijgi9110672
AMA Style
Man X, Chen Y. Fractal-Based Modeling and Spatial Analysis of Urban Form and Growth: A Case Study of Shenzhen in China. ISPRS International Journal of Geo-Information. 2020; 9(11):672. https://0-doi-org.brum.beds.ac.uk/10.3390/ijgi9110672
Chicago/Turabian StyleMan, Xiaoming, and Yanguang Chen. 2020. "Fractal-Based Modeling and Spatial Analysis of Urban Form and Growth: A Case Study of Shenzhen in China" ISPRS International Journal of Geo-Information 9, no. 11: 672. https://0-doi-org.brum.beds.ac.uk/10.3390/ijgi9110672
Note that from the first issue of 2016, this journal uses article numbers instead of page numbers. See further details here.