A Multi-factor Spatial Optimization Approach for Emergency Medical Facilities in Beijing


1
Faculty of Geomatics, Lanzhou Jiaotong University, Lanzhou 730070, China
2
Institute of Geographic Sciences and Natural Resources Research, CAS, Beijing 100101, China
3
School of Resource and Environment Science, Wuhan University, Wuhan 430079, China
*
Author to whom correspondence should be addressed.
ISPRS Int. J. Geo-Inf. 2020, 9(6), 361; https://0-doi-org.brum.beds.ac.uk/10.3390/ijgi9060361
Submission received: 13 April 2020
/
Revised: 14 May 2020
/
Accepted: 30 May 2020
/
Published: 1 June 2020
(This article belongs to the Special Issue GIS in Healthcare)
Abstract
:The outcomes for emergency medical services (EMS) are highly dependent on space-time accessibility. Prior research describes the location of EMS needs with low accuracy and has not integrated a temporal analysis of the road network, which accounts for varying mobility in a dynamic transportation network. In this study, we formulated a network-based location-allocation model (NLAM) and analyzed the spatial characteristics of emergency medical facilities within the fifth ring road in Beijing by considering time, traffic, and population characteristics. The conclusions are as follows: (1) The high demand area for EMS is concentrated in the areas in middle, north, and east during the daytime (8:00–20:00) and in the middle and north during the nighttime (20:00–8:00). From day to night, the centroid of the potential demand distribution shifts in the Western and Southern areas. (2) The road traffic data is sampled 20 times throughout the week, and variations in the average driving speed affect a higher mean driving speed on the weekend. This primarily impacts the main roads, due to these roads experiencing the greatest fluctuation in speed throughout the week of any roadway in the study area. (3) Finally, the 15-min coverage of emergency medical facilities are sampled 20 times in one week and analyzed. Fortunately, there is 100% coverage at night; however, due to traffic congestion, there were a few blind coverage areas in the daytime. The blind area is prevalent in Shijingshan South Station and the Jingxian Bridge in the South fifth ring.
1. Introduction
High-quality educational and medical resources are the primary purpose pursued by urban residents. However, the spatial distribution of educational and medical facilities is uneven. In particular, the regional imbalance of medical services is more prominent, and medical treatment becomes a prominent factor affecting people’s livelihood [1]. The proportion of medical technology is the highest factor among influencing aspects, followed by charges, medical ethics, and traffic convenience [2]. The attractive radiation range of high-level hospitals is far beyond the scope of space accessibility in general, which has caused a certain degree of the shortage of medical resources. Although China was promoting the medical classification system in 2015, it has not been enforced. It remains uncertain, for the impact of accessibility on medical services has changed. Compared with other medical services, emergency medical services are more dependent on the accessibility of time and space. Medical personnel rush to the scene in the quickest possible time, and the corresponding rescue measures can significantly improve the survival rate of patients [3]. Therefore, it is essential to improve the regional equilibrium allocation of emergency medical facilities with high accessibility. For the megacities with more than 10 million people, the improvement and optimization of the spatial distribution of emergency medical facilities has become a critical part of the healthy development of the city.
The existing research is executed with all medical service facilities (including comprehensive hospital, specialist hospital, hospital, emergency medical facilities, clinic, and so on), mainly from three aspects, including the analytics and evaluation of medical service facilities [1,4], study on the spatial and temporal accessibility of medical facilities services and its influencing factors [5,6,7], and the location selection and spatial optimization of medical service facilities [8,9,10]. There is relatively little research on emergency medical facilities for megacities. Chen et al. (2016) used the floating car global positioning system (GPS) to analyze the impact of traffic congestion on the space-time accessibility of emergency medical facilities in downtown Guangzhou [11]. Guo Zengxun et al. (2012) analyzed the temporal and spatial distribution of 120 emergency needs in urban areas using the Beijing emergency center dispatch information database [12]. The research of all medical service facilities consider multifactors such as the hospital’s grade, capacity, and facilities level. However, only the space-time accessibility will be considered for emergency medical facilities when responding to emergency needs (this will not be considered in the extreme case of the nearest emergency ambulance). Therefore, the research on the spatial layout of emergency medical facilities needs to consider factors such as population, time, and traffic. First of all, quantitatively simulate potential first aid needs; then, carefully consider time and traffic factors to analyze the spatial accessibility and coverage of emergency medical facilities, and, finally, optimize for the shortcomings. Some scholars consider the availability and efficiency of facilities, such as the gravity model [13] and its derived mobile search method [14], and the location-allocation model (also called the LA model). Since the 1970s, the location-distribution model has been widely used in site selection studies in education [15,16], firefighting [17], medical [18], and emergency facilities [19]. The existing spatial optimization of medical service facilities using the location-allocation model [8,9] has deficiencies in these two issues. First, the shape of the residential area or the neighborhood committee or village committee is the request point. The second is using the road speed without the time and area difference as the impedance parameter of the road network. In actual situations, the demand for emergency medical services is generated at work, life, or place of residence and needs to be expressed more meticulously. In the same way, the traffic conditions of roads also change with time and location. There are differences in traffic speeds between the peak traffic period and the peak period and the main road sections and suburban road sections. Studies have shown that there is a definite spatial and temporal difference in the accessibility of emergency medical facilities under the influence of transportation factors [6]. Therefore, a more detailed simulation of traffic factors is also required when performing coverage analysis.
Multisource location data such as the floating-car data, mobile terminal location-based service (LBS) positioning data, network data, map, and point of interest (POI) data have provided solutions to the deficiencies mentioned above. The POI data using the electronic map platform can be used to obtain the location of work, life, or place of residence as a request point for emergency medical services. The traffic situation data calculated based on the floating car global positioning system (GPS), mobile terminal location-based service (LBS) positioning, and mobile internet user volunteered geographic information (VGI) collection [20] can help obtain traffic speed information for different road sections at different times. The POI data has been proved to be of great significance in facility planning, urban space, and rescue analysis [21,22], and it has been applied in urban research [23,24,25]. The GPS and VGI data of floating cars are also widely used in urban traffic and spatial analysis research [25,26].
There are three classes of location models for emergency medical services (EMS), including covering models, p-median models, and p-center models [27]. The objective of covering models for EMS is to provide covering the demand point within a distance limit and budget constraints. The covering models contain the location set covering problem (LSCP) [28] and the maximal covering location problem (MCLP) [29]. The LSCP aims to locate the smallest number of EMS facilities that are required to cover all EMS demand points [30]. The MCLP model for EMS seeks the maximal coverage with a given number of facilities [31]. The objective function for the p-median model for EMS is to minimize the total distance between the demand points and the facilities [32,33,34]. The p-center model for EMS tends to find the center of a circle that has the smallest radius to cover the destinations [35,36]. It is essential to optimize the EMS for considering multifactors using location models [37].
This study aims to improve the problems in the study of the space layout of existing emergency medical facilities and consider time, traffic, population, and other factors to study the spatial layout of urban emergency medical facilities. First, by using POI facility data combined with population distribution grid data to more closely simulate the potential demand distribution of emergency medical services, then using the collected traffic data of different time and road sections to simulate the road traffic conditions at different times. Finally, the location-distribution model was used to quantitatively measure the coverage of urban emergency medical facilities, combined with the lack of optimization and improvement. The study aims to enhance the scientific and practical research of the spatial layout of urban emergency medical facilities.
2. Study Area and Method
2.1. Study Area
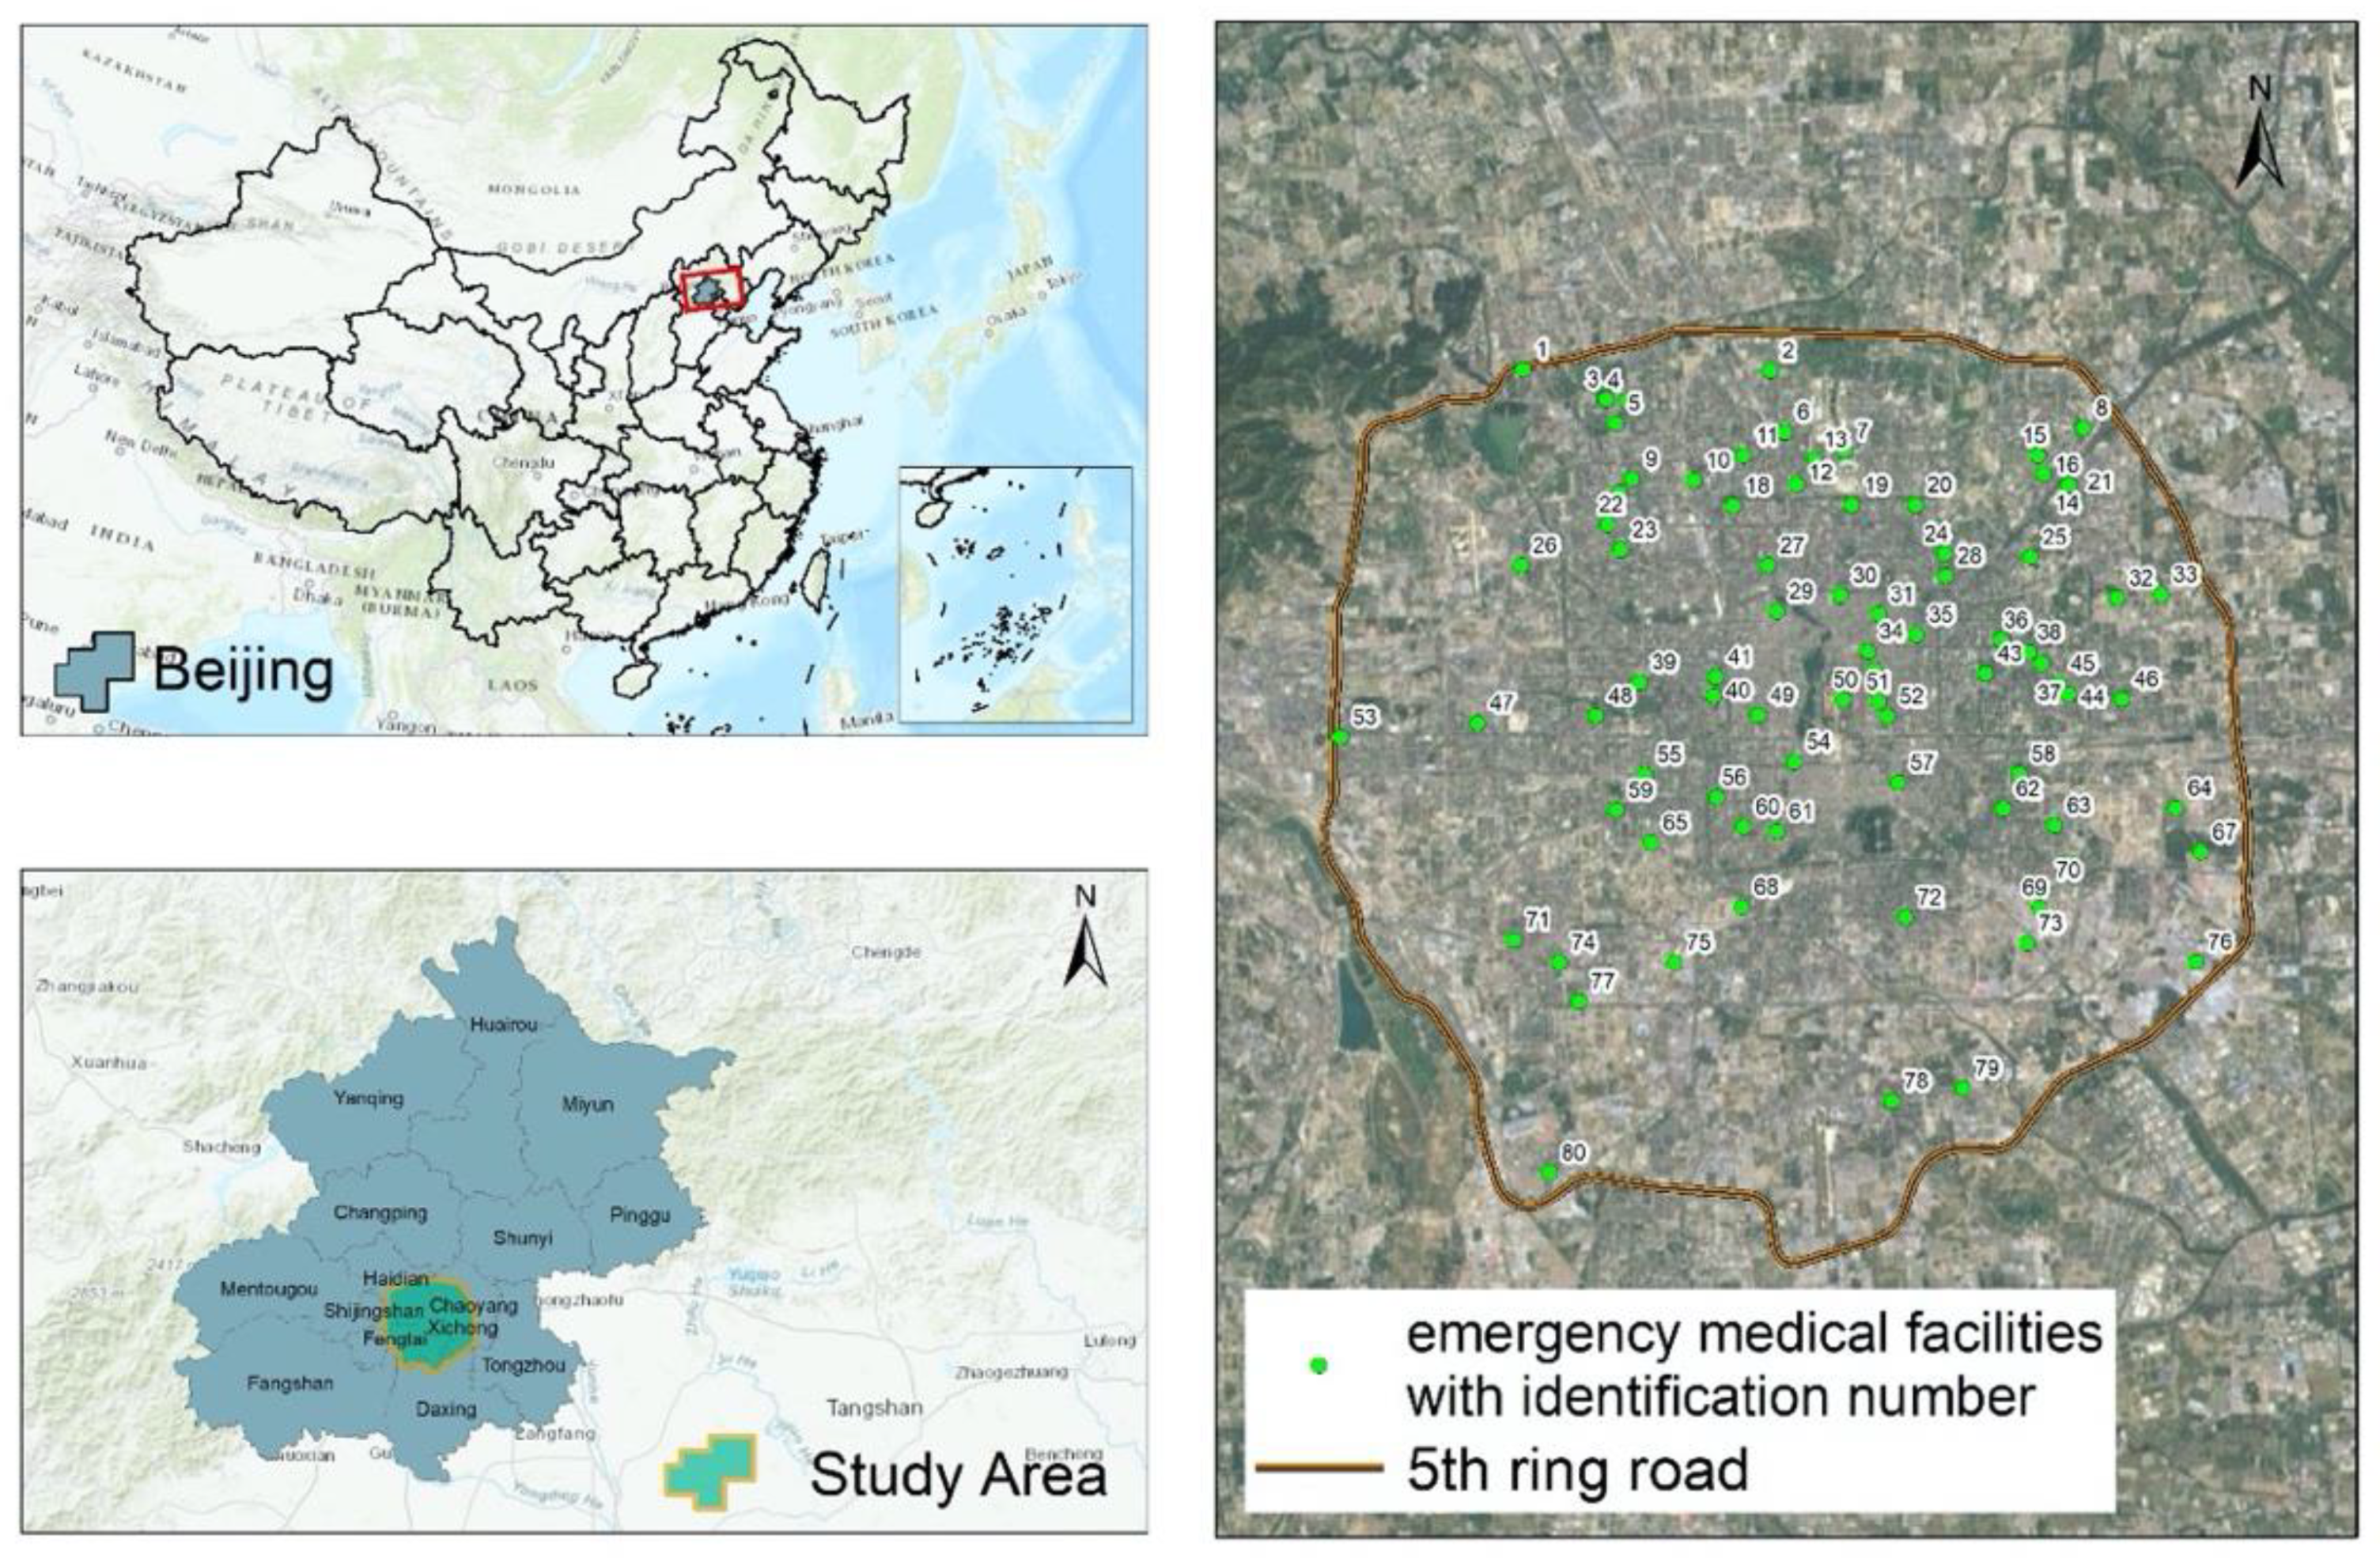
The study selected Beijing within the fifth ring road (area of approximately 668.40 km2) as the study area, mainly based on the following considerations. First, the city of Beijing is large in scale and densely populated, and the spatial layout and optimization of emergency medical facilities are more urgent and typical. Second, Beijing’s urban functional areas are staggered and complicated, and the traffic situation is complex and dynamic. The significance and value of emergency medical facility coverage in functional urban areas and traffic conditions in complex cities are significant. The permanent population of Beijing was approximately 21.7 million by the end of 2015. There were 10,425 institutions related to health, including 701 hospitals, 30 disease prevention and control centers (epidemic stations), 19 maternal and child health clinics, and 1979 community health centers, with 111,555 beds in total, including 104,644 hospital beds, as shown in Figure 1. During the year of 2015, a total of 163.4797 million visits were made to Beijing hospitals. Beijing is home to the highest quality of medical resources in China, and its scope of influence is, to some extent, covered by the whole country, because high-quality hospitals also have a strong appeal to patients in that specific field. In contrast, emergency medical facilities serve more local populations. This study focuses on emergency medical facilities to address the challenges for the distribution, coverage, and optimization of medical emergency medical facilities in the context of traffic congestion.
2.2. Data Preprocessing
The dataset in this research mainly included real-time traffic data, emergency location data, population data, POI facility data, road network data, and administrative divisions and other data. Emergency site data, POI facility data, and real-time traffic data are all available via Python Reptiles from the Open Maps Open Platform (http://lbs.amap.com/). The first-aid site and POI data were obtained in August 2016. The first-aid site was the emergency center in the Gaode POI three-level classification. After data deduplication, 80 first-aid sites in the study area were obtained. After data preprocessing, the POIs have been obtained a total of 187,700 of the nine major categories. The population grid data was produced by Worldpop (http://www.worldpop.org.uk/), with a spatial resolution of 100 meters [38]; real-time traffic data was mainly used to obtain the road traffic speed information under the Gaode traffic situation interface. The acquisition time was 8/15-8/21/2017. A continuous week of data was collected to distinguish road traffic conditions at different times on weekends and weekdays. The collection time points were 0, 6, 7, 8, 9, 10, 12, 15, 17, 18, 19, 20, and 21 o’clock. After removing the inaccurate and incomplete information, a total of 634,200 pieces of data on road speed were obtained. It should be pointed out that the road traffic data provided by Golder did not cover some low-level roads. The road network data came from OpenStreetMap (http://www.openstreetmap.org/). Other data, such as the regional administrative data, came from the national basic geographic information database, and the statistical data came from the Beijing Statistical Yearbook 2016.
2.3. Method
The methodology of this study was mainly divided into three parts, including the spatial identification of the potential needs of emergency medical services, the construction of multitemporal traffic network, and the coverage analysis of multitemporal emergency medical facilities.
2.3.1. Spatial Identification of Potential Demands for Emergency Medical Services
The potential demands of emergency medical services involve three elements, including time, place, and person, which can be summarized as which people have the potential for emergency medical services at which sites. At the present stage, subject to technical and data reasons, it is unrealistic to obtain full-time spatial locations for all people. This paper adopted a compromise strategy. It considered human work and living activities and divided them into two-time intervals. Then, found out where the person may be located in the two times frames and used the population data to simulate the spatial distribution of people at different places. Specifically, the time was first divided into two periods of daytime (8:00–20:00) and night (20:00–8:00 on the following day). Most people mainly stayed in workplaces during the daytime and stayed in residential and accommodation areas. In this situation, we could find and classify the corresponding POI categories. The population grid raster data was used to extract and obtain the estimates of personnel for each POI site by a geographic information system (GIS). Finally, the POI data was used to estimate the population of each POI site as the population field value. Using 100*100 m as the minimum grid unit for the kernel density analysis, the results of kernel density analysis were used to characterize the spatial distribution of the potential emergency demands. The higher the density, the more the population, the higher the demand for potential emergency medical services, and vice versa, the lower the demand for emergency medical services.
Table 1 shows the main activities of urban residents at different temporal periods. The analysis method mainly involved in this section is the kernel density analysis. The kernel density analysis was used to calculate the density of an element in its surrounding neighborhood. It utilized a kernel function to get the value per unit area based on a point or polyline feature to fit each point or polyline to a smooth conical surface. Only points or line segments that fell within the neighborhood were considered for computing the density. If there was no point or line segment within the neighborhood of a particular cell, the cell was assigned a null value. We used the default search radius (bandwidth) based on the space configuration and the number of input points. This method corrected spatial outliers without causing a large search radius. Using the population field gave some elements more weight than other elements, depending on how important they were. The kernel functions of the study were based on the quadratic kernel function described in Silverman’s book [39].
2.3.2. Multitemporal Traffic Network Construction
Traffic congestion is an important factor influencing the temporal and spatial differences in the accessibility of emergency medical services [6]. Therefore, it is essential to consider the road network modeling for traffic conditions at different times. First, we collated traffic situation data that was crawled to obtain the traffic speed at each time of each road segment and then used the road network data to create a network dataset and, according to the driving speed and the road length, the driving time of each road was calculated and the driving time was taken as the cost impedance of the road. Thus, a plurality of road network datasets were obtained, including traveling time at different times. The key to the research was the crawling, processing accuracy, and real-time performance of traffic situation data. Since the traffic situation data collected through the Gaode API was segmented data—that is, the speeds of different sections of a road were different—after the time dimension was superimposed, the speed of each section of each road was different at different times of the day. While in a network analysis, if a road is broken into small sections at different speeds at different times, the computational complexity will increase exponentially, and the number of small sections after an interruption will increase dramatically. Therefore, this study adopted the following preprocessing method. Road data with traffic speed in each period was converted into a 10*10 meter raster grid. The average speed of each raster grid at the same time in different days reflected the average speed of the road. The gaode traffic congestion data itself also had coverage blind areas; all speed-free road sections used the average speed of all other roads at the same time as their driving speed. In addition, in the construction of road network datasets, considering that ambulances have road priority, they can be free from road turning, traffic lights, and road direction. Therefore, appropriate settings were selected when the corresponding road network parameters were set. When the road impedance was set, the impedance field of the road was set to use the travel time. This travel time field can be defined as the value the road length dividing the corresponding road speed.
2.3.3. Multitime Status Analysis of Emergency Medical Facility Coverage
The analysis of the coverage of emergency medical facilities at multiple times is mainly to measure and analyze the arrival coverage of existing emergency medical facilities at different time points for all potential emergency medical service demand sites. This process involves three factors, including emergency medical facility sites, potential emergency medical service demand locations, and road traffic conditions. The emergency medical sites are fixed, and most of them are open 24 h. The spatial distribution of potential emergency medical services at different times has been identified, and road network data at different points in time have been established. Therefore, the research purpose in this section was to calculate the coverage of the existing emergency medical facilities using the public service coverage model according to the corresponding road traffic conditions for the needs of potential emergency medical services at different times. Specifically, the POI site for the potential emergency medical service in the corresponding time period was set as a request point, the POI site for the emergency medical place was set as a facility point, and a plurality of times were established based on the time. The demand POI sites for the potential emergency medical service in the corresponding period were set as the demand points. The emergency medical site POI was set as a facility, and based on the established road network dataset for multiple times, the “maximum coverage” algorithm in the “location-allocation” model was used to calculate the coverage of the emergency vehicle within 15 min (“Emergency Center Construction Standards” (BAN 117-2016). The minimization impedance algorithm was used to simulate the site selection optimization for the possible coverage blind spots.
The study used the L-A model, which suitably locates facilities to ensure that the requirements of the demand point are met most efficiently. The L-A model has a variety of algorithms that assign demand points to facilities while locating facilities. For an emergency medical facility, on the one hand, the emergency medical services of the hospital must arrive at as many places as necessary for emergency treatment within the specified response time. On the other hand, the first-aid site should make it easier for the ambulance to reach the demand place within the minimum travel cost. We propose a Network-based Location-Allocation Model (NLAM), including the maximum coverage (also called the maximal coverage location problem, MCLP) and the minimum impedance problem (also called p-median algorithm), along road networks.
(i) For possible coverage blindness, the p-median model can be used to perform a simulated siting of emergency medical facilities, which refers to setting facilities at appropriate locations so that the sum of all weighted costs between the demand point and solution at the facility can be minimized. The p-median model selects the facility that minimizes the sum of the weighted impedance (response point assigned to a facility multiplied by the impedance to that facility). We proposed a p-median model along the road network based on the formulation of the ReVelle–Swain model (1970) [11].
The notion is shown:
- P = total number of population
- M = total number of demand points
- = index of demand points ( = 1, 2, …, M)
- = the weighted value of the population associated at the demand point (P = )
- N = total number of potential candidates for the EMS location
- j = index of potential EMS facility sites (j = 1, 2, …, N)
- = the shortest-path distance between demand node and potential EMS facility j along the road network
- p = the number of optimal locations
The mathematical description of this model is described as follows:
subject to:
The objective function (1) is to minimize the sum for all demand points of the network distance to their closest EMS facility. Constraint (2) requires that all demand points are to be assigned to only one EMS facility point. Constraint (3) allows demand point to assign to a point j only if there is an open EMS facility at this location. Constraint (4) ensures that exact p EMS facility locations are to be chosen among the N potential ones. In Formulation (5), xij equals 1 if the demand at node i is allocated to the facility at site j and equals 0, otherwise. In Formulation (6), yj equals 1 if an EMS facility is located at site j and equals 0, otherwise.
(ii) For the current coverage of emergency medical facilities, the maximum coverage location problem model is mainly used for the location facilities, so that as many request points as possible are allocated to the impedance interruptions of the facility points being solved. The algorithm handles the request as follows. Request points outside the impedance cutoff at all facilities will not be allocated. If a demand point is only within the impedance interruption of one facility, the request point will assign all of its request weights to the facility. If a demand point is within an impedance interruption at two or more facilities, the demand point will assign all of its request weights to the nearest facility only. The mathematical description of this model is as follows:
subject to:
The objective of Function (7) was to maximize the amount of the covered EMS demand. Constraint (8) defined whether the EMS coverage had been provided to a given EMS demand i based on the location decisions. Constraint (9) specified that the p EMS facility locations were to be chosen among the N potential ones. Constraints (10) and (11) defined the integer siting and coverage variables. If a facility location j was providing coverage, then xj equaled 1; otherwise, xj equaled 0. If the demand i was covered, the decision variable yi was equal to 1; otherwise, yi was equal to 0.
3. Results
3.1. Spatial Distribution of Potential Needs for Emergency Medical Services
According to the characteristics of the population and functional space, using the 187,700 points of POI data obtained, the spatial distribution of potential demand for emergency medical services at different times in the study area is shown in Figure 2. The darker color denotes the higher POI density after the weight of the population in the area and the higher demand for potential emergency medical services. The shallower color indicates the lower POI density of the weight of the superimposed population in the area and the lower demand for potential emergency medical services. Figure 1 identifies potential high-demand areas during the daytime (08:00–20:00) in Zhongguancun, Wudaokou, Xidan North Street, Chaoyangmen, Sanlitun, Guomao, Dawang Road, Wangfujing, Chongwenmen, and Century City. The high-demand areas are mostly concentrated in the Central, Northern, and Eastern parts of the study area, and the areas between the East Third Ring Road and the Northwest three-fourth ring are most prominent. The potential high-demand areas at night (20:00- 08:00 on the following day) are distributed in the front gates of Dashilan, Yong’anli, Jinsong, Dongzhimen, Lianchichi Road, Chongwenmen Ciqikou, Suzhou Bridge, Chegongzhuang—Guanganmen, and Wukesong. The high-demand areas are mostly concentrated in the Central and Northern parts of the study area, and the “Haidian Huangzhuang-Beijing West Railway Station” is more widely distributed along the line. Based on the analysis of daytime and nighttime, the potential demand for emergency medical services in the study area is mostly distributed within the Fourth Ring Road, and the area outside the area between the South third ring and the fourth ring is even more pronounced. From day to night, the direction of distribution of the potential demand for emergency medical services shifted westward and southward. The use of statistical zoning tools to analyze the demand for potential medical emergency services in the major administrative districts of the Fifth Ring Road found that the total number of daytime and nighttime demand was, in descending order: Chaoyang District, Haidian District, Xicheng District, Dongcheng District, and Fengtai District.
3.2. Spatial Distribution of Multitemporal Traffic Conditions
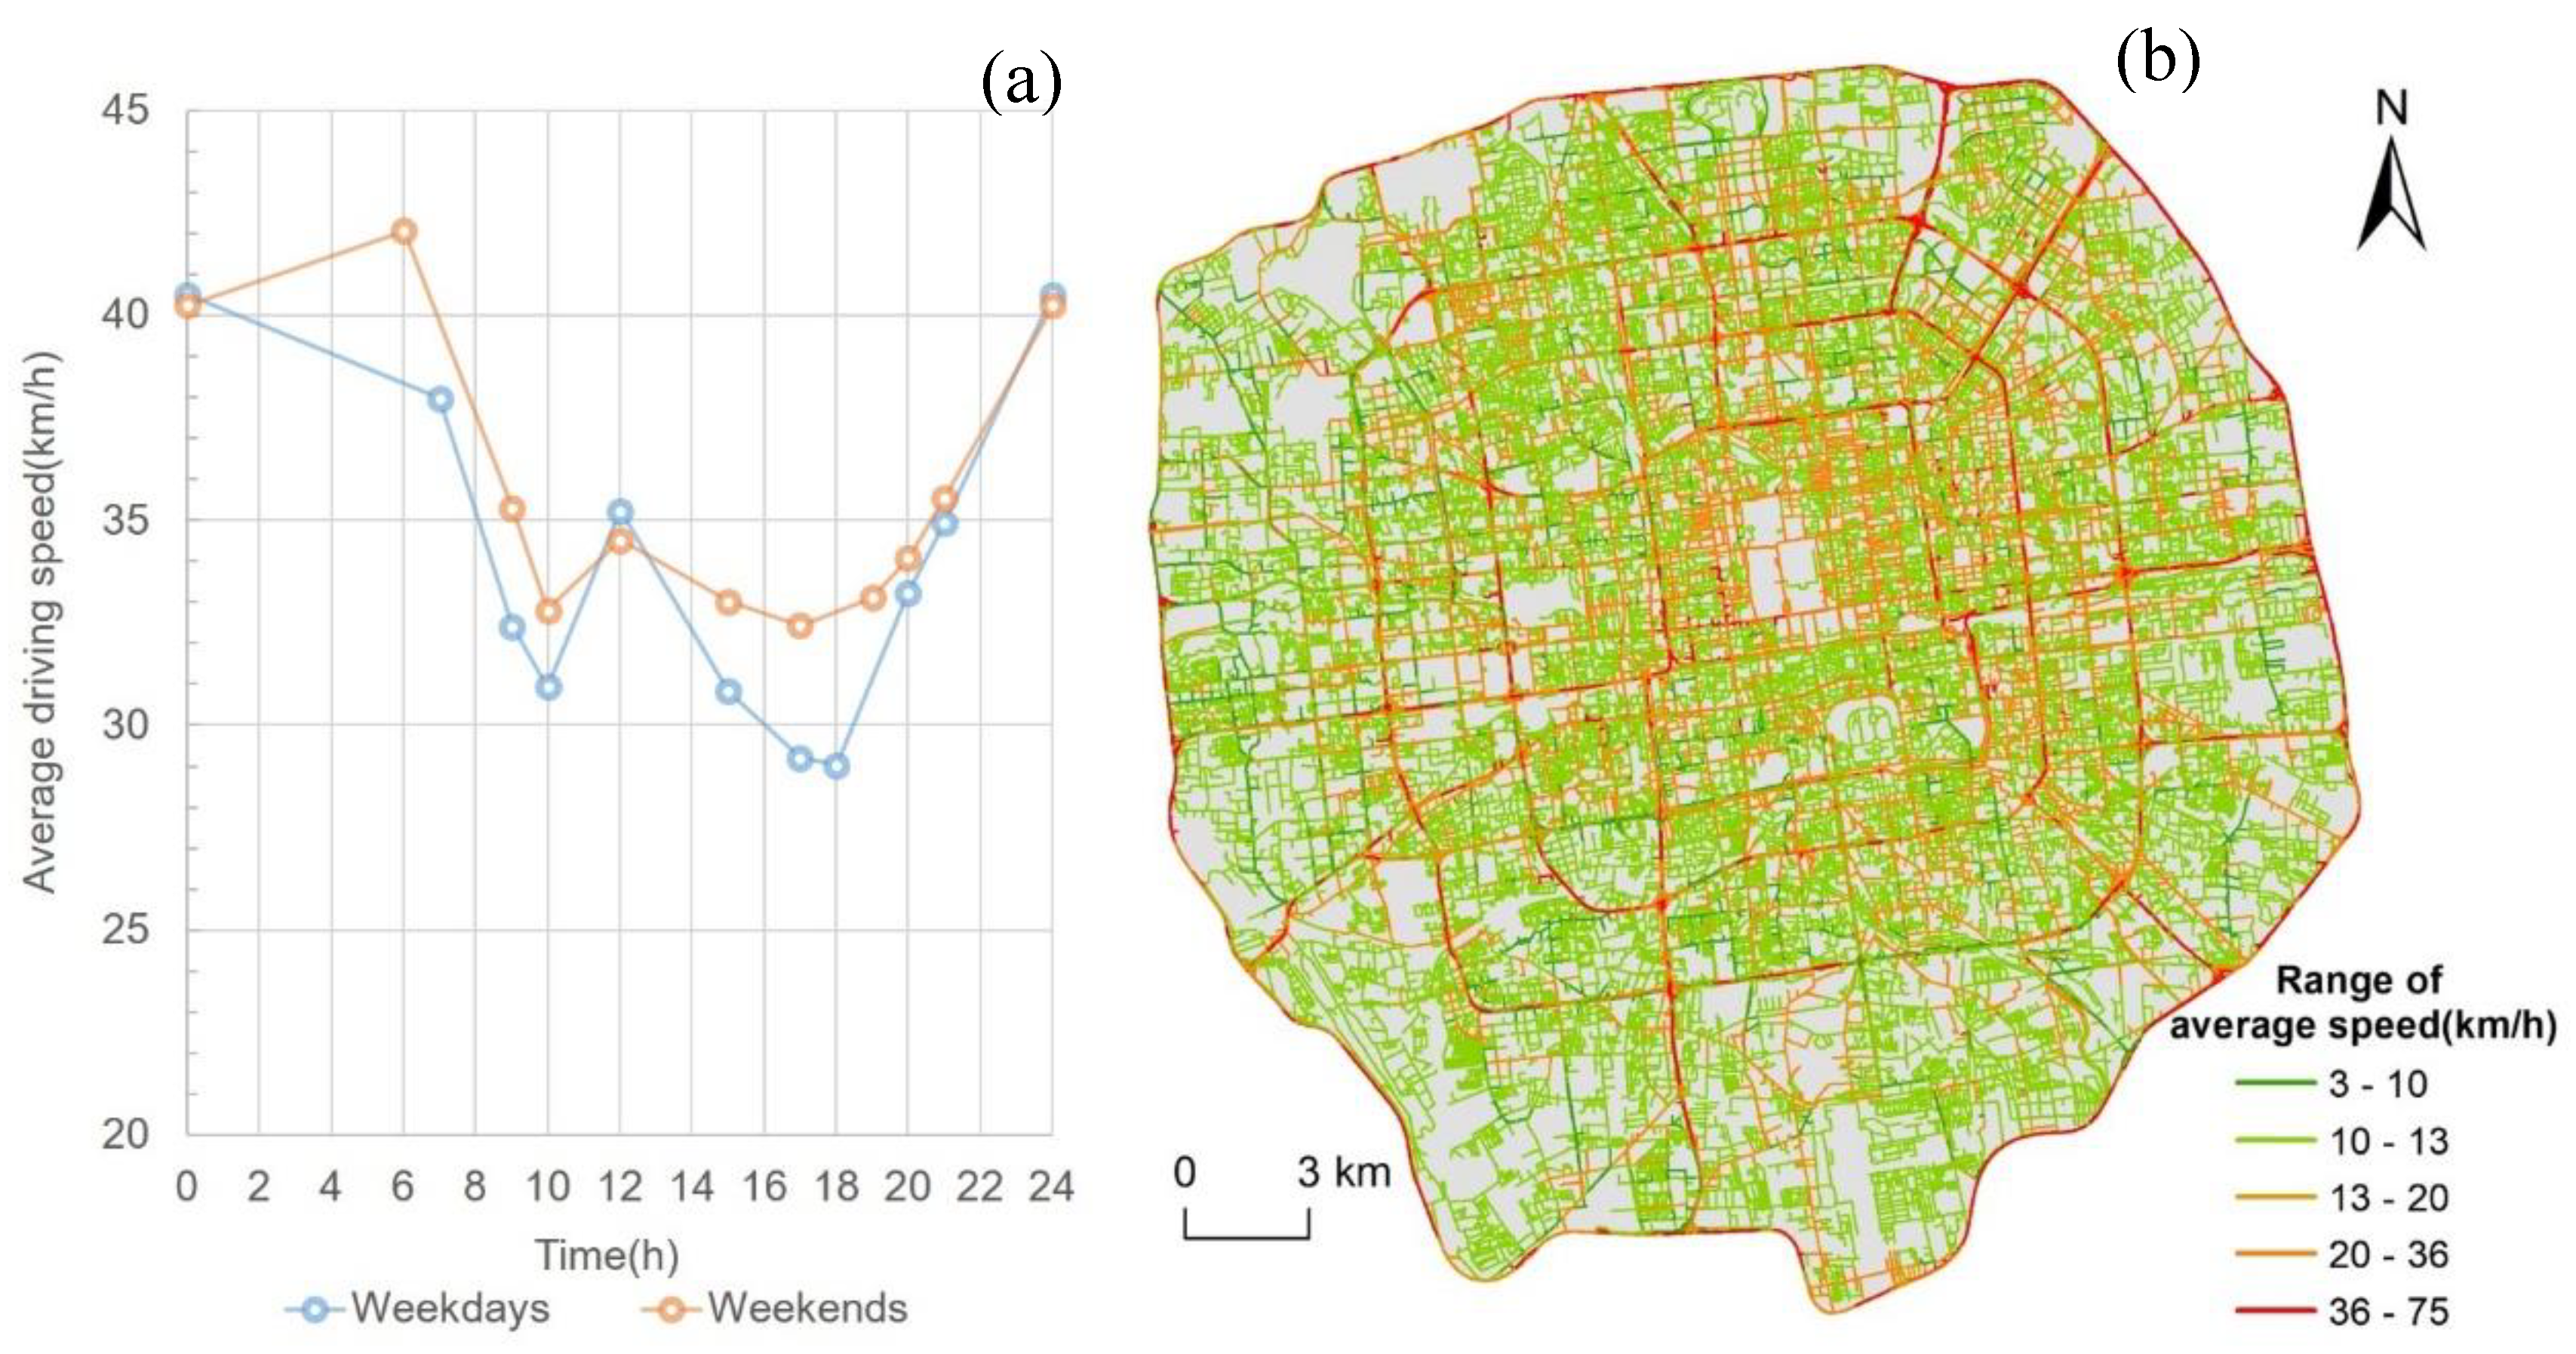
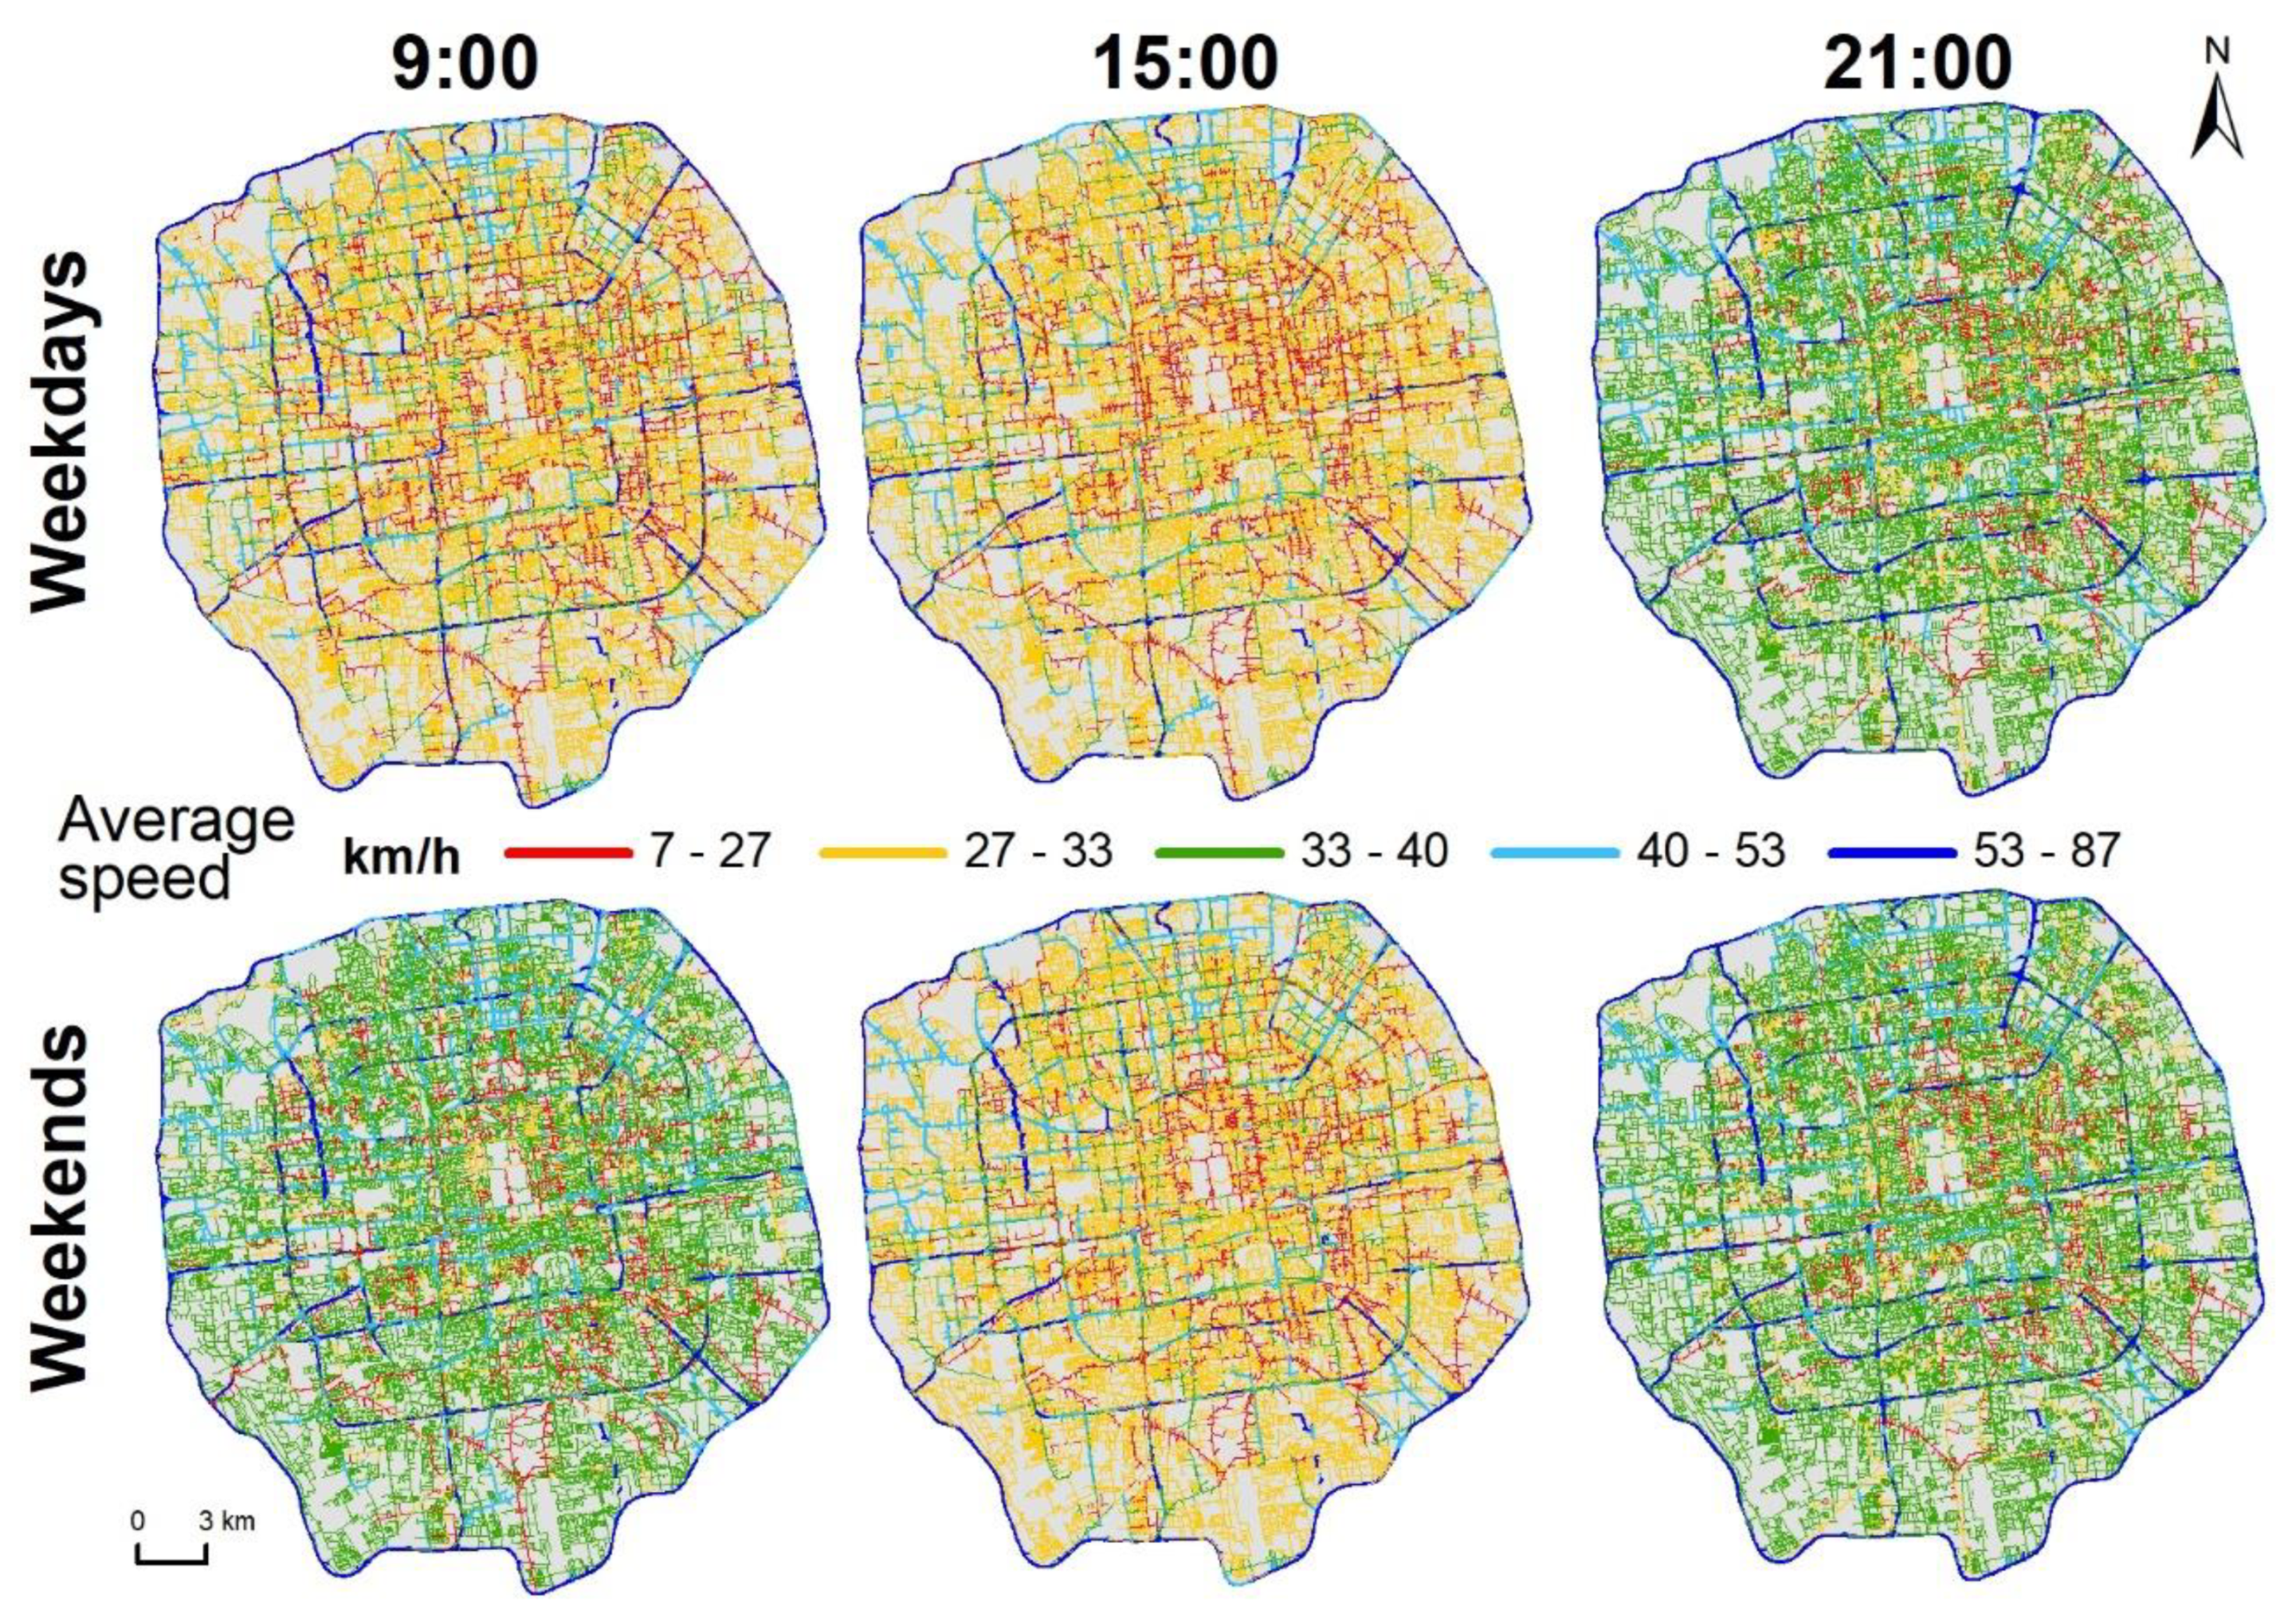
Using the collected 644,200 traffic data, according to the method described in the previous section, the traffic speeds of the roads in the study area at different times were first obtained through data preprocessing. Extensive computations were performed on average road speeds at 20 time points on all weekdays and weekends in the study area, as shown in Figure 3a. From the analysis of the period, during the morning peak (07:00–09:00) and the evening peak (17:00–19:00), the average driving speed decreased significantly, and the average driving speed had a slight rebound at noon. Comparing working days and weekends, the average speed of the weekends at the same time was mostly slightly higher than the working day. The average speed at 06:00 in the morning on weekends was slightly higher than at midnight, since people have more nightlife activities in the early morning on weekends. The average driving speed at noon on the weekend compared with at noon on the working day was slightly higher, because the residents’ trips during weekends have a certain time delay compared with on working days. Further, using the highest value of the speed of each road at different times minus the lowest value, the difference in speed was obtained as in Figure 3b. It can be found that the road segments with relatively large differences were mostly along the ring roads, among which, the ten road segments with the most extreme differences were concentrated in the Wufangqiao section of the East fifth ring of the Jingha Expressway and the Majialou Bridge section of the South Fourth Ring Road of the Jingkai Expressway. In order to accurately measure the coverage of emergency medical facilities, the road network was modeled at 20 time points on weekdays and weekends using the speed data of each road at the time. The obtained road speed distribution is shown in Figure 4.
3.3. Coverage Analysis of Multitime Status Emergency Medical Facilities
Based on the road network modeled for 20 time points on the working day and weekend, the “location-distribution” model was further analyzed, and it was found that the overall coverage of emergency medical facilities in the study area was relative high (Table 2 and Figure 5). From the perspective of spatial coverage, full coverage can be achieved within 15 min in the night period (20:00–8:00), divided by whether it was a working day or a weekend. There were very few coverage blind spots in emergency medical facilities during the daytime (08:00–20:00). In the spatiotemporal view, different traffic conditions at different time points made the space of the same emergency center cover in 15 min to make a difference. At the same time, due to the influence of time and traffic, the coverage of emergency medical facilities fluctuated, and the time at which coverage fell was basically in line with the traffic peak hours. In order to find the blindness area from spatial coverage due to traffic factors, POI facilities that cannot be covered at different points in time need to be further extracted to explore their spatial characteristics and get the optimal solution of the model.
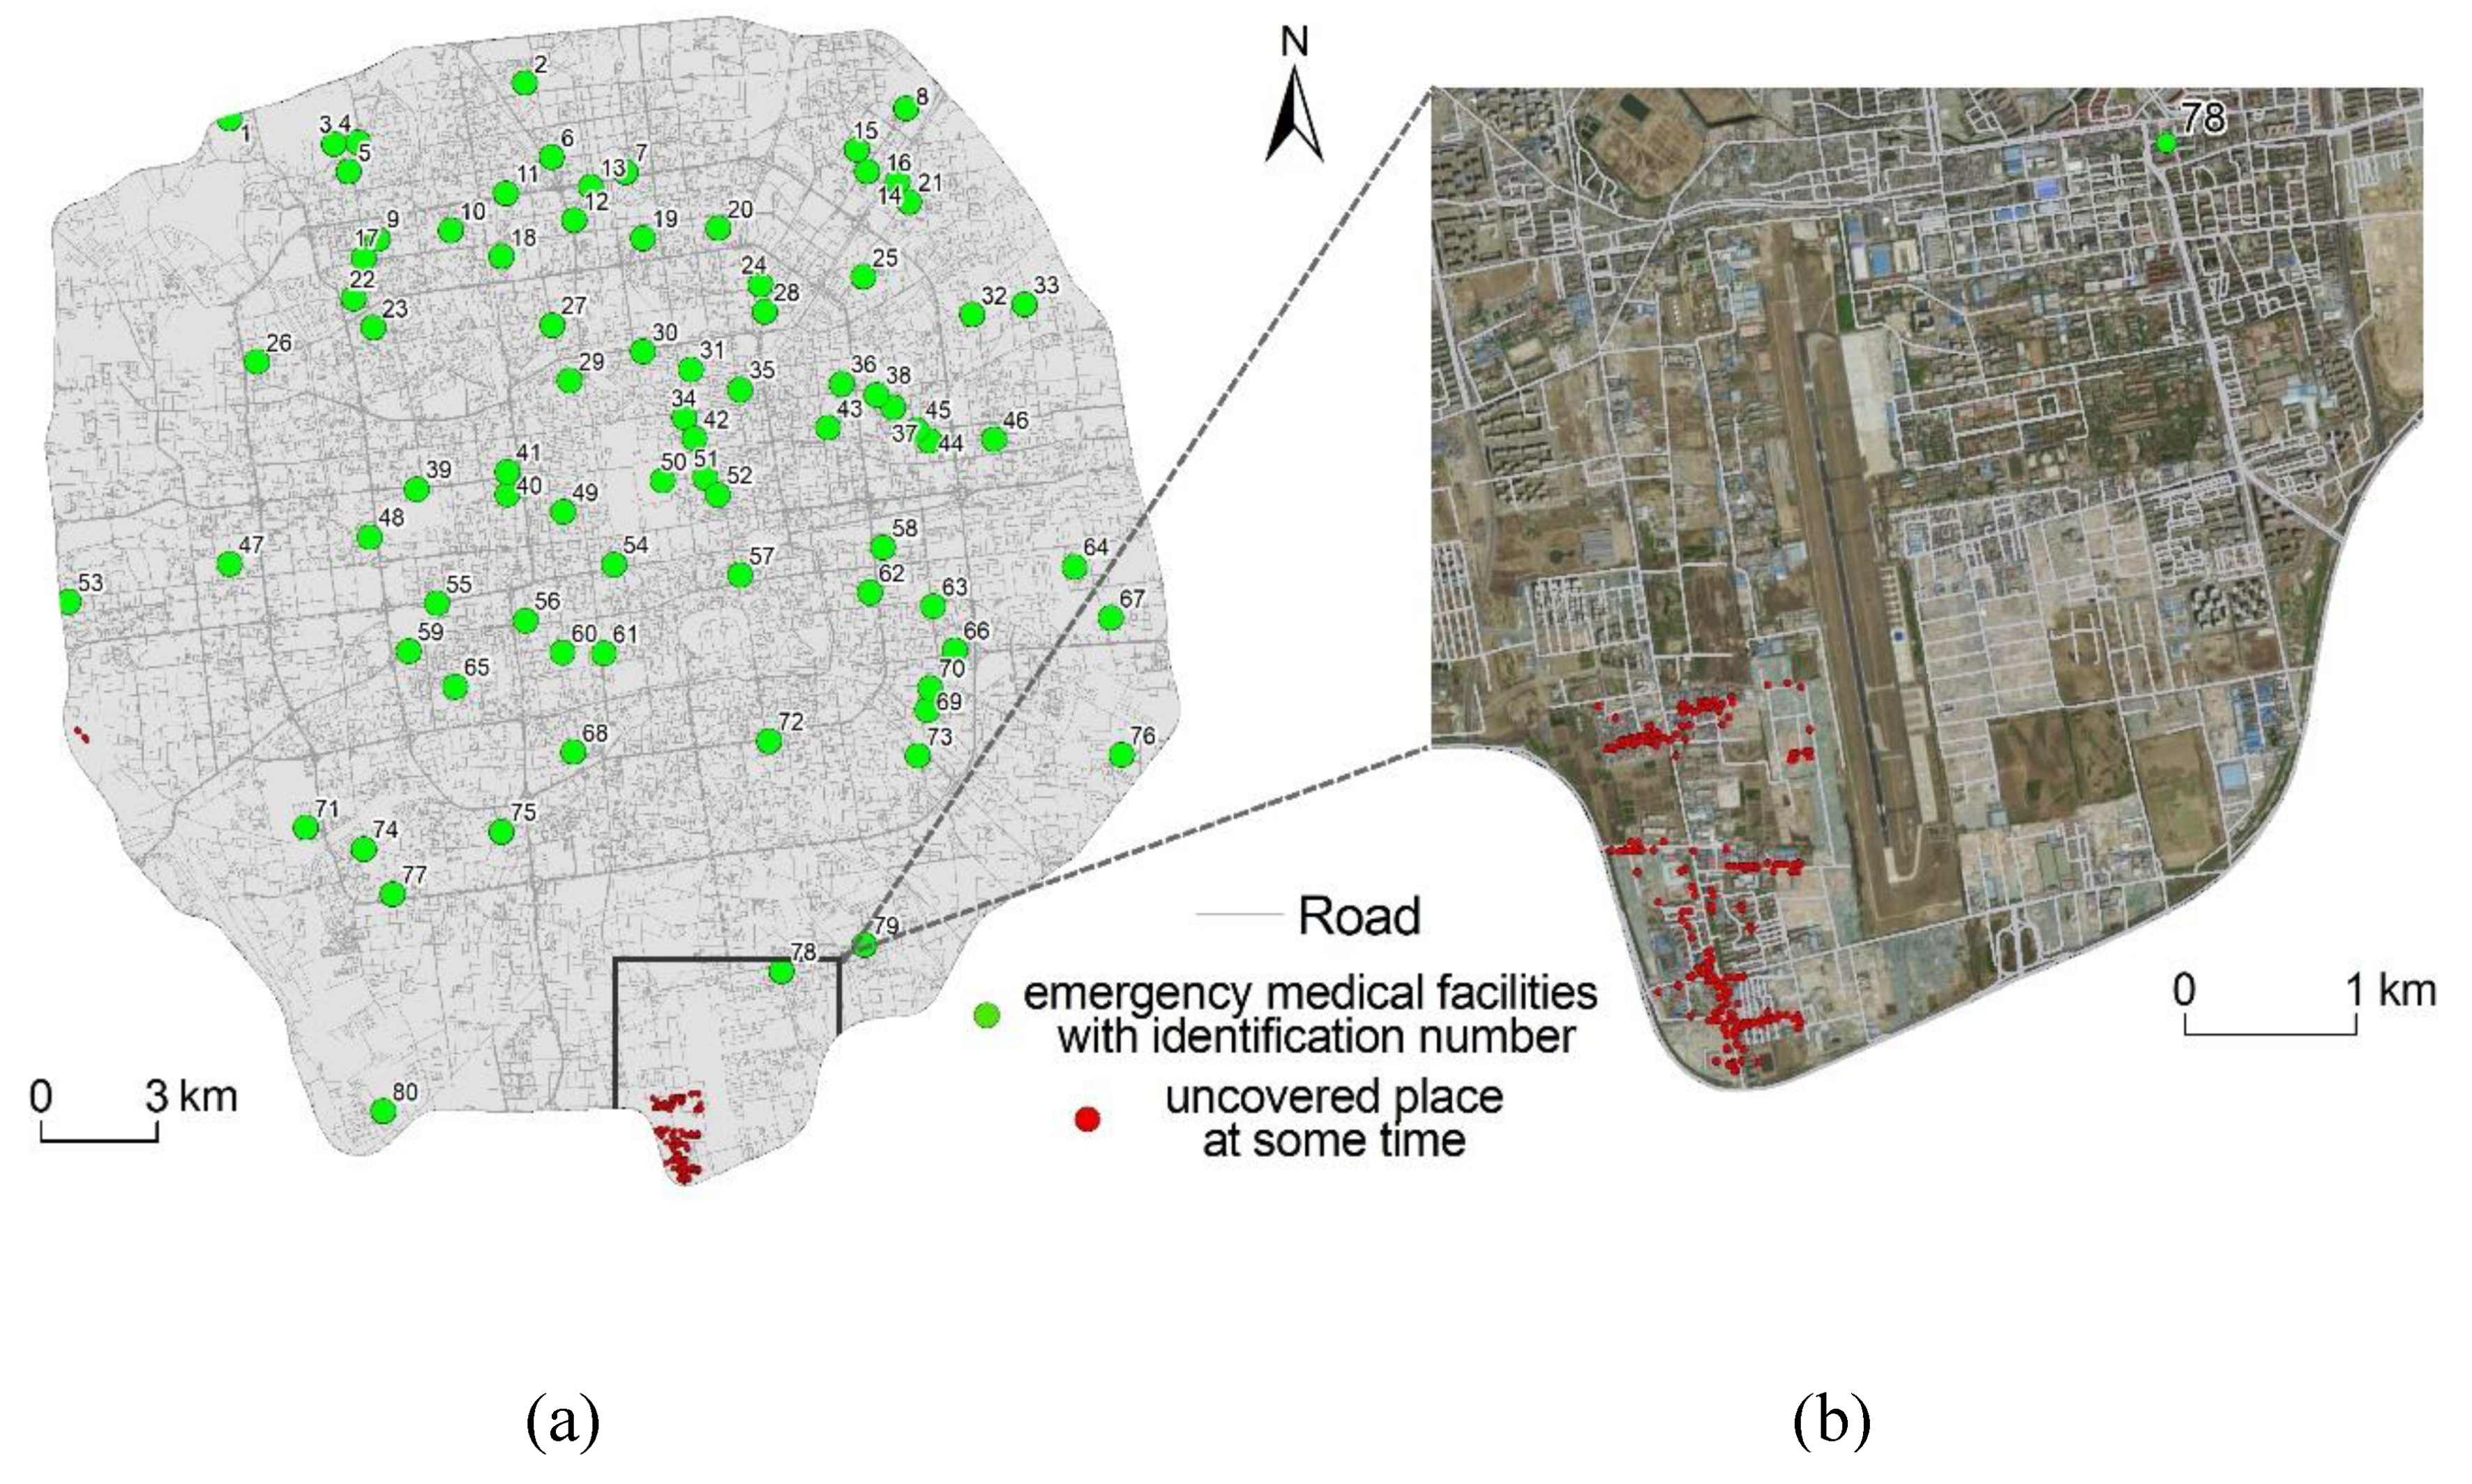
The POI facilities were extracted that failed to be covered at different time points, and the results were merged. The results are shown in Figure 6a. There were two main areas that could not be covered during part of the day, including parts of the Shijingshan South Station and the Southern Fifth Ring Road Jingxian Bridge. The Shijingshan South Station did not cover POIs on a small area (six sites). The scale of uncovered sites along the South Fifth Ring Road Jingxian Bridge varied from 1-36 in different times. Considering that the Shijingshan South Railway Station has a small scope of uncovered sites on the one hand, on the other hand, there is a first-aid center (The first-aid center was not involved in the analysis, because it was not in the study area) in the Jingxi District of Chaoyang Hospital, which is close to the Northwest of Ximenkou Bridge on the West Fifth Ring Road. Therefore, the main coverage blindness area and optimized area are in the Southern Fifth Ring Road Jingxian Bridge (Figure 6b).
Since the number of facilities within the Jingxianqiao area is not large enough, the construction of a new emergency center will make waste. If the method of reconstructing the road from the perspective of improving the road traffic conditions will also have a higher cost, a simple and effective solution is to find an existing medical facility in the area and transform it to have the function of an emergency center. This step can be performed by the following method. First, all medical facilities in the area are selected as candidates for the “location-allocation” model. Then, use the “minimum impedance” model to calculate and find the medical facilities that can cover the area with the least time-cost and upgrade it as an emergency medical service solution covering this area. The computational process was based on the road network at 17:00 on the most stressful working day. The final candidate was Beijing Wanbo Brain Health Traditional Chinese Medicine Hospital. It should be noted that the possibility of being an emergency medical facility is only discussed here from the perspective of spatial accessibility, subject to the lack of our medical professional knowledge.
4. Conclusions and Discussion
This study takes the urban emergency medical facilities in the Wuhan District in Beijing as the research object and comprehensively considers time, traffic impedance, and population factors to study the spatial distribution characteristics. First, using the POI facility data and population distribution grid data, the spatial distribution of potential medical emergency service needs during the day (8:00–20:00) and night (20:00–8:00) were identified. Then, using the collected traffic situation data, the road network was modeled according to the traffic conditions at different times. Finally, the emergency medical coverage at different time points in the study area was quantified using the algorithm in the “location-allocation” model, further combining the inadequacies of the proposed improvement direction. The main conclusions obtained in this paper are as follows:
(1) The distribution of potential emergency medical service needs during the two periods in the study area was identified based on the characteristics of the population and the space of residence and residence. During the day (8:00–20:00), high-demand areas for potential emergency medical services are mainly distributed in Zhongguancun, Wudaokou, Xidan North Street, Sanlitun, Guomao, Dawang Road, and other places, gathering in the Central, Northern, and Eastern parts of the study area. The high demand areas for potential emergency medical services during the night (20:00–8:00) were mainly distributed in Dashilan, Yong’anli, Chegongzhuang-Guang’anmen, Lianhuachi East Road, and other places, mostly in the Middle and North of the study area. From daytime to nighttime, the direction distribution center of potential demand shifted to the west and south. The total demand for potential emergency medical services in the major administrative regions of the study area are, in descending order: Chaoyang District, Haidian District, Xicheng District, Dongcheng District, and Fengtai District.
(2) Statistical analysis of the road traffic situation data were obtained, modeling the road network at 20 temporal ranges on the working days and weekend. Statistical analysis found that the average speed of all roads in the study area at the same time last weekend was mostly slightly higher than the working day. However, the average speed at midnight on weekends was slightly higher than the midnight on weekdays; the probable reason is that there is a certain delay in the travel of weekend residents compared to working days. The average driving speed at 6:00 in the morning on weekends is slightly higher than that at midnight, because people have more nightlife activities and less morning activities on the weekends. The roads at very different speeds at different time points are mostly ring roads. The ten road sections with the most extreme differences are concentrated in the Wufangqiao section of the East fifth ring of the Jingha Expressway and the Majialou Bridge section of the South Fourth Ring Road of the Jingkai Expressway.
(3) Based on the road network model at 20 time points on weekdays and weekends, the 15-min coverage of emergency medical facilities under the 20 time points in the study area was quantitatively measured, and optimization suggestions were given for coverage blind spots. The overall coverage of emergency medical facilities was relatively high. In the nighttime (20:00- 8:00), including working days and weekends, full coverage of the ambulances were achieved for 15 min. At some time points during the daytime (8:00–20:00) on the weekdays and weekends, there were very few coverage areas for emergency medical facilities, which were mainly distributed in parts of the Shijingshan South Railway Station and the Southern Fifth Ring Road Jingxian Bridge. Affected by time and traffic factors, the coverage of emergency medical facilities fluctuates, and the time at which coverage falls is basically in-line with traffic peak times. Further, the blind spot for the coverage of the Yinxianqiao area in the South Fifth Ring Road was considered. Considering the characteristics of the location and the scope of the uncovered point, the corresponding simulation site selection was given.
In this study, we did not consider the parallel method to solve the multifactor spatial optimization problem. We will integrate a high-performance spatial analysis method and spatial cloud computing algorithm [40,41,42] into the spatial optimization for a large-scale dataset to improve the efficiency in a future work. The multifactor spatial optimization approach is essential to understand the current worldwide emergency regarding the pandemic of COVID-19. In the next step, we will use a multifactor spatial optimization model for the testing site selection of COVID-19 with spatial coverage and the space-time traffic network.
Author Contributions
Conceptualization, Shaohua Wang and Liang Zhou; investigation, Zhibang Xu; methodology, Shaohua Wang, Zhibang Xu, and Liang Zhou; resources, Zhibang Xu; software, Shaohua Wang; and writing—original draft, Shaohua Wang and Liang Zhou. All authors have read and agreed to the published version of the manuscript.
Funding
This study was funded by the National Natural Science Foundation of China (Grant No. 41701173 and No. 41961027), National Key Research and Development Project (2016YFC0803106), China Postdoctoral Science Foundation (No. 2016M600121).
Conflicts of Interest
The authors declare no conflicts of interest.
References
- Zheng, W.; Jiang, H.; Ai, H. Analysis of regional inequalities of basic medical resources supply in China. Geogr. Res. 2015, 34, 2049–2060. [Google Scholar]
- Chen, Y.; Yunqing, M.; Shuzhang, L. Research and Analysis of Influencing Factors on the Patient’s Medical Treatment Selection. Chin. J. Soc. Med. 2012, 29, 110–111. [Google Scholar]
- Pons, P.T.; Haukoos, J.S.; Bludworth, W.; Cribley, T.; Pons, K.A.; Markovchick, V.J. Paramedic response time: Does it affect patient survival? Acad. Emerg. Med. 2005, 12, 594–600. [Google Scholar] [CrossRef] [Green Version]
- Guagliardo, M.F. Spatial accessibility of primary care: Concepts, methods and challenges. Int. J. Health Geogr. 2004, 3, 3. [Google Scholar] [CrossRef] [Green Version]
- Oppong, J.R.; Hodgson, M.J. Spatial accessibility to health care facilities in Suhum District, Ghana. Prof. Geogr. 1994, 46, 199–209. [Google Scholar] [CrossRef]
- Xia, T.; Song, X.; Zhang, H.; Song, X.; Kanasugi, H.; Shibasaki, R. Measuring spatio-temporal accessibility to emergency medical services through big GPS data. Health Place 2019, 56, 53–62. [Google Scholar] [CrossRef] [PubMed]
- Zhong, S.Y.; Yang, X.; Chen, R. The accessibility measurement of hierarchy public service facilities based on multi-mode network dataset and the two-step 2SFCA: A case study of Beijing’s medical facilities. Geogr. Res. 2016, 35, 731–744. [Google Scholar]
- Pulver, A.; Wei, R. Optimizing the spatial location of medical drones. Appl. Geogr. 2018, 90, 9–16. [Google Scholar] [CrossRef]
- Delen, D.; Erraguntla, M.; Mayer, R.J.; Wu, C.N. Better management of blood supply-chain with GIS-based analytics. Ann. Oper. Res. 2011, 185, 181–193. [Google Scholar] [CrossRef]
- Nasrabadi, A.M.; Najafi, M.; Zolfagharinia, H. Considering short-term and long-term uncertainties in location and capacity planning of public healthcare facilities. Eur. J. Oper. Res. 2019, 281, 152–173. [Google Scholar] [CrossRef]
- ReVelle, C.S.; Swain, R.W. Central facilities location. Geogr. Anal. 1970, 2, 30–42. [Google Scholar] [CrossRef]
- Guo, Z.; Yu, H.; Lu, Q. Region and Time Distribution of 120 EMSS Demand in Main Districts of Beijing. Chin. Gen. Pract. 2012, 26, 29. [Google Scholar]
- Hansen, W.G. How accessibility shapes land use. J. Am. Inst. Plan. 1959, 25, 73–76. [Google Scholar] [CrossRef]
- Yang, D.H.; Goerge, R.; Mullner, R. Comparing GIS-based methods of measuring spatial accessibility to health services. J. Med. Syst. 2006, 30, 23–32. [Google Scholar] [CrossRef] [PubMed]
- Cooper, L. Location-allocation problems. Oper. Res. 1963, 11, 331–343. [Google Scholar] [CrossRef]
- Menezes, R.C.; Pizzolato, N.D. Locating public schools in fast expanding areas: Application of the capacitated p-median and maximal covering location models. Pesqui. Oper. 2014, 34, 301–317. [Google Scholar] [CrossRef] [Green Version]
- Murray, A.T. Optimising the spatial location of urban fire stations. Fire Saf. J. 2013, 62, 64–71. [Google Scholar] [CrossRef]
- Harper, P.R.; Shahani, A.K.; Gallagher, J.E.; Bowie, C. Planning health services with explicit geographical considerations: A stochastic location–allocation approach. Omega 2005, 33, 141–152. [Google Scholar] [CrossRef]
- Li, X.; Zhao, Z.; Zhu, X.; Wyatt, T. Covering models and optimization techniques for emergency response facility location and planning: A review. Math. Meth. Oper. Res. 2011, 74, 281–310. [Google Scholar] [CrossRef]
- Goodchild, M.F. Citizens as sensors: The world of volunteered geography. GeoJournal 2007, 69, 211–221. [Google Scholar] [CrossRef] [Green Version]
- Niyomubyeyi, O.; Pilesjö, P.; Mansourian, A. Evacuation Planning Optimization Based on a Multi-Objective Artificial Bee Colony Algorithm. ISPRS Int. J. Geo Inf. 2019, 8, 110. [Google Scholar] [CrossRef] [Green Version]
- Li, X.; Xu, G.; Chen, E.; Zong, Y. Learning recency based comparative choice towards point-of-interest recommendation. Expert Syst. Appl. 2015, 42, 4274–4283. [Google Scholar] [CrossRef]
- McKenzie, G.; Janowicz, K.; Gao, S.; Yang, J.A.; Hu, Y. POI pulse: A multi-granular, semantic signature–based information observatory for the interactive visualization of big geosocial data. Cartogr. Int. J. Geogr. Inf. Geovis. 2015, 50, 71–85. [Google Scholar] [CrossRef]
- Santos, F.; Almeida, A.; Martins, C.; Gonçalves, R.; Martins, J. Using POI functionality and accessibility levels for delivering personalized tourism recommendations. Comput. Environ. Urban 2019, 77, 101173. [Google Scholar] [CrossRef]
- Zhang, S.; Tang, J.; Wang, H.; Wang, Y.; An, S. Revealing intra-urban travel patterns and service ranges from taxi trajectories. J. Transp. Geogr. 2017, 61, 72–86. [Google Scholar] [CrossRef]
- Zhu, D.; Wang, N.; Wu, L.; Liu, Y. Street as a big geo-data assembly and analysis unit in urban studies: A case study using Beijing taxi data. Appl. Geogr. 2017, 86, 152–164. [Google Scholar] [CrossRef]
- Jia, H.; Ordóñez, F.; Dessouky, M. A modeling framework for facility location of medical services for large-scale emergencies. IIE Trans. 2007, 39, 41–55. [Google Scholar] [CrossRef]
- Toregas, C.; Swain, R.; ReVelle, C.; Bergman, L. The location of emergency service facilities. Oper. Res. 1971, 19, 1363–1373. [Google Scholar] [CrossRef]
- Church, R.; ReVelle, C. The maximal covering location problem. Pap. Reg. Sci. 1974, 32, 101–118. [Google Scholar] [CrossRef]
- Daskin, M.S.; Stern, E.H. A hierarchical objective set covering model for emergency medical service vehicle deployment. Transp. Sci. 1981, 15, 137–152. [Google Scholar] [CrossRef]
- Eaton, D.J.; Daskin, M.S.; Simmons, D.; Bulloch, B.; Jansma, G. Determining emergency medical service vehicle deployment in Austin, Texas. Interfaces 1985, 15, 96–108. [Google Scholar] [CrossRef] [Green Version]
- Dzator, M.; Dzator, J. An effective heuristic for the P-median problem with application to ambulance location. Opsearch 2013, 50, 60–74. [Google Scholar] [CrossRef]
- Ahmadi-Javid, A.; Seyedi, P.; Syam, S.S. A survey of healthcare facility location. Comput. Oper. Res. 2017, 79, 223–263. [Google Scholar] [CrossRef]
- Grekousis, G.; Liu, Y. Where will the next emergency event occur? Predicting ambulance demand in emergency medical services using artificial intelligence. Comput. Environ. Urban 2019, 76, 110–122. [Google Scholar] [CrossRef]
- Chanta, S.; Mayorga, M.E.; McLay, L.A. Improving emergency service in rural areas: A bi-objective covering location model for EMS systems. Ann. Oper. Res. 2014, 221, 133–159. [Google Scholar] [CrossRef]
- Daskin, M.S.; Owen, S.H. Two New Location Covering Problems: The Partial P-Center Problem and the Partial Set Covering Problem. Geogr. Anal. 1999, 31, 217–235. [Google Scholar] [CrossRef]
- Afshari, H.; Peng, Q. Challenges and solutions for location of healthcare facilities. Ind. Eng. Manag. 2014, 3, 12. [Google Scholar]
- Lloyd, C.T.; Sorichetta, A.; Tatem, A.J. High resolution global gridded data for use in population studies. Sci. Data 2017, 4, 1–17. [Google Scholar] [CrossRef] [Green Version]
- Silverman, B.W. Density Estimation for Statistics and Data Analysis; CRC Press: Boca Raton, FL, USA, 1986. [Google Scholar]
- Zhou, L.; Dang, X.W.; Sun, Q.K.; Wang, S.H. Multi-scenario simulation of urban land change in Shanghai by random forest and CA-Markov model. Sustain. Cities Soc. 2020, 55, 1–10. [Google Scholar] [CrossRef]
- Heitzler, M.; Lam, J.C.; Hackl, J.; Adey, B.T.; Hurni, L. GPU-accelerated rendering methods to visually analyze large-scale disaster simulation data. J. Geovis. Spat. Anal. 2017, 1, 3. [Google Scholar] [CrossRef]
- Wang, S.; Zhong, Y.; Wang, E. An integrated GIS platform architecture for spatiotemporal big data. Future Gener. Comput. Syst. 2019, 94, 160–172. [Google Scholar] [CrossRef]
Figure 1.
Study area and locations of the emergency medical facilities in Beijing.

Figure 2.
Spatial distribution of the potential demand for emergency services at different times: (a) daytime and (b) nighttime.
Figure 2.
Spatial distribution of the potential demand for emergency services at different times: (a) daytime and (b) nighttime.

Figure 3.
The average vehicle speed: (a) at different times; (b) on each road segments.

Figure 4.
Speed at different times of each road in the study area.

Figure 5.
The coverage distribution of emergency medical facilities at different times.

Figure 6.
The blind coverage area of emergency medical facilities at some times: (a) the whole study area; (b) the Southern Fifth Ring Road Jingxian Bridge area.
Figure 6.
The blind coverage area of emergency medical facilities at some times: (a) the whole study area; (b) the Southern Fifth Ring Road Jingxian Bridge area.


Table 1.
The main places of activities for urban residents in different periods. POI: point of interest.
Table 1.
The main places of activities for urban residents in different periods. POI: point of interest.
| Time | Major categories | Detailed Category of POI |
|---|---|---|
| 8:00–20:00 | Residential, Corporate company, Science and Technology Culture, Food and Beverage Services, Leisure Services, Transportation Station Type, Financial Venues, Government Agencies | Villas, dormitories, residential areas, residential quarters, and dual-use commercial and residential buildings; company companies; museums, archives, art galleries, planetariums, libraries, cultural palaces, science and technology museums, exhibition halls, convention centers, schools, scientific research institutions, training institutions, media organizations, cultural and art groups, driving schools, and scientific and educational cultural venues; tea houses, pastry shops, cafes, fast food restaurants, cold drinks shops, dessert shops, foreign restaurants, Chinese restaurants, casual dining establishments, and catering-related venues; sports venues, entertainment venues, leisure venues, theaters, and resorts and convalescent places; subway stations, port terminals, railway stations, airport-related, and coach stations; securities companies, insurance companies, banks, and financial service agencies; and industrial and commercial tax agencies, public security agencies, transportation vehicle management, society-relevant groups, foreign institutions, government agencies, and social organizations. |
| 20:00–8:00 | Residential and Accommodation services | Villa, dormitory, residential area, residential area, commercial and residential dual-use buildings, hotels, guest houses, and hotel accommodation services. |
Table 2.
The coverage of emergency medical facilities at different times.
| Working day (time) | 9:00 | 10:00 | 12:00 | 15:00 | 17:00 | 18:00 | 20:00 | 21:00 | 0:00 | 7:00 |
| Coverage (%) | 99.99 | 99.94 | 99.99 | 99.95 | 99.81 | 99.84 | 100 | 100 | 100 | 100 |
| Weekend (time) | 9:00 | 10:00 | 12:00 | 15:00 | 17:00 | 19:00 | 20:00 | 21:00 | 0:00 | 6:00 |
| Coverage (%) | 99.99 | 99.99 | 99.99 | 99.99 | 99.99 | 99.97 | 100 | 100 | 100 | 100 |
© 2020 by the authors. Licensee MDPI, Basel, Switzerland. This article is an open access article distributed under the terms and conditions of the Creative Commons Attribution (CC BY) license (http://creativecommons.org/licenses/by/4.0/).
Share and Cite
MDPI and ACS Style
Zhou, L.; Wang, S.; Xu, Z. A Multi-factor Spatial Optimization Approach for Emergency Medical Facilities in Beijing. ISPRS Int. J. Geo-Inf. 2020, 9, 361. https://0-doi-org.brum.beds.ac.uk/10.3390/ijgi9060361
AMA Style
Zhou L, Wang S, Xu Z. A Multi-factor Spatial Optimization Approach for Emergency Medical Facilities in Beijing. ISPRS International Journal of Geo-Information. 2020; 9(6):361. https://0-doi-org.brum.beds.ac.uk/10.3390/ijgi9060361
Chicago/Turabian StyleZhou, Liang, Shaohua Wang, and Zhibang Xu. 2020. "A Multi-factor Spatial Optimization Approach for Emergency Medical Facilities in Beijing" ISPRS International Journal of Geo-Information 9, no. 6: 361. https://0-doi-org.brum.beds.ac.uk/10.3390/ijgi9060361
Note that from the first issue of 2016, this journal uses article numbers instead of page numbers. See further details here.