Article

Development of a Novel Framework to Propose New Strategies for Automated External Defibrillators Deployment Targeting Residential Out-Of-Hospital Cardiac Arrests: Application to the City of Milan

by
Gianquintieri Lorenzo
1,
Brovelli Maria Antonia
2,
Brambilla Piero Maria
3,
Pagliosa Andrea
3,
Villa Guido Francesco
3 and
Caiani Enrico Gianluca
1,4,*
1
Electronics, Information and Biomedical Engineering dpt, Politecnico di Milano, 20133 Milano, Italy
2
Civil and Environmental Engineering dpt, Politecnico di Milano, 20133 Milano, Italy
3
Azienda Regionale Emergenza Urgenza (AREU), 20124 Milano, Italy
4
Consiglio Nazionale delle Ricerche, Istituto di Elettronica e di Ingegneria dell’Informazione e delle Telecomunicazioni, 20133 Milan, Italy
*
Author to whom correspondence should be addressed.
ISPRS Int. J. Geo-Inf. 2020, 9(8), 491; https://0-doi-org.brum.beds.ac.uk/10.3390/ijgi9080491
Submission received: 7 July 2020 / Revised: 1 August 2020 / Accepted: 10 August 2020 / Published: 17 August 2020
(This article belongs to the Special Issue GIS in Healthcare)

Abstract

:
Public Access Defibrillation (PAD) is the leading strategy in reducing time to first defibrillation in cases of Out-Of-Hospital Cardiac Arrest (OHCA), but PAD programs are underperforming considering their potentiality. Our aim was to develop an analysis and optimization framework, exploiting georeferenced information processed with Geographic Information Systems (GISs), specifically targeting residential OHCAs. The framework, based on an historical database of OHCAs, location of Automated External Defibrillators (AEDs), topographic and demographic information, proposes new strategies for AED deployment focusing on residential OHCAs, where performance assessment was evaluated using AEDs “catchment area” (area that can be reached within 6 min walk along streets). The proposed framework was applied to the city of Milan, Lombardy (Italy), considering the OHCA database of four years (2015–2018), including 8152 OHCA, of which 7179 (88.06%) occurred in residential locations. The proposed strategy for AEDs deployment resulted more effective compared to the existing distribution, with a significant improvement (from 41.77% to 73.33%) in OHCAs’ spatial coverage. Further improvements were simulated with different cost scenarios, resulting in more cost-efficient solutions. Results suggest that PAD programs, either in brand-new territories or in further improvements, could significantly benefit from a comprehensive planning, based on mathematical models for risk mapping and on geographical tools.

1. Introduction

The American Heart Association (AHA) defines Out–Of–Hospital Cardiac Arrest (OHCA) as the cessation of mechanical cardiac activity outside of a medical care setting [1]. Survival is strongly correlated with the time between OHCA occurrence and first defibrillation [2,3,4,5], with 6 min considered as the time limit for an effective intervention [6], as the survival probability declines by 7–12% for every minute of delay in the treatment [7,8,9]. To address the need for a fast emergency response, the leading strategy is constituted by Public Access Defibrillation (PAD), based on the placement of publicly accessible Automated External Defibrillators (AEDs, fully automatic devices composed by two electrodes to be placed on the patient, and a main body, which records the ECG signal and delivers electric shock if potentially necessary to restore the physiological rhythm) over the cities’ territory [10], on the training of lay rescuers on how to perform Cardio-Pulmonary Resuscitation (CPR) and how to use AED, and on campaigns for awareness raising.
PAD programs are nowadays diffused worldwide [11,12], but it is recognized that they are underperforming, considering their potential [13,14,15,16]. In an attempt of improvement, recent research is focusing on the development of analysis and optimization frameworks [9,17,18,19,20], but, whereas current guidelines focus on public places with a significant flow of people during daytime, multiple statistical analyses revealed that 60%–80% of OHCAs usually occur in residential locations [18,21,22,23,24,25]. For example, in Sondergaard et al. [25], in a study aimed at assessing the impact of location of OHCA on rescue intervention timing and clinical outcome, it was shown that, from a database of 25,505 OHCA records that occurred in Denmark between 2001 and 2014, 26.4% of them occurred in public places, whereas 73.6% were in residential locations. Moreover, different studies [22,26,27] found out that residential OHCA is characterized by higher mortality when compared with OHCA in public places. This included the study by Folke et al. [22], in which, with the aim of identifying residential areas suitable for AED installation, from a database of 4828 OHCA records that occurred in Copenhagen from 1994 to 2005, it resulted that OHCA survival rates were 13.9% and 3.2% for public and residential locations, respectively. Although the likelihood of use of a publicly accessible AED is significantly lower in residential events when compared to public ones [28], recent studies highlighted, as a priority, the development of new strategies to reduce the mortality in residential areas by early defibrillation [22,25,29,30,31].
The frameworks proposed in previous studies for optimization of AED deployment are usually characterized by three main processes:
  • Efficiency analysis of the current distribution of AEDs, based on the area where AEDs can be used within the scientifically assessed time limit for an effective and beneficial use, hence there is no standard in how to convert this time limit into a spatial measure.
  • Mapping of OHCA occurrence risk by development of a geographic risk function using different approaches: purely statistical (simulation of events based on retrospective data or application of distribution models, such as Poisson regression or Kernel density analysis) or more sophisticated ones (modelling of explicative factors, relevant to demography, socio-economic conditions, and land-use). Given the intrinsic randomness of the phenomenon, both predictive performance and generalization of the proposed methods are uncertain.
  • Identification of new AED spatial distributions, based on the optimization of a target function, and assessment of the related performance by a validation procedure. Whereas the proposed mathematical optimizations of target functions are detailed and successful, their conversion into PAD performance improvement is hard to validate.
Recent research has identified Geographic Information Systems (GISs, a set of tools for capturing, storing, checking, manipulating, analyzing and displaying spatially georeferenced data [32]) as a key tool addressing the problem of optimizing PAD [33,34,35]. For example, in Ringh et al. [35], a study aimed at discussing existing evidence of Public Access Defibrillation and knowledge gaps and future directions to improve outcomes for OHCA, the use of GIS in planning deployment of AED is listed among the eight key actions to improve PAD results. We hypothesized that a GIS-based deployment strategy could be more successful in targeting residential OHCAs, as encouraged by multiple studies [22,25,29,30,31], including Rea T. [30], who encourages a “paradigm” shift for PAD towards an “all-access defibrillation” beyond the conventional public setting use, and cites the use of “advanced mapping techniques” as a potential source of improvement.
Accordingly, our aim was to develop an analysis and optimization framework exploiting georeferenced information from a historical database of OHCAs, known AED locations, and topographic and demographic information, to define a geographic risk function and propose new strategies for AED deployment specifically targeting residential OHCAs. This framework was applied and validated on the city of Milan, Lombardy (Italy), counting 1,372,810 residents (as of 31 July 2017) over a surface of 181.67 km2.

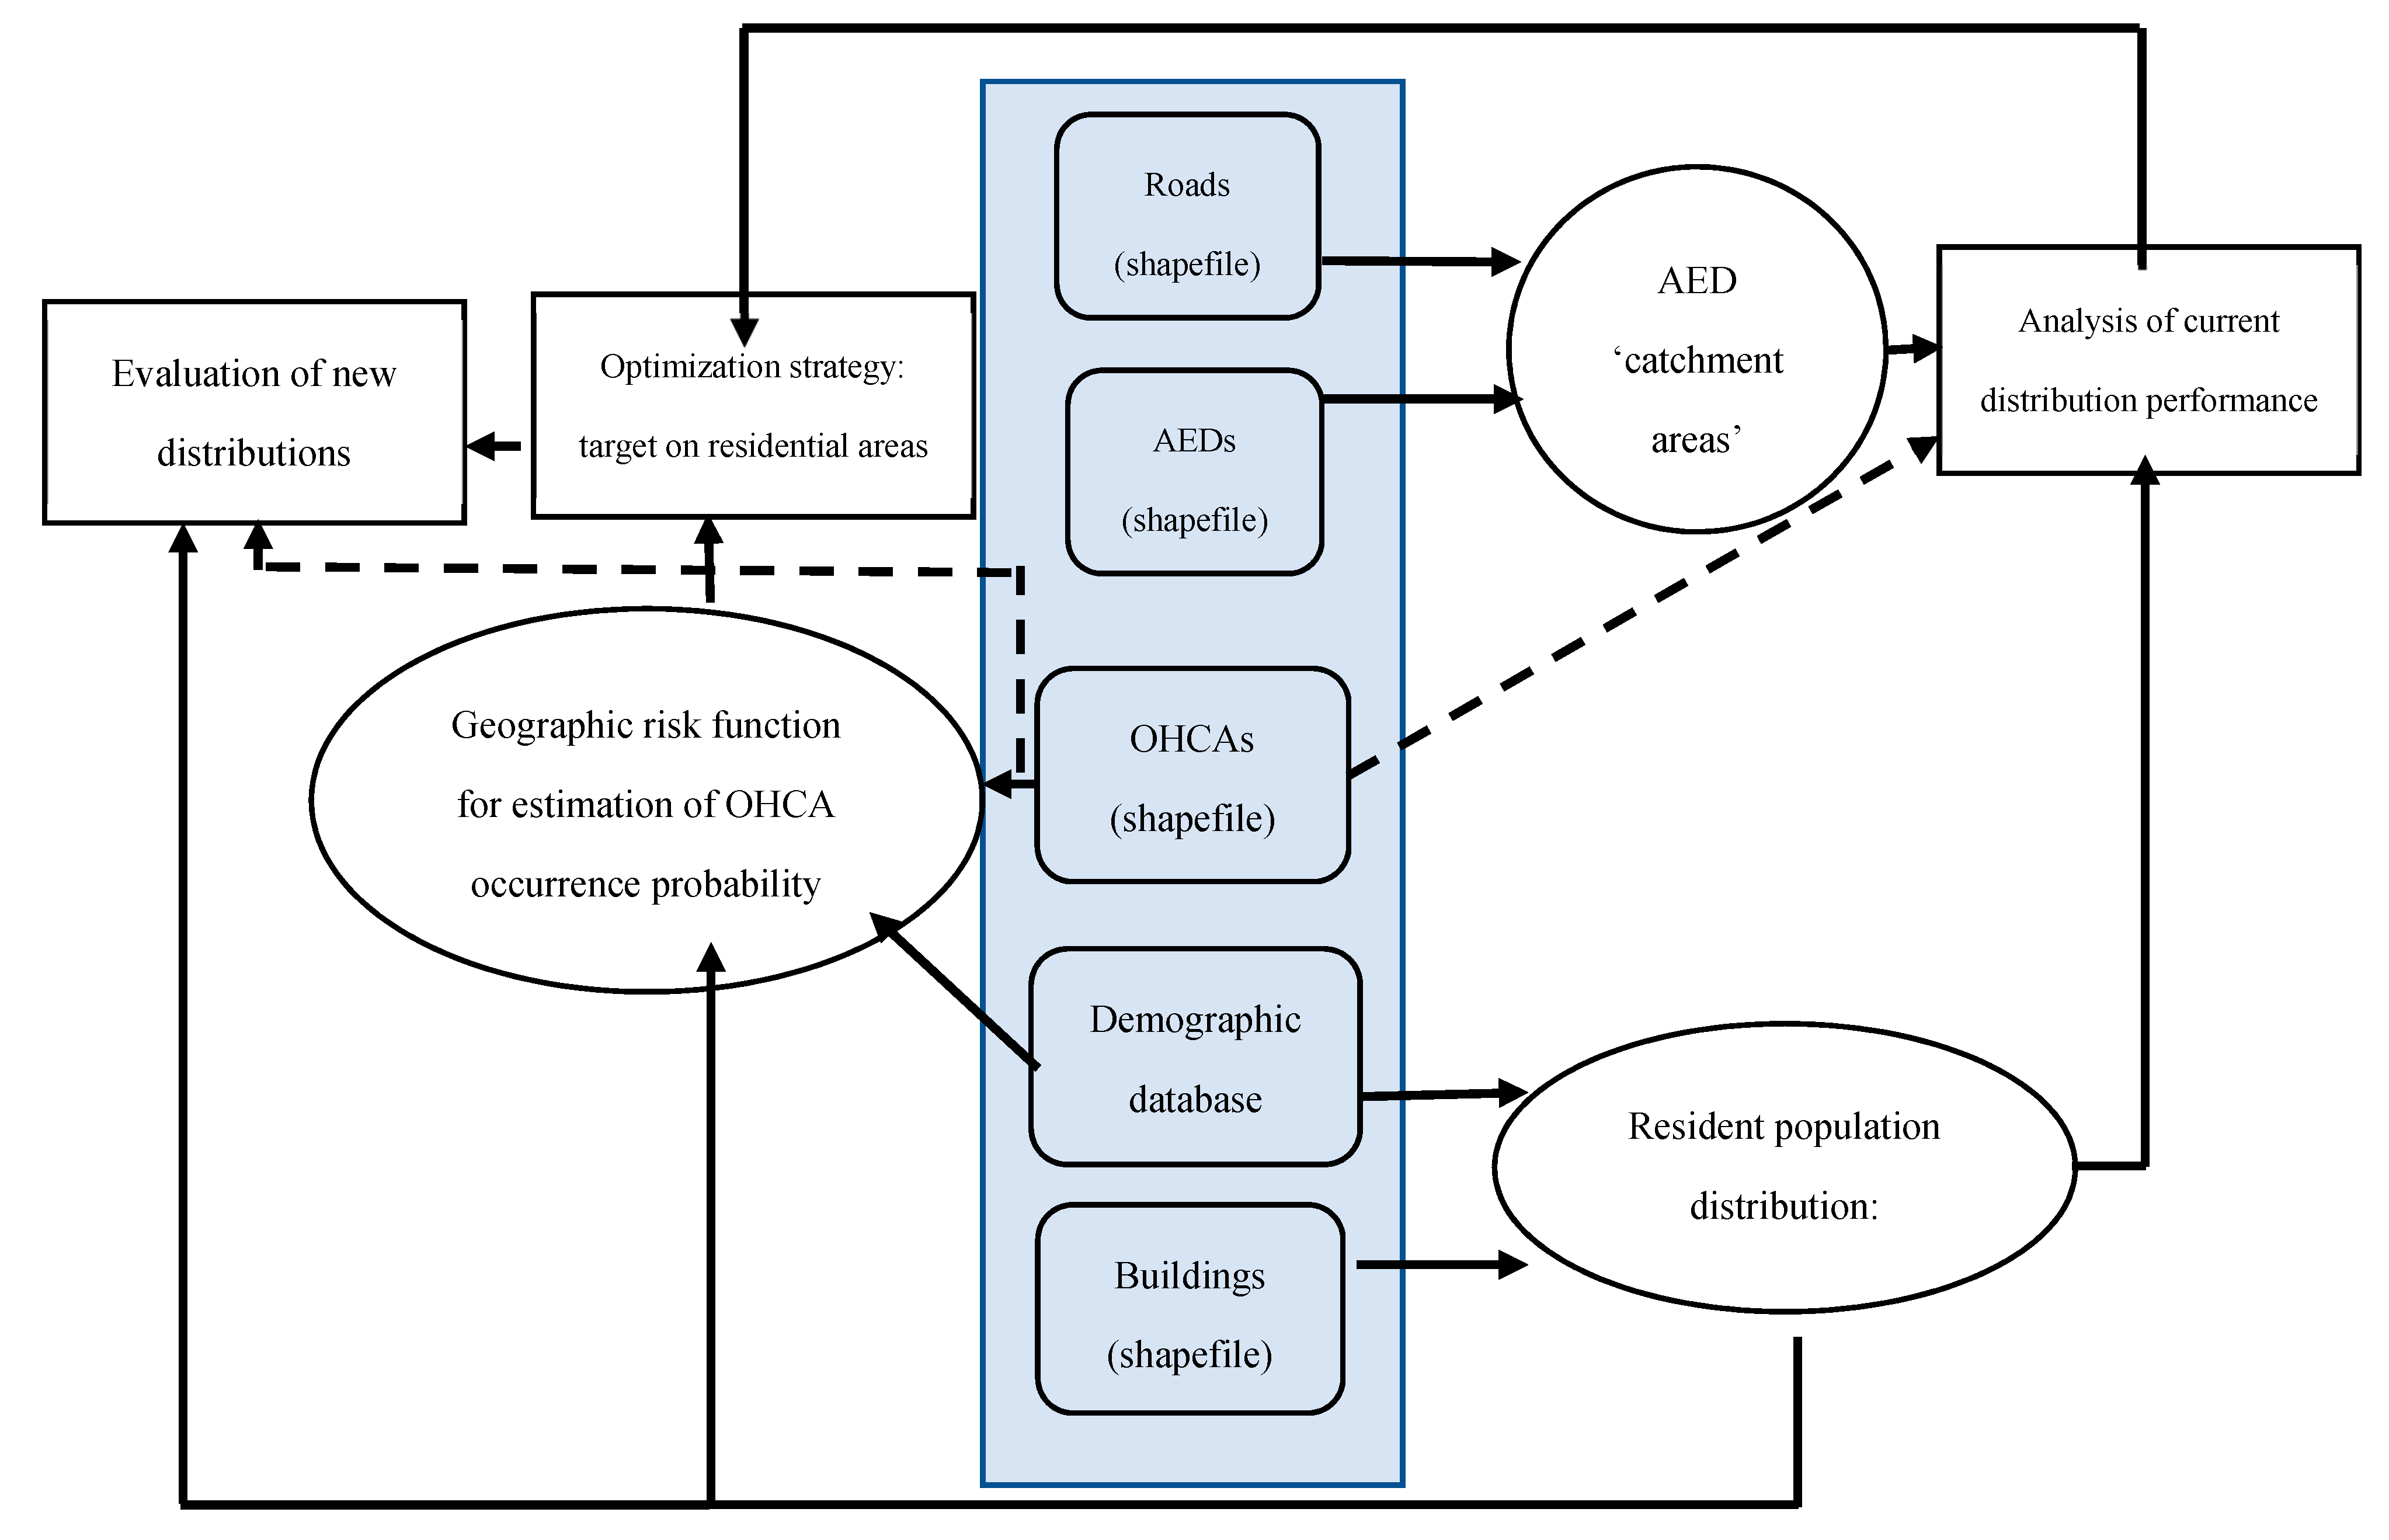
2. Materials and Methods

2.1. Data Sources and Pre-Processing

Four different data sources were utilized:
  • Georeferenced database of OHCAs (collected and made available for this research by AREU, Azienda Regionale Emergenza/Urgenza, responsible for the 112 emergency number service and Emergency Medical Services (EMS) provider for Lombardy region): it includes records of all OHCAs that occurred in Lombardy from 2015 to 2018 for a total of 45,043 records. In this timeframe, 8152 OHCAs occurred in the city of Milan, of which 7179 (88.06%) in residential locations. The anonymized database contains, as fields, the geolocation of each event, its date and time, time-to-intervention, information related to CPR and AED use, and more.
  • Georeferenced database of AED (from AREU): it includes geo-reference (geographic coordinates), location (description of the AED’s installation place), and accessibility of known publicly accessible AEDs in Lombardy as of 31 December 2018 (10,023 devices, 1001 in the city of Milan).
  • Milan City Topographic Database (open data at https://geoportale.comune.milano.it/sit/): Geographic information about residential buildings, roads, subdivision of the city into 88 districts (Local Identity Nuclei, LINs: an administrative subdivision of the city based on traditional areas of the city and history of urban development).
  • Demography (open data at http://dati.comune.milano.it/): demographic and socioeconomic information about the resident population specifically for each LIN (gender, age, and nationality).
All georeferenced information was converted to the World Geodetic System 84 (WGS 84)–UTM (Universal Transverse Mercator) 32 North coordinates system and imported into an open source and free-to-use under the GNU GPL license GIS software (QGIS, http://www.qgis.org), to be visualized as separate layers in the same map. Figure 1 shows an example of this visualization, with the georeferenced records in the OHCA database filtered for the city of Milan.
Routing issues were managed through pgRouting (https://pgrouting.org/) and PostGIS, open source SQL libraries run on PostgreSQL (http://www.postgresql.org), available on OSGeo, an operative system developed by the Open Source Geospatial Foundation (https://www.osgeo.org/). Processing of metadata and the optimization algorithm were implemented using the programming platform MATLAB (https://www.mathworks.com/products/matlab.html).
Figure 2 reports the schematic of the proposed framework (data sources highlighted in the gray box). The first step (right side) is represented by the evaluation of the current distribution of AEDs, based on the computation of the catchment areas of currently placed devices (area where they can be effectively used within the time limit, see next paragraph for implementation details), and a model for estimation of the distribution of the resident population. This output is exploited (left side) by the development of a geographic risk function to estimate the risk of residential OHCA occurrence along the territory, and by the final optimization defining a new geographical distribution for AEDs, that is subsequently evaluated with the same approach applied to the current deployment.

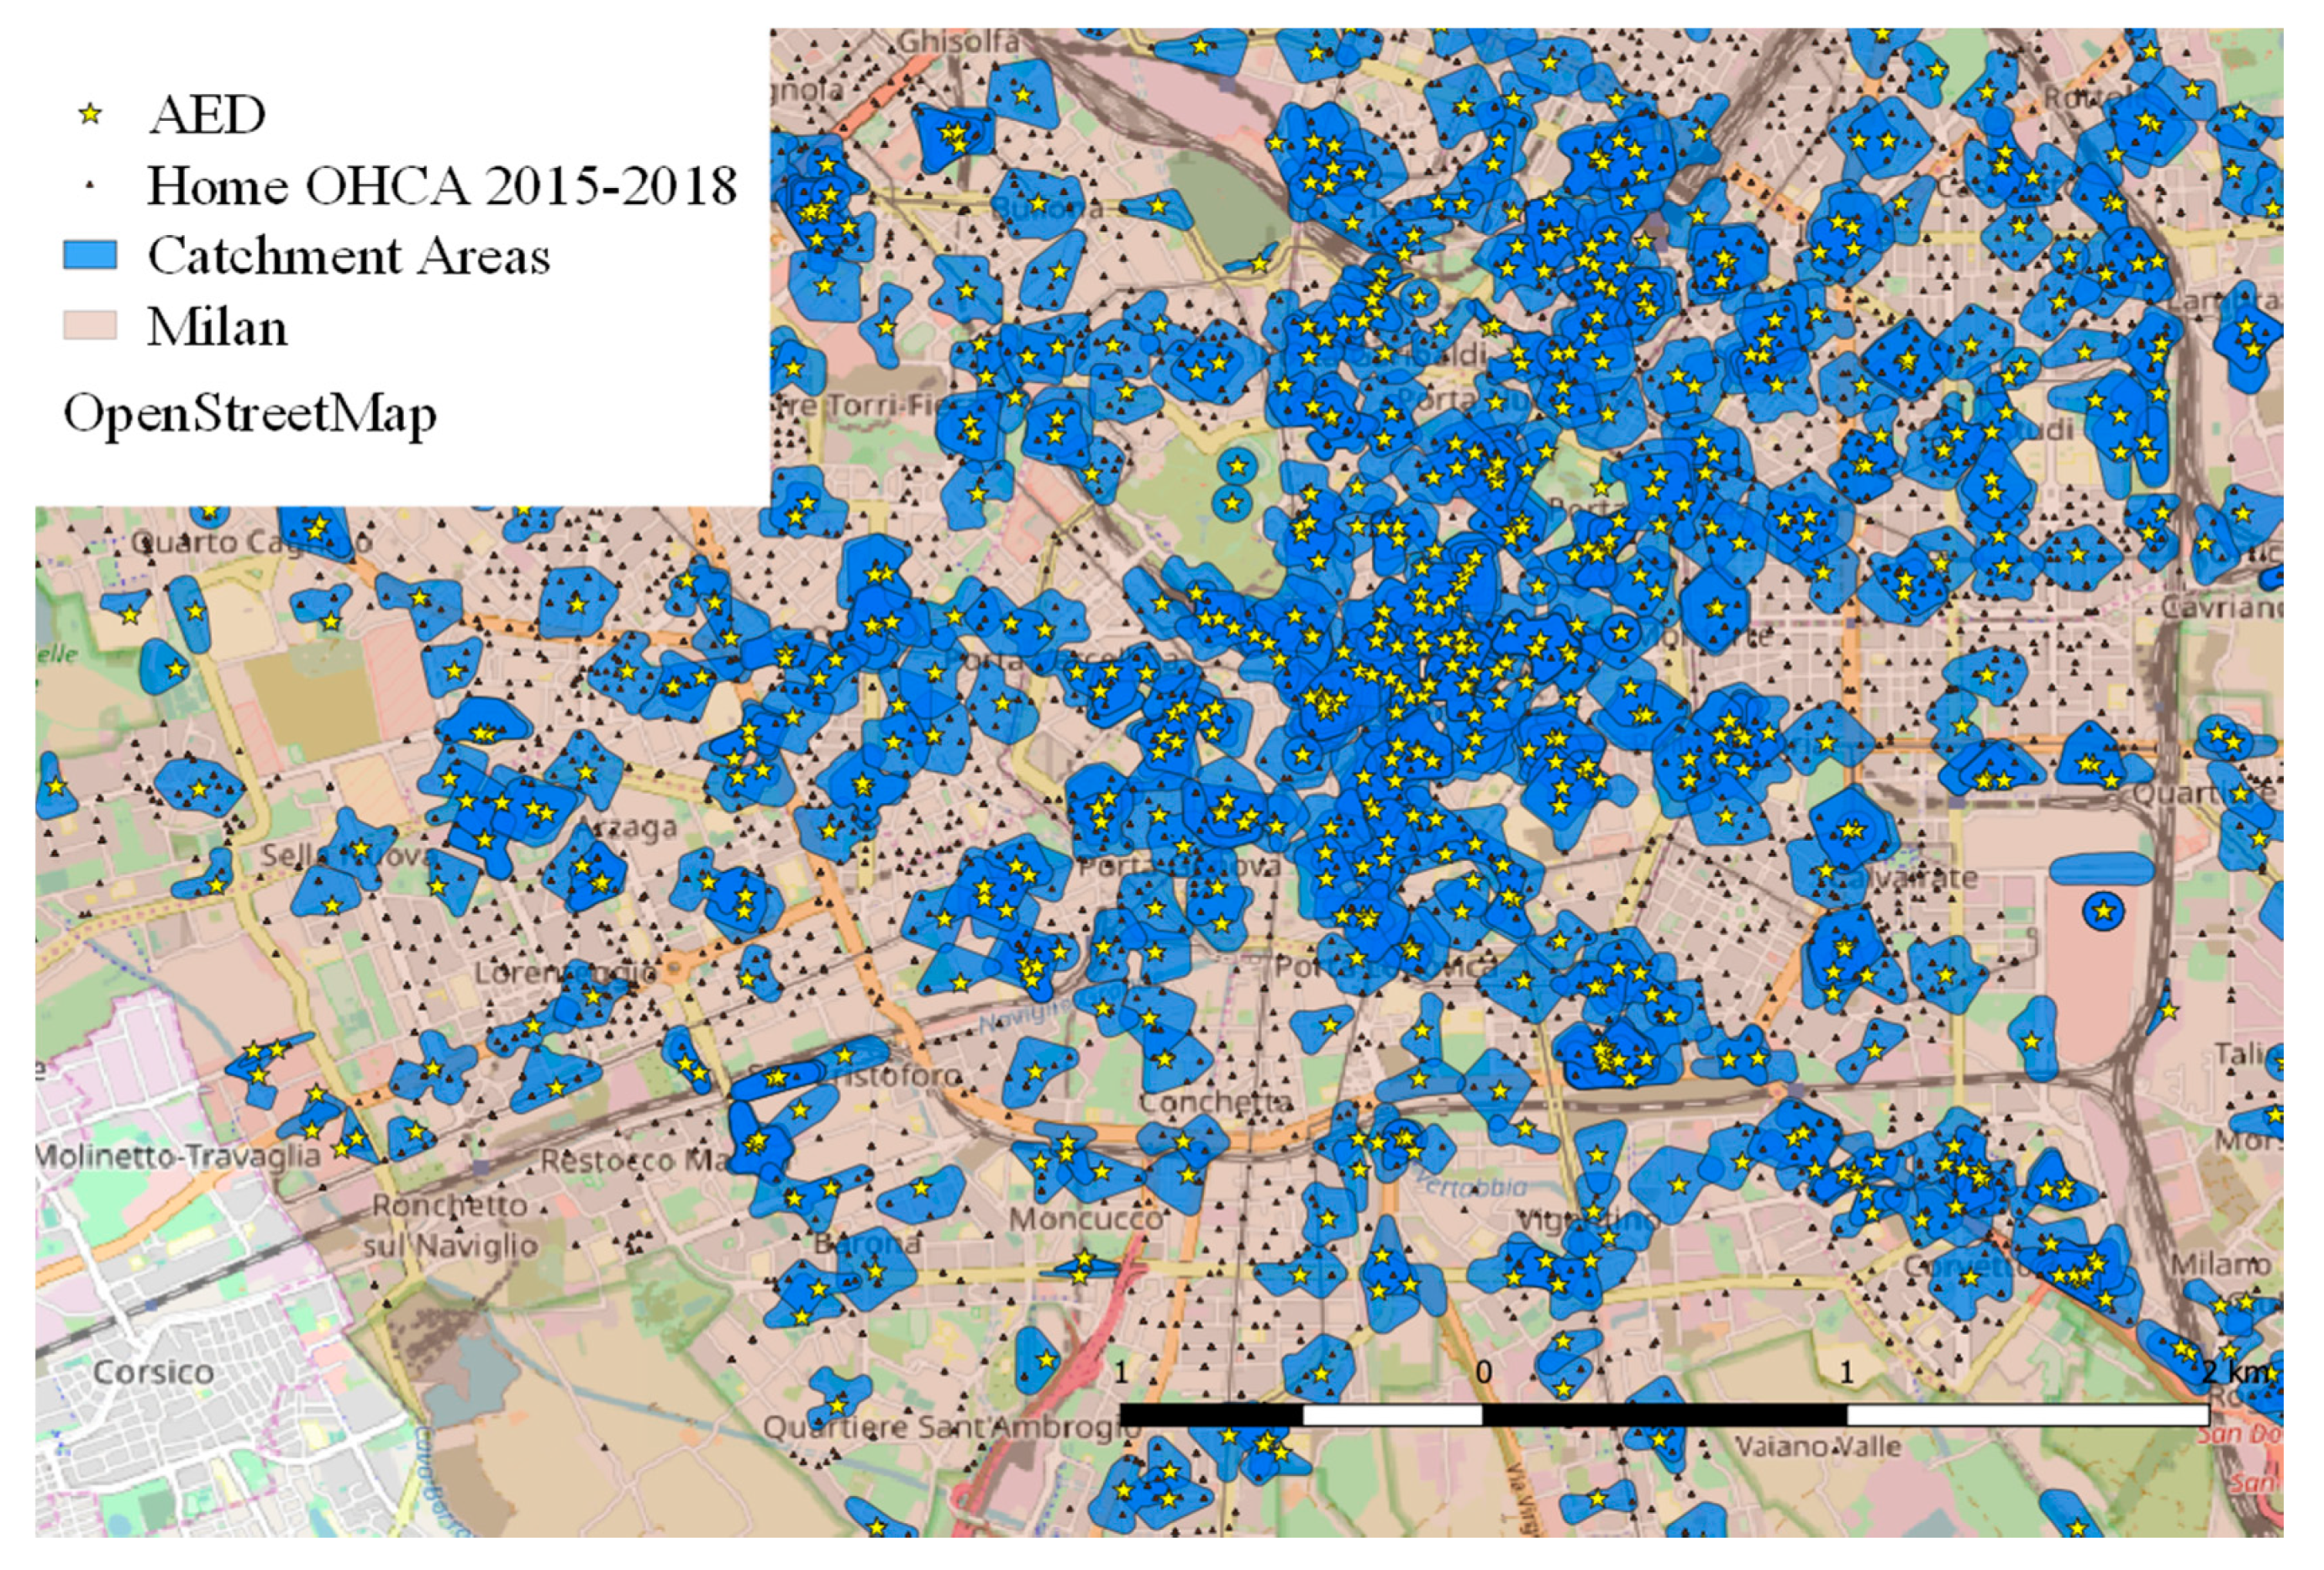
2.2. AED “Catchment Areas”

In order to assess the performance of AEDs, a “catchment area” was defined as the area that can be reached from the position of each AED within the set time limit (portion of territory potentially covered by the AED presence). Guidelines from AHA [36] suggest a time of 3 min as the limit (thus allowing back and forth within 6 min), but the conversion of this time limit into a space indication is not established [19,24,37]. In most of the previous studies, catchment areas were computed as 100 m radius circles [17,20,22,34,38,39]. For example, in the study by Sun et al. [39], a paper that studied if optimized AED locations improved coverage of OHCA, results showed an increase in estimation between 50% and 100%, where 100 m circular buffers were used as the measurement of device catchment areas. However, other studies, such as Deakin et al. [24], where the impact of AED accessibility and locations on the clinical outcome is investigated, and Bonnet et al. [9] where a platform for planning of optimal AED deployment in urban environments is developed and validated, suggested the use of realistic topography-based catchment areas. This second approach was followed in our research by computing them considering the reachable distance moving along the streets network (not through Euclidian distance), thus resulting in very different mapping results [24,28], especially when considering OHCA coverage (i.e., when studying the whole territory of Lombardy region from 2015 to 2018, we reported a 15.35% OHCA coverage considering 200 m realistic areas against 9.43% considering 100m circular buffers [40]). The computation resulted successful for 929 of the 1001 AEDs (92.8%), whereas for the remaining 72 (7.2%), the computation failed due to limitations in mapping quality, specifically in relation to open spaces such as parks, squares and large facilities, where the walkable paths are not clearly reported, and it is not possible to exclude the presence of obstacles. In these cases, the traditional 100 m circular buffer was considered, being the approach that better estimates the spatial coverage in cases where roads mapping is insufficient, resulting in a comparable mean surface of the catchment area [40]. Setting a 1.5 m/s walking speed (that is relatively low, in order to correct for the human factor and delays due to non-trained bystanders), 3 min correspond to a distance of 270 m centered on each AED. However, considering the time needed to reach the ground level from residential locations at higher floors, a non-negligible issue in the urban environment of Milan, the path length for computation of the catchment areas was reduced by a variable distance factor (max 70 m, down to a min final measure of 200 m) based on the mean height of the buildings in an outer 100 m portion of territory (between 150 and 250 m from the location of the AED) and weighting each building according to its estimated resident population. Details about this adjustment are reported in Appendix A.

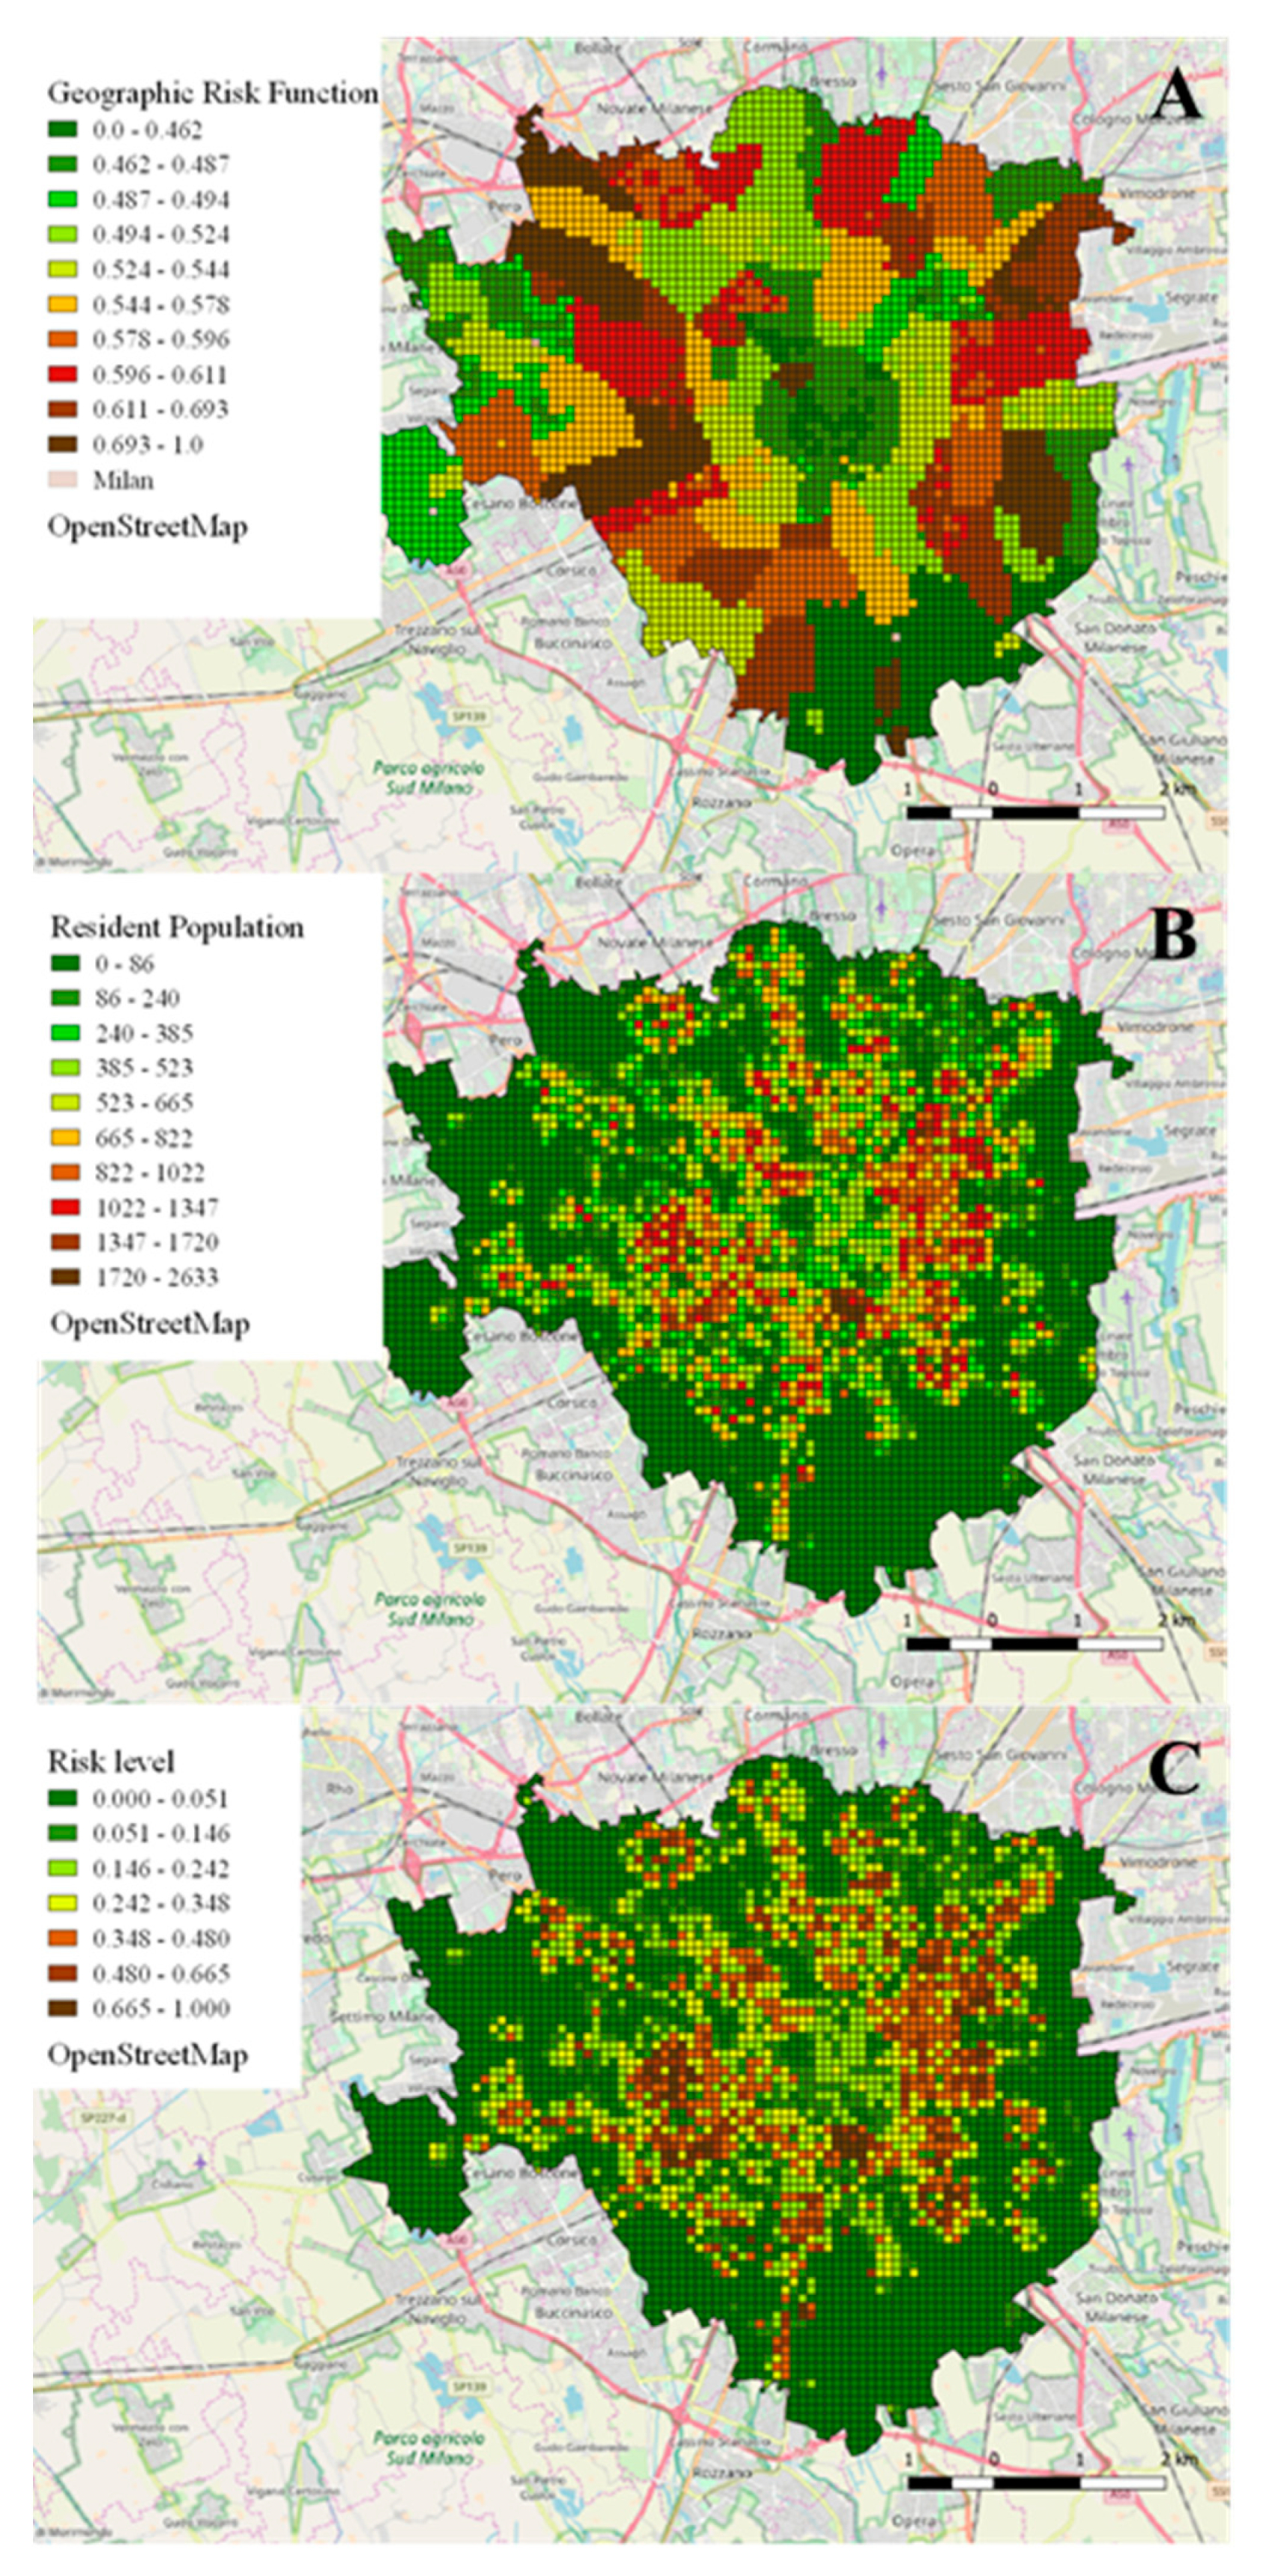
2.3. Geographic Risk Function

A geographic risk function, developed from retrospective data, expressing the expected probability of residential OHCA occurrence, was computed on 200 × 200 m squared cells obtained gridding the city territory; the cell dimension was set as a first conservative estimate for the possible presence of an AED catchment area, with the AED to be installed at the center of the cell. The amount of resident population in the area constituted the main factor; since a high level of granularity is required, a model for the estimation of the amount of residents building-by-building was developed for the whole city, as this information was not directly available. The estimate was derived as:
b u i l d i n g _ p o p = b u i l d i n g _ v o l v o l _ u d = b u i l d i n g _ v o l t o t _ p o p d t o t _ v o l d
where b u i l d i n g _ p o p is the estimated number of residents for each building, b u i l d i n g _ v o l the building volume; v o l _ u d the LIN-specific residential volume available for each resident person, computed as t o t _ v o l d / t o t _ p o p d , with t o t _ v o l d representing the total residential volume in each LIN; and t o t _ p o p d the total resident population in each LIN.
However, aiming at a more accurate risk function definition, a purely geographic factor unbound from the absolute number of residents was developed using supervised machine learning, where the target variable (set as a geographic risk estimator) was constituted by the percentage incidence of residential OHCA in the resident population. As previously stated, the whole territory was divided into 200 × 200 m cells; those with < 200 inhabitants were discarded as they were considered statistically meaningless, since the random noise component of the measured phenomenon (the percentage incidence of residential OHCA in the population) is prevalent within these records. This operation resulted in a final set composed of 2124 items. Each item was characterized by 35 attributes (three cell-specific, 32 LIN-specific) considering relevant factors with respect to OHCA occurrence probability [41], including age and gender of the resident population, percentage of foreign citizens (divided by ethnicity), resident population density, mean price of the properties in the district (considered as a socioeconomic indicator), percentage of edified surface in the area, and more. Attributes were reduced by applying Principal Components Analysis [42] separately on demography, ethnicity, and socio-economical subsets of attributes, and maintaining resulting attributes until the total explained variance was > 95% for each category, leading to a total of eight attributes; only these resulting eight attributes are used in the following steps of the algorithm. Outliers were identified through z-index (defined as z i i n d = x i μ ¯ σ ¯ where x i is the value of record i, μ ¯ is the sample mean and σ ¯ is the sample standard deviation) with threshold set to 5 [42] and then removed. The third-degree polynomial interpolation (four estimated coefficients) for each of the right attributes with the target variable was computed (32 total coefficients). The final predictor was calculated as a weighted average among all the eight estimators (results of the interpolation for each attribute):
p ^ i = j = 1 n w j ( c 1 , j v i , j 3 + c 2 , j v i , j 2 + c 3 , j v i , j + c 4 , j ) j = 1 n w j
with:
  • p ^ i : Target variable predictor (i-th item), estimate for the purely geographic risk function;
  • n : Attributes number;
  • c x , j : Coefficients for polynomial third degree interpolation (j-th attribute);
  • v i , j : Value of the j-th attribute for the i-th item;
  • w j : 1 r j ¯ , where r j ¯ is the absolute value of the mean of residuals for the estimator from interpolation of j-th attribute.
Figure 3 shows a schematization of the procedure: the model output values (geographic risk function, represented by the target variable estimate) were rescaled in the [0,1] range and applied as a weight to the number of resident population in the cell, providing the final risk level:
R i = p ^ i | 0 1 p o p i
with:
  • R i : Final risk level (i-th cell);
  • p ^ i | 0 1 : Predictor of OHCA percentage incidence (i-th cell, rescaled [0,1]), representing the estimate of the purely geographic risk function;
  • p o p i : Estimated resident population (i-th cell);
The implemented risk function was validated through a Receiving Operating Characteristic (ROC) curve: the cells where at least one OHCA occurred in a biennium (repeated on 2015–2016, 2016–2017, and 2017–2018) were considered “positive”, otherwise they were considered “negative”. Setting a threshold risk value (“alpha” threshold) separating “positive” and “negative” test outputs allowed the computation of true positives (TPs), false positives (FPs), true negatives (TNs), and false negatives (FNs). ROC curve was obtained plotting the sensitivity ( T P T P + F N ) on y axis and 1-specificity ( 1 T N T N + F P ) on x axis for different values of alpha threshold (ranging 0–1).

2.4. Optimization Strategy

An algorithm was implemented for the priority-ranked identification of cells where the installation of an AED is required, according to the user-defined figure of merit, which can be budget constraint, or the achievement of a target performance (in terms of coverage of final risk level, territory, resident population, or retrospective OHCAs: in this latter case, the performance was estimated on the basis of the coverage provided by the 200 × 200 m cell, set to be the a first rough and conservative estimate of the possible presence of a catchment area). The optimization algorithm has as inputs:
  • AEDs database, each weighted by an efficiency score (coverage of final risk level through its catchment area), and by a time-accessibility score (ts) ranged 0 to 1, with 1 assigned to AEDs accessible 24/7.
  • dataset of 200 × 200 m cells not covered by an AED, where each cell has a priority score expressed by the final risk level.
The algorithm proceeds iteratively, identifying at each step the cell with the highest risk and the least efficient AED (i.e., considering only AEDs in whose catchment areas where no OHCA occurred in the last four years), choosing between the installation of a new AED or the repositioning of a pre-existing one, considering the ratio between performance gain (coverage of final risk level) and implementation cost (accordingly to AREU, 2500 € for a new installation and 500 € for a re-displacement), until the user-defined objective was reached.
The outputs of the algorithm consist in:
  • Identification of all the cells where an AED should be positioned according to the selected goal, with priority ranking, as a new installation or a re-displacement;
  • Identification of the currently located AEDs that should be repositioned.
To assess efficiency (benefits/costs), a dedicated score (CE, Cost-Efficiency figure of merit) was calculated:
C E ( % ) = Δ T p T c / 10 6
where:
-
ΔTp represents the increase in percentage of covered OHCAs from the baseline: when evaluating the current AED distribution, the baseline value is assumed as 0%, whereas when evaluating new distributions, the baseline represents the percentage of OHCAs covered through the pre-existing deployment. As an example, a new simulated deployment covering 60% of retrospective events could results in ΔTp = 60 if representing a new distribution starting from blank (i.e., no AED on the territory); otherwise in case of a coverage of 41.77% provided by the current distribution, it results in ΔTp = 60 − 41.77 = 18.23, thus representing further processing of the currently implemented deployment.
-
Tc is the cost for the implementation of such distribution, expressed in M€.

3. Results

From the analysis of the age distribution of the observed 7179 (88.06%) OHCAs in residential locations (recorded from 2015 to 2018 in the city of Milan), most of the victims were older than 60 years (61–80 years old = 32.9%; > 80 years old = 53.21%), where 46–60 years old accounted for 9.21%, 30–45 years old for 2.87%, < 30 years old for 1.06%, while 0.74% of the records did not report the victim’s age. Median time (25th, 75th) to arrival of EMS was 8 min 44 sec (6 min 55 s, 11 min), and in only 143 cases (1.99%) of home OHCA the use of a public AED was reported. In Figure 4, in a zoomed portion of Milan, the position of each AED currently installed, with its realistic catchment area, and of each residential OHCA are shown.

3.1. Performance of Current AEDs Distribution

Table 1 reports the results of performance analysis of the current distribution of AEDs for the OHCA database for the city of Milan. The sub-optimal coverage both of territory (23.14%) and resident population (40%) was noticeable. Moreover, a high overlapping of catchment areas (39.28% of the total catchment area of AEDs) was observed, where its elimination alone could provide a 9% increase in coverage of city territory. The 41.77% of total OHCAs occurred within a catchment area (cost-efficiency parameter CE = 16.69%), of which 50.46% for “outside” OHCAs, and 40.59% for residential OHCAs, with a lowering the overall performance, as residential events represented almost the 90% of the total. The 41.77% actual coverage was considered as the baseline to compute the cost-efficiency CE parameter in new distributions.
The correlation between common GIS attributes relevant to LIN and the use of AED in presence of residential OHCA was analyzed. Interestingly, higher levels of use were associated with a lower resident population (1720 [1119; 2587.5] vs. 2005 [1412; 2617.25]) with larger residential volume/person available (219.6 [176.4; 265.73] vs. 190.44 [172.85; 256.38] m3/person), thus evidencing wealthier areas, and with less prevalence of residents > 60 years old (27.5 [25.5; 30.1] vs. 28.2 [26.1; 30.7] %).

3.2. Validation of the Geographic Risk Function

Despite the actual prediction of OHCA incidence being impossible (due to the strong randomness observed in the occurrence of OHCA), the small variations of the target value were considered representative of the relative difference in the risk distribution.
The area of the obtained ROC curve was 0.887 for 2015–2016 (best “alpha” threshold at 0.037, with 95% sensitivity and 68.2% specificity), 0.886 for 2016–2017 (best “alpha” threshold at 0.0317, with 95% sensitivity and 67.8% specificity), 0.884 for 2017–2018 (best “alpha” threshold at 0.0263, with 95% sensitivity and 67% specificity), confirming the reliability of the computed geographic risk function.

3.3. Performance of the Optimized Distribution of AEDs

First, the optimization algorithm was applied to a scenario that replicated the number of currently available AEDs, to test for possible improved configurations achievable if the proposed model would have been used to assist in the decision about where to put each AED, as suggested by Sun et al. [39]. As expected, a better performance achievable in respect to the current one was evidenced, estimating an increase in spatial coverage of all OHCAs of +31.56% (from 41.77% to 73.33%), with a CE parameter increasing from 16.69% to 29.3% (+12.61%). Detailed results are reported in Table 2.
In order to evaluate the potential improvements, starting from the current situation, four additional scenarios were simulated:
1. Displacements only (no new AED is installed, some of the currently located AEDs are re-displaced): the algorithm suggested the re-displacement of 373 (37.26% of the total) AEDs, providing an expected increase of covered OHCAs between 2015 and 2018 of 23.06% (from 41.77% to 64.83%), with a CE of 123.65% (resulting very high due to the low cost of re-displacements).
2. Installation of fixed number (N = 100) of new AEDs and re-displacement of existing ones: a total of 366 re-displacements (36.56%) were suggested in addition to the installation of 100 new devices, potentially covering the 68.69% of OHCAs between 2015 and 2018, with a CE of 62.4%.
3. Doubling the current risk coverage (from 39.51% to 79.03%): this scenario resulted in an increase, hence not a doubling, in total covered OHCAs from 41.77% to 74.9%, with a +33.13%, associated to a remarkable coverage level, and with a CE which is twice that of the current deployment (from 16.69% to 36.17%, +19.48%).
4. Doubling the initial investment relevant to the current distribution (estimated as 2,502,500 €, based on the cost of installation of 1001 AED): results of this scenario showed the re-displacement of 293 (29.27%) AEDs together with 942 new installations, obtaining a risk function coverage close to the total (98.79%), accounting for the 88% of all the OHCAs, with a CE slightly higher than the initial level (18.47%).
In Table 3, the detailed results of performance analysis for the simulated scenarios are presented.
It should be noticed that the estimation of the expected performance is strongly conservative, as the catchment areas of hypothetical new AED installations are 200 × 200 m cells (and not referring to a potential distance of 270 m), which is therefore an estimate by default.
Figure 5 reports a graphical representation of the output, where the algorithm returns currently located AEDs that should be re-positioned and identifies cells where the installation of a new device is suggested.

4. Discussion

In the context of deployment strategy of AEDs for improving spatial coverage of residential OHCAs, several unsolved issues relevant to optimization frameworks in PAD programs were addressed:
  • Dimensioning of the catchment areas: the proposed computation considers realistic areas, based on the reachable distance within 3 min (allowing back and forth within 6 min) at 1.5 m/s velocity (270 m), reduced by a variable quantity (max 70 m) depending on the mean height of the surrounding buildings. This solution constitutes a possible improvement in matching a real-world scenario, compared to previous literature (100 m circular area [17,20,22,34,38,39]).
  • Development of the risk function: the main innovation was to focus on OHCAs occurring inside residential locations constituting the majority of the events (almost 90% in the considered dataset), characterized by higher mortality. Differently from previous studies [9,20,39], a supervised learning approach inspecting the relation between geographic risk (target) and attributes related to demography, socio-economic conditions and land-use was applied.
  • Applicability as a decision-making support tool: in literature, only one example [9] of an interactive interface for the optimization framework with the possibility for the user to modify the initial parameters as a decision-making support was present. The novelty (and main potentiality) of the proposed framework is related to its generalization and application to any new territory where the input data (AEDs and past OHCAs geolocation, streets network, demography) are available, although with variable accuracy to be determined according to the provided information (both regarding quantity and quality). Moreover, the proposed framework also considers the possibility to re-displace current devices (as suggested by Tierney et al. [38]) and allows the user to set the target constraints for optimization, choosing among a wider number of different criteria including area, population or risk coverage, not just limited to budget or number of devices.
As a result, in the context of its application to the case study of the city of Milan, the proposed strategy for AEDs deployment resulted more effective compared to the existing distribution. The initial spatial coverage of OHCAs (41.77%) was significantly lower than that estimated to be achieved by the new distribution (73.33%), resulting in a higher cost-efficiency parameter CE (from 16.69% OHCAs coverage increase for 1 M € invested, up to 29.3%).
Based on the results of this study, AEDs placement should be directed by the public authority according to a predefined plan, which is in line with results from similar studies [19,39]. Although private funding is a primary source for the development of PAD programs, and should always be encouraged, a centralized management of every initiative relevant to the installation of an AED would result in a more efficient exploitation of the allocated resources, which is enlightened as a primary objective by Deakin et al. [24].
This main conclusion is in line with Folke et al. [33], that examined cost-effectiveness of covering OHCA in public places in the city of Copenhagen (Denmark) and concluded that strategic placement of AEDs based on historical occurrence was economically acceptable, whereas unguided initiatives lead to AEDs being placed inappropriately. Similarly, the use of geographical information together with mathematical modelling helped in identifying such high-risk areas for the city of Toronto (Canada), thus proving that strategic placement of AEDs in a limited number of sites may result in an increase in public OHCA coverage in a large urban center [34]. When combined with community responder programs, the proportion of OHCA in public settings treated by AED in the Seattle area increased every year, from 1.56% in 1999 to 5.23% in 2002, with no adverse outcome from AED application in non-arrest events, and with 25% survival for OHCA in residential settings [43].
In addition, it is worth noting that the resulting AEDs distributions in this study scenario focused on residential events were not worsening (and actually improving, from 50.46% to 56.22%) the coverage of OHCAs in outdoor locations, by globally covering a higher portion of territory. This relevant finding suggests that a home-OHCA-based strategy does not impact negatively on the possibility of receiving assistance by a bystander in case of outdoor OHCA. Whereas, on the contrary, policies focused on optimizing AEDs distribution to cover outdoor OHCAs will have no or minimal impact in increasing the coverage of residential OHCAs, resulting in a lower level of use of AEDs in residential locations with respect to public places, as confirmed by recent studies [23,28].
Considering the performed simulations of further improvements in AEDs deployment (even though results should be considered conservative, because catchment areas of new hypothetical devices were estimated covering a 200 × 200 m area, instead of a realistic one), all new computed distributions are more cost-efficient from the point of view of spatial coverage when compared with the current deployment, including the most demanding simulated scenario (“budget doubling”), where the expected coverage of OHCAs reached 88%.
The relationship between risk coverage and OHCAs coverage is non-linear due to the random component of the phenomenon, which cannot be modelled; therefore, high levels of covered risk (as percentage of the total) correspond to a lower percentage of covered OHCAs (e.g., in the “budget doubling” scenario a 98.79% of covered risk corresponds to a 88% coverage of OHCAs). However, the overall trend of the results in the different scenarios is coherent: an increase in risk coverage does correspond to an increase in OHCAs and resident population coverages, although with a decreasing ratio when approaching higher levels, implying a reduction in cost-efficiency. Despite the model being targeted on residential OHCAs, the coverage of events happening outside the residential location was increased too, although with lower ratios.
Main limitations concerning the utilized methodology were:
  • Data quality: topographic and demographic open data, not specifically collected for scientific purposes, were used for the development of the risk function. Moreover, the topographic mapping information was not complete and prevented the computation of realistic catchment areas for 72 (7.2%) of the considered devices, for which the use of the traditional (yet inefficient in terms of OHCA coverage [40]) 100 m circular buffer was implemented. However, due to the limited number of affected AED and their location (parks, squares and large facilities), which is not relevant in addressing residential events (i.e., the main focus of this study), we considered the resulting approximation as acceptable.
  • AED placement spot: the algorithm identifies squared cells where an installation is considered necessary (according to specifications), but no output is provided about the exact spot within the cell where the AED should be placed, which means that the resulting coverage area might not be the most efficient. A future development could address the identification of these spots, with a following phase of fine-tuning positioning for each cell.
  • Follow-up survival data not available: due to Italian legislation and separate database system between the EMS provider and the hospitals, the assessment of the rescue outcome, neither in short-term (as EMS crew often does not include a physician, so death could not be declared until body arrival to the hospital) nor in long-term survival, was not available. This prevented a possible comparison of the rate of AED use and successful resuscitation between cases of home-OHCA, which occurred within the actual public AED catchment areas, versus those that occurred outside. Although timely interventions on OHCA with a public AED do increase survival probability [4,5], and the likelihood of such interventions is higher when the distance between the OHCA location and the AED is shorter [28], the proposed increase in spatial coverage provided by public AEDs, which is the target of this study, could be evaluated from an efficiency point of view (e.g., by computing the results in terms of Quality-Adjusted Life Years, QALYs). This is only if correlating more frequent uses of AED in events occurring within their catchment areas with higher survival rates and better medical outcomes, of which were not available in this study. However, Sondergaard et al. [28] reported a higher likelihood of use of public AEDs when placed closer to OHCA locations, while Sun et al. [39] demonstrated, exploiting the Utstein-based outcome prediction, that the increase in spatial coverage provided by AEDs is correlated with higher survival chances and better neurological outcome. In addition, the report remarked that this kind of “in-silico” trial “can be used to identify promising interventions based on objective performance criteria and inform trial design in a data-driven manner, potentially saving significant time and money”.
As the risk function was computed considering all OHCA etiologies, with both shockable rhythms and pulseless electrical activity, a further improvement could be to limit the risk function computation on OHCA with shockable rhythms only, in order to potentially maximize cost-effectiveness of AED distribution. However, this was not possible with the available data, where 5963 records (73.15%) had missing information for this field, and only in 352 records (4.32%) a shockable rhythm was reported, also due to the result of the time-dependent deterioration of ventricular fibrillation to asystole [44], considering that the median time to arrival of EMS was larger than the recommended 6 min.
Moreover, by expanding the spatial-temporal sample and having more records where a publicly accessible AED is used, the correlation between territorial attributes (routing, environment etc.) and the level (and quality) of public AEDs use could be further inspected, as well as possible correlations with the medical outcome.
Finally, it is worth noticing that the actual use of public AEDs is still very low, in line with data from other countries [37], with 227 reported uses in the 8152 total OHCA, accounting for 2.78% of the cases, of which 143 were related to a home OHCA, also due to a 45.46% of missing data in the available database. While increasing geographic coverage and spatial accessibility does not ensure by itself an increase in the use of public AEDs (although Sondergaard et al. [28] enlightened a correlation between AED-to-OHCA proximity and AED use), providing policy makers with methods for increasing AED spatial accessibility represents a first step towards increasing their utilization and survival probability, particularly if accompanied by public campaigns for awareness raising. The HAT trial [21], despite not finding differences in terms of mortality between the patients in the control group (conventional response) and those to which a personal AED was given at home, confirmed that the use of AED at home on loved ones or neighbors by lay users with minimal training was feasible, risk free, and resulted in overall survival after cardiac arrest at home of 12% (18.3% for witnessed events), better than the 2% previously reported [45].
Therefore, even if a more accurate distribution of the devices could improve PAD performance, the first and key resource where more efforts should be invested are the final users. Campaigns for awareness raising and citizens training [46], together with the inclusion of this kind of resource in the EMS [25,47,48] (e.g., via smartphone app [49]), could positively improve PAD performance regardless to the optimality of the deployment of the devices. These improvements in the usage model could also provide AEDs retriever with the exact location and potentially with the faster routing, significantly reducing the time to retrieval. Moreover, despite the assessed safeness of AED use from untrained people, legal restrictions are still negatively impacting use level of AEDs from bystanders, especially in Italy [16]. In other countries too, where willingness of bystanders to initiate resuscitation is higher, usage is still low, at least to some extent due to the reduced accessibility [25,37].

5. Conclusions

The proposed framework for PAD, considering realistic catchment areas, showed that, in the city of Milan, the current distribution of publicly accessible AEDs, based on the current guidelines and use practice, is sub-optimal, both regarding the coverage of territory, of OHCA events, and of resident population. The following optimization, exploiting a geographic risk function for estimation of OHCA occurrence probability, could provide a highly valuable decision-making support for policy makers, from which new installations or re-displacement of existing AEDs could result in effective improvement in the spatial accessibility of publicly accessible AEDs.
Based on the results of this study, AEDs placement should be directed by the public authority according to a predefined plan both concerning public and private initiatives, as stated in similar studies [19,39]. The focus on residential OHCAs, following recent suggestions encouraging this approach [22,25,29,30,31], revealed that, from a spatial point of view, targeting residential areas is more effective in increasing coverage of both in-home and public OHCA.
The obtained findings could be considered as a relevant starting point for a real field application of the proposed framework, which can be implemented for any territory in which the required information is available. If including medical follow up of OHCA outcome, it could provide definite data for policy makers on performance of algorithms for the most cost-effective placement of AEDs, leading to a more effective definition of PAD programs guidelines. However, in line with conclusions by Sun et al. [39], the proposed approach could already be considered valuable in guiding AED placements in order to increase spatial coverage, which is likely to result in better clinical outcome for victims of OHCA.

Author Contributions

Conceptualization: Gianquintieri Lorenzo, Brovelli Maria Antonia and Caiani Enrico Gianluca Methodology: Gianquintieri Lorenzo, Brovelli Maria Antonia and Caiani Enrico Gianluca. Software: Gianquintieri Lorenzo Validation: Gianquintieri Lorenzo Formal Analysis: Gianquintieri Lorenzo, Brovelli Maria Antonia and CAIANI ENRICO GIANLUCA Investigation: Brambilla Piero Maria, Pagliosa Andrea and Villa Guido Francesco Resources: Brambilla Piero Maria, Pagliosa Andrea, Villa Guido Francesco and Caiani Enrico Gianluca Data Curation: Gianquintieri Lorenzo, Brambilla Piero Maria, Pagliosa Andrea and Villa Guido Francesco Writing-Original Draft Preparation: Gianquintieri Lorenzo, Brovelli Maria Antonia and Caiani Enrico Gianluca Writing-Review & Editing: Gianquintieri Lorenzo, Brovelli Maria Antonia and Caiani Enrico Gianluca Visualization: Gianquintieri Lorenzo, Brovelli Maria Antonia and Caiani Enrico Gianluca Supervision: Caiani Enrico Gianluca Project Administration: Caiani Enrico Gianluca All authors have read and agreed to the published version of the manuscript.

Funding

This research received no external funding.

Acknowledgments

We acknowledge the support of AREU in sharing the historical data on OHCAs for the city of Milan.

Conflicts of Interest

No actual or potential conflict of interest declared.

Appendix A

Adjustment of catchment areas dimensions considering buildings height.
1. Computation of a realistic catchment area with a target path dimension of 150 m, considered to be the minimal distance after which the effect of building height could prevent the possibility to reach the OHCA location within the time limit of 6 min (back and forth).
2. Computation of a realistic catchment area with a target path dimension of 250 m, considered to be the maximal distance in which the OHCA location can be reached within the time limit of 6 min (back and forth) even when considering buildings height.
3. Computation of the portion of the territory included within the realistic catchment areas with 150 and 250 m target path, considered to be the area in which buildings height could have an impact and should be evaluated.
4. Identification of all the buildings in the territory included within the 150 and 250 m realistic catchment areas, considered to be the buildings potentially impacting reaching the OHCA locations in due time.
5. Computation of the weighted (on the base of estimated hosted resident population) mean height m w h of buildings in the territory within the 150 and 250 m realistic catchment areas:
m w h = i h i p o p i i p o p i
where h i is the height of the i-th building in the interest area, p o p i is the estimated resident population living in the i-th building in the interest area (with the estimation method previously described).
6. Reduction of the dimension of the catchment area: The vertical movement speed is considered to be 1.5 m/s, therefore the reduction dimension is computed as m w h * 1.5, where m w h is the weighted mean height [m] of the buildings in the interest area (step 3).
l r = m w h 1.5 = i h i p o p i i p o p i 1.5

References

  1. Roger, V.L.; Go, A.S.; Lloyd-Jones, D.M.; Adams, R.J.; Berry, J.D.; Brown, T.M.; Carnethon, M.R.; Dai, S.; Simone, D.G.; Ford, E.S.; et al. Heart Disease and Stroke Statistics—2011 Update: A Report From the American Heart Association. Circulation 2011, 123, 18–209. [Google Scholar] [CrossRef] [PubMed] [Green Version]
  2. Priori, S.G.; Blomstrom-Lundqvist, C.; Mazzanti, A.; Blom, N.; Borggrefe, M.; Camm, J.; Elliott, P.M.; Fitzsimons, D.; Hatala, R.; Hindricks, G.; et al. 2015 ESC Guidelines for the management of patients with ventricular arrhythmias and the prevention of sudden cardiac Death. The Task Force for the Management of Patients with Ventricular Arrhythmias and the Prevention of Sudden Cardiac Death of the European Society of Cardiology (ESC). Eur. Heart J. 2015, 36, 2793–2867. [Google Scholar] [PubMed] [Green Version]
  3. Wellens, H.J.; Lindemans, F.W.; Houben, R.P.; Gorgels, A.; Volders, P.G.; Bekke, R.M.; Crijns, H.J. Improving survival after out-of-hospital cardiac arrest requires new tools. Eur. Heart J. 2016, 37, 1499–1503. [Google Scholar] [CrossRef] [PubMed] [Green Version]
  4. Holmberg, M.J.; Vognsen, M.; Andersen, M.S.; Donnino, M.W.; Andersen, L.W. Bystander automated external defibrillator use and clinical outcomes after out-of-hospital cardiac arrest: A systematic review and meta-analysis. Resuscitation 2017, 120, 77–87. [Google Scholar] [CrossRef]
  5. Kiyohara, K.; Nishiyama, C.; Kitamura, T.; Matsuyama, T.; Sado, J.; Shimamoto, T.; Kobayashi, D.; Kiguchi, T.; Okabayashi, S.; Kawamura, T.; et al. The association between public access defibrillation and outcome in witnessed out-of-hospital cardiac arrest with shockable rhythm. Resuscitation 2019, 140, 93–97. [Google Scholar] [CrossRef]
  6. Zulli, L. La Morte Cardiaca Improvvisa—L’arresto Cardiocircolatorio—La Rianimazione Cardiopolmonare. Available online: http://internetsfn.asl-rme.it/file_allegati/morte_improvvisa.pdf (accessed on 10 September 2019).
  7. Jost, D.; Degrange, H.; Verret, C.; Hersan, O.; Banville, I.L.; Chapman, F.W.; Lank, P.; Petit, J.L.; Fuilla, C.; Migliani, R.; et al. DEFI 2005: A randomized controlled trial of the effect of automated external defibrillator cardiopulmonary resuscitation protocol on outcome from out-of-hospital cardiac arrest. Circulation 2010, 121, 1614–1622. [Google Scholar] [CrossRef] [Green Version]
  8. Perkins, G.D.; Handley, A.J.; Koster, R.W.; Castren, M.; Smyth, M.; Olasveengen, T.; Monsieurs, K.G.; Raffay, V.; Gräsner, J.-T.; Wenzel, V.; et al. European Resuscitation Council Guidelines for Resuscitation 2015: Section 2. Adult basic life support and automated external defibrillation. Resuscitation 2015, 95, 81–99. [Google Scholar] [CrossRef] [Green Version]
  9. Bonnet, B.; Dessavre, D.G.; Kraus, K.; Ramirez-Marquez, J.E. Optimal placement of public-access AEDs in urban environments. Comput. Ind. Eng. 2015, 90, 269–280. [Google Scholar] [CrossRef]
  10. Weisfeldt, M.L.; Kreber, R.E.; McGoldrick, R.P.; Moss, A.J.; Nichol, G.; Ornato, J.P.; Palmer, D.G.; Reigel, B.; Smith, S.C. Public Access Defibrillation A Statement for Healthcare Professionals From the American Heart Association Task Force on Automatic External Defibrillation. Circulation 1995, 92, 2763. [Google Scholar] [CrossRef]
  11. Mauri, R.; Burkart, R.; Benvenuti, C.; Caputo, M.L.; Moccetti, T.; Bufalo, D.A.; Gallino, A.; Casso, C.; Anselmi, L.; Cassina, T.; et al. Better management of out-ofhospital cardiac arrest increases survival rate and improves neurological outcome in the Swiss Canton Ticino. Europace 2016, 18, 398–404. [Google Scholar] [CrossRef]
  12. Smith, C.M.; Wilson, M.H.; Hartley-Sharpe, C.; Gwinnutt, C.; Dicker, B.; Perkins, G.D. The use of trained volunteers in the response to out-of-hospital cardiac arrest—The GoodSAM experience. Resuscitation 2017, 121, 123–126. [Google Scholar] [CrossRef] [PubMed] [Green Version]
  13. Weisfeldt, M.L.; Sitlani, C.M.; Ornato, J.P.; Rea, T.; Aufderheide, T.P.; Davis, D.; Dreyer, J.; Hess, E.P.; Jui, J.; Maloney, J.; et al. Survival after application of automatic external defibrillators before arrival of the emergency medical system: Evaluation in the resuscitation outcomes consortium population of 21 million. J. Am. Coll. Cardiol. 2010, 55, 1713–1720. [Google Scholar] [CrossRef] [PubMed] [Green Version]
  14. Deakin, C.D.; Shewry, E.; Gray, H.H. Public access defibrillation remains out of reach for most victims of out-of-hospital sudden cardiac arrest. Heart 2014, 100, 619–623. [Google Scholar] [CrossRef] [PubMed] [Green Version]
  15. Mao, R.D.; Ong, M.E.H. Public access defibrillation: Improving accessibility and outcomes. Br. Med. Bull. 2016, 118, 25–32. [Google Scholar] [CrossRef] [PubMed] [Green Version]
  16. Baldi, E.; Savastano, S. AED use before EMS arrival: When survival becomes a matter of law and system in Italy, which can be improved. Eur. Heart J. 2018, 39, 1664. [Google Scholar] [CrossRef]
  17. Sun, C.L.F.; Demirtas, D.; Brooks, S.; Morrison, L.J.; Chan, T.C. Overcoming Spatial and Temporal Barriers to Public Access Defibrillators Via Optimization. J. Am. Coll. Cardiol. 2016, 68, 836–845. [Google Scholar] [CrossRef]
  18. Lin, B.-C.; Chen, C.-W.; Chen, C.-C.; Kuo, C.-L.; Fan, I.-C.; Ho, C.-K.; Liu, I.-C.; Chan, T.-C. Spatial decision on allocating automated external defibrillators (AED) in communities by multi-criterion two-step floating catchment area (MC2SFCA). Int. J. Health Geogr. 2016, 15, 17. [Google Scholar] [CrossRef] [Green Version]
  19. Chrisinger, B.; Grossestreuer, A.V.; Laguna, M.C.; Griffis, H.M.; Branas, C.C.; Wiebe, U.J.; Merchant, R.M. Characteristics of automated external defibrillator coverage in Philadelphia, PA, based on land use and estimated risk. Resuscitation 2016, 109, 9–15. [Google Scholar] [CrossRef] [Green Version]
  20. Chan, T.C.; Demirtas, D.; Kwon, R.H. Optimizing the Deployment of Public Access Defibrillators. Manag. Sci. 2017, 62, 3617–3635. [Google Scholar] [CrossRef] [Green Version]
  21. Bardy, G.H.; Lee, K.L.; Mark, D.B.; Poole, J.E.; Toff, W.; Tonkin, A.M.; Smith, W.; Dorian, P.; Packer, U.L.; White, R.D.; et al. Home Use of Automated External Defibrillators for Sudden Cardiac Arrest. N. Engl. J. Med. 2008, 358, 1793–1804. [Google Scholar] [CrossRef] [Green Version]
  22. Folke, F.; Gislason, G.H.; Lippert, F.; Nielsen, S.L.; Weeke, P.; Hansen, M.L.; Fosbøl, E.L.; Andersen, S.S.; Rasmussen, S.; Schramm, T.K.; et al. Differences Between Out-of-Hospital Cardiac Arrest in Residential and Public Locations and Implications for Public-Access Defibrillation. Circulation 2010, 122, 623–630. [Google Scholar] [CrossRef] [PubMed] [Green Version]
  23. Hansen, S.M.; Hansen, C.M.; Folke, F.; Rajan, S.; Kragholm, K.; Ejlskov, L.; Gislason, G.; Køber, L.; Gerds, T.A.; Hjortshøj, S.; et al. Bystander Defibrillation for Out-of-Hospital Cardiac Arrest in Public vs Residential Locations. JAMA Cardiol. 2017, 2, 507–514. [Google Scholar] [CrossRef] [PubMed] [Green Version]
  24. Deakin, C.D.; Anfield, S.A.; Hodgetts, G. Underutilisation of public access defibrillation is related to retrieval distance and time-dependent availability. Heart 2018, 104, 1339–1343. [Google Scholar] [CrossRef] [PubMed]
  25. Sondergaard, K.B.; Wissenberg, M.; Gerds, T.A.; Rajan, S.; Karlsson, L.; Kragholm, K.; Pape, M.; Lippert, F.; Gislason, G.; Folke, F.; et al. Bystander cardiopulmonary resuscitation and long-term outcomes in out-of-hospital cardiac arrest according to location of arrest. Eur. Heart J. 2019, 40, 309–318. [Google Scholar] [CrossRef]
  26. Iwami, T.; Hiraide, A.; Nakanishi, N.; Hayashi, Y.; Nishiuchi, T.; Uejima, T.; Morita, H.; Shigemoto, T.; Ikeuchi, H.; Matsusaka, M.; et al. Outcome and characteristics of out-of-hospital cardiac arrest according to location of arrest: A report from a large-scale, population-based study in Osaka, Japan. Resuscitation 2006, 69, 221–228. [Google Scholar] [CrossRef]
  27. Weisfeldt, M.L.; Everson-Stewart, S.; Sitlani, C.; Rea, T.; Aufderheide, T.P.; Atkins, D.L.; Bigham, B.; Brooks, S.; Foerster, C.; Gray, R.; et al. Ventricular Tachyarrhythmias after Cardiac Arrest in Public versus at Home. N. Engl. J. Med. 2011, 364, 313–321. [Google Scholar] [CrossRef] [Green Version]
  28. Sondergaard, K.B.; Hansen, S.M.; Pallisgaard, J.L.; Gerds, T.A.; Wissenberg, M.; Karlsson, L.; Lippert, F.; Gislason, G.H.; Madelaire, C.; Folke, F. Out-of-hospital cardiac arrest: Probability of bystander defibrillation relative to distance to nearest automated external defibrillator. Resuscitation 2018, 124, 138–144. [Google Scholar] [CrossRef] [Green Version]
  29. Giacoppo, D. Impact of bystander-initiated cardiopulmonary resuscitation for out-of-hospital cardiac arrest: Where would you be happy to have a cardiac arrest? Eur. Heart J. 2019, 40, 319–321. [Google Scholar] [CrossRef]
  30. Rea, T. Paradigm shift: Changing public access to all-access defibrillation. Heart 2018, 104, 1311–1312. [Google Scholar] [CrossRef]
  31. Blackwood, J.; Eisenberg, M.; Jorgenson, D.; Nania, J.; Howard, B.; Collins, B.; Connell, P.; Day, T.; Rohrbach, C.; Rea, T.D. Strategy to Address Private Location Cardiac Arrest: A Public Safety Survey. Prehospital Emerg. Care 2018, 22, 784–787. [Google Scholar] [CrossRef]
  32. Open Geospatial Consortium. Glossary of Terms. Available online: https://www.opengeospatial.org/ogc/glossary/g (accessed on 10 August 2020).
  33. Folke, F.; Knudsen Lippert, F.; Nielsen, S.L.; Gislason, G.H.; Hansen, M.L.; Schramm, T.K.; Sorensen, R.; Loldrup Fosbol, E.; Andresen, S.S.; Rasmussen, S.; et al. Location of cardiac arrest in a city centre strategic placement of automated external defibrillators in public locations. Circulation 2009, 120, 510–517. [Google Scholar] [CrossRef] [PubMed]
  34. Chan, T.C.; Li, H.; Lebovic, G.; Tang, S.K.; Chan, J.Y.; Cheng, H.C.; Morrison, L.J.; Brooks, S. Identifying Locations for Public Access Defibrillators Using Mathematical Optimization. Circulation 2013, 127, 1801–1809. [Google Scholar] [CrossRef] [PubMed] [Green Version]
  35. Ringh, M.; Hollenberg, J.; Møller, T.P.; Svensson, L.; Rosenqvist, M.; Lippert, F.; Wissenberg, M.; Hansen, C.M.; Claessen, A.; Viereck, S.; et al. The challenges and possibilities of public access defibrillation. J. Intern. Med. 2018, 283, 238–256. [Google Scholar] [CrossRef] [PubMed]
  36. American Heart Association. Implementing an AED Program, DS13398 5/18. Available online: https://cpr.heart.org/idc/groups/ahaecc-public/@wcm/@ecc/documents/downloadable/ucm_501521.pdf (accessed on 10 August 2020).
  37. Smith, C.M.; Keung, S.N.L.C.; Khan, M.O.; Arvanitis, T.N.; Fothergill, R.; Hartley-Sharpe, C.; Wilson, M.; Perkins, G.D. Barriers and facilitators to public access defibrillation in out-of-hospital cardiac arrest: A systematic review. Eur. Heart J. Qual. Care Clin. Outcomes 2017, 3, 264–273. [Google Scholar] [CrossRef]
  38. Tierney, N.J.; Reinhold, H.; Mira, A.; Weiser, M.; Burkart, R.; Benvenuti, C.; Auricchio, A. Novel relocation methods for automatic external defibrillator improve out-of-hospital cardiac arrest coverage under limited resources. Resuscitation 2018, 125, 83–89. [Google Scholar] [CrossRef] [Green Version]
  39. Sun, C.L.; Karlsson, L.; Torp-Pedersen, C.; Morrison, L.J.; Brooks, S.; Folke, F.; Chan, T.C. In Silico Trial of Optimized Versus Actual Public Defibrillator Locations. J. Am. Coll. Cardiol. 2019, 74, 1557–1567. [Google Scholar] [CrossRef]
  40. Gianquintieri, L.; Caiani, E.G.; Brambilla, P.; Pagliosa, A.; Villa, G.F.; Brovelli, M.A. Open Data in Health-Geomatics: Mapping and Evaluating Publicly Accessible Defibrillators. Isprs Archives 2019, XLII-4/W14, 63–70. [Google Scholar] [CrossRef] [Green Version]
  41. Dicker, B.; Garrett, N.; Wong, S.; McKenzie, H.; McCarthy, J.; Jenkin, G.; Smith, T.; Skinner, J.R.; Pegg, T.; Devlin, G.; et al. Relationship between socioeconomic factors, distribution of public access defibrillators and incidence of out-of-hospital cardiac arrest. Resuscitation 2019, 138, 53–58. [Google Scholar] [CrossRef] [Green Version]
  42. Vercellis, C. Business Intelligence Modelli Matematici e Sistemi per le Decisioni, 1st ed.; McGraw-Hill: Milano, Italy, 2006; pp. 77–79, 83–88. [Google Scholar]
  43. Culley, L.L.; Rea, T.D.; Murray, J.A.; Welles, B.; Fahrenbruch, C.E.; Olsufka, M.; Eisenberg, M.S.; Copass, M.K. Public Access Defibrillation in Out-of-Hospital Cardiac Arrest. Circulation 2004, 109, 1859–1863. [Google Scholar] [CrossRef] [Green Version]
  44. Holmberg, M.; Holmberg, S.; Herlitz, J. Incidence, duration and survival of ventricular fibrillation in out-of-hospital cardiac arrest patients in sweden. Resuscitation 2000, 44, 7–17. [Google Scholar] [CrossRef]
  45. Norris, R.M.; UK Heart Attack Study (UKHAS) Collaborative Group. Circumstances of out of hospital cardiac arrest in patients with ischaemic heart disease. Heart 2005, 91, 1537–1540. [Google Scholar] [CrossRef] [PubMed] [Green Version]
  46. Nehme, Z.; Andrew, E.; Bernard, S.; Patsamanis, H.; Cameron, P.; Bray, J.; Meredith, I.T.; Smith, K. Impact of a public awareness campaign on out-of-hospital cardiac arrest incidence and mortality rates. Eur. Heart J. 2017, 38, 1666–1673. [Google Scholar] [CrossRef] [PubMed]
  47. Nordberg, P.; Hollenberg, J.; Rosenqvist, M.; Herlitz, J.; Jonsson, M.; Järnbert-Petterson, H.; Forsberg, S.; Dahlqvist, T.; Ringh, M.; Svensson, L. The implementation of a dual dispatch system in out-of-hospital cardiac arrest is associated with improved short and long term survival. Eur. Heart J. Acute Cardiovasc. Care 2014, 3, 293–303. [Google Scholar] [CrossRef] [PubMed]
  48. Pijls, R.W.; Nelemans, P.J.; Rahel, B.M.; Gorgels, A.P. Factors modifying performance of a novel citizen text message alert system in improving survival of out-of-hospital cardiac arrest. Eur. Heart J. Acute Cardiovasc. Care 2018, 7, 397–404. [Google Scholar] [CrossRef] [PubMed]
  49. Caputo, M.L.; Muschietti, S.; Burkart, R.; Benvenuti, C.; Conte, G.; Regoli, F.; Mauri, R.; Klersy, C.; Moccetti, T.; Auricchio, A.; et al. Lay persons alerted by mobile application system initiate earlier cardio-pulmonary resuscitation: A comparison with SMS-based system notification. Resuscitation 2018, 114, 73–78. [Google Scholar] [CrossRef] [Green Version]
Figure 1. Distribution of georeferenced Out-Of-Hospital Cardiac Arrests (OHCAs), over the territory of the city of Milan from 2015 to 2018, that occurred at residential location (left panel) and outside of residential locations (right panel).
Ijgi 09 00491 g001
Figure 2. Schematic representation of the proposed framework, with data sources highlighted in the gray box. See text for further details.
Ijgi 09 00491 g002
Figure 3. Schematization of the implementation of the geographic risk function. Panel A: The purely geographic risk estimator (scaled in the range 0 to 1) is computed for each 200 × 200 m cell in which the city territory was divided. Panel B: Number of estimated residents for each cell. Panel C: Their product, where the geographic risk estimator was applied as a weight, providing a final risk function estimating Out-of-Hospital Cardiac Arrest (OHCA) occurrence probability (scaled in the range 0 to 1).
Ijgi 09 00491 g003
Figure 4. A zoomed portion of the city of Milan, with the position of each Automated External Defibrillator (AED, yellow stars) and its realistic catchment area, and the position of each residential Out-of-Hospital Cardiac Arrest (OHCA) in the period 2015–2018 (black dot).
Ijgi 09 00491 g004
Figure 5. Example of the graphical representation of the output of the optimization strategy. Among currently available Automated External Defibrillators (AEDs), those that should be re-displaced (orange catchment areas) or not (blue catchment areas) are indicated, while the cells where the installation of a new device is suggested are depicted in green.
Ijgi 09 00491 g005
Table 1. Results of performance analysis of the initial distribution of Automated External Defibrillators (AEDs). Out-of-Hospital Cardiac Arrest (OHCA) coverage values are reported separately for residential events (‘Home’), non-residential ones (‘Out’) and aggregated (‘Tot’, enlightened in bold).
TerritoryCoverage on Milan City Area (%)Overlapping (%)Overlapped Coverage on Milan City Area (%)
23.14%39.28%9.09%
PopulationCovered Population (%)Percentage of Covered Population in OverlapTotal Population in Overlap (%)
40.02%40.3%16.13%
OHCAs2015–20162017–2018Overall (2015–2018)
CoverageHomeOutTotHomeOutTotHomeOutTot
#138722216091527269179629144913405
% on Total39.56%47.54%40.5%41.57%53.16%42.98%40.59%50.46%41.77%
# in overlapping48411359755914970810432621305
% in overl. on cov34.9%50.9%37.1%36.61%55.39%39.42%35.79%53.36%38.33%
% in overl. on tot13.8%24.2%15.03%15.22%29.45%16.94%14.53%26.93%16.01%
Table 2. Detailed results of performance analysis where a model-based distribution of the same number of Automated External Defibrillators (AEDs) that are currently deployed is simulated.
CoveragesOHCAs
(Home, Outside)
Geographic Risk FunctionAreaResident PopulationCost-Efficiency Parameter CE
Current deployment41.77%
(40.59%, 50.46%)
39.51%23.14%40.02%16.69%
Model-based simulated deployment
(% Δ)
73.33% (+31.56%)
(75.65%, 56.22%)
(+35.06%, +5.76%)
65.27%
(+25.76%)
29.07%
(+5.93%)
70.15%
(+30.13%)
29.3%
(+12.61%)
Table 3. Detailed results of performance analysis of the simulated scenarios for new distributions of Automated External Defibrillators (AEDs); signed values within brackets represent the delta in respect to the corresponding value in the current placement (first column).
Current PlacementDisplacements Only100 New AEDsRisk Coverage DoublingBudget Doubling
Final AEDs N°10011001
(=)
1101
(+100)
1396
(+295)
1943
(+942)
N° of re-displaced AEDs (%)/373
(37.26%)
366
(36.56%)
357
(35.66%)
293
(29.27%)
Total Cost (€)
(% of initial estimated investment)
2,502,500186,500
(7.45%)
433,000
(17.3%)
916,000
(36.6%)
2,501,500
(99.96%)
Covered Risk39.51%64.52%
(+25.01%)
69.96%
(+30.45%)
79.03%
(+39.52%)
98.79%
(+59.28%)
Covered Area23.14%17.94%
(-5.2%)
19.98%
(-3.16%)
23.91%
(+0.77%)
36.43%
(+13.29%)
Covered Resident Population40.02%59.49%
(+19.47%)
64.08%
(+24.06%)
71.66%
(+31.64%)
88.75%
(+48.73%)
Covered home OHCAs
2015–2016
39.56%65.43%
(+25.87%)
69.91%
(+30.35%)
76.41%
(+36.85%)
89.45%
(+49.89%)
Covered home OHCAs
2017–2018
41.57%64.69%
(+23.12%)
68.69%
(+27.12%)
74.93%
(+33.36%)
89.14%
(+47.57%)
Covered home OHCAs
2015–2018
40.59%65.05%
(+24.46%)
69.29%
(+28.7%)
75.65%
(+35.06%)
89.29%
(+48.7%)
Covered outside OHCAs
2015–2018
50.46%63.21%
(+12.75%)
65.15%
(+14.69%)
69.37%
(+18.91%)
78.52%
(+28.06%)
Total Covered OHCAs
2015–2018
41.77%64.83%
(+23.06%)
68.79%
(+27.02%)
74.9%
(+33.13%)
88%
(+46.23%)
Cost-efficiency
(% coverage improvement over baseline/M€)
16.69%123.65%
(+106.96%)
62.4%
(+45.71%)
36.17%
(+19.48%)
18.47%
(+16.78%)

