
Modeling the Impact of Future Climate Change Impacts on Rainfed Durum Wheat Production in Algeria


1
Hall de Technologie-Kharrouba, Ecole Supérieure d’Agronomie de Mostaganem, Mostaganem 27000, Algeria
2
Division Bioclimatologie et de l’Hydraulique Agricole, Station Mehdi Boualem, Baraki, Institut National de Recherche Agronomique, Algiers 16000, Algeria
3
Faculty of Social and Human Sciences, Khemis Miliana University, Miliana 44000, Algeria
*
Author to whom correspondence should be addressed.
Climate 2022, 10(4), 50; https://0-doi-org.brum.beds.ac.uk/10.3390/cli10040050
Submission received: 1 February 2022
/
Revised: 17 March 2022
/
Accepted: 18 March 2022
/
Published: 23 March 2022
(This article belongs to the Special Issue Climate Change and Food Insecurity)
Abstract
:The predicted climate change threatens food security in the coming years in Algeria. So, this study aims to assess the impact of future climate change on a key crop in Algeria which is rainfed durum wheat. We investigate the impact of climate change on rainfed durum wheat cultivar called Mexicali using AquaCrop crop model and the EURO-CORDEX climate projections downscaled with the ICHEC_KNMI model under RCP 4.5 and RCP 8.5. A delta method was applied to correct the incertitudes present in the raw climate projections of two experimental sites located in Sétif and Bordj Bou Arreridj (BBA)’s Eastern High plains of Algeria (EHPs). AquaCrop was validated with a good precision (RMSE = 0.41 tha−1) to simulate Mexicali cultivar yields. In 2035–2064, it is expected at both sites: an average wheat grain yield enhances of +49% and +105% under RCP 4.5 and RCP 8.5, respectively, compared to the average yield of the baseline period (1981–2010), estimated at 29 qha−1. In both sites, in 2035–2064, under RCP 4.5 and RCP 8.5, the CO2 concentrations elevation has a fertilizing effect on rainfed wheat yield. This effect compensates for the negative impacts induced by the temperatures increase and decline in precipitation and net solar radiation. An increase in wheat water productivity is predicted under both RCPs scenarios. That is due to the water loss drop induced by the shortening of the wheat-growing cycle length by the effect of temperatures increase. In 2035–2064, early sowing in mid-September and October will lead to wheat yields improvement, as it will allow the wheat plant to benefit from the precipitations increase through the fall season. Thus, this early sowing will ensure a well vegetative development and will allow the wheat’s flowering and grain filling before the spring warming period.
1. Introduction
Non-climatic stressors (e.g., demographic and income growth, demand for animal products) and climate change (CC) influence the food system. These climatic and non-climatic stressors have an effect on the four pillars of food security (availability, access, use, and stability) [1]. From the beginning of the 1990s, the Intergovernmental Panel on Climate Change (IPCC), showed that over the period from 1850 to 2012, the global average temperature had experienced warming of 0.78 °C. This global warmingcould be induced by the change in the carbon dioxide (CO2) concentration in the atmosphere from 278 ppm to 379 ppm. The prediction for the end of the 21st century is a global warming that will range between 1.5 °C and 2 °C [2]. In Africa, in recent decades, temperatures have increased at a rate somewhat faster than the global average temperature. Thus, the 2019 year was identified as one of the three warmest years on this continent [3]. CC is a consequence of global warming, which has adverse effects on fluctuations in annual total precipitations, average temperature, global increase in atmospheric CO2, and sea-level rise. These are some of the major manifestations of CC, which have direct and indirect socio-economic negative impacts on plant development and crop yield (reduction in crop yields by up to 70%) ([4,5]). In general, crop yields will increase in cold areas where low temperature currently limits crop growth. However, heat stress on crops and water scarcity will lead to a decline in yields in warm environments. Warm temperatures and precipitation variability associated with a high frequency of extreme climate events (e.g., droughts, floods, heat waves, etc.) have worsened food insecurity in several regions of the world, especially in Africa ([3,6]). Information related to climate impacts on crops is important for understanding their macroeconomic implications for food security. This climate information allows us to choose e the appropriate adaptation strategies supported by knowledge of the processes that lead to changes in yield, under average and extreme weather conditions [7]. Identifying the drivers of changes and variability in yields can enable the development of targeted adaptation measures such as: (i) insurance solutions against specific weather [8], (ii) support the planning of long-term investments in irrigation infrastructure [9], or (iii) improve reproductive efficiency as the suitability of adaptive traits changes with CC and elevated CO2 concentrations in the atmosphere [10].
In Algeria, 50% of non-irrigated agricultural lands are cultivated with cereals, especially durum wheat, with a low national average grain yield estimated at 17 qha−1 (2000–2020 period). However, these lands are mainly located in the High Plains region, known for its semi-arid climate [11]. Moreover, the decrease in the national production of meat and milk had affected their prices and caused an increase in demand for cereal products. The last are characterized by their subvention prices by the government, especially wheat, which is considered as the main source of protein in the diet of Algerian people [12]. Thus, Algeria meets its national needs for durum wheat with massive imports, with an average annual bill of $1 billion. These food bills are paid, thanks to oil rent [11].
It is projected in Algeria by the future horizon 2030: (i) an increase in temperatures of +0.9 to +1.3 °C and their variability, (ii) an intensification of the frequency of heat waves, and (iii) an accentuation of the variability of precipitations, which will result in an increase in dry and wet episodes by +10% and will be accompanied by a decrease in precipitation of −9 up to −14% [13]. In the future decades, the harmful impacts of the above projected CC will manifest themselves above all else by the increase in the frequency and severity of droughts. This projected drought will threaten crop production, mainly rainfed crops yields, such as durum wheat. Thus, by the future, under the projected CC, the demographic surge will lead to an increase in national wheat needs. Thus, with the fall in oil prices, the satisfaction of national demand for wheat could become a real concern to economic balance and food security in Algeria [14].
Given the importance of wheat in human nutrition and global trade, many studies (e.g., [15,16,17]) are carried out across the world to assess the impact of CC on wheat yield. These studies used crop models and the Representative Concentrations Pathway scenarios (RCPs) [18]. The results of the above studies could not apply directly in Algeria. Because the CC’s impacts on wheat production are specific to each region in the world according to its local climate and to its financial and technical capacity to face the CC impacts. According to [19], in Algeria, the negative impacts of CC on water resources were assessed with the UKHI model (United Kingdom Meteorological Office High Resolution). This assessment study carried out by seasonal climate forecasting showed a decrease in the rainiest area and an increase in the driest ones in Algeria. So, the rainfed crop is very vulnerable to future climate change. As a consequence of the above-cited projected CC in Algeria, a decline in crop yields by −10 to −30% was predicted by 2030 [20]. Despite the strategic role of rainfed wheat in national food security and its high level of vulnerability to the projected CC, the studies of CC assessment impacts on wheat production, using crop models and associated with RCPs scenarios, are very rare in Algeria. With the exception of the study carried out by Rouabhi et al. [21], who used a statistical model to predict durum wheat yields under RCP 2.6 and RCP 8.5, in 2070, at the Setif region. So, the main aim of this research is to improve the available knowledge related to the future CC negative impacts on rainfed wheat in Algeria. This study could help the farmers better understand the CC issue and its impacts on wheat. This study could help the farmers to choose more resilient and CC-adapted agricultural practices in the future. Furthermore, these kinds of studies will be important to the agricultural stakeholders in preparing adapted policies which will accompany the farmers in their quest to prevent wheat yields losses induced by CC. Thus, these types of studies are very important in preparing a national strategy to adapt rainfed wheat against the projected CC negative impacts. This could help them to protect the national economic balance from the potential negative impacts of food insecurity induced by low national wheat production.
2. Materials and Methods
2.1. Study Area
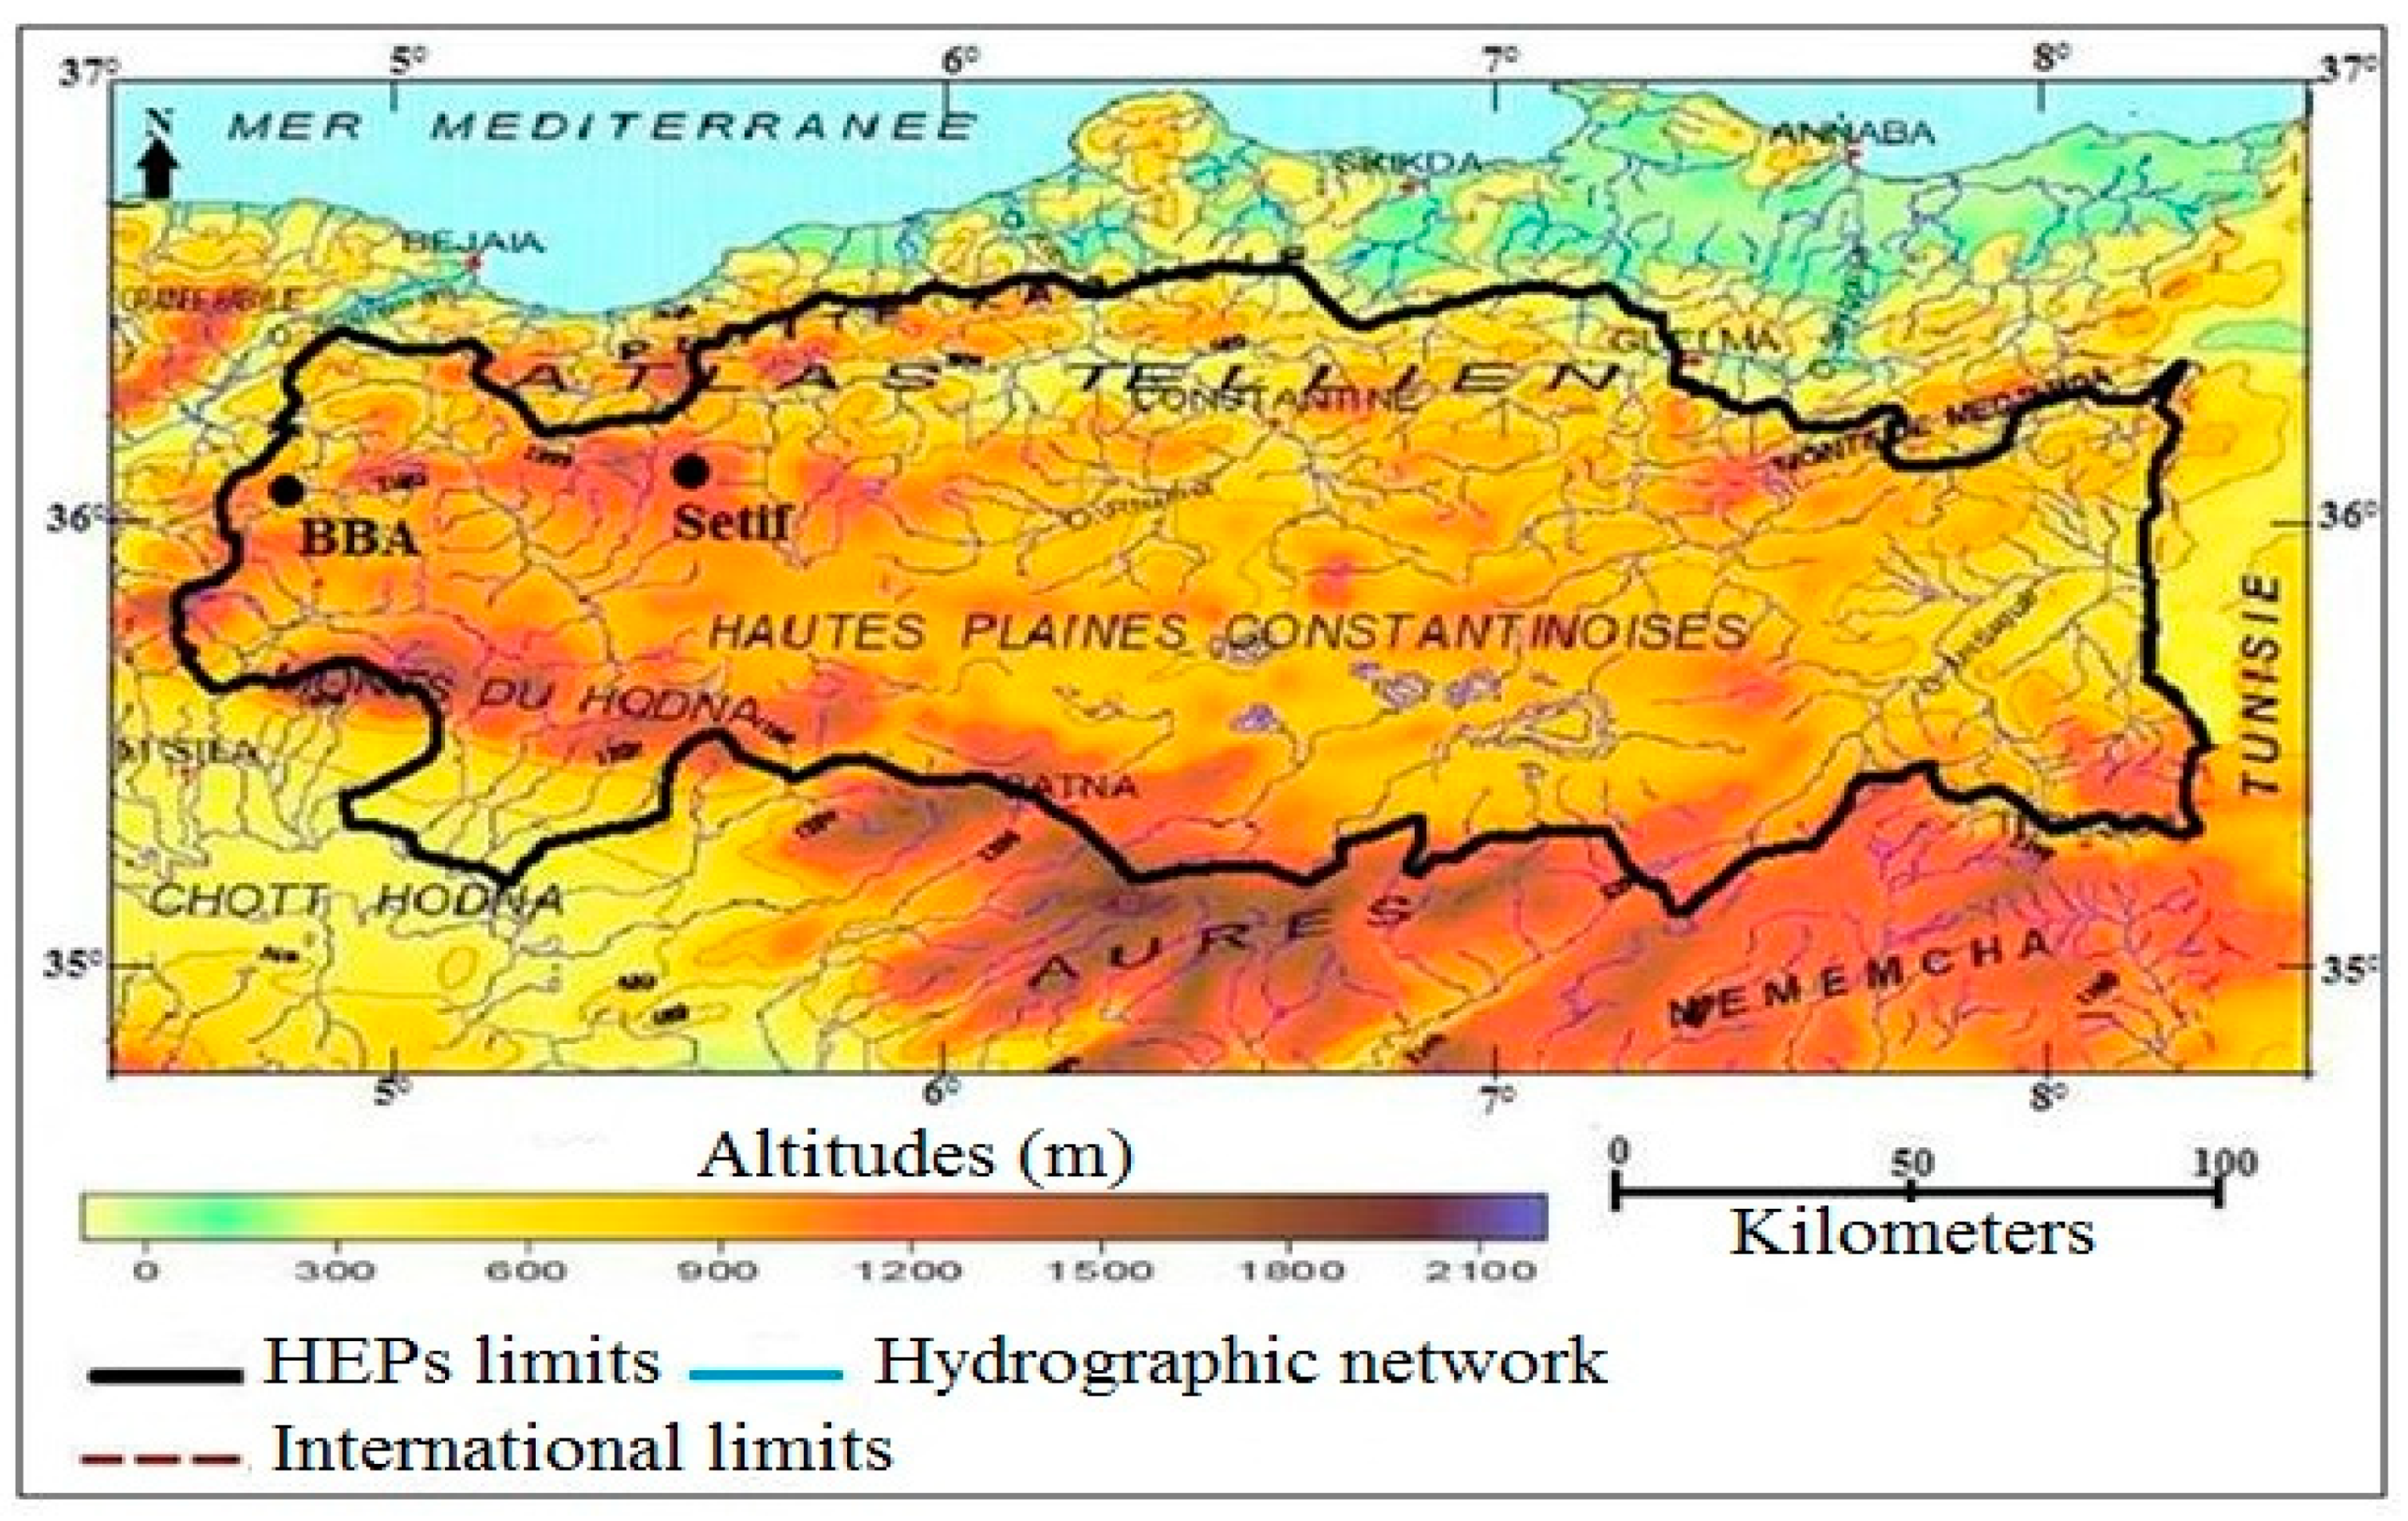
The High Eastern plains of Algeria (HEPs) of Algeria are located in the Northeast of the country between the latitudes 35–36.5° N and longitudes 4.5–8.3° E (Figure 1). The HEPs are characterized by altitudes that vary between 900 and 1200 m. The HEPs are limited to the North and West by the eastern part of Tellian Atlas mountain ranges, to the South by the salt lake called Chott Hodna and the eastern part of the Saharan Atlas mountain ranges, and to the East by Tunisia [22]. In this research, the study of the CC impacts on wheat yield at the level of the semi-arid HEPs is established at two experimental sites. The last are located in two wilayas (or departments) called Sétif and Bordj Bou Arreridj (BBA), regions known for the practice of rainfed durum wheat production. According to the precipitation map established by the National Agency of Water Resources in 1993, the annual average precipitation in the HEPs can reach 500 mm in the North and decrease up to 300 mm in the South and can even reach less than 200 mm in the salt lakes areas. During the period 1995–2009, in the HEPs, the Tmax ranges between 32 and 37 °C, while the Tmin varies between 0 and 5 °C [23]. The HEPs are more exposed to sunshine radiation thanks to the continental climate and high altitude. This topography made the HEPs well suited to rainfed cereal crops. However, the high variability of annual total precipitation results in extremely variable yields from year to year. The choice of the location of both sites of Sétif and BBA for this study is justified by the availability of soil and climate data, and the availability of phenological data for a cultivar of durum wheat called “Mexicali” at the Setif site.
2.2. Observed Baseline and Projected Future Climate Data
The daily climate data: Tmax and Tmin (in °C), precipitations (P in mm), wind speed (V in m/s), relative humidity (Hr in %) and sunshine duration (S in hours), observed during the baseline (or reference) period (BP) 1981–2010 are collected from the professional Meteorological stations The last belong to the National Meteorological Office (ONM) of Setif and BBA. The Setif station is located in the Soummam watershed, and the BBA station is located in the Hodna watershed; the geographic coordinates and elevation of these two stations are shown in Table 1.
The global simulated future climate data of P, Tmax, Tmin, net sunshine radiation (Nr), Hr, and V used in this study, comes from the Coordinated Regional Climate Downscaling (CORDEX) experiment, Europe domain. It must be mentioned that these data were downloadable from the website https://euro-cordex.net/060378/index.php.en (accessed on 5 January 2022). They are simulated under the RCPs scenarios: RCP 4.5 and RCP 8.5 during the future period 2035–2064. The RCPs are four greenhouse gas concentration trajectories adopted by the IPCC on its Fifth Assessment Report (AR5). The numerical values of the RCPs (2.6, 4.5, 6.0, and 8.5 W m−2, respectively) refer to radiative forcing in 2100 [24,25]. These projected radiative forcings are estimated based on the forcing of greenhouse gases, mainly CO2 and other forcing agents. The above four selected RCPs were considered to be representative of the literature and included one mitigation scenario leading to a very low forcing level (RCP2.6), two medium stabilization scenarios (RCP4.5 and RCP6), and one very high greenhouse emission scenario(RCP8.5), induced by a massive use of fossil energy and a high change in land use [26]. Generally, in CC impact studies, the RCP 4.5 and RCP 8.5 are used.
Then, to obtain the local future climate data projected for Setif and BBA meteorological stations, the above projected global climate data were downscaled by applying a dynamic downscaling method on a grid with a very fine resolution of 0.11° (~11 km). This downscaling is performed by the use of a Regional Circulation Model (RCM) called KNMI forced by a Global Circulation Model (GCM) called ICHEC. The choice of this combination GCM/RCM: ICHEC_KNMI is justified by its best simulation of climate data observed during the BP in Algeria [27]. Then, the climate data simulation errors (or bias) present in the raw downscaled future climate data of Setif and BBA stations are corrected using the delta method [28]. According to these last authors, the basic principle of this method is the addition and/or the multiplication of the anomalies of the simulated future climate data to the daily observed climate data during the BP at Setif and BBA, as indicated with Equations (1) and (2).
where (d) and (d) are the daily bias-corrected future temperature and precipitation, (d) and (d) are the daily observed temperature and precipitation during the BP, (d)) and (d)) are the monthly averages of daily raw future temperature and precipitation, and (d)) and are the monthly averages of daily temperature and precipitation simulated for the BP, respectively.
The bias-correction methods such as the quantile mapping method widely used in hydrological impact studies can be difficult to validate in semi-arid climates. This is due to the limited number of rainy days, especially during summer. Moreover, the high variability of precipitations year to year, which is an atypical characteristic of the Mediterranean climate, made the quantile mapping method not easy to use in the HEPs of Algeria [29]. In contrast, the delta method did not rely on the stationary assumption of model bias and did not modify the results of the climate model [30]. Therefore, it can be considered more robust and should be preferred in cases where other approaches cannot be satisfactorily validated. Thus, these precedents results justify the choice of the deltas method for the correction of the uncertainties of the future climatic data simulated by the ICHEC_KNMI climate model in this study. Thus, the two future CC scenarios, Sc1 and Sc2, which refer to the scenarios: RCP 4.5 in 2035–2064 and RCP 8.5 in 2035–2064, respectively, are evaluated in this study.
2.3. The Aquacrop Model
2.3.1. AquaCrop Model Description
AquaCrop is a crop water productivity model developed by FAO’s Land and Water Division in Rome, Italy. This crop model was created to address food security issues and assess the effect of environment and field water management on agricultural production (www.fao.org/aquacrop/overview/en/, accessed on 15 January 2022). This model simulates the response of herbaceous crop yields to water. It is particularly well suited to conditions in which water is a limiting factor in agricultural production [31]. AquaCrop combines precision, simplicity, and robustness; it is widely used around the world given the limited number of inputs required for its simulation process [32]. AquaCrop can also simulate crop growth under CC scenarios by taking into consideration different CO2 concentrations scenarios. However, AquaCrop does not take into account the negative impacts of pests, diseases, and weeds on yields [33].
2.3.2. AquaCrop Model Input Data
Observed Historical Climatic Data and Projected Future
To simulate the durum wheat’s grain yield for the BP (1981–2010) with the AquaCrop crop model for the experimental sites of BBA and Setif, it is necessary to introduce into this model the daily climate data of Tmin, Tmax, and P. These data were observed during the BP at the professional meteorological stations of Setif and BBA as it is necessary to introduce into the AquaCrop model, the daily data of the reference evapotranspiration (ET0). This last was calculated in advance by the ET0 calculator software according to the Penman–Monteith equation [34]. The CO2 concentration is also required by AquaCrop to simulate durum wheat grain yield. Thus, the global annual averages of CO2 concentrations from the Mauna Loa observatory in Hawaii are attached to the AquaCrop package, so they are used to simulate durum wheat yields. The same method was applied to simulate durum wheat’s future yields in 2035–2064, under RCP 4.5 and RCP 8.5, using the corrected daily climate data simulated by the ICHEC-KNMI climate model for the future horizon 2035–2064, under both RCPs scenarios.
Soil Data
The values of Setif and BBA experimental site’s soil organic matter, clay, and sand content, obtained by laboratory analysis, were introduced into the SPAW model [35].Thus, this last, in turn, simulates the permanent wilting point (PWP), the field capacity (FC), the total quantity of available water contained in the soil (TAW), and saturated hydraulic conductivity (SAT). The values of PWP, FC, and SAT are simulated by the SPAW model by applying a pedotransfer function. These four soil parameters are essential for the AquaCrop model run [36].
2.3.3. AquaCrop Model Calibration and Validation
Before using the AquaCrop crop model to simulate grain yields of a local durum wheat cultivar called “Mexicali” in the future horizon 2035–2064 (under RCP 4.5 and RCP 8.5). This crop model was first calibrated using Mexicali cultivar phenological data, observed by [37] at a field test during the 2010/2011 agricultural campaign at the experimental farm of Sétif (belonging to the National Institute of Agronomic Research). This farm is located at 36.15° N latitude and 5.37° E longitude, and at an altitude of 970 m. In order to calibrate AquaCrop, according to the climatological conditions of this above Setif experimental site, the daily climate data (Tmax, Tmin and P) observed during the growing season 2010/2011, the daily ET0 data throughout this growing season, calculated using ET0 calculator, and also the soil data (PWP, FC, SAT and soil horizon deeps) are injected into this model.
The durum wheat’s non-conservative parameters in the AquaCrop model are given in Table 2, such as: the sowing density, the length (in days) of the stages of emergence, maximum leaf expansion, maximum roots depth, flowering, seed formation, and the maturity observed during the (2010/2011) growing season, are also introduced into the AquaCrop model. Then, the last was validated with the values of the Mexicali cultivar’s final grain yields and above-ground biomass, observed throughout the experimentations, carried out by [37], during the period of the three growing seasons: (2010/2011), (2011/2012) and (2012/2013), at the Setif experimental farm.
Finally, the values of the Mexicali cultivar’s non-conservative parameters in AquaCrop are calibrated several times in order to obtain values of simulated Mexicali cultivargrain yield and final above-ground biomass, close to those observed by [37] during these above three experimentation growing seasons. Thus, the final values of the Mexicali cultivar‘s non-conservative (indicated in Table 2) and conservative parameters are applied in all simulation scenarios on AquaCrop.
2.4. Statistical Correlation between Durum Wheat Grain Yields and Growing Season Length with Temperature, Rainfall and Net Solar Radiation Changes
In order to detect any possible sensitivity of durum wheat grain yield to the projected future CC, the Pearson correlation test [38] was applied between the time series of 30 years of the Mexicali cultivar grain yields, simulated by AquaCrop for the Sc1, Sc2, and BP scenarios, with the time series of 30 years of the averages seasonal: mean temperatures (TS), cumulative precipitation (PS) and net incident solar radiation (NrS) projected under both the future CC scenarios and those recorded during BP. Furthermore, this test was applied between the time series of 30 years of the growing season length (GSL) of Mexicali cultivar simulated by AquaCrop for the Sc1, Sc2, and BP scenarios, with the time series of 30 years of TS, PS, and NrS, simulated by the ICHEC-KNMI climate model under the last three scenarios. Thus, this test allowed r to detect the impact of TS, PS, and NrS changes on the GSL. The season considered in this study is the period coinciding with the Mexicali cultivargrowing cycle.
3. Results
3.1. Assessment of the Quality of the Simulated Climate Data for the Baseline Period
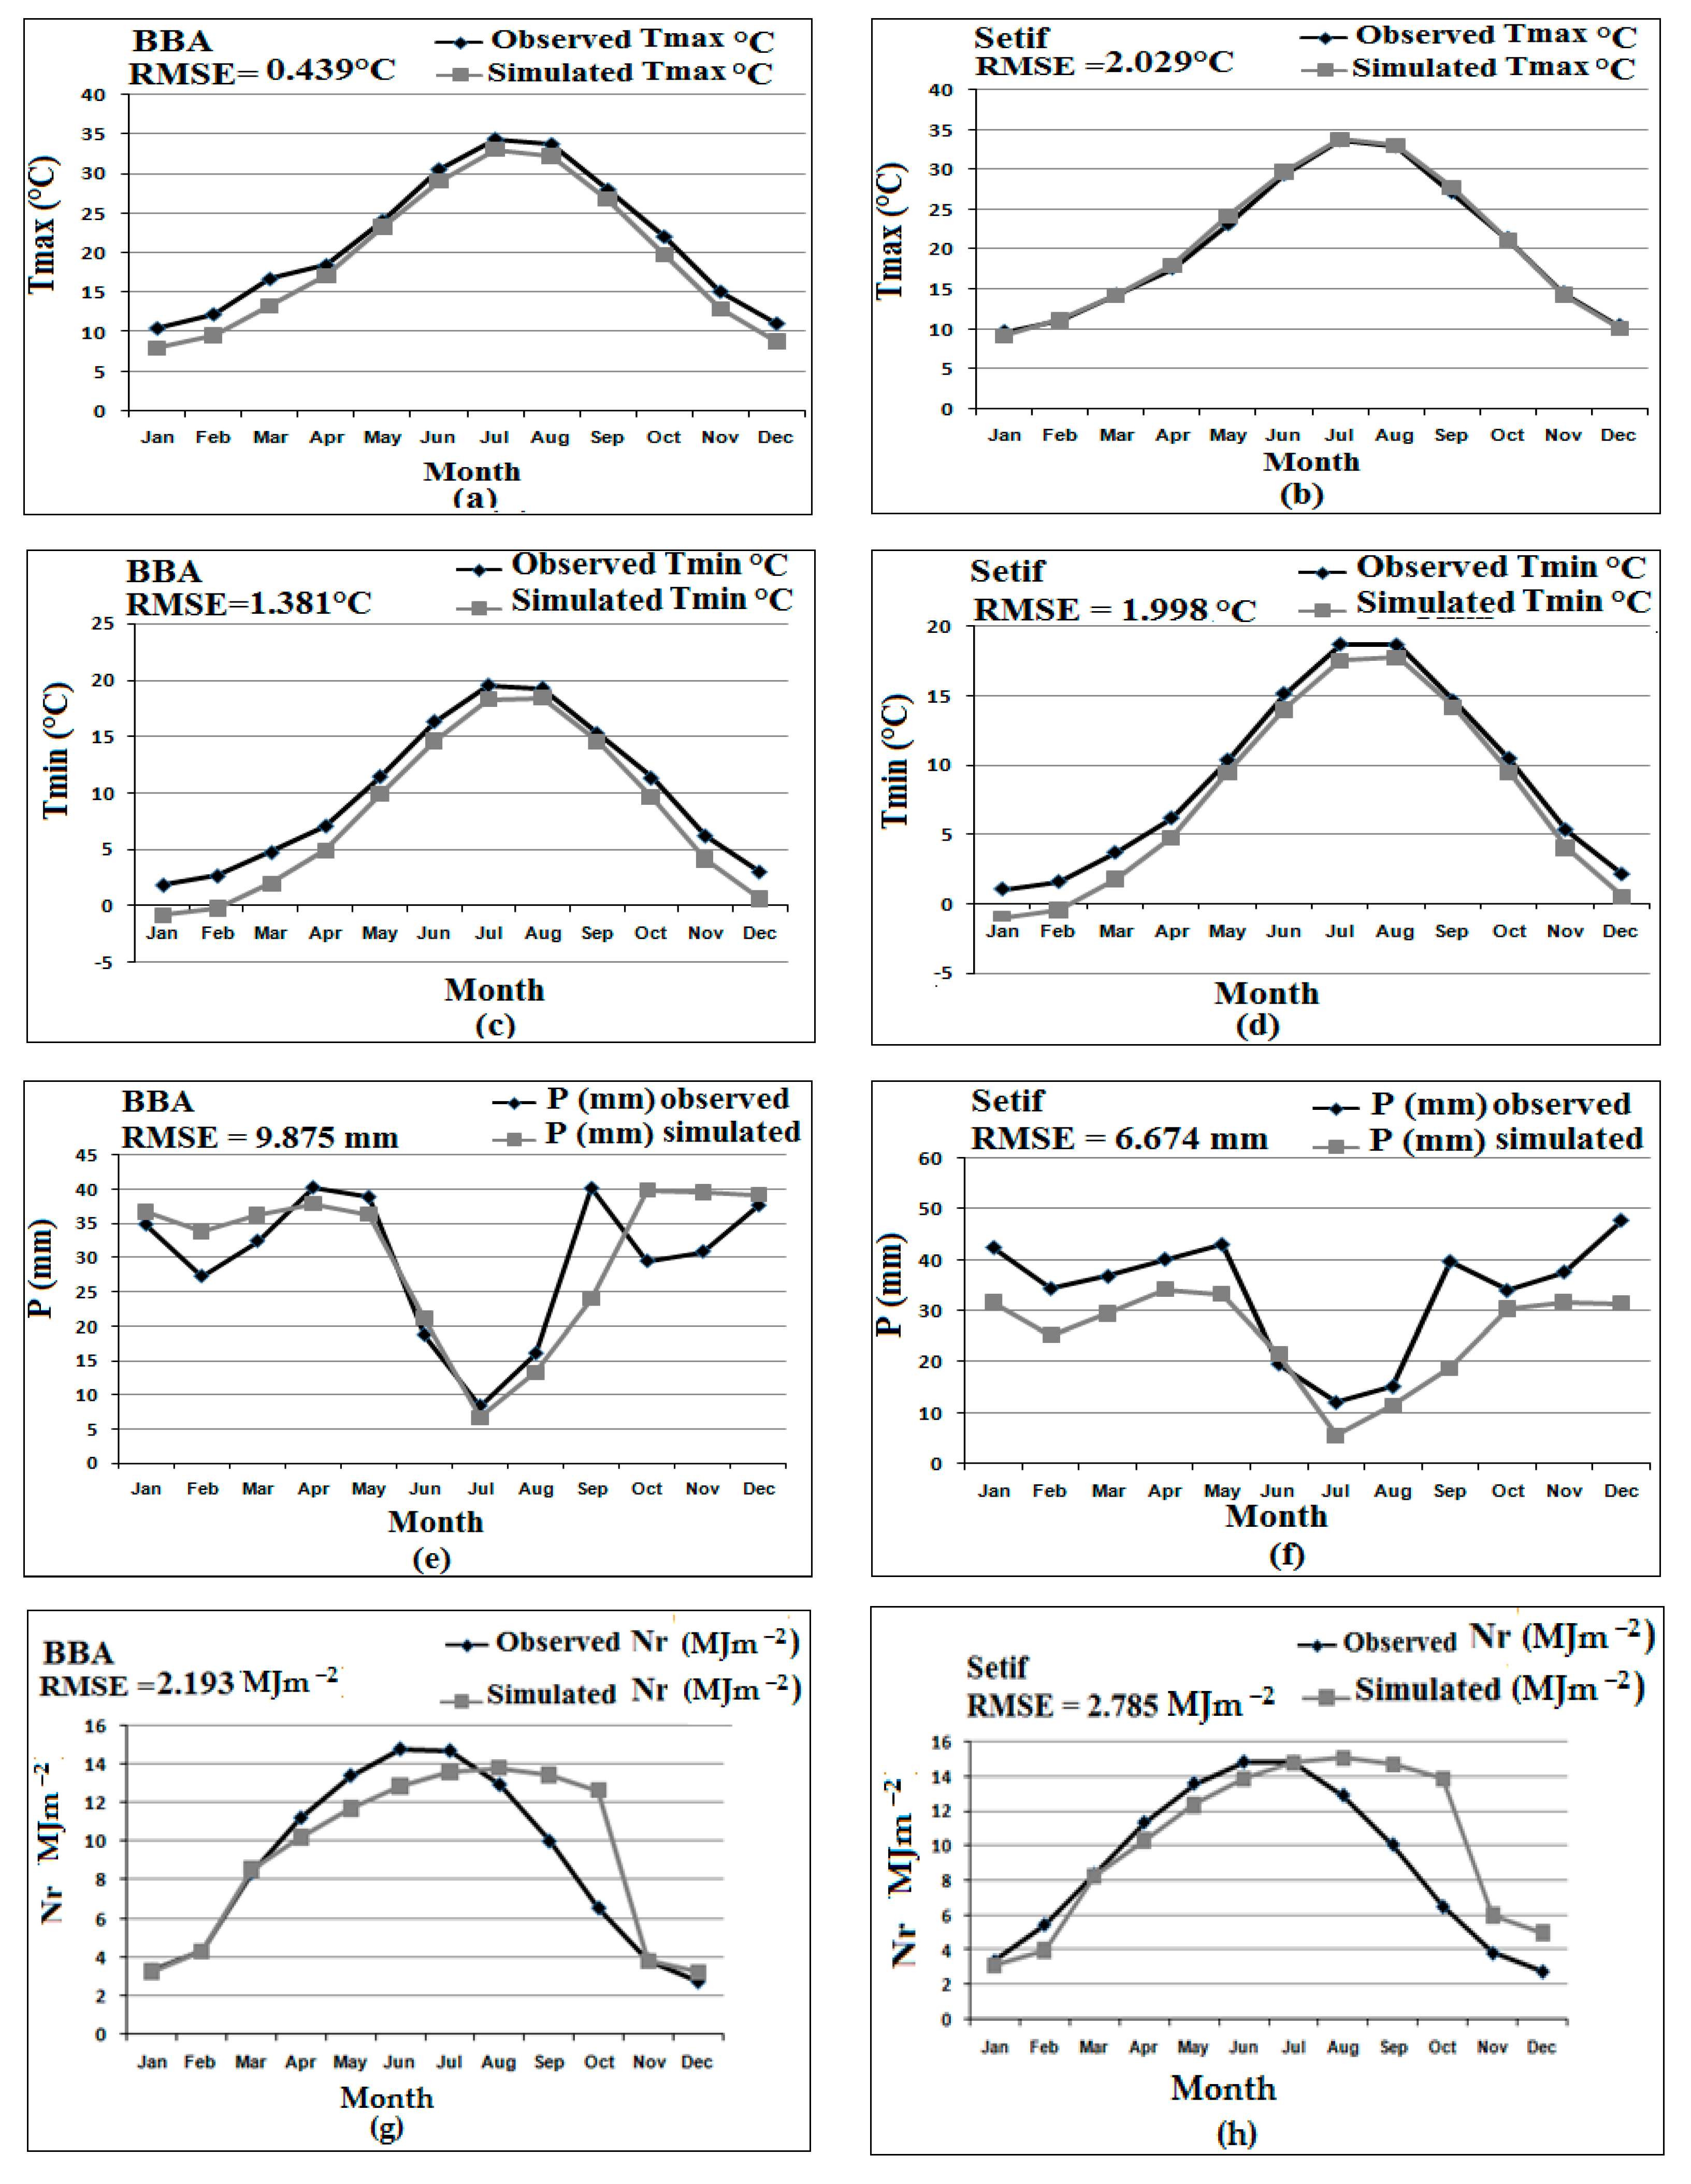
The monthly averages of P (mm), Tmax and Tmin (°C), and Nr (MJm−2) were recorded on the two meteorological stations of BBA and Setif departments, during the BP (1981–2010) are indicated in Figure 2. These recorded monthly averages are compared with those simulated by the climate model ICHEC_KNMI for this same BP. Additionally, in Figure 2, the RMSE values for each of the above four climate parameters are indicated. Thus, for the BBA station, Tmax, Tmin, and Nr are simulated with great precision as shown by the low values of their respective RMSE 1.998 °C, 2.029 °C, and 2.193 MJm−2, (Figure 2a,c,g). However, the P were simulated with less precision (RMSE = 6.674 mm), as indicated in Figure 2e. Thus, for the months of the period from October to March, the simulated P are overestimated. However, the simulated P for the months April to September are underestimated compared to the P recorded on the BBA station during the BP. Figure 2b,d,h show that Tmax, Tmin, and Nr, respectively, at the Sétif station, are simulated with good precision as indicated by the low values of their respective RMSEs (0.439 °C, 1.381 °C, and 2.785 MJm−2). However, the P simulated with relatively lower accuracy as shown in Figure 2f and the relatively higher RMSE value (9.875 mm).
3.2. Projected Climate during the Mexicali Cultivar Growing Season
In Table 3, in order to detect the impact of future CC on Mexicali cultivar’s LGS, the thirty years average of the last simulated by AquaCrop for the BP are compared to those simulated under Sc1 and Sc2 by this crop model. Furthermore, in Table 3, the thirty years average of TS (°C), PS (mm), NrS (M J m−2) recorded during the BP are compared to thosesimulated by the ICHEC_KNMI model under Sc1 and Sc2 at the Setif and BBA stations. This comparison aims to detect any relationship between LGS and CC.
By taking into account that the Mexicali cultivar sowing date is fixed on 28 November in AquaCrop. For the BP, Sc1, and Sc2 scenarios. At Setif, the average Ts during the BP is 10.3 °C. Thus, the ICHEC_KNMI model predicted an increase in TS by +3.5 and its decrease by −0.3 °C under Sc1 and Sc2 scenarios, respectively. At BBA, this climate model predicted the same TS trend predicted at Setif, so an increase in TS by +4.5 and its decline by −0.1 °C are projected under Sc1 and Sc2, respectively. According to these results, the TS elevation is more pronounced under Sc1 than under Sc2 at both stations Setif and BBA. This last result could be attributed to the fact that under RCP 4.5, the TS increase is accentuated during the months coinciding with the Mexicali cultivar growing season (especially during March and April). Meanwhile, under RCP 8.5, the TS increase will be more accentuated during the summer and autumn (period from June to October), so it does not coincide with the Mexicali cultivar growing season. During the BP, the PS average at Setifstation is 263.1 mm, so a decline of −18.8 mm (−7.1%), and an increase of 65.6 mm (+24.9%) are projected under Sc1 and Sc2, respectively. At BBA, the ICHEC-KNMI model predicted the same trend of PS projected at Setifbut with a more accentuated degree. Thus, a decrease in PS of −67.1 mm (−31%) and its increase of +64.3 mm (+29.2%) are predicted by this climate model under Sc1 and Sc2, respectively.
The averages NrS observed during the BP are 1059 and 1058 MJm−2 at the Setif and BBA stations, respectively. They are projected to drop by −347 MJm−2 (−32.8%) and −590 MJm−2 (−55.7%) under Sc1, and by −136.8 MJm−2 (−12.9%) and −42.4 MJm−2 (−4%) under Sc2 scenario at Setif and BBA, respectively.
3.3. Evaluation of AquaCrop Model Performance in Simulation Wheat Grain Yield and Above-Ground Biomass
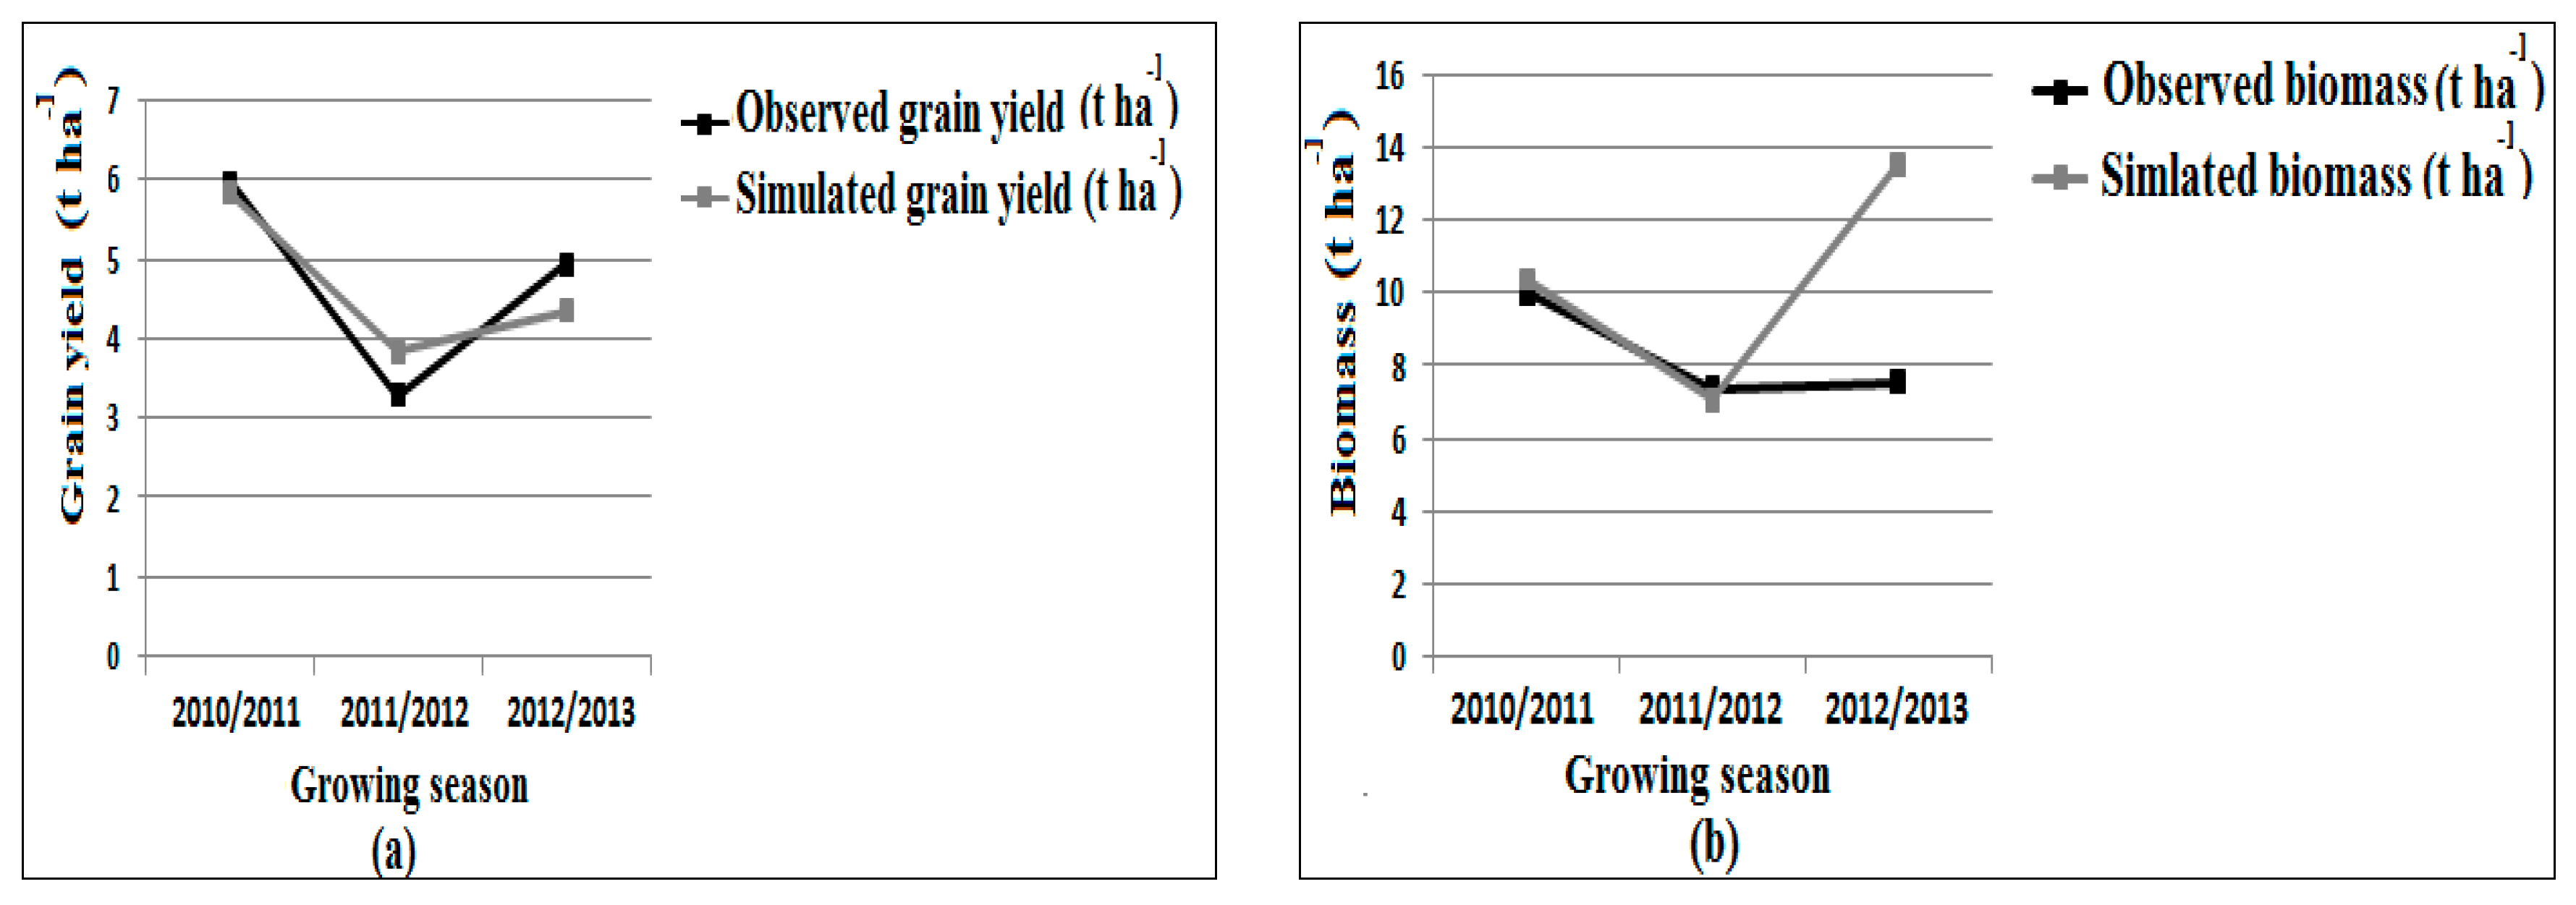
Figure 3 shows the comparison between the Mexicali cultivar’s final yields and above-ground biomasses observed at Setif experimental site during the three tests growing seasons: 2010/2011, 2011/2012, and 2012/2013, with respect to those simulated by AquaCropin these same growing seasons. Thus, according to Figure 3a, the Mexicali cultivar’s yields were simulated with good precision for the three years. However, as shown in Figure 3b, AquaCrop overestimates the simulation of the above-ground biomass for the 2012/2013′s growing season. This could be due to an error in the biomass measurement at the field test. Generally, the averages of statistical indicators of the model’s performance, for the three growing seasons were better in predicting yield (RMSE = 0.41 tha−1, NRMSE = 8.81% and d = 0.80), than in prediction above-ground biomass (RMSE = 2.25 tha−1, NRMSE = 21.65% and d = 0.54) (Table 4). In Brazil, Rosa et al. [39] validated the AquaCrop model to predict wheat grain yields with an estimated RMSE = 0.6 tha−1 and a Willmott agreement index of (d) ≥ 0.80.
3.3.1. Impact of Future Climate Change on Durum Wheat Grain Yield
With the aim of showing the projected impacts of changes in TS, PS, and the atmospheric CO2 concentration, on rainfed durum wheat grain yields, the charts in Figure 4 were carried out. So, for the BP, as shown in Figure 4a,b, the average grain yield of Mexicali cultivar simulated by AquaCrop crop model are estimated to 34.7 and 23.3 qha−1 at Setif and BBA experimental sites, respectively. So, a Mexicali cultivar grain yields enhancements estimated at (+82 and +76.6) and (+16 and +133%) are projected under the Sc1 and Sc2 scenarios, in Setif and BBA field tests, respectively.
3.3.2. Wheat Growing Season Length, Reference Evapotranspiration and Water Productivity Prediction under Future Climate Change Scenarios
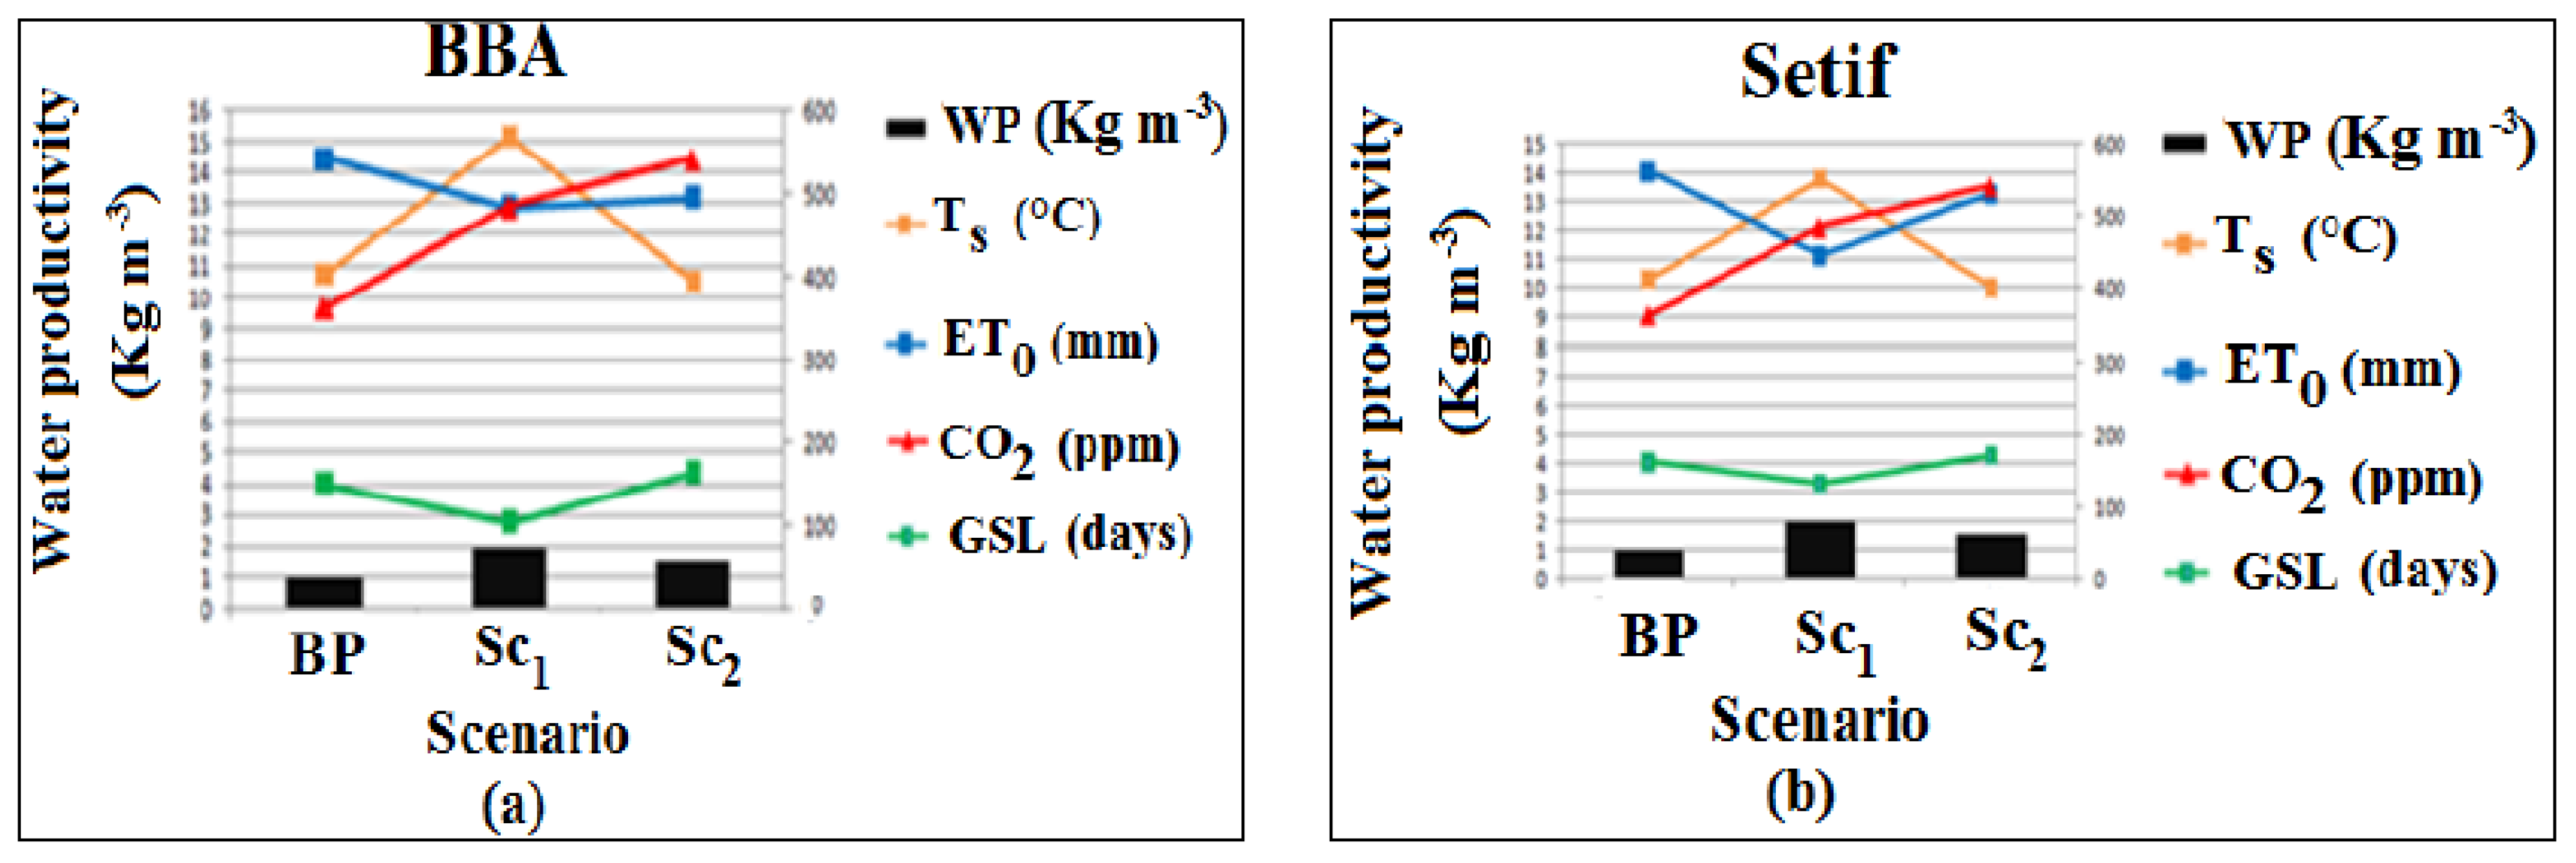
Figure 5 summarizes the results of AquaCrop simulations of the thirty years averages of GSL, WP, and ET0, under the BP, Sc1, and Sc2 scenarios at BBA and Setif experimental sites. Figure 5 also shows the relationship between GSL, WP, and ET0 variations with the changes in seasonal temperatures and CO2 concentrations projected under Sc1 and Sc2 with respect to their averages simulated for the BP.
As indicated in Figure 5a,b, the Mexicali cultivar’s GSL follows an inverse evolution of TS one under Sc1 and Sc2 scenarios at BBA and Setif sites, respectively. For the BP, AquaCrop simulated a Mexicali cultivar’s GSL of 161 and 151 days at Setif and BBA sites, respectively. It is predicted that a shortening of the Mexicali cultivar’s GSL by 30 and 47 days occurs in Sc1; meanwhile, the Mexicali cultivar’s GSL lengthening of +10 and +13 days are predicted under the Sc2 conditions at Setif and BBA sites, respectively. In comparison with the BP, the shortening of the Mexicali cultivar’s GSL under Sc1 by 30 and 47 days under Sc1 is due to the increase in TS of +3.5 and +4.5 °C at Setif and BBA sites, respectively. However, the Mexicali cultivar’s GSL lengthening by 10 and 13 days in Sc2 is due to the drop in TS of −0.3 and −0.1 °C at Setif and BBA sites, respectively.
In addition to these above results, the Pearson correlation test revealed the existence of a negative and statistically significant correlation between this Mexicali cultivar’s GSL and TS during the BP, under both Sc1 and Sc2. However, this test proved that there is a positive and statistically significant correlation between the Mexicali cultivar‘s GSL and PS during the BP and under both Sc1 and Sc2 scenarios at theSetif and BBA sites. Thus, the lengthening of the Mexicali cultivar‘s GSL by 10 days under Sc2 at the Setif site could alsobe explained by the PS increase by +65.6 mm. So, despite the shortening of Mexicali cultivar‘s GSL by the effect of the expected TS increase, Mexicali cultivar‘s grain yield is projected to be enhanced under Sc1.
Moreover, according to the results of this study reported in Figure 5a,b, the AquaCrop model simulated thirty years average water productivity (WP) of 1 and 0.7 kgm−3 of the Mexicali cultivar for the BP at the experimental sites of Setif and BBA, respectively. Thus, this crop model predicted WP enhance, estimated at (+1 and +0.3) and (+0.6 and +0.9) kgm−3, corresponding to WP enhancement rate of (+100 and +43) and (+60 and +129)% under Sc1 and Sc2, at Setif and BBA experimental sites, respectively.
Furthermore, according to Figure 5a,b, the ET0 simulated by the AquaCrop crop model for the BP is estimated to be 562.5 and 542.8 mm, for the Setif and BBA sites, respectively. Thus the drops of (−118 and −58.6) and (−32 and −47) mm, corresponding to decline rates of (−21 and −11) and (−6 and −8)%, are projected under the Sc1 and Sc2, at the Setif and BBA sites, respectively. So, these above ET0 declines projected under Sc1 could be induced by the shortening of MC’s GSL. However, under Sc2, the lengthening of the Mexicali cultivar’s GSL did not prevent the ET0 decline.
3.4. Adaptation of Durum Wheat Cultivation to Future Climate Change by Adjusting a Sowing Date
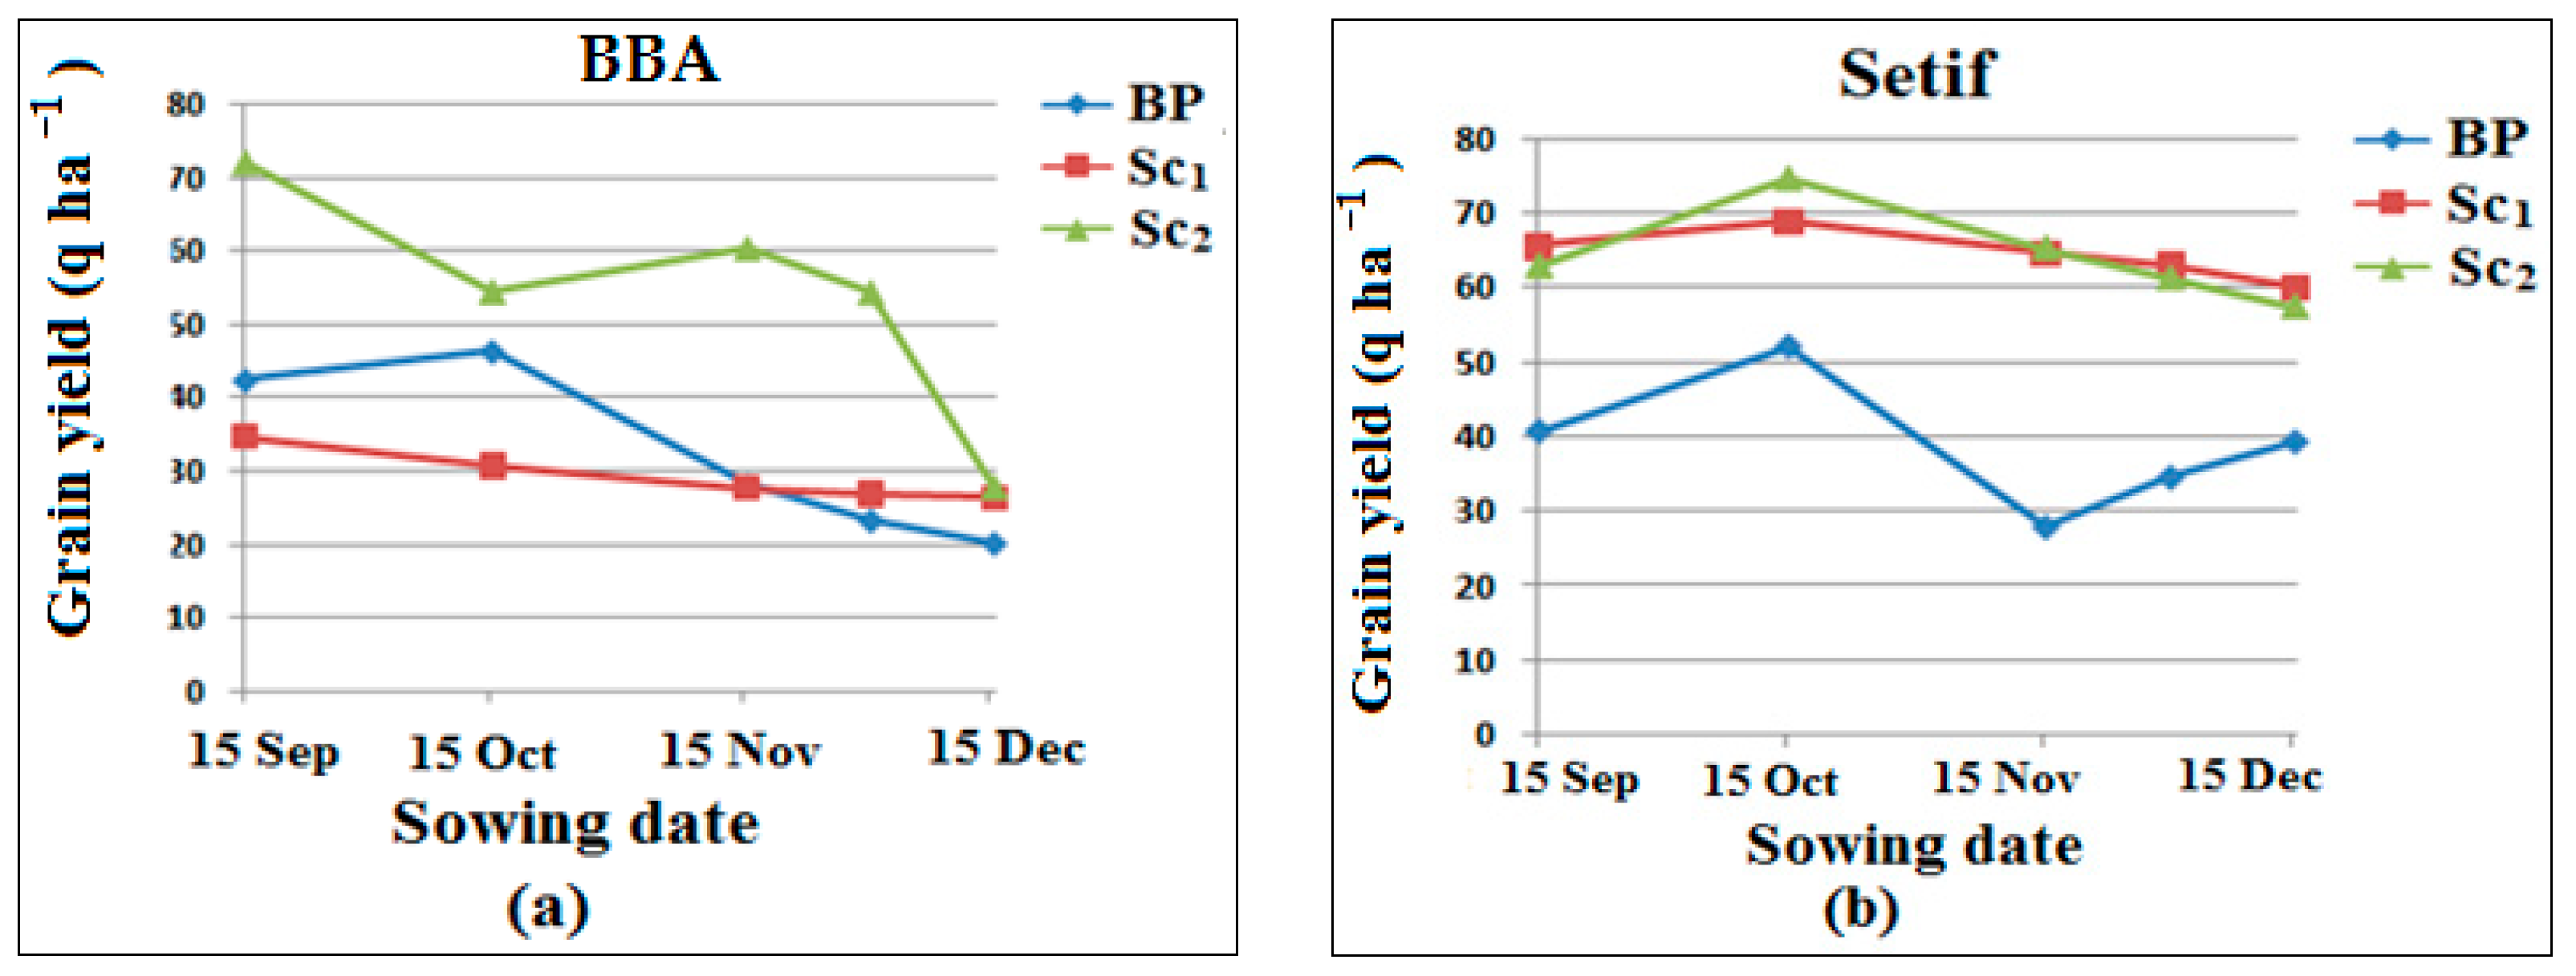
To adapt the rainfed durum wheat crop to the projected CC throughout its growing season, a CC adaptation strategy based on the sowing dates adjustment was tested in the AquaCrop model. Thus, five sowing dates on: 15 September, 15 October, 15 November, 30 November, and 15 December are tested in the AquaCrop crop model to simulate the Mexicali cultivar’s grain yields under the BP, Sc1 and Sc2 scenarios. So, the average Mexicali cultivar’s grain yields simulated by applying the above sowing dates in BP, Sc1, and Sc2 scenarios are reported in Figure 6. So, at the BBA site, as shown in Figure 6a, for the BP, the best simulated yield is estimated at 47.9 qha−1 by applying a sowing date of 15 October. However, Mexicali cultivar’s grain yield losses estimated at −37.5, −35, and −7% are projected in Sc1 with early sowing on 15 September, 15 October, and 15 November, respectively at the BBA site. However, late sowings on 30 November and 15 December allow grain yields a gain of +13% and +27%, respectively, under Sc1 at the BBA site. As shown in Figure 6. a, at this last experimental site, the Mexicali cultivar’s grain yield gains are projected to decline under Sc2 with the delay of the sowing date. Thus, the best estimated grain yield is 70.5 qha−1 simulated by applying an early sowing date of 15 September. In the case of the Setif site (Figure 6b), with early sowing on 15 October, the best Mexicali cultivar’s grain yields simulated with AquaCrop are 54,69, and 73 qha−1 for the BP, Sc1, and Sc2, respectively. So, as indicated in Figure 6b, the future Mexicali cultivar’s grain yields in the Setif site tend to improve with early sowing (in September and October) and decrease with late sowing (in November and December).
4. Discussion
The precipitations of the BP simulated by the climate model ICHEC_KNMI are underestimated compared to those observed at theSetif and BBA stations during the BP. Thus, the simulated precipitations are underestimated for all months of the year except June, where P were overestimated. Romeraet al. [40] suggested that the high variability of rainfall and the weak network of observation stations in the Maghreb region made the rainfall simulations in the EURO-CORDEX database full of uncertainties (or bias). The underestimation of Nr in spring and summer at both stations was possibly caused by the climate model overestimation of cloud cover as suggested by [41].
The decline in Ps under Sc1 compared to the BP at both stations is attributed to the shortening of the Mexicali cultivar’s GSL. This is induced by the increase in TS, as PS is expected to increase throughout the Mexicali cultivar’s GSL. In addition, the increase in spring’s precipitations and the lengthening of the Mexicali cultivar’s GSL under Sc2 explain why PS is expected to increase in this scenario compared to the BP. The NrS decreases in Sc1 could be due to the shortening of the Mexicali cultivar’s GSL and the aerosol pollution projected under these two RCPs scenarios, as suggested by [42]. Meanwhile, the decrease in NrS in Sc2 could be attributed to the atmospheric pollution caused by the presence of aerosols in the atmosphere as the Mexicali cultivar’s GSL was prolonged in this last scenario.
The wheat grain yield increase projected under both RCPs scenarios is due to the fertilizing effect of the air enrichment with CO2. This result is more consistent at the BBA site, where the evolution of the grain yield curve perfectly follows that of CO2 concentrations. Thus, the Mexicali cultivar’s grain yields projected in Sc2 are higher than those projected in Sc1 at the BBA site because the CO2 concentrations expected under RCP 8.5 are higher than those projected under RCP4.5. However, at the Setif site, the average grain yield simulated in Sc1 is higher than that simulated under Sc2. This could be explained by the decline in TS by −0.3 °C in Sc2 because it is possible that the lower temperatures reduce the fertilizing effect of CO2 on durum wheat grain yields. However, under Sc1, the projected grain yields at Setif are better by comparison with those projected at the BBA site. This result can be explained by the combined negative effect on wheat grain yield of very severe water stress and the thermal stress projected under Sc1 at the BBA site (Table 3). According to the Pearson correlation test results, in Sc1 and Sc2, there is a negative and statistically significant correlation between TS and Mexicali cultivar’s grain yields at the Setif site. Meanwhile, at the BBA site, the correlation is negative and statistically insignificant. On the contrary, the PS and NrS’s correlation is positive and statistically significant with Mexicali cultivar’s grain yield simulated by AquaCrop by both future scenarios.
Therefore, the fertilizing effect of CO2 offsets the negative effects of rising TS and decreasing PS and NrS on durum wheat yields projected, under Sc1 and Sc2, at the Setif and BBA experimental sites. These results are compatible with the conclusions of recent studies carried out by ([43,44,45] respectively, in China, Germany, and Morocco. Likewise, Pugh et al. [46] reported that rainfed wheat in arid and semi-arid regions located in low latitudes would benefit from the fertilizing effect of CO2, but less in temperate regions located in high latitudes. Moreover, Long et al. [47] reported that 550 ppm high CO2 concentration in experiments in a Free Air CO2 Enrichment (FACE) and in closed chamber experiments, resulted in a wheat yield enhancement of +31 and +13%, respectively, in both these experimental devices. Tubiello et al. [48] suggested that the fertilizing effects of a high CO2 concentration might be overestimated in crop models because their simulation of yield enhancement induced by a high CO2 concentration was much greater than that observed in FACE studies. However, they suggested that the magnitude of these effects is still under debate. In China, the study [49], proved that the fertilizing effect of the CO2 enrichment in the atmosphere slows the negative effects of warm air temperatures and precipitation decline on wheat yield under RCP 4.5 and RCP 8.5, at the beginning of the 21st century in China. Likewise, Xiong et al. [50] found that the CO2 enrichment in the atmosphere enhanced wheat yield by +0.9% by offsetting the negative effect of the drop in solar radiation, but without this fertilizing effect of CO2, the wheat yield would decrease by −9.7%. Under RCP 8.5, in Egypt, the increase in atmospheric CO2 concentrations will act as a growth stimulant. The simulated irrigated wheat yield across Egypt was projected to increase slightly (2.4%) in the 2030s and will decline slowly toward the end of the century (−1.7% by 2050s and−4.0% by 2080s). This result was attributed to the increase in negative impacts of the projected warm temperature [51]. In Jordan, the ESCWA [52] reported that under RCP 4.5 and RCP 8.4, with a fixed CO2 concentration, the rainfed wheat yields simulated with the AquaCrop model will increase by an average of about +33.8 and +48.3% in 2025 and 2045 future periods. Meanwhile, with elevated CO2 concentration, the simulated wheat yield will be enhanced by +53.5 and +81.6%inboth above future periods, respectively, with respect to the baseline yield.
The Pearson correlation test revealed the existence of a negative and statistically significant correlation between Mexicali cultivar’s GSL and TS during the BP and under both Sc1 and Sc2.This result is compatible with that of [45] in Morocco and [53] in the entire Mediterranean region. Furthermore, in Palestine and Jordan, the rainfed wheat growth cycle period simulated under RCP 8.5 is projected to shorten by 2030 and 2050 [52].
In addition to these above results, the Pearson correlation test proved that there is a positive and statistically significant correlation between Mexicali cultivar’s GSL and PS during the BP and under both Sc1 and Sc2 at the Setif and BBA sites. Thus, the lengthening of the Mexicali cultivar’s GSL by 10 days under Sc2 at the Setif site could also be explained by the increase in PS by +65.6 mm. Despite the shortening of Mexicali cultivar’s GSL by the effect of the expected increase in TS. The Mexicali cultivar’s grain yield is projected to enhance under Sc1.Tao et al. [54] and Liu et al. [55], explained that the shortening of wheat‘s GSL is due to the vegetative development stage’s length reduction, meanwhile the duration of the reproductive stage remained intact. So, this negated the yield losses reported by Zheng et al. [16], who recommended wheat cultivars flower early in order to prevent wheat crops from the risk of yield loss which could be induced by very warm temperatures in late spring throughout the period of grain formation.
The ET0 drop predicted under Sc1 is due to the shortening of the Mexicali cultivar’s GSL. This result is consistent with that of [56] on rice in Bangladesh and [45] on wheat in Morocco. However, under Sc2, the lengthening of the Mexicali cultivar’s GSL did not avoid the ET0 decrease, which could be explained by the stomatal regulatory effect ofdurum wheat, which made it possible to reduce water losses by evapotranspiration, as it was suggested by [45], under the fertilizing effect of the elevated CO2 concentrations in the atmosphere, projected under Sc2.
WP is the ratio of the amount of durum wheat biomass produced (in kg) to the amount of water lost by evapotranspiration during durum wheat’s growing cycle. Thus, according to the AquaCrop model simulations, the WP enhancement under both Sc1 and Sc2 scenarios is due to the increase in Mexicali cultivar’s above-ground biomass induced by the fertilizing effect of the enrichment of the atmosphere with CO2. This induced the acceleration of photosynthetic activity and the decrease in water loss by evapotranspiration, thanks to stomatal regulation under Sc2, and the shortening of the Mexicali cultivar’s GSL induced by the TS increase under Sc1. According to [52], the AquaCropcrop model, with a fixed CO2 concentration, predicted an enhancement of rainfed wheat’s WP by an average of +17.8 and +30% for the 2025 and 2045 future periods, whereas in the case of elevated CO2, an increase of +3 and +56% are projected by both future horizons, respectively, under RCP 4.5 and RCP 8.5.
According to [46], the fertilizing effect of a high CO2 concentration can improve the WP of C3 plants (such as wheat) by stimulating their photosynthetic activity. Ainsworth et al. [57] reported that across a range of FACE experiments, with a variety of plant species, the growth of plants at elevated CO2 concentrations of 475–600 ppm leads to increasing leaf photosynthetic rates by an average of +40%. These last authors explained that CO2 concentrations are essential in regulating the openness of stomata, the pores that allow plants to exchange gasses with the exterior environment. Thus, open stomata allow CO2 to diffuse into leaves for photosynthesis, but also provide a way for water to circulate out of leaves. Plants, therefore, regulate the degree of stomatal opening, a measure called stomatal conductance, which is used as a compromise between the aims of maintaining high rates of photosynthesis and low rates of water loss. So, as CO2 concentrations increase, plants can maintain high photosynthetic rates with relatively low stomatal conductance. Added to that, they also reported that across a multitude of FACE experiments, growth under elevated CO2 concentrations decreases stomatal conductance of water by an average of −22%. However, Taub et al. [58] suggested that generally, the magnitude of the effect of CO2 on crop water use would depend on how it affects other determinants of plant water use, such as plant size, morphology, and leaf temperature.
At both experimental sites, under the climate conditions projected by 2035–2064, under RCP 4.5 and RCP 8.5, the earlier sowings of mid-September and mid-October lead to the best yields because the earlier sowing dates allow the wheat crop to take advantage of the increase in precipitations predicted in the late summer and early fall. That will allow the achievement of the vegetative development stage of the Mexicali cultivar’s plant from November until the beginning of February. In addition, this early sowing allows the flowering stage to take place between the period from the end of February until the beginning of April, which allows the Mexicali cultivar’s plant to avoid the high temperaturesin May and June. These results are compatible with those of [59], who also predicted the adaptation of wheat to early sowings in 2031–2060 climate conditions, under both RCP 4.5 and RCP 8.5 scenarios in the Mediterranean area. However, late sowing in mid-November and mid-December resulted in poor yields, as they led to the achievement of the durum wheat’s flowering and grain-filling stages through the high-temperature period of the mid-April and early June period, which induce durum wheat’s grain yield losses by scalding. This result is in concordance with those of [60], who reported that the early maturing cultivar did not show a yield reduction on any sowing dates, thanks to the earliness of the anthesis stage, on which risk of crop exposure to heat stress during the sensitive grain-filling stage is decreased or avoided. In Ethiopia, [61], reported that by the middle and the end of the 21st century, one wheat cultivar is adapted to late sowing date, under low CO2 emissions of RCP 4.5, meanwhile another cultivar is well adapted to early sowing date, under elevated CO2 emissions of RCP 8.5. So, it is important to assess the adaptation of wheat sowing dates under future CC scenarios by simulating different wheat cultivars yields with the crop model in order to select the best-adapted wheat cultivar to the projected CC.
5. Conclusions
This study has shown the strategic interest of referring to climate and crop modeling for the prediction of the impacts of future climate change on the rainfed durum wheat yield in the High eastern plain of Algeria. For the baseline period 1981–2010, the climate model ICHEC_KNMI used in this study has proved its reliability in simulating temperatures and net solar radiation with good precision. However, precipitations are simulated with less certainty, given the high variability of precipitation in Algeria, which made the simulation very complicated. The AquaCrop crop model was used to assess the impacts of future climate change on grain yields, length of the growth cycle, and the water productivity of the durum wheat cultivar, Mexicali, in 2035–2064, under RCP 4.5 and RCP 8.5. This study showed that the effect of the increase in CO2 concentrationsin the atmosphere made it possible to avoid the drop yields of the rainfed Mexicali cultivar. This decline in grain yield could be induced by the negative effects: of the drop in precipitation and net solar radiation and by the increased air temperatures projected over the growing season of this cultivar in 2035–2064, under RCP 4.5 or RCP 8.5. Moreover, this study proved that the increase in temperature expected in 2035–2064 under the above scenarios, causes a shortening of the duration of the growth cycle of the Mexicali cultivar. However, an increase in yields and water productivity of this cultivar are projected by this future horizon, thanks to the fertilizing effect of the enrichment of the atmosphere with CO2. This study has made it possible to plan a strategy for adapting rainfed durum wheat to rising temperatures by applying early sowing in October, which avoids the loss of yield during the wheat growth cycle very sensitive stage, of grain filling in spring. However, further research is needed, using climate projections from an ensemble of climate models instead of a single model, to reduce the observed uncertainties in the precipitation simulation. It is necessary to evaluate, under RCPs scenarios, with other crop models, the effect of supplemental irrigation and fertilization on the adaptation of this Mexicali cultivar and other durum wheat cultivars to future climate change. Thus, the association of climate and crop modeling proves to be a relevant tool that meets the needs of farmers in terms of choice of farming practices and cultivars, in order to reduce the negative impacts of climate change on crops yields, as it enables decision-makers in the agricultural sector to plan sustainable and effective policies to help farmers to face the projected climate change and avoid crop yield losses, thereby maintaining food security in Algeria.
Author Contributions
T.K. collected, corrected, analyzed, simulated crop data with AquaCrop, interpreted the crop and climate data and wrote the initial draft of the paper. D.S. provided some data and supervised and corrected the paper, she also, reanalyzed and reinterpreted some data and contributed in the improvement of the manuscript contain and quality. A.M. read and contributed in improvement the English editing of the paper. All authors have read and agreed to the published version of the manuscript.
Funding
This research received no external funding.
Data Availability Statement
The data presented in this study are available on request from the corresponding author. The data are not publicly available due to restriction imposed by the National office of meteorology in Algeria.
Conflicts of Interest
The authors declare no conflict of interest.
References
- Mbow, C.; Rosenzweig, C.; Barioni, L.G.; Benton, T.G.; Herrero, M.; Krishnapillai, M.; Liwenga, E.; Pradhan, P.; Rivera Ferre, M.G.; Sapkota, T.; et al. Food Security. In Climate Change and Land 2019, an IPCC Special Report on Climate Change, Desertification, Land Degradation, Sustainable Land Management, Food Security, and Greenhouse Gas Fluxes in Terrestrial Ecosystems; Shukla, P.R., Skea, J., CalvoBuendia, E., Masson-Delmotte, V., Pörtner, H.-O., Roberts, D.C., Zhai, P., Slade, R., Connors, S., van Diemen, R., et al., Eds.; in press.
- IPCC. Intergovernmental Panel on Climate Change. Global Warming of 1.5 °C. An IPCC Special Report on the Impacts of Global Warming of 1.5 °C above Pre-industrial Levels and Related Global Greenhouse Gas Emission Pathways, in the Context of Strengthening the Global Response to the Threat of Climate Change, Sustainable Development, and Efforts to Eradicate Poverty; Masson-Delmotte, V., Zhai, P., Pörtner, H.-O., Roberts, D., Skea, J., Shukla, P.R., Pirani, A., Moufouma-Okia, W., Péan, C., Pidcock, R., et al., Eds.; in press.
- WMO World Meteorological Organization. The Global Climate in 2015–2019; World Meteorological Organization Publication: Geneva, Switzerland, 2019; p. 20. [Google Scholar]
- Raza, A.; Razzaq, A.; Mehmood, S.S.; Zou, X.; Zhang, X.; Lv, Y.; Xu, J. Impact of climate change on crop adaptation and strategies to tackle its outcome: A review. Plants 2019, 8, 34. [Google Scholar] [CrossRef] [PubMed] [Green Version]
- Tandzi Ngoune, L.; Mutengwa, S.C. Factors Affecting Yield of Crops, Agronomy, Climate Change & Food Security; Khan, A., Ed.; IntechOpen, 2020; Available online: https://www.intechopen.com/chapters/70658 (accessed on 30 January 2022). [CrossRef]
- IPCC. Intergovernmental Panel on Climate Change. Africa. In Climate Change 2014: Impacts, Adaptation, and Vulnerability. Part B: Regional Aspects. Contribution of Working Group II to the Fifth Assessment Report of the Intergovernmental Panel on Climate Change; Barros, V.R., Field, C.B., Dokken, D.J., Mastrandrea, M.D., Mach, K.J., Bilir, T.E., Chatterjee, M., Ebi, K.L., Estrada, Y.O., Genova, R.C., et al., Eds.; Cambridge University Press: Cambridge, UK; New York, NY, USA, 2014; pp. 1199–1265. [Google Scholar]
- Webber, H.; Ewert, F.; Olesen, J.E.; Müller, C.; Fronzek, S.; Ruane, A.C.; Bourgault, M.; Martre, P.; Ababaei, B.; Bindi, M.; et al. Diverging importance of drought stress for maize and winter wheat in Europe. Nat. Commun. 2018, 9, 4249. [Google Scholar] [CrossRef] [PubMed] [Green Version]
- Panda, A. Climate Change and Agricultural Insurance in the Asia and Pacific Region; The Asian Development Bank: Mandaluyong, Philippines, 2021; 44p. [Google Scholar]
- Iglesias, A.; Garrote, L. Adaptation strategies for agricultural water management under climate change in Europe. Agric. Water Manag. 2015, 155, 113–124. [Google Scholar] [CrossRef] [Green Version]
- Snowdon, R.J.; Wittkop, B.; Chen, T.-W.; Stahl, A. Crop adaptation to climate change as a consequence of long-term breeding. Theor. Appl. Genet. 2021, 134, 1613–1623. [Google Scholar] [CrossRef]
- Kourat, T. Évaluation du Changement Climatiqueet Impact sur la Production du blé dur Pluvial dans les Hautes Plaines Orientales de L’algérie. Ph.D. Thesis, ENSA El Harrach, Algiers, Algeria, 2021. Available online: http://localhost:8080/xmlui/handle/123456789/2489 (accessed on 3 January 2022).
- Bessaoud, O.; Pellissier, J.P.; Rolland, J.P.; Khechimi, W. Rapport de Synthèse sur L’agriculture en Algérie; Research Report; CIHEAM-IAMM: Montpellier, France, 2019; p. 82. [Google Scholar]
- MATE. Ex Ministère de l’Aménagement de Territoire et de l’Environnement. In Etude Diagnostique sur la Biodiversité et les Changements Climatiques en Algérie; Cooperatioproject between the Algerian Ministry of Land Planning and the Environment (MATE), United Nations Development Program (UNDP) and Global Environment Facility (GEF); Final Report; MATE: Algiers, Algeria, 2015; p. 111. [Google Scholar]
- Harrag, M.; Boulfred, Y. La sécurité alimentaire en Algérie Une étude analytique sur les céréales Food security in Algeria An analyticalstudy on cereals. Rev. L’économie Financ. Aff. 2019, 2, 162–188. Available online: Chrome-extension://efaidnbmnnnibpcajpcglclefindmkaj/viewer.html?pdfurl=https%3A%2F%2Fwww.asjp.cerist.dz%2Fen%2FdownArticle%2F109%2F3%2F2%2F92285&clen=170135 (accessed on 11 January 2022).
- Rapacza, M.; Macko-Podgórnib, A.; Jurczyka, B.; Kucharc, L. Modeling wheat and triticale winter hardiness under current and predicted winter scenarios for Central Europe: A focus on deacclimation. Agric. For. Meteorol. 2021, 313, 108739. [Google Scholar] [CrossRef]
- Zheng, Z.; Cai, H.; Wang, Z.; Wang, X. Simulation of Climate Change Impacts on Phenology and Production of Winter Wheat in Northwestern China Using CERES-Wheat Model. Atmosphere 2020, 11, 681. [Google Scholar] [CrossRef]
- Qian, B.; Jing, Q.; Cannon, A.J.; Smith, W.; Grant, B.; Semenov, M.A.; Xu, Y.-P.; Ma, D. Effectiveness of using representative subsets of global climate models in future crop yield projections. Sci. Rep. 2021, 11, 20565. [Google Scholar] [CrossRef]
- Agriconsulting. Support to Climate Change Mitigation and Adaptation in the ENPI South Region. Algeria Country Report, ENPI/2012/308-787. 2013. Available online: https://www.climamed.eu/wp-content/uploads/files/Algeria-Country-Report.pdf (accessed on 5 December 2021).
- Climat-Med. Policy Fiche: Managing the Impact of Climate Change on Agriculture. 2018. Climat-Med. 13 Pages. Available online: https://www.climamed.eu/wp-content/uploads/files/Agriculture-CC-Algeria.pdf (accessed on 20 December 2021).
- Wayne, G. The Beginner’s Guide to Representative Concentration Pathways. 2013. Available online: https://skepticalscience.com/docs/RCP_Guide.pdf (accessed on 13 December 2021).
- Rouabhi, A.; Adouane, C.; Felloussia, A.L. Assessment of climate change and its effects on cereal production by 2070 in north Algeria. Rev. Agric. 2019, 10, 27–39. Available online: file:///C:/Users/USER/Downloads/Rouabhi-al.pdf (accessed on 2 January 2022).
- Kourat, T.; Medjerrab, A. Analyse et cartographie des pluies et l’incidence de leursvariabilitéspatiotemporelle sur la délimitation des zones céréalières dans les hautesplainesorientales de l’Algérie. Révue. Agric. 2016, 1, 220–229. Available online: //efaidnbmnnnibpcajpcglclefindmkaj/viewer.html?pdfurl=https%3A%2F%2Frevue-agro.univ-setif.dz%2Fdocuments%2Fnumerospecial%2FSession6%2FKourat%2520et%2520Medjerb.pdf&clen=1619913&chunk=true (accessed on 5 December 2021).
- Kourat, T. Analyse et Cartographie des Pluies et L’incidence de leurs Variabilite Spatio-Temporelle sur la Délimitation Des zones Céréalières dans les Hautes Plaines Orientales de L’algérie. Master’s Thesis, Faculté des Sciences de la Terre, De Geographie et de L’amenagement de Territoire, Université des Sciences et de la TechnologieHouari Boumediene, Algiers, Algeria, 2015. [Google Scholar]
- Moss, R.H.; Babiker, M.; Brinkman, S.; Calvo, E.; Carter, T.; Edmonds, J.A.; Elgizouli, I.; Emori, S.; Lin, E.; Hibbard, K.; et al. Towards New Scenarios for Analysis of Emissions, Climate Change, Impacts, and Response Strategies; Intergovernmental Panel on Climate Change: Geneva, Switzerland, 2008. [Google Scholar]
- Van Vuuren, D.P.; Edmonds, J.; Kainuma, M.; Riahi, K.; Thomson, A.; Hibbard, K.; Hurtt, G.C.; Kram, T.; Krey, V.; Lamarque, J.-F.; et al. The representative concentration pathways: An overview. Clim. Chang. 2011, 109, 5. [Google Scholar] [CrossRef]
- Saeed Al Blooshi, F.; Alyan, S.; Joshua, N.J.; Ksiksi, T.K. Modeling Current and Future Climate Change in the UAE using Various GCMs in MarksimGCMR. Open Atmos. Sci. J. 2019, 13, 56–64. [Google Scholar] [CrossRef]
- Arbadi, R.; Bacciu, V.; Benkheira, A.; Bouazzaoui, A.; Bouzid, B.W.; Brachemi, O.; Ziani Cherif, S.M.; Ghouari, N.; Salis, M.; Tefiani, W. Réduction D’échelle et ModélisationClimatique Avec Une Application a la Gestion des ForetsenAlgérie; Technical Paper; ClimaSouth: Algiers, Algeria, 2018; p. 56. [Google Scholar]
- Navarro-Racines, C.E.; Tarapues, J.; Thornton, P.; Jarvis, A.; Ramirez-Villegas, J. High-resolution and bias-corrected CMIP5 projections for climate change impact assessments. Sci. Data 2020, 7, 7. [Google Scholar] [CrossRef] [PubMed] [Green Version]
- Foughali, A.; Tramblay, Y.; Bargaoui, Z.; Carreau, J.; Ruellan, D. Hydrological Modeling in Northern Tunisia with Regional Climate Model Outputs: Performance Evaluation and Bias-Correction in Present Climate Conditions. Climate 2015, 3, 459–473. [Google Scholar] [CrossRef] [Green Version]
- Tramblay, Y.; El Adlouni, S.; Servat, E. Trends and variability in extreme precipitation indices over Maghreb countries. Nat. Hazards Earth Syst. Sci. 2013, 13, 3235–3248. [Google Scholar] [CrossRef] [Green Version]
- Latief, A.; Syed, S.M. Satelite Farming. In An Information and Technology Based Agriculture; Springer: Berlin/Heidelberg, Germany, 2018; 181p. [Google Scholar]
- Steduto, P.; Hsia, T.C.; Raes, D.; Fereres, E. AquaCrop—The FAO Crop Model to Simulate Yield Response to Water: I. Concepts and Underlying Principles. J. Agron. 2009, 101, 426–437. [Google Scholar] [CrossRef] [Green Version]
- Raes, D.; Steduto, P.; Hsiao, T.C.; Fereres, E. AquaCrop; Version 4.0; Manuel d’utilisation; FAO, Land and Water Division: Rome, Italy, 2014. [Google Scholar]
- Allen, R.G.; Pereira, L.S.; Raes, D.; Smith, M. Crop Evapotranspiration. Guidelines for Computing Crop Requirements. FAO Irrigation and Drainage Paper; FAO: Rome, Italy, 2015; Volume 56, 15p. [Google Scholar]
- Saxton, K.E.; Willey, P.H. The SPAW Model for Agricultural Field and Pond Hydrologic Simulation; CRC Press: Boca Raton, FL, USA, 2006. [Google Scholar]
- Kaly, E.; Malou, R.; Akpo, L.E. Évaluation du modèleAquaCrop de la FAO enrizicultureirriguée dans le Delta du FleuveSénégal. J. Anim. Plant Sci. 2016, 30, 4781–4796. [Google Scholar]
- Khebbat, Z. Etat Hydrique du sol et Performance D’une Collection de Variétés de blé dur. Ph.D. Thesis, Faculté des Sciences de la Nature et de la Vie, Université Ferhat Abbas, Setif, Algeria, 2015; 83p. [Google Scholar]
- Gray, C.D.; Kinnear, P.R. IBM SPSS Statistics 19 Made Simple; Psychology Press: New York, NY, USA, 2012; p. 688. [Google Scholar]
- Rosa, S.L.K.; Souza, J.L.M.D.; Tsukahara, R.Y. Performance of the AquaCrop model for the wheat crop in the subtropical zone in Southern Brazil. Pesqui. Agropecuária Bras. 2020, 55, e01238. [Google Scholar] [CrossRef] [Green Version]
- Romera, R.; Sánchez, E.; Domínguez, M.; Gaertner, M.; Gallardo, C. Evaluation of present-climate precipitation in 25 km resolution regional climate model simulations over Northwest Africa. Clim. Res. 2015, 66, 125–139. [Google Scholar] [CrossRef]
- Freidenreich, S.M.; Ramaswamy, V. Analysis of the biases in the downward shortwave surface flux in the GFDL CM2.1 general circulation model. J. Geophys. Res. 2011, 116, D08208. [Google Scholar] [CrossRef] [Green Version]
- Liu, M.; Matsui, H. Aerosol radiative forcings induced by substantial changes in anthropogenic emissions in China from 2008 to 2016. Atmos. Chem. Phys. 2021, 21, 5965–5982. [Google Scholar] [CrossRef]
- Erda, L.; Wei, X.; Hui, J.; Yinlong, X.; Yue, L.; Liping, B.; Liyong, X. Climate change impacts on crop yield and quality with CO2 fertilization in China. Philos. Trans. R. Soc. B Biol. Sci. 2015, 360, 2149–2154. [Google Scholar] [CrossRef] [Green Version]
- Degener, J.F. Atmospheric CO2 fertilization effects on biomass yields of 10 crops in northern Germany. Front. Environ. Sci. 2015, 3, 48. [Google Scholar] [CrossRef] [Green Version]
- Bouras, E.; Jarlan, L.; Khabba, S.; Er-Raki, S.; Dezetter, A.; Sghir, F.; Tramblay, Y. Assessing the impact of global climate changes on irrigated wheat yields and water requirements in a semi-arid environment of Morocco. Sci. Rep. 2019, 9, 19142. [Google Scholar] [CrossRef] [PubMed]
- Pugh, T.; Müller, C.; Elliott, J.; Deryng, D.; Folberth, C.; Olin, S.; Schmid, E.; Arneth, A. Climate analogues suggest limited potential for intensification of production on current croplands under climate change. Nat. Commun. 2016, 7, 12608. [Google Scholar] [CrossRef] [PubMed] [Green Version]
- Long, S.P. Food for Thought: Lower-than-expected crop yield stimulation with rising CO2 concentrations. Science 2006, 312, 918–1921. [Google Scholar] [CrossRef]
- Tubiello, F.N.; Amthor, J.S.; Boote, K.; Donatelli, M.; Easterling, W.; Fischer, G.; Gifford, R.M.; Howden, S.; Reilly, J.; Rosenzweig, C. Crop response to elevated CO2 and world food supply: A comment on “Food for Thought” by Long et al. Science 312:1918–1921. Eur. J. Agron. 2007, 25, 215–223. [Google Scholar] [CrossRef]
- Xiao, D.; Bai, H.; Liu, D.L. Impact of future climate change on wheat production: A simulated case for china’s wheat system. Sustainability 2018, 10, 1277. [Google Scholar] [CrossRef] [Green Version]
- Xiong, W.; Holman, I.; Lin, E.; Conway, D.; Li, Y.; Wu, W. Untangling relative contributions of recent climate and CO2 trends to national cereal production in China. Environ. Res. Lett. 2012, 7, 044014. [Google Scholar] [CrossRef]
- Asseng, S.; Kheir, A.M.S.; Kassie, B.T.; Hoogenboom, G.; Abdelaal, A.I.N.; Haman, D.Z.; Ruane, A.C. Can Egypt become self-sufficient in wheat? Environ. Res. Lett. 2018, 13, 094012. [Google Scholar] [CrossRef] [Green Version]
- ESCWA. Economic and Social Commission of Western Asia. Modelling Climate Change Impacts on Agricultural Productivity Using AquaCroptools and RICCAR Datasets. Climate Change & Natural Resources Sustainability Cluster; Virtual Workshop for the Arab Region; ESCWA: Beirut, Lebanon, 2020. [Google Scholar]
- Saadi, S.; Todorovic, M.; Tanasijevic, L.; Pereira, L.S.; Pizzigalli, C.; Lionello, P. Climate change and Mediterranean agriculture: Impacts on winter wheat and tomato crop evapotranspiration, irrigation requirements and yield. Agric. Water Manag. 2015, 147, 103–115. [Google Scholar] [CrossRef]
- Tao, F.; Zhang, Z. Climate change, wheat productivity and water use in the North China Plain: A new super-ensemble-based probabilistic projection. Agric. For. Meteorol. 2013, 170, 146–165. [Google Scholar] [CrossRef]
- Liu, H.; Li, Y.; Josef, T.; Zhang, R.; Huang, G. Quantitative estimation of climate change effects on potential evapotranspiration in Beijing during 1951–2010. J. Geogr. Sci. 2013, 24, 93–112. [Google Scholar] [CrossRef]
- Acharjee, T.K.; Ludwig, F.; van Halsema, G.; Hellegers, P.; Iwan, S. Future changes in water requirements of Boro rice in the face of climate change in North–West Bangladesh. Agric. Water Manag. 2017, 194, 172–183. [Google Scholar] [CrossRef]
- Ainsworth, E.A.; Rogers, A. The response of photosynthesis and stomatal conductance to rising (CO2): Mechanisms and environmental interactions. Plant Cell Environ. 2007, 30, 258–270. [Google Scholar] [CrossRef] [PubMed]
- Taub, D. Effects of Rising Atmospheric Concentrations of Carbon Dioxide on Plants. Nat. Educ. Knowl. 2010, 3, 21. [Google Scholar]
- Moriondo, M.; Bindi, M.; Brilli, L.; Costafreda-Aumedes, S.; Dibari, C.; Leolini, L.; Padovan, G.; Trombi, G.; Karali, A.; Varotsos, K.V.; et al. Assessing climate change impacts on crops by adopting a set of crop performance indicators. Euro-Mediterr. J. Environ. Integr. 2021, 6, 45. [Google Scholar] [CrossRef]
- Yang, C.; Fraga, H.; van Ieperen, W.; Trindade, H.; Santos, J.A. Effects of climate change and adaptation options on winter wheat yield under rainfed Mediterranean conditions in southern Portugal. Clim. Chang. 2019, 154, 159–178. [Google Scholar] [CrossRef] [Green Version]
- Demelash, T.; Amou, M.; Gyilbag, A.; Tesfay, G.; Xu, Y. Adaptation Potential of Current Wheat Cultivars and Planting Dates under the Changing Climate in Ethiopia. Agronomy 2022, 12, 37. [Google Scholar] [CrossRef]
Figure 1.
Geographical location of the study area (source [23]).
Figure 1.
Geographical location of the study area (source [23]).

Figure 2.
Comparison of the degree of agreement between the observed and simulated Tmin, Tmax, P, and Nr monthly means at Setif and BBA stations during the BP.
Figure 2.
Comparison of the degree of agreement between the observed and simulated Tmin, Tmax, P, and Nr monthly means at Setif and BBA stations during the BP.

Figure 3.
(a,b) Comparison between the observed and simulated of Mexicali cultivar’s grain yields and above ground-biomass for the three growing seasons: 2010/2011, 2011/2012 and 2012/2013 at Setif experimental site.
Figure 3.
(a,b) Comparison between the observed and simulated of Mexicali cultivar’s grain yields and above ground-biomass for the three growing seasons: 2010/2011, 2011/2012 and 2012/2013 at Setif experimental site.

Figure 4.
(a,b) Impact of future change in seasonal temperatures, precipitations, and CO2 concentrations on Mexicali cultivar grain yield at BBA and Setif sites.
Figure 4.
(a,b) Impact of future change in seasonal temperatures, precipitations, and CO2 concentrations on Mexicali cultivar grain yield at BBA and Setif sites.

Figure 5.
(a,b) Impact of temperature and CO2 concentrations futures changes on reference evapotranspiration and wheat water productivity and the growing cycle length.
Figure 5.
(a,b) Impact of temperature and CO2 concentrations futures changes on reference evapotranspiration and wheat water productivity and the growing cycle length.

Figure 6.
(a,b) Wheat grain yield simulated by AquaCrop by adjusting the sowing dates to adapt wheat crop to the future climate change projected under Sc1 and Sc2 at BBA and Setif sites.
Figure 6.
(a,b) Wheat grain yield simulated by AquaCrop by adjusting the sowing dates to adapt wheat crop to the future climate change projected under Sc1 and Sc2 at BBA and Setif sites.


Table 1.
Geographical coordinates and altitudes of the of the Setif and BBA meteorological stations.
Table 1.
Geographical coordinates and altitudes of the of the Setif and BBA meteorological stations.
| Station | Latitude (°C) | Longitude (°C) | Altitude (m) |
|---|---|---|---|
| BBA | 36.06° N | 4.66° E | 957 |
| Setif | 36.16° N | 5.31° E | 1015 |
Table 2.
Calibrated AquaCrop model specific parameters for Mexicali cultivar of wheat.
| Non-Conservative Crop Parameters | Value |
|---|---|
| Length to emergence (day) | 10 |
| Reference harvest index (HI) (%) | 57 |
| Length to building up HI (day) | 37 |
| Duration of flowering (day) | 29 |
| Length to max cc (day) | 70 |
| Length max root depth (day) | 49 |
| Length to flowering (day) | 61 |
| Length to start canopy senescence (day) | 82 |
| Length to maturity (day) | 106 |
| Initial canopy cover (%) | 4.5 |
| Maximum canopy cover (%) | 90 |
| Plant density (plant/m2) | 300 |
| Canopy decline coefficient at senescence | 0.405% GDD |
| Canopy growth coefficient | 0.669% GDD |
| Max effective root depth (m) | 1 |
| Crop transpiration coefficient | 0.98 |
| Water productivity (kg/m3) | 1.35 |
| SWDT for canopy expansion, upper limit | 0.2 TASW |
| SWDT for canopy expansion, lower limit | 0.6 TASW |
| SWDT for stomatal closure, upper limit | 0.6 TASW |
| SWDT for canopy senescence, upper limit | 0.7 TASW |
| Shape factor of canopy expansion | 5 |
| Shape factor of stomatal closure | 2.5 |
| Shape factor early senescence | 2.5 |
| Base temperature (°C) | 0 |
| Max temperature (°C) | 26 |
GDD, growing degree-day; SWDT, soil water depletion threshold; TASW, total available soil water.
Table 3.
Comparison of the thirty years averages of TS, PS, NrS between the BP and the futurescenarios Sc1 and Sc2.
Table 3.
Comparison of the thirty years averages of TS, PS, NrS between the BP and the futurescenarios Sc1 and Sc2.
| Future Simulation Scenario | TS | TS Change (°C) | PS | PS Change | NrS | NrS Change | ||
|---|---|---|---|---|---|---|---|---|
| (mm) | (%) | (M J m−2) | (M J m−2) | (%) | ||||
| Setif | ||||||||
| BP | 10.3 | 263 | 1059.1 | |||||
| Sc1 | 13.8 | 3.5 | 244 | −18.8 | −7.1 | 712.1 | −347 | −32.8 |
| Sc2 | 10 | −0.3 | 329 | 65.6 | 24.9 | 922.3 | −136.8 | −12.9 |
| BBA | ||||||||
| BP | 10.7 | 220 | 1058.9 | |||||
| Sc1 | 15.2 | 4.5 | 153 | −67.1 | −31 | 468.7 | −590.2 | −55.7 |
| Sc2 | 10.5 | −0.1 | 285 | 64.3 | 29.2 | 1016.5 | −42.4 | −4 |
Table 4.
Comparison of Mexicali cultivar’s yields and above-ground biomasses observed and simulated by AquaCrop in the 2010/2011, 2011/2012 and 2012/2013 growing seasons.
Table 4.
Comparison of Mexicali cultivar’s yields and above-ground biomasses observed and simulated by AquaCrop in the 2010/2011, 2011/2012 and 2012/2013 growing seasons.
| Statistical Indices | RMSE | NRMSE | Willmott Agreement Index (d) | |||
|---|---|---|---|---|---|---|
| Yield (tha−1) | Biomass (tha−1) | Yield (%) | Biomass (%) | Yield | Biomass | |
| Three years average | 0.41 | 2.25 | 8.81 | 21.65 | 0.80 | 0.54 |
Publisher’s Note: MDPI stays neutral with regard to jurisdictional claims in published maps and institutional affiliations. |
© 2022 by the authors. Licensee MDPI, Basel, Switzerland. This article is an open access article distributed under the terms and conditions of the Creative Commons Attribution (CC BY) license (https://creativecommons.org/licenses/by/4.0/).
Share and Cite
MDPI and ACS Style
Kourat, T.; Smadhi, D.; Madani, A. Modeling the Impact of Future Climate Change Impacts on Rainfed Durum Wheat Production in Algeria. Climate 2022, 10, 50. https://0-doi-org.brum.beds.ac.uk/10.3390/cli10040050
AMA Style
Kourat T, Smadhi D, Madani A. Modeling the Impact of Future Climate Change Impacts on Rainfed Durum Wheat Production in Algeria. Climate. 2022; 10(4):50. https://0-doi-org.brum.beds.ac.uk/10.3390/cli10040050
Chicago/Turabian StyleKourat, Tassadit, Dalila Smadhi, and Azzeddine Madani. 2022. "Modeling the Impact of Future Climate Change Impacts on Rainfed Durum Wheat Production in Algeria" Climate 10, no. 4: 50. https://0-doi-org.brum.beds.ac.uk/10.3390/cli10040050
Note that from the first issue of 2016, this journal uses article numbers instead of page numbers. See further details here.