Article

High Variation in Resource Allocation Strategies among 11 Indian Wheat (Triticum aestivum) Cultivars Growing in High Ozone Environment

by
Ashutosh K. Pandey
1,2,†,
Baisakhi Majumder
2,
Sarita Keski-Saari
1,
Sari Kontunen-Soppela
1,
Vivek Pandey
2,* and
Elina Oksanen
1
1
Department of Environmental and Biological Sciences, University of Eastern Finland, POB 111, 80101 Joensuu, Finland
2
Plant Ecology and Environmental Science, National Botanical Research Institute (CSIR-NBRI), Lucknow 226001, India
*
Author to whom correspondence should be addressed.
Institute of Technology, University of Tartu, 50411 Tartu, Estonia (Current address).
Submission received: 26 December 2018 / Revised: 23 January 2019 / Accepted: 23 January 2019 / Published: 28 January 2019
(This article belongs to the Special Issue Air Pollution and Plant Ecosystems)

Abstract

:
Eleven local cultivars of wheat (Triticum aestivum) were chosen to study the effect of ambient ozone (O3) concentration in the Indo-Gangetic Plains (IGP) of India at two high-ozone experimental sites by using 300 ppm of Ethylenediurea (EDU) as a chemical protectant against O3. The O3 level was more than double the critical threshold reported for wheat grain production (AOT40 8.66 ppm h). EDU-grown plants had higher grain yield, biomass, stomatal conductance and photosynthesis, less lipid peroxidation, changes in superoxide dismutase and catalase activities, changes in content of oxidized and reduced glutathione compared to non-EDU plants, thus indicating the severity of O3 induced productivity loss. Based on the yield at two different growing sites, the cultivars could be addressed in four response groups: (a) generally well-adapted cultivars (above-average yield); (b) poorly-adapted (below-average yield); (c) adapted to low-yield environment (below-average yield); and (d) sensitive cultivars (adapted to high-yield environment). EDU responses were dependent on the cultivar, the developmental phase (vegetative, flowering and harvest) and the experimental site.

Graphical Abstract

1. Introduction

Tropospheric ozone (O3) is a phytotoxic pollutant causing substantial damage to agricultural production and food security [1,2,3,4,5,6,7]. O3-induced loss in plant productivity has been estimated to range between 14 and 26 billion US$ on the global scale [8]. Modelling studies suggest a further increase in O3 concentrations, especially in the East and South Asian regions due to the increased O3 precursor emissions that result from high population density, rapid industrial growth and favorable climatic conditions [9,10,11]. Tropospheric O3 concentration has increased in India and China by 20% and 13%, respectively, from the year 1999 to 2013 [12]. Recent studies have shown very high O3 concentrations in India, particularly in the Indo-Gangetic Plains (IGP) region, which is one of the most fertile agricultural land areas facing high pollution and population loads [13,14,15]. By 2030, the population of India is projected to increase further by 300 million people (United Nations Population Division [16,17]. Therefore, due to limited arable land, food security in India is under threat. The selection of O3-tolerant crops or cultivars can be an important strategy for food security in the area suffering from high-O3 concentrations [3].
O3 can adversely affect crop productivity either directly causing the oxidative damage as a result of the production of the reactive oxygen species (ROS) or indirectly as a greenhouse gas [3]. O3 enters the leaves mainly through stomatal pores. After entry, O3 is rapidly dissolved in the apoplast and it generates ROS that finally causes an imbalance in the redox status of the cells. This eventually leads to cellular damage or programmed cell death [18,19,20]. O3 modifies the plant metabolism by adversely affecting the photosynthetic carbon assimilation, stomatal regulation and plant growth leading to reduced crop yield [21,22].
India is a major producer of wheat (Triticum aestivum) accounting 12% of the total wheat production in the world [23]. Wheat is sensitive to O3-induced damage [17,24]. The critical O3 level for 5% yield reduction, a three-month Accumulated Ozone exposure over the Threshold of 40 ppb (AOT40) for three months is 3 ppm h, for wheat [25]. Recently, Ghude et al. [24] estimated the production loss of 3.5 ± (0.8) million tons of wheat in India. Despite the obvious sensitivity of wheat to O3, large scale screening of Indian wheat cultivars in the field conditions has been scarcely done due to technical limitations [26,27]. So far, responses of 14 wheat cultivars cultivated in India have been tested in open top chambers for their O3 sensitivity to elevated O3 of 30 ppb with respect to ambient O3, resulting in lower gas exchange rates, biomass, and yield [27].
A chemical protectant, EDU [ethylenediurea; N-(2-2-oxo-1-imidazolidinyl) ethyl]-N′- phenyl urea N-(2-2-oxo-1-imidazolidinyl) ethyl]-N′-phenyl urea) was first introduced by Carnahan et al. [28]. Thereafter, several reports have shown that the use of EDU can specifically prevent the O3 injury as well as decrease the growth and yield losses in the ambient field conditions [13,15,29,30,31]. EDU application is a useful and cost-effective method for the large-scale screening of plant materials for ozone-tolerance/sensitivity, particularly in remote areas, lacking electricity and infrastructures for O3 exposure or its removal [32].
In this study, we compared the productivity and performance of 11 Indian wheat cultivars throughout the growing season in the ambient field conditions at two high-ozone experimental sites, NBRI (urban) and Banthra (semi-urban), in the IGP region of India. EDU application was used as a research tool to protect the plants against high-ozone stress at both experimental sites. The plants with and without the application of EDU were measured for growth, gas-exchange antioxidants and yield attributes in two developmental phases and two sites. The aim was (1) to classify the cultivars into four adaptation groups, according to their yield (grain weight), and thereafter (2) to indicate the key parameters linked to adaptation strategies for each adaptation group.

2. Materials and Methods

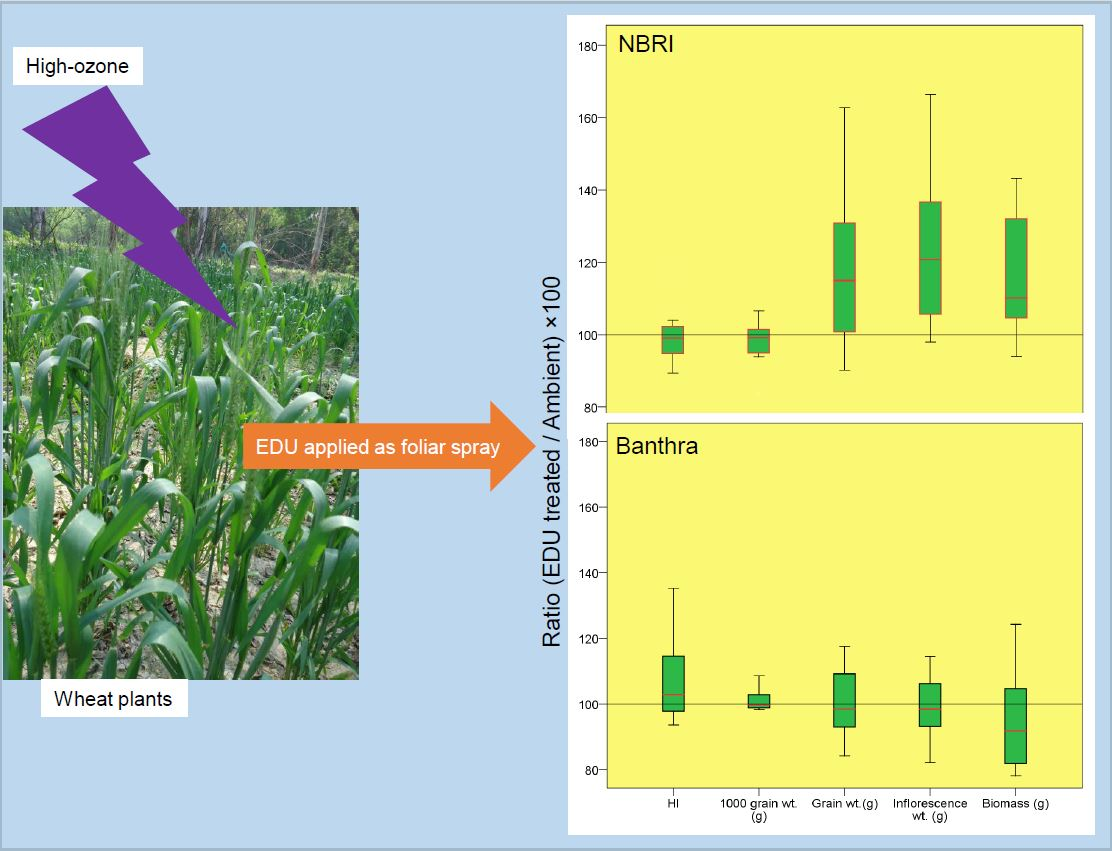
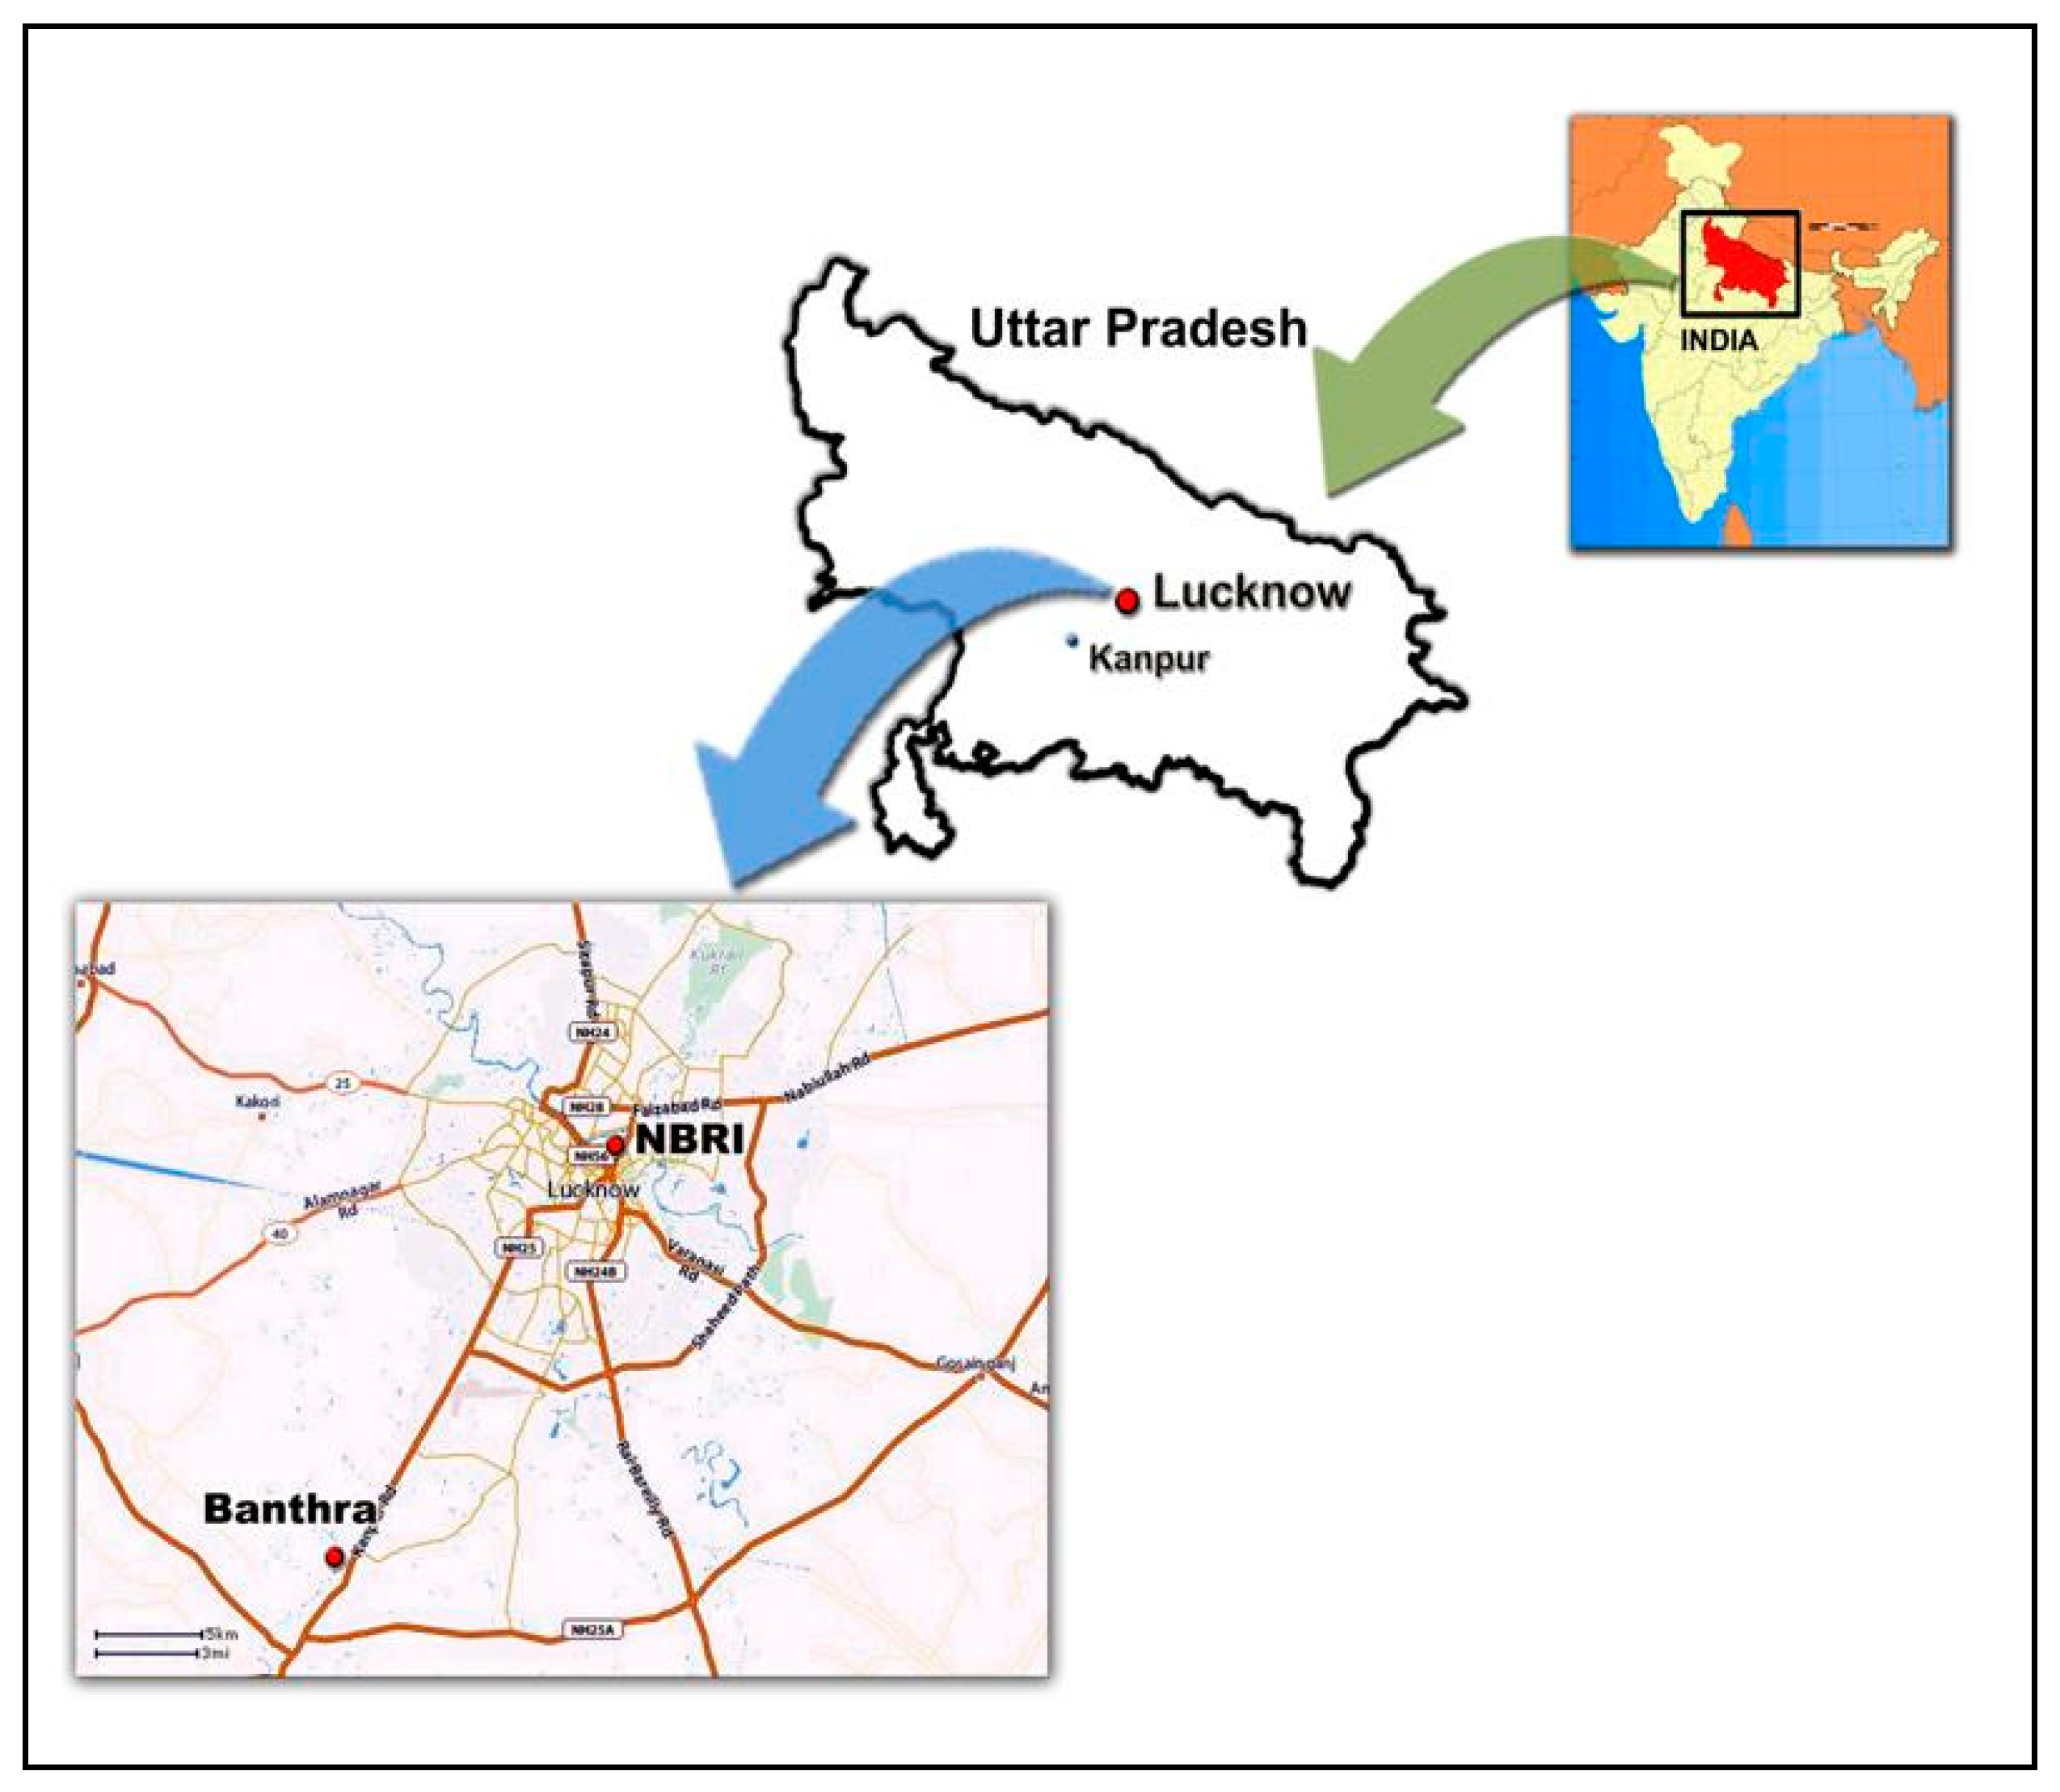
2.1. Experimental Sites and Plant Material

A field study was carried out from 6 December 2011 to 29 March 2012 at two experimental sites (1) the Botanical garden of the CSIR-National Botanical Research Institute, NBRI (26°55′ N, 80°59′ E) in Lucknow and (2) at the Banthra (26°45′ N, 80°53′ E) approximately 25 km from the Lucknow city, India (Figure 1). The NBRI site represents an urban site with soil type of sandy loam (sand 50%, silt 33%, clay 17%; pH 8.4 and electrical conductivity 231.1 μS cm−1), and Banthra a semi-urban site with silt clay loam (sand 14.5%, silt 53.5%, clay 32%; pH 8.4 and electrical conductivity 219 μS cm−1) soil. Eleven locally important wheat (Triticum aestivum L.) cultivars were chosen for the present study (Table S1).

2.2. Experimental Design and EDU Application

The field size was 400 m2 at the both experimental sites. The field was divided into six plots; three for ambient O3-grown (non-EDU treated) and three for EDU-treated plants, where non-EDU treated were sprayed with water. Each plot had 11 subplots of 1.5 × 1.5 m in dimension, one for each of the 11 cultivars. The distance between the subplots was 0.5 m. Seeds were sown in each subplot in rows with 25 cm spacing. The recommended dose of NPK fertilisation (120:60:60 kg ha−1) was applied during the field preparation. At first, nitrogen was applied as basal dose which included a full dose of potassium and phosphorus, the second and third doses of nitrogen were applied after 30 and 60 days of sowing (DAS) as top dressing.
EDU was applied at 300 ppm concentration as a foliar spray to individual plants until its entire foliage was visibly saturated. EDU treatment was started after 15 DAS and continued at an interval of 15 days until the final harvest phase. Application of EDU was done on a cloud free day to avoid risk of washing away. The choice of 300 ppm EDU concentration was based on the earlier experiments by Feng et al. [33] suggesting the concentrations at 200–400 ppm range as the most effective in ameliorating effects of high-O3 concentration in field conditions. Paoletti et al. [34] also demonstrated that 300 ppm of EDU concentration was effective to halt the O3-induced ROS formation in Phaseolus vulgaris. EDU was obtained from Prof. W.J. Manning, University of Massachusetts, Amherst, USA.

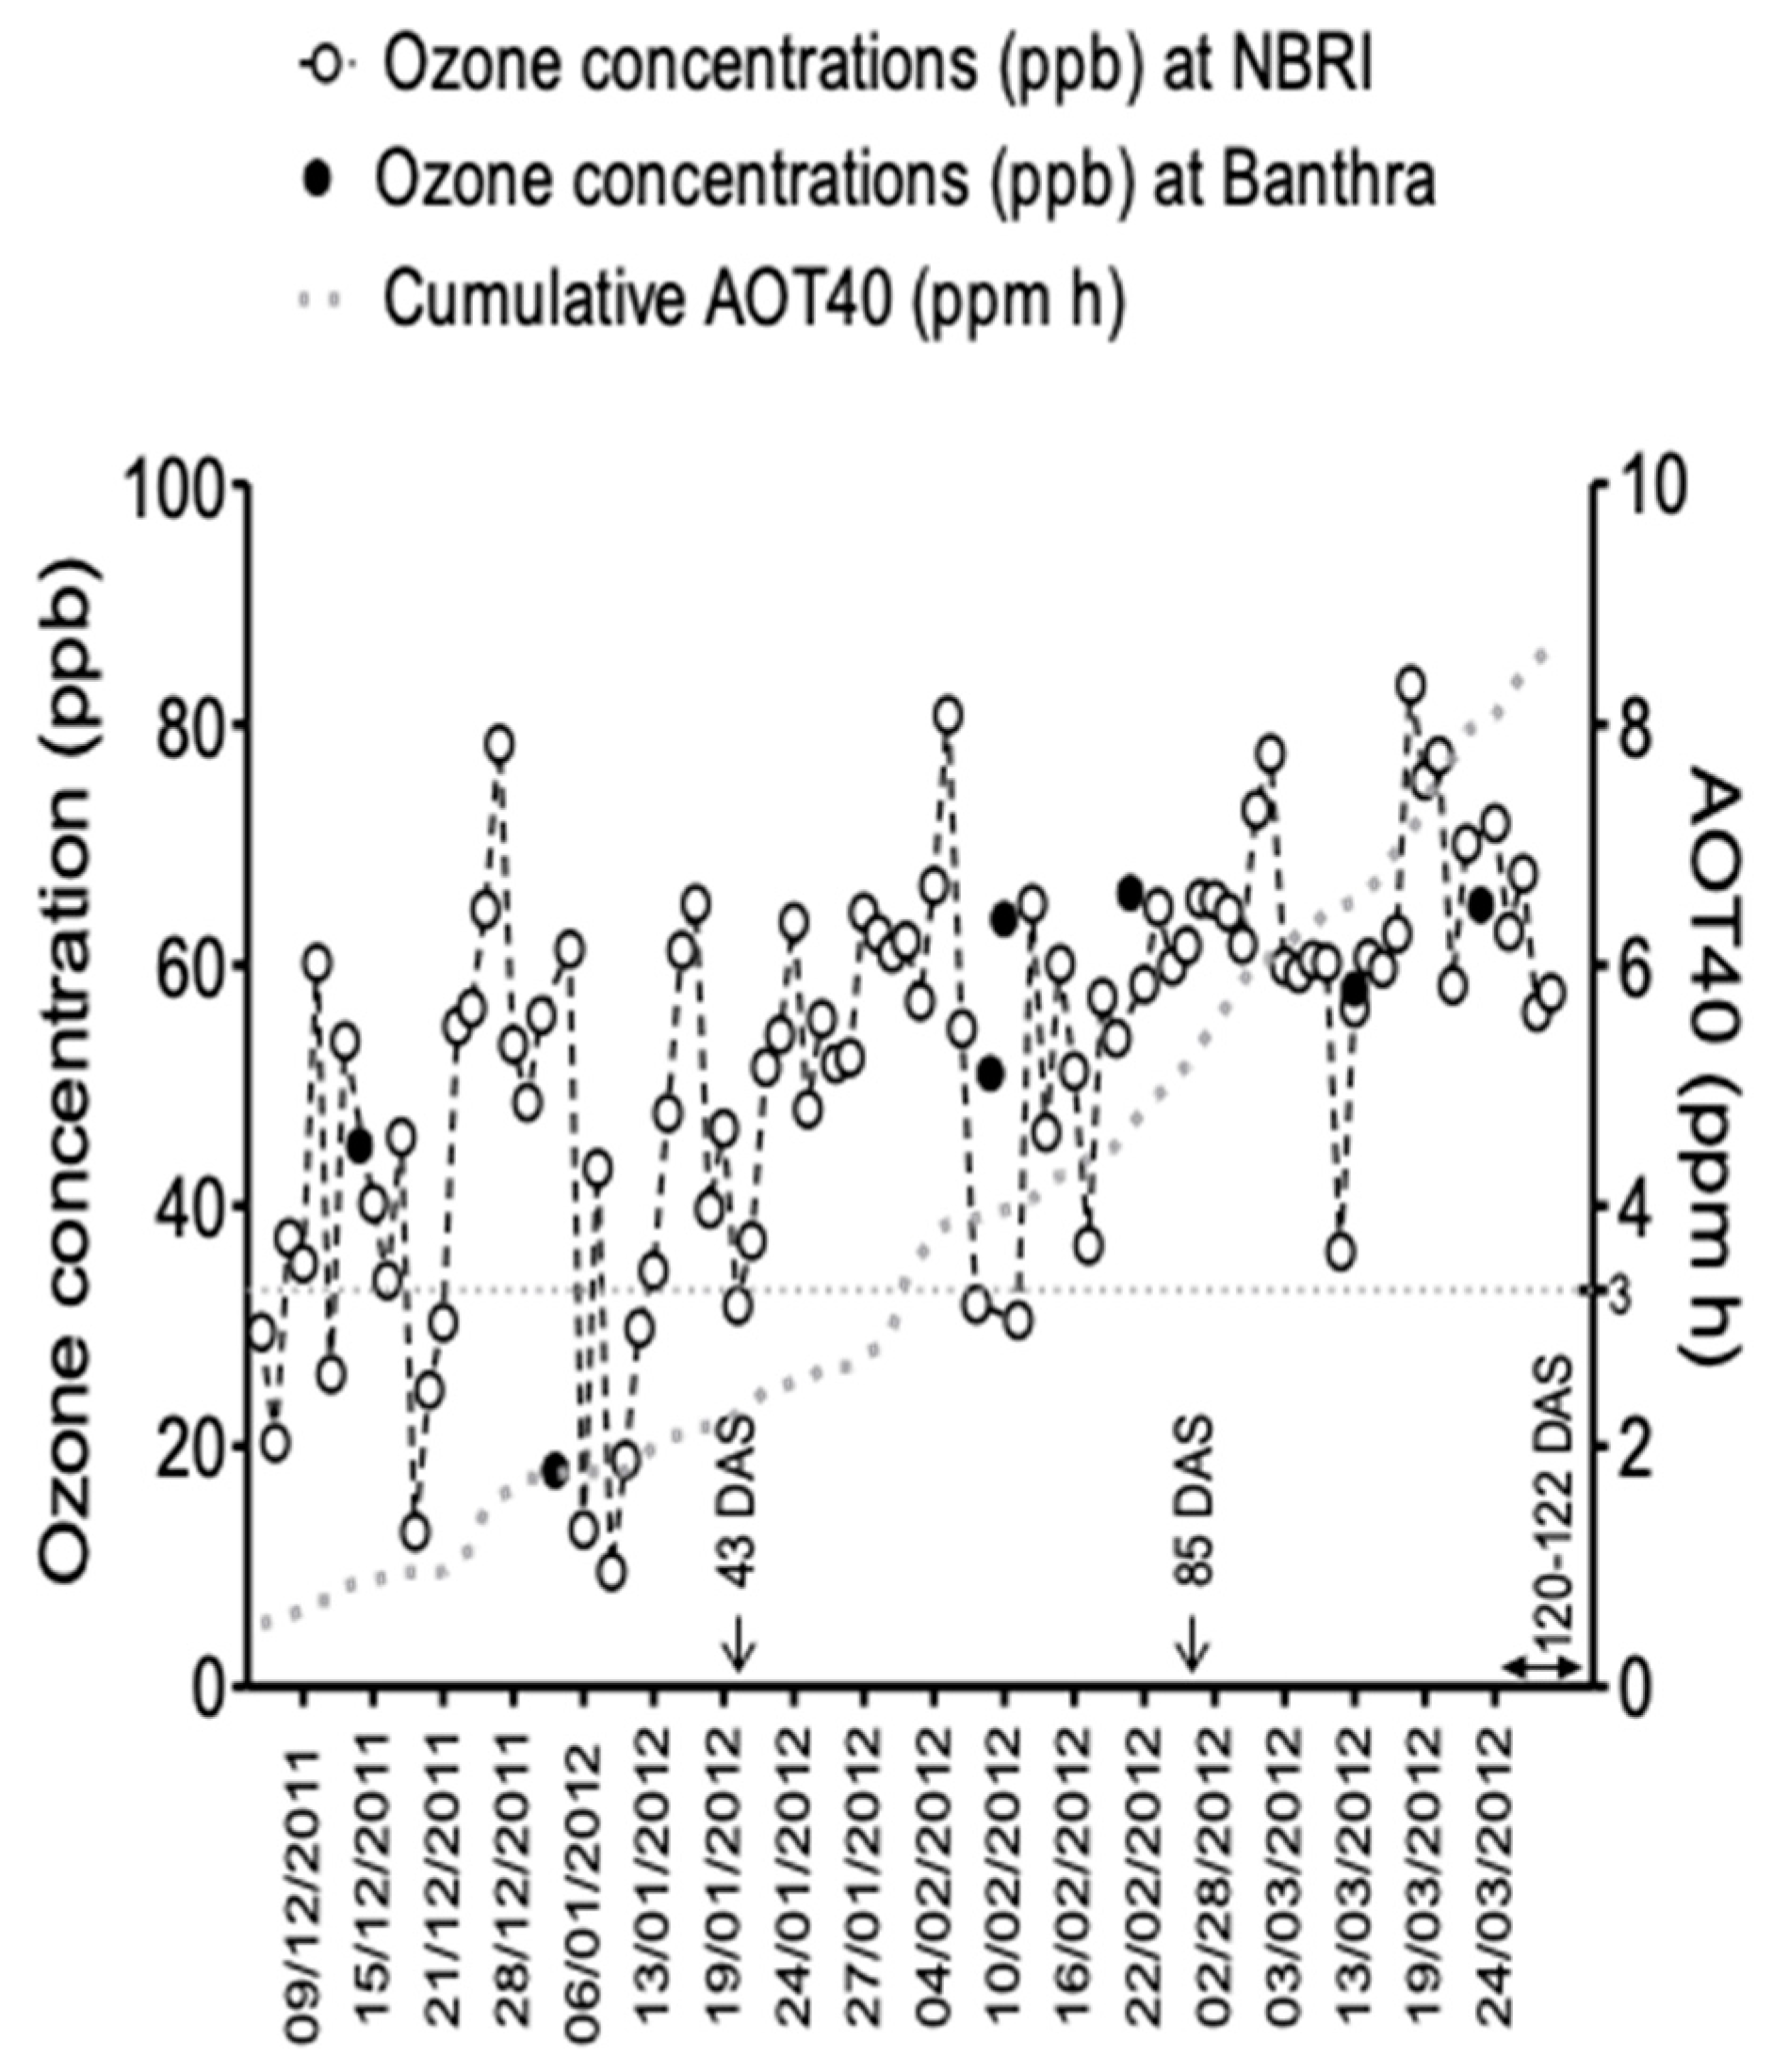
2.3. Ozone Monitoring

Ambient O3 monitoring was carried out with a 2B Tech Ozone Monitor (106-L) for 8 h day−1 (9.00 to 17.00) regularly at the NBRI site, and on weekly basis at the Banthra site using the same device (Figure 2). For the NBRI site, the AOT40 (accumulated exposure over a threshold of 40 ppb) exposure index for the O3 concentration was calculated as described by De Leeuw and Zantvoort [35].

2.4. Biomass and Yield Attributes

Harvest index (HI, the ratio of grain yield and the above ground biomass at maturity), 1000 grain weight, grain weight plant−1, and inflorescence weight plant−1, were measured from three randomly selected plants for each cultivar in both treatments (n = 3) at 120–121 DAS at NBRI and 122 DAS at the Banthra site. Above ground biomass was measured for three plants for each cultivar in both treatments at the harvest phase (n = 3).

2.5. Physiological and Biochemical Measurements

The second youngest fully mature leaves were measured for photosynthetic rate (A), stomatal conductance (gs), and the maximum quantum yield of primary PSII photochemistry (Fv/Fm, the ratio of variable fluorescence to maximum chlorophyll fluorescence) with Li-COR 6400, gas exchange portable photosynthesis system (Li-COR, Lincoln, Nebraska, USA) with a fluorescence chamber (LFC6400-40; Li-COR). Three randomly selected plants of each wheat cultivar in each treatment were measured (n = 3) at the vegetative phase (42–45 DAS) and at the flowering phase at (84–87 DAS) at both experimental sites. The CO2 level inside the leaf cuvette was maintained as 400 µmol mol−1, photosynthetic photon flux density was 1200 µmol mol−1, and leaf temperature was 25 °C.
Leaf samples were collected for the biochemical analyses twice: at the vegetative phase at 43 DAS and at the flowering phase at 85 DAS. The measurements were performed on three randomly selected plants within each cultivar for each treatment (n = 3). Leaf samples were frozen in liquid nitrogen and stored at −80 °C until further analyses. Total chlorophyll content was calculated using equation given in Arnon [36]. The total carotenoid content was calculated from the absorbance values at 480 and 510 nm according to Parsons et al. [37].
Lipid peroxidation in the leaf tissue was determined as 2-thiobarbituric acid (TAB) reactive metabolite, mainly malondialdehyde, Heath and Packer [38]. The Bradford [39] method was used to measure the protein concentration using bovine serum albumin (BSA sigma) as the concentration standard. Superoxide dismutase activity (SOD) was measured using the photochemical NBT method, Beyer and Fridovich [40]. Catalase (CAT) activity was measured by following the reduction in the absorbance at 240 nm as H2O2 was consumed Rao et al. [41]. Reduced glutathione (GSH) and oxidized glutathione (GSSG) content were measured by enzyme recycling assay as illustrated by Griffith [42].

2.6. Statistical Analyses

To test the effects of EDU treatment, cultivar and their interaction, two-way ANOVA was performed with SPSS software (SPSS Inc., version 21.0), separately for the vegetative, flowering and the harvest phase and two experimental sites.
To test the differences in the grain weight plant−1 for all the 11 tested cultivars, a linear regression was conducted between the mean grain weight plant−1 of all the cultivars at each experimental site and EDU treatment (as a numerical measure of the overall quality of the environment) and the individual grain weight of each of the 11 cultivars in the experimental site and treatment combinations. This technique was originally used by Finlay and Wilkinson [43], in order to test the performance of barley in different environments and time scale.
The cultivars were classified in four groups (a–d) based on whether the mean grain weight plant−1 of each cultivar was above or below the mean grain weight plant−1 of all cultivars (site-mean) in the two environments (NBRI and Banthra). The site mean had a regression coefficient of 1 and the cultivars with clearly higher or lower regression coefficient were considered sensitive or insensitive to environmental change, respectively. The groups were named as: (a) “Well-adapted cultivars” that had an above average grain weight plant−1 in all environments. (b) “Poorly adapted cultivars” that had a below average grain weight plant−1 in all environments (c) “Cultivars adapted to high yield environments” whose grain weight plant−1 was higher than the mean in high-yield environments, but lower than the mean in low-yield environments: They had a regression coefficient clearly higher than 1 indicating strong environmental response in yield. (d) “Cultivars adapted to low yield environments” whose grain weight plant−1 was higher than the mean in low yield environments, but lower than mean in high-yield environments. Their regression coefficient was less than 1. Details of the technique used have been illustrated in Pandey et al. [32]. The Spearman correlation of grain yield plant−1 with the other measured parameters was tested. The analysis was performed separately for pooled data with all the cultivars and for each cultivar response group.

3. Results

Detailed O3 data was collected at the NBRI site throughout the study. Less frequent measurements from the Banthra site followed the same pattern. Daily mean O3 concentrations were above 40 ppb during most of the growing season for wheat, especially during the flowering phase (in February and March), although high daily O3 concentrations were observed throughout the experiment (Figure 2). The average O3 concentrations (day time average based on hourly values between 09:00 and 17:00 h) of 45, 45, 57 and 65 ppb were recorded for December, January, February and March, respectively. The average ambient O3 concentration was 52.8 ppb and ranged between 9.6 and 83.3 ppb during the growth period of wheat. Accumulated Ozone exposure over the Threshold of 40 ppb (AOT40 exposure) was 8.66 ppm h at NBRI site (Figure 2).

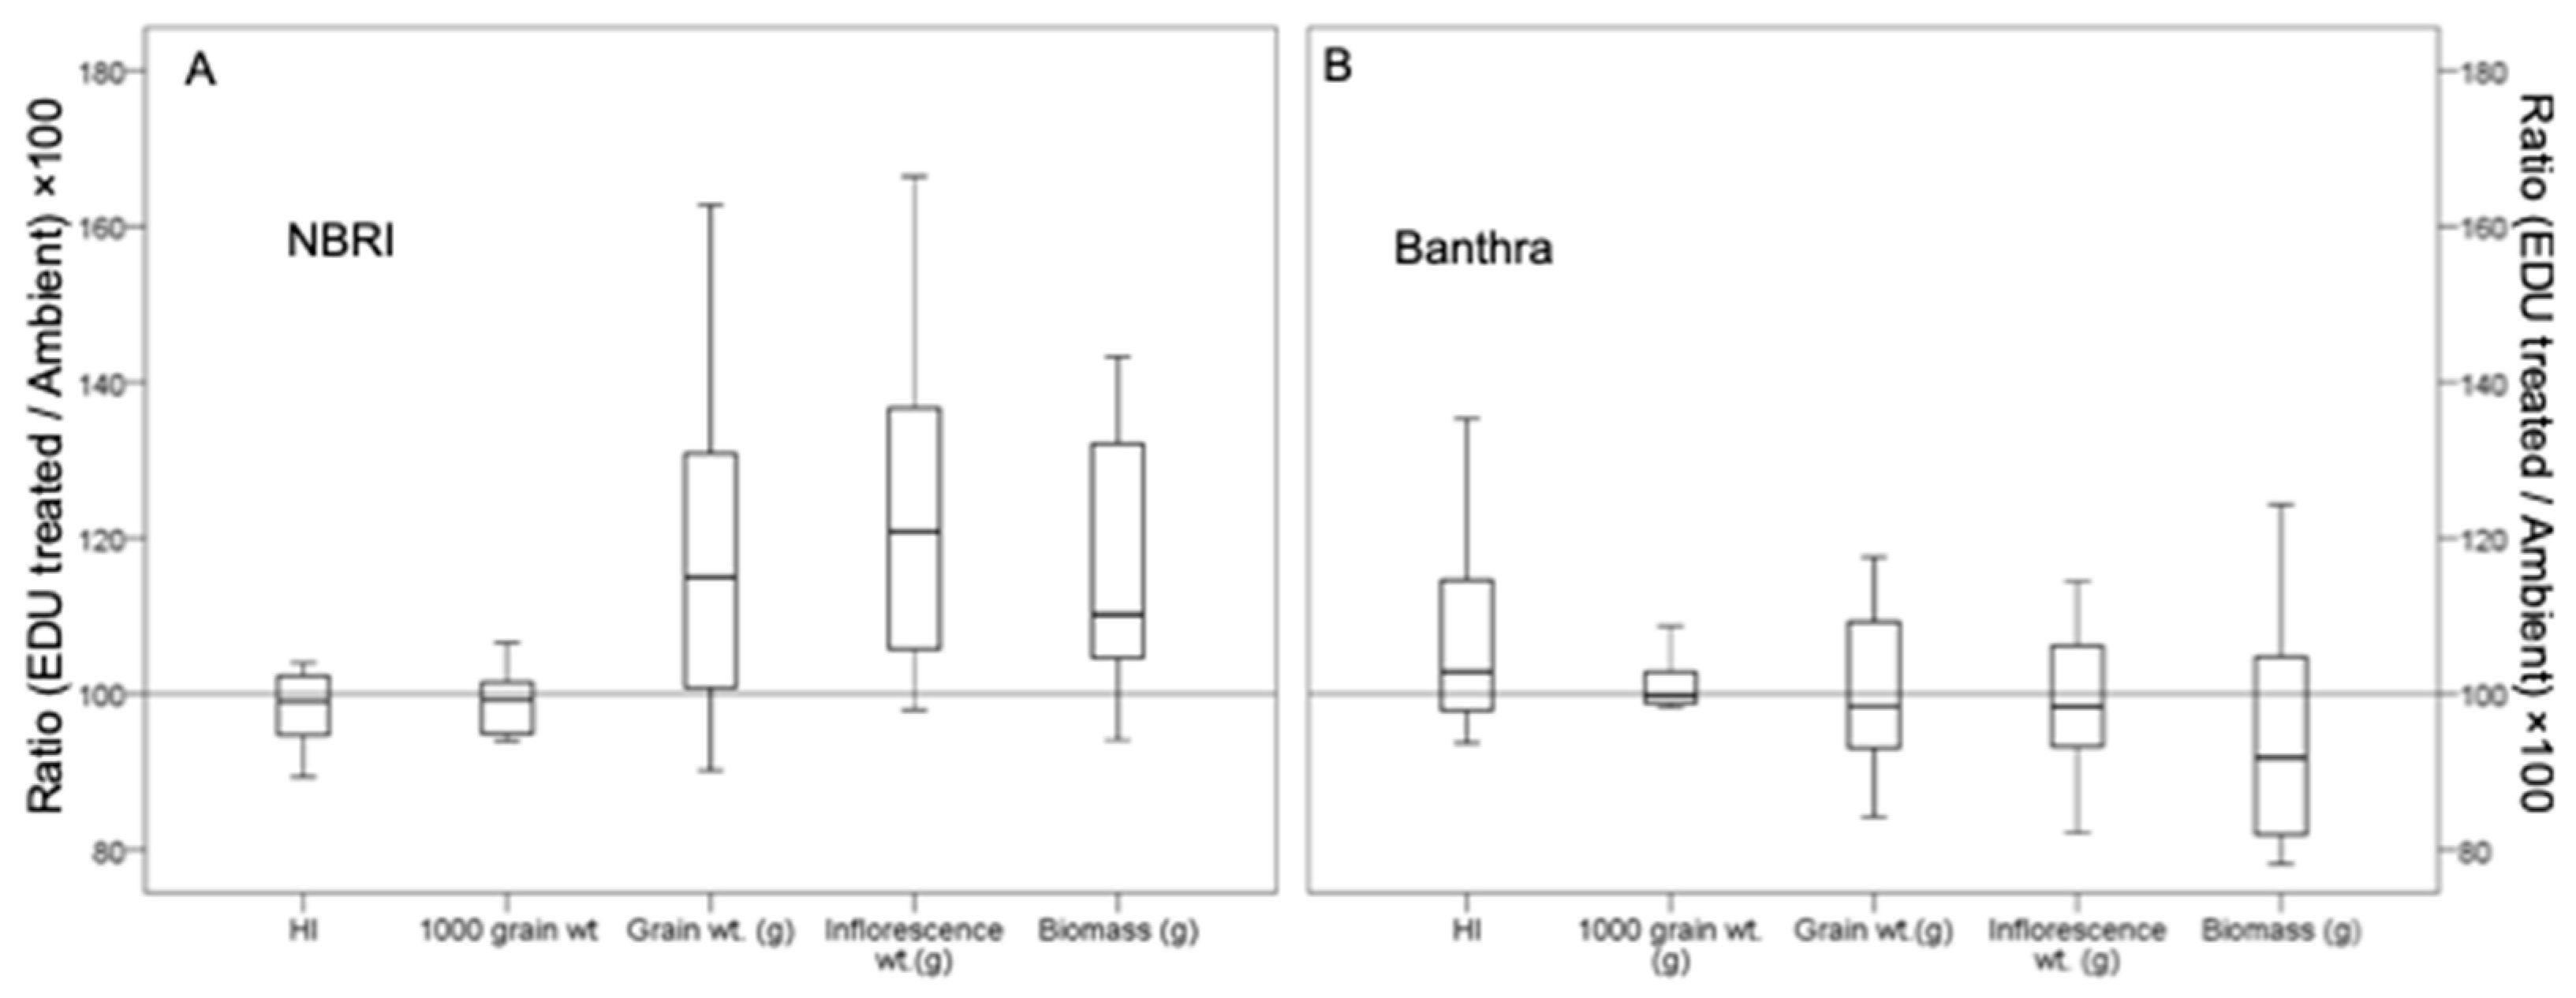
3.1. Yield and Biomass in Response to EDU Treatment

The yield attributes (HI, grain weight plant−1 and weight of inflorescence) were generally higher in EDU-treated than in non-EDU treated plants, particularly at NBRI site (Figure 3, Figure S1). However, large variation between cultivars in the response to EDU for all yield parameters was evident by the significant Cv × EDU treatment interaction in ANOVA (Table 1 and Figure S1).
Biomass was significantly higher with EDU treatment than in non-EDU treated plants for all the cultivars at the NBRI site (Figure 3A). Since both the grain yield and the biomass were higher in response to EDU, HI was slightly lower in response to EDU treatment at NBRI site (Figure 3A). At Banthra, biomass decreased, and grain yield remained the same, and thus HI improved with EDU treatment, which is indicated by the median in the box-plot suggesting that more than 50% of the cultivars showed improved HI (Figure 3B).
The 11 cultivars represented different response groups in a regression analysis of grain weight plant−1: (a) three cultivars (Kundan, WR544 and PBW550) were generally well-adapted with above-average yield (Figure 4A), (b) three cultivars (PBW373, PBW154, HUW234) were poorly-adapted with below-average yield (Figure 4A); (c) two cultivars (PBW343, LOK1) were adapted to low-yield environments (Figure 4B); and (d) three cultivars (PBW502, WH711 and DBW17) were adapted to high-yield environments (Figure 4B). The cultivars adapted to high-yield environments (WH711 and DBW17) had the poorest grain yield of the whole experiment at the NBRI site at ambient O3 conditions.

3.2. Gas Exchange and Pigments

Gas exchange was affected by cultivar, EDU, developmental stage and study site. Although impact of EDU on A and gs was variable among the cultivars as shown by the significant Cv × EDU treatment interactions (Table 1 and Figure S2) EDU-treated plants tended to have higher A and gs than non-EDU ones (significantly only in Banthra at vegetative phase) (Supplementary Figures S3 and S5).
Cultivars differed from each other also in the contents of pigments (chlorophyll, carotenoids) throughout the experiment at both experimental sites (Figure S4). Contents of chlorophyll and carotenoids differed among the cultivars and treatments in a similar way. Significantly lower contents of chlorophyll and carotenoids were detected in EDU-treated plants than non-EDU ones in the flowering phase at both experimental sites (Figure S5). EDU-treated plants had higher chlorophyll and carotenoid content than the non-EDU treated plants at the vegetative phase at NBRI (Figure S5), whereas they had similar or even lower contents of pigments at the flowering phase at both experimental sites (Figure S5).

3.3. Biochemical Measurements

EDU treatment had a significant effect on all measured biochemical parameters (MDA, CAT, GSH, GSSG, SOD), but the responses varied among the cultivars, developmental phases and experimental sites throughout the experiment (Table 1 and Figures S3, S6 and S7). Lipid peroxidation (MDA content) tended to be lower in EDU-treated plants than non-EDU ones at both experimental sites (except for Banthra at the vegetative phase) (Figure S7). EDU-treated plants had higher SOD activity and GSH content than non-EDU treated ones in Banthra at vegetative stage, while EDU-treated plants had lower SOD activity than non-EDU treated ones (NBRI, vegetative phase), GSSG content (NBRI, flowering phase; Banthra, vegetative phase) than non-EDU ones (Figure S7).

3.4. Correlations of Measured Parameters and Grain Yield

The strongest positive correlations to grain yield across all response groups were found for inflorescence weight−1 and biomass, except for the cultivars adapted to low-yield environments (Table 2). HI showed a positive correlation with grain yield in the cultivars adapted to high-yield environments. The strongest negative correlations to grain yield were found for CAT activity (except for the cultivars adapted to high-yield conditions) and GSSG (except for the cultivars adapted to low-yield conditions) at the flowering phase. The grain yield of the well-adapted cultivars showed a positive correlation with A at the flowering phase (Table 2). The grain yield of the poorly-adapted cultivars showed positive correlation with A and gs at the vegetative phase, followed by strong negative correlations with the CAT, GSSG and MDA at the flowering stage (Table 2). The grain yield of the cultivars adapted to low-yield conditions showed negative correlations with chlorophyll content at the vegetative phase and CAT at the flowering phase (Table 2). In the cultivars adapted to high-yield environments, strong negative correlation was found with SOD at the vegetative phase, accompanied by positive correlations with CAT, GSH and GSSG. At the flowering phase, positive correlation with SOD and contents of chlorophyll and carotenoids were accompanied with negative correlations with CAT, GSSG and gas exchange parameters.

4. Discussion

In this study EDU application was used as ozone-protectant to indicate the severity of the O3-induced damage in wheat production in an agriculturally important region suffering from high pollution in a highly populated area of India. The O3 concentration increased gradually during the growing period of wheat from December to March, particularly at the grain filling phase (February to March), which has been considered to be the most sensitive stage to O3 damage, especially for wheat [44]. The critical three-month O3 level for wheat (3 ppm h) [25] was not reached at the vegetative phase, but it was attained before the flowering phase resulting in O3 exposure that was double than the estimated damage threshold by the harvest time. Accordingly, our results indicate the strong impact of O3 in the flowering and harvest stage. AOT40 values and the average O3 concentrations were in line with the other studies performed in this region of India reviewed by Oksanen et al. [13] and Ainsworth [3], e.g., with mustard (Brassica campestris) [45] and clover (Trifolium alexandrium L.) [27].

4.1. Biomass, Allocation Strategies and Grain Yield

Our experiment showed clear differences in antioxidant and gas exchange parameters among the cultivars, adaptation groups and the two developmental phases. These results can be linked to O3-tolerance and O3-defence strategies, because plants treated with EDU application can be regarded to represent clean-air controls. O3 tolerance of the plants can be linked to two important strategies, the regulation of stomatal conductance and the potential to detoxify the ROS generated in the course O3 degradation [14,46,47,48]. Previous studies have also indicated that O3-sensitive cultivars tend to allocate more of their resources to defense actions in response to O3 limiting biomass [27,45,49,50].
In the present study, biomass accumulation showed a positive significant correlation with the grain yield. The associations between the grain yield and other parameters in this study indicated that the grain yield of the well-adapted cultivars was not associated with the biochemical parameters, but rather the higher the yield was correlating with high photosynthesis (A) at the flowering stage (Table 2). Poorly-adapted cultivars showed positive correlations with gas exchange rates during the vegetative stage, which may indicate high O3 uptake, accompanied by weak antioxidative defense through GSSG and CAT. Cultivars adapted to low-yield conditions were limited by chlorophyll content and poor defense by CAT. Cultivars adapted to high-yield conditions (including EDU protection) are relying on high antioxidative defense through CAT, GSH, GSSG during the vegetative stage, with negative correlations (trade-off) with SOD. At the flowering stage, antioxidant status was reversed and accompanied by low gas exchange rates but high contents of chlorophyll and carotenoids. Thus, our study indicated that defense strategies are complex and may vary during the development. Clearly, low grain yield in our experiment was associated with low CAT activity but high GSSG content at the flowering phase for most of the cultivar groups. GSSG content has been shown to accumulate in response to O3, as well as GSH content and total glutathione [51]. Higher total glutathione content has been associated with high tolerance to O3 in poplar trees [51]. Singh et al. [49] have exposed 14 wheat cultivars to elevated (ambient +30 ppb) O3 and classified them in three different classes: sensitive, intermediately sensitive, and tolerant cultivars based on the cumulative stress response matrix using growth, physiological and yield. Two cultivars included also in our study, i.e., the well-adapted Kundan and the high-yield environment adapted PBW502, were classified by Singh et al. [49] as O3-tolerant and intermediately sensitive, respectively, which was in accordance with our classification despite the different grouping method. Reduced biomass due to O3 stress may also be attributed to several other physiological and biochemical events in the developmental phase of the plants, for example decline in Rubisco activity [50]. Pleijel and Uddling [52] reported that O3 can significantly reduce the proportion of above-ground biomass converted to grains, on the contrary, in the present study, biomass accumulation showed a positive significant correlation with the grain yield.
The higher biomass and yield with EDU treatment compared to ambient field conditions reflect the positive effects of EDU in those parameters, which are often negatively affected by O3 [53,54]. In a meta-analysis by Feng et al. [33] the increase of the above-ground biomass by 6.7% was reported with EDU treatment. Similar biomass enhancements with EDU treatment under high O3 have been reported in wheat (Triticum aestivum L.) [55], mustard (Brassica campestris L.) [45], rice (Oryza sativa L.) [32] and pea (Phaseolus vulgaris L.) [56]. In addition to positive impact of EDU, in the present study indicated that the resource allocation strategies in response with EDU differed among the wheat cultivars and between experimental sites. At NBRI, the wheat plants showed more efficient resource allocation towards grains in response to EDU treatment which was accompanied by improved biomass and slight decrease in HI. However, at Banthra, the biomass was lower with EDU-treated plants than non-EDU ones and HI was slightly improved (due to decrease in above-ground biomass) and grain yield was not higher with EDU-treatment than in non-EDU treated plants.

4.2. EDU as a Tool to Reveal Ozone Impact

In the present study, EDU responses were not only limited to growth, gas-exchange or the biochemical parameters, but also showed that the prevailing O3 concentration had an adverse effect on yield attributes, reflected as reduced grain yield at the harvest phase. EDU-mediated increase in the antioxidant defense (SOD, CAT, APX and GR), growth parameters, biomass, and yield attributes have been reported in previous studies under high O3 conditions. The activation of the antioxidative defense and EDU responses, however, are related to severity of the oxidative stress [11,13,29,30,32,45,50,55,57,58,59,60].
The positive impact of EDU on gas exchange and photosynthesis related parameters is not well-established, as evidenced also in our experiment showing the high variation among the cultivars. Feng et al. [33], Hassan et al. [61] and Manning et al. [57] have reported that EDU did not show any clear effect on the gs and A. On the other hand, a positive impact of EDU on gs in rice [59] and wheat [26] and on A, gs, light reaction and Fv/Fm in pea (Phaseolus vulgaris L.) [56] have been reported, especially on O3 sensitive cultivars, which is in accordance with our results at vegetative phase at Banthra. The higher chlorophyll content in non-EDU grown plants than in EDU-treated plants during the flowering phase (NBRI and Banthra) may indicate O3-induced compensatory responses in the newly formed leaves, as all the measurements were conducted on the youngest fully mature leaves. Such compensatory responses appearing as increased shoot weight plant−1 [32,62] leaf greenness, and photosynthetic adjustment [32,63] have been reported in response to high O3. The similarity of responses between chlorophyll and carotenoid content across the cultivars was expected because of the similarity in the regulation of their biosynthesis [64].
Our experiment demonstrates the applicability of EDU as a surface treatment in large-scale screening for O3-tolerance in wheat cultivars in different environments. A recent study by Ashrafuzzaman et al. [31] also suggest that EDU did not interfere with the gene-regulations and did not affect the tolerance of the plants to other abiotic stresses, such as iron toxicity, zinc deficiency and salinity stresses, under O3-stress conditions in rice, which further strengthen the potential use of EDU in field conditions. Several other studies with rice [32,55,59] and wheat [50,55] have also reported the usefulness of EDU in the field conditions in identifying O3-tolerant cultivars. In the present study, the EDU-responses varied not only among the cultivars, but also due to growth phase and experimental site, as reported also in pea [65], mustard [45], rice [32,59] and wheat [50]. Although the exact mechanism for the mode of action of EDU still unclear, it has been demonstrated that the nitrogen present in EDU has no role in fertilization, growth regulation, or grain yield under O3-free conditions [2,59].
EDU is currently not commercially available and can thus be applied for research purposes only. Earlier studies with EDU suggest the range between 100 and 300 ppm (100 to 300 mg L−1) to be the most effective concentration in ameliorating negative effects against O3 without having any toxic effects of its own [2]. The concentration of 300 mg EDU L−1 was also recommended as the upper limit for toxicity in a toxicological bioassay in Lemna minor [66]. Manning et al. [30] reported that EDU did not show any constitutive effects on the crops in O3-free control conditions.

5. Conclusions

Our experiment with EDU application at two different high-ozone environments indicated high variation in the resource allocation and the defense strategies in the Indian wheat cultivars. The well-adapted cultivars in our study, i.e., Kundan, WR544 and PBW550 showed a high yield regardless of the site in the IGP area of India. In these well-adapted cultivars, the grain yield was related to high net assimilation (A) at the flowering stage of the development and high biomass accumulation at the end of the experiment. On the other hand, all other response groups showed high stomatal conductance and net assimilation at vegetative phase and low antioxidant defense (CAT activity, glutathione content) at vegetative and flowering phases. The cultivars that were able to maintain high antioxidative defense and net assimilation capacity ended up with higher yield indicating higher ozone tolerance. It is clear that a wide screening of wheat cultivars is necessary to improve food-security for crops in areas experiencing high O3 concentrations. Based on our results, high throughput screening will reveal high differences among cultivars and help to find the key parameters to be studied.

Supplementary Materials

The following are available online at https://0-www-mdpi-com.brum.beds.ac.uk/2225-1154/7/2/23/s1.

Author Contributions

E.O. conceived the project. A.K.P. and B.M. performed the experimental part. V.P. supervised the experiments. A.K.P., S.K.-S. (Sarita Keski-Saari), S.K.-S. (Sari Kontunen-Soppela), E.O., V.P. performed writing reviewing and editing.

Funding

This study was funded by the Academy of Finland, project no 138161. AKP also acknowledges FinCEAL Plus Research Visit Grant project No. 51770 for the financial support to travel to Finland.

Acknowledgments

The authors express a sincere thanks to W.J. Manning, Department of Plant, Soil and Insect Science, University of Massachusetts, Amherest, USA, for providing EDU for this study. AP and BM thank the Academy of Finland and for the financial support. Jenna Lihavainen is acknowledged for long insightful discussions.

Conflicts of Interest

The authors declare no conflict of interest.

References

  1. Agathokleous, E.; Saitanis, C.J.; Koike, T. Tropospheric O3, the nightmare of wild plants: A review study. J. Agric. Meteorol. 2015, 71, 142–152. [Google Scholar] [CrossRef]
  2. Agathokleous, E. Perspectives for elucidating the ethylenediurea (EDU) mode of action for protection against O3 phytotoxicity. Ecotoxicol. Environ. Saf. 2017, 142, 530–537. [Google Scholar] [CrossRef] [PubMed]
  3. Ainsworth, E.A. Understanding and improving global crop response to ozone pollution. Plant J. 2017, 90, 886–897. [Google Scholar] [CrossRef]
  4. Emberson, L.D.; Büker, P.; Ashmore, M.R.; Mills, G.; Jackson, L.S.; Agrawal, M.; Atikuzzaman, M.D.; Cinderby, S.; Engardt, M.; Jamir, C.; et al. A comparison of North American and Asian exposure–response data for ozone effects on crop yields. Atmos. Environ. 2009, 43, 1945–1953. [Google Scholar] [CrossRef]
  5. Tai, A.P.; Martin, M.V.; Heald, C.L. Threat to future global food security from climate change and ozone air pollution. Nat. Clim. Chang. 2014, 4, 817. [Google Scholar] [CrossRef]
  6. Fuhrer, J. Ozone risk for crops and pastures in present and future climates. Naturwissenschaften 2009, 96, 173–194. [Google Scholar] [CrossRef] [PubMed]
  7. Tai, A.P.K.; Val Martin, M. Impacts of ozone air pollution and temperature extremes on crop yields: Spatial variability, adaptation and implications for future food security. Atmos. Environ. 2017, 169, 11–21. [Google Scholar] [CrossRef]
  8. Avnery, S.; Mauzerall, D.L.; Fiore, A.M. Increasing global agricultural production by reducing ozone damages via methane emission controls and ozone-resistant cultivar selection. Glob. Chang. Biol. 2013, 19, 1285–1299. [Google Scholar] [CrossRef]
  9. Feng, Z.; Hu, E.; Wang, X.; Jiang, L.; Liu, X. Ground-level O3 pollution and its impacts on food crops in China: A review. Environ. Pollut. 2015, 199, 42–48. [Google Scholar] [CrossRef]
  10. Tiwari, S.; Rai, R.; Agrawal, M. Annual and seasonal variations in tropospheric ozone concentrations around Varanasi. Int. J. Remote Sens. 2008, 29, 4499–4514. [Google Scholar] [CrossRef]
  11. Tiwari, S. Ethylenediurea as a potential tool in evaluating ozone phytotoxicity: A review study on physiological, biochemical and morphological responses of plants. Environ. Sci. Pollut. Res. 2017, 24, 14019–14039. [Google Scholar] [CrossRef] [PubMed]
  12. Brauer, M. The global burden of disease from air pollution. In Proceedings of the 2016 AAAS Annual Meeting, Washington, DC, USA, 11–15 February 2016. [Google Scholar]
  13. Oksanen, E.; Pandey, V.; Pandey, A.K.; Keski-Saari, S.; Kontunen-Soppela, S.; Sharma, C. Impacts of increasing ozone on Indian plants. Environ. Pollut. 2013, 177, 189–200. [Google Scholar] [CrossRef] [PubMed]
  14. Pandey, A.K.; Ghosh, A.; Agrawal, M.; Agrawal, S.B. Effect of elevated ozone and varying levels of soil nitrogen in two wheat (Triticum aestivum L.) cultivars: Growth, gas-exchange, antioxidant status, grain yield and quality. Ecotoxicol. Environ. Saf. 2018, 158, 59–68. [Google Scholar] [CrossRef] [PubMed]
  15. Tiwari, S.; Agrawal, M. Effect of Ozone on Physiological and Biochemical Processes of Plants. In Tropospheric Ozone and its Impacts on Crop Plants; Springer: Cham, Switzerland, 2018; pp. 65–113. [Google Scholar]
  16. United Nations Population Division (2010) World Population Prospects, the 2010 Revision. Available online: http://esa.un.org/unpd/wpp/ (accessed on 20 April 2018).
  17. Avnery, S.; Mauzerall, D.L.; Liu, J.; Horowitz, L.W. Global crop yield reductions due to surface ozone exposure: 2. Year 2030 potential crop production losses and economic damage under two scenarios of O3 pollution. Atmos. Environ. 2011, 45, 2297–2309. [Google Scholar] [CrossRef]
  18. Castagna, A.; Ranieri, A. Detoxification and repair process of ozone injury: From O3 uptake to gene expression adjustment. Environ. Pollut. 2009, 157, 1461–1469. [Google Scholar] [CrossRef]
  19. Fiscus, E.L.; Booker, F.L.; Burkey, K.O. Crop responses to ozone: Uptake, modes of action, carbon assimilation and partitioning. Plant Cell Environ. 2005, 28, 997–1011. [Google Scholar] [CrossRef]
  20. Vahisalu, T.; Puzõrjova, I.; Brosché, M.; Valk, E.; Lepiku, M.; Moldau, H.; Pechter, P.; Wang, Y.S.; Lindgren, O.; Salojärvi, J.; Loog, M. Ozone-triggered rapid stomatal response involves the production of reactive oxygen species, and is controlled by SLAC1 and OST1. Plant J. 2010, 62, 442–453. [Google Scholar] [CrossRef]
  21. Black, V.J.; Black, C.R.; Roberts, J.A.; Stewart, C.A. Tansley Review No. 115 Impact of ozone on the reproductive development of plants. New Phytol. 2000, 147, 421–447. [Google Scholar] [CrossRef]
  22. Feng, Z.; Kobayashi, K. Assessing the impacts of current and future concentrations of surface ozone on crop yield with meta-analysis. Atmos. Environ. 2009, 43, 1510–1519. [Google Scholar] [CrossRef] [Green Version]
  23. Tomer, R.; Bhatia, A.; Kumar, V.; Kumar, A.; Singh, R.; Singh, B.; Singh, S.D. Impact of elevated ozone on growth, yield and nutritional quality of two wheat species in Northern India. Aerosol Air Qual. Res. 2015, 15, 329–340. [Google Scholar] [CrossRef]
  24. Ghude, S.D.; Jena, C.; Chate, D.M.; Beig, G.; Pfister, G.G.; Kumar, R.; Ramanathan, V. Reductions in India’s crop yield due to ozone. Geophys. Res. Lett. 2014, 41, 5685–5691. [Google Scholar] [CrossRef]
  25. Mills, G.; Buse, A.; Gimeno, B.; Bermejo, V.; Holland, M.; Emberson, L.; Pleijel, H. A synthesis of AOT40-based response functions and critical levels of ozone for agricultural and horticultural crops. Atmos. Environ. 2007, 41, 2630–2643. [Google Scholar] [CrossRef]
  26. Singh, S.; Agrawal, S.B.; Agrawal, M. Differential protection of ethylenediurea (EDU) against ambient ozone for five cultivars of tropical wheat. Environ. Pollut. 2009, 157, 2359–2367. [Google Scholar] [CrossRef] [PubMed]
  27. Singh, S.; Singh, P.; Agrawal, S.B.; Agrawal, M. Use of Ethylenediurea (EDU) in identifying indicator cultivars of Indian clover against ambient ozone. Ecotoxicol. Environ. Saf. 2018, 147, 1046–1055. [Google Scholar] [CrossRef]
  28. Carnahan, J.E.; Jenner, E.L.; Wat, E.K.W. Prevention of ozone injury to plants by a new protectant chemical. Phytopathology 1978, 68, 1229. [Google Scholar] [CrossRef]
  29. Paoletti, E.; Contran, N.; Manning, W.J.; Ferrara, A.M. Use of the antiozonant ethylenediurea (EDU) in Italy: Verification of the effects of ambient ozone on crop plants and trees and investigation of EDU’s mode of action. Environ. Pollut. 2009, 157, 1453–1460. [Google Scholar] [CrossRef] [PubMed]
  30. Manning, W.J.; Paoletti, E.; Sandermann Jr, H.; Ernst, D. Ethylenediurea (EDU): A research tool for assessment and verification of the effects of ground level ozone on plants under natural conditions. Environ. Pollut. 2011, 159, 3283–3293. [Google Scholar] [CrossRef] [PubMed]
  31. Ashrafuzzaman, M.; Haque, Z.; Ali, B.; Mathew, B.; Yu, P.; Hochholdinger, F.; de Abreu Neto, J.B.; McGillen, M.R.; Ensikat, H.J.; Manning, W.J.; et al. Ethylenediurea (EDU) mitigates the negative effects of ozone in rice: Insights into its mode of action. Plant Cell Environ. 2018, 41, 2882–2898. [Google Scholar] [CrossRef]
  32. Pandey, A.K.; Majumder, B.; Keski-Saari, S.; Kontunen-Soppela, S.; Mishra, A.; Sahu, N.; Pandey, V.; Oksanen, E. Searching for common responsive parameters for ozone tolerance in 18 rice cultivars in India: Results from ethylenediurea studies. Sci. Total Environ. 2015, 532, 230–238. [Google Scholar] [CrossRef]
  33. Feng, Z.; Wang, S.; Szantoi, Z.; Chen, S.; Wang, X. Protection of plants from ambient ozone by applications of ethylenediurea (EDU): A meta-analytic review. Environ. Pollut. 2010, 158, 3236–3242. [Google Scholar] [CrossRef] [Green Version]
  34. Paoletti, E.; Castagna, A.; Ederli, L.; Pasqualini, S.; Ranieri, A.; Manning, W.J. Gene expression in snapbeans exposed to ozone and protected by ethylenediurea. Environ. Pollut. 2014, 193, 1–5. [Google Scholar] [CrossRef] [PubMed]
  35. De Leeuw, F.A.A.M.; Van Zantvoort, E.D.G. Mapping of exceedances of ozone critical levels for crops and forest trees in the Netherlands: Preliminary results. Environ. Pollut. 1997, 96, 89–98. [Google Scholar] [CrossRef]
  36. Arnon, D.I. Copper enzymes in isolated chloroplasts. Polyphenoloxidase in Beta vulgaris. Plant Physiol. 1949, 24, 1–15. [Google Scholar] [CrossRef]
  37. Parsons, T.R.; Maita, Y.; Lalli, C.M. A Manual of Chemical and Biological Methods for Seawater Analysis; Pergamon Press: Oxford, UK, 1984. [Google Scholar]
  38. Heath, R.L.; Packer, L. Photoperoxidation in isolated chloroplasts: I. Kinetics and stoichiometry of fatty acid peroxidation. Arch. Biochem. Biophys. 1968, 125, 189–198. [Google Scholar] [CrossRef]
  39. Bradford, M.M. A rapid and sensitive method for the quantitation of microgram quantities of protein utilizing the principle of protein-dye binding. Anal. Biochem. 1976, 72, 248–254. [Google Scholar] [CrossRef]
  40. Beyer, W.F., Jr.; Fridovich, I. Assaying for superoxide dismutase activity: Some large consequences of minor changes in conditions. Anal. Biochem. 1987, 161, 559–566. [Google Scholar] [CrossRef]
  41. Rao, M.V.; Paliyath, G.; Ormrod, D.P. Ultraviolet-B-and ozone-induced biochemical changes in antioxidant enzymes of Arabidopsis thaliana. Plant Physiol. 1996, 110, 125–136. [Google Scholar] [CrossRef] [PubMed]
  42. Griffith, O.W. Determination of glutathione and glutathione disulfide using glutathione reductase and 2-vinylpyridine. Anal. Biochem. 1980, 106, 207–212. [Google Scholar] [CrossRef]
  43. Finlay, K.W.; Wilkinson, G.N. The analysis of adaptation in a plant-breeding programme. Aust. J. Agric. Res. 1963, 14, 742–754. [Google Scholar] [CrossRef] [Green Version]
  44. Picchi, V.; Iriti, M.; Quaroni, S.; Saracchi, M.; Viola, P.; Faoro, F. Climate variations and phenological stages modulate ozone damages in field-grown wheat. A three-year study with eight modern cultivars in Po Valley (Northern Italy). Agric. Ecosyst. Environ. 2010, 135, 310–317. [Google Scholar] [CrossRef]
  45. Pandey, A.K.; Majumder, B.; Keski-Saari, S.; Kontunen-Soppela, S.; Pandey, V.; Oksanen, E. Differences in responses of two mustard cultivars to ethylenediurea (EDU) at high ambient ozone concentrations in India. Agric. Ecosyst. Environ. 2014, 196, 158–166. [Google Scholar] [CrossRef]
  46. Brosché, M.; Merilo, E.B.E.; Mayer, F.; Pechter, P.; Puzõrjova, I.; Brader, G.; Kangasjärvi, J.; Kollist, H. Natural variation in ozone sensitivity among Arabidopsis thaliana accessions and its relation to stomatal conductance. Plant Cell Environ. 2010, 33, 914–925. [Google Scholar] [CrossRef] [PubMed] [Green Version]
  47. Dizengremel, P.; Le Thiec, D.; Bagard, M.; Jolivet, Y. Ozone risk assessment for plants: Central role of metabolism-dependent changes in reducing power. Environ. Pollut. 2008, 156, 11–15. [Google Scholar] [CrossRef] [PubMed]
  48. Felzer, B.S.; Cronin, T.; Reilly, J.M.; Melillo, J.M.; Wang, X. Impacts of ozone on trees and crops. C. R. Geosci. 2007, 339, 784–798. [Google Scholar] [CrossRef] [Green Version]
  49. Singh, A.A.; Fatima, A.; Mishra, A.K.; Chaudhary, N.; Mukherjee, A.; Agrawal, M.; Agrawal, S.B. Assessment of ozone toxicity among 14 Indian wheat cultivars under field conditions: Growth and productivity. Environ. Monit. Assess. 2018, 190, 190. [Google Scholar] [CrossRef]
  50. Gupta, S.K.; Sharma, M.; Majumder, B.; Maurya, V.K.; Lohani, M.; Deeba, F.; Pandey, V. Impact of Ethylene diurea (EDU) on growth, yield and proteome of two winter wheat varieties under high ambient ozone phytotoxicity. Chemosphere 2017, 196, 161–173. [Google Scholar] [CrossRef] [PubMed]
  51. Dumont, J.; Keski-Saari, S.; Keinänen, M.; Cohen, D.; Ningre, N.; Kontunen-Soppela, S.; Baldet, P.; Gibon, Y.; Dizengremel, P.; Vaultier, M.N.; et al. Ozone affects ascorbate and glutathione biosynthesis as well as amino acid contents in three Euramerican poplar genotypes. Tree Physiol. 2014, 34, 253–266. [Google Scholar] [CrossRef] [Green Version]
  52. Pleijel, H.; Uddling, J. Yield vs. Quality trade-offs for wheat in response to carbon dioxide and ozone. Glob. Chang. Biol. 2012, 18, 596–605. [Google Scholar] [CrossRef]
  53. Mishra, A.K.; Rai, R.; Agrawal, S.B. Individual and interactive effects of elevated carbon dioxide and ozone on tropical wheat (Triticum aestivum L.) cultivars with special emphasis on ROS generation and activation of antioxidant defence system. Indian J. Biochem. Biophys. 2013, 50, 139–149. [Google Scholar]
  54. Saitanis, C.J.; Bari, S.M.; Burkey, K.O.; Stamatelopoulos, D.; Agathokleous, E. Screening of Bangladeshi winter wheat (Triticum aestivum L.) cultivars for sensitivity to ozone. Environ. Sci. Pollut. Res. 2014, 21, 13560–13571. [Google Scholar] [CrossRef]
  55. Wang, X.; Zheng, Q.; Yao, F.; Chen, Z.; Feng, Z.; Manning, W.J. Assessing the impact of ambient ozone on growth and yield of a rice (Oryza sativa L.) and a wheat (Triticum aestivum L.) cultivar grown in the Yangtze Delta, China, using three rates of application of ethylenediurea (EDU). Environ. Pollut. 2007, 148, 390–395. [Google Scholar] [CrossRef] [PubMed]
  56. Yuan, X.; Calatayud, V.; Jiang, L.; Manning, W.J.; Hayes, F.; Tian, Y.; Feng, Z. Assessing the effects of ambient ozone in China on snap bean genotypes by using ethylenediurea (EDU). Environ. Pollut. 2015, 205, 199–208. [Google Scholar] [CrossRef] [PubMed] [Green Version]
  57. Manning, W.J.; Flagler, R.B.; Frenkel, M.A. Assessing plant response to ambient ozone: Growth of ozone-sensitive loblolly pine seedlings treated with ethylenediurea or sodium erythorbate. Environ. Pollut. 2003, 126, 73–81. [Google Scholar] [CrossRef]
  58. Singh, S.; Agrawal, S.B. Use of ethylene diurea (EDU) in assessing the impact of ozone on growth and productivity of five cultivars of Indian wheat (Triticum aestivum L.). Environ. Monit. Assess. 2009, 159, 125. [Google Scholar] [CrossRef] [PubMed]
  59. Ashrafuzzaman, M.; Lubna, F.A.; Holtkamp, F.; Manning, W.J.; Kraska, T.; Frei, M. Diagnosing ozone stress and differential tolerance in rice (Oryza sativa L.) with ethylenediurea (EDU). Environ. Pollut. 2017, 230, 339–350. [Google Scholar] [CrossRef] [PubMed]
  60. Ueda, Y.; Uehara, N.; Sasaki, H.; Kobayashi, K.; Yamakawa, T. Impacts of acute ozone stress on superoxide dismutase (SOD) expression and reactive oxygen species (ROS) formation in rice leaves. Plant Physiol. Biochem. 2013, 70, 396–402. [Google Scholar] [CrossRef] [PubMed]
  61. Hassan, I.A.; Bell, J.N.B.; Marshall, F.M. Effects of air filtration on Egyptian clover (Trifolium alexandrinum L. cv. Messkawy) grown in open-top chambers in a rural site in Egypt. Res. J. Biol. Sci. 2007, 2, 395–402. [Google Scholar]
  62. Oksanen, E.; Rousi, M. Differences of Betula origins in ozone sensitivity based on open-field experiment over two growing seasons. Can. J. For. Res. 2001, 31, 804–811. [Google Scholar] [CrossRef]
  63. Akhtar, N.; Yamaguchi, M.; Inada, H.; Hoshino, D.; Kondo, T.; Fukami, M.; Funada, R.; Izuta, T. Effects of ozone on growth, yield and leaf gas exchange rates of four Bangladeshi cultivars of rice (Oryza sativa L.). Environ. Pollut. 2010, 158, 2970–2976. [Google Scholar] [CrossRef]
  64. Meier, S.; Tzfadia, O.; Vallabhaneni, R.; Gehring, C.; Wurtzel, E.T. A transcriptional analysis of carotenoid, chlorophyll and plastidial isoprenoid biosynthesis genes during development and osmotic stress responses in Arabidopsis thaliana. BMC Syst. Biol. 2011, 5, 77. [Google Scholar] [CrossRef]
  65. Ranieri, A.; Soldatini, G. Detoxificant systems in bean plants grown in polluted air: Effects of the antioxidant EDU. Mediterr. Agric. 1995, 125, 375–386. [Google Scholar]
  66. Agathokleous, E.; Mouzaki-Paxinou, A.-C.; Saitanis, C.J.; Paoletti, E.; Manning, W.J. The first toxicological study of the antiozonant and research tool ethylene diurea (EDU) using a Lemna minor L. bioassay: Hints to its mode of action. Environ. Pollut. 2016, 213, 996–1006. [Google Scholar] [CrossRef] [PubMed]
Figure 1. The location of experimental sites in Lucknow, state of Uttar Pradesh, India.
Climate 07 00023 g001
Figure 2. Variation in 8 h (9:00 to 17:00) average ozone concentration at NBRI (open circles) and Banthra (closed circles) sites. Accumulated Ozone exposure over the Threshold of 40 ppb (AOT40) accumulation during the experimental period (6 December 2011 to 29 March 2012) is indicated by grey dashed line. Horizontal line indicates the AOT40 threshold for wheat (3 ppm h). Arrows denote the sampling dates for analyses at vegetative phase (43 days of sowing (DAS)), flowering phase (85 DAS) and harvest phase (120–122 DAS).
Climate 07 00023 g002
Figure 3. The effect of Ethylenediurea (EDU) treatment on various yield attributes across all the cultivars {(based on relative values, e.g., harvest index with non-EDU/harvest index with EDU treatment) × 100)}. The median of each parameter is shown as the horizontal bar in each box, and the upper and the lower sides of a box represent the first and the third quartile values of the distribution respectively. Harvest index (HI), 1000 grain weight plant−1 (1000 grain wt.), grain weight plant−1 (grain wt.), inflorescence weight plant−1 (wt. of inflorescence) and biomass.
Climate 07 00023 g003
Figure 4. Regressions between the mean grain weight plant−1 of all the cultivars at each site and treatment (x-axis) and the individual grain weight plant−1 (y-axis) of each of the 11 wheat cultivars. (A) Grouping of well adapted (8, 9 and 11) cultivars and poorly adapted (1, 3 and 10) cultivars. (B) Grouping of cultivars adapted to low-yield conditions (5 and 7) and cultivars adapted to high-yield (2, 6 and 4) conditions. (1) PBW-373, (2) PBW-502, (3) PBW-154, (4) WH711, (5) PBW-343, (6) DBW-17, (7) LOK-1, (8) KUNDAN, (9) WR-544, (10) HUW-234, (11) PBW-550.
Climate 07 00023 g004
Table 1. F ratios and levels of significance of multivariate ANOVA test for different parameters of all the 11 tested cultivars. Significant results of two-way ANOVA are marked with asterisks (* p < 0.05 and ** p < 0.01) for Cultivar, Treatment (EDU) and Cultivar × treatment (EDU) at experimental sites; NBRI and Banthra at vegetative, flowering and harvest phase. Superoxide dismutase activity (SOD), catalase activity (CAT), reduced glutathione (GSH), oxidised glutathione (GSSG), malondialdehyde content (MDA), total chlorophyll (Tchl), carotenoid (Caro), photosynthesis (A), stomatal conductance (gs), ratio of variable to maximal chlorophyll fluorescence (Fv/Fm), harvest index (HI), 1000 grain weight plant−1 (1000_grain wt), inflorescence weight plant−1 (Inflorescence wt) and biomass.
NBRIBanthra
VegetativeFloweringVegetativeFlowering
CultivarTreatment (EDU)Cultivar × treatment (EDU)CultivarTreatment (EDU)Cultivar × treatment (EDU)CultivarTreatment (EDU)Cultivar × treatment (EDU)CultivarTreatment (EDU)Cultivar × treatment (EDU)
SOD23.36**175.10**25.63**1.86 0.03 1.81**48.16**956.17**28.25**45.78**0.04 35.04**
CAT27.26**46.27**25.94**17.56**24.40**14.79**67.83**0.34 17.77**169.41**307.79**108.07**
GSH4.71**1.82 6.67**14.86**16.82**19.63**10.78**699.47**12.57**11.36**15.86**18.38**
GSSG10.80**25.17**19.12**7.62**76.36**14.48**26.24**82.41**7.02**36.15**24.56**21.41**
MDA12.97**3.56 8.45**46.62**12.06**14.02**17.69**238.44**26.32**18.05**82.85**5.71**
T Chl41.92**58.73**26.84**10.60**8.53**15.20**1614.38**2919.22**2101.01**327.17**3314.84**128.99**
Caro25.94**27.69**15.56**24.52**2.47 12.26**1549.28**1622.39**2027.76**514.43**1993.56**158.96**
A2.08*1.15 4.63**17.43**18.21**23.80**11.19**33.61**11.16**25.52**2.38 9.98**
gs3.22**0.37 1.65 13.89**3.03 11.31 6.33**31.85**5.93**39.34**7.13**3.30**
FvFm1.79 0.08 1.09 2.97**2.98 1.69 0.65 4.10*1.51 0.96 0.23 0.93
Harvest parametersHarvest parameters
HI16.04**6.03**2.74** HI67.73**22.33**15.31**
1000_grain wt401.47**55.75**51.52** 1000_grain wt331.58**62.61**31.57**
Inflorescence wt12.58**96.61**6.80** Inflorescence wt12.56**0.66 3.44**
Grain_wt10.01**34.61**3.93** Grain_wt10.78**0.00 3.39**
Biomass14.65**81.30**8.24** Biomass12.95**20.95**12.12**
Table 2. Correlation of the different parameters with the grain yield plant−1 for the groups assigned from the Finlay method. Significant correlations are in bold. Positive correlations (light grey) and negative (grey) are presented in the table. Superoxide dismutase activity (SOD), catalase activity (CAT), reduced glutathione (GSH), oxidised glutathione (GSSG), malondialdehyde content (MDA), chlorophyll (chl), carotenoid (Caro), photosynthesis (A), stomatal conductance (gs), ratio of variable to maximal chlorophyll fluorescence (Fv/Fm), harvest index (HI), 1000 grain weight plant−1 (1000_grain wt), inflorescence weight plant (Inflorescence wt) and biomass.
ParametersCultivars 8,9,11 (Well-adapted)Cultivars 1,3,10 (Poorly Adapted)Cultivars 5,7 (Low-yield Condition)Cultivars 2,4,6 (High-yield Condition)All Cultivars
Vegetative
SOD−0.1510.0110.166−0.614 **−0.313 *
CAT0.0050.2940.2440.1560.311 *
GSH0.1250.060−0.240−0.1490.033
GSSG0.277−0.542 **0.1920.490 **0.325 *
MDA−0.2460.1630.087−0.007−0.024
Chl−0.2630.230−0.472 *−0.079−0.087
Car−0.3200.294−0.401−0.221−0.12
A−0.2850.441 **−0.2040.1320.144
gs−0.2810.344 *−0.2180.2450.26
Fv/Fm0.049−0.0550.1160.0620.06
Flowering
SOD−0.0330.155−0.3640.590 **0.137
CAT0.222−0.472 **−0.408 *−0.629 **−0.373 *
GSH0.2660.0670.236−0.2030.191
GSSG−0.132−0.379 *0.401−0.543 **−0.322 *
MDA0.010−0.618 **−0.222−0.178−0.251
Chl0.202−0.0100.1320.384 *0.236
Car−0.1170.1160.0530.410 *0.198
A0.383 *0.147−0.078−0.533 **−0.141
gs0.189−0.093−0.140−0.653 **−0.257
FvFm0.2840.012−0.125−0.0980.107
Final harvest
HI0.2090.0640.3270.659 **0.426 **
1000_grain wt−0.082−0.425 **−0.0970.243−0.246
Inflorescence wt0.614 **0.599 **−0.0330.695 **0.737 **
Biomass0.472 **0.618 **0.1380.694 **0.776 **

