
Landing Performance Study for Four Wheels Twin Tandem Landing Gear Based on Drop Test


1
School of Astronautics, Harbin Institute of Technology, Harbin 150001, China
2
Shanghai Aircraft Design and Research Institute, China Commercial Aircraft Corporation, Shanghai 201210, China
*
Author to whom correspondence should be addressed.
Aerospace 2022, 9(7), 334; https://0-doi-org.brum.beds.ac.uk/10.3390/aerospace9070334
Submission received: 16 May 2022
/
Revised: 17 June 2022
/
Accepted: 20 June 2022
/
Published: 22 June 2022
(This article belongs to the Section Aeronautics)
Abstract
:The drop tests of a twin tandem landing gear with different filling parameters are carried out in two different landing attitudes (level and tail-down). The overload coefficient and power absorption efficiency are obtained. Curves of dynamic oscillation and pressure change for the pitch damper are obtained. The results show that twin tandem landing gear has a good ability to absorb the work of landing impact. Under landing weight, the vertical overload coefficients during level landing and tail-down landing are 1.14 and 1.07, respectively, when the corresponding efficiencies of its buffer system are 80.9% and 83.3%. During tail-down landing, the work absorbed by the pitch damper accounts for only 14.9% of the maximum pitching kinetic energy of the trolley. When the orifice diameter of the pitch damper keeps the same, its peak axial load does not change significantly with the change of its initial pressure. When the initial pressure of the pitch damper keeps the same, the decrease of its orifice diameter is beneficial to the vibration attenuation of the trolley. The smaller recoil channel may lead to a significant increase in the peak pressure of the pitch damper, which should be a consideration in its design.
1. Introduction
Twin tandem wheels–trolley landing gear has been widely used in modern military and civil aircraft of 150 tons and above because of its excellent landing performance and small storage space [1,2,3]. The main landing gears of Boeing’s B747, B767, B787, and B2 are four-wheeled, while B777, C5, and other similar aircraft are six-wheeled. Airbus is also experienced in the development of wheels–trolley landing gear, such as the twin tandem main landing gear of A330, A340, and A350, the four-wheeled wing landing gear of A380, and its six-wheeled body landing gear. At present, the development of landing gear for heavy civil passenger aircraft and transport aircraft in some countries is still in its infancy. Since landing impact load is the decisive factor in the structural design of landing gear, scholars have done a lot of research [4]. Most of the research is based on simulation analysis. In 1970, NASA simplified the landing gears of B747 and established the ground dynamics model, which is the basic model of the future simulator [5,6]. In 1976, Wahi discussed the influence of Reynolds number and recoil’s shape on the flow coefficient [7]. In 1998, Berg discussed the application of electrorheological fluid in landing gear buffer [8]. In 2018, Chulhee proposed a new magnetorheological damper, which can provide better damping performance [9]. In 2009, Zheng Lan who derived a landing dynamics equation of the wheels–trolley landing gear analyzed the effects of different landing conditions on the landing performance for this type of landing gear through simulation comparison [10]. Zhang Ming, who simulated the brake load transfer process of the wheels–trolley landing gear in detail, put forward a way to obtain the maximum braking efficiency which can optimize the design of the pitch damper and brake balancing device [11]. In 2020, Xia Mingyuan established two kinds of pitch damper models, passive and active, and analyzed the influence of filling parameters on the landing performance for wheels–trolley landing gear through simulation [12]. As can be seen from the above, for the wheels–trolley landing gear, scholars have done a lot of studies by simulation. The analytical model includes the effects of tire-rotation and pillar-sliding. The simulated buffer and tire have been refined a lot gradually and will take into account the impact of elasticity for buffer pillar and aircraft structures in further development. As for drop test verification, in 1974, Daughetee studied the drop and dynamic test of landing gear for naval aircraft [13]. In 2001, Shi Haiwen conducted the landing gear rotating drop test for different imitation runways [14]. In 2022, De Martin developed an innovative “iron bird” for executing tests including the simulation of complete landing procedures on an innovative landing gear of a small aircraft [15]. Giannella, V. validated the design of this test machine by structural analyses [16]. With the development of technology, the simulation analysis of the landing gear is more detailed in recent years considering more and more factors, and scholars actively test and verify the landing gear on the small pillar landing gear. However, direct experimental studies for four wheels twin tandem landing gear are still rare in the available literature. It is of great practical significance to carry out the experimental research on the wheels–trolley landing gear for large aircraft design [17,18,19].
In this paper, a drop test without lift is carried out for twin tandem landing gear on the 80 t·m drop test rig to study the effects of landing attitude and sinking speed on the landing impact load and power absorption efficiency. Dynamic oscillation behavior and pressure change of the pitch damper are compared between configurations with different initial inflation pressure and orifice size. It provides a basis for the structure and load design for this type of landing gear.
2. Four Wheels Twin Tandem Landing Gear
2.1. Structural Layout
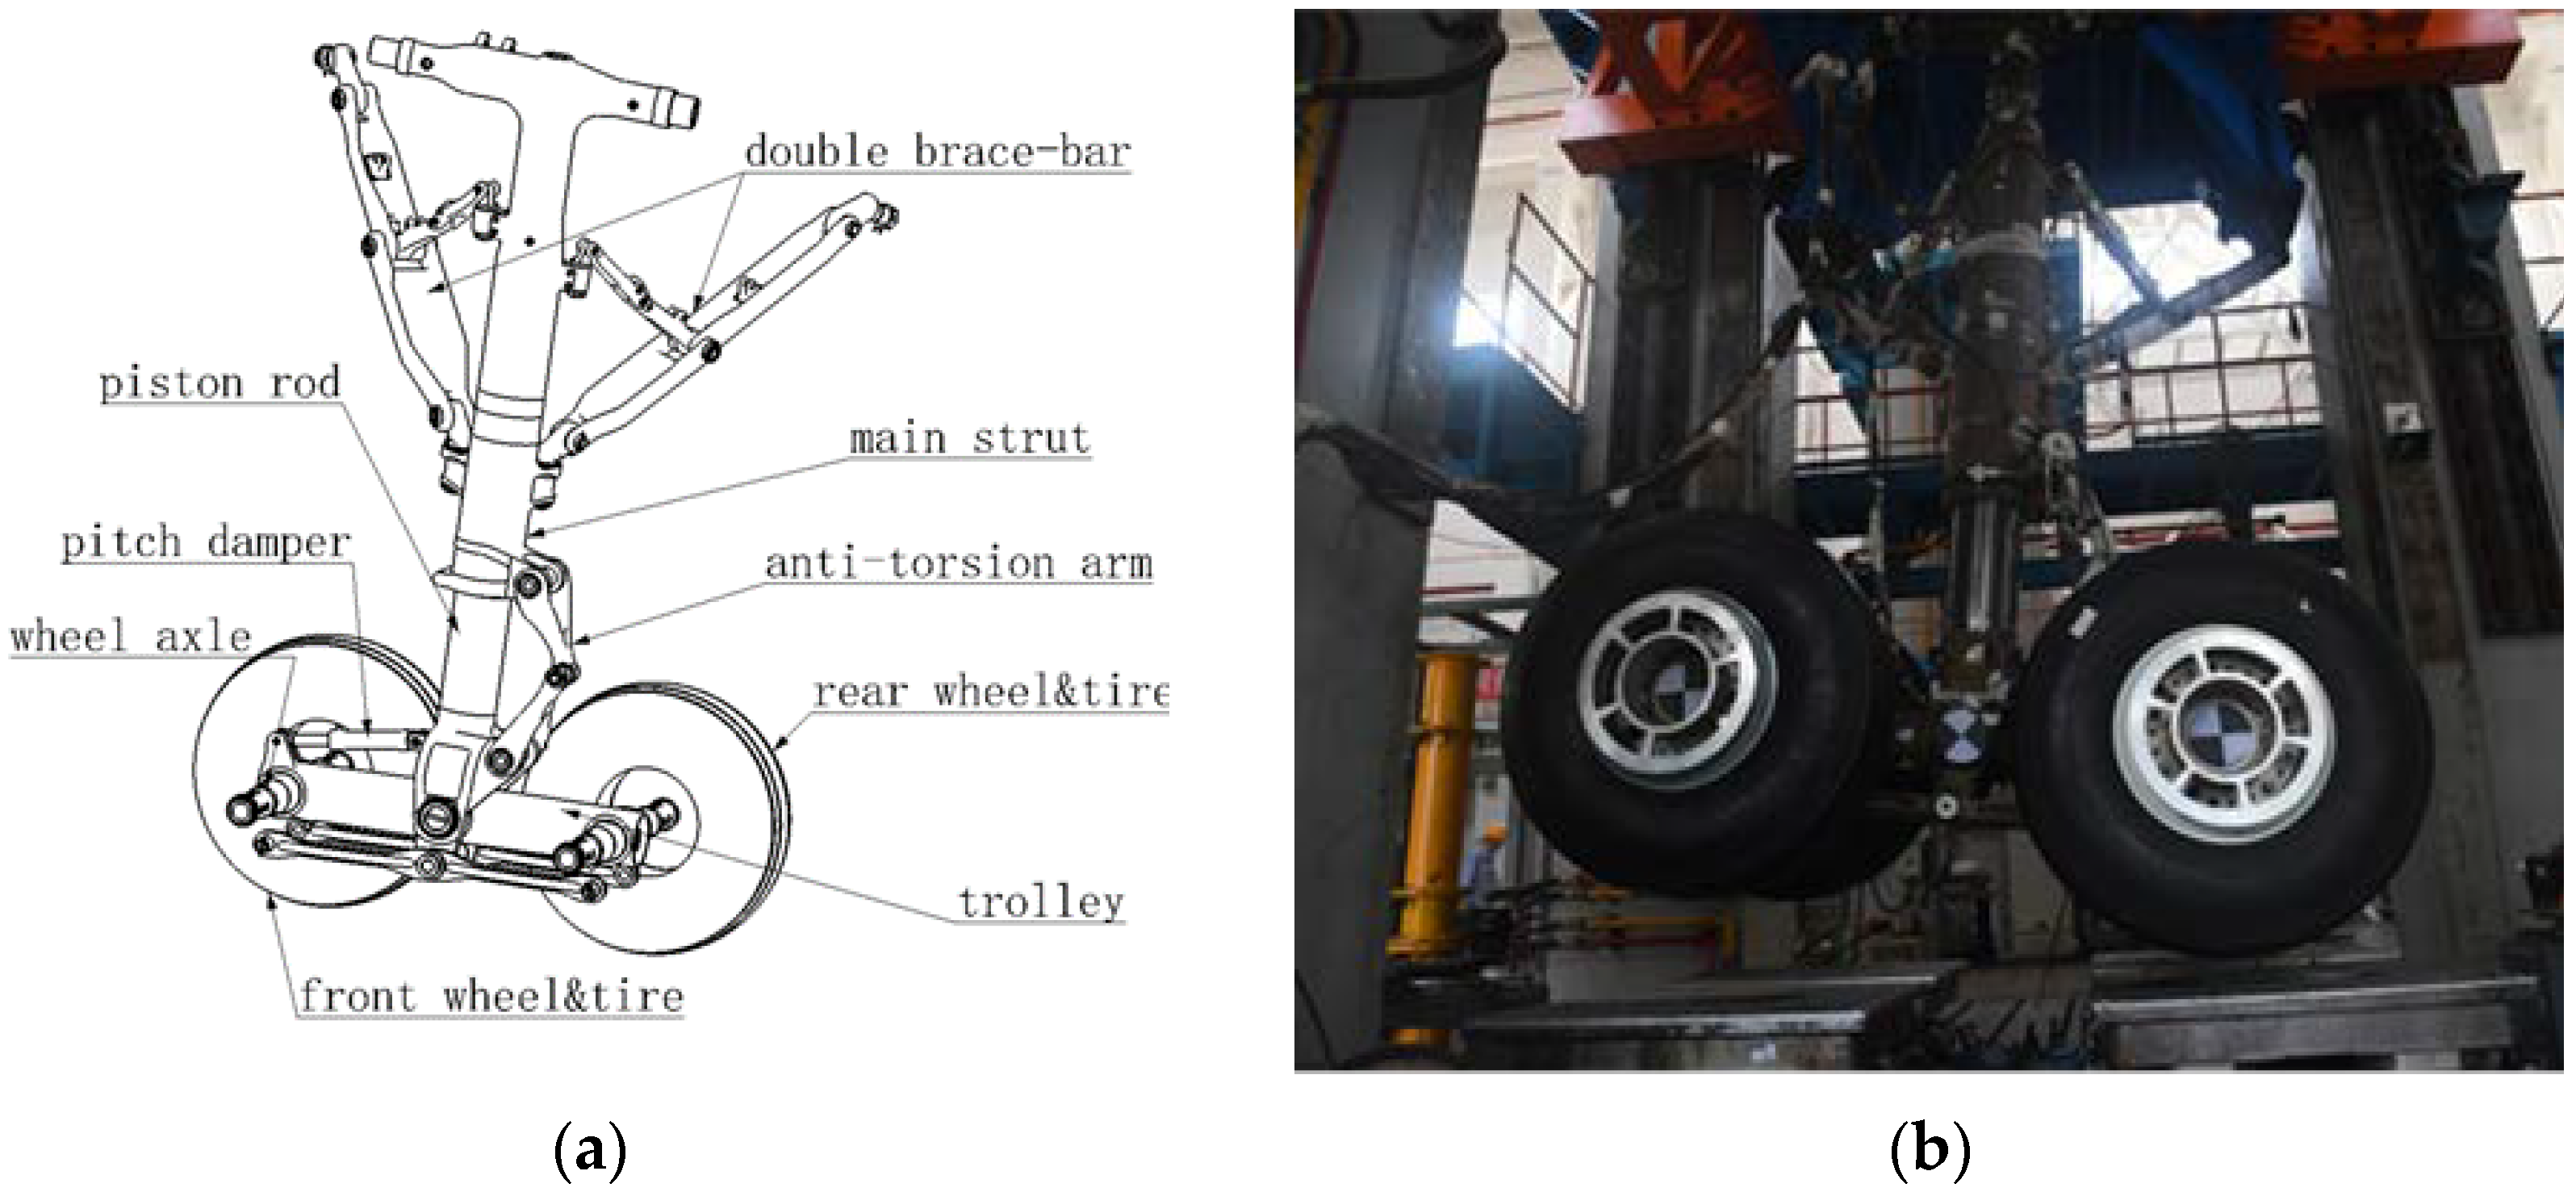
The test piece used in this paper is a typical twin tandem landing gear which is mainly composed of the main strut, double brace-bar, piston rod, anti-torsion arm, trolley, wheel axles, and four wheels and tires (see Figure 1). An oil–gas buffer is arranged inside the main strut to absorb most of the energy of the landing impact. Four wheels and tires with brakes are divided into two groups and arranged symmetrically in the front and rear of the trolley. The trolley is leaned back at 9° (the position of the rear two wheels is lower) when the aircraft’s attitude is horizontal. A passive pitch damper is arranged between the piston rod and the trolley to maintain the balance of the trolley.
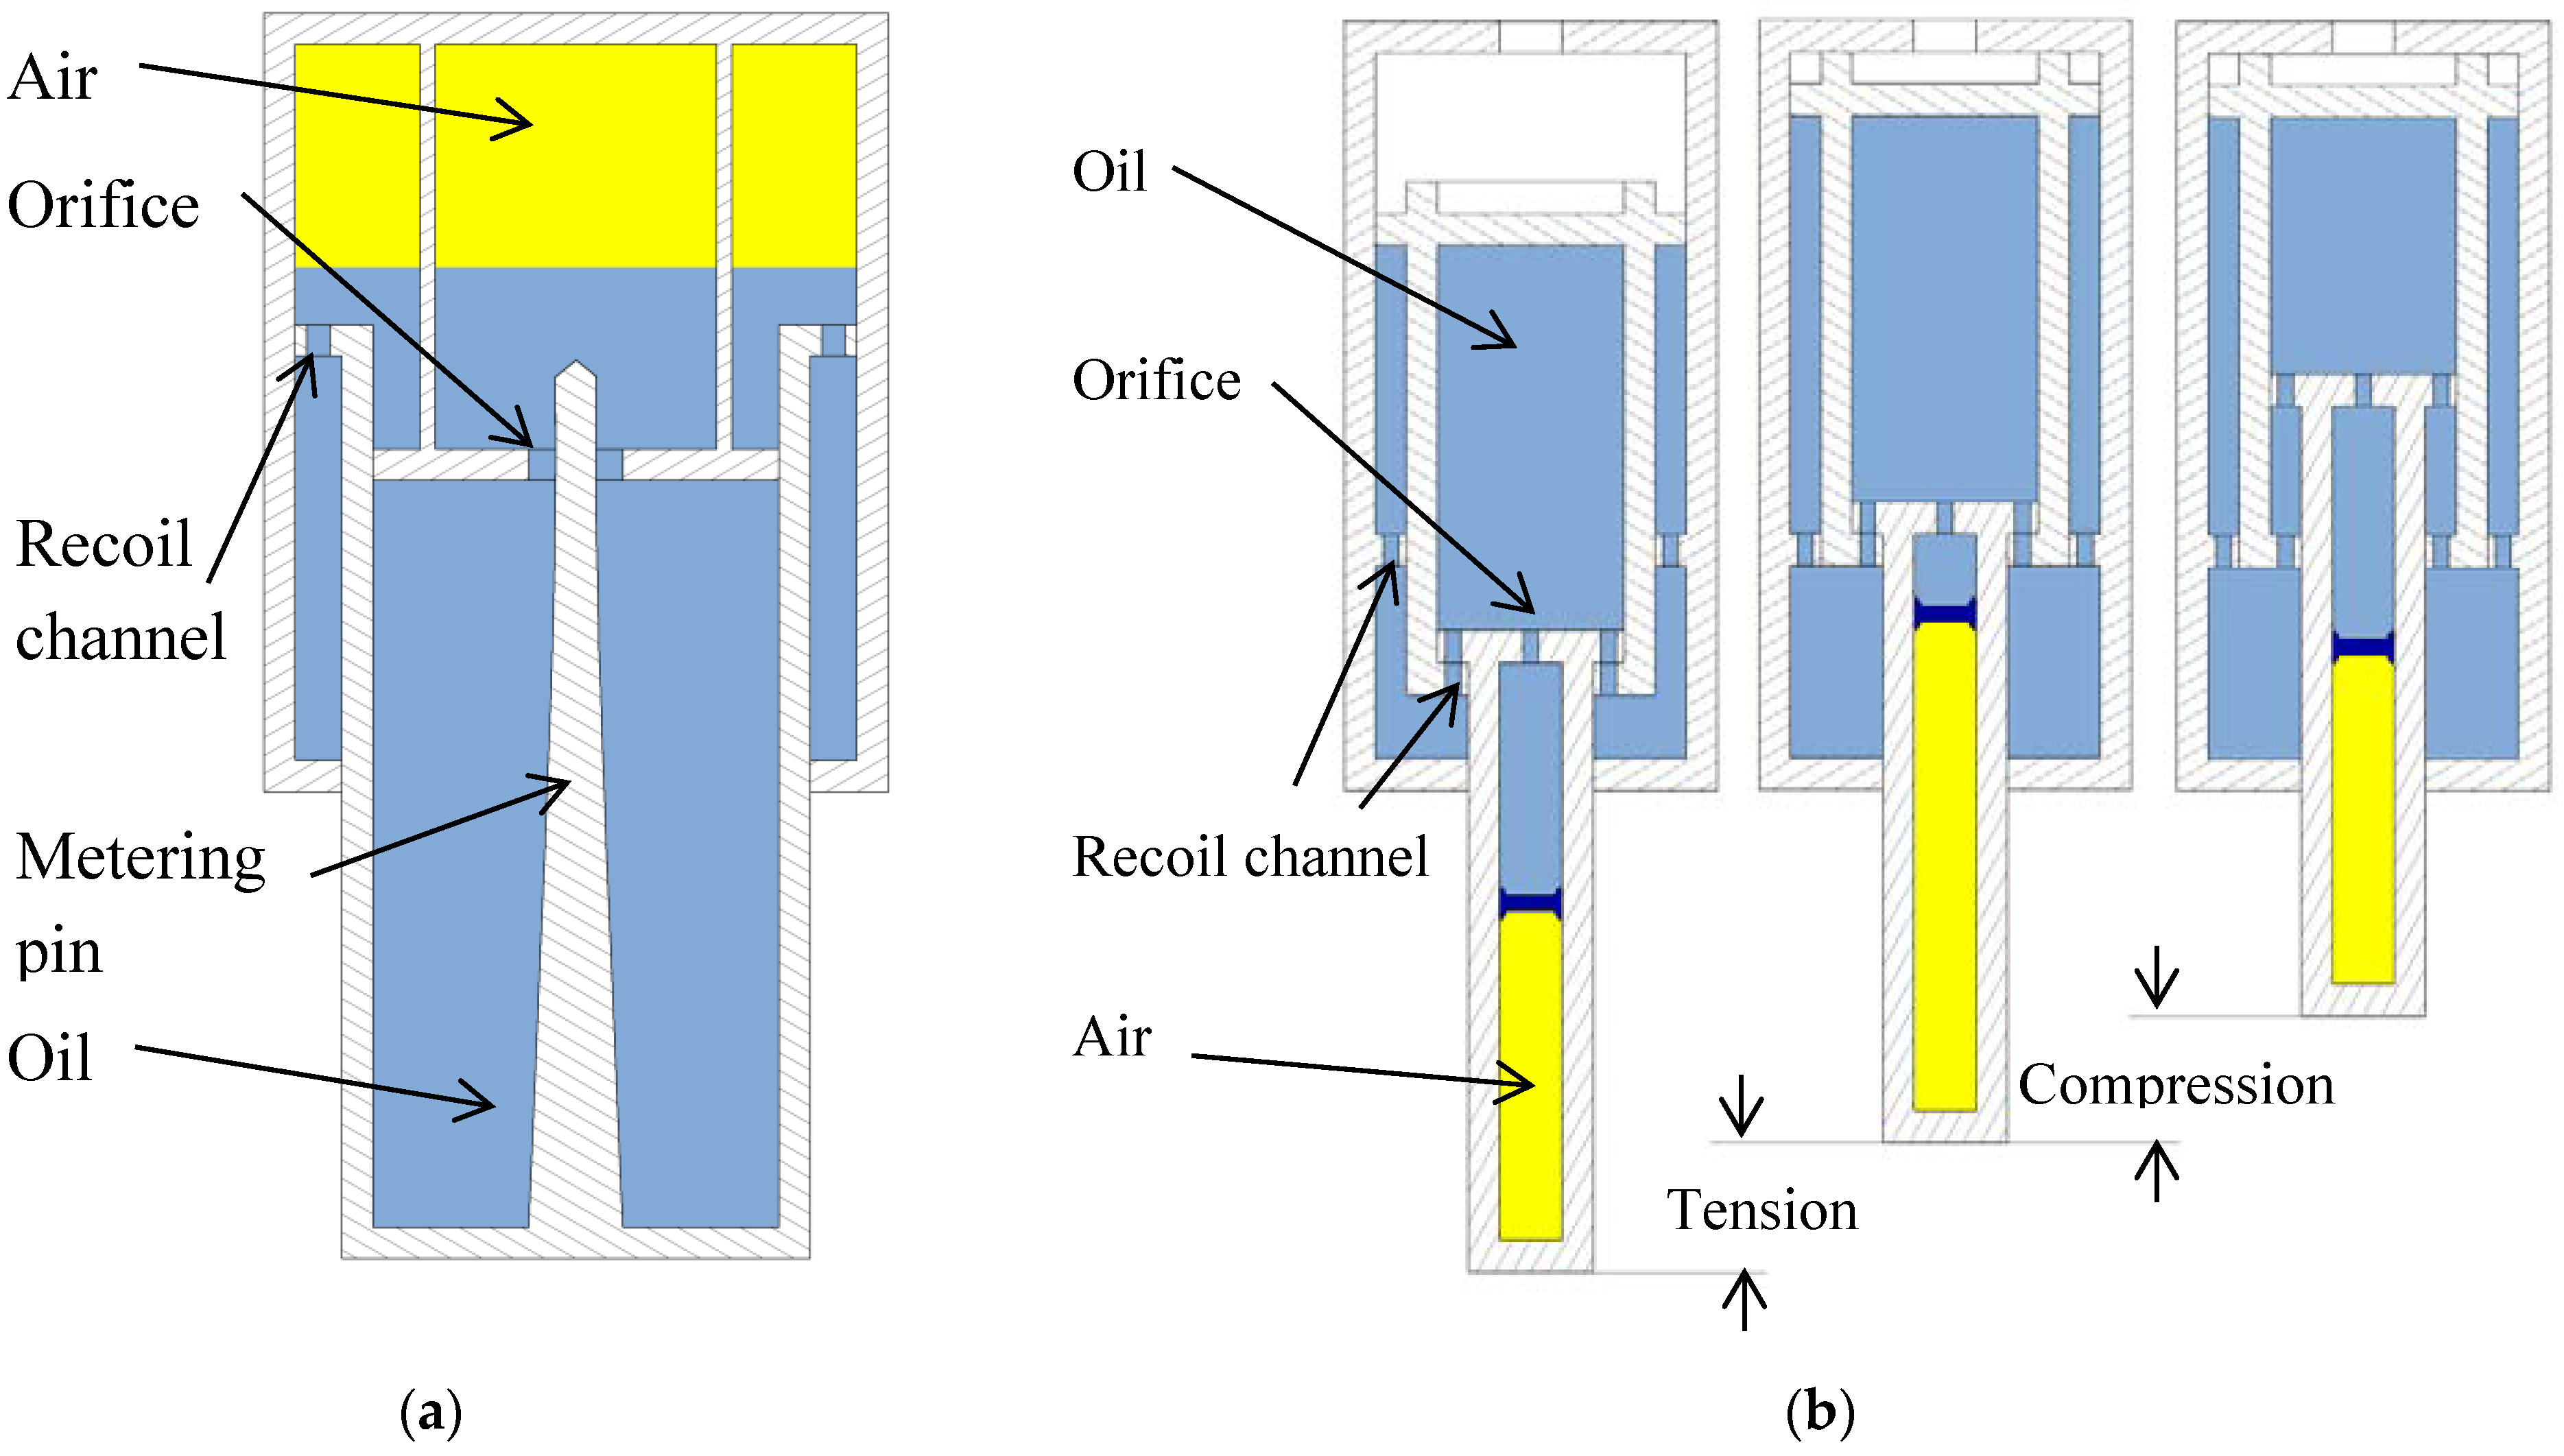
2.2. Main Buffer System
The main buffer system includes the main buffer and four tires. The main buffer, which is a single-chamber oil–gas type (with an annular cavity, see Figure 2), is arranged inside the main strut. The structure of the pitch damper is different from the conventional oil–gas buffer, in that it can be compressed and stretched. During the positive stroke (strut compression), the oil flows into the upper air chamber from the main oil chamber, while part of the oil flows into the annular cavity from the upper air chamber, causing the air chamber to compress and the impact energy to be stored. During the reverse stroke (strut tension), the oil chamber expands and some of the recoil channels are closed as the oil flows in the opposite direction, dissipating energy [20,21,22].
2.3. Pitch Damper
The pitch damper is a unique part of wheels–trolley landing gear, and its function is:
- During aircraft touching down, it stabilizes and keeps the trolley at the designed angle, so that the tires at the lower end can touch the ground first to increase the cushioning distance and decrease the overload.
- During touching down and ground taxiing, it assists to absorb and dissipate the energy caused by the pitching motion of the trolley and slow down this motion to reduce the ground reaction of the tire [12].
In this paper, a passive pitch damper composed of an outer strut, an inter strut, and a sliding tube is used (see Figure 2). Its air chamber is filled with high-pressure gas. When unloaded, the sliding tube extends outward under the action of gas pressure, and the inter strut moves upward under the action of oil pressure until finally stopped by the outer strut. When compressed, the sliding tube moves upward and decreases the air chamber causing a higher gas pressure which forces the oil to flow to the oil chamber through the main throttle to absorb energy. When tensed, the sliding tube extends rapidly in the inter strut until its end, which increases the air chamber and causes oil flow. Then, the two parts extend together and further compress the oil chamber, making oil flow to the air chamber through the main throttle and dissipate energy [23,24]. Before the drop test of the full-scale landing gear, the dynamic performance of the pitch damper is simulated, and six different test configurations are set up for the pitch damper, as shown in Table 1, to identify the key factors. The partition is removed so that the damping of the main oil chamber is reduced to the minimum in PD6.
3. Introduction of Drop Test
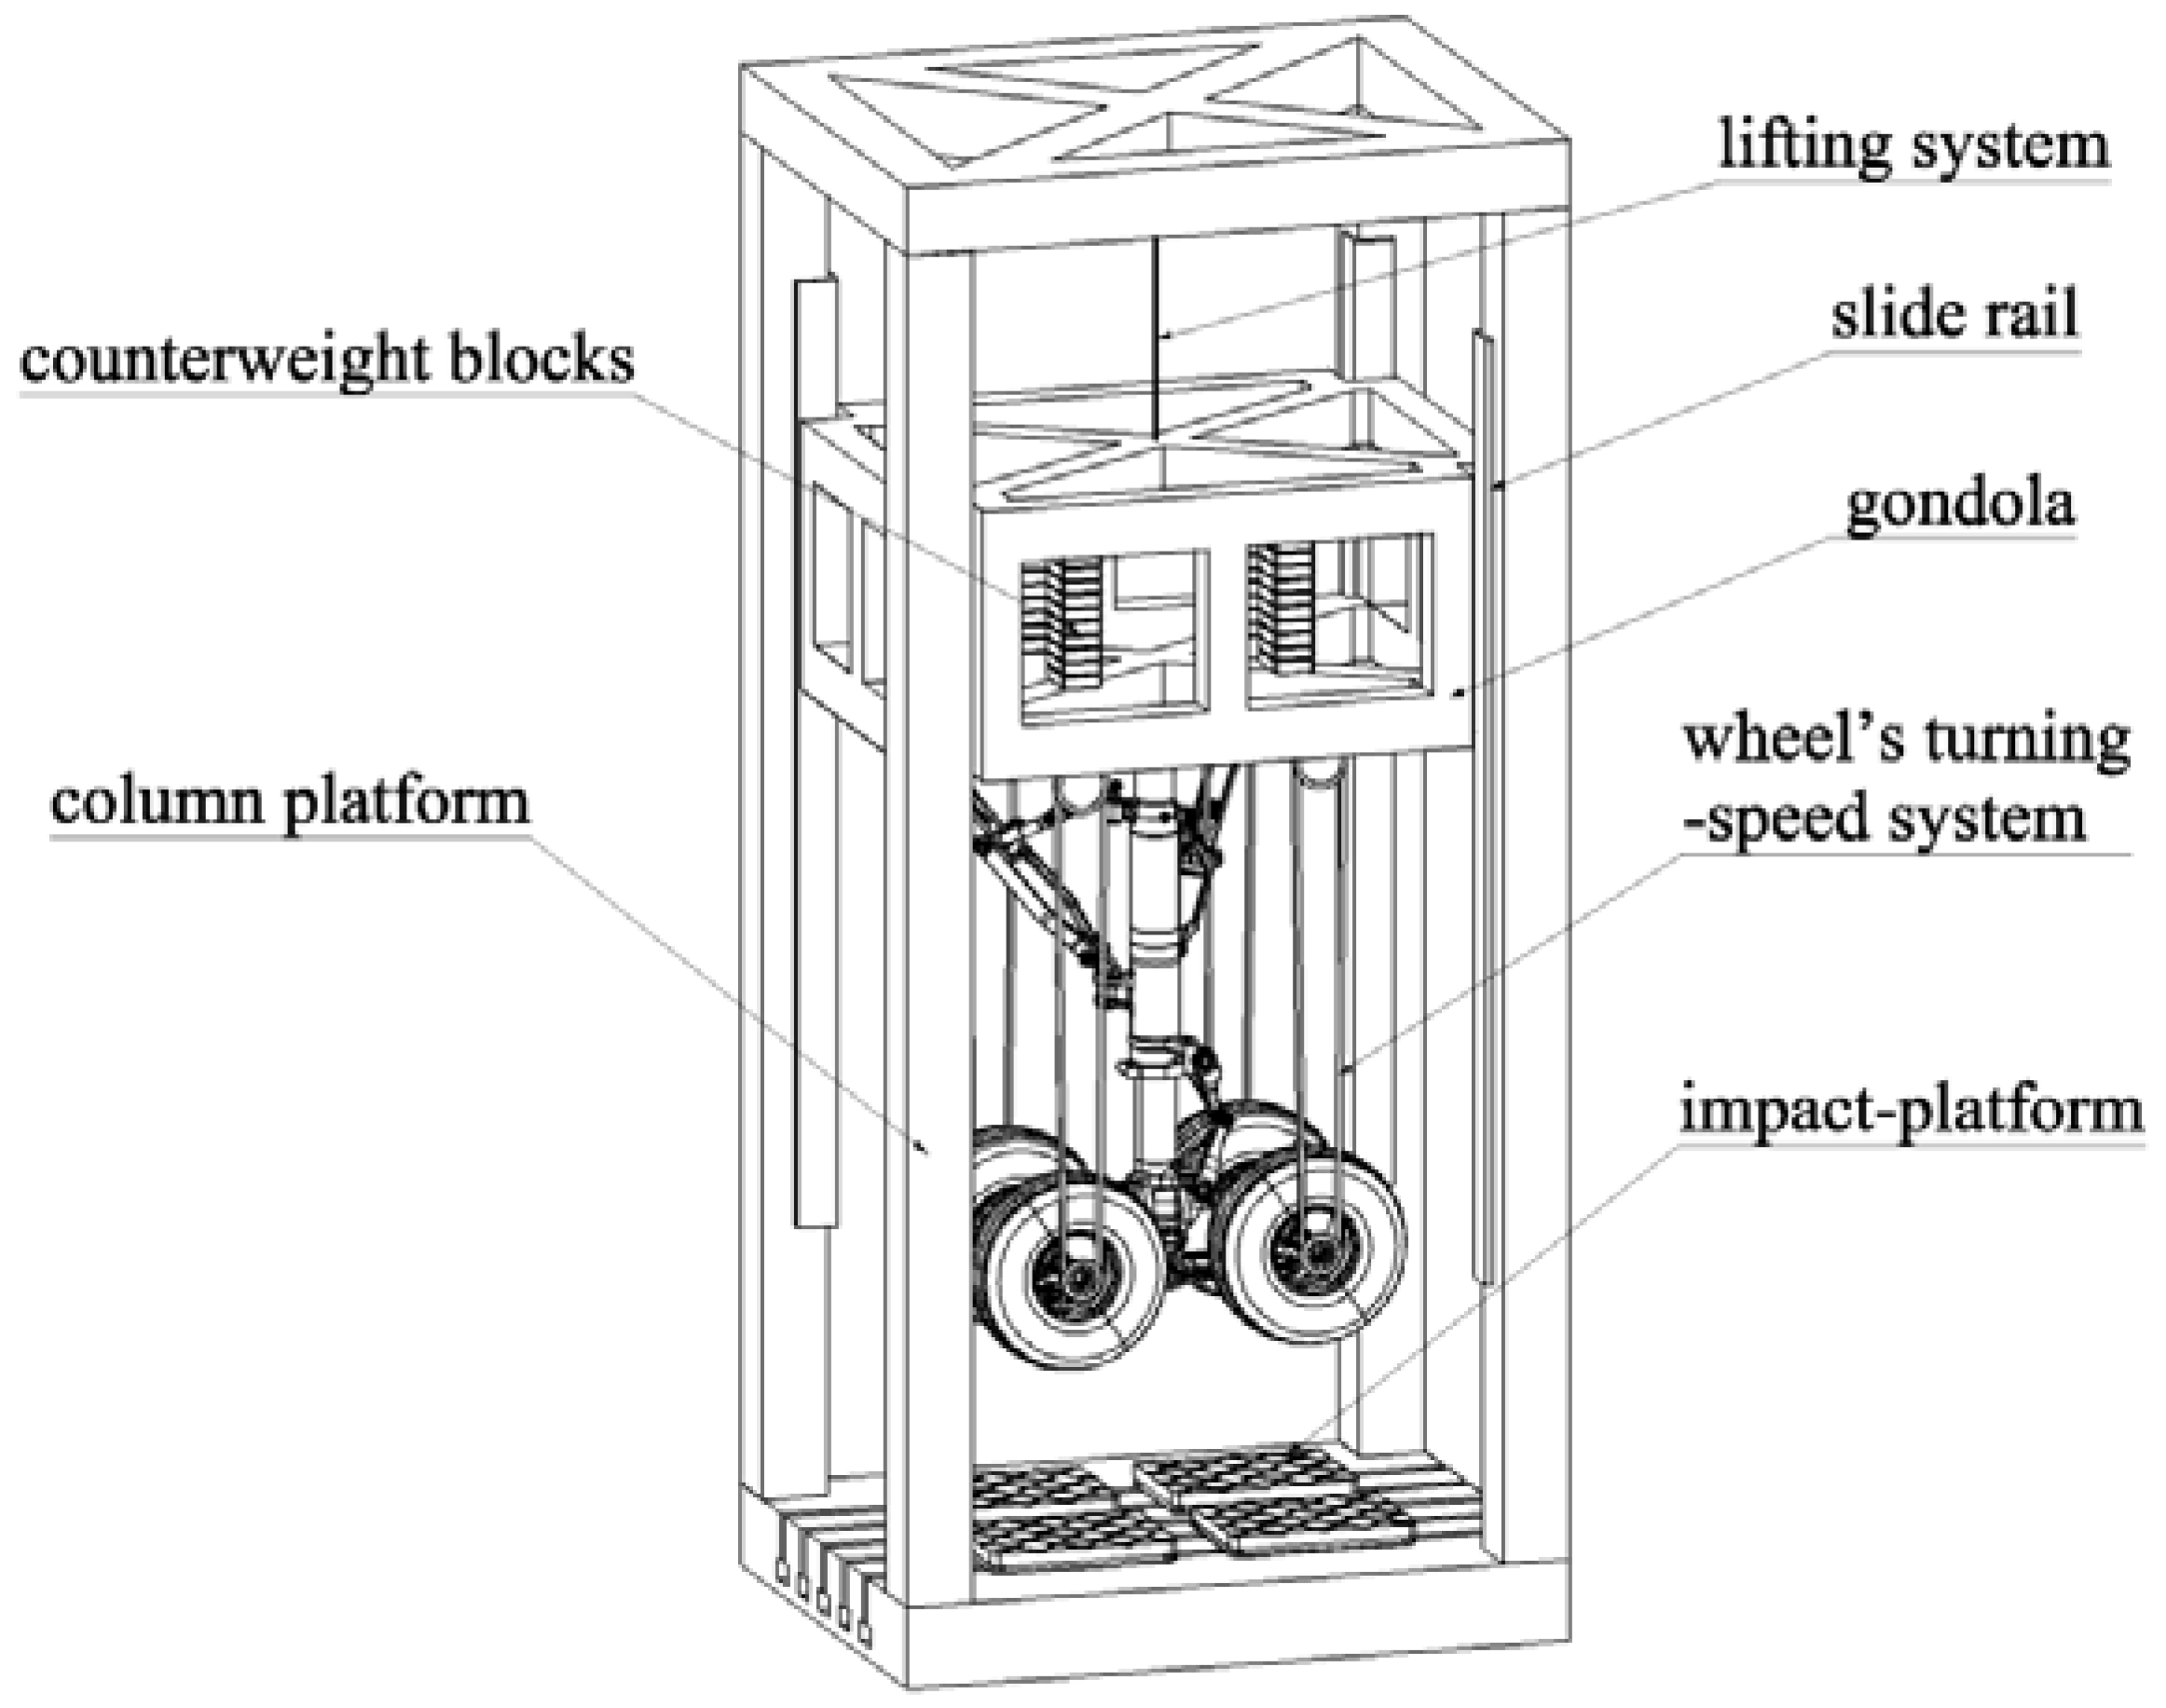
3.1. Drop Test Rig
In this paper, a drop test without imitating lift is carried out on an 80 t·m test rig (see Figure 3). This is a column free-fall drop test rig which is mainly composed of a column platform, slide rail, lifting system, wheel’s turning-speed system, four impact-platforms, and gondola, as shown in Figure 3. The test rig is located in Xi’an, China, and belongs to the China aircraft strength Research Institute.
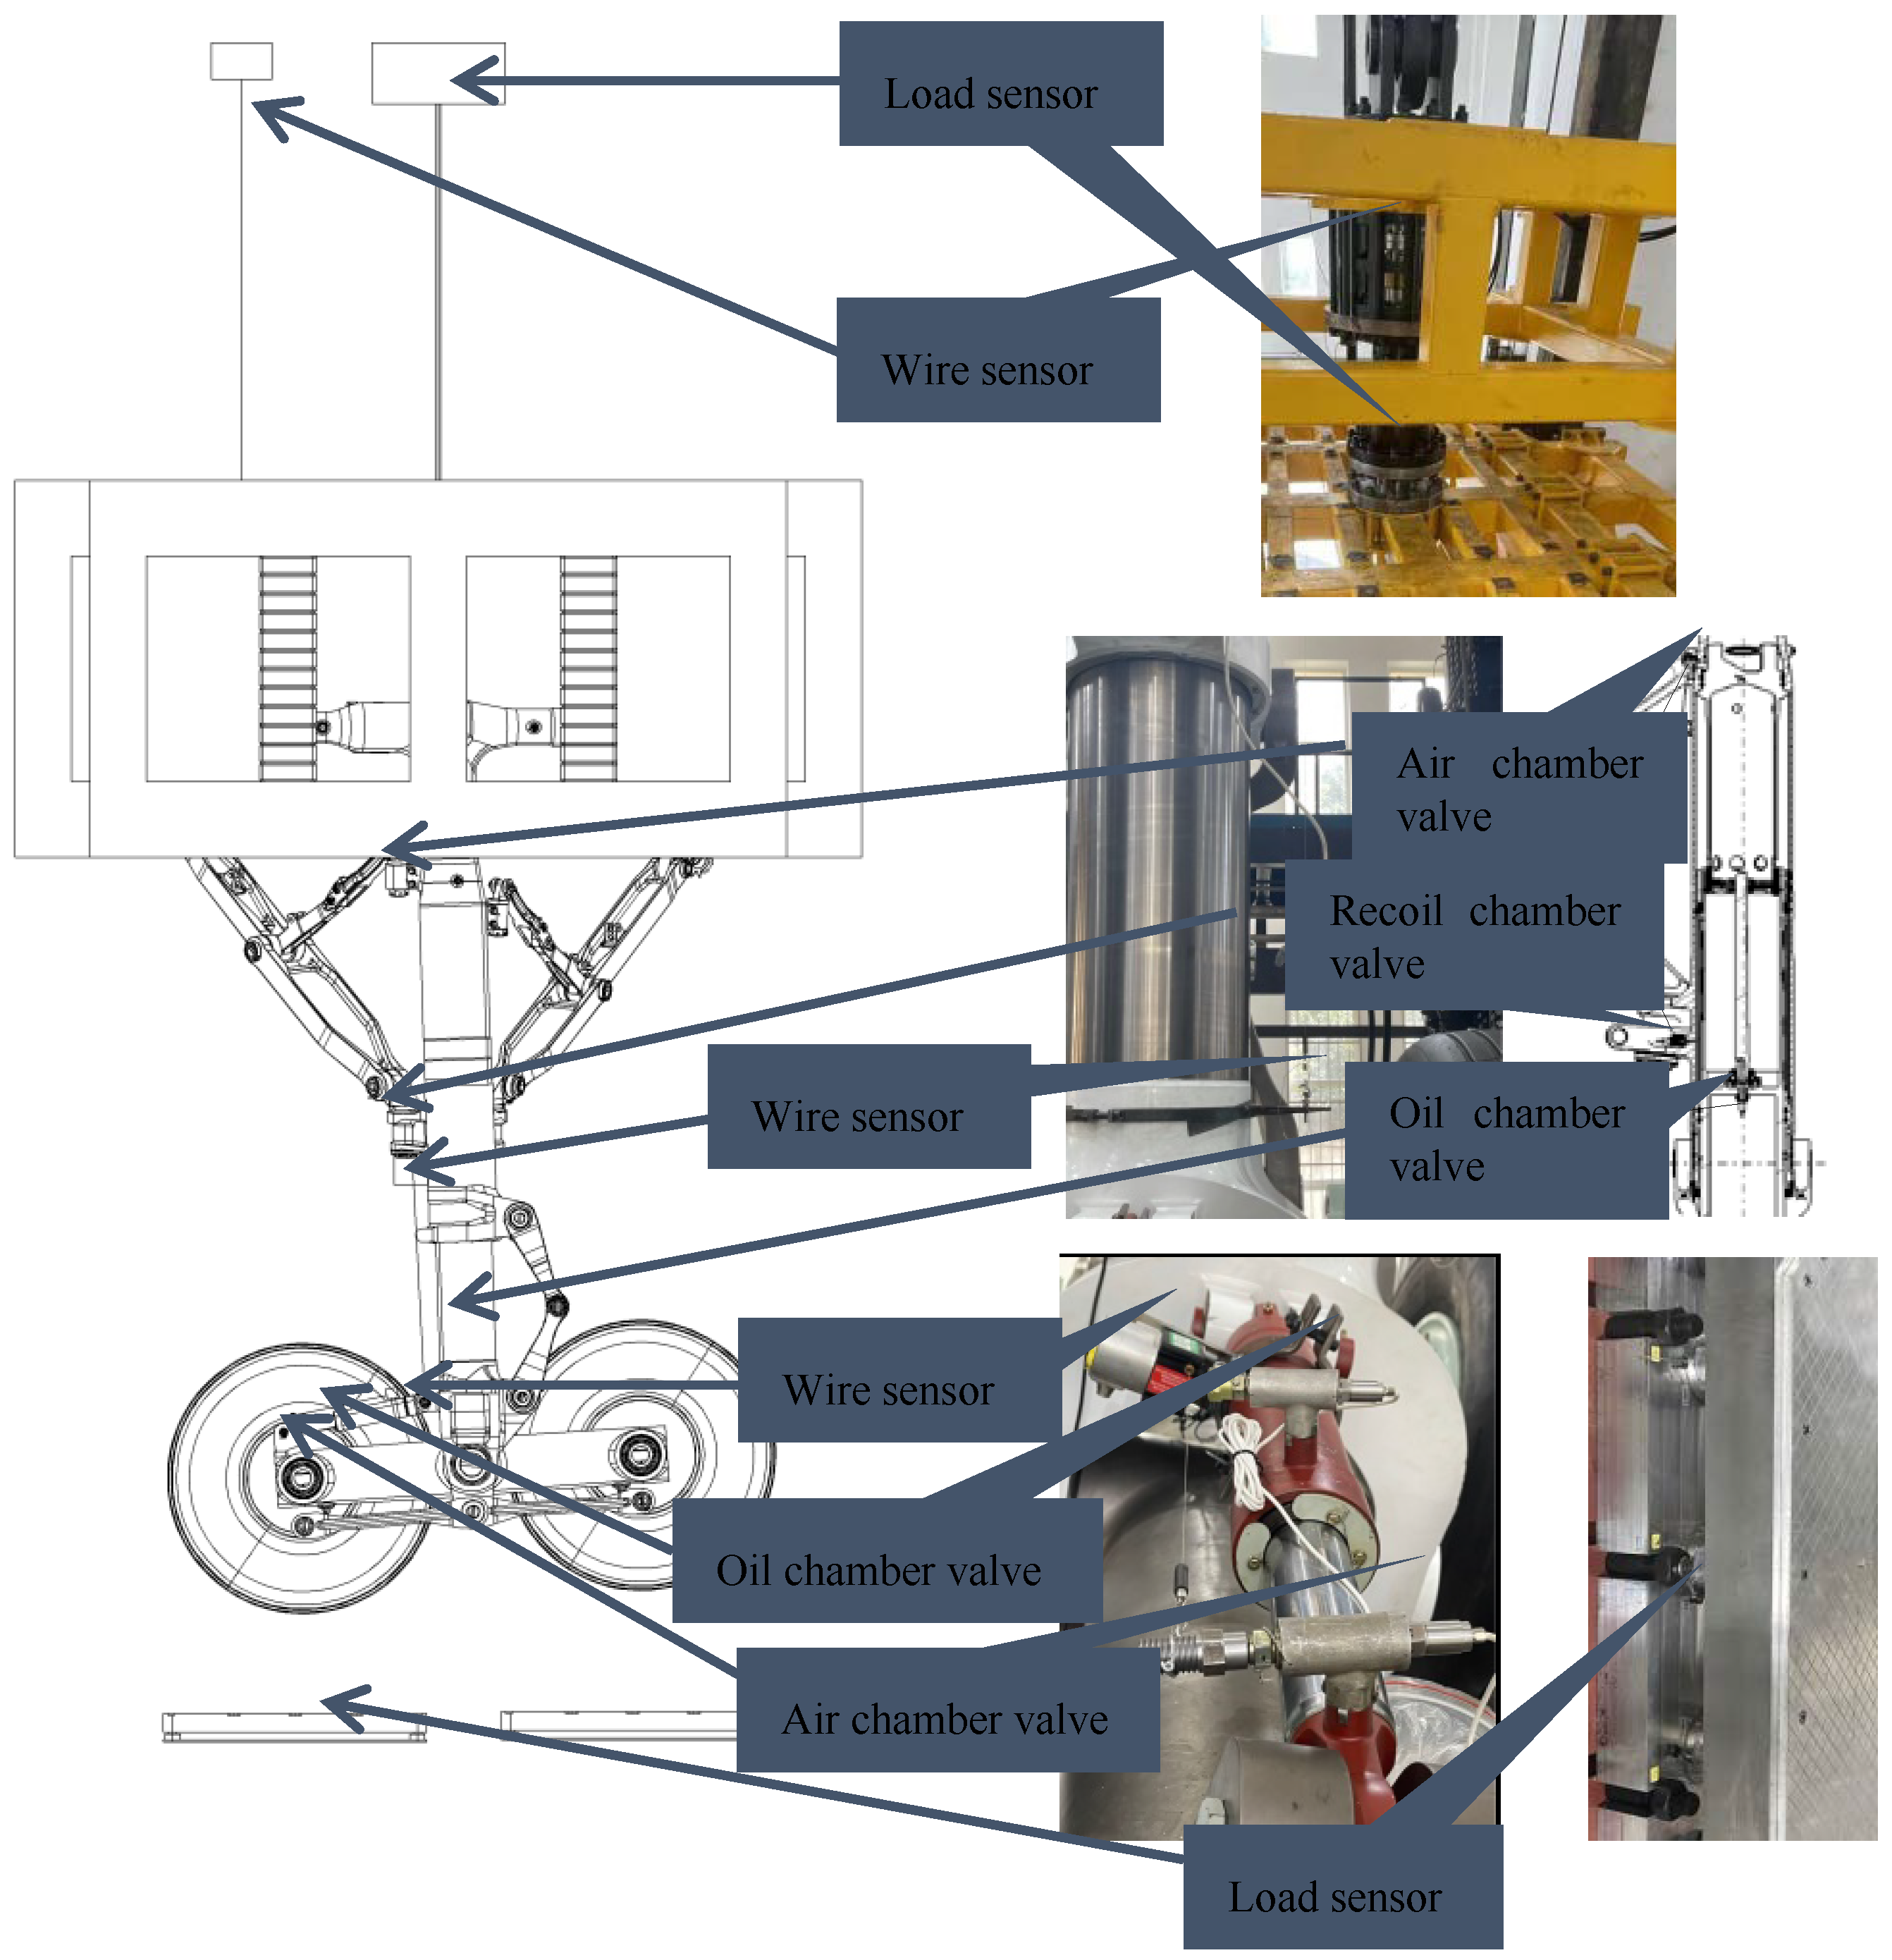
The landing gear is fixedly attached to the gondola, and the assembly can slide vertically along the slide rails. The gondola is equipped with counterweight blocks, which can be added or decreased as needed. Each impact-platform is equipped with 6 load sensors, which can measure vertical and longitudinal loads with 1000 Hz sampling. The overall displacement of gondola, main buffer stroke, the internal pressure of the pitch damper, and the trolley pitch angular velocity are measured by the sensor. The sensors to be used in the test are shown in Figure 4.
3.2. Drop Test Working Principle
The parameters should be simulated during the drop test including landing weight, angle of attack, sinking velocity, forward velocity, and wing aerodynamic force of the aircraft [25].
In the experiment, the equivalent reduced mass (the delivery mass) is used to represent the lift effect of the aircraft [26]. Before testing, according to the requirements of landing impact power, a certain weight dummy is assembled with the gondola to get the specific delivery mass which is measured accurately by the force sensor at the top of the gondola before each test. The landing gear is raised to a certain off-ground height to get the required ground sinking speed [27]. The four wheels are accelerated to the specified landing speed by the wheel’s turning-speed system. After that, the whole assembly of the delivery mass drops vertically along the slide rail and finally hits the four impact-platforms. During the test, each case should repeat at least three times, and if the peak error of the key parameters for the three groups of data obtained does not exceed 3%, the test could be considered valid. Otherwise, the test will continue until the criteria are met.
Since the total power absorbed by the landing gear buffer system is affected by two factors, its filling parameters and the released mass, it may need to adjust the delivery mass sometimes in each case to meet the requirement that the total work absorbed should equal 1.0–1.03 times of the theoretical design power.
3.3. Drop Test Cases
The following requirements should be considered in the process of case set for the drop test:
- (a)
- Aircraft landing attitude: two types, level, and tail-down, according to the requirements of CCAR 25,479 and 25,481. The tail-down angle is 8° based on the aircraft design requirements.
- (b)
- Aircraft landing weight: two types, landing weight and take-off weight, whose sinking velocities are 3.05 m/s and 1.83 m/s, respectively, following CCAR 25,473.
- (c)
- Pitch damper filling parameters adjusting: due to the lack of development experience, a parameter adjusting test is added for the pitch damper by varying its initial pressure and main throttle diameter as shown in Table 1, which aims at the influence of these parameters on the load for the pitch damper and the overall landing performance for the landing gear. As the pitching rotation of the trolley during tail-down landing is much higher than that during level landing, all the adjusting tests are carried out in the condition of tail-down landing.
Based on the above thinking, this paper sets a total of 9 test cases in three categories landing weight test, take-off weight test, and parameter adjustment test for the pitch damper. All the test cases are shown in Table 2. The weight data in Table 2 is determined according to the target weight of the aircraft.
3.4. Formulation of Data Processing
For each test case, the height of the gondola is adjusted by the lifting system to the certain state that the lowest tire is just in contact with the impact-platform, and all test parameters are zeroed. Next, the gondola is raised to the required drop height H. After confirming that all the test devices are working properly, the gondola is released and accelerated under the action of gravity and finally hits the impact-platforms. The test devices record the changes of parameters during the impact. In the test, attention should be paid to the following parameters:
- The drop height : the vertical distance from the impact-platform to the lowest edge of all tires [28], which is determined by,where is the sinking velocity (specified by regulations, see Section 3.3(b)), and is gravitational acceleration. In the experiment, the reading of a wire sensor which measures the vertical displacement of the gondola is checked to ensure the calculated H for each specified V.
- The theoretical work quantity : the kinetic energy of the landing gear before the landing impact, that is,where is the sinking velocity, and is reduced mass.
- The vertical overload coefficient: the ratio of the maximum sum of the vertical load of all tires to the equivalent reduced weight (equivalent reduced mass by gravitational acceleration).
- The longitudinal overload coefficient: the ratio of the maximum sum of the longitudinal load of all tires to the reduced weight. In the test, the time history curves of vertical and longitudinal loads of all tires are measured by the sensors assembled in the impact-platforms.
- The total work absorbed by the landing gear : the work done by the vertical reaction force of all tires from the moment that the tire touches the ground until the hanging basket reaches its lowest position, i.e.,where is the sum of the vertical reaction forces of all tires. is the vertical displacement of the gondola measured by the wire sensor (detailed in Figure 4, the tire first touching the ground as zero). is the maximum displacement. For the buffer, its axial force, , is obtained by multiplying the measured pressure (see Figure 4) with the acting area.
- The efficiency of the landing gear buffer system : the ability to absorb energy during the landing impact, which could be calculated by [29]where is the maximum sum of the vertical reaction force on the ground of all tires, and is the maximum displacement.
- The work absorbed by the pitch damper : the work done by the axial force from the damper begins to compress until its maximum compression, i.e.,where, is the axial force of the pitch damper. is the compression amount of the pitch damper, and is the maximum compression amount of the pitch damper.
- The maximum kinetic energy of the trolley pitching rotation could be calculated aswhere is the pitching moment of inertia of the trolley (composited of all mechanisms installed on the trolley such as axles, wheels and brakes, and tires. This value is obtained by measuring the 3D digital model in CATIA V19R5.). is the maximum angular velocity of the trolley in the first compression cycle, which is calculated from the compression speed of the pitch damper.
4. Results and Analysis
4.1. Landing Weight Test
This includes cases 1 and 2 in Table 2, i.e., level and tail-down attitude and the pitch damper in the PD4 configuration of Table 1. The corresponding parameters, such as landing theoretical work, release height, and release mass, are shown in Table 3. In the experiment, the measured work is 446.3 kJ and 443.8 kJ, respectively, which exceeds the theoretical work by less than 1%, so the tests are effective.
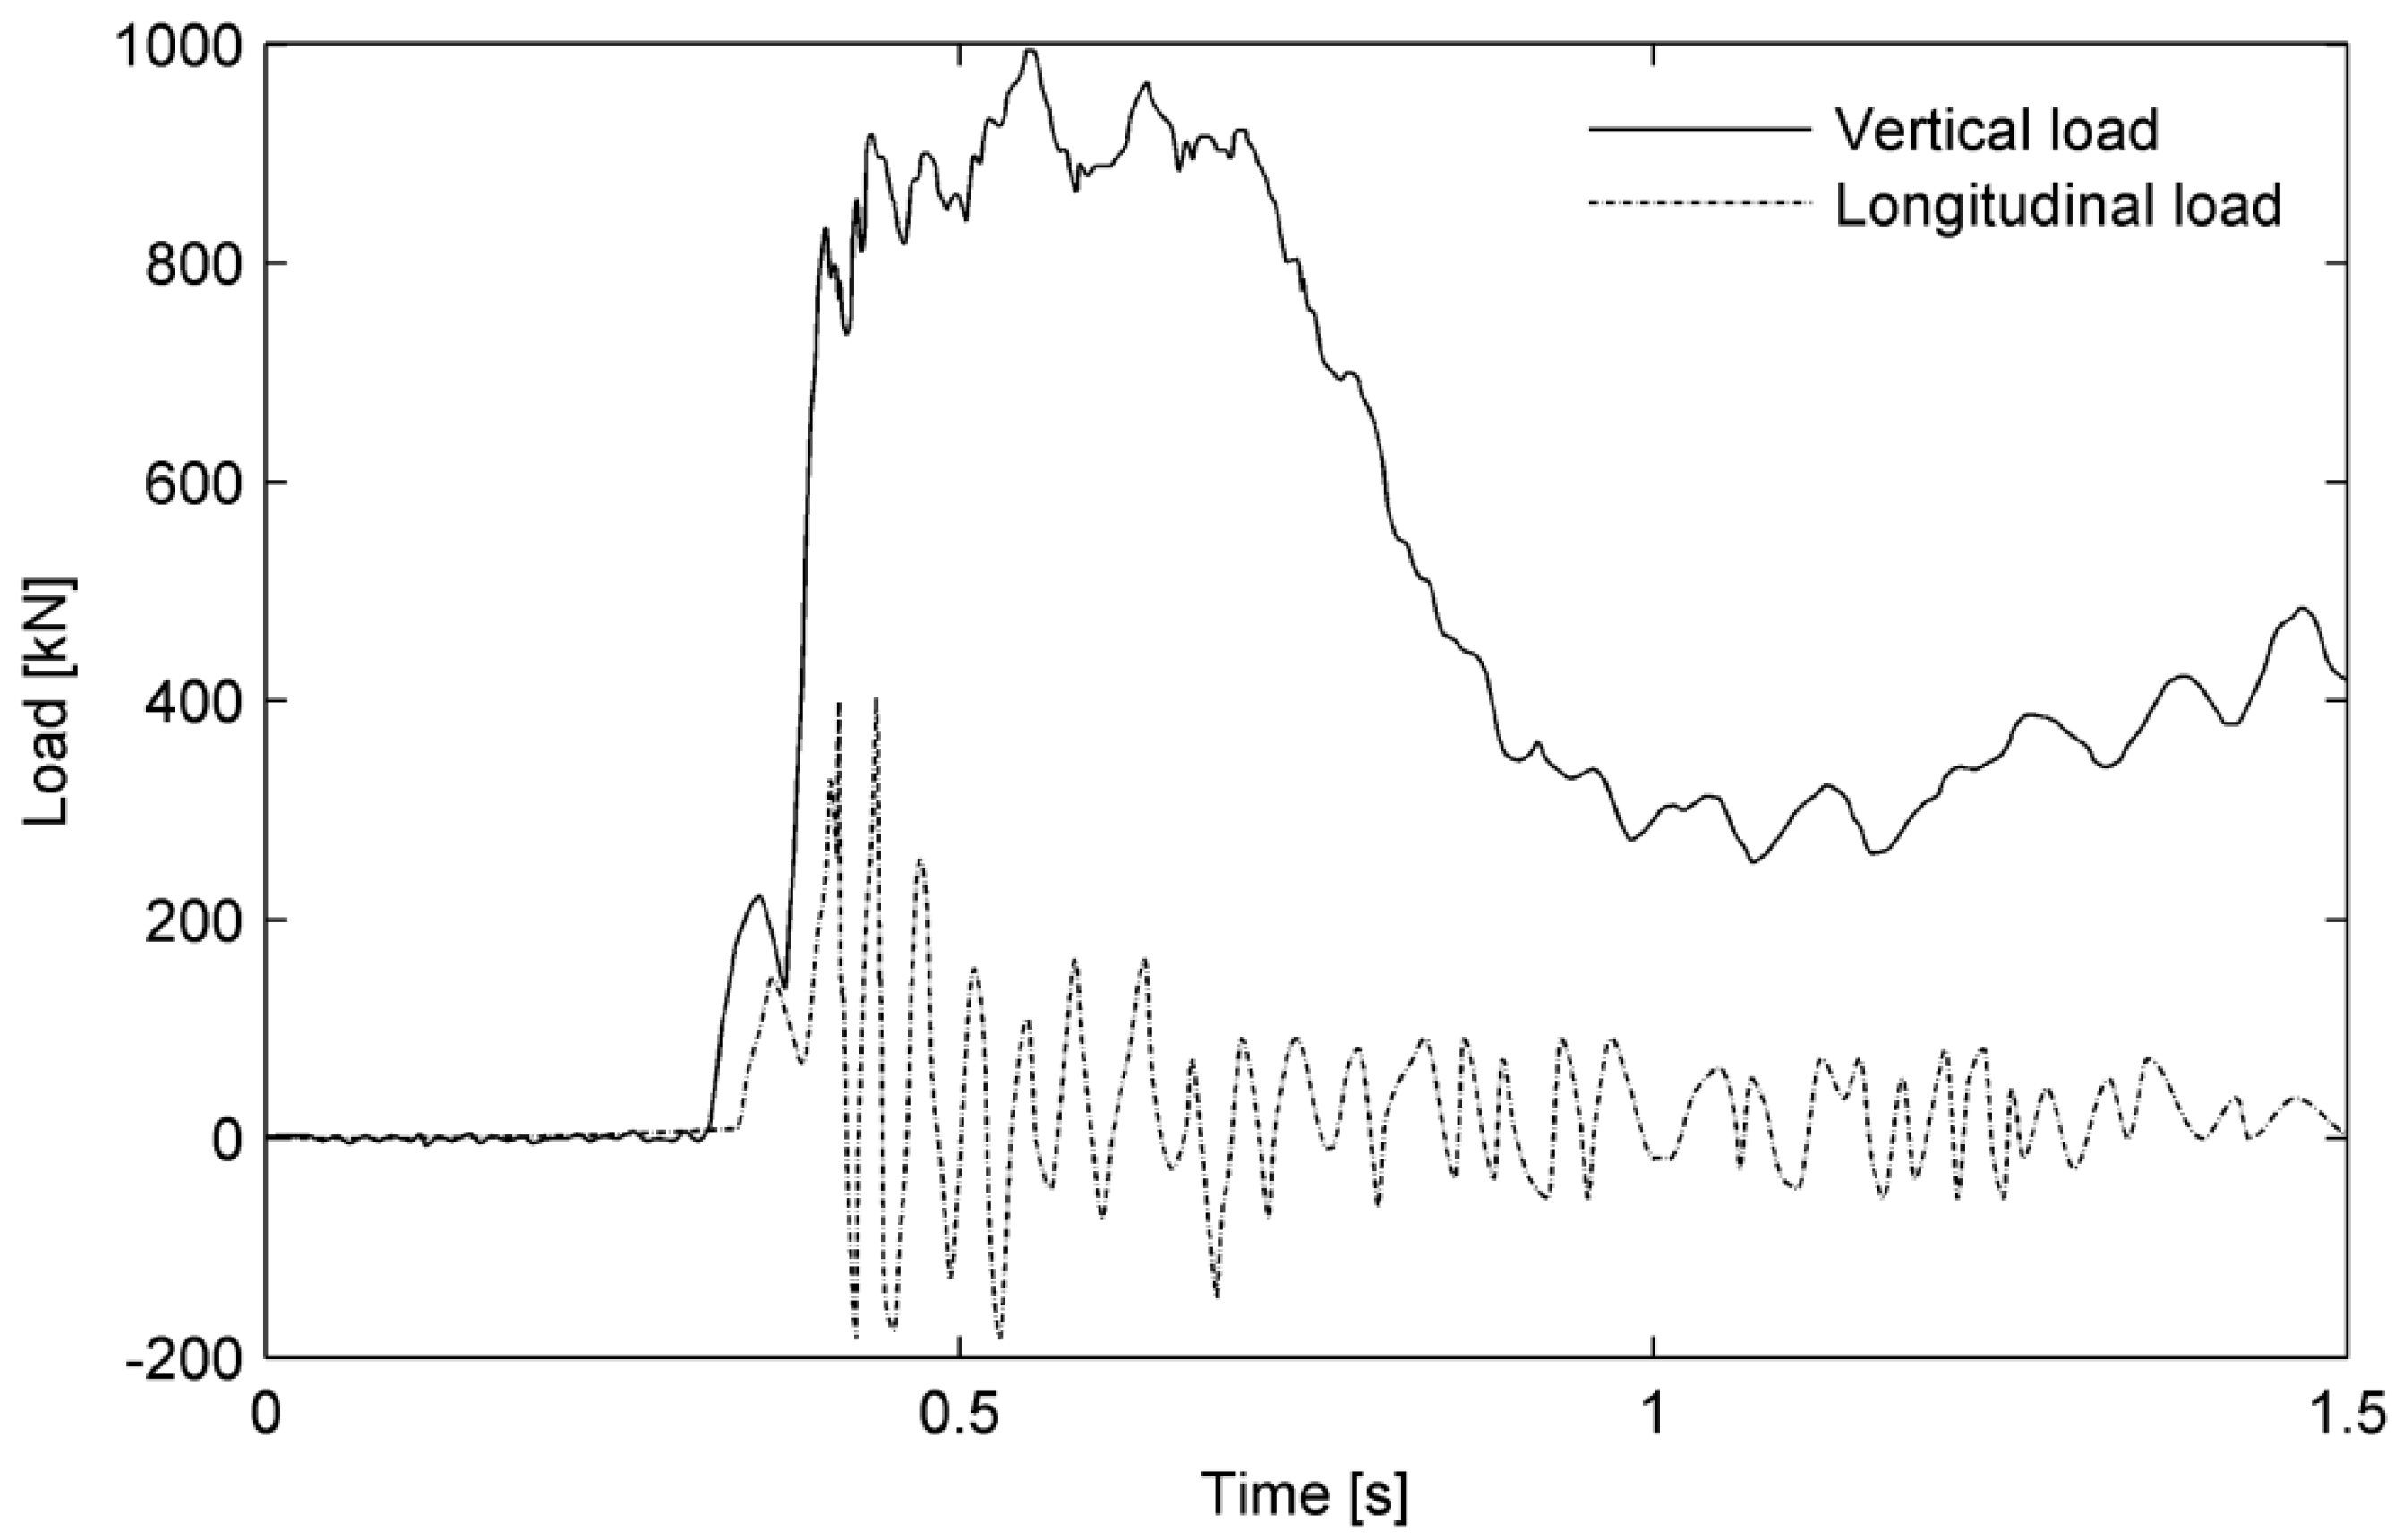
In the level attitude, the landing gear is put vertically. After dropping, the rear wheels touch the ground first due to the 9° leaned back angle, and the trolley rotates rapidly under the combined action of vertical and longitudinal loads. Next, the front wheels are grounded, the four wheels are subjected to impact load synchronously, and the main buffer is compressed rapidly. The vertical load reaches its first peak, and then the trolley oscillation weakens rapidly as the time history of vertical and longitudinal loads are shown in Figure 5.
Under the tail-down condition where the rear elevation angle of the trolley reaches 17°, the impact process could be divided into two stages. In the first stage, the lower two tires are compressed synchronously with the main buffer, and the first load peak appears (see Figure 6). In the second stage, the four wheels are grounded at the same time, and the front and rear tires rebound alternately but do not leave the ground. The buffer further compresses and absorbs energy, and a small oscillation occurs after the vertical load reaches the peak.
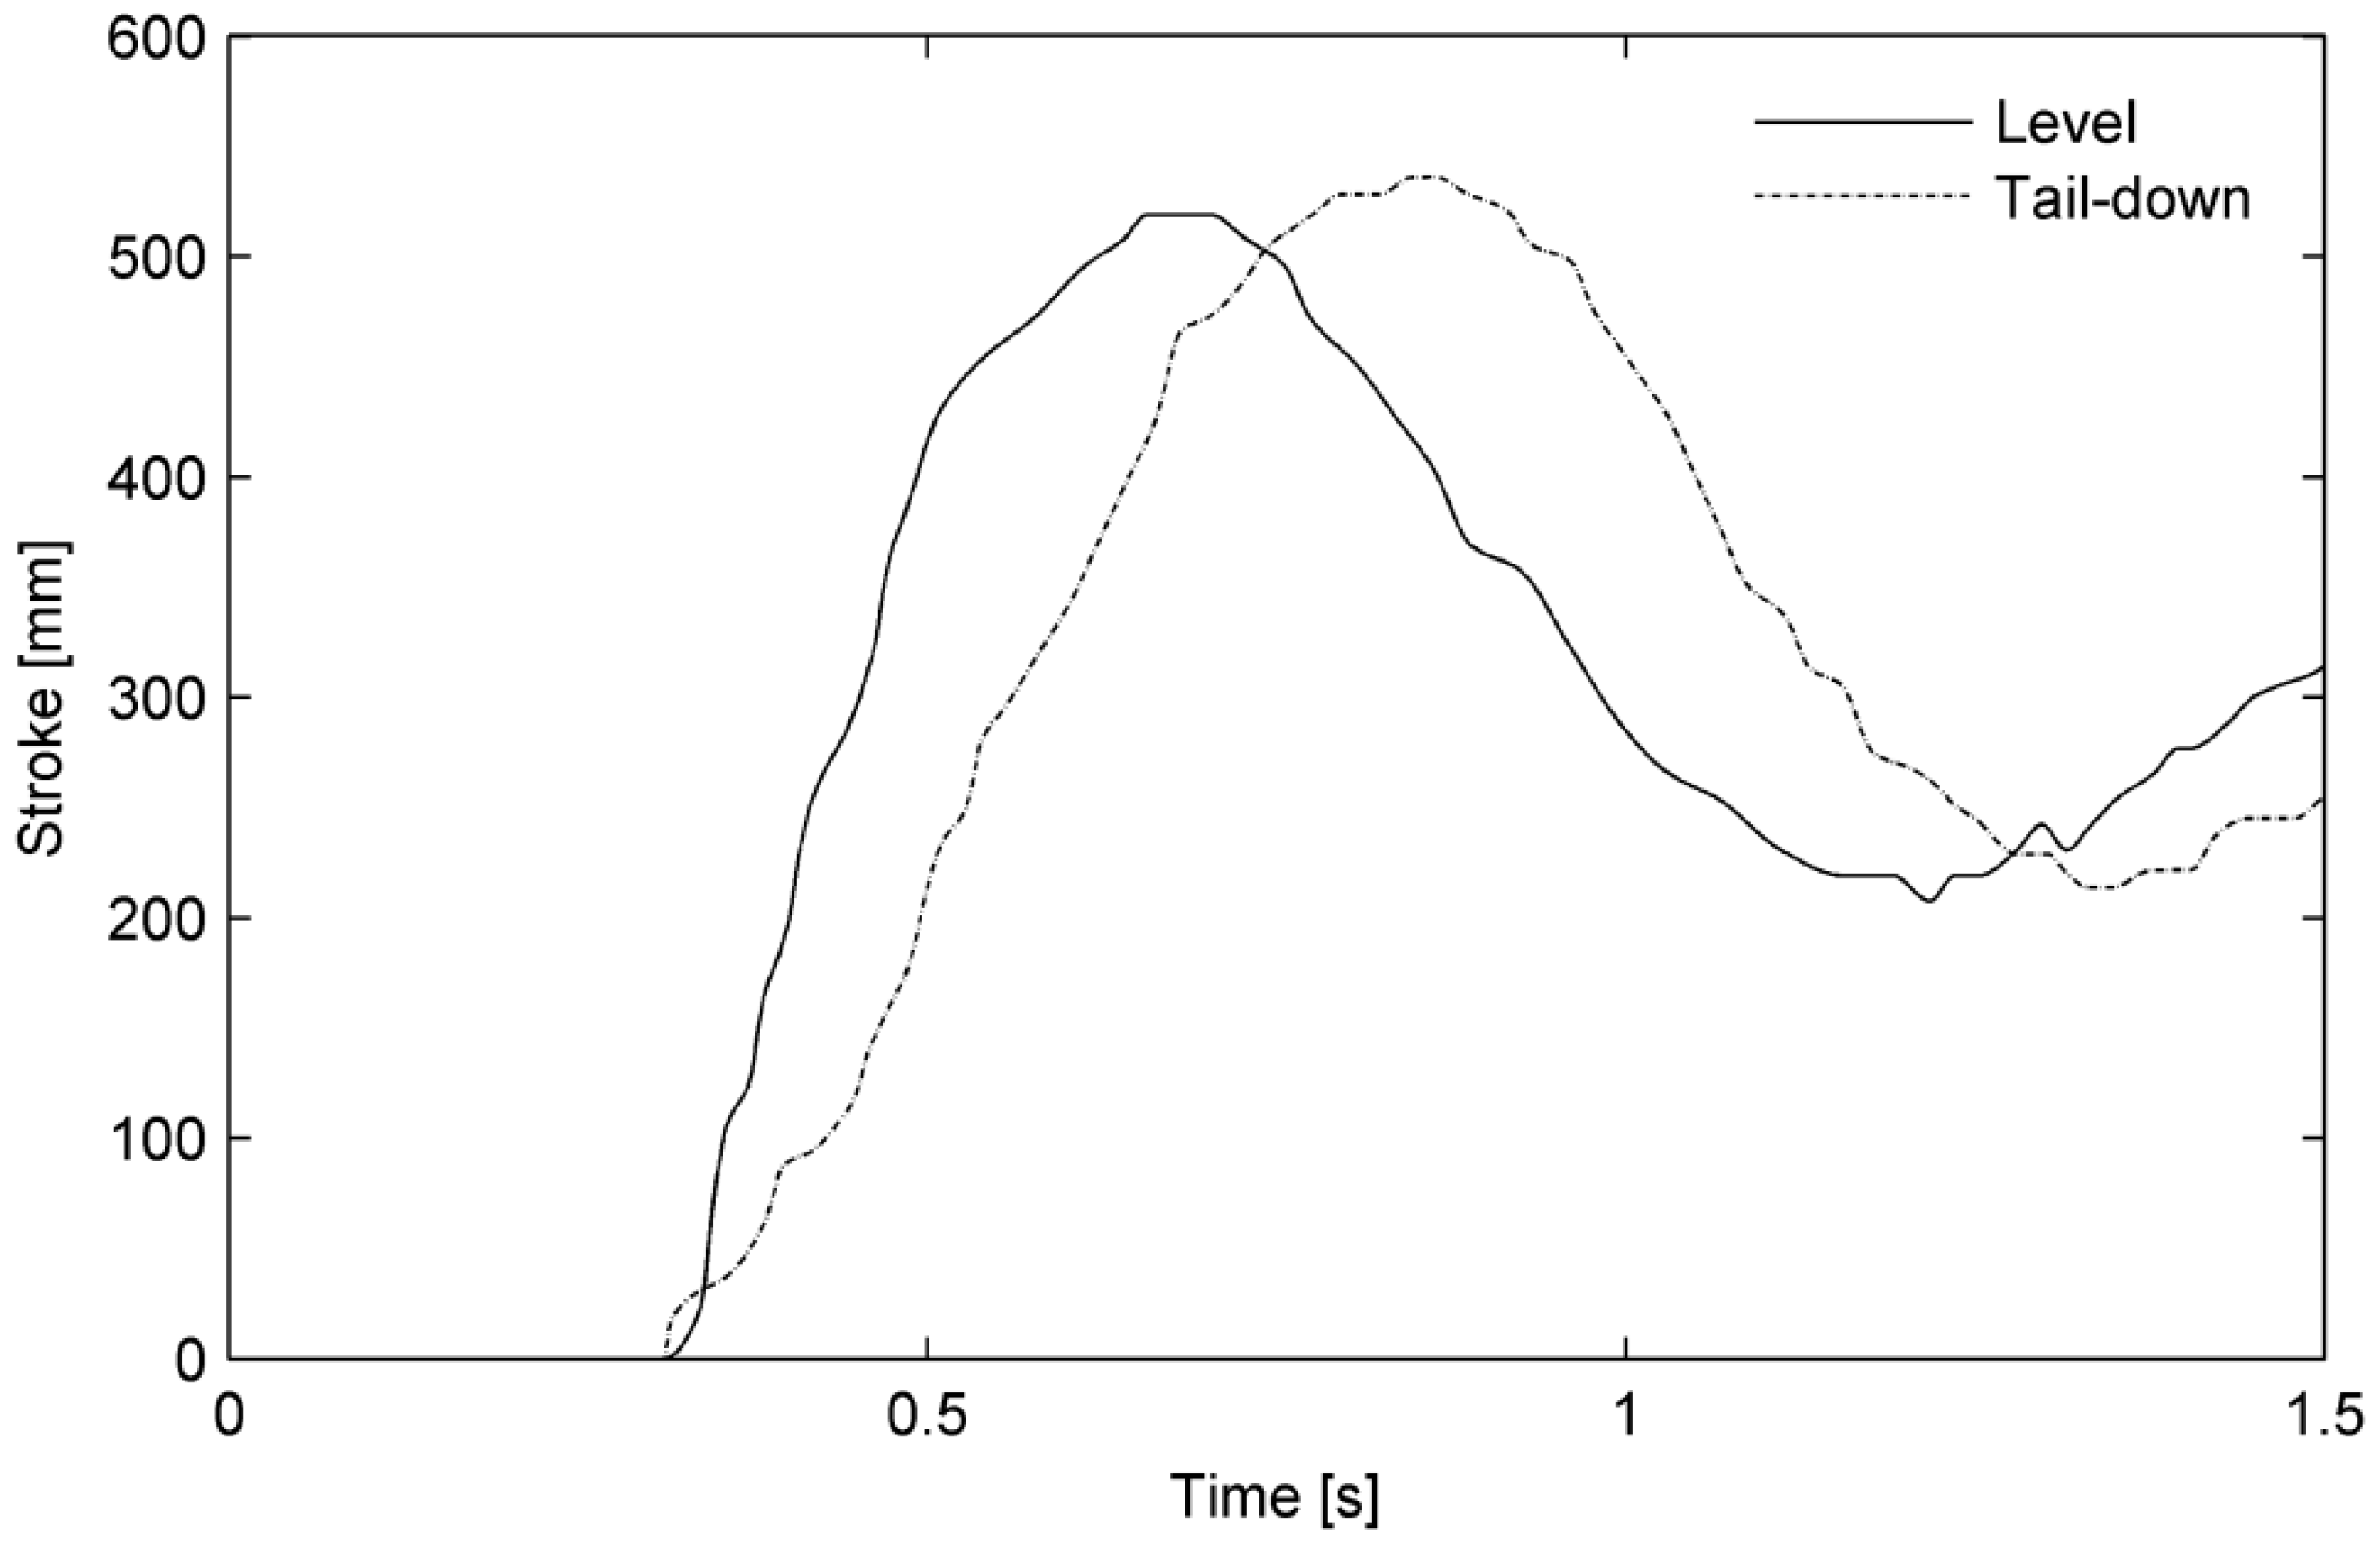
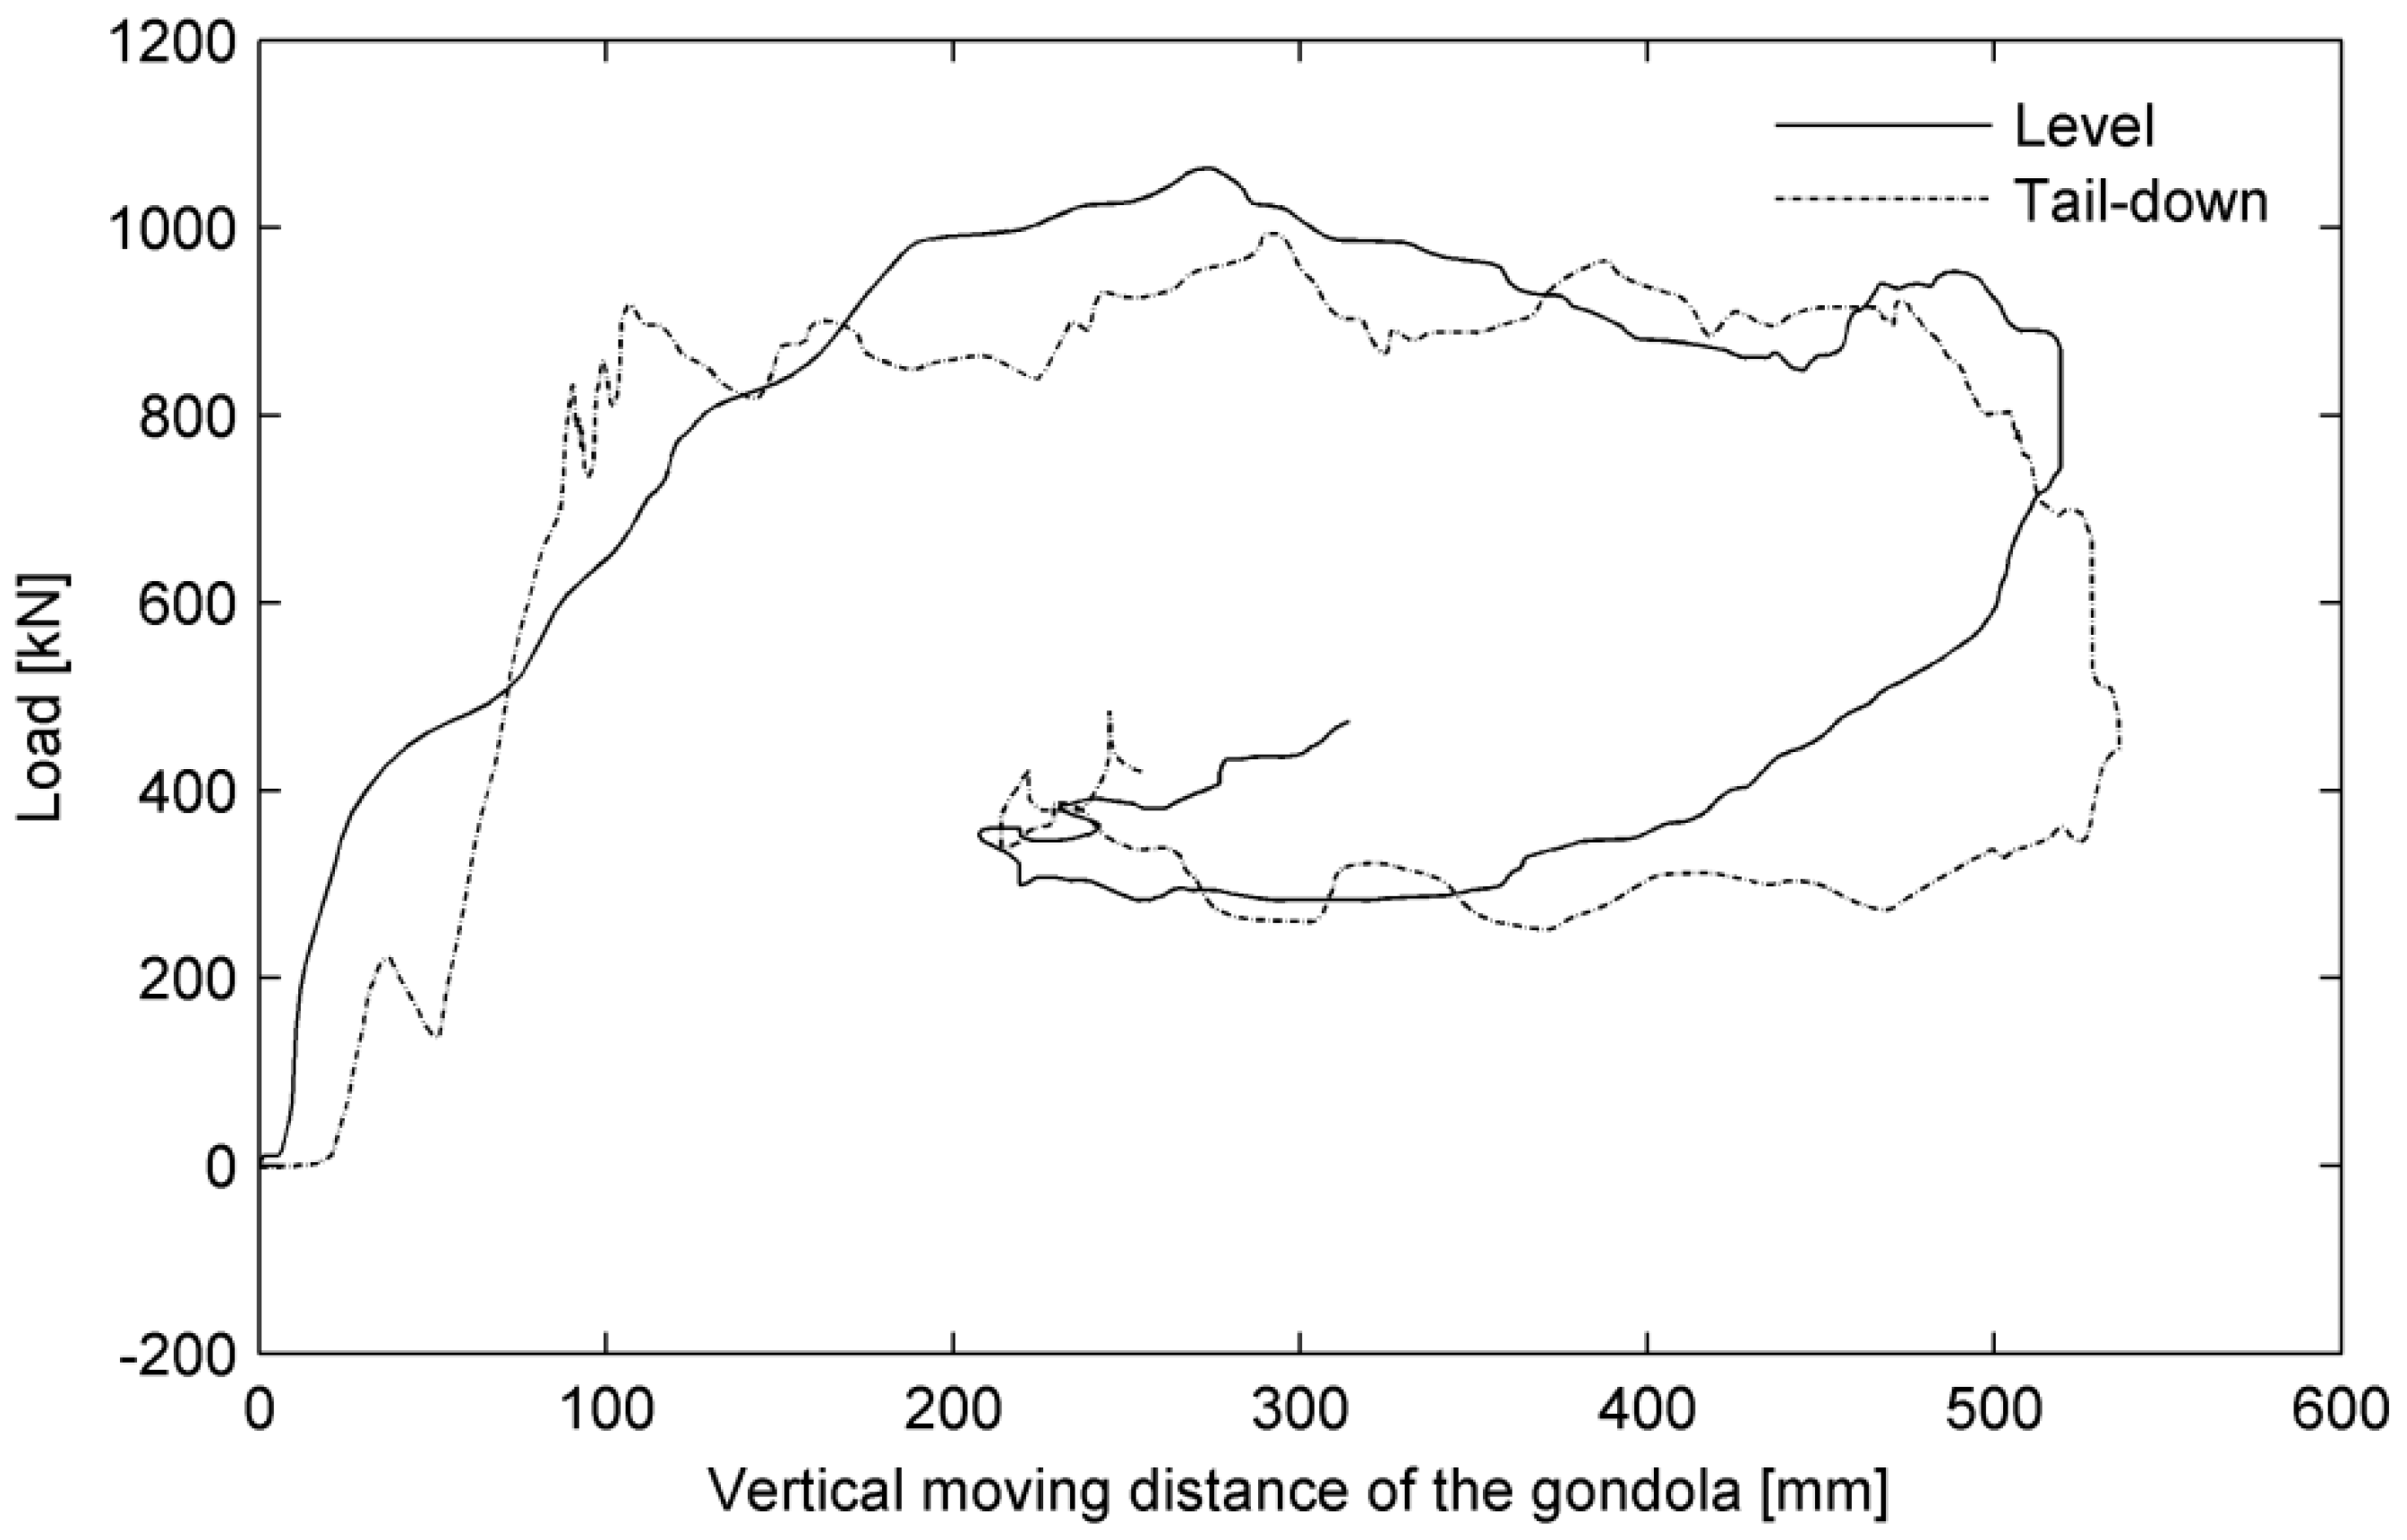
As can be seen from Figure 5 and Figure 6, when the four-wheel landing gear lands under landing weight, the vertical load curve is full, and the vertical load coefficients are 1.14 (level) and 1.07 (tail-down), respectively, which is much less than 1.45 [30] of the pillar landing gear. According to the efficiency calculation method in Section 3.4, the total energy during the landing impact is integrated, and the efficiency coefficients are obtained by dividing the maximum sum of the vertical reaction force on the ground of all tires and the maximum displacement (Time history of strokes are shown in Figure 7). The efficiency coefficients of the corresponding buffer system are 80.9% and 83.3% (Amount of work on landing weight are shown in Figure 8). The positive longitudinal load coefficients are 0.54 (level) and 0.47 (tail-down). The negative longitudinal load coefficients are −0.21 (level) and −0.20 (tail-down). In the tail-down attitude, the appearance of the first impact peak effectively absorbs the impact energy and reduces the subsequent impact, reducing the vertical and longitudinal loads coefficients and improving the efficiency of the buffer system.
4.2. Take-Off Weight Test
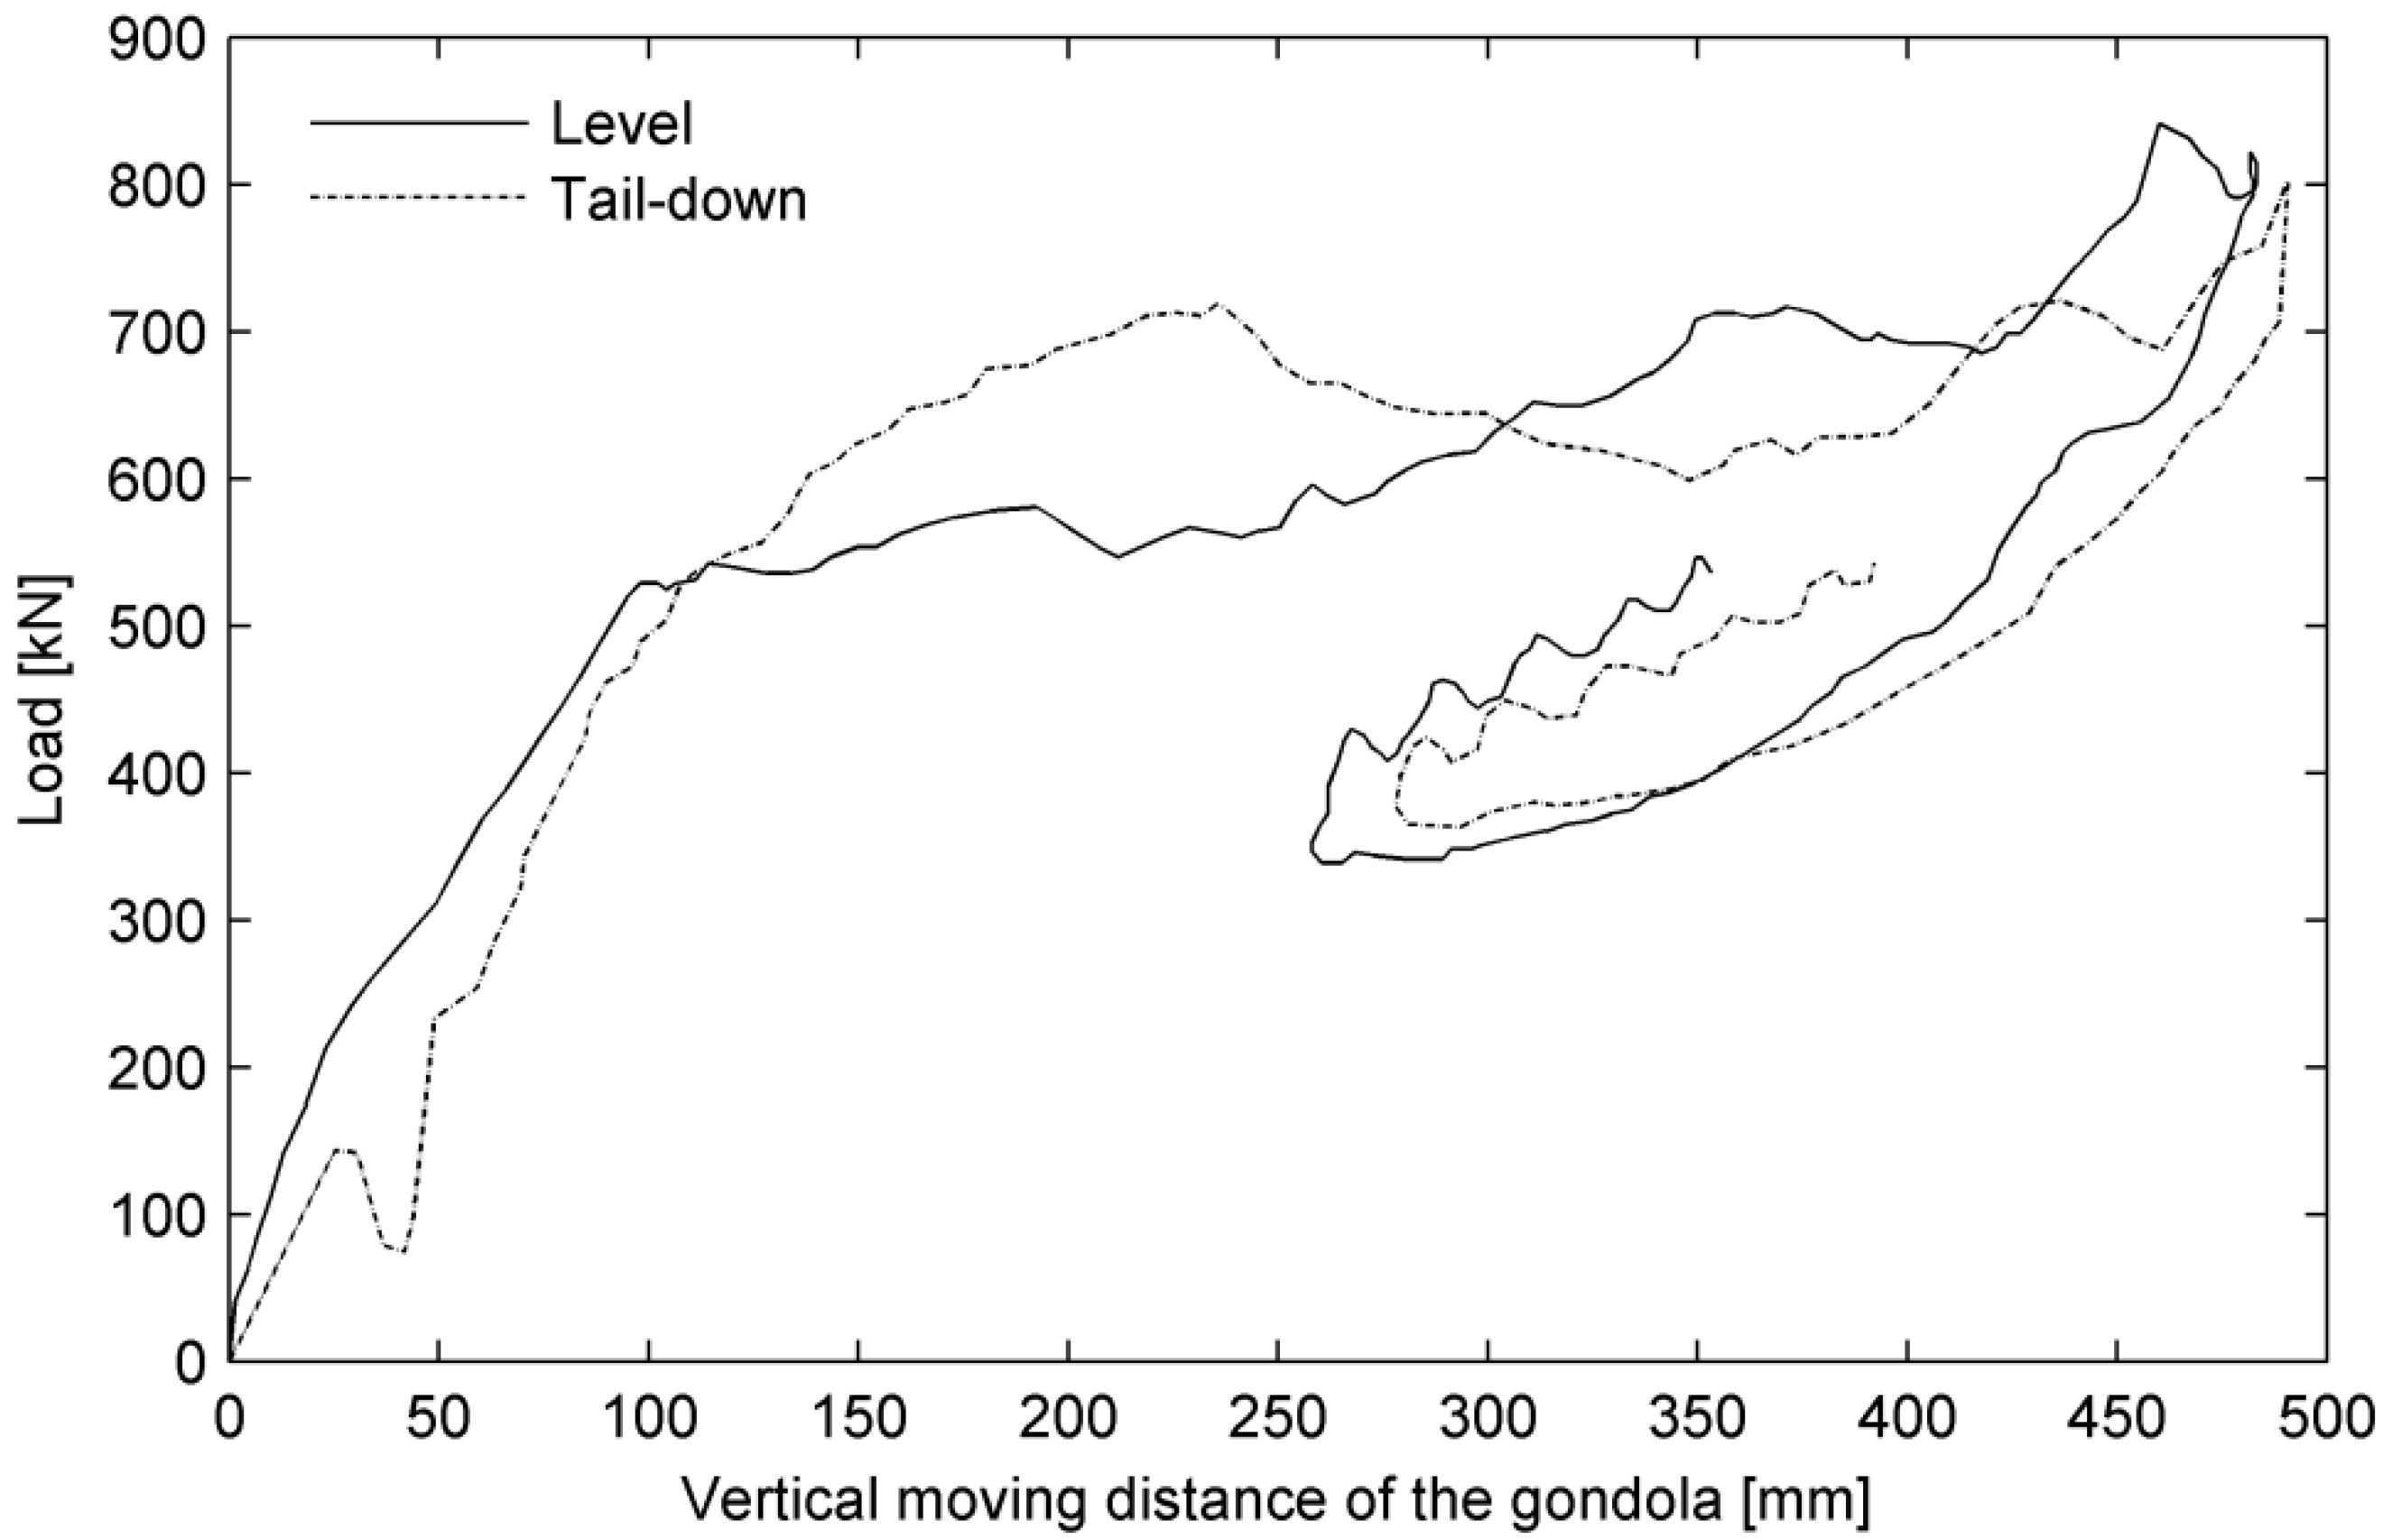
This drop test includes cases 1 and 2 in Table 2, i.e., level and tail-down attitude and the pitch damper in the PD4 configuration of Table 1. The corresponding parameters such as landing theoretical work, release height, and reduced release mass are shown in Table 4. In the experiment, the measured work is 274.1 kJ and 275.0 kJ, respectively, which exceeds the theoretical work by less than 3%, and the tests are effective. The work of landing in take-off weight is about 60.6% of that in landing weight, and the measured vertical and longitudinal loads are lower than that under landing weight. Vertical and longitudinal loads are the important aspects of the design. Under take-off weight, the efficiency coefficients of the buffer system are only 67.5% (level) and 69.7% (tail-down). The reasons are that, on the one hand, the impact energy is low and the compression of the buffer system is slow, leading to the slow rise of the vertical load and the lack of fullness of the power diagram (see Figure 9). On the other hand, under take-off weight, the buffer is not fully compressed, and the stroke of the buffer is not fully utilized. The maximum measured compression capacity of the buffer is 370 mm (level) and 368 mm (tail-down), which are much smaller than that of 418 mm (level) and 413 mm (tail-down) under the landing weight.
In a tail-down attitude, there are also two stages in the impact process, which makes the efficiency of the buffer system higher than that of the level landing condition.
4.3. Parameter Adjusting Test of Pitch Damper
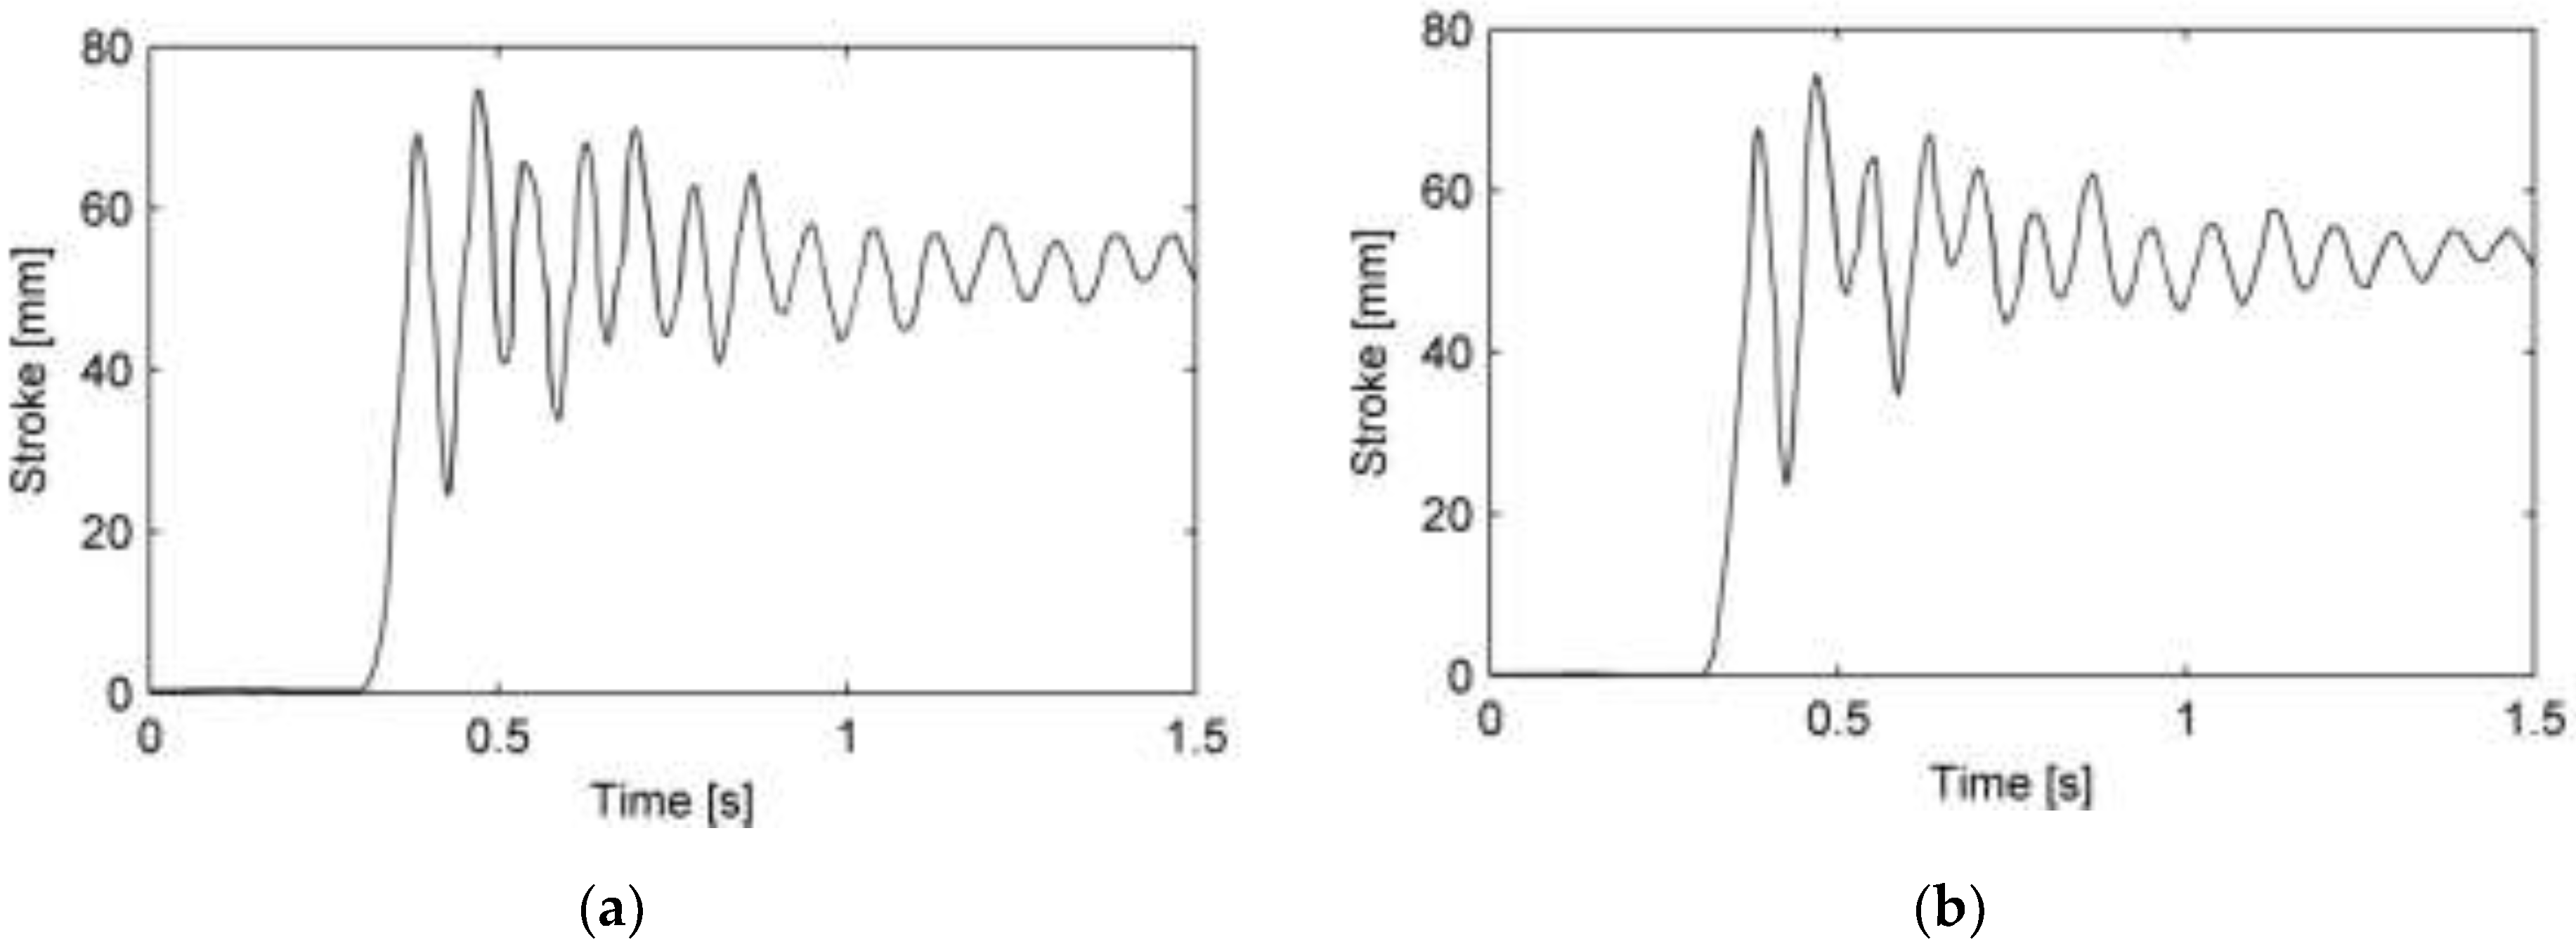
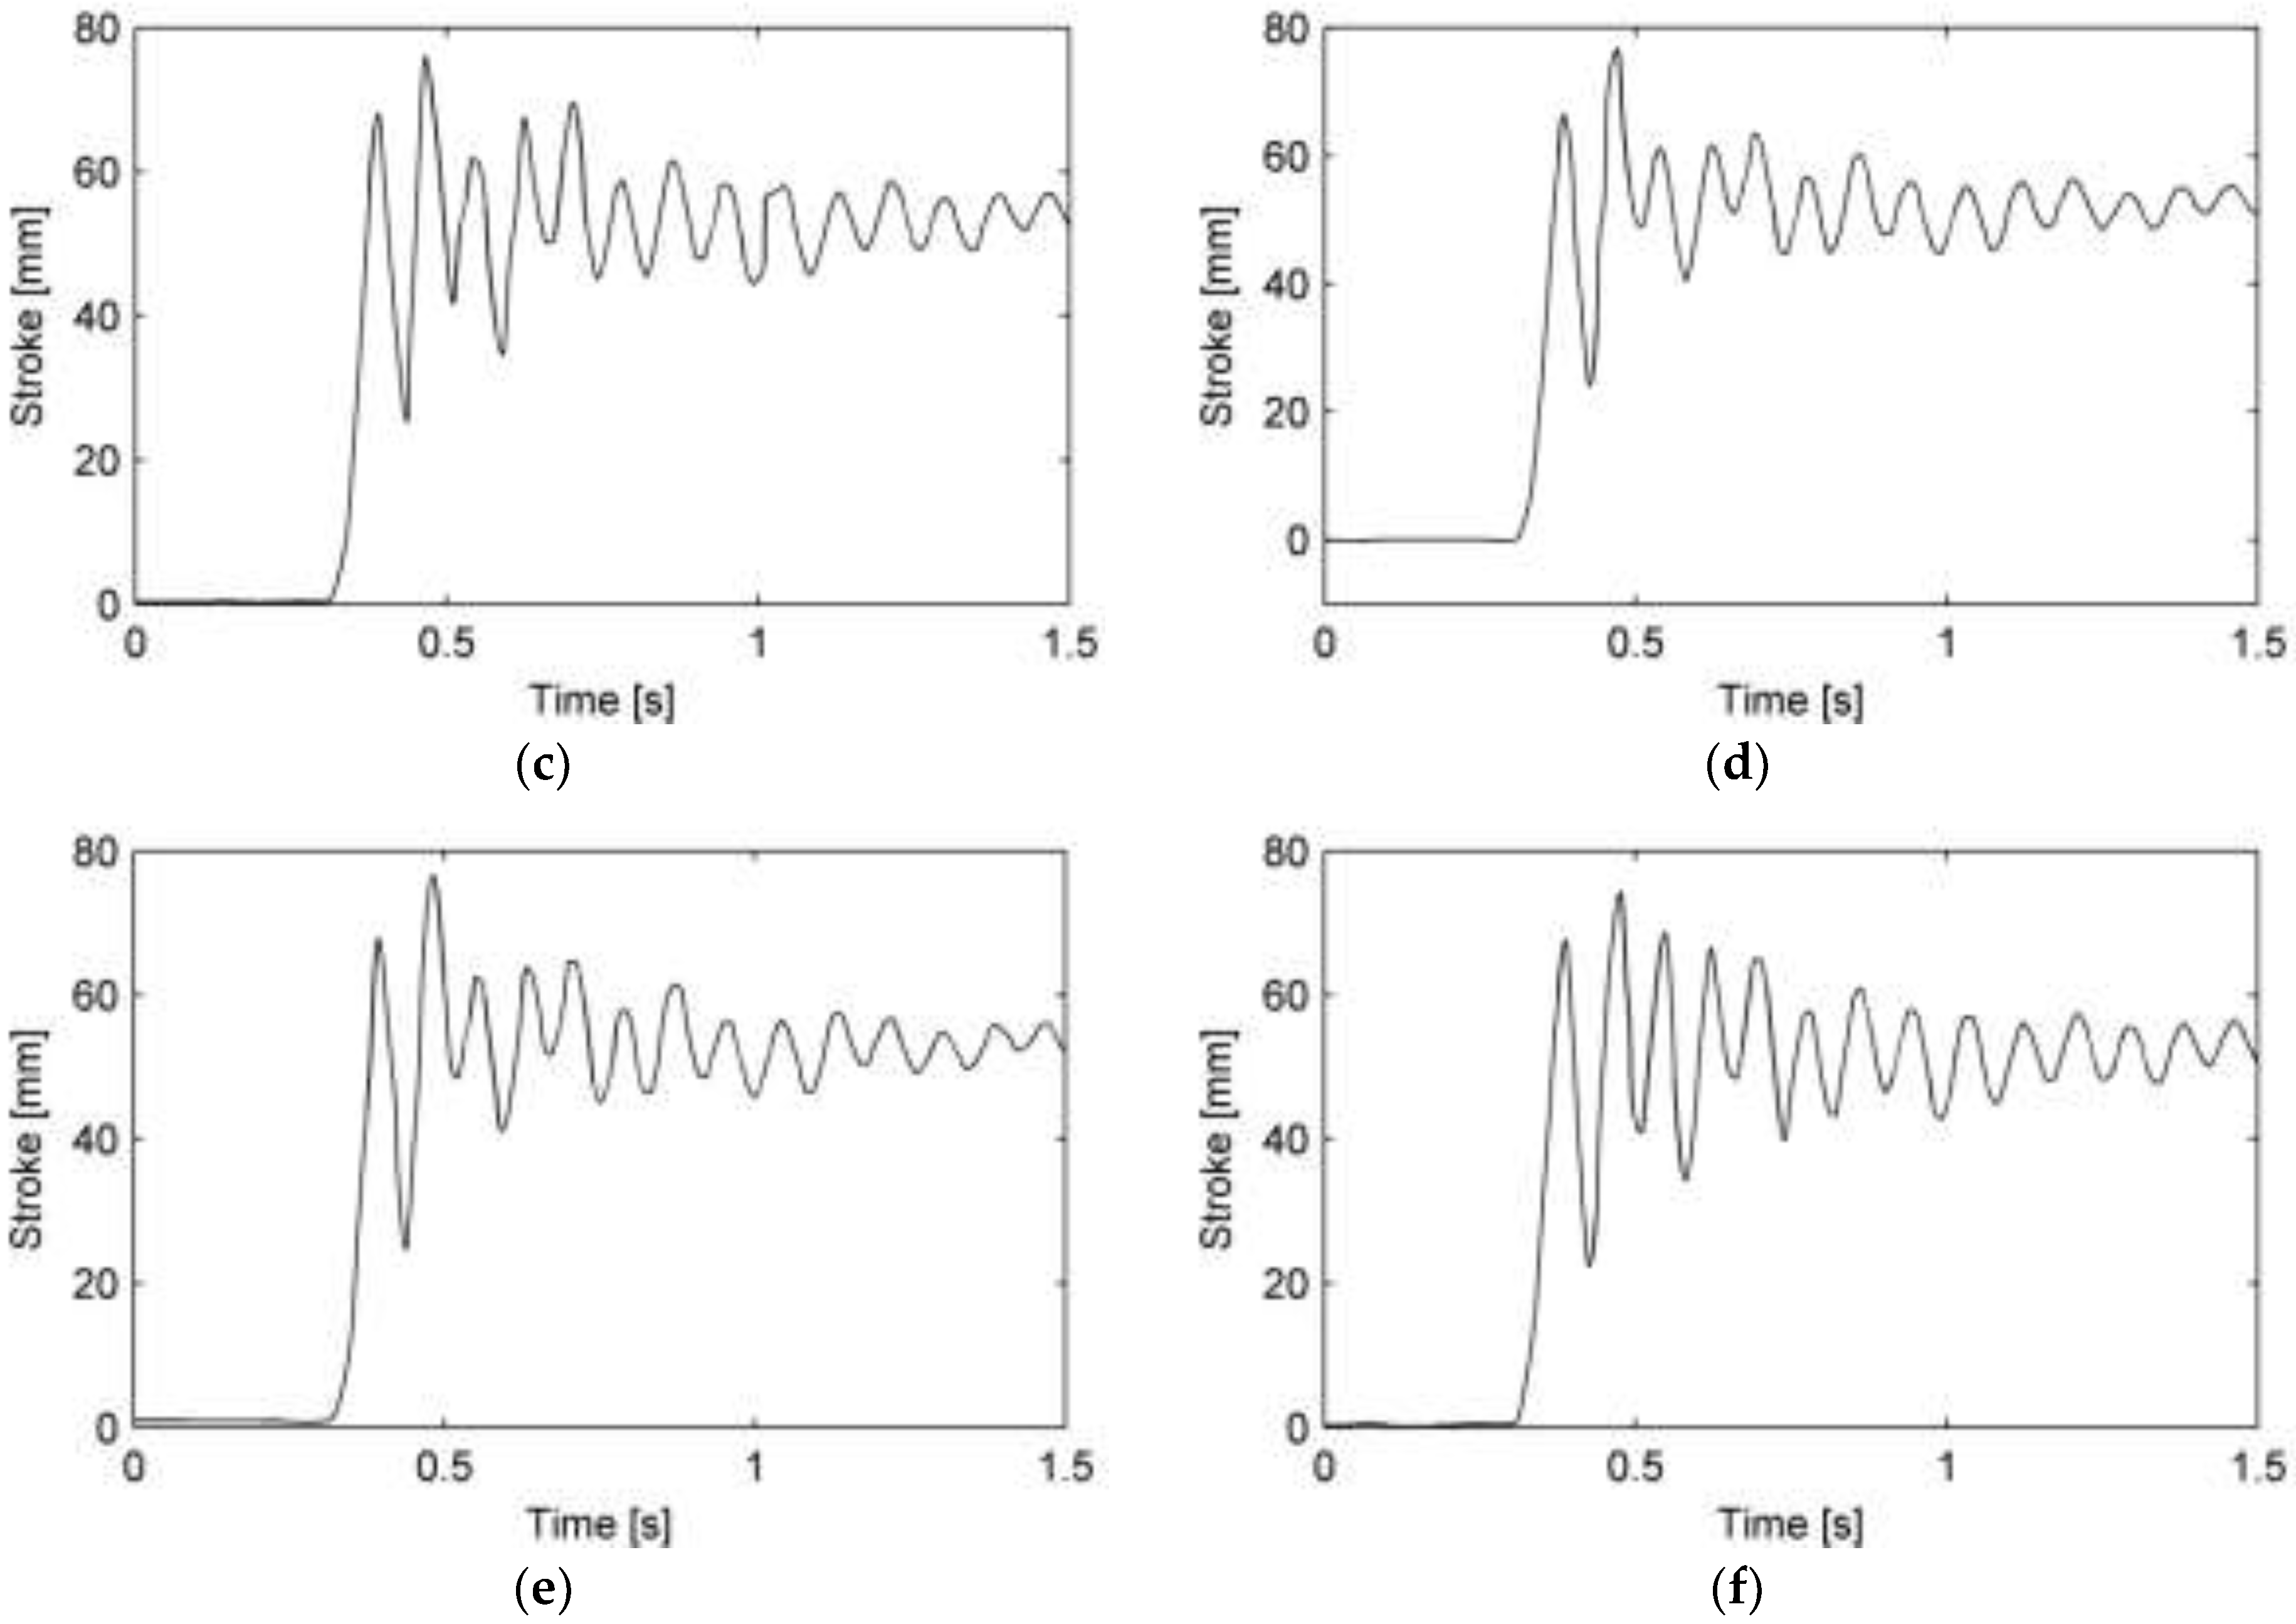
The parameter adjusting test of the pitch damper includes six cases (see Table 2, cases 2, 5, 6, 7, 8, 9). In the tests, the landing gear is in a tail-down attitude. The measured time history of pitch damper compression is shown in Figure 10. It can be seen from the test results of all the six configurations that the pitch damper can make the trolley oscillation tend to converge, and the change in filling pressure and orifice diameter will not significantly affect its telescopic motion law. After the tires touch the ground, the pitch damper is compressed quickly, reaches the maximum compression stroke at the second peak, and then gradually attenuates. The maximum compression strokes for the six configurations are very close, as shown in Figure 10. Generally, the initial filling pressure of the pitch damper does not significantly change the pitching motion of the trolley. Through detailed comparison with the filling pressures of PD1 (Figure 10a), PD2 (Figure 10b), and PD3 (Figure 10c), it can be drawn that the compression under 6 MPa tends to stabilize a little faster, and the amplitude of each cycle attenuates more when compared with the filling pressure of 4 MPa and 8 MP. Considering the bearing capacity of the pitch damper, the filling pressure is set to 6 MPa.
In tail-down landing, the maximum kinetic energy of the trolley pitching motion, 19.8 kJ, appears after all four wheels touch the impact-platforms, which is not affected by the initial filling pressure of the pitch damper. In this process, the energy absorbed by the pitch damper is about 2.96 kJ, which accounts for only 14.9% of the maximum kinetic energy of the trolley. Thus, it can be seen that the pitch damper is not the chief consumer of the kinetic energy of the trolley.
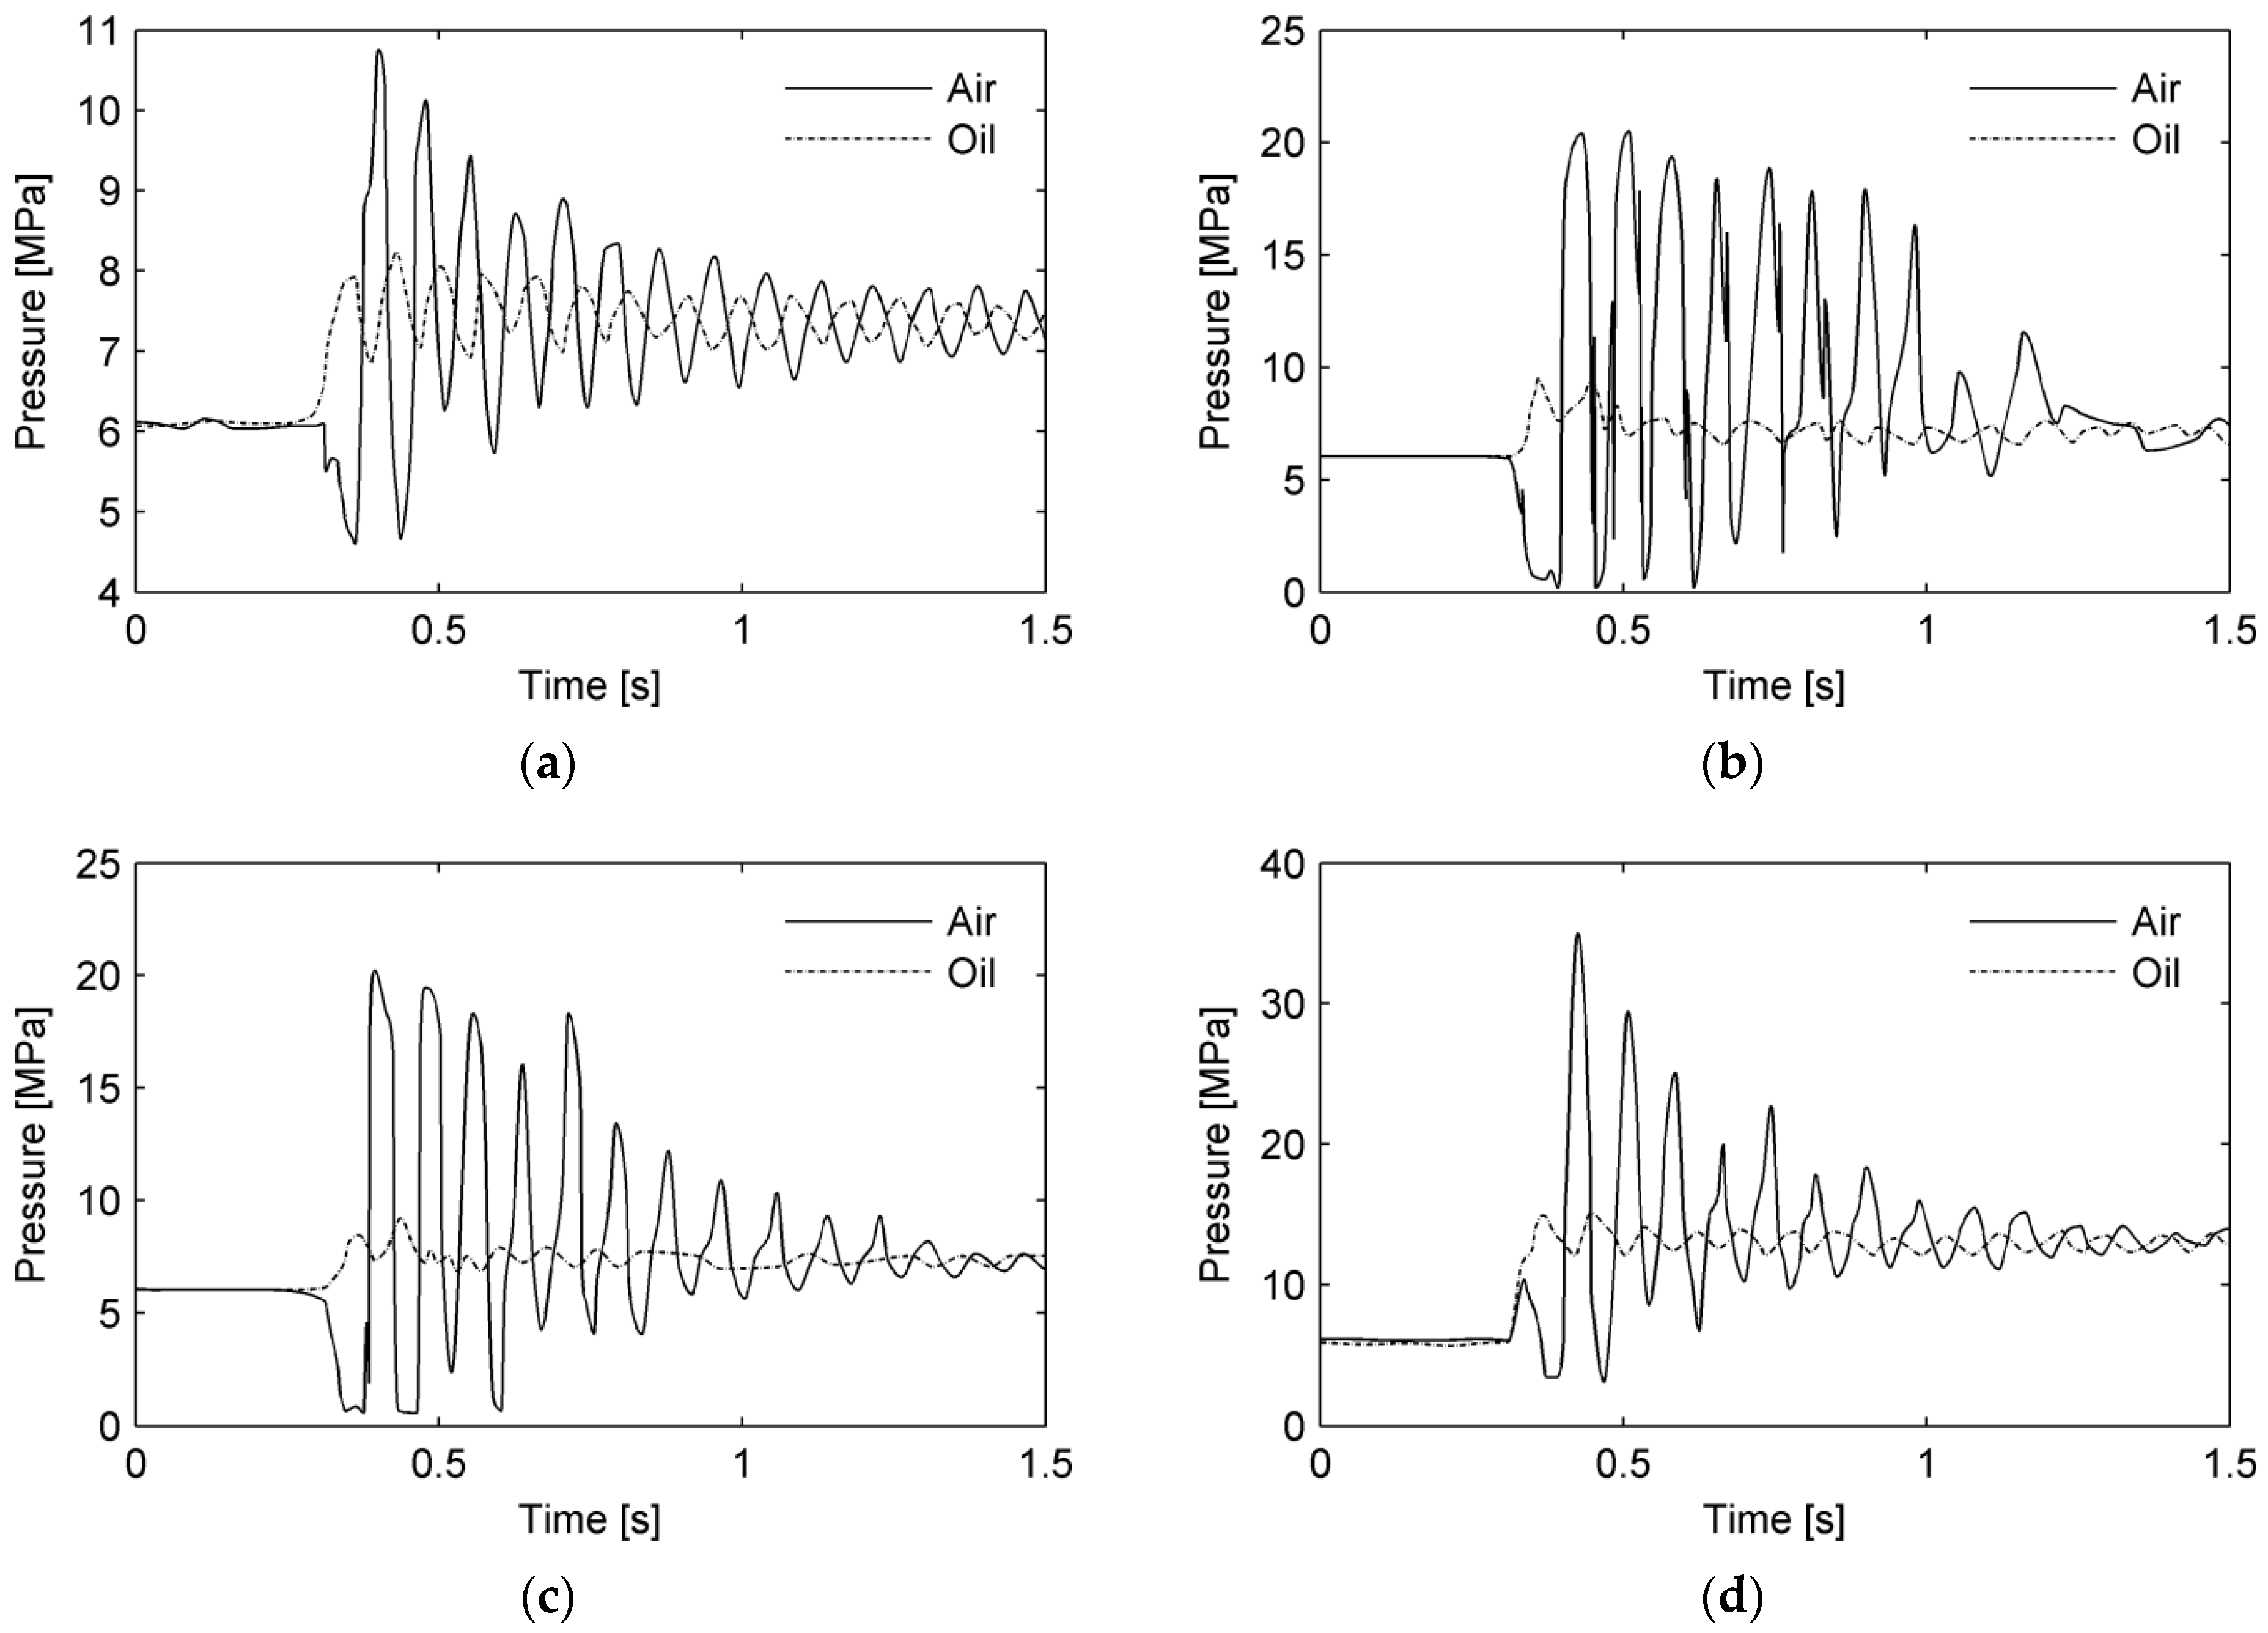
It can be seen from Figure 11 that under the initial filling pressure of 6 MPa, the maximum pressure of the oil chamber of the pitch damper increases gradually with the decrease of the main throttle diameter, while the vibration attenuation of the trolley is also accelerated. When the diameter of the main throttle is reduced to 2.5 mm the maximum pressure of the oil chamber could exceed 35 MPa, which is adverse to the safety of the structure and seals. When the diameter of the main throttle is 3.5 mm and 4.5 mm, the pressure of the oil cavity is less than 20 MPa, which will not threaten the structural safety, but the vibration of the trolley under the diameter of 4.5 mm attenuates slowly, which is not conducive to the trolley entering the stable state as soon as possible. In the case of no damping, although the pressure of the oil cavity is further reduced, the too-long trolley oscillation time and too large vibration amplitude will affect the landing gear operation and safety. Therefore, the main throttle diameter of the pitch damper is selected as 3.5 mm.
5. Conclusions
The drop test without imitating lift was developed and carried out for a typical four-wheeled twin tandem landing gear. The landing performance test is carried out and the effects of landing attitude on landing impact load and power absorption efficiency are studied. The effects of pitch damper filling parameters on the dynamic behavior of the trolley are analyzed. From the drop test results, the following conclusions can be drawn:
- Compared with the pillar landing gear, the vertical and longitudinal overload coefficient of the wheels–trolley landing gear is lower and the efficiency of the buffer system is higher during the landing process, which shows its good ability to absorb the impact power of landing.
- The overload coefficient decreases and the buffer system efficiency of the wheels–trolley landing gear increases during 8° tail-down landing, which shows its good anti-tail-down landing ability.
- The work absorbed by the pitch damper accounts for a small proportion of the total energy of the trolley pitching rotation during the landing process, and the pitch damper is not the chief consumer of the kinetic energy of the trolley during the landing process.
- In the condition of tail-down landing, the initial filling pressure of the pitch damper will not significantly affect the pitching oscillation law of the trolley, nor will it significantly affect the peak axial load. However, it will affect the attenuation rate of the pitching oscillation of the trolley. The appropriate initial inflation pressure can accelerate the attenuation of the oscillation. The increase of the main throttle of the pitch damper or even the absence of damping will not significantly affect the peak axial load; however, the too-small main throttle will lead to a significant increase in the peak pressure of the internal oil chamber and affect the structural safety.
Author Contributions
Conceptualization, W.F.; methodology, W.F.; software, W.F.; validation, W.F.; formal analysis, W.F.; investigation, W.F.; resources, L.Z. and Y.W.; data curation, W.F.; writing—original draft preparation, W.F.; writing—review and editing, W.F.; visualization, W.F.; supervision, L.Z. and Y.W.; project administration, L.Z. and Y.W.; funding acquisition, L.Z. and Y.W. All authors have read and agreed to the published version of the manuscript.
Funding
The APC was funded by Shanghai Aircraft Design & Research Institute, China Commercial Aircraft Corporation, Shanghai 201210, China.
Institutional Review Board Statement
Not applicable.
Informed Consent Statement
Not applicable.
Data Availability Statement
Not applicable.
Conflicts of Interest
The authors declare no conflict of interest. The funders had no role in the design of the study; in the collection, analyses, or interpretation of data; in the writing of the manuscript, or in the decision to publish the results.
References
- Pan, W.; Kuang, A.; Feng, Y. Study on the Wheel Load Distribution of a Four-wheel Aircraft Landing-Gear when Landing at Large Attack Angle. Mech. Sci. Technol. Aerosp. Eng. 2008, 27, 649–651. [Google Scholar]
- Herman, S.; Yang, D. C-5A main landing gear bogie pitching control. J. Aircr. 1971, 8, 912–917. [Google Scholar]
- Nie, H.; Wei, X. Key Technologies for Landing Gear of Large Civil Aircrafts. J. Nanjing Univ. Aeronaut. Astronaut. 2008, 40, 427–432. [Google Scholar]
- Pritchard, J. An Overview of Landing Gear Dynamics; NASA/TM-1999-209143; Langley Research Center: Hampton, VA, USA, 1999. [Google Scholar]
- Hanke, C.R. The Simulation of a Large Jet Transport Aircraft-Vol.1 Mathematical Model; NASA-CR-1756; NASA Center for Aerospace Information: Wichita, KS, USA, 1971. [Google Scholar]
- Hanke, C.R. The Simulation of a Large Jet Transport Aircraft-Vol.2 Modeling Data; US National Technical Information Service N73-10027; NASA Center for Aerospace Information: Wichita, KS, USA, 1970. [Google Scholar]
- Wahi, M.K. Oleopneumatic shock strut dynamic analysis and its real-time simulation. J. Aircr. 1976, 13, 303–308. [Google Scholar] [CrossRef]
- Berg, C.D.; Wellstead, P.E. The application of a smart landing gear oleo incorporating electrothelogical fluid. J. Intell. Mater. Syst. Struct. 1998, 9, 592–600. [Google Scholar] [CrossRef]
- Han, C.; Kim, B.; Choi, S. Design of a New Magnetorheological Damper Based on Passive Oleo-Pneumatic Landing Gear. J. Aircr. 2018, 55, 2510–2520. [Google Scholar] [CrossRef]
- Zhen, L. Conceptual Design of Landing Gear for Heavy Load Aircraft. Master’s Thesis, Nanjing University of Aeronautics and Astronautics, Nanjing, China, 2009. [Google Scholar]
- Zhang, M. Research on Some Key Technologies of Aircraft Ground Dynamics. Ph.D. Thesis, Nanjing University of Aeronautics and Astronautics, Nanjing, China, 2009. [Google Scholar]
- Xia, M. Design and Performance Analysis on Bogie Stabilization System of the Four-Wheel Landing Gear. Master’s Thesis, Nanjing University of Aeronautics and Astronautics, Nanjing, China, 2020. [Google Scholar]
- Daughetee, C.C. Drop testing naval aircraft and the VSD landing gear dynamic test facility [A]. J. Aircr. 1974, 11, 758–764. [Google Scholar] [CrossRef]
- Shi, H.; Zhang, D. Influence of imitation condition of spin-up and spring back drag loads on drop test result. Acta Aeronaut. Et Astronaut. Sin. 2001, 22, 39–41. [Google Scholar]
- De Martin, A.; Jacazio, G.; Sorli, M. Simulation of Runway Irregularities in a Novel Test Rig for Fully Electrical Landing Gear Systems. Aerospace 2022, 9, 114. [Google Scholar] [CrossRef]
- Giannella, V.; Baglivo, G.; Giordano, R.; Sepe, R.; Citarella, R. Structural FEM Analyses of a Landing Gear Testing Machine. Metals 2022, 12, 937. [Google Scholar] [CrossRef]
- Wong, J.; Ryan, L.; Kim, I. Design optimization of aircraft landing gear assembly under dynamic loading. Struct. Multidisc. Optim. 2018, 57, 1357–1375. [Google Scholar] [CrossRef] [Green Version]
- Ding, Y.W.; Wei, X.H.; Nie, H.; Li, Y.P. Discharge coefficient calculation method of landing gear shock absorber and its influence on drop dynamics. J. Vibroeng. 2018, 20, 2550–2562. [Google Scholar]
- Han, C.; Kim, B.H.; Choi, S.B. Effects of magnetic core parameters on landing stability and efficiency of magnet or heological damper-based landing gear system. J. Intell. Mater. Syst. Struct. 2020, 31, 198–208. [Google Scholar] [CrossRef]
- Ahmad, M.A.; Shah, S.I.A.; Shams, T.A.; Javed, A.; Rizvi, S.T.U.I. Comprehensive design of an oleo-pneumatic nose landing gear strut. Proc. IMechE Part G J. Aerosp. Eng. 2021, 235, 1605–1622. [Google Scholar] [CrossRef]
- Cui, Y.; Cen, G.; Liang, L. Study on the characteristics dynamic load of new aircraft landing. Comput. Simul. 2020, 37, 15–21. [Google Scholar]
- Nie, W.; Lu, J.; Ma, Y.; Chen, X. Analysis on the characteristics of the damping hole of landing gear buffer. Mach. Tool Hydraul. 2021, 49, 151–155. [Google Scholar]
- Hou Ci Wan, X.; Zhao, M.; Zhang, D. Simulation Analysis Technique of Truck-like Landing Gear Based on ADAMS. J. Syst. Simul. 2007, 19, 909–913. [Google Scholar]
- Xu, W. Design and Analysis on Bogie Stabilization System of Multi-Wheel Landing Gear. Master’s Thesis, Nanjing University of Aeronautics and Astronautics, Nanjing, China, 2018. [Google Scholar]
- Xue, C.; Han, Y.; Qi, W.; Dai, J. Landing-gear drop-test rig development and application for light airplane. J. Aircr. 2012, 49, 2064–2076. [Google Scholar] [CrossRef]
- Shi, H.W.; Yang, S.X.; Zhang, D.Q.; Fu, Y.H. Parameters Study at Touchdown Instant of the Nose Undercarriage of Fighter Airplane. Acta Aeronaut. Astronaut. Sin. 2003, 24, 517–520. [Google Scholar]
- Jia, Y.; Xia, T.; Song, R. Drop test and analysis of the landing gear of the tube spring. J. Vib. Shock 2017, 36, 218–223. [Google Scholar]
- Schmidt, R.K. Design of Aircraft Landing Gear; SAE International: Warrendale, PA, USA, 2021. [Google Scholar]
- Currey, N.S. Aircraft Landing Gear Design Principles and Practices; American Institute of Aeronautics and Astronautics: Washington, DC, USA, 1988. [Google Scholar]
- Tang, A. Analysis of usage landing gears loads spectrum for an aircraft’s landing gears. Struct. Environ. Eng. 2007, 34, 43–48. [Google Scholar]
Figure 1.
Landing gear and drop test rig. (a) Four wheels twin tandem landing gear; (b) Drop-test rig.
Figure 1.
Landing gear and drop test rig. (a) Four wheels twin tandem landing gear; (b) Drop-test rig.

Figure 2.
Buffer systems. (a) Main buffer, (b) Pitch damper.

Figure 3.
80 t·m drop test rig.

Figure 4.
Experimental setup.

Figure 5.
Time history of loads on level landing.

Figure 6.
Time history of loads on tail-down landing.

Figure 7.
Time history of strokes on landing weight.

Figure 8.
Amount of work on landing weight.

Figure 9.
Amount of work on take-off weight.

Figure 10.
Time history of pitch damper stroke. (a) PD1 4 MPa pressure 4.5 mm diameter; (b) PD2 6 MPa pressure 4.5 mm diameter; (c) PD3 8 MPa pressure 4.5 mm diameter; (d) PD4 6 MPa pressure 3.5 mm diameter; (e) PD5 6 MPa pressure 2.5 mm diameter; (f) PD6 6 MPa pressure. No damping.
Figure 10.
Time history of pitch damper stroke. (a) PD1 4 MPa pressure 4.5 mm diameter; (b) PD2 6 MPa pressure 4.5 mm diameter; (c) PD3 8 MPa pressure 4.5 mm diameter; (d) PD4 6 MPa pressure 3.5 mm diameter; (e) PD5 6 MPa pressure 2.5 mm diameter; (f) PD6 6 MPa pressure. No damping.


Figure 11.
Time history of pitch damper pressure. (a) 6 MPa pressure No damping; (b) 6 MPa pressure 4.5 mm diameter; (c) 6 MPa pressure 3.5 mm diameter; (d) 6 MPa pressure 2.5 mm diameter.
Figure 11.
Time history of pitch damper pressure. (a) 6 MPa pressure No damping; (b) 6 MPa pressure 4.5 mm diameter; (c) 6 MPa pressure 3.5 mm diameter; (d) 6 MPa pressure 2.5 mm diameter.


Table 1.
Parameters of pitch damper.
| Case No. | Air Chamber Pressure under Unloaded Condition/MPa | Recoil Channel Diameter/mm |
|---|---|---|
| PD1 | 4 | 4.5 |
| PD2 | 6 | 4.5 |
| PD3 | 8 | 4.5 |
| PD4 | 6 | 3.5 |
| PD5 | 6 | 2.5 |
| PD6 | 6 | No damping |
Table 2.
Drop test cases.
| Case No. | Landing Attitude | Reduced Mass (kg) | Sinking Velocity (m/s) | Parameters of Pitch Damper |
|---|---|---|---|---|
| 1 | Level | 95,000 | 3.05 | PD4 |
| 2 | Tail-down | 95,000 | 3.05 | PD4 |
| 3 | Level | 120,000 | 1.83 | PD4 |
| 4 | Tail-down | 120,000 | 1.83 | PD4 |
| 5 | Tail-down | 95,000 | 3.05 | PD5 |
| 6 | Tail-down | 95,000 | 3.05 | PD2 |
| 7 | Tail-down | 95,000 | 3.05 | PD1 |
| 8 | Tail-down | 95,000 | 3.05 | PD3 |
| 9 | Tail-down | 95,000 | 3.05 | PD6 |
Table 3.
Test results at landing weight.
| Parameters | Case 1 | Case 2 |
|---|---|---|
| Release height/mm | 475 | 475 |
| Release mass/kg | 45,673 | 45,673 |
| Tire speed (km/h) | 185.4 | 185.4 |
| Theoretical work/kJ | 441.9 | 441.9 |
| Measured work/kJ | 446.3 | 443.8 |
| Work error/% | 0.996 | 0.430 |
| The maximum vertical moving distance of the gondola/mm | 519 | 536 |
| The efficiency of the buffer system/% | 80.9 | 83.3 |
| The maximum sum of the vertical reaction force of all tires/kN | 1063 | 994 |
| The maximum sum of the longitudinal reaction force of all tires/kN | 504 | 438 |
| The minimum sum of the longitudinal reaction force of all tires/kN | −200 | −183 |
| Vertical overload coefficient | 1.14 | 1.07 |
| Maximum longitudinal overload coefficient | 0.54 | 0.47 |
| Minimum longitudinal overload coefficient | −0.21 | −0.20 |
Table 4.
Test results at take-off weight.
| Parameters | Case 1 | Case 2 |
|---|---|---|
| Release height/mm | 171 | 171 |
| Release mass/kg | 45,673 | 45,673 |
| Tire speed (km/h) | 185.4 | 185.4 |
| Theoretical work/kJ | 267.9 | 267.9 |
| Measured work/kJ | 274.1 | 275.0 |
| Work error/% | 2.3 | 2.7 |
| The maximum vertical moving distance of the gondola/mm | 483 | 491 |
| The efficiency of the buffer system/% | 67.5 | 69.7 |
| The maximum sum of the vertical reaction force of all tires/kN | 841 | 803 |
| The maximum sum of the longitudinal reaction force of all tires/kN | 388 | 282 |
| The minimum sum of the longitudinal reaction force of all tires/kN | −335 | −242 |
| Vertical overload coefficient | 0.71 | 0.68 |
| Maximum longitudinal overload coefficient | 0.42 | 0.24 |
| Minimum longitudinal overload coefficient | −0.28 | −0.21 |
Publisher’s Note: MDPI stays neutral with regard to jurisdictional claims in published maps and institutional affiliations. |
© 2022 by the authors. Licensee MDPI, Basel, Switzerland. This article is an open access article distributed under the terms and conditions of the Creative Commons Attribution (CC BY) license (https://creativecommons.org/licenses/by/4.0/).
Share and Cite
MDPI and ACS Style
Fang, W.; Zhu, L.; Wang, Y. Landing Performance Study for Four Wheels Twin Tandem Landing Gear Based on Drop Test. Aerospace 2022, 9, 334. https://0-doi-org.brum.beds.ac.uk/10.3390/aerospace9070334
AMA Style
Fang W, Zhu L, Wang Y. Landing Performance Study for Four Wheels Twin Tandem Landing Gear Based on Drop Test. Aerospace. 2022; 9(7):334. https://0-doi-org.brum.beds.ac.uk/10.3390/aerospace9070334
Chicago/Turabian StyleFang, Wei, Lingang Zhu, and Youshan Wang. 2022. "Landing Performance Study for Four Wheels Twin Tandem Landing Gear Based on Drop Test" Aerospace 9, no. 7: 334. https://0-doi-org.brum.beds.ac.uk/10.3390/aerospace9070334
Note that from the first issue of 2016, this journal uses article numbers instead of page numbers. See further details here.