Article

An Interactive Task Conditioning System Featuring Personal Comfort Models and Non-Intrusive Sensing Techniques: A Field Study in Shanghai

School of Architecture, Carnegie Mellon University, Pittsburgh, PA 15213, USA
*
Author to whom correspondence should be addressed.
Submission received: 14 September 2021 / Revised: 15 November 2021 / Accepted: 17 November 2021 / Published: 21 November 2021
(This article belongs to the Section Information and Communication Technologies)

Abstract

:
Heating, ventilation and air-conditioning (HVAC) systems play a key role in shaping office environments. However, open-plan office buildings nowadays are also faced with problems like unnecessary energy waste and an unsatisfactory shared indoor thermal environment. Therefore, it is significant to develop a new paradigm of an HVAC system framework so that everyone could work under their preferred thermal environment and the system can achieve higher energy efficiency such as task ambient conditioning system (TAC). However, current task conditioning systems are not responsive to personal thermal comfort dynamically. Hence, this research aims to develop a dynamic task conditioning system featuring personal thermal comfort models with machine learning and the wireless non-intrusive sensing system. In order to evaluate the proposed task conditioning system performance, a field study was conducted in a shared office space in Shanghai from July to August. As a result, personal thermal comfort models with indoor air temperature, relative humidity and cheek (side face) skin temperature have better performances than baseline models with indoor air temperature only. Moreover, compared to personal thermal satisfaction predictions, 90% of subjects have better performances in thermal sensation predictions. Therefore, personal thermal comfort models could be further implemented into the task conditioning control of TAC systems.

1. Introduction

Heating, ventilation and air conditioning (HVAC) is a technology to create a suitable indoor environment, particularly thermal environment and indoor air quality, for various types of buildings. Since the HVAC system plays a key role in shaping office environments and building energy performances, it is of great importance to develop a new paradigm of HVAC system framework considering both comfort and energy efficiency.
Among various types conditioning systems in office buildings, the task ambient conditioning (TAC) system is one of the most energy efficient and comfortable space conditioning systems. The TAC system is defined as any space conditioning system that allows thermal conditions in small, localized zones to be individually controlled by building occupants, while still automatically maintaining acceptable environmental conditions in the ambient space of the building [1]. Since the TAC system not only takes individual thermal preferences into account but also maintains the overall acceptable thermal environment, it has become one of the most promising air-conditioning systems in open-plan office buildings. Moreover, due to rapid development of building automation system (BAS), many researchers have investigated advanced control strategies so as to operate an advanced HVAC system more effectively and energy efficient in the open-plan office buildings recently [2,3,4].
However, for most existing TAC systems, the control of the task component is partially or entirely decentralized and completely under the control of the occupants. As a result, the TAC system cannot be fully optimized since the task conditioning system is not responsive to dynamic thermal environment and personal thermal comfort until the occupant takes action on his/her own. In order to tackle the issue, automatic task conditioning system control with a personal thermal comfort model shall be developed.
This paper consists of mainly five different sections. Besides the introduction, including related work, motivation and contribution, Section 2 mainly describes the methodology and test setup of the field study. Moreover, Section 3 analyzes the result of personal thermal comfort model performances and energy savings of the proposed task-ambient conditioning system in the field study. Last but not least, Section 4 discusses about the limitations and future work, followed by Section 5, the conclusion.

1.1. Related Work

Since the development of task conditioning systems aims to satisfy individual thermal preferences in the local environment, control strategies based on thermal comfort models could realize the automation of the task conditioning system. Thermal comfort is the condition of mind that expresses satisfaction with the thermal environment and is assessed by subjective evaluation. In the course of thermal comfort theory, static thermal comfort and adaptive thermal comfort have become two main categories. In terms of static thermal comfort, predicted mean vote (PMV) developed by Fanger [5] is the most widely accepted thermal comfort model. Moreover, in the study of static thermal comfort, the psychrometric chart can be used to analyze the comfort zone under certain conditions, as shown in Figure 1. On the contrary, adaptive thermal comfort models emphasize how people interact with and change the real environment [6]. However, since both static and adaptive comfort models are aggregate models, which are designed to predict the average comfort of large populations, the accuracy decreases when predicting individual thermal comfort [7]. Therefore, researchers have proposed a new category of thermal comfort model, named the personal comfort model, which predicts an individual’s thermal comfort response [7]. Such personal comfort models have been developed with various algorithms, including Bayesian network, hidden markov model (HMM), support vector machine (SVM), random forest (RF), and multi-variate regression models [8,9,10,11,12,13,14,15,16,17,18,19,20].
In addition, motivated by thermoregulation theory, skin temperature is one of the key factors to thermal comfort. Therefore, many researchers have proposed to use mean skin temperature or the most representative local skin temperature [19,20,21,22,23,24,25,26] for thermal comfort inference. Moreover, the development of advanced sensing techniques has also promoted the development of the personal thermal comfort model. The current sensing technique used for thermal comfort inference can be mainly divided into two categories. One is wearable sensing devices and the other is contactless sensing devices.
Currently, there have been various types of wearable devices, such as wrist bands [12,13,14,16,17,18,19] and eyeglass frames [15]. Even if wearable devices can directly measure skin temperature to indicate thermal comfort, the major disadvantage is intrusiveness [20,21]. Therefore, contactless measurement methods have drawn much more attention nowadays, especially infrared (IR) thermography. An empirical study utilized an infrared (IR) sensor called Lepton to estimate occupant thermal comfort level by measuring skin temperature measured from different face regions. The results have shown that the ears, nose and cheeks are most indicative to thermal comfort [21,22]. In addition, Ranjan and Scott [23] have used an IR camera to dynamically detect and predict thermal comfort. They classified thermal preferences based on skin temperature of eight different body parts, and found that face has outperformed other body regions. Moreover, the results have shown that the cheek performs much better than other face regions. Moreover, Han et al. [24] utilized infrared imaging to measure face skin temperature and control the indoor environment with self-learning algorithms. As a result, 98% of the occupants’ feedback demonstrated the control system was able to achieve satisfactory thermal environments. Moreover, Lu et al. [25] have developed steady-state data-driven personal thermal comfort models with Random forest and support vector machines using infrared camera. The results of the best model have shown a recall score of 100% on female subjects and 95% on male subjects. In addition, Ghahramani et al. [15] have developed an eyeglass frame for thermal comfort, which measures skin temperatures of different parts of human heads, including the cheekbone, front face, nose and ears. Besides the IR camera, other types of cameras can also be implemented to measure skin temperature-related variables like a red–green–blue (RGB) camera and depth camera. A recent study has proposed a red–green–blue-depth–temperature (RGB-DT) framework consisting of a thermographic camera, a depth-sensor and a color camera to measure body temperatures to indicate thermal comfort at different body parts, including the hand, elbow, shoulder, chest as well as the left and right of the head [26].
To summarize, personal thermal comfort models are more realistic to the actual indoor environment than static and adaptive thermal comfort models and the performance can be enhanced with machine learning algorithms. Moreover, infrared thermography can solve the intrusiveness issue while maintaining high performance of thermal comfort inference. However, since the current thermal camera is too expensive to be deployed in large-scale open plan office buildings, developing personal comfort models with more cost-effective contactless sensing techniques have become an interesting research area recently.

1.2. Motivation and Contribution

Based on a literature review regarding thermal comfort and task-ambient HVAC control, it can be concluded that the recent studies related to thermal comfort have drawn more attention to different sensing techniques to develop personal comfort models and apply such models into a dynamic HVAC system. Moreover, in terms of sensing technique, even if a wearable sensing technique is popular for thermal comfort inference nowadays, vision-based sensors such as IR thermography are less intrusive. However, it is expensive to use existing IR cameras in large-scale open-plan office buildings.
Therefore, motivated by improving personal thermal comfort with the cost-effectiveness task conditioning system, this study aims to develop a dynamic task conditioning system with personal comfort prediction models. The models were developed with machine learning algorithms by collecting data from the non-intrusive sensing system consisting of infrared temperature sensor called AMG8833 to measure cheek (side face) skin temperature, indoor air temperature and relative humidity called DHT22 in an empirical study in Shanghai.
The study contributes to the field of building automation that personal thermal comfort models were used for controlling the task conditioning system automatically. With a personal thermal comfort model with machine learning and the non-intrusive sensing system, the proposed task conditioning system could be further implemented to optimize ambient conditioning system (i.e., cooling set-point) so as to improve energy efficiency while still maintaining individual thermal comfort level. In particular, this study not only builds personal thermal comfort models with machine learning algorithms but also develops an online learning process to update the personal thermal comfort model through interactive behaviors between occupants and the task conditioning system such as desktop fan.

2. Methodology

As mentioned in the introduction, this study aims to develop a dynamic task conditioning system with a personal thermal comfort model and a non-intrusive sensing system. Therefore, the development of a non-intrusive sensing system and the development of personal thermal comfort models with two phases are described below. In addition, the methodology was applied in a case study in Shanghai during cooling season.

2.1. Development of Non-Intrusive Sensing System

In order to predict personal comfort in real-time, a personalized sensing system has been implemented for each individual. Table 1 shows the specification of each component in the sensing system. As shown in the table, inspired by advantages of a contactless sensing device, a contactless temperature array called AMG8833 (Grideye) was used to measure the cheek (side face) skin temperature in the study.
AMG8833 is a temperature array sensor for temperature detection. It has a two-dimensional area with 8 × 8 pixels. Unlike the infrared temperature sensor called MLX90614 [12], AMG8833 measures temperature distribution of an area at a time instead of a single temperature spot. The typical application of the sensor includes occupancy detection, energy savings, thermal comfort, digital signage and home appliances. Compared to an infrared camera like Lepton 2.5 [21], AMG8833 is more cost-effective, with a price of around $25. In addition, the accuracy of the sensor will be ±0.5 °C after calibration [27], which is higher than that of Lepton being, ±2.5 °C, while lower than that of special version of MLX90614 for human body temperature, being ±0.2 °C. However, since in this study the thermal comfort response rate from participants was 5 min/time and the task-conditioning system of desktop fans was controlled with two simple and discrete modes of on/off, the accuracy of the sensing system, including DHT22 and that of the calibrated AMG8833 are enough for the development of a personal thermal comfort model for task-conditioning system control. The calibration process of AMG8833 is shown below:
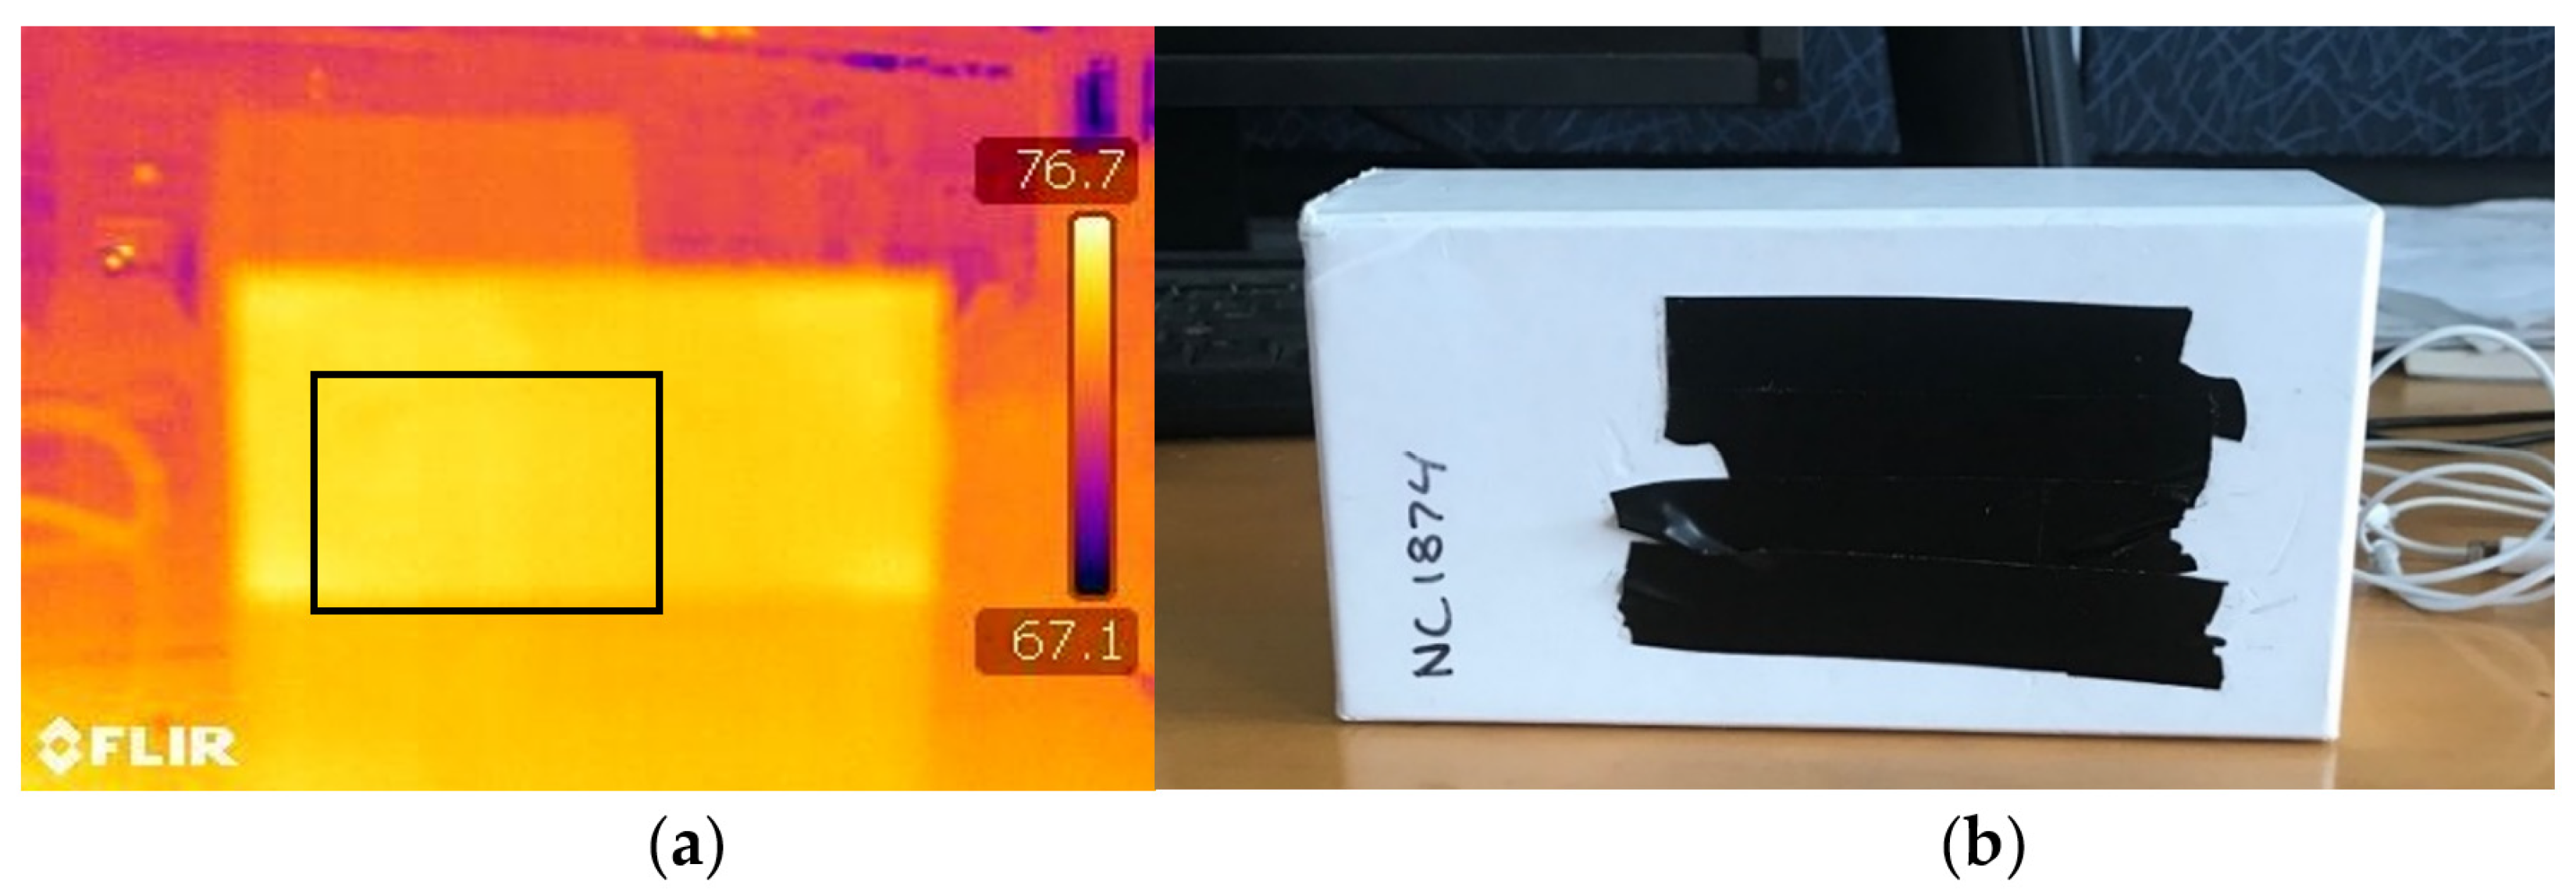
  • Cool or warm the object covered with electric tape whose emissivity is 0.95 [28] (the object used in the calibration needs to have high emissivity close to 1). As a result, the electric tape temperature can be distinguished from the environment temperature and the temperature distribution over the electric tape will be uniform;
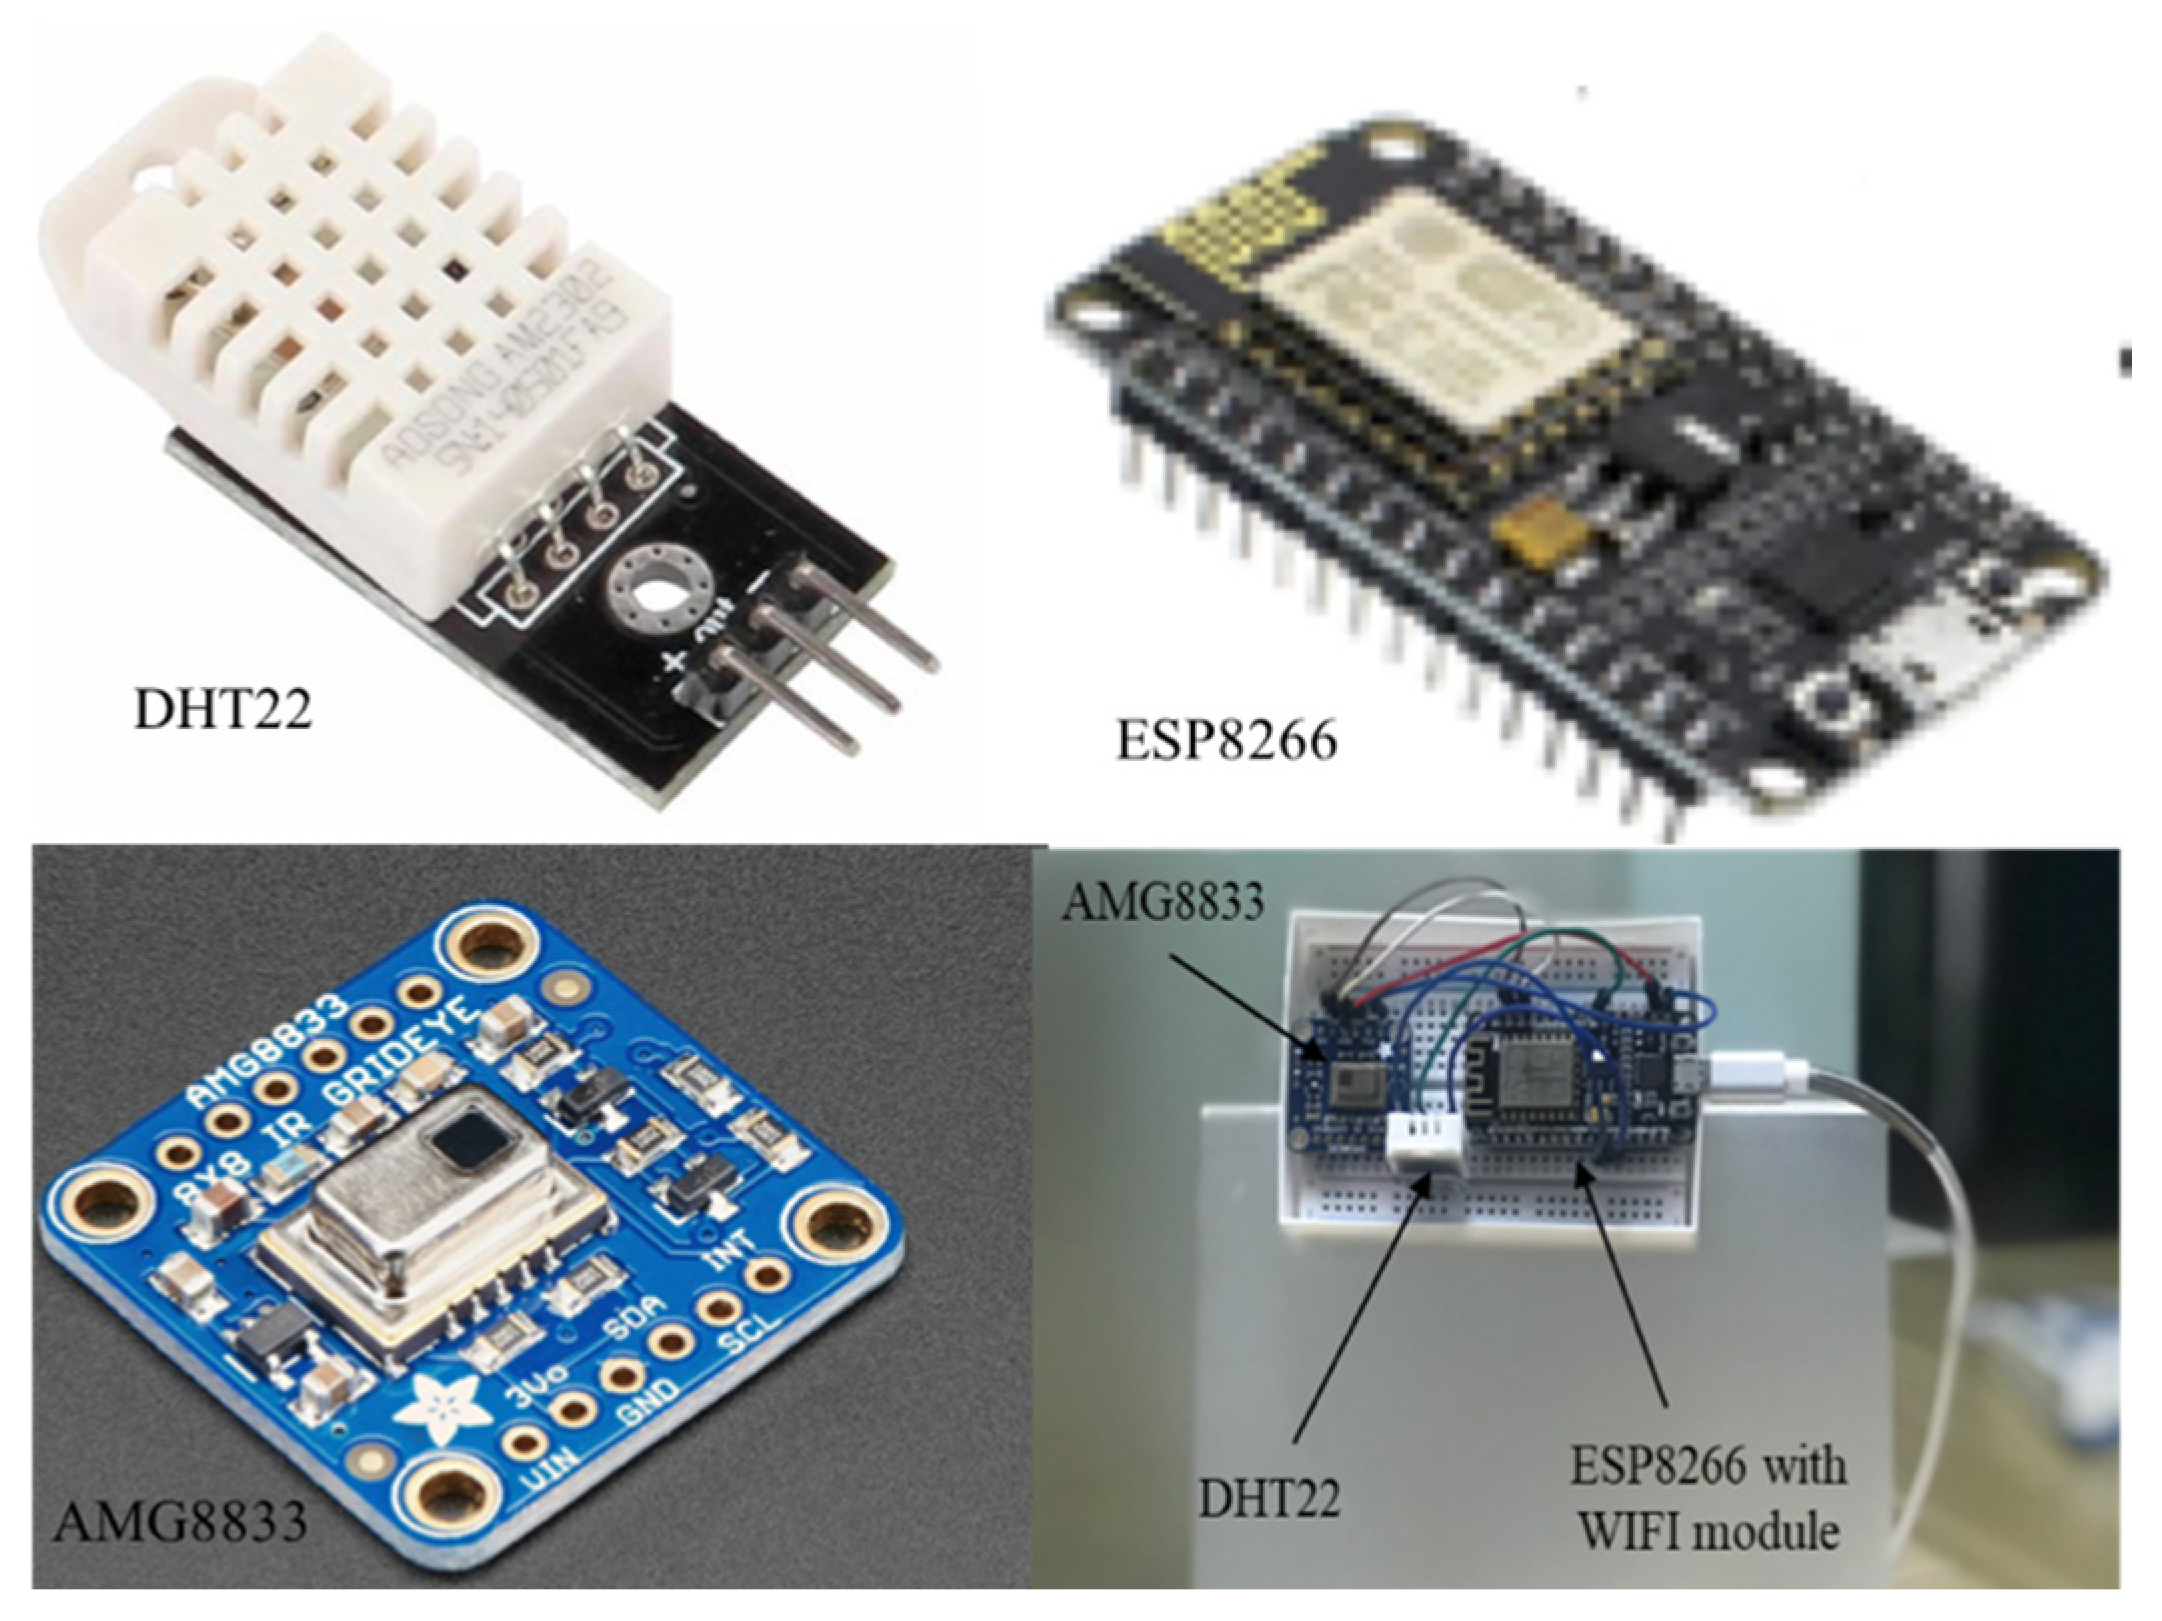
  • Use the Infrared camera to take the photo of the object (Figure 2) and measure the average temperature T rad of the tape surface with the camera at 0.5-m distance;
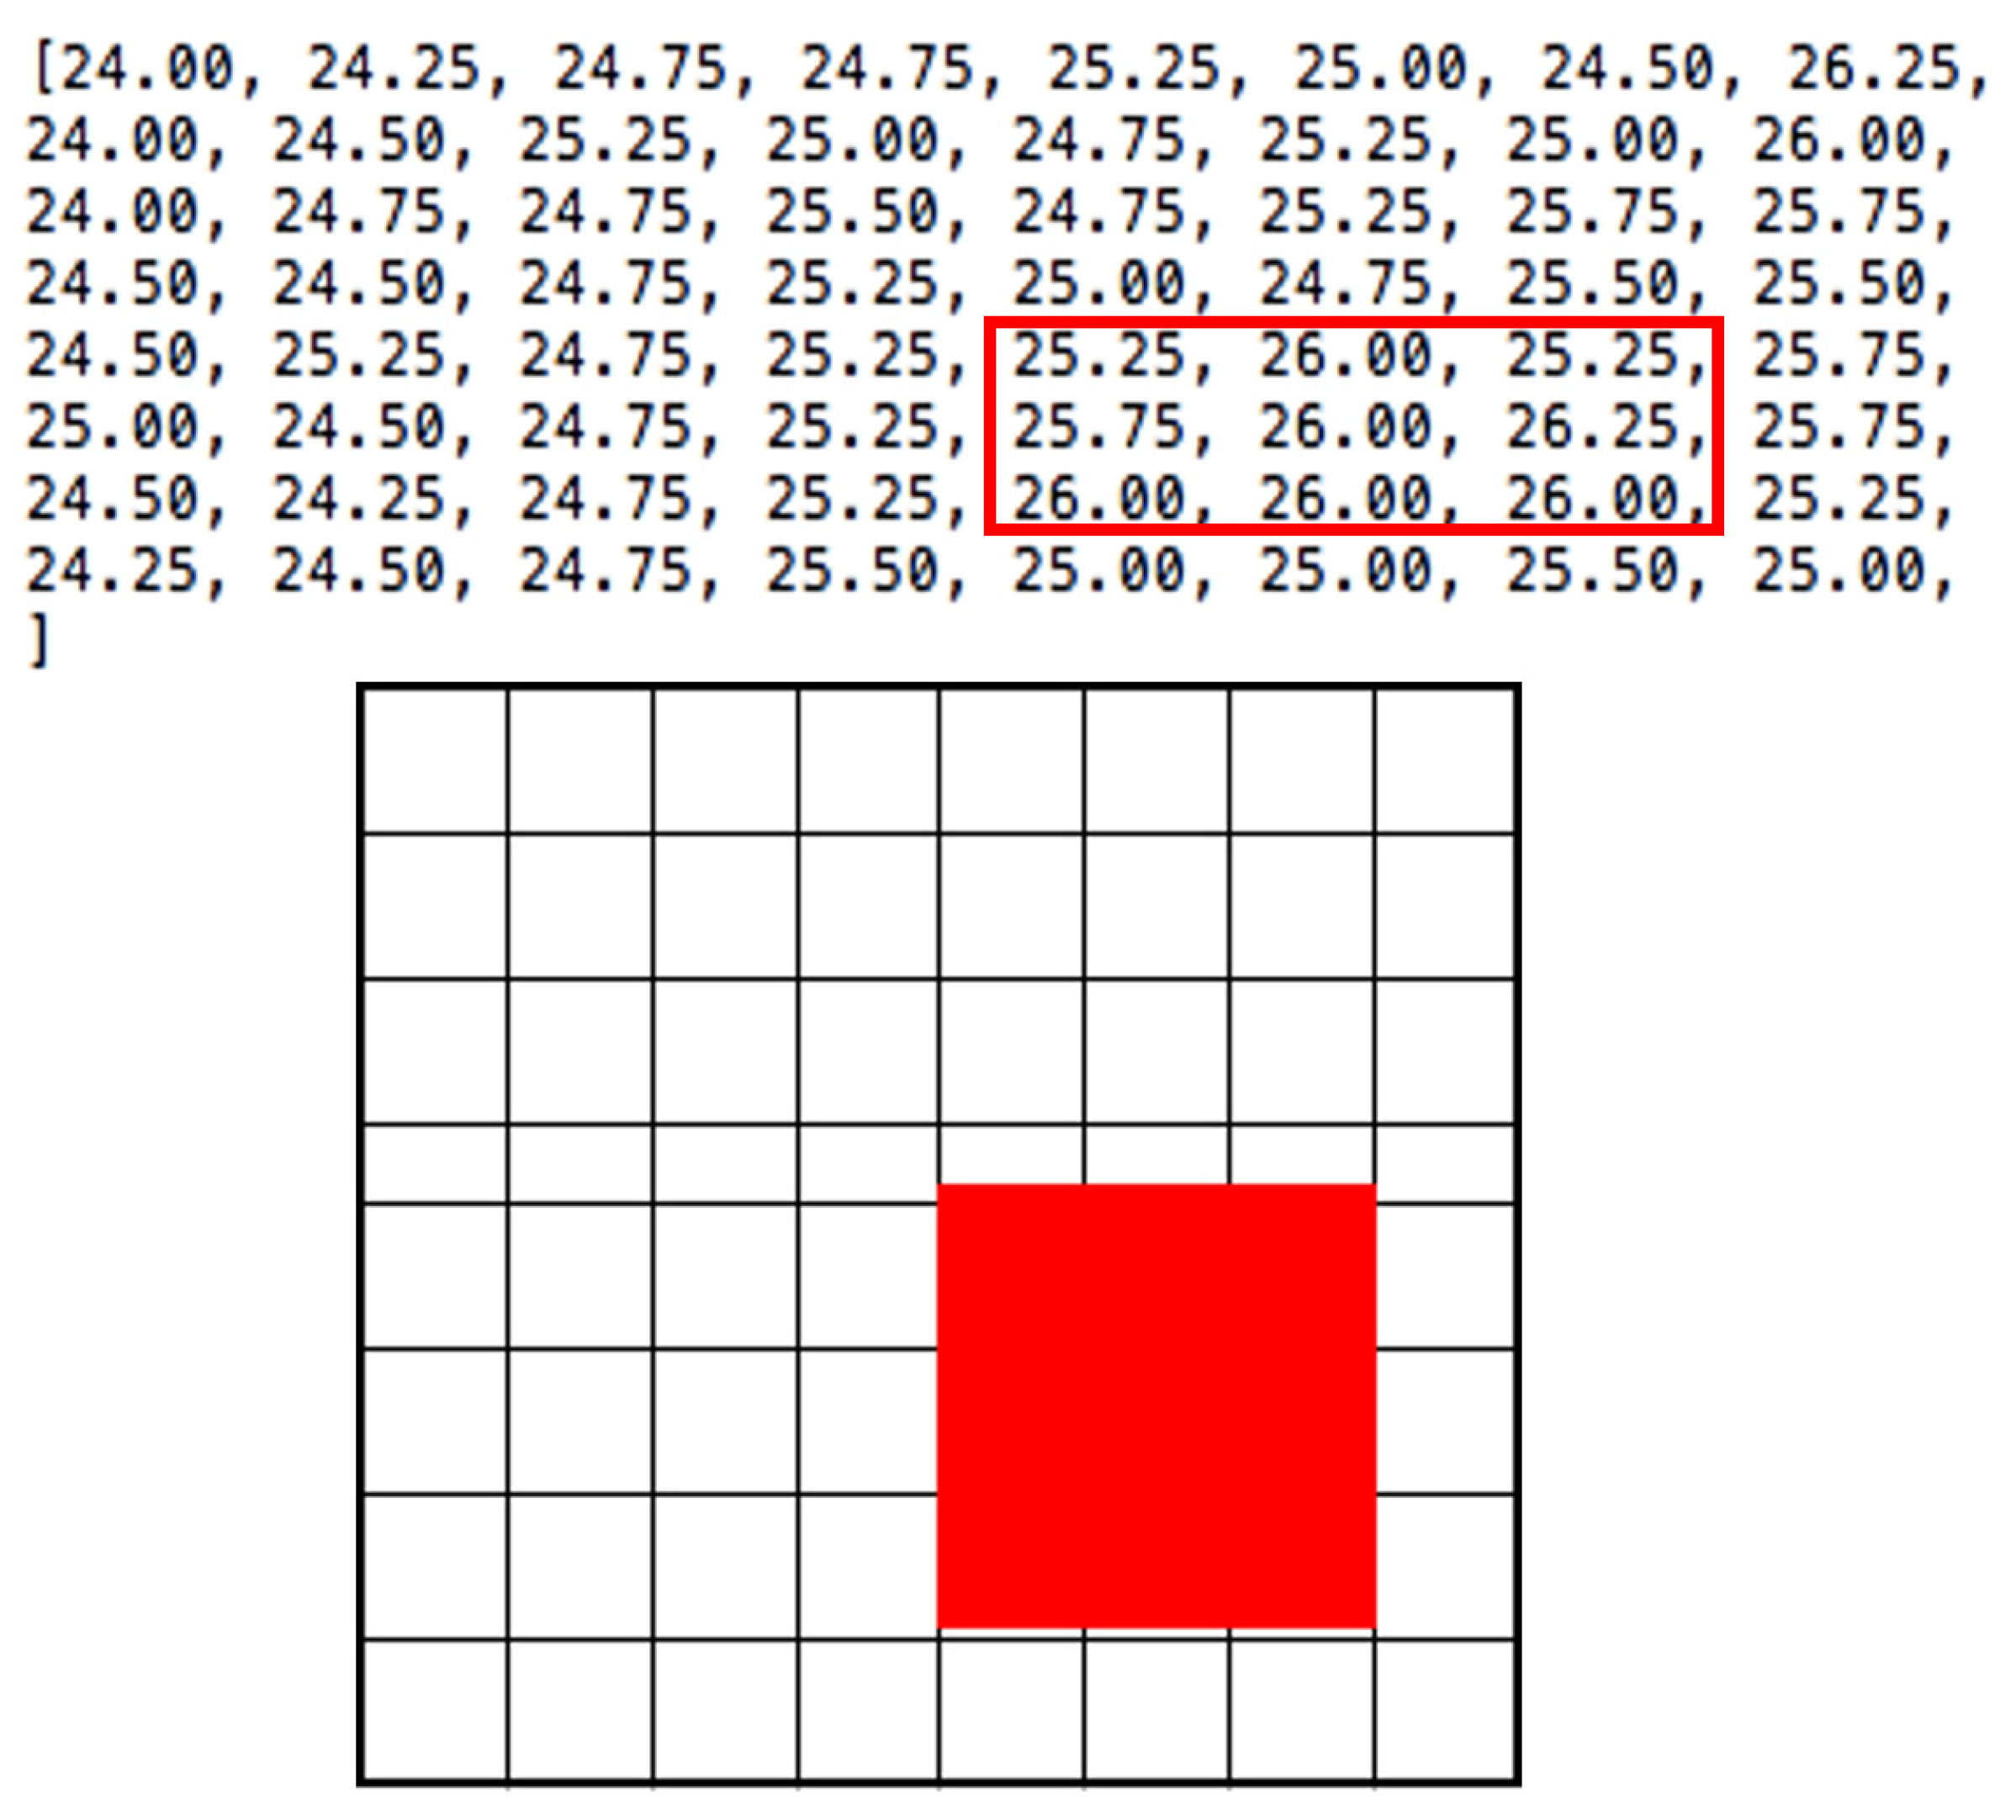
  • Measure the temperature of the tape surface with AMG8833 at the same distance and make sure that all pixels ( T 11 , T 21 T 88 )   only measure the surface temperature of the electric tape; and
  • Calibrate the temperature of all pixels with T rad . For instance, Δ t 11 = T 11 T rad .
Moreover, in order to measure cheek (side face) skin temperature correctly, the sensor is designed to be installed 0.5 m away from the user so as to avoid the error due to distance. Since the view angle of AMG8833 is around 60° and the distance between the sensor and the user is 0.5 m, part of the pixels may measure the background temperature (i.e., temperature of the object surface behind the user) instead of cheek (side face) skin temperature. Since the radiative surface temperature in the background is always lower than that of occupant skin temperature in regular office buildings, in order to ensure only the radiative temperature of the cheek (side face) area is captured, a simple yet effective skin temperature extraction is proposed such that the cheek (side face) skin temperature is estimated as the mean of 3 × 3 highest temperatures among these 64 pixels. Figure 3 shows an example of skin temperature detection.
In addition, a micro-controller called ESP8266 with a WIFI module was used for data collection with sample frequency of 1 sample every 5 min so as to correspond the survey feedback interval described below. The sensing system is shown in Figure 4.
Besides the sensing system, the personalized cooling system also includes an 8′ desktop mini-fan (since the air velocity > 0.2 m/s also has cooling effects [29], the supply direction is adjusted so that the air velocity towards each occupant is controlled within 0.1 m/s without draft risk). Compared to a conventional air-conditioning system, the TAC system with a fan has several advantages. Firstly, fans offer a straight-forward, economic, and independently operable technique to increase movement of air so as to ultimately improve thermal comfort in a room [29]. Moreover, when operated with an AC system, the downwash propelled by foil (rotating) drives the warm air downwards to blend with the cold air, countering the impacts of buoyancy [30].

2.2. Development of Personal Comfort Models

The development of personal comfort models consists of two phases. The first phase was to collect sensor data used as features and thermal comfort feedback used as labels from various participants in different sessions. The second phase was to update personal comfort models by observing the thermal environment when individuals overrode the actuations of the fan controlled with personal comfort models.
In the first phase, personal comfort models were trained by varying the temperature set-point from 22 °C to 30 °C slowly such that the air temperature increases no more than 0.2 °C/min on average. However, it was not guaranteed that the same people would attend all the sessions in both phases. During each session, they were asked to report their thermal sensation and thermal satisfaction with a 7-point thermal sensation [31] and modified 5-point thermal satisfaction scale every 5 min, as shown in Figure 5a,b.
Figure 6 describes the development of personal comfort models in the first phase. The classification follows the standard machine learning pipeline, including feature extraction, feature selection, classification and validation. In order to evaluate the effects of cheek (side face) skin temperature on the personal thermal comfort model, including both thermal sensation and thermal satisfaction, two different personal thermal comfort models were developed with the same machine learning pipeline. One is the personal thermal comfort model with only air temperature (baseline model) while the other is the personal thermal comfort with all features, including air temperature, relative humidity and cheek (side face) skin temperature (proposed model).
In this study, a support vector machine (SVM) was used for developing personal comfort models, including thermal sensation and thermal satisfaction prediction in the first phase. SVM can be used to develop supervised classification models with high-dimensional and non-linear data. Since the data is unlikely to be separated linearly, with SVM classification, soft margin usually performs better than hard margin [32]. The following equations show the optimization framework in SVM. Moreover, compared to quadratic programming to solve the optimization problem, kernelized SVM can be computed much more efficiently. The common kernel functions include linear kernel, polynomial kernel and Gaussian kernel. In this study, kernel type and penalty number were selected with cross-validation [33].
Inputs:
S = { ( x 1 , y 1 ) ,   ( x 2 , y 2 ) , ( x n , y n ) } ,
where x i X t r a i n and y i Y t r a i n
Objective:
argmin w , ξ 1 , ξ 2 ξ n | | w | | 2 + C i ξ i  
Subject to:
y i w x i 1 ξ i  
ξ i   0
where w is a weight vector, C is a penalty parameter controlling how much you want to avoid misclassifying each training example and ξ i   is a slack variable indicating if the sample is misclassified. With larger C, the optimization will select a smaller margin of the hyperplane while with smaller C, the optimization will select a larger margin of the hyperplane.
In addition, the confusion matrix [34] is a matrix M such that Mi,j is equal to the number of observations known to be in group i and predicted to be group j. With the confusion matrix, the recall score is calculated as ratio between TP and sum of FN and TP, which can be used to evaluate the performance of a classification model. The confusion matrix of binary classification is shown below:
In binary classification with the confusion matrix, each cell in the Table 2 is the number of the testing samples with the prediction and the correspondent actual results. The metric used for personal comfort model evaluation is the recall score. Based on the confusion matrix, recall is used for evaluating percentage of actual positive instances classified correctly among all actual positive instances, which is defined as the ratio between true positives and the sum of false negatives and true positives [35].
In the second phase, due to the fact that some participants in the first phase did not attend the second phase and some participants in the second phase had insufficient data from the first phase to get well-developed personal comfort models, the initialized personal comfort model for each female participating in the second phase was developed with all female data in the first phase, and so was the initialized personal comfort model for each male. Moreover, instead of interrupting occupants by asking them to respond to surveys in the second phase, personal comfort models were updated with dynamic rule-based logics by taking override actions into account after a certain period. The reason for rule-based logics instead of machine learning algorithms was that it took a long time to get enough data for retraining with machine learning algorithms since the override actions happened infrequently. Figure 7 shows an example of updating the personal comfort model with the rule-based control logics. The example assumes the indoor air temperature threshold t0 and skin temperature threshold tsk have been learnt from occupant override actions after a certain period. As shown in the diagram, if the current indoor air temperature t, relative humidity RH and skin temperature ts as well as the personal thermal comfort prediction satisfy the conditions, the new prediction will override the original prediction. Otherwise, the original prediction will be unchanged.
In addition, Wemo insight with an open source Wemo control package called Ouimeaux [36] was used to control the desktop fan with the personal thermal sensation prediction wirelessly. Since thermal satisfaction models outperformed thermal sensation models in the first phase, the mini-fan was controlled based on thermal sensation predictions in the second phase. In addition, the fan was designed to be turned off when the sensation prediction was negative (uncomfortably cool) or neutral, while being turned on when it was positive (uncomfortably warm). However, users still had the right to override the control manually, and the system recorded the overridden actuations. During both phases, the data from all participants, including sensor data and plug status were stored in a remote server using an open-source platform called ThingSpeak [37]. The proposed closed-loop task conditioning system diagram used in the second phase is shown in Figure 8.

2.3. Case Study

A case study with a total of 14 sessions was conducted in a 2.6 × 3.5 × 4.3 m3 office room in Shanghai from July to August during the cooling season in the first phase. In the office environment, an air-conditioner was operated when the space was occupied. Moreover, the radiation effect on thermal comfort was avoided by using curtains to prevent direct sunlight coming through windows. Meanwhile, a total of 9 healthy female and 11 healthy male participants aged from their twenties to forties attended the study. In the first phase, for each session, 5 participants attended the study for at least a continuous 3 h. In the second phase, the experiment was conducted with a group of five participants for a two-day comparative study at the end of August where the first day was to update personal comfort models and the second day was to evaluate performances of updated models. For each of the two days, the desktop fan was controlled every 10 min based on the personal thermal sensation prediction at that time.
Figure 9a,b shows the real field study in an open plan office and the 3D visualization, respectively. As shown in the figures, each participant is provided with a personalized device while an air-conditioner is used to control the overall thermal environment. In addition, the sensing system is facing towards the participant and the status of the desktop fan is controlled by personal thermal comfort model outputs, which can be manually overridden with the Wemo control interface. The proposed task conditioning system realizes the automatic adjustments of the local thermal environment around each occupant while still allowing the user to override the automatic actions from the controller.

3. Result Analysis

3.1. Analysis between Objective Thermal Environment Conditions and Subjective Thermal Comfort

Even if 20 participants attended the study in the first phase, some of them did not have enough amount of data for training. Therefore, only 12 personal comfort models were developed. Hence, throughout the field study, a total of 488 instances collected from female subjects and a total of 770 instances collected from male subjects were used for developing thermal models.
Figure 10a shows the distribution among neutral sensation and non-neutral sensation votes where the x-axis refers to participant ID and the y-axis refers to the ratio of occurrences of neutral and non-neutral sensation votes of each participant in the first phase. Moreover, Figure 10b shows the distribution among satisfaction and dissatisfaction votes where the x-axis refers to participant ID and the y-axis refers to the ratio of occurrences of satisfaction and dissatisfaction for each participant in the first phase. As shown in the figure, among all feedbacks from the first phase, the number of votes for non-neutral sensation is 28.7% of that for neutral sensation on average. Similarly, the number of votes for dissatisfaction is 67.9% of that for satisfaction on average. This indicates that in a regular office environment, it is more difficult to detect discomfort states than comfort states because of imbalanced data distribution. Therefore, in order to realize more fine-grained thermal comfort management, it is of great significance to operate localized and personalized control so as to further reduce individual discomfort as much as possible.
Moreover, Figure 11a–h shows the boxplots between thermal environment conditions and thermal sensation and thermal satisfaction. Figure 11a,b shows the box plots of indoor air temperature to thermal sensation of the female and male subjects. As shown in the figures, both female and male subjects perceive warmth as the indoor air temperature increases. Meanwhile, the air temperature is 29 °C when participants feel neutral, which indicates it has potential to save energy consumption by increasing standard indoor air temperature of 26 °C in such climate conditions [38].
Figure 11c,d shows the box plots of skin temperature to thermal sensation of the female and male subjects. Unlike the relation between air temperature and thermal sensation, the relation between skin temperature and thermal sensation of female subjects differs from that of male subjects. As for female subjects, the median skin temperatures are 31.31, 31.11, 31.52 and 31 °C, respectively, which vary little among different thermal sensations while for male subjects, the median skin temperatures are 31.47, 31.53, 32.22 and 32.88 °C, which vary over 1 °C when thermal sensation is above 0. This indicates that female subjects are more sensitive than male subjects. Moreover, since relative humidity was not strictly controlled, the thermal sensation of participants is likely to be affected by skin moisture.
Figure 11e,f shows the box plots of indoor air temperature to thermal satisfaction of the female and male subjects. As shown in the figures, the air temperature differences among different thermal sensations of female subjects are much smaller than those of male subjects. Moreover, compared to male subjects, the female subjects are more satisfied under the thermal environment with higher air temperature than the male subjects. In addition, considering thermal sensation distribution, the female subjects prefer a warm environment while the male subjects prefer a cold environment, which indicates even if thermal sensation is the precondition of thermal satisfaction [39], it may not be the same as thermal satisfaction all the time.
Lastly, Figure 11g,h shows the box plots of skin temperature to thermal comfort of the female and male subjects. The results also illustrate the female subjects are very satisfied thermally with higher skin temperature while male subjects are very satisfied thermally with lower skin temperature. Moreover, similarly to thermal sensation, thermal satisfaction is also likely to be affected by skin moisture.

3.2. Performances of Personal Comfort Models

Table 3 shows the performance benchmark of the personal thermal sensation and satisfaction models with the recall score. As shown in the table, compared to baseline models, the personal thermal sensation models and the thermal satisfaction models developed with data of all female subjects outperform them by 2 and 3%, respectively. In addition, thermal sensation models and thermal satisfaction models developed with data of all male subjects have similar performances to the baseline models. However, performances vary from 61.5 to 100% among different individuals and the highest recall score improvement was 25% for both sensation and satisfaction predictions.
Moreover, among all personal comfort models for female subjects, 80% of thermal sensation models and 100% of thermal satisfaction models with the proposed features have no worse performances than those with baseline features, respectively. Meanwhile, for male subjects, all thermal sensation and thermal satisfaction models with proposed features have no worse performances than those with baseline features. Therefore, personal comfort models with air temperature, skin temperature and relative humidity outperform those with air temperature only. Moreover, compared to thermal satisfaction predictions, 11 out of 12 subjects have better performances in thermal sensation predictions. Therefore, personal thermal sensation models were applied into task conditioning system control for each participant.
Moreover, Figure 12 shows the comparison regarding the proportion of the override actions among all actuations between the two days in the second phase. Since both experiments were conducted under the same outdoor climates with same type of air-conditioner, the override actions can be used to indicate if fans make occupants thermally comfortable. As shown in the figure, 60% of the subjects have fewer override actions with the updated thermal sensation models than the initialized personal comfort models. Moreover, those participants providing override actions on the first day achieved a reduction of 11–27% based on override actions. This indicates that the rule-based updating mechanism does help improve the performances of personal comfort models.

4. Discussion

In order to improve personal thermal comfort level, this study has developed a task conditioning system featuring personal comfort models with machine learning and a non-intrusive sensing system in a shared office room. In addition, compared to expensive IR cameras, this study has proposed a cost-effective sensing system consisting of an infrared temperature array called AMG8833 as well as an air temperature and relative humidity sensor called DHT22 to develop personal comfort models, including personal thermal sensation and personal thermal satisfaction predictions with machine learning algorithms. Moreover, personal comfort models were further updated with the feedback mechanism by collecting the override actions of the desktop fans by users.
One of the advantages of the proposed approach is the wireless sensing system. The current sensing system for personal comfort prediction consists of a temperature and humidity sensor called DHT22 and infrared temperature sensor called AMG8833. With such non-intrusive sensing systems, occupants no longer need to wear any devices to measure skin temperature. Moreover, compared to wearable devices, the proposed sensing system consists of indoor air temperature, indoor relative humidity and an IR sensor. Hence, only temperature, relative humidity and the mean of highest nine radiative temperatures from an IR sensor are collected. Therefore, there is no privacy issue since the system will not conduct applications such as face recognition with RGB cameras or wearable devices such as smart watches. Besides, compared to existing non-intrusive skin temperature measurement methods such as Lepton 2.5 [18] or MLX90614 [12], the proposed AMG883 is more cost-effective with acceptable resolutions.
In addition, as one of the key components in the system, the personal comfort model is proposed and evaluated for real-time task conditioning control. Hence, the second advantage of the proposed system is that of an automatic task conditioning system, and the task-ambient system could be optimized by maximizing energy savings while maintaining individual thermal comfort. As shown in the results, even if the recall scores of the initialized comfort models developed with data from all female subjects or all male subjects are above 80%, the performances of personal comfort models developed with individual data vary a lot among different individuals. This is not only because of individual differences but also because the amount of data from some individuals is not sufficient enough to train personal comfort models. Therefore, an initialized personal comfort model with a large amount of data from various occupants is a good start point and the individual thermal models can be updated continuously via the interactions with the personalized cooling system in real-time. In addition, with the rule-based updating mechanism to improve performances of personal thermal comfort models, the results have shown that with more override actions from occupants, the personal comfort predictions indeed improve.
However, there still exists some limitations to be improved. For instance, the current experimental testbed consists of only a split air-conditioner in a thermal zone and occupants can interact with personal fans with only on/off operations. Moreover, since the current task conditioning system is only for temperature set-point control, the benefits of thermal comfort are limited. Therefore, with more options for personal comfort control of the task conditioning system, the proposed framework can also be able to be implemented in more complex HVAC systems such as variable refrigerant volume (VRV) or variable air volume (VAV) systems.

5. Conclusions

This study aims to develop a dynamic task conditioning system controlled with personal comfort models with SVM featuring a non-intrusive sensing technique in a shared office room. The sensing system consists of the infrared temperature sensor, indoor air temperature sensor and indoor relative humidity sensor. In addition, this study also evaluates the feedback collection mechanism to calibrate personal comfort models by observing interactions between the task conditioning system (the desktop fan) and occupants instead of interrupting occupants with surveys. As a result, the performances of personal comfort models with features consisting of indoor air temperature, relative humidity and cheek skin temperature were better than those with baseline features consisting of indoor air temperature only. Moreover, the performances of thermal sensation models were better than satisfaction models. The study contributes to the development of the dynamic task conditioning system to maximize energy performances while maintaining individual thermal comfort in the regular shared office space. In the future, the proposed task conditioning system shall be developed with a more intelligent control algorithm with personal thermal comfort models for thermal comfort management. Moreover, in order to evaluate the proposed automatic task conditioning system more comprehensively, besides field studies, more detailed studies shall be conducted with computational fluid dynamic (CFD) simulations as well as building energy simulations.

Author Contributions

Conceptualization, S.L. and E.C.H.; Data curation, S.L.; Funding acquisition, E.C.H.; Investigation, S.L.; Methodology, S.L.; Resources, E.C.H.; Validation, S.L.; Writing—original draft, S.L.; Writing—review & editing, E.C.H. All authors have read and agreed to the published version of the manuscript.

Funding

This research received no external funding.

Institutional Review Board Statement

The study was conducted according to the guidelines of the Declaration of Helsinki, and approved by Ethics Committee of Donghua University.

Informed Consent Statement

Not applicable.

Data Availability Statement

The data and related codes can be found at https://github.com/lusiliang93/aic_personal_comfort, accessed on 14 September 2021.

Acknowledgments

The first author of the paper is funded by China Scholarship Council.

Conflicts of Interest

The authors declare no conflict of interest.

References

  1. Bauman, F.S.; Arens, E.A. Task/Ambient Conditioning Systems: Engineering and Application Guidelines; Center for Environmental Design Research, University of California: Berkeley, CA, USA, 1996. [Google Scholar]
  2. Zhang, H.; Arens, E.; Kim, D.; Buchberger, E.; Bauman, F.; Huizenga, C. Comfort, perceived air quality, and work performance in a low-power task-ambient conditioning system. Build. Environ. 2010, 45, 29–39. [Google Scholar] [CrossRef] [Green Version]
  3. Andersen, M.P.; Fierro, G.; Kumar, S.; Chen, M.; Truong, L.; Kim, J.; Arens, E.A.; Zhang, H.; Raftery, P.; Culler, D.E. Well-connected microzones for increased building efficiency and occupant comfort. In Proceedings of the 2nd ACM International Conference on Embedded Systems for Energy-Efficient Built Environments, Seoul, Korea, 4–5 November 2015; pp. 121–122. [Google Scholar]
  4. Bauman, F.; Raftery, P.; Kim, J.; Kaam, S.; Schiavon, S.; Zhang, H.; Arens, E.; Brown, K.; Peffer, T.; Blumstein, C.; et al. Changing the Rules: Innovative Low-Energy Occupant-Responsive HVAC Controls and Systems. Final Report to the California Energy Comission; CEC Contract PIR-12-026; Center for the Built Environment: Berkeley, CA, USA, 2017. [Google Scholar]
  5. Fanger, P.O. Thermal Comfort. Analysis and Applications in Environmental Engineering; Danish Technical Press: Copenhagen, Demark, 1970. [Google Scholar]
  6. De Dear, R.; Brager, G.S. Developing an Adaptive Model of Thermal Comfort and Preference; American Society of Heating, Refrigerating and Air-Conditioning Engineers, Inc.: Atlanta, GA, USA, 1998; Volume 104, Part 1. [Google Scholar]
  7. Kim, J.; Schiavon, S.; Brager, G. Personal comfort models—A new paradigm in thermal comfort for occupant-centric environmental control. Build. Environ. 2018, 132, 114–124. [Google Scholar] [CrossRef] [Green Version]
  8. Lee, S.; Bilionis, I.; Karava, P.; Tzempelikos, A. A Bayesian approach for probabilistic classification and inference of occupant thermal preferences in office buildings. Build. Environ. 2017, 118, 323–343. [Google Scholar] [CrossRef] [Green Version]
  9. Youssef, A.; Youssef Ali Amer, A.; Caballero, N.; Aerts, J.M. Towards online personalized-monitoring of human thermal sensation using machine learning approach. Appl. Sci. 2019, 9, 3303. [Google Scholar] [CrossRef] [Green Version]
  10. Ngarambe, J.; Yun, G.Y.; Santamouris, M. The use of artificial intelligence (AI) methods in the prediction of thermal comfort in buildings: Energy implications of AI-based thermal comfort controls. Energy Build. 2020, 211, 109807. [Google Scholar] [CrossRef]
  11. Xie, J.; Li, H.; Li, C.; Zhang, J.; Luo, M. Review on occupant-centric thermal comfort sensing, predicting, and controlling. Energy Build. 2020, 226, 110392. [Google Scholar] [CrossRef]
  12. Choi, J.H. CoBi: Bio-Sensing Building Mechanical System Controls for Sustainably Enhancing Individual Thermal Comfort. Ph.D. Thesis, Carnegie Mellon University, Pittsburgh, PA, USA, 2010. [Google Scholar]
  13. Sim, S.Y.; Koh, M.J.; Joo, K.M.; Noh, S.; Park, S.; Kim, Y.H.; Park, K.S. Estimation of thermal sensation based on wrist skin temperatures. Sensors 2016, 16, 420. [Google Scholar] [CrossRef] [Green Version]
  14. Li, W.; Zhang, J.; Zhao, T.; Liang, R. Experimental research of online monitoring and evaluation method of human thermal sensation in different active states based on wristband device. Energy Build. 2018, 173, 613–622. [Google Scholar] [CrossRef]
  15. Ghahramani, A.; Castro, G.; Karvigh, S.A.; Becerik-Gerber, B. Towards unsupervised learning of thermal comfort using infrared thermography. Appl. Energy 2018, 211, 41–49. [Google Scholar] [CrossRef] [Green Version]
  16. Huang, C.C.; Yang, R.; Newman, M.W. The potential and challenges of inferring thermal comfort at home using commodity sensors. In Proceedings of the 2015 ACM International Joint Conference on Pervasive and Ubiquitous Computing, Osaka, Japan, 7–11 September 2015; pp. 1089–1100. [Google Scholar]
  17. Dai, C.; Zhang, H.; Arens, E.; Lian, Z. Machine learning approaches to predict thermal demands using skin temperatures: Steady-state conditions. Build. Environ. 2017, 114, 1–10. [Google Scholar] [CrossRef] [Green Version]
  18. Hasan, M.H.; Alsaleem, F.; Rafaie, M. Sensitivity study for the PMV thermal comfort model and the use of wearable devices biometric data for metabolic rate estimation. Build. Environ. 2016, 110, 173–183. [Google Scholar] [CrossRef]
  19. Abdallah, M.; Clevenger, C.; Vu, T.; Nguyen, A. Sensing occupant comfort using wearable technologies. In Proceedings of the Construction Research Congress, San Juan, Puerto Rico, 31 May–2 June 2016; pp. 940–950. [Google Scholar]
  20. Cosma, A.C.; Simha, R. Machine learning method for real-time non-invasive prediction of individual thermal preference in transient conditions. Build. Environ. 2019, 148, 372–383. [Google Scholar] [CrossRef]
  21. Li, D.; Menassa, C.C.; Kamat, V.R. Non-intrusive interpretation of human thermal comfort through analysis of facial infrared thermography. Energy Build. 2018, 176, 246–261. [Google Scholar] [CrossRef]
  22. Li, D.; Menassa, C.C.; Kamat, V.R. Robust non-intrusive interpretation of occupant thermal comfort in built environments with low-cost networked thermal cameras. Appl. Energy 2019, 251, 113336. [Google Scholar] [CrossRef]
  23. Ranjan, J.; Scott, J. ThermalSense: Determining dynamic thermal comfort preferences using thermographic imaging. In Proceedings of the 2016 ACM International Joint Conference on Pervasive and Ubiquitous Computing, Heidelberg, Germany, 12–16 September 2016; pp. 1212–1222. [Google Scholar]
  24. Han, D.; Li, R.; Wang, F.; Sun, Z.; Moon, S.; Gong, Z.; Zhang, Y. Study on indoor thermal environment control based on thermal sensation prediction. Procedia Eng. 2017, 205, 3072–3079. [Google Scholar] [CrossRef]
  25. Lu, S.; Wang, W.; Wang, S.; Cochran Hameen, E. Thermal comfort-based personalized models with non-intrusive sensing technique in office buildings. Appl. Sci. 2019, 9, 1768. [Google Scholar] [CrossRef] [Green Version]
  26. Cosma, A.C.; Simha, R. Thermal comfort modeling in transient conditions using real-time local body temperature extraction with a thermographic camera. Build. Environ. 2018, 143, 36–47. [Google Scholar] [CrossRef]
  27. Abbas, M. Frequently Asked Questions: Infrared Grideye Sensor. Panasonic Inc. 2015. Available online: https://cdn.sparkfun.com/assets/2/0/3/f/b/faqs_grideye_v1.0.pdf (accessed on 1 April 2018).
  28. FLIR. Use Low-Cost Materials to Increase Target Emissivity. TELEDYNE FLIR LLC. 2015. Available online: https://www.flir.com/discover/rd-science/use-low-cost-materials-to-increase-target-emissivity/ (accessed on 8 March 2021).
  29. Sekhar, S.C. Higher space temperatures and better thermal comfort—A tropical analysis. Energy Build. 1995, 23, 63–70. [Google Scholar] [CrossRef]
  30. Li, W. Numerical and Experimental Study of Thermal Stratification in Large Warehouses. Ph.D. Thesis, Concordia University, Montreal, QC, Canada, 2016. [Google Scholar]
  31. Ashrae, A.S. Standard 55-2013. Thermal Environmental Conditions for Human Occupancy; American Society of Heating, Refrigerating and Air-Conditioning Engineers, Inc.: Atlanta, GA, USA, 2013. [Google Scholar]
  32. Smola, A.J.; Schölkopf, B. A tutorial on support vector regression. Stat. Comput. 2004, 14, 199–222. [Google Scholar] [CrossRef] [Green Version]
  33. Kohavi, R. A study of cross-validation and bootstrap for accuracy estimation and model selection. IJCAI 1995, 14, 1137–1145. [Google Scholar]
  34. Pedregosa, F.; Varoquaux, G.; Gramfort, A.; Michel, V.; Thirion, B.; Grisel, O.; Blondel, M.; Prettenhofer, P.; Weiss, R.; Dubourg, V.; et al. Scikit-learn: Machine learning in Python. J. Mach. Learn. Res. 2011, 12, 2825–2830. [Google Scholar]
  35. Goutte, C.; Gaussier, E. A probabilistic interpretation of precision, recall and F-score, with implication for evaluation. In European Conference on Information Retrieval; Springer: Berlin/Heidelberg, Germany, 2005; pp. 345–359. [Google Scholar]
  36. McCracken, I. Ouimeaux: Open Source WeMo Control. 2014. Available online: https://github.com/iancmcc/ouimeaux (accessed on 1 May 2018).
  37. Mathworks. ThingSpeak Communication Library for Arduino, ESP8266 and ESP32. 2015. Available online: https://github.com/mathworks/thingspeak-arduino (accessed on 1 June 2018).
  38. Nie, C.; Gao, Y.; Li, B.; Tan, M. Research of summer comfortable temperature in Air-conditioning Room in Chongqing, China. In Proceedings of the 2011 International Conference on Remote Sensing, Environment and Transportation Engineering, Nanjing, China, 24–26 June 2011; pp. 4318–4321. [Google Scholar]
  39. Shahzad, S.; Brennan, J.; Theodossopoulos, D.; Calautit, J.K.; Hughes, B.R. Does a neutral thermal sensation determine thermal comfort? Build. Serv. Eng. Res. Technol. 2018, 39, 183–195. [Google Scholar] [CrossRef]
Figure 1. Examples of psychrometric charts for acceptable comfort ranges in winter and summer with different acceptability criteria. (a) 90% general acceptability criterion. (b) 80% general acceptability criterion [6].
Technologies 09 00090 g001
Figure 2. Camera views of the electric tape. (a) IR image of electric tape whose color bar ranges between 76.7 °F (23.8 °C) and 67.1 °F (19.5 °C); (b) RGB image of electric tape.
Technologies 09 00090 g002
Figure 3. An example of skin temperature detection.
Technologies 09 00090 g003
Figure 4. The non-intrusive sensor board.
Technologies 09 00090 g004
Figure 5. Personal thermal comfort metrics. (a) The 7-point thermal sensation; (b) 5-point thermal satisfaction.
Technologies 09 00090 g005
Figure 6. The personal comfort model pipeline in the first phase.
Technologies 09 00090 g006
Figure 7. An example of updating the personal comfort model.
Technologies 09 00090 g007
Figure 8. Closed-loop task system diagram of the task conditioning system.
Technologies 09 00090 g008
Figure 9. Test bed set-up. (a) A real test bed setup. (b) A 3D view of the proposed system.
Technologies 09 00090 g009
Figure 10. Comparison between votes for neutral and non-neutral sensation/satisfaction. (a) Sensation; (b) Satisfaction.
Technologies 09 00090 g010
Figure 11. Relations between air/skin temperature and thermal sensation/satisfaction. (a) Air temperature vs. sensation of females; (b) air temperature vs. sensation of males; (c) skin temperature vs. sensation of females; (d) skin temperature vs. sensation of males; (e) air temperature vs. satisfaction of females; (f) air temperature vs. satisfaction of males; (g) skin temperature vs. satisfaction of females; (h) skin temperature vs. satisfaction of males.
Technologies 09 00090 g011
Figure 12. The comparison between initial and updated thermal comfort models.
Technologies 09 00090 g012
Table 1. Components in the non-intrusive sensing system.
VariableSensorUnitResolutionAccuracyOperating Range
Air temperatureDHT22°C0.1 °C±0.5 °C−40–80 °C
Relative humidityDHT22%0.1%±2%0–100%
Skin temperature (calibrated)AMG8833°C0.01 °C±0.5 °C0–80 °C
Table 2. Confusion matrix.
Predicted: NegativePredicted: Positive
Actual: NegativeTrue negative (TN)False positive (FP)
Actual: PositiveFalse negative (FN)True positive (TP)
Table 3. Performance benchmark of the thermal models with recall scores.
GenderSensation Prediction with Baseline ModelSensation Prediction with Proposed Model Satisfaction Prediction with Baseline ModelSatisfaction Prediction with Proposed Model
All female82.65%84.7%73.5%76.5%
All male87.0%87.0%81.2%82.5%
F93.0%88.0%83.0%84.0%
F90.9%91.0%63.6%77.3%
F84.6%85.0%84.6%84.6%
F50.0%75.0%50.0%75.0%
F61.5%61.5%84.6%84.6%
M92.3%94.9%82.1%82.0%
M86.7%90.0%80.0%87.0%
M83.3%83.3%83.3%83.3%
M94.7%94.7%89.5%90.0%
M100.0%100.0%100.0%100.0%
M61.5%61.5%46.1%46.1%
Publisher’s Note: MDPI stays neutral with regard to jurisdictional claims in published maps and institutional affiliations.

