Article

Enhancing Multimodal Interaction and Communicative Competence through Task-Based Language Teaching (TBLT) in Synchronous Computer-Mediated Communication (SCMC)

by
Jose Belda-Medina
Department of English Studies, University of Alicante, 03690 Alicante, Spain
Submission received: 26 August 2021 / Revised: 28 October 2021 / Accepted: 9 November 2021 / Published: 11 November 2021
(This article belongs to the Special Issue Post-pandemic Technology Enhanced Language Learning)

Abstract

:
The number of publications on live online teaching and distance learning has significantly increased over the past two years since the outbreak and worldwide spread of the COVID-19 pandemic, but more research is needed on effective methodologies and their impact on the learning process. This research aimed to analyze student interaction and multimodal communication through Task-Based Language Teaching (TBLT) in a Synchronous Computer-Mediated Communication (SCMC) environment. For this purpose, 90 teacher candidates enrolled in the subject Applied Linguistics at a university were randomly assigned in different teams to create collaboratively digital infographics based on different language teaching methods. Then, all the teams explained their projects online and the classmates completed two multimedia activities based on each method. Finally, the participants discussed the self-perceived benefits (relevance, enjoyment, interest) and limitations (connectivity, distraction) of SCMC in language learning. Quantitative and qualitative data were gathered through pre- and post-tests, class observation and online discussion. The statistical data and research findings revealed a positive attitude towards the integration of TBLT in an SCMC environment and a high level of satisfaction with multimodal communication (written, verbal, visual) and student interaction. However, the language teacher candidates complained about the low quality of the digital materials, the use of technology just for substitution, and the lack of peer-to-peer interaction in their live online classes during the pandemic.

1. Introduction

1.1. Synchronous Computer-Mediated Communication (SCMC) in Language Learning

Synchronous Computer-Mediated Communication (SCMC) has been the subject of an increasing number of publications since the outbreak of the COVID-19 pandemic worldwide [1,2,3], but its use in language learning had been widely studied before, both in comparison to asynchronous computer-mediated communication (ASCMC) and face-to-face environments [4,5]. According to different authors [6,7], SCMC generally focuses on meaning rather than form, reflecting a more real-life situation that may in turn result in lower lexical richness and grammatical accuracy because of its immediacy [8]. Compared to face-to-face (FTF) contexts, some of the SCMC affordances commonly cited are higher learning mobility and autonomy, reduced language anxiety due to a less stressful environment, enhanced collaborative learning and increased participation [9,10,11], partly because ‘instructors and learners can be engaged in the learning process as partners so that the focus is no longer limited to the knowledge of the instructor delivered via lecture’ [12] (p. 86).
However, there are several challenges for effective SCMC. Technologically, different studies have delved into the scarcity of digital resources in some educational contexts, poor connectivity resulting in delayed communication, lack of privacy and partly ineffective communication owing to the lack of nonverbal cues and true human contact [13]. Pedagogically, some constraints reported were low computer literacy, lack of teacher readiness as regards class management in live online platforms and low student interest and interaction partly due to longer conversational turns, which might result in student disengagement [14,15,16].
Within the SCMC environment, research has concentrated on the differences in interaction and language learning between text-based, such as chat or instant messaging (IM), and video-based, e.g., videoconferencing [17]. In this regard, some of the alleged benefits of text-based over video-based communication are increased saliency [18] and extended opportunities to review the written interaction thanks to more processing time [10], mainly because ‘delayed SCMC obviously places a smaller time burden on the learners in responding than audio- and videoconferencing’, as pointed out by Stockwell [19] (p. 105).
However, different modes, text-based and video-based, may occur at once in modern SCMC practice thanks to recent technological advances, such as using tools that integrate instant messaging, file sharing and videoconferencing. Consequently, SCMC interactions today tend to be multimodal and multitask-oriented, as learners simultaneously utilize different semiotic resources (voice, image, gestures, pictures, text and files) in their online communication.

1.2. Interaction in Synchronous Computer-Mediated Communication

Several works have been published about SCMC in second language (L2) learning from the Interactionist Approach [20,21]. L2 refers to the language that is not native of the speaker. The Interactionist Approach focuses on how learners interact ‘with the input and their interlocutors through the processes of negotiating for meaning, giving and receiving corrective feedback, and producing modified output that are likely to lead to L2 development’, according to Ziegler [10] (p. 555). These studies examined different aspects such as conversational strategies and participation rates, grammatical accuracy, etc. [22,23]. From an Interactionist Approach, several moderating factors should be considered, namely type of target, type of interlocutor, educational context and research setting [10], but much of the research published on teacher–student interaction through SCMC was conducted within a laboratory setting or in a traditional classroom context, occasionally combining face-to-face (T2F) and SCMC in a b-learning mode.
However, the educational setting changed after the outbreak of the COVID-19 pandemic, as most students were home-based and bound to distance learning. Therefore, new studies about SCMC have come to light in the past two years; for example, Junn [24] analyzed student interaction and communicative competence in a course fully delivered online, focusing on expression, interpretation and negotiation of meaning, and concluded that ‘effective integration of technology can even increase student motivation to acquire L2 due to greater autonomy and individualization, enhanced opportunities for communication, identity development and the ability to utilize learners’ IT skills’ (p. 15). Nevertheless, research on multimodal interaction through SCMC remains very scarce to date [25,26,27], as multimodal analysis has traditionally given more attention to face-to-face contexts, and the majority of studies examined online interaction separately, either in a synchronous or asynchronous mode, with a few exceptions [28].
Thanks to the emergence and wide availability of modern technological tools, SCMC has become more complex in recent years. Compared to traditional oral or written conversations, students today can interact online simultaneously through video, audio, images and text by using one or several digital tools, but this enriched multimedia interaction in modern distance learning poses new problems such as the effects of disruptions and distractions, whether for intrinsic or extrinsic reasons, and their impact on student engagement and the learning process [29]. For this reason, it is necessary to adopt digitally oriented methodologies to enhance online interaction, which can be threefold: teacher–student, student–student and student–materials.

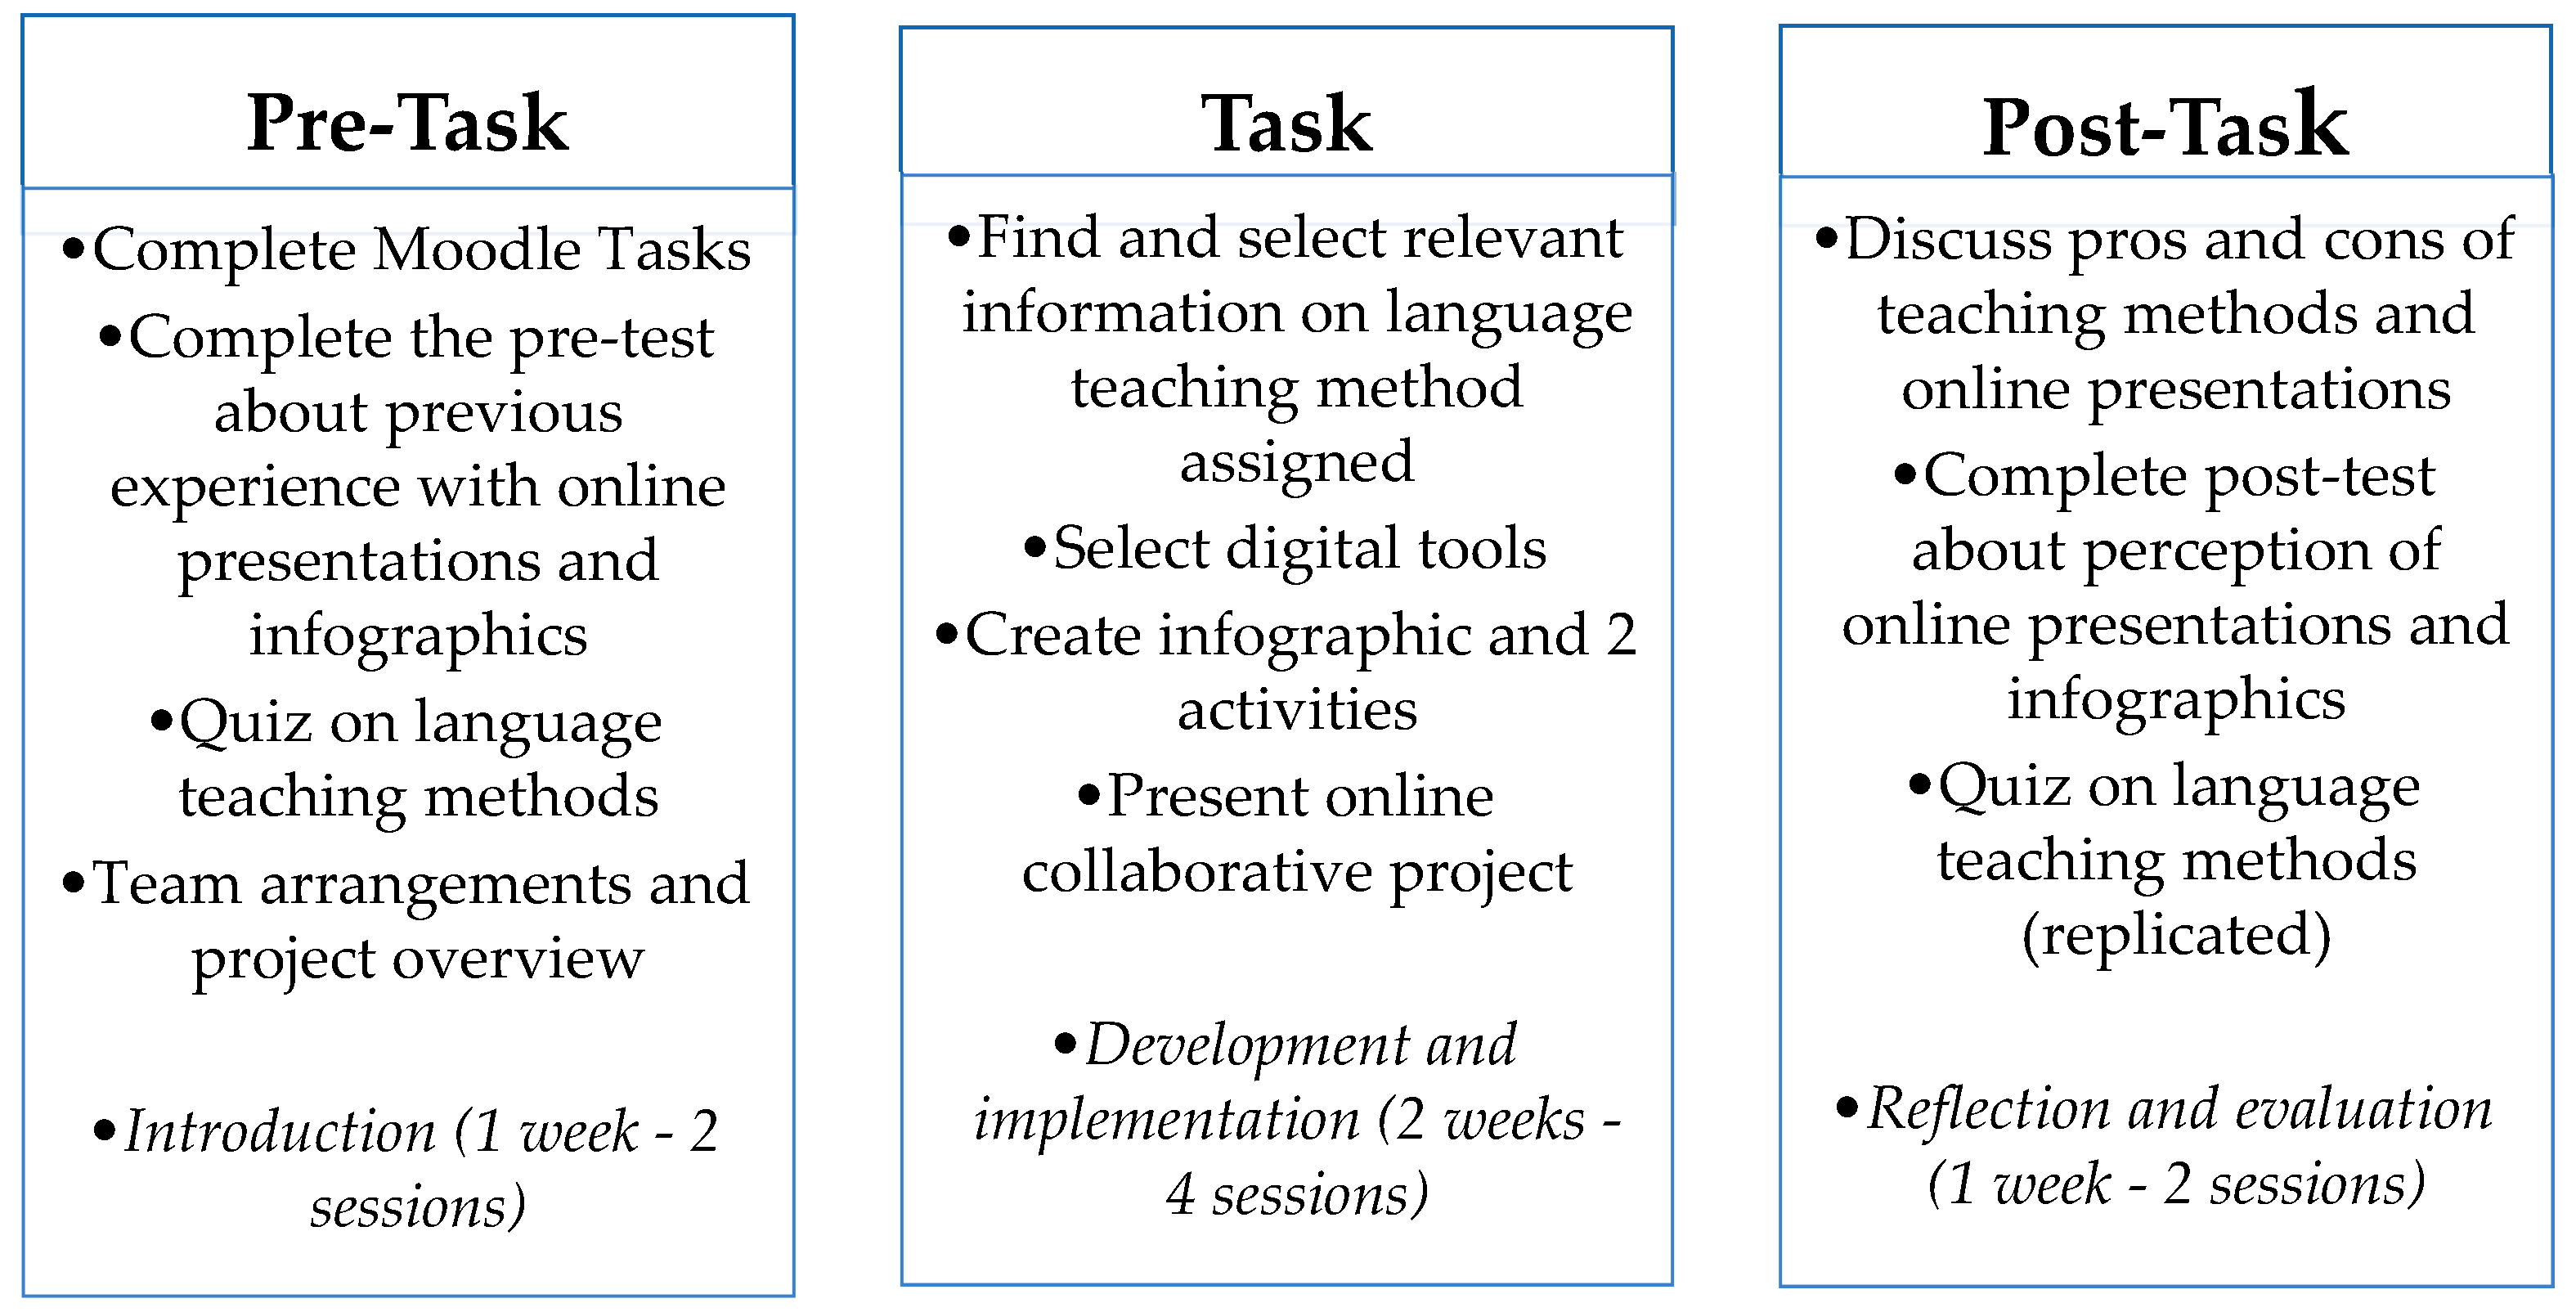
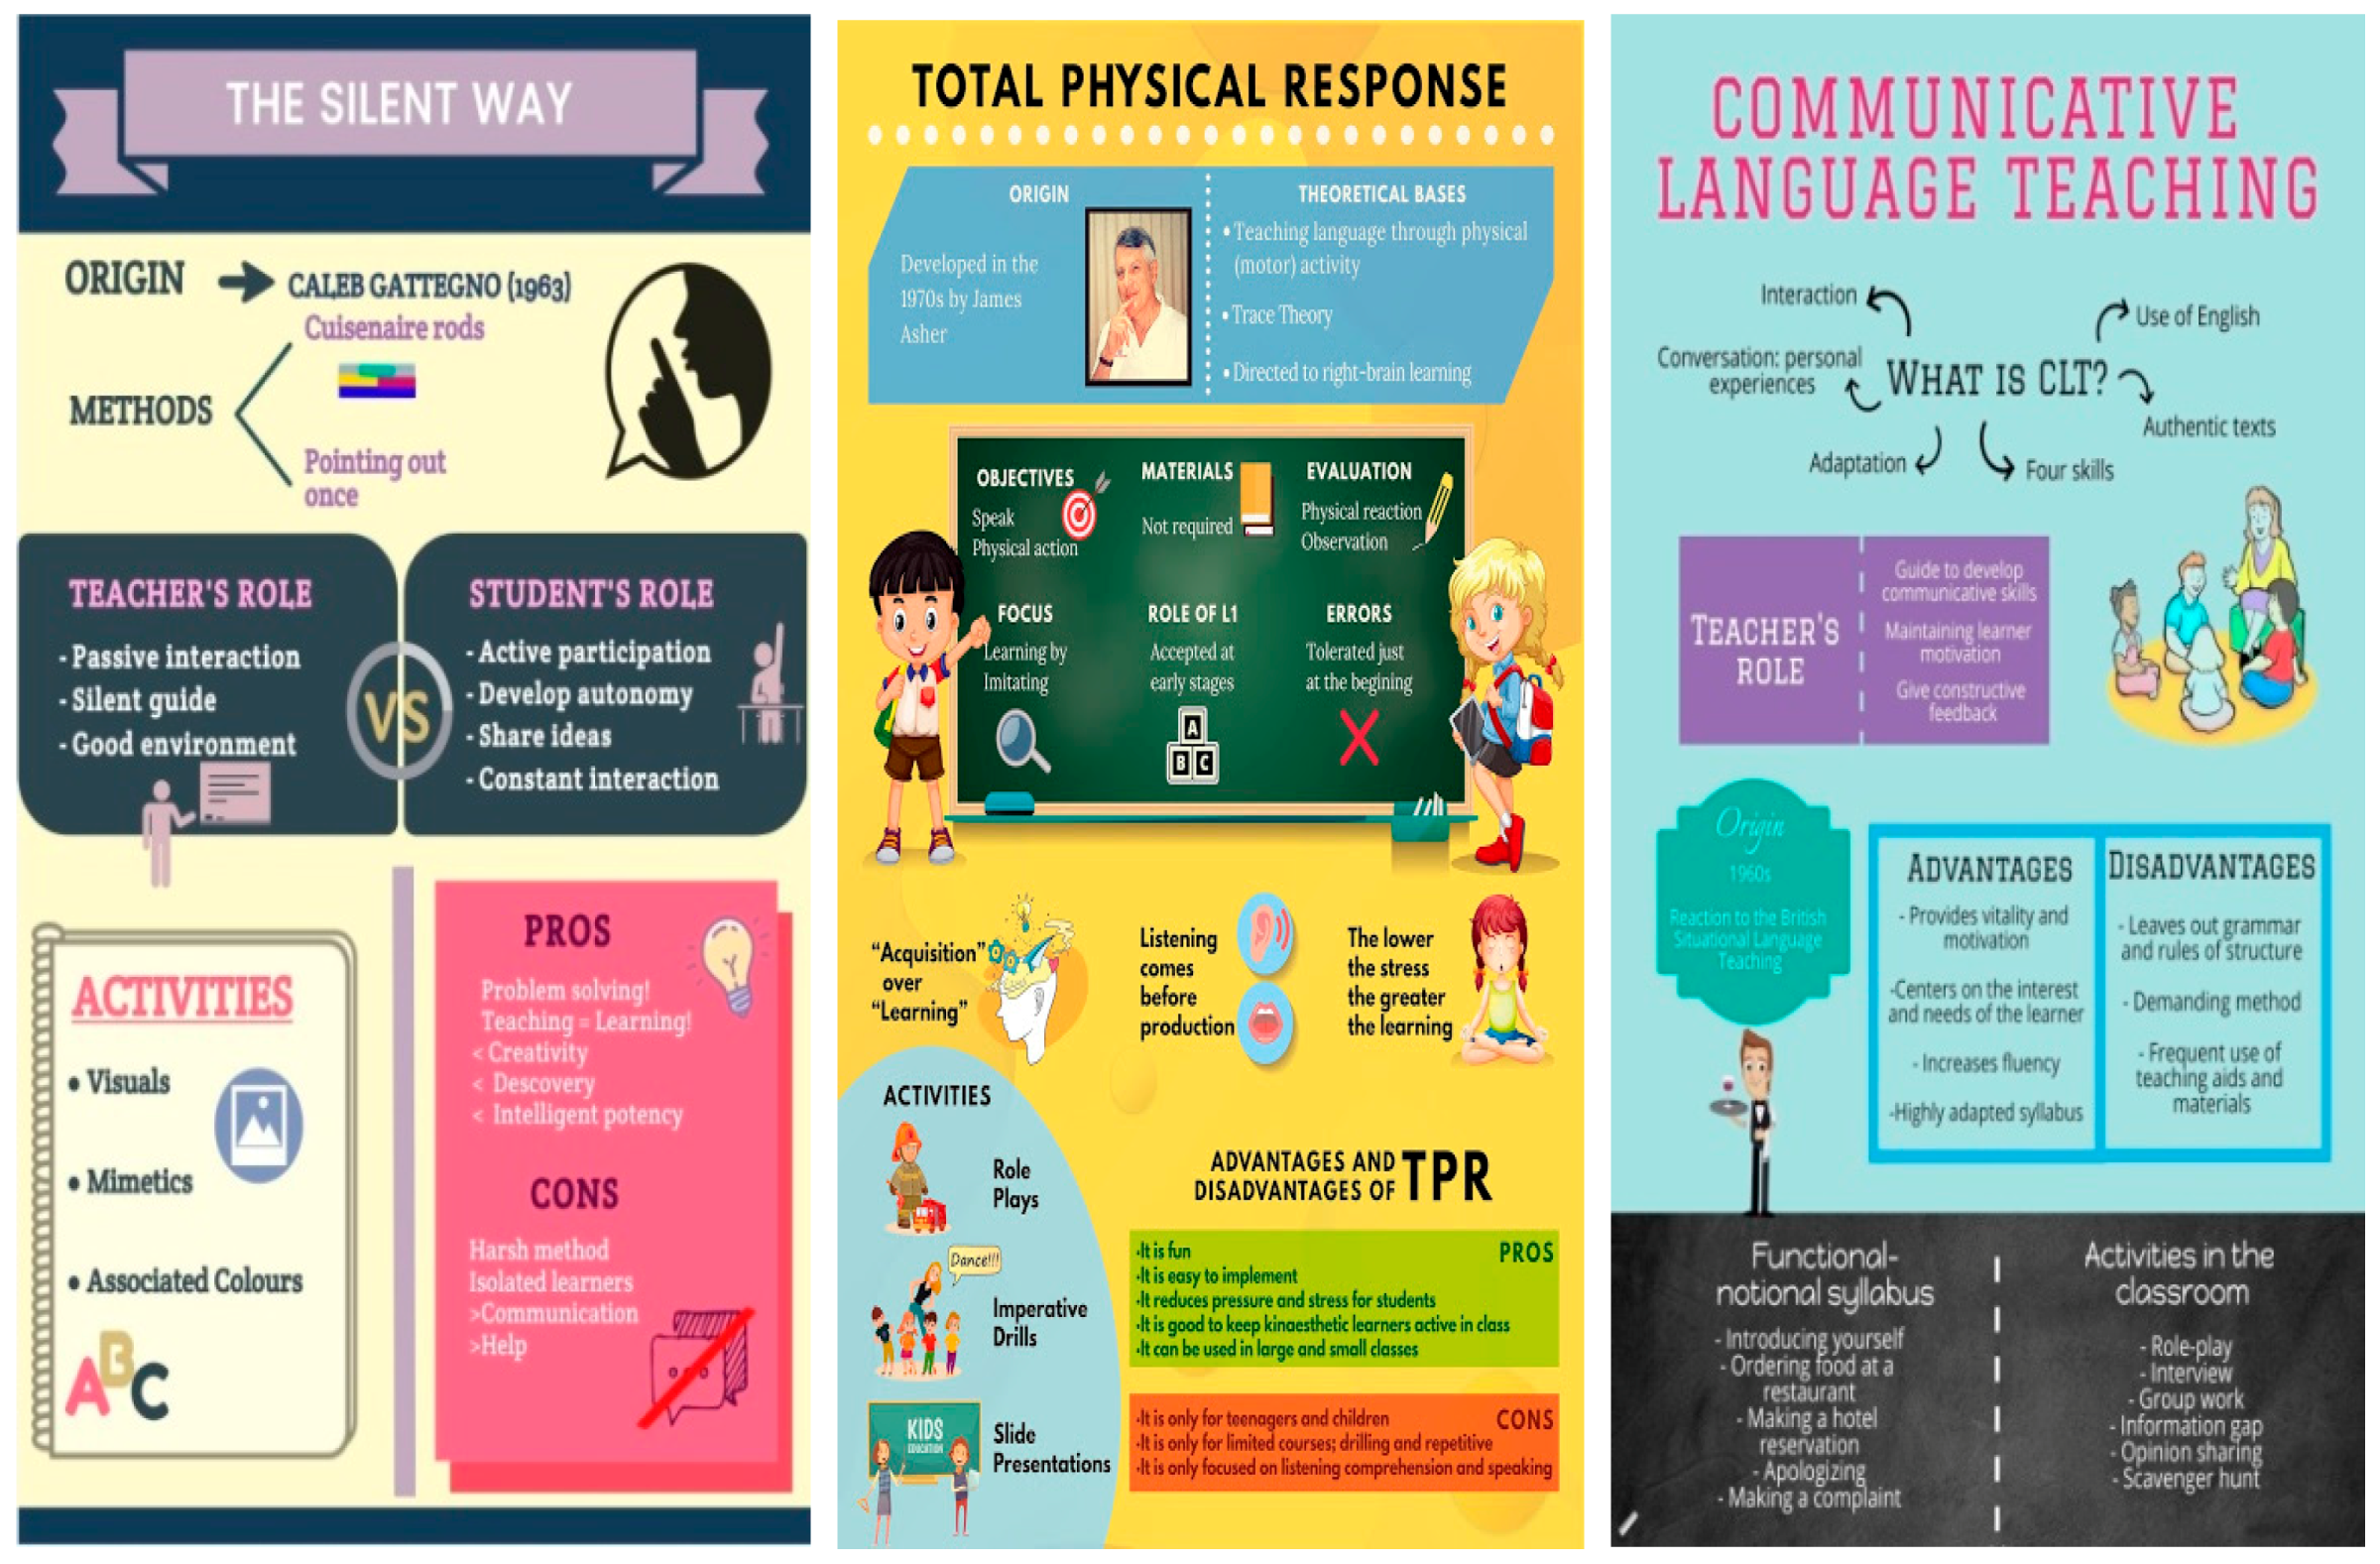
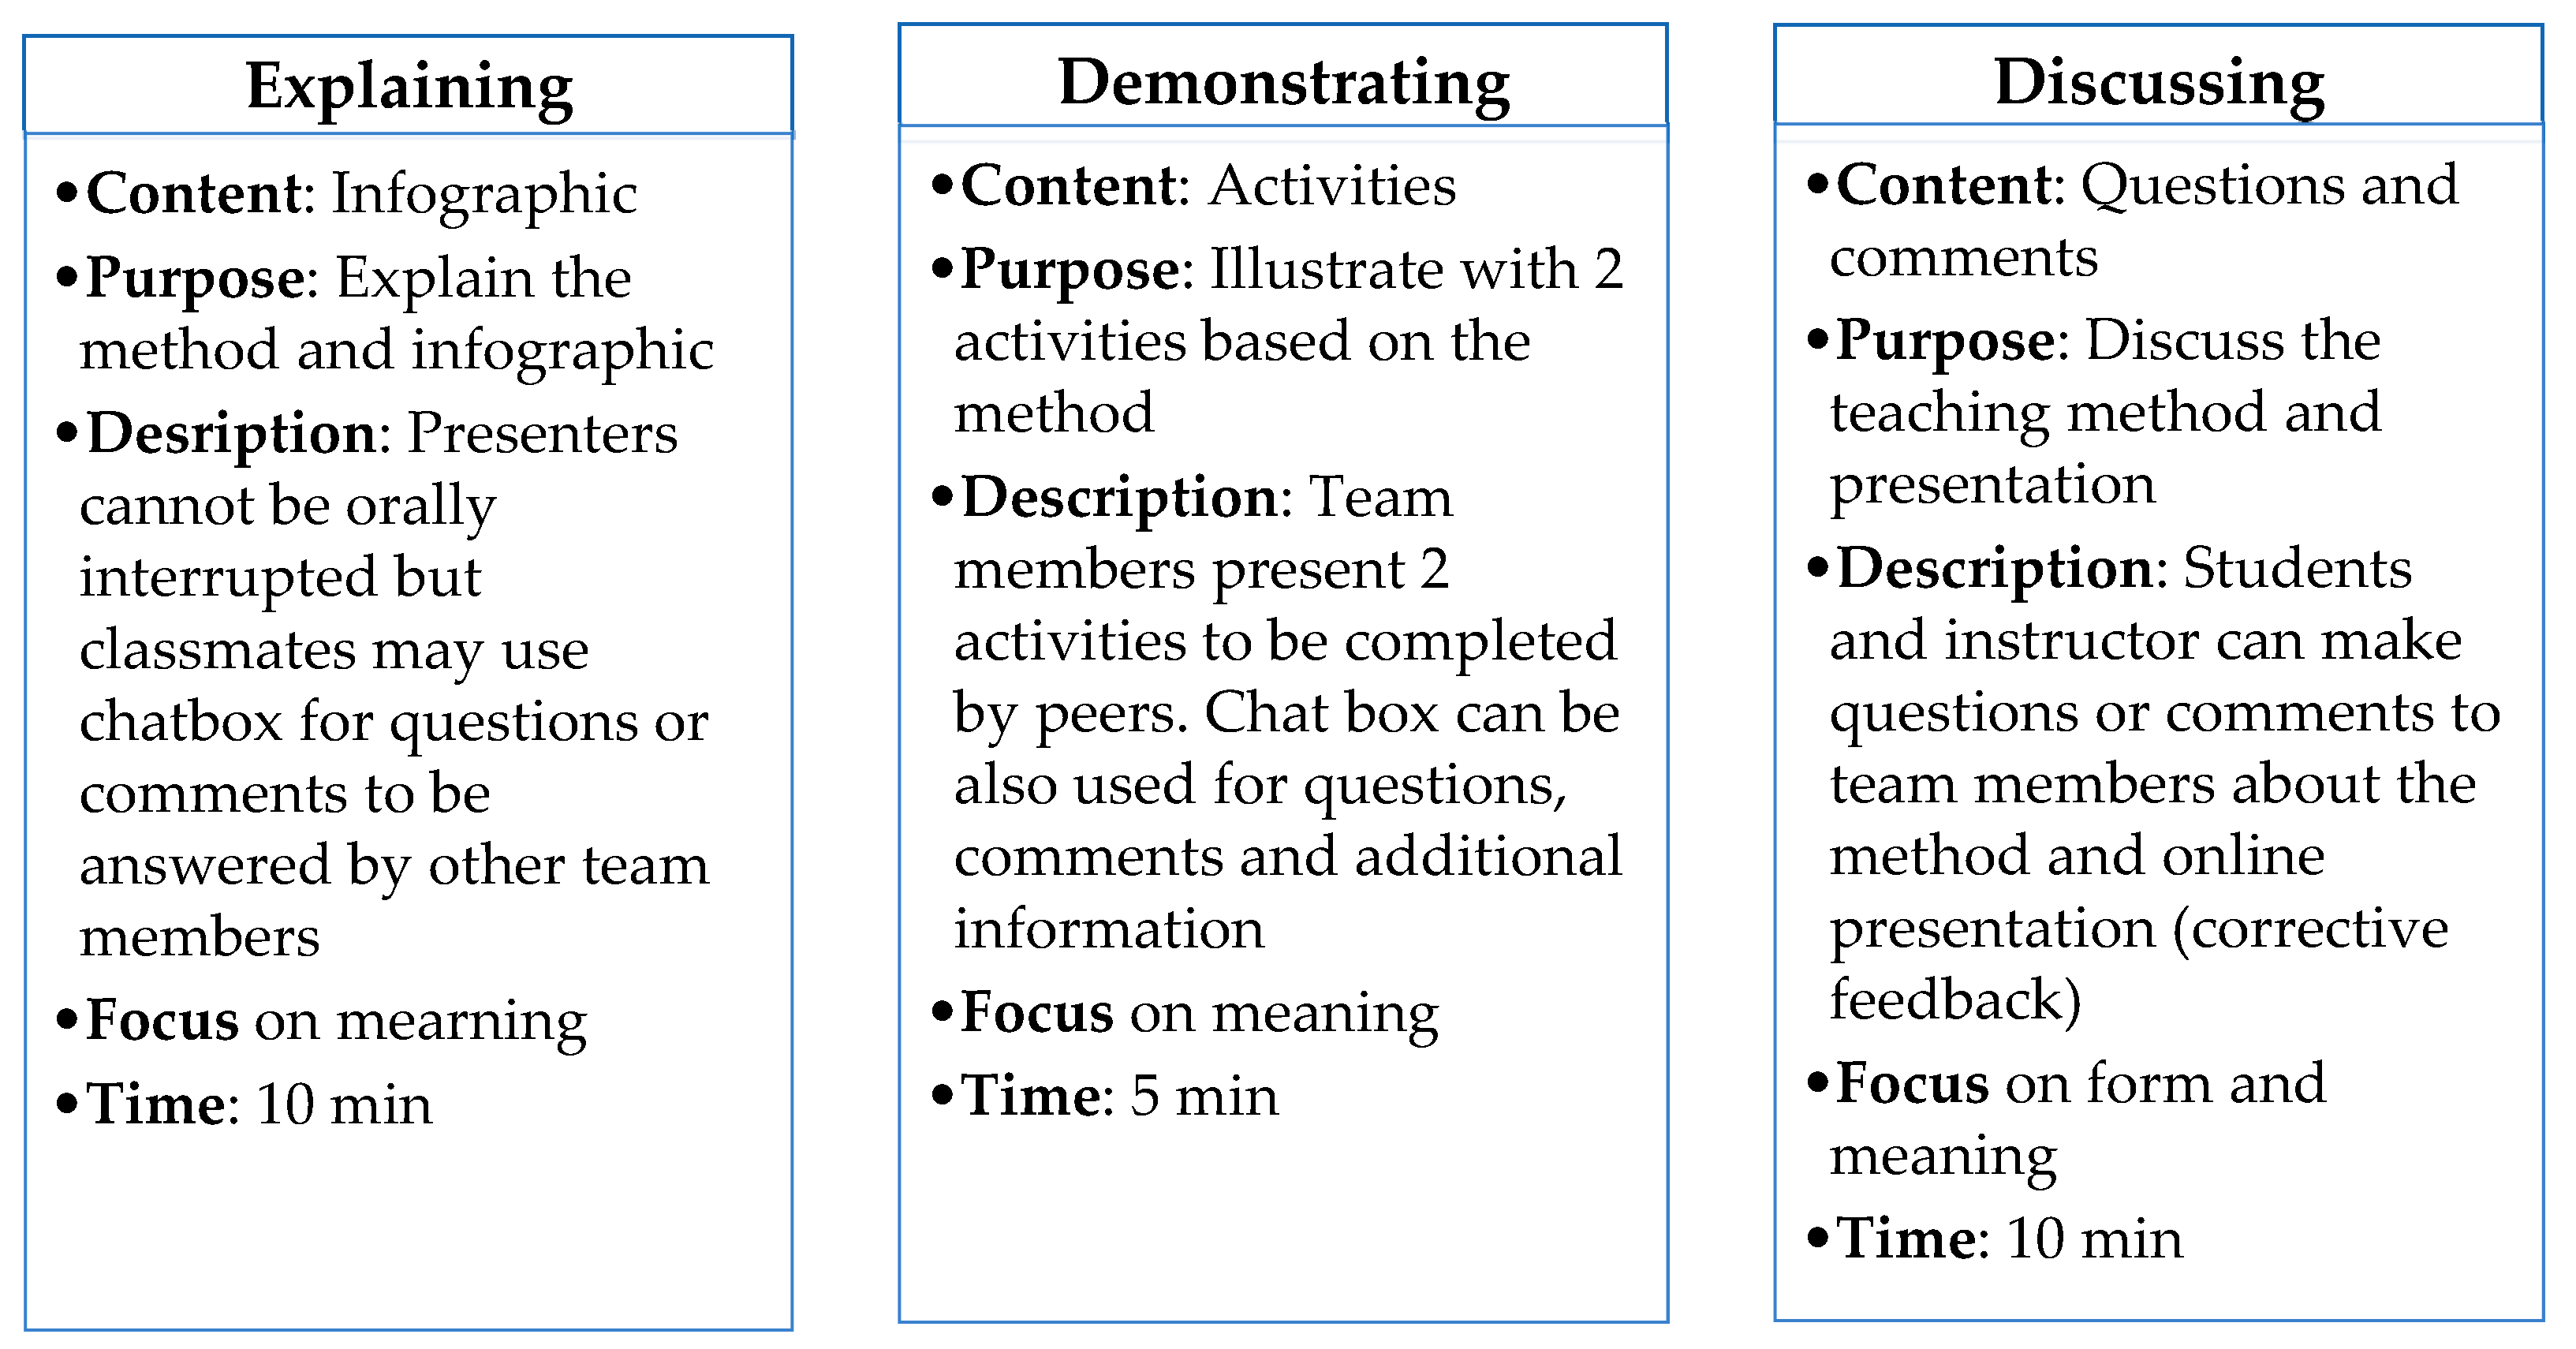
1.3. Task-Based Language Teaching (TBLT) and the Use of Infographics

A good amount of research published on Task-Based Language Teaching (TBLT) has been carried out in traditional face-to-face settings [18,30]. Task, as applied to language learning, has been conventionally defined as ‘a goal-oriented communicative activity with a specific outcome, where the emphasis is on exchanging meanings’ [31] (p. 26), or an ‘activity which requires learners to use language, with emphasis on meaning, to attain an objective’ [19] (p. 11).
Recent studies have started to examine the adoption of TBLT in a CMC environment [32,33,34,35,36]. Müller-Hartmann and Schocker-von Ditfurth [32], for example, delved into the analysis of certain determining factors such as the teacher’s role and online presence in SCMC, the learners’ motivation and engagement, and the task goal and process, pinpointing that ‘teachers and learners share the responsibility of promoting interactive leaning’ (p. 29). Therefore, communication and interactivity are key issues since SCMC is based on ‘promoting real-world authentic tasks in the target language at a time when 1.5 billion people in the world have access to global forms of technology-mediated communication’, according to Thomas and Reinders [37] (p. 3).
Generally, tasks are considered to be student-centered, authentic, holistic and communicative in nature since they focus on the content rather than the form of the message, ‘although pre-tasks and post-tasks or pedagogic tasks, depending on the model of TBLT, can focus on language per se’, as expressed by González-Lloret [34] (p. 235). Theoretically, tasks should be used to promote reflection and higher-order thinking skills in the learning process, but most of the tasks investigated in CMC to date, e.g., information-gap tasks, were designed to enhance productivity in language learning, not creativity and communicative competence, mainly because ‘tasks were borrowed from SLA face-to-face research and transferred into the computer-mediated environment’ [34] (p. 238).
A few studies have recently examined the use of online tasks as part of larger projects (project-based learning or PBL), thus requiring the combination of different modes, synchronous and asynchronous. Consequently, according to different authors, there is a need to investigate student multimodal interaction, digital development and computer-mediated communication through TBLT [34,38]. For this reason, the present paper examines the effects of using infographics as a TBLT methodology among EFL students in an SCMC environment.
Infographics have been integrated in language learning with different purposes, both as a data visualization format [39,40] and as an effective tool to improve several language skills and components such as reading [41], writing [42], grammar [43] and vocabulary [44]. Dahmash et al. [45] defined them as ‘a visualization of ideas and data in a type of picture that combines data with design to communicate information to an audience in a comprehensible manner’ (p. 12). Bicen and Behesti [46] investigated the impact of utilizing infographics in a flipped classroom with the purpose of improving the management of cognitive load as well as increasing motivation and autonomy of ESL learners. More recently, Dewantari et al. [47] analyzed the use of infographics for independent English learning among secondary education students and revealed its positive impact on the students’ performance in combination with other tools such as Google classroom.
Combining different modes of online interaction, text- and video-based, with a task-based methodology such as the use of infographics, may result in an enriched and complex communication. As pointed out by Warschauer [48], students today need to develop their language competence together with their multimodal and informational literacies, but it is essential that instructors as well as learners exhibit good language competence and mastery of online class management. Similarly, Barrett et al. [48] emphasized the need for more research in group oral presentations and projects with mobile and desktop devices as the collaborative, storage and creative tools. The novelty of this study is that it aims to analyze student multimodal interaction and communicative competence in an SCMC environment using infographics in a TBLT methodology.

2. Objectives and Method

This article aims to investigate three research questions:
  • RQ1. Can TBLT (infographics) be effectively used to enhance multimodal interaction in live online learning (SCMC)?
  • RQ2. Can TBLT (infographics) be used to strengthen communicative competence in live online learning (SCMC)?
  • RQ3. What is the students’ perception of using TBLT (infographics) in live online learning (SCMC)?
This study was based on a sequential mixed method approach aimed at exploring participant perceptions and views of using infographics for second language learning through SCMC. This research method combined quantitative and qualitative data which were gathered though two types of instruments: semi-structured discussions and surveys (Appendix A). Firstly, the participants completed a pre-test including three sections: the first was related to socio-demographic information (age and gender) and technology ownership (number and type of electronic devices); the second section contained 10 items about the student previous experience with live online presentations; and the third section comprised 5 items associated with the previous use of collaborative infographics in language learning.
The post-test was designed to measure the student perception of the online presentations and interaction after the experiment and encompassed two sections: the first one was related with the tools used by participants to create their own infographics and multimedia activities based on language teaching methods; the second comprised 12 items including three dimensions (enjoyment, relevance and intention) about the perception of the collaborative infographics and online presentations. In this section, reverse-coded items were used to avoid the acquiescence bias of some self-perceived scales. The results were analyzed through the IBM SPSS Statistics 20 software.
For the qualitative data, online discussions and semi-structured debates were used and later transcribed (Appendix A). The online presentations, student interaction and discussion through Google Meet were recorded with permission from the research participants. Personal data collected were processed and treated anonymously, except for cases in which students gave written consent to use their images for scientific purposes.

3. Context and Research Procedure

Research participants were 90 third-year undergraduates enrolled in the subject Applied Linguistics in a medium-sized university located on the southeastern coast of Spain. Of the participants, 82% were female students and the remaining 18% were males, all aged 21 to 30 and with a B2–C1 English level according to the CEFR. Students were divided in two groups of 45, who met regularly twice a week in two-hour sessions for four consecutive weeks in the 2021 spring term. The class methodology was based on Task-Based Learning and Teaching (TBLT), so students had to first complete several Moodle tasks related with the subject content in an asynchronous mode. These tasks consisted of readings, videos, assignments or discussions, and all of them assessed through different quizzes. Live online sessions (SCMC) through Google Meet were strictly reserved for project presentations and class discussion in order to promote student interaction and communication.
For the digital projects, which were task-oriented and collaborative, participants were randomly assigned in teams of 4–5 members as a ‘learning group’ [49]. This article shows the results of the first project created by the students based on digital infographics. First, the participants had to fulfill three Moodle tasks (reading articles, watching videos, exercises) related with language teaching methods and become familiar with different concepts, which were mainly taken from Celce-Murcia [50], and complete the pre-test. Next, each team was assigned a different method and all participants received an online training session on how to create digital infographics. All the project instructions were included in the class handbook, which contained detailed information about the learning objectives, step-by-step procedure, content and format requirements, recommended digital tools, samples and a rubric.
The teaching language methods proposed for the infographics were: the Grammar-Translation Method, the Direct Method, the Audio-Lingual Method, Total Physical Response, the Silent Way, Situational Language Teaching, Suggestopedia, Communicative Language Teaching and Community Language Learning. The home-based students needed to find relevant information about the assigned method, summarize the main ideas and collaboratively create an infographic to be explained online. Additionally, they were required to prepare two multimedia activities based on their method to illustrate it among their peers. In this stage, most of the creative work was performed autonomously by the different teams, so live online sessions (SCMC) were reserved for project supervision and problem solving. Finally, participants were required to complete a post-test based on their perception (relevance, enjoyment, intention) of the online presentations and student interactions.
The experiment was carried out for four weeks with eight two-hour sessions. The first week was devoted to the pre-task activities, the following two weeks to project development and online presentations (task) and the last week to online discussion and evaluation (post-task). To minimize extraneous variables, the pre- and post-tests were administered online during class time. Figure 1 summarizes the TBLT cycle.

4. Results and Discussion

A total of 18 infographics were created by the participants based on different language teaching methods. They needed to contain meaningful imagery, charts and minimal text as an aid for visual representation of data and communication during the online presentations, and the content should focus on the origins, context, principles, techniques and some advantages and disadvantages of each method. Although students received a training session on digital tools (Canva, Piktochart, Glogster, Genially, Easel.ly, etc.), they could select the program that best suited their needs. In this sense, they had to consider different factors such as graphic design, image library, editing format, publishing options, pricing, etc.
As language teacher candidates, they were required to investigate different principles and practices associated with each language method from a critical perspective. The main objective was to promote their creativity as well as critical thinking skills by having each team become specialized in a particular method and sharing their knowledge with the rest of the class online. Figure 2 illustrates some of the infographics created by the research participants.
The pre-test results evidenced the teacher candidates’ low experience with infographics, as shown in Table 1. Only 18% declared to have some practice creating infographics (#1), barely half of them had done so in English (#3) and just 4% had used them during online presentations (#5). In this sense, most research participants manifested that their online classes during the COVID-19 pandemic were lecture-type or based on teacher–student interaction and not peer-to-peer interaction.
The second section of the pre-test about previous experience with online presentations revealed significant differences, as shown in Table 2. Although a number of participants had moderate experience, it was based on individual presentations (#1 M = 3.76) as opposed to team presentations (#2 M = 2.20). Regarding purpose, there was no difference in scores between online presentations for lesson delivery (#3 M = 2.63) versus content creation (#4 M = 2.64). However, the frequency of experience depending on type of materials used was very diverse, as online presentations using PPT files (#6 M = 4.09) clearly outnumbered those exclusively based on text (#5 M = 2.5) or posters (#7 M = 2.44). Regarding online interaction, the teacher–student type (#9 M = 3.43) showed a higher frequency over the other two types: student–student (#10 M = 2.43) and little or no interaction (#8 M = 2.44). To summarize, the live online classes during the COVID-19 pandemic were mainly based on individual presentations involving PPT files with teacher–student interaction.
A good number of participants considered that these results mirrored the typical presentations in a traditional face-to-face classroom, but they called attention to the highly discouraging factor of this practice in distance learning when classes are fully delivered online and different factors need to be considered (lack of physical human contact, disruptions and distraction, technological problems, etc.). In fact, they believed that presentation format, length and type of interaction had a great impact on online attention and enjoyment, or in other words, the longer and less interactive the presentation, the higher the risk of student distraction and disengagement in live online lessons. This was consistent with previous literature [15,16] stating that longer conversational turns may hinder interaction in SCMC, resulting in student disengagement. However, the novelty was that participants stressed the importance not only of length but also of format (games, collaborative dashboards) and type (peer-to-peer) of the presentations as key factors to enhance online student participation.
Regarding the structure of the online presentations, each team had 10 min to explain their language teaching method with the aid of the infographic, followed by another 5 min to illustrate it with two activities based on the assigned method. Every team member was made responsible for the whole project development and presentation (‘learning groups’), so they needed to be well coordinated: deciding who was/were presenting online the infographic and the activities (speaking), and who was/were simultaneously chatting (writing), responding to questions or comments made by their classmates or sharing links with additional information (articles, videos, websites, etc.).
Students speaking online could not be orally interrupted during the first 15 min to avoid or minimize communication problems, and all team members were instructed to be ready to deal with unexpected technical issues (file sharing, turn up-taking in the event of connection failure, etc.). However, the rest of the classmates could use the chat box to write comments or questions in real time, which needed to be answered by the team members who were not presenting in that moment. After each team finished explaining the infographic and the two activities (15 min), there was a 10 min period for oral questions and comments by the lecturer and peers before the next presentation. Figure 3 shows the different tasks and critical thinking skills involved in the presentations.
This system was aimed to enhance student interaction and multimodal communication (video- and text-based), engage all the students in the presentations, keep their attention alive and avoid student distraction. The existing regulation on the use of webcams for distance learning, which was updated following the COVID-19 outbreak, set that students could not be obliged to have their webcams on during the full online session due to privacy issues, but they could be required to turn them on just for identification. However, most students opted for keeping their webcams connected during the whole class, as they believed it was more natural and engaging, except when it was not possible for technical or personal reasons. Figure 4 shows a screenshot of a live online presentation.
This image could be divided into 5 different frames from a multimodal and interactionist perspective (Figure 5): the main frame (1) with a presentational function corresponded to the space used to share visual content; the middle frame (2) was used for personal contact (face or profile) with other classmates and control different modes of communication (visual, aural, gestural, etc.); the right-hand side frame (3) formed by the chat box and list of online attendants was used to keep interaction alive as all participants could chat via text in real time while the presentations were taking place, and the students could exchange messages (text, emojis, etc.) and share links that might activate new screen tabs; the bottom frame (4) corresponding to the control panel was used with functions such as turn taking or activating subtitles, which proved to be helpful for students with a hearing impairment; the top frame (5) displayed all the active tabs or windows connected with the right frame (3) and was used to provide additional information (videos, articles) and complete multimedia activities (exercises, games) through links provided in the chat box (1).
In this type of multimodal interaction, focused and sustained attention to the different frames was necessary while the learners simultaneously performed different online tasks (presenting, texting, sharing content, completing activities, etc.). During the presentations, class collaboration was essential ‘to avoid periods of silence that may affect communication flow’ within SCMC platforms due to technological delays, as indicated by Vurdien [51] (p. 287). In this sense, procedural (e.g., ‘I will show next the first activity’ or ‘Does anyone have any questions?’) as well as technological negotiations (e.g., ‘Can you hear me?’, ‘Can you see our infographics’ or ‘you are on mute’) were solved thanks to effective coordination, as explained in previous works [24]. As a result, all language skills (listening, speaking, reading and writing) were involved in this type of multimedia presentation, although the cognitive load and division of attention was sometimes challenging due to immediacy, as expressed by the students.
As Figure 4 and Figure 5 illustrate, live online learning can become a very rich and complex experience from an interactionist perspective if used to its full potential, but it requires effective online class management and digital expertise. In this experiment, teacher talk time was kept to the minimum and the rubric provided the first week of class clearly stated that active participation, and not just ‘being online’ (the online presence), was a key factor in the assessment process, so students were highly encouraged to promote as well as be involved in oral and written communication. Furthermore, the two activities illustrating each method and designed by the participants made use of a wide array of tools (Nearpod, Educaplay, Quizziz, Mentimeter, Socrative, etc.), which contained different types of exercises (online quizzes, gap-filling, word rearranging, multiple choice, odd-one out, sentence translation, jigsaws, etc.) aimed to enhance peer-to-peer interaction.
The post-test results revealed an overall satisfaction with the TBLT methodology (infographics) and live online presentations, as shown in Table 3. The survey designed to measure the teacher candidates’ perception was based on a 5-point Likert scale (from 1 = strongly disagree to 5 = strongly agree), and included three reverse coded items (#6, #10, #11) to avoid acquiescence bias in self-reported scales. The items were associated with three different dimensions (enjoyment, relevance and intention), the data were analyzed through IBM SPSS Statistics 20, and the Cronbach’s alpha reliability was 0.868. The first six items of the scale related with enjoyment yielded positive results: shared enjoyment when presenting (#1 M = 4.24) and watching others’ projects (#3 M = 4.32), completing the online activities (#4 M = 4.17), using digital tools (#5 M = 4.27) and collaborative work (#2 M = 4.29).
Regarding relevance and in line with previous findings in Bicen et al. [46], students believed infographics can be used effectively for better illustration in SCMC (#7 M = 4.47), the online activities can help to enhance student participation and engagement (#8 M = 4.42) and improve the learning progress in live online sessions (#9 M = 4.36). In contrast, the participants did not think that the infographics and online activities could be distracting (#10 M = 2.29) or confusing (#11 M = 2.28), and expressed their interest in other classes with similar methods (#12 M = 3.92).
These findings are consistent with previous works [51] highlighting the positive impact that live online classes may have on students’ motivation and communicative competence if they are actively involved, but the relevance of this experiment is that the participants used technology in a transformative manner to design their own infographics on language teaching methods and to share their knowledge and skills with other classmates. As stated by the participants, they did not only learn new theoretical content, but they also acquired new knowledge and competence in digital tools and multimodal communication through the online project presentations.
The previous results were confirmed by the qualitative data obtained through the transcription of online class discussion and comments (Table 4). In line with previous research [11], some students (S7) highlighted the reduced language anxiety perceived when speaking online. Similarly and consistent with other works [9,10,52], the teacher candidates stressed the relevance of using infographics for its visual format (S12 and S21) and the increased participation thanks to the online digital tools with the activities prepared by their classmates (S81). In this sense, most students praised the novelty of combining different digitals tools in real time as opposed to traditional methodologies and materials, such as the overuse of PowerPoint (S21).
Critical thinking and creativity were also commended because of collaborative learning since ‘allowing students to express their creativity and personality can create community’, as expressed by Gacs et al. [53] (p. 9). However, the most cited affordance in live online presentations was enhanced interaction (S39 and S85), which was clearly viewed as a key factor for student engagement and satisfaction. A few students summarized the different benefits of combining TBLT with SCMC, such as the use of visual and concise information, interaction, engagement and shared enjoyment (S21 and S52), while others complained about the problems they had encountered in most live online classes during the COVID-19 pandemic (S77).

5. Conclusions

Live online learning has increasingly been in the spotlight over the past two years because of the recent educational needs due to the COVID-19 pandemic, and the scientific interest will likely grow in this enduring situation. The present research demonstrated that interaction and multimedia communication can be effectively enhanced in language learning through SCMC. Only one fifth of the 90 participants had some previous experience with infographics (TBLT) in live online presentations, which were predominantly based on a teacher–student interaction model. According to the participants, their online lessons relied excessively on traditional materials such as PowerPoint. Most language teacher candidates complained that their online classes basically mirrored the ordinary face-to-face setting and that a number of learning activities and materials had been poorly designed or thoughtlessly adapted and transferred from a traditional context to a digital environment.
The first conclusion to be drawn is that effective online learning may imply the use of different methods and materials as opposed to a face-to-face context. This fact seemed to be neglected for different reasons (immediacy and lack of readiness, lack of technical preparation and support, etc.) during the COVID-19 pandemic when some instructors essentially utilized the same materials in their virtual lessons, resulting in student disengagement as manifested by the research participants. In their opinion, this was partly due to the gap between students who are familiar with social technology and teachers with no experience in using such technology in the classroom, as already reported by Trinder [54].
Teaching physically and teaching virtually require different techniques and approaches, so it is necessary to adopt digitally oriented methodologies to enhance student interaction and engagement in the current situation, particularly with the ‘digital native’ generations [55]. In this experiment, the home-based participants proved their digital competence by creating their own infographics based on different language teaching methods and using technology in a transformative manner.
Regarding the first research question (RQ1), a TBLT methodology was effectively used encompassing different types of tasks (explaining, demonstrating, discussing) and critical thinking skills (understanding, analyzing, applying, evaluating, and creating) to enhance student interaction. The tasks, based on different modes (synchronous in live online sessions and asynchronous through Moodle activities), were specifically designed to enhance peer-to-peer interaction. As highlighted by González-Lloret [34], collaborative technology-mediated tasks can be effectively used to promote productive language output and the type of interaction that facilitates language learning but our research results also demonstrated that a task-based approach can be employed effectively to strengthen student creativity in live online learning. For this, the task-based approach should be carefully planned to distribute the pre- and post-tasks in different stages and reserve the live online lessons for peer-to-peer interaction.
Concerning the second research question (RQ2), the teacher candidates demonstrated their communicative competence through live online presentations (SCMC), which had been conveniently structured in three different parts (presentation, demonstration and discussion). They shared their infographics and activities, which had been designed with a wide array of digital tools, to involve their peers and prove their mastery in multimedia communication by effectively combining text content, video and different types of activities in real time. The online multimedia presentations required focused and sustained attention from the learners as the screen was conveniently divided into five frames, and each frame could integrate several modes (visual, oral, textual, gestural, etc.) and be used with different functions (texting, turn-taking, etc.). All participants needed to take on different roles and actively engage in the online presentations.
Team coordination was essential not only for content creation but also for presentation as the different team members needed to explain visually and orally as well as answer in a written form the questions or comments made by their peers through the chat box. For this reason, it was essential to train the participants initially in the different frames, roles and semiotic modes they were going to be exposed during the online lessons. As observed by some students, this was the first time they were explained the different online spaces (frames) and functions of each of them and the online roles they were going to adopt. This proves the need not only to adapt the methods and materials to the new digital environment but also to explain the new virtual space to all participants to take full advantage of it.
In relation to the third research question (RQ3), the post-test results evidenced a self-perceived positive attitude toward the integration of TBLT (infographics) in SCMC among participants. The statistical results scored high on shared enjoyment and relevance, as students enjoyed presenting as much as watching other students’ projects and they strongly believed that collaborative infographics could be effectively used in language learning to better illustrate their knowledge and ideas and to improve the learning progress. Similarly, they clearly advocated for the integration of multimedia activities based on different tools in the presentations to strengthen student participation in live online lessons.
Contrary to the findings reported by Famularsih [56] that the students felt bored in the online learning activities due to the lack of challenges as opposed to face-to-face meetings, the participants in this research declared they enjoyed creating as well as watching the infographics and completing the multimedia activities. This may be due to the fact that students were given the (active) role of content creators rather than receivers (passive) and were motivated to share the results with their peers through online presentations.
Qualitative data confirmed these results as the teacher candidates openly discussed the problems they commonly encountered in most live online lessons during the COVID-19 pandemic, particularly the lack of peer-to-peer interaction that resulted in a high risk of distraction and disengagement. As expressed by some participants, technology was mostly integrated in their online classes just for substitution, essentially content delivery, and not for modification and redefinition with the aim to promote creativity and higher order thinking skills, as highlighted in other works [57].
Although the present results may be limited to the context and research participants, some findings are consistent with those of previous works in different settings [58,59]. The major limitations were initially related with the participants’ lack of experience in online group presentations combining different digital tools and being simultaneously exposed to different semiotic modes (oral, aural, text). As observed by some students, it was not common to find such a number and variety of interactions taking place at the same time, as most online classes adopted a more traditional method where the instructor explained the lesson while the students were supposed to listen and occasionally ask questions (oral or written) in a sequential manner. In this experiment, all participants played different roles, which demanded focused and sustained attention (speaking, listening, chatting or completing multimedia activities).
Given the rapid expansion and availability of technology worldwide and the need to be prepared for an unforeseeable context in the future, further research is needed on multitask-based learning and teaching (MTBL), student interaction (motivation, engagement) and pre- and in-service teacher readiness (digital and pedagogical competence) in live online learning, particularly from a constructivist approach. Finally, multimedia studies should also focus on synchronous computer-mediated communication and analyze the specific issued related with this virtual environment (visual, aural, gestural, etc.)

Funding

This research received no external funding.

Institutional Review Board Statement

Ethical review and approval were waived for this study, due to the informed consent obtained from all participants. The research procedure followed the instructions provided by the Ethical Review Board of the University of Alicante available on its website https://bit.ly/3F2MW4L, accessed on 9 October 2021.

Informed Consent Statement

Informed consent was obtained from all subjects involved in the study.

Data Availability Statement

The data presented in this study are available on request from the corresponding author. The data are not publicly available due to personal information obtained from participants (names, email accounts, images).

Conflicts of Interest

The author declares no conflict of interest.

Appendix A

  • Pre-test
    • Section 1 (Socio-demographic and technology ownership).
      • Gender: Male/Female/Other
      • Age: 20–29/30–39/40–49/50+
      • Personal electronic devices you have: PC or Mac/laptop/tablet/smartphone
    • Section 2 (previous experience with live online presentations).
      As a student, how often have you done the following activities in your ONLINE classes over the last year during the COVID-19 pandemic.
      Choices: Never/Rarely/Sometimes/Often/Always
      • Online presentations (individual)
      • Online presentations (in a team or group)
      • Online presentations for lesson delivery (no content creation)
      • Online presentations for demonstration (project design)
      • Online presentations using text-based files (pdf, word, etc.)
      • Online presentations using ppt files (PowerPoint, Prezzi, etc.)
      • Online presentations using posters and/or images you created
      • Online presentations without interaction (just the presentation)
      • Online presentation and teacher-student interaction (questions and answers)
      • Online presentation and peer-to-per interaction (questions, debates, activities, games, etc.)
    • Section 3 (previous experience with infographics).
      Choices: Yes/No
      • Have you ever created an infographic in other classes?
      • Have you ever created an infographic collaboratively (in teams)?
      • Have you ever created a digital infographic in English?
      • Have you ever used an infographic to present in English?
      • Have you ever used an infographic for an online presentation in English?
  • Post-test
    • Section 1 (tools used to design and create your infographics and multimedia activities, you can tick several or add new ones).
      Canva/Piktochart/Easel/Genial.ly/Pinterest/Glogster/Pdf (Adobe)/Crello/Snappa/Visme/other
      Socrative/Kahoot/Nearpod/Quizizz/Quizalize/Quizlet/Mentimeter/Padlet/other
      Section 2 (perception of the infographics and online presentations).
      Rate from 1 to 5 your level of agreement with the following statements about online presentations. Read carefully the statements before you answer.
      Choices: 1 (strongly disagree), 2 (disagree), 3 (neither agree nor disagree), 4 (agree), 5 (completely agree)
      • I enjoyed sharing online our poster and presentation with the rest of the class
      • I enjoyed working online with my team and preparing the infographics for the presentation
      • I enjoyed watching the posters of other teams and listening to my classmates
      • I enjoyed completing the online activities and exercises based on language methods prepared by my classmates
      • I enjoyed using different digital tools (Kahoot, Quizizz, Nearpod, etc.) to illustrate and complete the online activities based on a language method
      • I felt sometimes bored with the online activities and exercises about language methods prepared by my classmates
      • I think using infographics can help to better illustrate a lesson in live online sessions
      • I think using online activities and exercises based on different digital tools (Kahoot, Nearpod, etc.) can help to promote student participation and engagement in live online sessions
      • I think doing online activities and exercises after the presentations can be distracting
      • I believe using different digital tools (Canva, Kahoot, Nearpod, etc.) can improve the student learning progress in online sessions
      • I felt sometimes confused with the poster information or digital activities about teaching language methods during the online presentations
      • I would like other classes to include more student presentations and digital activities in the online sessions
    • Dimensions: Enjoyment (1–6), Relevance (7–11), Intention (12)
    • Reverse-coded items to avoid acquiescence bias: items 6, 9 and 11.
  • Semi-structured questions (online discussion)
    • What advantages and disadvantages can you mention about doing an online presentation using infographics?
    • What aspects did you enjoy the most and the least about the infographics presented by the other teams?
    • What were the main problems you experienced when creating your collaborative infographics (team coordination, technology, etc.)?
    • How different was your experience with the online group presentations as opposed to a traditional face-to-face environment?

References

  1. Kohnke, L.; Moorhouse, B.L. Facilitating Synchronous Online Language Learning through Zoom. RELC J. 2020. [Google Scholar] [CrossRef]
  2. Gruber, A.; Bauer, E. Fostering Interaction in Synchronous Online Class Sessions with Foreign Language Learners. In Teaching, Technology, and Teacher Education during the COVID-19 Pandemic: Stories from the Field; Ferdig, R.E., Baumgartner, E., Hartshorne, R., Kaplan-Rakowski, R., Mouza, C., Eds.; AACE: Waynesville, NC, USA, 2020; pp. 175–178. [Google Scholar]
  3. Camilleri, M.A. Evaluating service quality and performance of higher education institutions: A systematic review and a post-COVID-19 outlook. Int. J. Qual. Serv. Sci. 2021, 13, 268–281. [Google Scholar] [CrossRef]
  4. Martin, F.; Ahlgrim-Delzell, L.; Budhrani, K. Systematic Review of Two Decades (1995 to 2014) of Research on Synchronous Online Learning. Am. J. Distance Educ. 2017, 31, 3–19. [Google Scholar] [CrossRef]
  5. Martin, F.; Sun, T.; Westine, C.D. A systematic review of research on online teaching and learning from 2009 to 2018. Comput. Educ. 2020, 159, 104009. [Google Scholar] [CrossRef] [PubMed]
  6. Zeng, G. Collaborative dialogue in synchronous computer-mediated communication and face-to-face communication. Recall 2017, 29, 257–275. [Google Scholar] [CrossRef]
  7. Kung, W.-T.; Eslami, Z.R. Focus-on-Form and L2 learning in Synchronous Computer-Mediated Communication: Language Proficiency and Dyadic Types. In Handbook of Research on Integrating Technology into Contemporary Language Learning and Teaching; IGI Global: Hershey, PA, USA, 2018; pp. 118–139. [Google Scholar]
  8. Sotillo, S.M. Discourse Functions and Syntactic Complexity in Synchronous and Asyncronous Communication. Lang. Learn. Technol. 2000, 4, 77–110. [Google Scholar]
  9. Warschauer, M. Motivational Aspects of Using Computers for Writing and Communication. In Telecollaboration in Foreign Language Learning; University of Hawaii Press: Honolulu, HI, USA, 1996; pp. 29–46. [Google Scholar]
  10. Ziegler, N. Synchronous Computer-Mediated Communication and Interaction. Stud. Second Lang. Acquis. 2016, 38, 553–586. [Google Scholar] [CrossRef]
  11. Rassaei, E. Computer-mediated text-based and audio-based corrective feedback, perceptual style and L2 development. System 2019, 82, 97–110. [Google Scholar] [CrossRef]
  12. Thomas, W.R.; MacGregor, S.K. Online Project-Based Learning: How Collaborative Strategies and Problem Solving Processes Impact Performance. J. Interact. Learn. Res. 2005, 16, 83–107. [Google Scholar]
  13. Taghizadeh, M.; Basirat, M. EFL Instructors’ Perceptions of Computer-Mediated Communication in Language Classes. In Proceedings of the 13th Annual Conference on Electronic Learning and Teaching, Toosi University of Technology, Tehran, Iran; Available online: https://civilica.com/doc/867239 (accessed on 9 October 2021).
  14. Kim, H.Y. Learning opportunities in synchronous computer-mediated communication and face-to-face interaction. Comput. Assist. Lang. Learn. 2012, 27, 26–43. [Google Scholar] [CrossRef]
  15. Atmojo, A.E.P.; Nugroho, A. EFL Classes Must Go Online! Teaching Activities and Challenges during COVID-19 Pandemic in Indonesia. Regist. J. 2020, 13, 49–76. [Google Scholar] [CrossRef]
  16. Zou, C.; Li, P.; Jin, L. Online college English education in Wuhan against the COVID-19 pandemic: Student and teacher readiness, challenges and implications. PLoS ONE 2021, 16, e0258137. [Google Scholar] [CrossRef] [PubMed]
  17. Hung, Y.-W.; Higgins, S. Learners’ use of communication strategies in text-based and video-based synchronous computer-mediated communication environments: Opportunities for language learning. Comput. Assist. Lang. Learn. 2015, 29, 901–924. [Google Scholar] [CrossRef] [Green Version]
  18. Smith, B. The Relationship between Negotiated Interaction, Learner Uptake, and Lexical Acquisition in Task-Based Computer-Mediated Communication. TESOL Q. 2005, 39, 33. [Google Scholar] [CrossRef]
  19. Stockwell, G. Effects of Multimodality in Computer-Mediated Communication Tasks. In Task-Based Language Teaching and Technology; Thomas, M., Reinders, H., Eds.; Continuums Books: Bloomburg, TX, USA, 2010; pp. 83–104. [Google Scholar]
  20. Gass, S.M.; Mackey, A. Input, interaction, and output in second language acquisition. In Theories in Second Language Acquisition; Williams, J., Ed.; Routledge: Oxford, UK, 2014; pp. 194–220. [Google Scholar]
  21. Mackey, A.; Sachs, R. Older Learners in SLA Research: A First Look at Working Memory, Feedback, and L2 Development. Lang. Learn. 2012, 62, 704–740. [Google Scholar] [CrossRef]
  22. Berglund, T. Örnberg Multimodal student interaction online: An ecological perspective. Recall 2009, 21, 186–205. [Google Scholar] [CrossRef]
  23. Rapanta, C.; Botturi, L.; Goodyear, P.; Guàrdia, L.; Koole, M. Online University Teaching During and After the COVID-19 Crisis: Refocusing Teacher Presence and Learning Activity. Postdigital Sci. Educ. 2020, 2, 923–945. [Google Scholar] [CrossRef]
  24. Junn, H. L2 communicative competence analysis via synchronous computer-mediated communication (SCMC) as an alternative to formal classrooms. Innov. Lang. Learn. Teach. 2021, 1, 1–17. [Google Scholar] [CrossRef]
  25. Perez, L.C. Foreign Language Productivity in Synchronous Versus Asynchronous Computer-mediated Communication. CALICO J. 2004, 21, 89–104. [Google Scholar] [CrossRef] [Green Version]
  26. AbuSeileek, A.F.; Qatawneh, K. Effects of synchronous and asynchronous computer-mediated communication (CMC) oral conversations on English language learners’ discourse functions. Comput. Educ. 2013, 62, 181–190. [Google Scholar] [CrossRef]
  27. Ajabshir, Z.F. The effect of synchronous and asynchronous computer-mediated communication (CMC) on EFL learners’ pragmatic competence. Comput. Hum. Behav. 2019, 92, 169–177. [Google Scholar] [CrossRef]
  28. Bailey, D.; Almusharraf, N.; Hatcher, R. Finding satisfaction: Intrinsic motivation for synchronous and asynchronous communication in the online language learning context. Educ. Inf. Technol. 2021, 26, 2563–2583. [Google Scholar] [CrossRef] [PubMed]
  29. Eigege, C.Y.; Kennedy, P.P. Disruptions, distractions, and discoveries: Doctoral students’ reflections on a pandemic. Qual. Soc. Work. Res. Pract. 2021, 20, 618–624. [Google Scholar] [CrossRef] [PubMed]
  30. Samuda, V.; Bygate, M. Tasks in Second Language Learning; Palgrave Macmillan: London, UK, 2008. [Google Scholar]
  31. Yuan, F.; Willis, J. A Framework for Task-Based Learning. TESOL Q. 1999, 33, 157. [Google Scholar] [CrossRef] [Green Version]
  32. Research on the Use of Technology in Task-Based Language Teaching. In Task-Based Language Teaching and Technology; Thomas, M.; Reinders, H. (Eds.) Continuums Books: Bloomburg, TX, USA, 2014; pp. 17–40. [Google Scholar] [CrossRef]
  33. Yanguas, Í. Task-based Oral Computer-mediated Communication and L2 Vocabulary Acquisition. CALICO J. 2012, 29, 507–531. [Google Scholar] [CrossRef]
  34. González-Lloret, M. Technology for Task-based Language Teaching. In The Handbook of Technology and Second Language Teaching and Learning; John Wiley & Sons: Hoboken, NJ, USA, 2017; pp. 234–247. [Google Scholar] [CrossRef] [Green Version]
  35. Yanguas, I.; Bergin, T. Focus on Form in Task-Based L2 Oral Computer-Mediated Communication. Lang. Learn. Technol. 2018, 22, 65–81. [Google Scholar]
  36. Tang, X. Task-based interactional sequences in different modalities. Appl. Pragmat. 2020, 2, 174–198. [Google Scholar] [CrossRef]
  37. Thomas, M.; Reinders, H. Task-Based Language Learning and Teaching with Technology; A&C Black: London, UK, 2010; ISBN 1-4411-0153-5. [Google Scholar]
  38. Hampel, R. Rethinking task design for the digital age: A framework for language teaching and learning in a synchronous online environment. Recall 2006, 18, 105–121. [Google Scholar] [CrossRef] [Green Version]
  39. Pazilah, F.N.; Hashim, H. Using infographics as a technology-based tool to develop 21st century skills in an ESL context. J. Educ. Learn. Stud. 2018, 1, 35. [Google Scholar] [CrossRef]
  40. Ibrahim, T.; Maharaj, A. The Impact of Infographics on Language Learning. Int. J. Comput. Sci. Netw. Secur. 2019, 19, 47–60. [Google Scholar]
  41. Cupita, L.A.L.; Franco, L.M.P. The Use of Infographics to Enhance Reading Comprehension Skills among Learners. Colomb. Appl. Linguist. J. 2019, 21, 230–242. [Google Scholar] [CrossRef]
  42. Maamuujav, U.; Krishnan, J.; Collins, P. The utility of infographics in L2 writing classes: A practical strategy to scaffold writing development. TESOL J. 2020, 11. [Google Scholar] [CrossRef]
  43. Rezaei, N.; Sayadian, S. The Impact of Infographics on Iranian EFL Learners’ Grammar Learning. J. Appl. Linguist. Lang. Res. 2015, 2, 78–85. [Google Scholar]
  44. Alrajhi, A.S. Static infographics effects on the receptive knowledge of idiomatic expressions. Indones. J. Appl. Linguist. 2020, 10, 315–326. [Google Scholar] [CrossRef]
  45. Dahmash, A.B.; Al-Hamid, A.; Alrajhi, M. Using Infographics in the Teaching of Linguistics. Arab. World Engl. J. 2007, 8. Available online: https://ssrn.com/abstract=3094545 (accessed on 9 October 2021). [CrossRef] [Green Version]
  46. Bicen, H.; Beheshti, M. Assessing perceptions and evaluating achievements of ESL students with the usage of infographics in a flipped classroom learning environment. Interact. Learn. Environ. 2019, 27, 1–29. [Google Scholar] [CrossRef]
  47. Dewantari, F.; Utami, I.G.A.L.P.; Santosa, M.H. Infographics and independent learning for English learning in the secondary level context. J. Engl. Foreign Lang. 2021, 11, 250–274. [Google Scholar] [CrossRef]
  48. Warschauer, M. The paradoxical future of digital learning. Learn. Inq. 2007, 1, 41–49. [Google Scholar] [CrossRef]
  49. Graham, C.R.; Misanchuk, M. Computer-mediated learning groups: Benefits and challenges to using groupwork in online learning environments. In Online Collaborative Learning: Theory and Practice; IGI Global: Hershey, PA, USA, 2004; pp. 181–202. [Google Scholar]
  50. Celce-Murcia, M.; McIntosh, L. Teaching English as a Second or Foreign Language; Heinle & Heinle: Boston, MA, USA, 1991. [Google Scholar]
  51. Vurdien, R. Videoconferencing: Developing Students’ Communicative Competence. J. Foreign Lang. Educ. Technol. 2019, 4, 269–298. [Google Scholar]
  52. Côté, S.; Gaffney, C. The effect of synchronous computer-mediated communication on beginner L2 learners’ foreign language anxiety and participation. Lang. Learn. J. 2021, 49, 105–116. [Google Scholar] [CrossRef]
  53. Gacs, A.; Goertler, S.; Spasova, S. Planned online language education versus crisis-prompted online language teaching: Lessons for the future. Foreign Lang. Ann. 2020, 53, 380–392. [Google Scholar] [CrossRef]
  54. Trinder, R. Blending technology and face-to-face: Advanced students’ choices. Recall 2016, 28, 83–102. [Google Scholar] [CrossRef]
  55. Prensky, M. Digital Natives, Digital Immigrants Part 2: Do They Really Think Differently? Horizon 2001, 9, 1–6. [Google Scholar] [CrossRef]
  56. Famularsih, S. Students’ Experiences in Using Online Learning Applications Due to COVID-19 in English Classroom. Stud. Learn. Teach. 2020, 1, 112–121. [Google Scholar] [CrossRef]
  57. Hamilton, E.R.; Rosenberg, J.M.; Akcaoglu, M. The Substitution Augmentation Modification Redefinition (SAMR) Model: A Critical Review and Suggestions for its Use. TechTrends 2016, 60, 433–441. [Google Scholar] [CrossRef]
  58. Ylirisku, S.; Jang, G.; Sawhney, N. Re-Thinking Pedagogy and Dis-Embodied Interaction for Online Learning and Co-Design. Language 2021, 9, 10. [Google Scholar]
  59. Tang, Y.M.; Chen, P.C.; Law, K.M.; Wu, C.; Lau, Y.-Y.; Guan, J.; He, D.; Ho, G. Comparative analysis of Student’s live online learning readiness during the coronavirus (COVID-19) pandemic in the higher education sector. Comput. Educ. 2021, 168, 104211. [Google Scholar] [CrossRef]
Figure 1. TBLT cycle (8 two-hour sessions distributed over 4 weeks).
Education 11 00723 g001
Figure 2. Infographics about language teaching methods.
Education 11 00723 g002
Figure 3. Tasks and critical thinking skills involved in the live online presentations.
Education 11 00723 g003
Figure 4. Live online presentation through Google Meet.
Education 11 00723 g004
Figure 5. Frame sections of the screen in live online sessions through Google Meet.
Education 11 00723 g005
Table 1. Previous experience with infographics.
N = 90YESNO
#1. Have you ever created an infographic?18.3%81.7%
#2. Have you ever created an infographic collaboratively?12.9%87.1%
#3. Have you ever created an infographic in English?8.6%91.4%
#4. Have you used your own infographic to present in English?6.5%93.5%
#5. Have you used your own infographic to present online in English?4.3%95.7%
Table 2. Previous experience with online presentations.
N = 90, Alpha’s Cronbach = 0.801MeanSDKurtosis
#1. Online presentations (individual)3.761.104−0.601
#2. Online presentations (team or collaborative)2.200.940−0.653
#3. Online presentations for lesson delivery (no content creation)2.631.156−0.565
#4. Online presentations for project demonstration (project design)2.641.301−1.093
#5. Online presentations using mostly text-based files (pdf, etc.)2.501.318−0.999
#6. Online presentations using PPT files or similar (Prezzi, etc.)4.090.907−0.398
#7. Online presentations using posters and/or images2.071.225−0.424
#8. Online presentations with little or no interaction (just the presentation)2.441.191−0.731
#9. Online presentation with teacher–student interaction (questions and answers)3.431.142−0.464
#10. Online presentation with student–student (–teacher) interaction (discussion, questions, etc.)2.431.112−0.771
Frequency: 1 (never), 2 (rarely), 3 (sometimes), 4 (often), 5 (very often).
Table 3. Perception of student presentations and online interaction.
N = 90, Cronbach’s Alpha = 0.868MeanSD
1I enjoyed sharing online our poster and presentation with the rest of the class4.240.903
2I enjoyed working online with my team and preparing the infographics for the presentation4.290.851
3I enjoyed watching the posters of other teams and listening to my classmates4.320.832
4I enjoyed completing the online activities and exercises based on language methods prepared by my classmates4.170.811
5I enjoyed using different digital tools (Educaplay, Quizziz, Nearpod, etc.) to illustrate and complete the online activities based on a language method4.270.832
6I felt sometimes bored with the online activities and exercises about language methods prepared by my classmates2.421.112
7I think using infographics can help to better illustrate a lesson in live online sessions4.470.810
8I think using online activities and exercises based on different digital tools (Kahoot, Nearpod, etc.) can help to promote student participation and engagement in live online sessions4.420.821
9I believe using different digital tools (Canva, Kahoot, Nearpod, etc.) can improve the student learning progress in live online sessions4.360.754
10I think doing live online activities and exercises after the presentations can be distracting2.291.343
11I felt sometimes confused with the poster information or digital activities about teaching language methods during the online presentations2.281.050
12I would like other classes to include more student presentations and digital activities in live online sessions3.920.986
(1 = strongly disagree to 5 = strongly agree).
Table 4. Transcription of some student comments.
N = 90, Online Discussion
S7In this class I felt a welcoming environment and I was more or less relaxed when doing my presentation
S12I quite liked the fact of creating infographics, it is a different way of showing the theoretical information we have learned […] all of them were visual and interesting
S21I usually do not really like oral presentations, because I think that spending several classes in a row doing the same can sometimes be boring, but in this class, my opinion on this aspect changed completely. It showed me that oral presentations can be easily understood, fun, engaging, dynamic and interactive. I would say that the fact that the infographics were visual and concise helped a lot, because we are used to seeing PowerPoint with no images at all and with a lot of written information, which is not visually appealing
S31I really enjoyed preparing ours in another format. We are only used to doing PowerPoints and it feels repetitive. I was definitely challenging to do an infographic because it was our first time but I really liked it
S39Honestly, they are the most interactive presentations I have ever seen and done in university
S52I enjoyed my classmates’ presentations and the method we used (the infographics) is a fun way to learn and be creative at the same time
S61I believe it is a good idea to create digital activities, since it is a way of engaging students in the presentation and to make sure that they were paying attention.
S31I really enjoyed preparing ours in another format. We are only used to doing PowerPoints and it feels repetitive. I was definitely challenging to do an infographic because it was our first time but I really liked it
S77[…] teachers think that if we only focus on the lesson we need to teach to the rest of the class, then the rest are going to listen and not be distracted by anything. We need everything to be more interactive, not just listen and copy everything down
S81all these new digital tools make very interesting for me to create the presentation and to pay attention to the rest of works
S85I think these presentations are great for participating and it’s a better way to learn new information
Publisher’s Note: MDPI stays neutral with regard to jurisdictional claims in published maps and institutional affiliations.

