
A Visual Approach for Solving Problems with Fractions


1
Department of Education and Teacher Training, Instituto Politécnico de Viana do Castelo, 4900-347 Viana do Castelo, Portugal
2
CIEC, Instituto de Educação, Universidade do Minho, 4704-553 Braga, Portugal
*
Author to whom correspondence should be addressed.
Educ. Sci. 2021, 11(11), 727; https://0-doi-org.brum.beds.ac.uk/10.3390/educsci11110727
Submission received: 21 October 2021
/
Revised: 3 November 2021
/
Accepted: 9 November 2021
/
Published: 12 November 2021
(This article belongs to the Section Teacher Education)
Abstract
:This article discusses the importance of visual models in problem solving, in the scope of rational numbers. We seek to highlight the potential of this approach, as a structuring theme in the mathematical development of students in elementary education and the connections it allows to establish. In order for students to be mathematically competent and creative, they must be able not only to solve traditional computational problems but also to use models/visual representations when solving all types of mathematical problems, including those in which the visual component is not evident. We developed a qualitative study based on a didactical experience involving 14 future teachers who were attending a Didactics of Mathematics unit course that included a module about problem solving with emphasizes in visual approaches. The main purpose of the study was to identify the strategies used by the future teachers when solving problems with multiple solutions, before and after that module. Data was collected through observation and the written productions of the participants. It was possible to conclude that they tended to privilege analytical approaches before the intervention and, after the teaching experience, they started to value visual approaches, which generated an increase of the productions involving this type of solutions.
1. Introduction
Rational numbers are considered a structural issue in mathematics elementary education, but it is also true that the underlying concepts are considered as highly complex, partly due to the different interpretations and representations associated to those numbers. Although many students reveal procedural knowledge (knowledge of symbols, rules, algorithms, and sequences of actions that are useful for solving a situation), usually the conceptual knowledge (knowledge of concepts and principles and their relationships) remains deficient, an aspect that becomes noticeable when they solve problems involving rational numbers. A possible explanation for this situation could be the teaching practices, in the cases that teachers focus more on teaching procedures and not so much on their meaning [1]. To overcome this situation, students should be able to solve problems using a diversity of strategies, including visual ones, as an important support in solving all types of mathematical problems. According to some authors [2,3], visual representations are often part of strategies that originate powerful and creative solutions. However, despite several recommendations that underline the power of visual approaches, the fact is that they are still not common in students’ mathematical experiences and obviously in teachers’ practices. Therefore, our vision of problem solving includes, among other aspects, the practice with a wide range of problems in which different ways of thinking, including various representations, and different strategies for solving them can be applied. Solving a problem in different ways requires and develops the knowledge and the flexibility of mathematical thinking, also contributing to the development of each student’s creativity. Among this set of strategies, we highlight a particular problem solving strategy, which we call seeing [4], that leads to visual solutions, using different visual representations, in contrast to non-visual solutions, which resort mainly to algebraic, numerical, and verbal representations.
Taking these assumptions into account, in this article, we discuss the main ideas related to rational numbers, problem solving, and visual solutions that support our study, carried out with elementary education pre-service teachers (6–12 years old). The main purpose of the study was to analyze how pre-service teachers solve problems with multiple solutions in the scope of rational numbers before and after a module about problem solving that emphasizes visual approaches. Based on this problem, we formulated two research questions: (1) Which strategies do the pre-service teachers use before and after the module? (2) Is there a change in the strategy preference after the module?
2. Visual Approaches to Problem Solving
Mathematical concepts are, in essence, abstract, and it is necessary to use higher-order cognitive skills to internalize them. However, the use of representations may facilitate the understanding of these concepts, making them more concrete and clearer. Mathematical representations are considered useful tools that support reasoning, allow mathematical communication, and convey mathematical thinking. They can be defined as mental or physical constructs that describe aspects of the structure inherent in a concept and the interrelationship between this and other ideas [5]. Overall, students’ understanding of a given concept increases when they have the opportunity to contact multiple representations of the same idea. An approach based on the use of representations of different natures is quite powerful and enhances the development of flexibility of thought, a fundamental characteristic of a good problem solver [6,7]. This flexibility is also important for (future) teachers, as it allows them to sustain more in-depth learning, to conduct classroom discussions with a wider perspective to a diversity of paths, and is a way to facilitate abstraction and generalization, as students develop their ability to mathematize the situations explored.
Bruner [8] identified three different forms of representing the world around us: (a) active (presupposes a set of actions to achieve a certain result using manipulatives or other types of objects); (b) iconic (involves visual images that symbolize a concept), and (c) symbolic (involves a set of logical or symbolic propositions taken from a symbolic system governed by rules or laws that form and transform propositions). These three forms of representation are not only different ways of reasoning, or different work contexts, but they also stress the importance of encouraging students to interrelate the physical component with the creation of images and, in turn, this form with the symbolic. There are proposals for other categorizations in the literature that emerge from an extension of the model presented by Bruner. For example, some authors [5,9,10] defend a model consisting of five forms of representation associated with the learning of mathematics and problem solving: (a) contextual (highlights real-life situations); (b) concrete (uses manipulatives/objects); (c) semi-concrete (pictorial); (d) verbal (use of language), and (e) symbolic (mathematical notation). This classification helps differentiate the various forms that a mathematical concept can assume, but it also gives indications about the abilities needed for its understanding.
Following these ideas, the importance of figurative or visual contexts arises, associated with concrete and semi-concrete representations, with an indisputable relevance in all mathematical activity. A visual image translates much of the information related to a given situation, which allows us to understand and/or explain a concept more quickly than with a sequence of words [11]. The visual characteristics of a task can help students to overcome some difficulties they may have with specific mathematical concepts and procedures, successfully solving a certain problem. To reinforce this idea, it can also be said that the 21st-century school must prepare students for a global society, governed by forms of communication with great visual impact. It is, therefore, fundamental that students develop the ability to read and interpret information visually, aspects that have great potential in the learning of mathematics and, in particular, in problem solving. In the perspective of some authors [3], for students to be mathematically competent and creative, they must be able to use visual and intuitive representations at all stages of the problem solving process. Visual representations can help reduce the cognitive burden in problem solving and also support numerical reasoning [12,13]. That is, they help students understand the concepts and procedures, make sense of the problems they solve, as well as facilitate the discussion with their peers [6]. In addition, this type of representation can help highlight relevant information that might otherwise be more difficult to identify and even create a scaffold for algebraic reasoning, facilitating the establishment of connections between concrete and symbolic representations. It has been verified that this type of representation allows students to establish the bridge between concrete objects, which they can use to model concepts, and the symbolic or verbal forms, which they later use to refer to these concepts [7].
Not all students have the same preferences when it comes to learning mathematics. This is reflected, for example, in the preference for the different themes they are studying, from numbers to geometry, in the way they understand these themes and solve the respective problems, privileging words, formulas, or figures. Thus, teachers have to consider that students may have different learning styles and that they may also have different preferences in relation to mathematical communication, which has an effect on the representations used. Emphasizing this perspective, psychologists and mathematical educators [3,14] were concerned with categorizing the typology of problem solving strategies used by students, according to their learning styles: (1) visual or geometric—those who prefer to use pictorial-visual schemes even when problems are more easily solved with analytical tools; (2) non-visual, analytical, or verbal—those who prefer more verbal approaches, even in problems that are relatively simpler to solve through a visual approach, and (3) mixed, integrating, or harmonics—those who have no specific preference for either logical-verbal or visual-pictorial thinking, and tend to combine analytical and visual approaches. These styles are of great importance in the way that each student processes the information that is provided.
If the teacher chooses a single form of communication, privileging a particular type of representation, they may be creating difficulties in the understanding of mathematical ideas for some students [11]. There are a number of problems that have great potential for visual solutions, so, for these cases, we propose the use of a complementary and specific strategy that we call seeing. This thinking strategy involves the visual perception of mathematical objects combined with knowledge and past experiences. In addition, seeing includes imagining, which is related to having creative insights or aha! moments, which can be expressed in terms of drawing, which means translating someone’s ideas visually. In problem solving, this strategy, which uses visual representations, is usually complemented with numerical and verbal explanations [4]. Thus, visual solutions are understood as the way in which mathematical information is presented and/or processed in the initial approach or during problem solving. They include the use of different representations of visual nature (e.g., figures, drawings, diagrams, graphs) as an essential part of the process of reaching the solution. On the contrary, non-visual solutions do not depend on visual representations as an essential part to achieve a solution, using other types of representations, such as numerical, algebraic, and verbal [3,4].
3. Problem Solving and Rational Numbers
3.1. Discussing the Concept of Rational Number
There is a great consensus in accepting the idea that learning rational numbers is difficult for students. Many studies state that, globally, poor performance is shown in calculating and solving problems with rational numbers, which can translate into difficulties in using fractions also in other content areas, particularly in algebra [15,16]. This scenario may be surprising if we think that, in terms of rational numbers, curricula cover procedural and computational skills. However, it may also indicate that there is a greater emphasis on acquiring procedural than conceptual knowledge [17]. It is noteworthy that the concepts associated with this domain are extremely important in different aspects: from a practical point of view, the ability to deal effectively with these concepts also improves the ability to solve everyday problems; from the point of view of psychology, rational numbers are a fertile area in which students can develop and expand the mental structures necessary for their intellectual development, and from a mathematical perspective, knowledge of rational numbers provides the basis for the construction of elementary algebraic operations, with relational reasoning with fractions being a vehicle for improving algebraic reasoning [17]. For all these reasons, it is important not only to understand the difficulties experienced by the students but also to find out what kind of experiences will be more favorable to the learning of these concepts.
Rational numbers can be presented in different ways (e.g., fractions, decimals, percentages), have different interpretations, and different forms of representation can be chosen (e.g., figures, diagrams, number lines, symbols). Although these forms and modes of representation are apparently well defined, their use is still a dubious aspect for teachers and students. Considering the different forms assumed by rational numbers, there is some inconsistency in the understanding of its most common representation: fractions. The rational number as a fraction is the most used, but it is a multifaceted concept, a fact that underlies many of the difficulties experienced by students. Fractions represent both a symbolic and a conceptual challenge. Symbolically they exhibit a split structure with a separate numerator and denominator, instead of a unit symbol, and are the only type of numbers that represent, at the same time, the ideas of quantity and division. In addition, it is possible to find in the literature several categorizations of different situations in which fractions can be found. Kieren [18] was one of the first researchers to present a proposal with four interrelated categories: ratio, operator, quotient, and measure. Fraction as a ratio expresses the notion of comparison between two quantities. In the case of the fraction from the operator’s perspective, it is understood as a function applied to an object, a number, or a set. The quotient refers to the result of an operation. In the measurement category, fractions are associated with two interrelated notions. First, they are considered as numbers, which indicate the magnitude of the fractions. Second, they are associated with the measurement of an interval. According to this author, the idea of part-whole is implicit in these four categories. For this reason, they did not consider it as a fifth category.
In this context, we emphasize that, for students to understand the concept of rational number as a fraction in a meaningful and comprehensive way, they must contact with tasks that involve the various meanings it can assume [16,18]. The proposal of problematic situations that highlight only one or some of the possible meanings, as often happens with the understanding of fraction as a synonym for part-whole, may leave students with an impoverished notion of rational number [16]. Therefore, the goal in teaching fractions is to help students recognize distinctions in meanings, to associate each meaning with appropriate situations and operations, and, in general, to develop insight and flexibility in the use of rational numbers [19].
3.2. Visual Strategies for Solving Problems with Fractions
As already mentioned, rational numbers can be represented in several ways, which include visual (e.g., drawings, diagrams, figures, graphs), verbal (natural language), and symbolic (numbers, letters) representations. In the case of fractions, it means that students must explore a variety of contexts, representations, and tasks, such as drawing figures, paper cutting/folding, manipulating sets of objects, identifying fractions, locating fractions on a number line. The use of manipulative materials (active representations) in the teaching of fractions can help the development of strategies to apply in processes, such as comparing, finding equivalences, and performing operations, but it is important to emphasize that a connection must be established with symbolic representations. In the perspective of Van den Heuvel-Panhuizen [20], as well as in our understanding, models are seen as representations of problematic situations; that is, visual representations model the way students conceptualize fractions. In this sense, the models commonly used to represent fractions at the most elementary levels of education vary between discrete and continuous, taking the form of geometric regions, sets of objects (discrete context), or even the number line. For example, discrete models (e.g., chips) may be more suitable to illustrate part-whole situations, whereas area representations (e.g., circles, rectangles) can help to perceive the denominator’s role in the magnitude of the fraction [21]. In the latter case, we must say that the interpretation of situations involving geometric regions presupposes a knowledge of the notion of area, and some studies have identified the existence of a positive relationship between students’ success in tasks with areas and success in tasks about fractions represented by geometric regions [22]. Still within the scope of area models, according to some authors, circular models, as well as rectangular ones, are one of the most powerful representations since the circle/rectangle naturally symbolizes the unit, in continuous contexts, simultaneously illustrating the concept of part-whole and the meaning of the relative magnitude of the fractions [21]. Siegler, Thompson, and Schneider [23] argued that the number line is a representation with enormous potential because it helps to support an integrated model that associates fractions to real numbers. However, it is necessary to keep in mind that this model helps students in the construction of a richer fraction design, without being dependent on the perspective typically associated with the area model, identifying the number of painted areas in the total number of parts, being able, in addition to the number line, to use, for example, the folding of paper strips or the rectangle model. As can be seen, there is plenty of evidence that points to the effectiveness of using visual representations in tasks with fractions [21], but none by itself reflects the multiplicity of ideas that constitute the concept of fraction, being fundamental to establishing connections among them.
The so-called bar (rectangular) model has been gaining visibility since its introduction in the Singapore mathematics curriculum in the 1980s. This model is used to facilitate the solution of numerical or algebraic problems involving fractions, integers, ratios, and percentages [24]. In practical terms, rectangles are used to represent quantities or to relate quantities extracted from a “word problem”, which will help students decide which operations to use and understand why they are applied [25]. It constitutes a model that gives meaning to the situation proposed in the statement of a given problem and facilitates mathematical reasoning, becoming a way of thinking for students [26].
Despite the recognized importance of visual representations in this context, it is necessary that the teacher has some concerns in its use and knows some of the potentialities of visual approaches or solutions.
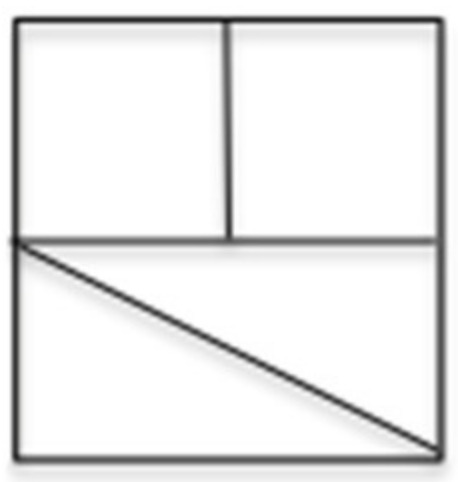
For example, much of the work done with students in the first approaches to rational numbers leads them to think that when speaking in equal parts, it means geometrically equal. They are rarely asked to reflect on whether a figure, such as the one presented in Figure 1, could represent a whole divided into quarters [27], giving preference to divisions into geometrically equal parts.
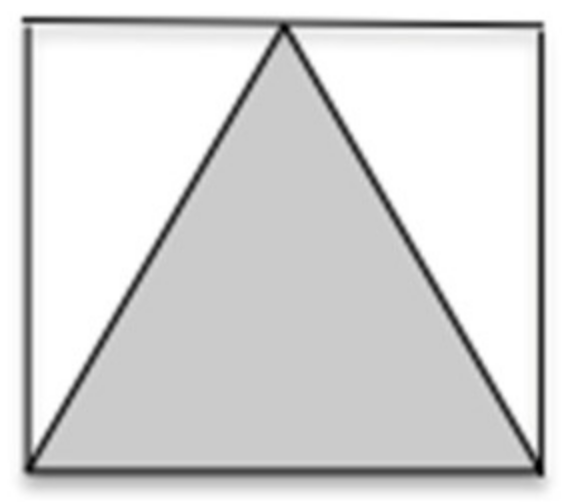
It is also interesting to note that, both in school textbooks and classroom practices, the idea of half a figure is almost always represented by shapes that are divided into two parts or a number of parts, multiple of two, with half of those parts painted. It is uncommon to ask students to identify, through a fraction, the part of the figure that is painted, using a representation such as the one in Figure 2. In this image, three parts are visible; however, the painted part is, in fact, half of the figure. The mere existence of three parts could be a distracting element for many students, based on their experiences and mental constructions, eventually concluding that the fraction would have denominator three and not two.
In cases such as the ones analyzed, students have to visually identify the number of equivalent geometric regions into which the whole can be divided, an aspect that is not immediately visible. This approach may be used with iconic representations but also with active representations. For example, in Figure 3, we can see a square inscribed in a larger square.
When asking to analyze which part of the initial square is occupied by the smaller square, students have to look for strategies to decompose the initial figure into equivalent figures that represent the parts since it is not obvious how many parts it is divided into. In this case, they can, for instance, use paper folding or drawings, to identify eight geometrically equal triangles, as shown in Figure 4.
Despite the potential and effectiveness of visual representations in learning rational numbers, once students come into contact with the symbolic component, teachers rarely return to visual representations, assuming that they are no longer useful. Instead, increasingly complex concepts and algorithms are taught, developed with the support of a symbolic system without reference to visualization [28]. Visual models are valued in the phase of the introduction of concepts related to rational numbers, as well as in operational rules with fractions, being recognized as more intuitive and with an illustrative role [29], allowing students to contact with complex ideas since the early years. However, when advancing the approach to content about rational numbers and especially when working with “word problems” with rational numbers in different contexts, the exploration done is rarely visual, privileging the manipulation of the rules already learned. But, some authors [29] argue that visual representations continue to be useful, even when progressing in curriculum content to more formal levels of representation, such as symbols. In addition to contributing to more meaningful learning, the establishment of connections between visual and symbolic representations can assist students in performing reasoning at a conceptual level, as well as in explaining those same reasonings [6,28].
According to Arcavi [12], visualization can accompany the construction of a symbolic representation since an image, due to its concrete aspect, can be decisive in self-conviction and in the sensation of almost immediate validity. In this sense, the association of visual representations with numerical notations and “word problems” has been considered a crucial way to demonstrate conceptual knowledge of rational numbers, which is often lacking in students [10]. It is considered a good practice in the mathematics classroom to use multiple representations in order to meet students’ preferences, also trying to teach in order to promote understanding. This approach will help students to understand more comprehensively rational numbers as well as the different ways of representing them, thus showing the flexibility of thought.
3.3. Some Potentialities of Visual Solutions
A characteristic of mathematically competent students is that they are able to strive to find a solution to a problem that is clear, simple, short, and elegant [2,14]. The potential and limitations of visual reasoning are recognized as part of the classroom mathematical culture [3,12]. In particular, there are authors [4,30] who point to evidences that visual representations can be particularly beneficial for all students, especially those with more difficulties. Visual strategies that use different representations (physical, pictorial, schematic, geometric) are not always fully used to solve a problem. They are usually overlooked by the mechanized use of rules and procedures learned without meaning, which reduces teaching to a routine and monotonous process of numerical, symbolic, and/or algorithmic manipulation. However, a path that includes visual approaches is fundamental to act as a starting point to reach the solution, but that must be completed with other forms of representation, verbal and symbolic, contributing to a more conceptual understanding of this theme, favoring the establishment of connections between representations [6]. Following this discussion, we present two examples of tasks that admit visual and non-visual solutions and with which we intend to illustrate the possible potential of visual strategies that can be used from the most elementary levels [3].
The first example (Figure 5) is a typical problem with rational numbers in which the previously learned concepts and procedures are used and where the whole is known.
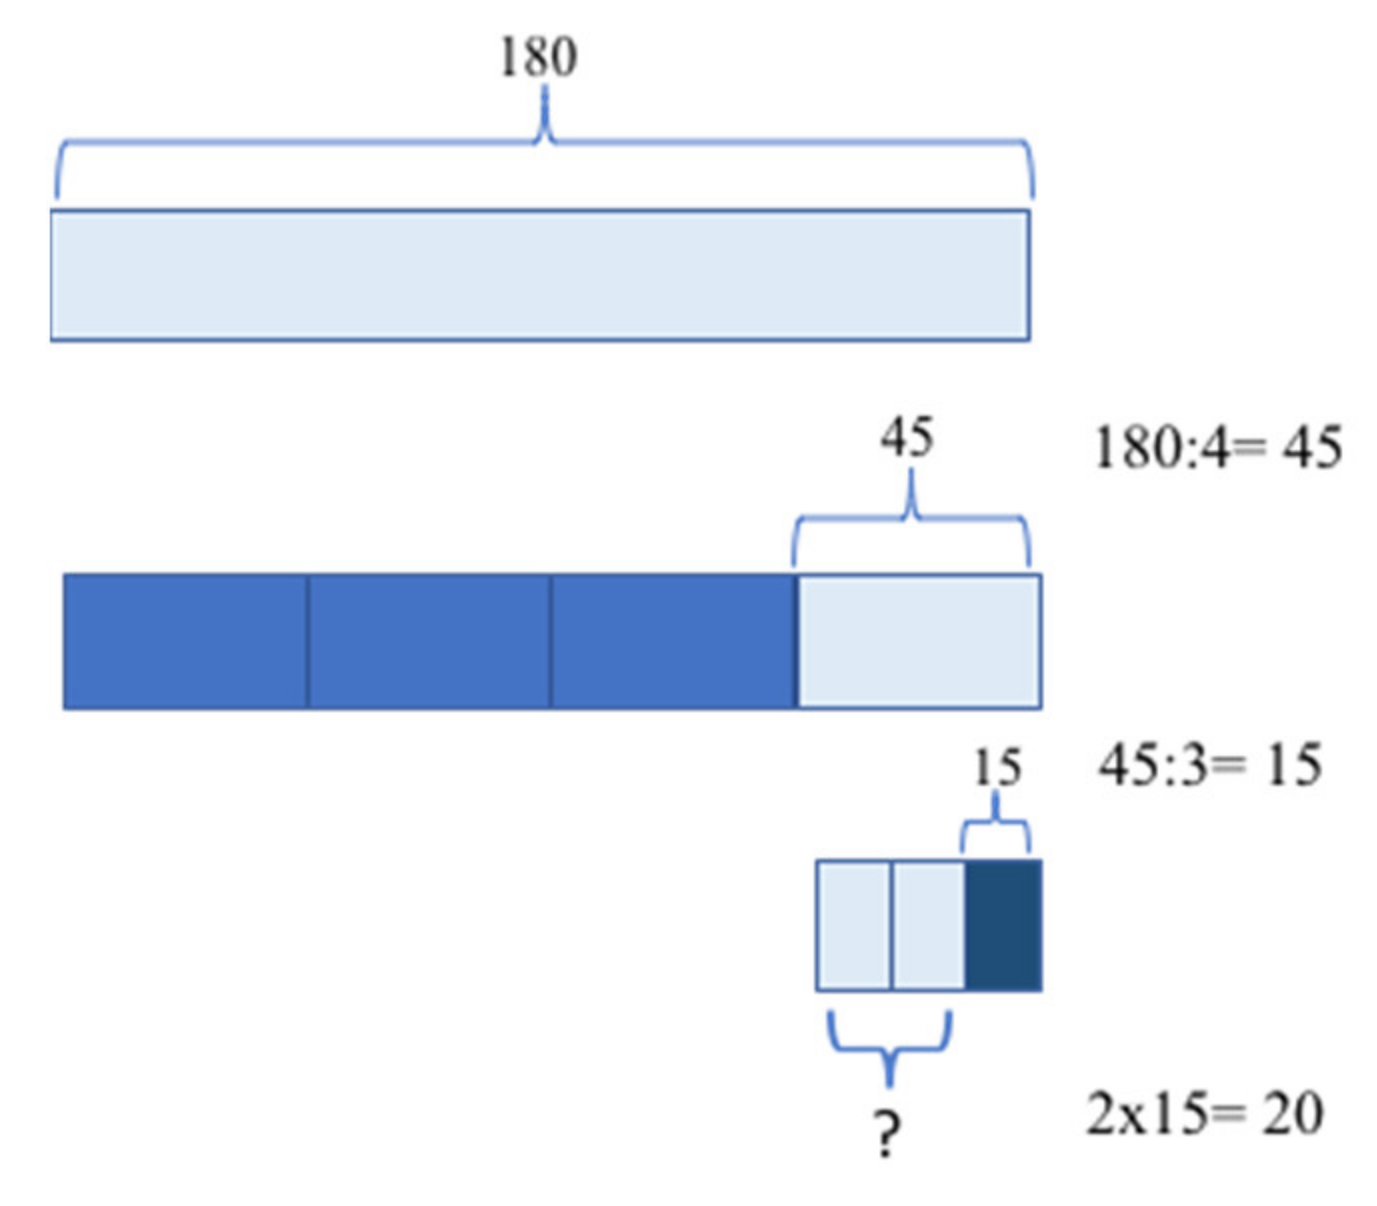
To solve this task numerically, we just have to follow the conditions expressed in the statement, and one of the processes would be: she sold 3/4 of the 180 egg tarts, that is 3/4 × 180 = (3 × 1 × 80)/4 = 135, and gave her neighbor 1/3 of the remaining tarts, that is, she had 180 and sold 135, leaving her with 180 − 135 = 45. Then she gave 1/3 × 45 = 15. If she gave 15, she was left with 45 − 15 = 30. For many students, this numerical manipulation is not always understood, as it involves conceptual and procedural knowledge to solve the problem. The use of a visual model can be helpful in the first stage of learning with fractions or to make sense of the procedures that are being used. After this step, this resource is no longer used in problem solving. Thus, starting by using the bar model to represent the whole, the 180 egg tarts, and following the conditions expressed in the statement, as was done in the previous case, we successively obtain the representations of Figure 6, using this visual model:
In this situation, the bar represents the unit that is known, the number of egg tarts. The model may be sufficient to solve the problem or help clarify some misconceptions in understanding the situation. The students can use different complementary representations or make sense of the use of calculations or vice versa.
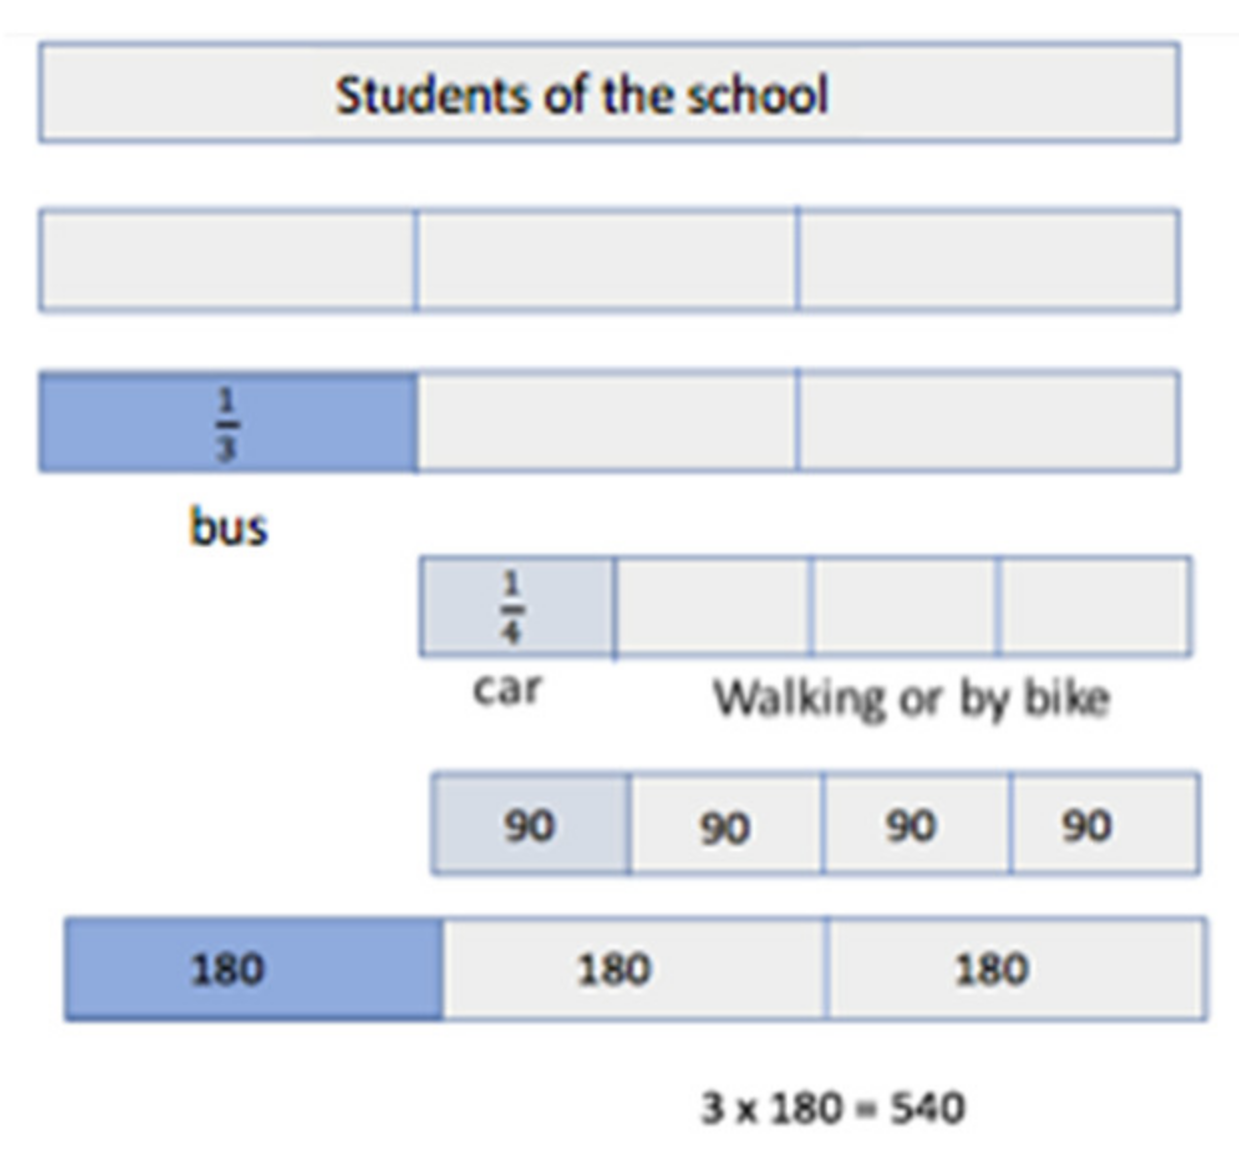
In the second example [31,32], seen in Figure 7, contrary to the previous situation, the whole is an unknown quantity, which makes this problem more complex for students.
The most common numerical solution would be: start by seeing what part remains of the whole when taking the part of the students that use the bus, that is, 1 − 1/3 = 2/3. Calculating the part corresponding to those who go to school by car, that is 1/4 of this amount (2/3), we have 1/4 × 2/3 = 2/12 = 1/6. As the part of students who go to school by car is 1/4, which corresponds to 90 students (the sixth part of the whole), the whole will be 6 × 90 = 540. We conclude that the school has 540 students. This solution involves not only procedural knowledge but also conceptual knowledge that not all students are able to mobilize simultaneously, according to the conditions of the problem. If we solve the problem using a visual model, students start by representing the unknown quantity (number of students) by a bar. Afterward, they will try to see the information obtained in the successive bars (Figure 8).
Throughout this section, we intended to emphasize the importance of visualization in solving certain mathematical problems, in particular, in the scope of rational numbers, illustrating some of its potentialities with examples. In an early stage of the learning process, a visual solution makes it easier for students to understand the structure of the problem than an analytical solution. It is important for the teacher to work simultaneously with analytic and visual solutions, showing the complementarity between the two in order to give meaning to mathematical expressions and the words involved. Subsequently, students will choose the best strategy when they have to attack a problem.
4. Method
This study aimed to analyze how pre-service teachers solve problems with multiple solutions in the scope of rational numbers before and after a module about problem solving that emphasizes visual approaches. Thus, we followed a qualitative and interpretative approach [33]. This choice of paradigm was sustained by the fact that the main goal was to understand the perspective and reactions of the participants to a particular situation.
We conducted this research with 14 pre-service teachers of elementary education (future teachers of 6–12 years old students) in the form of a didactical experience. Of this group, 12 were women and 2 were men, with an average age of 23. At the moment of the study, they were attending the second semester of the 1st year of a Master’s course, with a two-year duration, that qualifies them for the teaching of Mathematics and Sciences for grades 1–6. Prior to this course, all of them concluded a degree in Education, a 6-semester transversal training that enabled them to be education technicians, but not yet teachers. As for the Master’s course, we can generally say that it lasts four semesters, the first two consisting of subjects related to the areas of didactics, general education, and content knowledge, and the last year (2 semesters) dedicated to an internship with students with 6–12 years old.
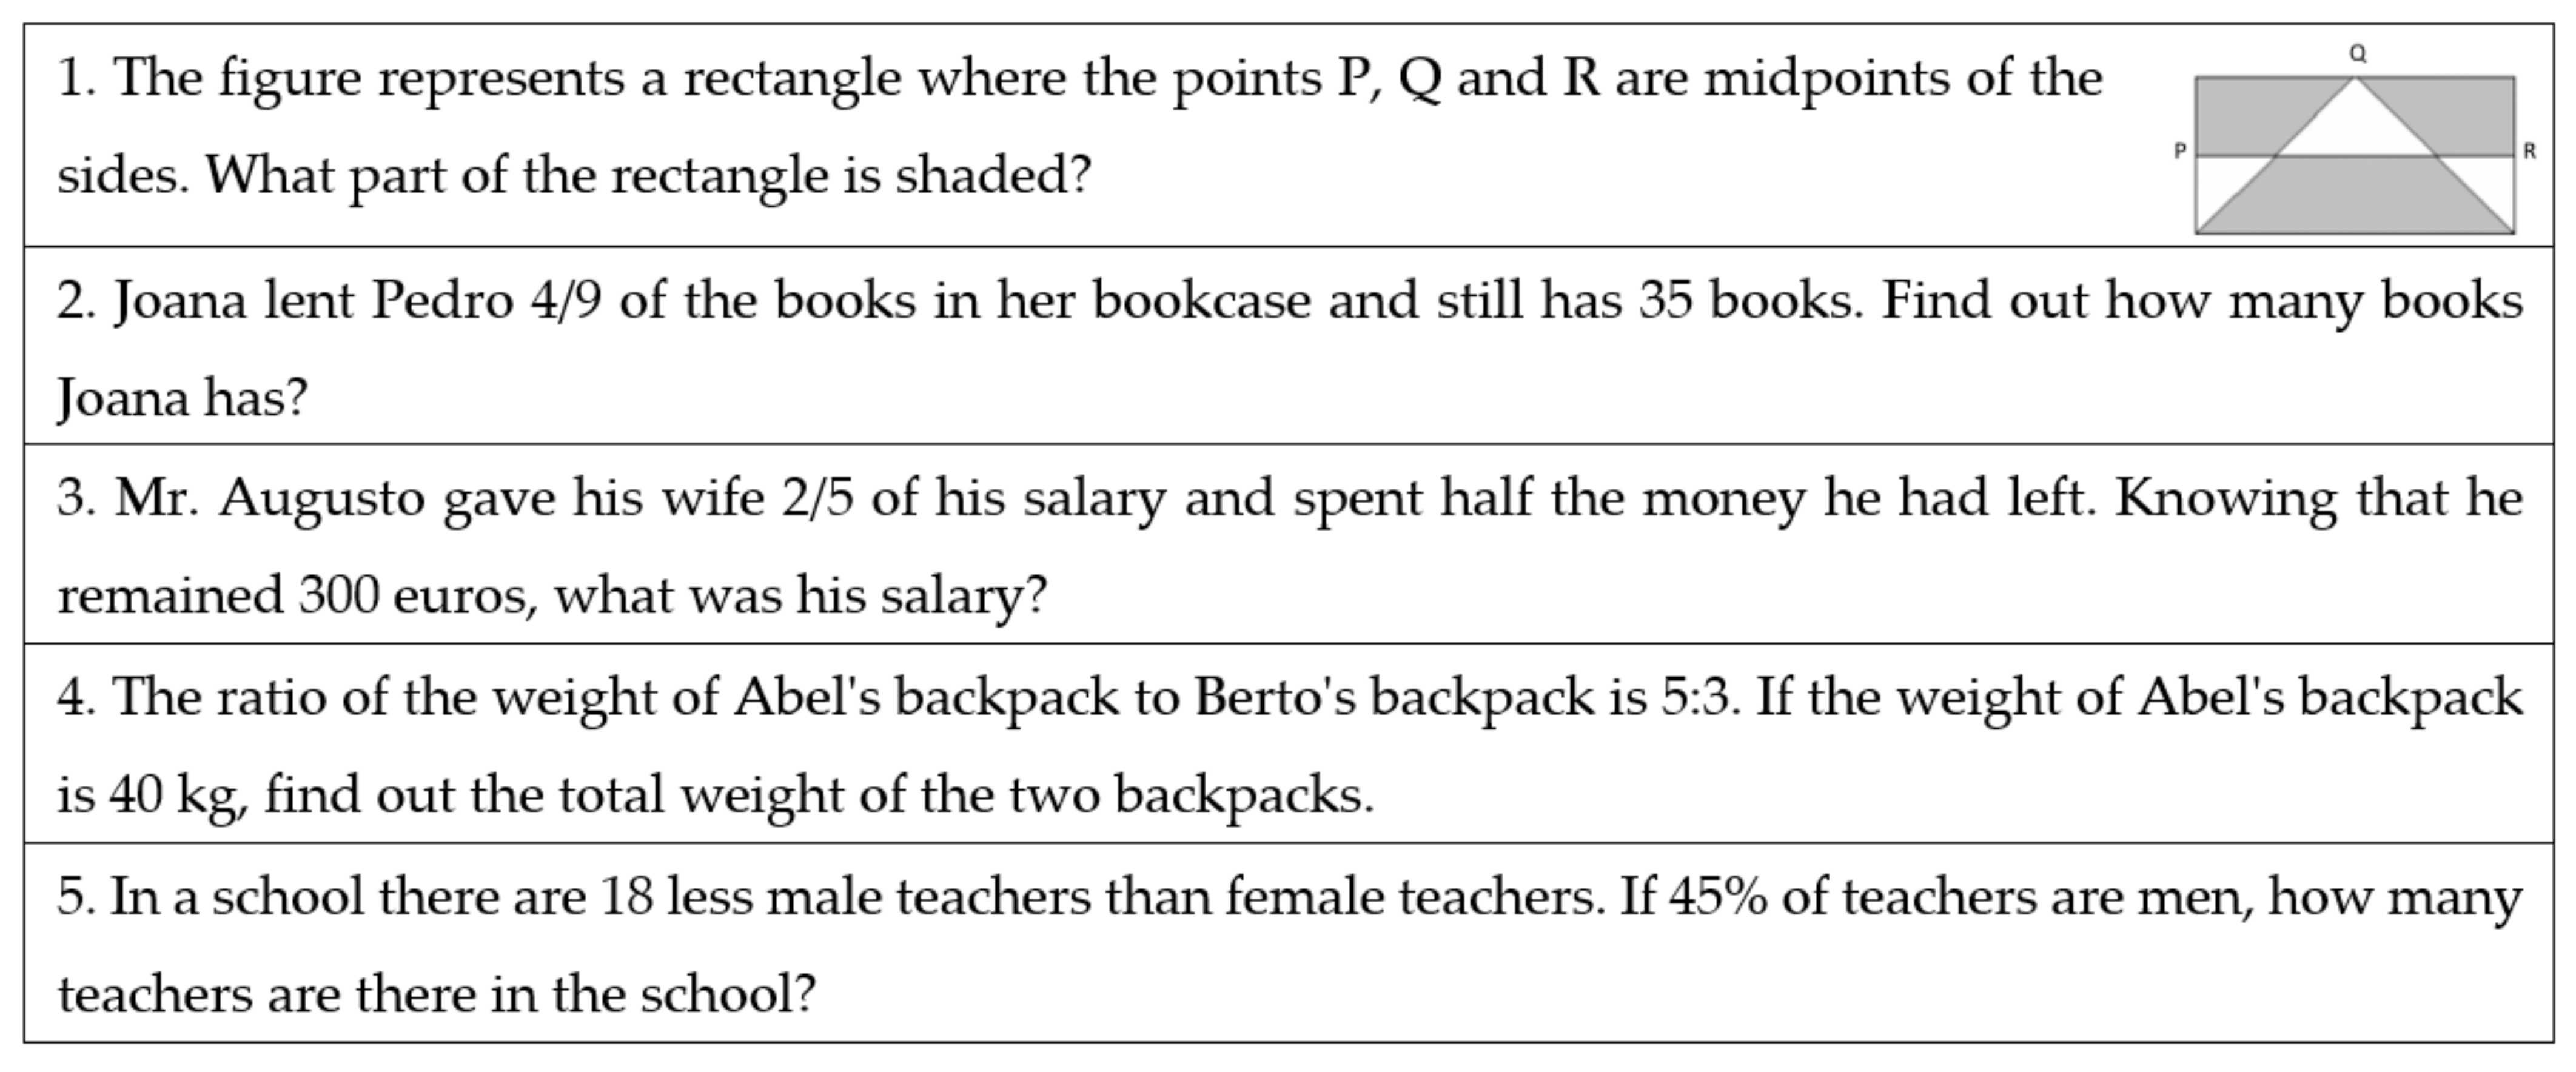
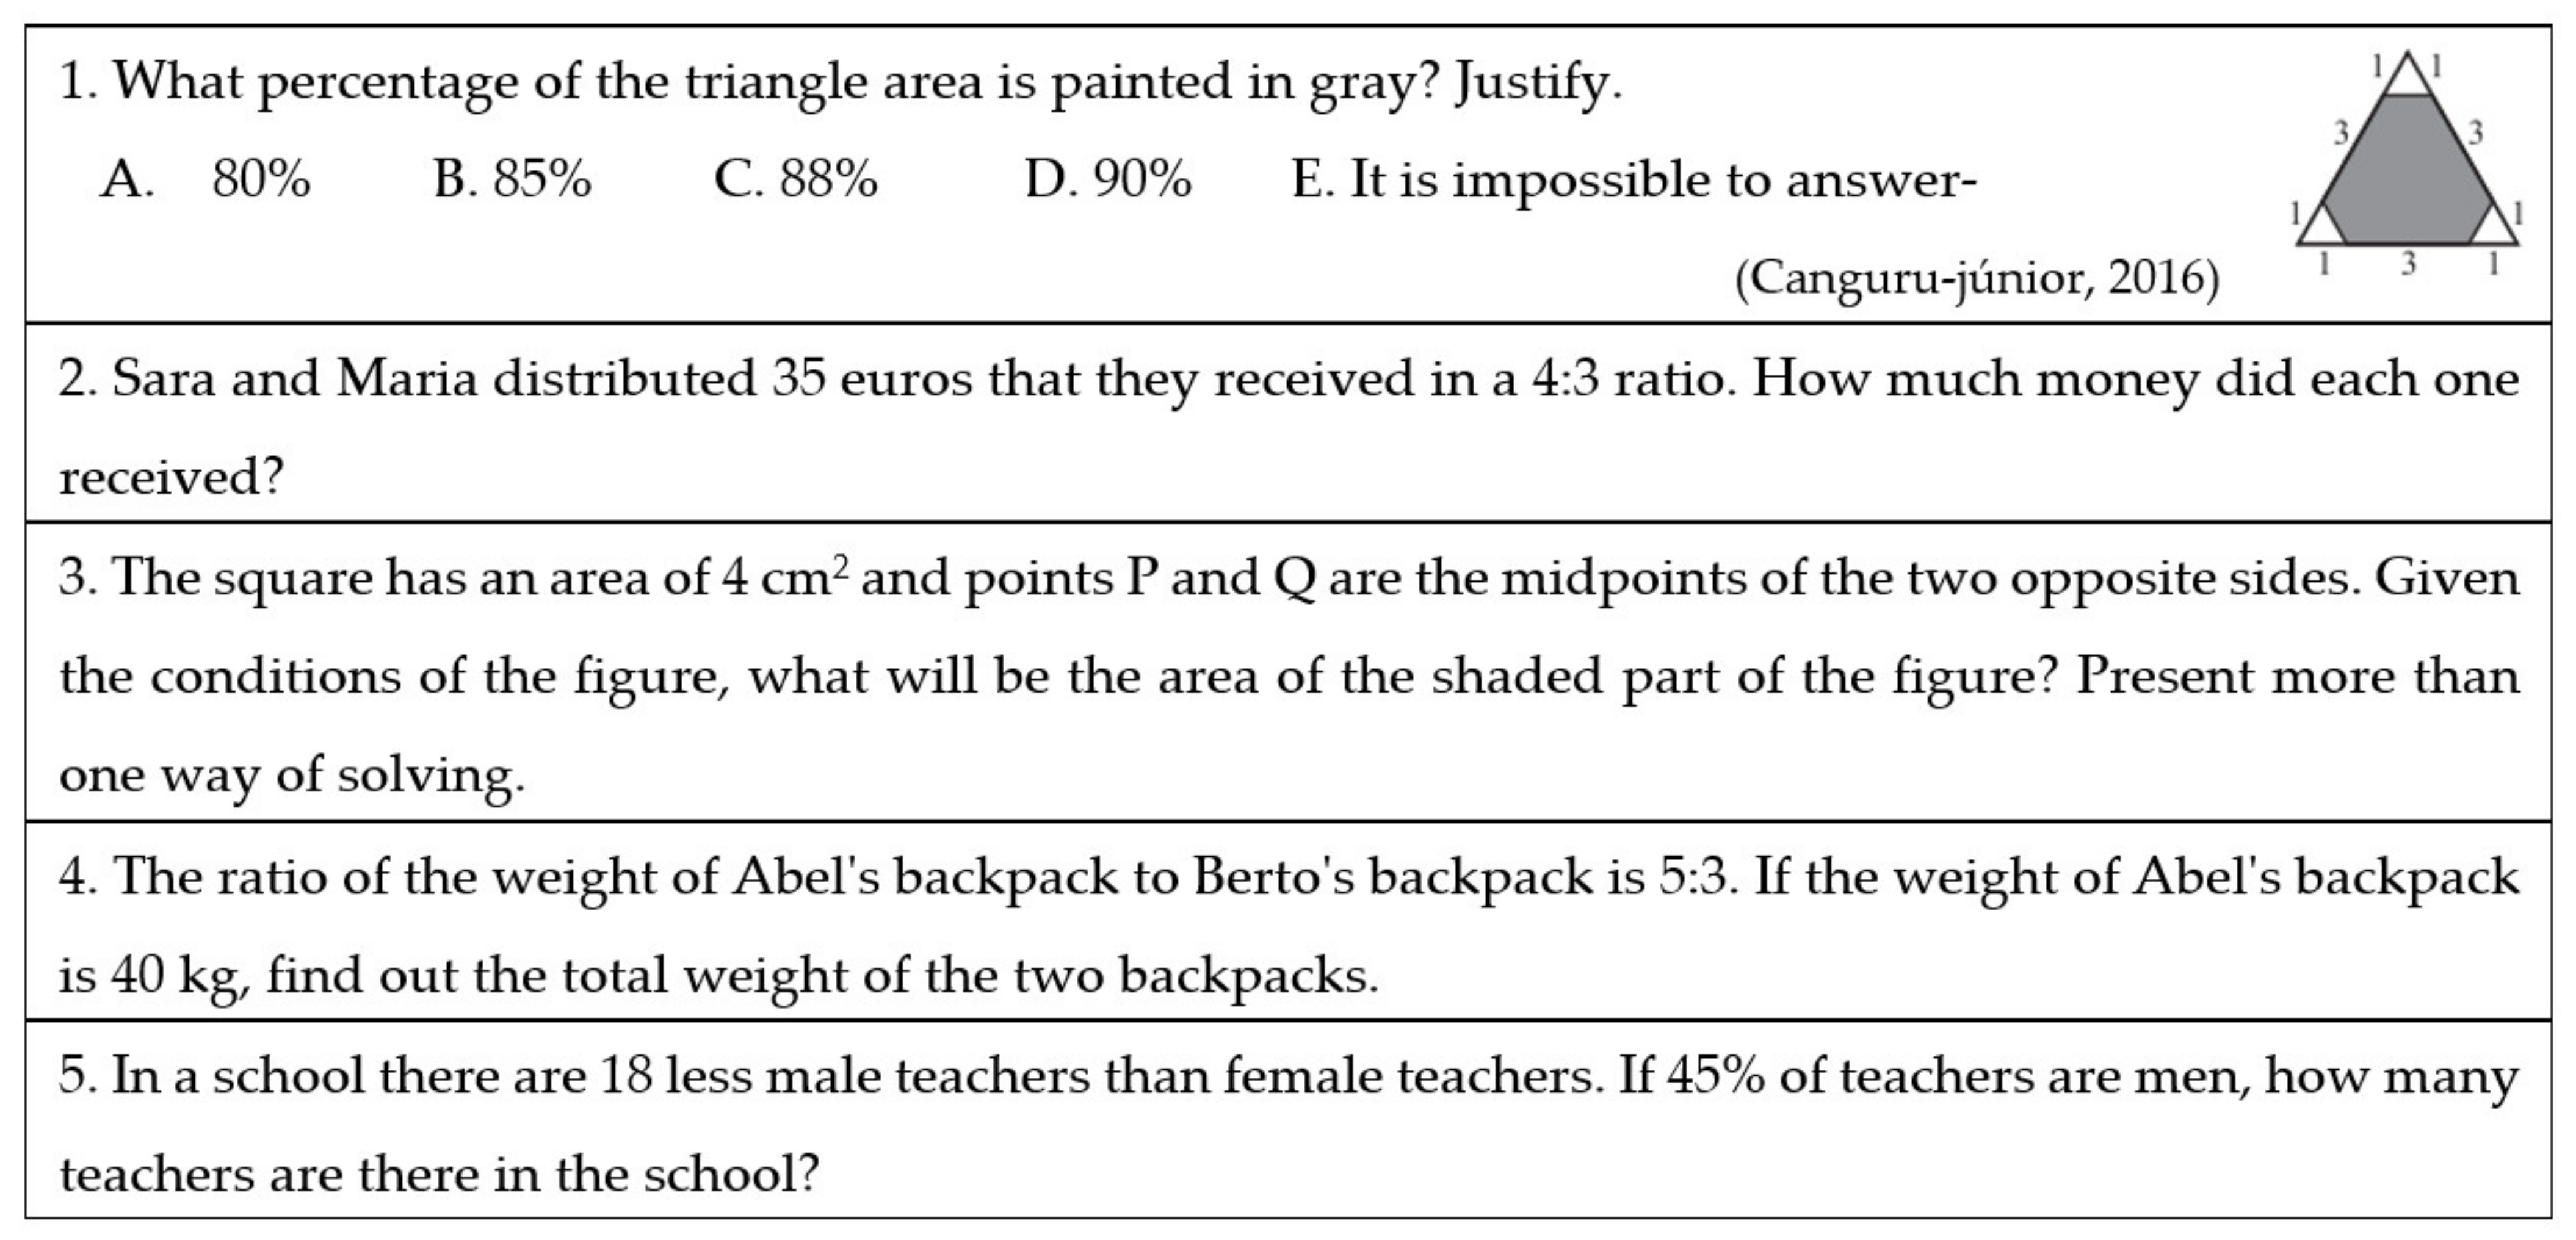
During the 2nd semester of this course, the participants were enrolled in a Didactics of Mathematics subject that served as context for this study, which, among other topics, included a module about visualization and problem solving. Traditionally, mathematics teaching favors analytical approaches, often considered as the main or only possible path to solve a problem. Considering that students may have different learning styles, teachers must explore different solutions for the same problems, highlighting not only analytical approaches but also visual or mixed ones in order to meet the students’ needs in terms of reasoning. With this specific module, we intended to make the participants aware of these aspects, motivating them to think as future teachers and not only as problem solvers whose previous experiences were mainly analytical. As an alternative or as a complement to more traditional approaches, they had the opportunity to analyze aspects such as the potential and constraints of the use of visual approaches in problem solving regarding different mathematical domains (e.g., numbers and operations, algebra, geometry), for example applying the seeing strategy, which in some cases generates simpler and more elegant solutions. During the module, they discussed: the idea of learning styles and its’ impact in the classroom; the advantages of using multiple-solution tasks; the anticipation and orchestration of different ways of solving the same task, emphasizing the power of visual representations as a way to produce more meaningful solutions, as a more intuitive approach, or as a complement to analytical approaches. Specifically, in the scope of rational numbers (the main topic of this study), where numerical and algebraic manipulations are very common and almost always presented as the only possibility, the module included the exploration of the bar model, among other visual representations, that the participants were not acquainted with. The future teachers solved a series of tasks, some prior to the module and others after this intervention (see Figure A1 and Figure A2 in the Appendix A). The proposed tasks could be solved by more than one process, thus being multiple-solution tasks, allowing the use of different approaches (analytical, visual, mixed). In this particular paper, we focus only on the tasks about rational numbers.
Data was collected during the classes of the abovementioned unit course, of which the researchers were also teachers, and included: participant observation, taking notes of the future teachers’ reactions and interactions, and the participants’ written productions regarding the proposed tasks. The participant’s written productions were the predominant data source, mainly to identify the strategies used and possible difficulties experienced by these future teachers. However, there were evidences that emerged from the notes referring to the observations, centered on the collective discussions, that allowed the reinforcement or complementary conclusions drawn from the participants’ records, such as their verbal reactions to the potential/constraints of the visual approaches. To analyze the data, we used an inductive approach, recurring to content analysis [34], relying on the written productions (solutions of the tasks), the observations made, and the field notes. After repeatedly reading and consulting the collected information, we proceed to a categorization of the strategies used to systematize the data and facilitate the interpretation of the results. In this process, we formed the categories with the support of the research problem and the theoretical framework, which led to the formation of categories, namely the categorization of the strategies used (analytical, visual, and mixed).
5. Preliminary Results and Discussion
The pre-service teachers solved five tasks about rational numbers prior and after the intervention module about problem solving with emphasis on visual approaches. Table 1 sums up the global results related to the nature of the strategies used by the participants in the two stages, dividing them into visual and non-visual approaches. Problems 4 and 5 (Appendix A) were proposed again after the module due to the results obtained since the majority of the participants chose non-visual solution methods.
Looking at the results we perceived that in the five problems used before the module, there was a predominance of analytical strategies, with only 26.7% of the solutions presented being considered visual strategies. In fact, visual approaches were not used at all in one of the proposed tasks, and in two others, the percentage of preference for analytical strategies was very high. The most common solutions in this stage involved the use of equations, systems, numerical manipulation of acquired procedures, and the “simple rule of three”. The participants were impelled to present the solutions they came up with and explain their reasoning, stating how they would do the exploration of each task solution with students of elementary education. We identified several difficulties related to the lack of some communication and argumentation abilities, which, in some cases, compromised the understanding of their peers.
After the didactical experience, five more tasks were applied that had the same characteristics as the previously proposed problems. As said before, two problems of the first stage were included in this second group of tasks. The results (Table 1) allowed us to verify a significant shift in these future teachers’ choices, resorting more frequently to visual strategies (increasing from 26.7% of use before the intervention to 57.8% usage rate after the intervention), an approach explicitly valued during the teaching module. The results point out an increase in the productions involving visual solutions, being even the privileged approach in some of the problems (problems 2 and 3), despite the context in which they were presented.
After a global analysis of the results, we will now present more detailed evidences of the participants’ work before and after the intervention, focusing on two of the proposed problems, the last two tasks. As an introduction to each situation, we start by presenting a possible visual solution as a way to clarify the type of work developed with these pre-service teachers during the module and then present and discuss the participants’ proposals to each task.
5.1. Task 4
This task had the following statement (Figure 9):
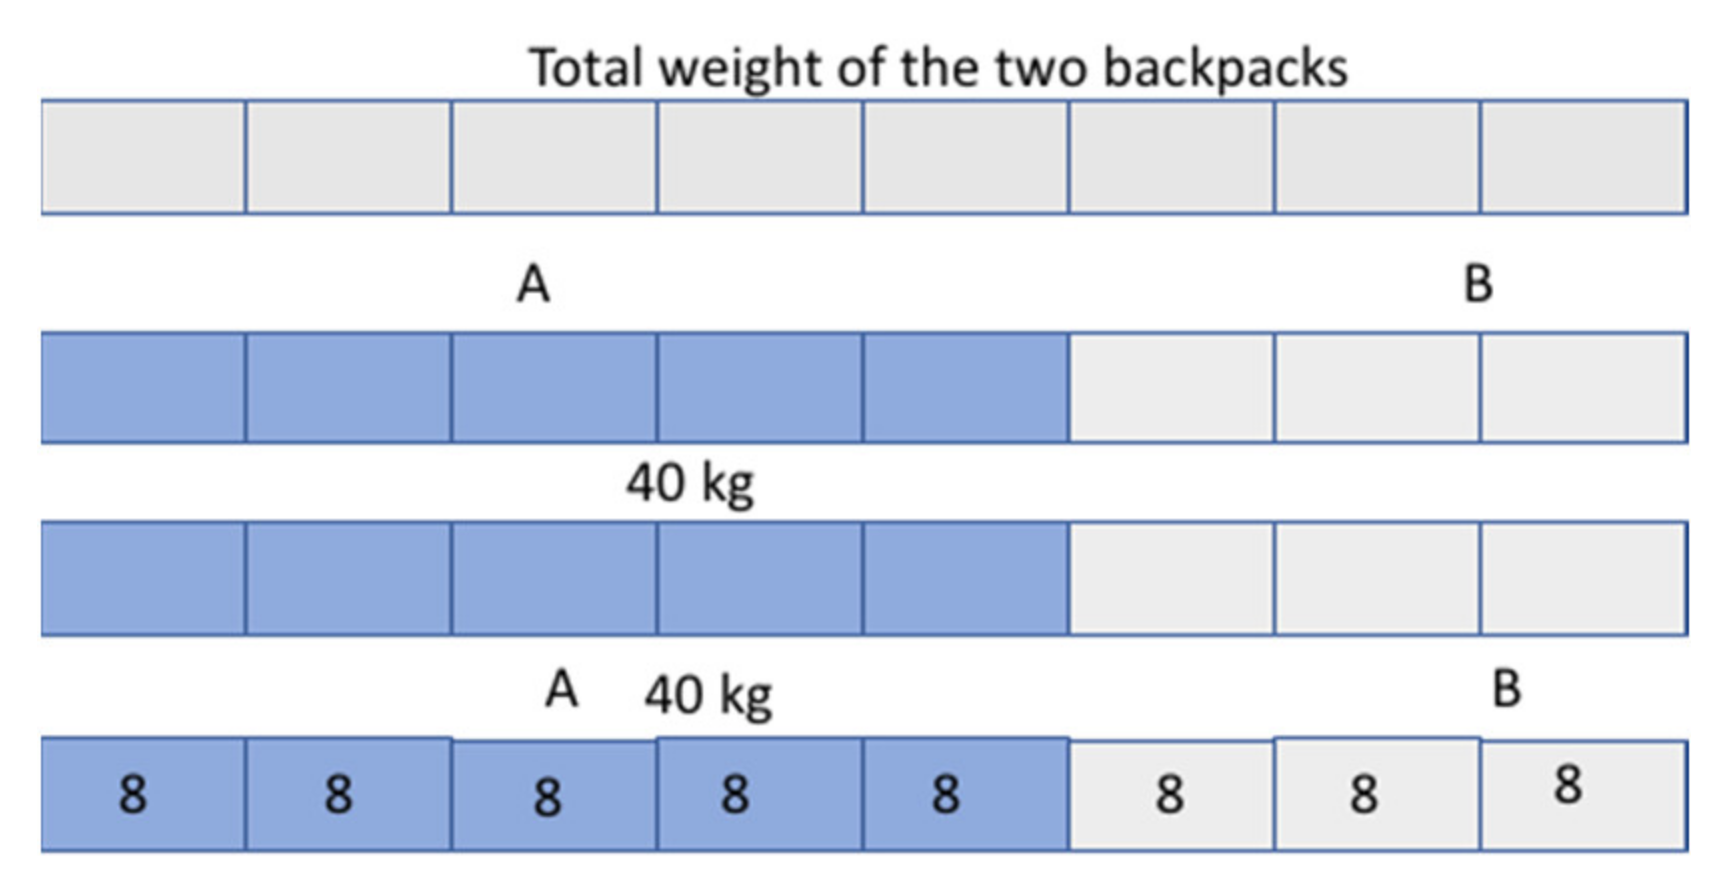
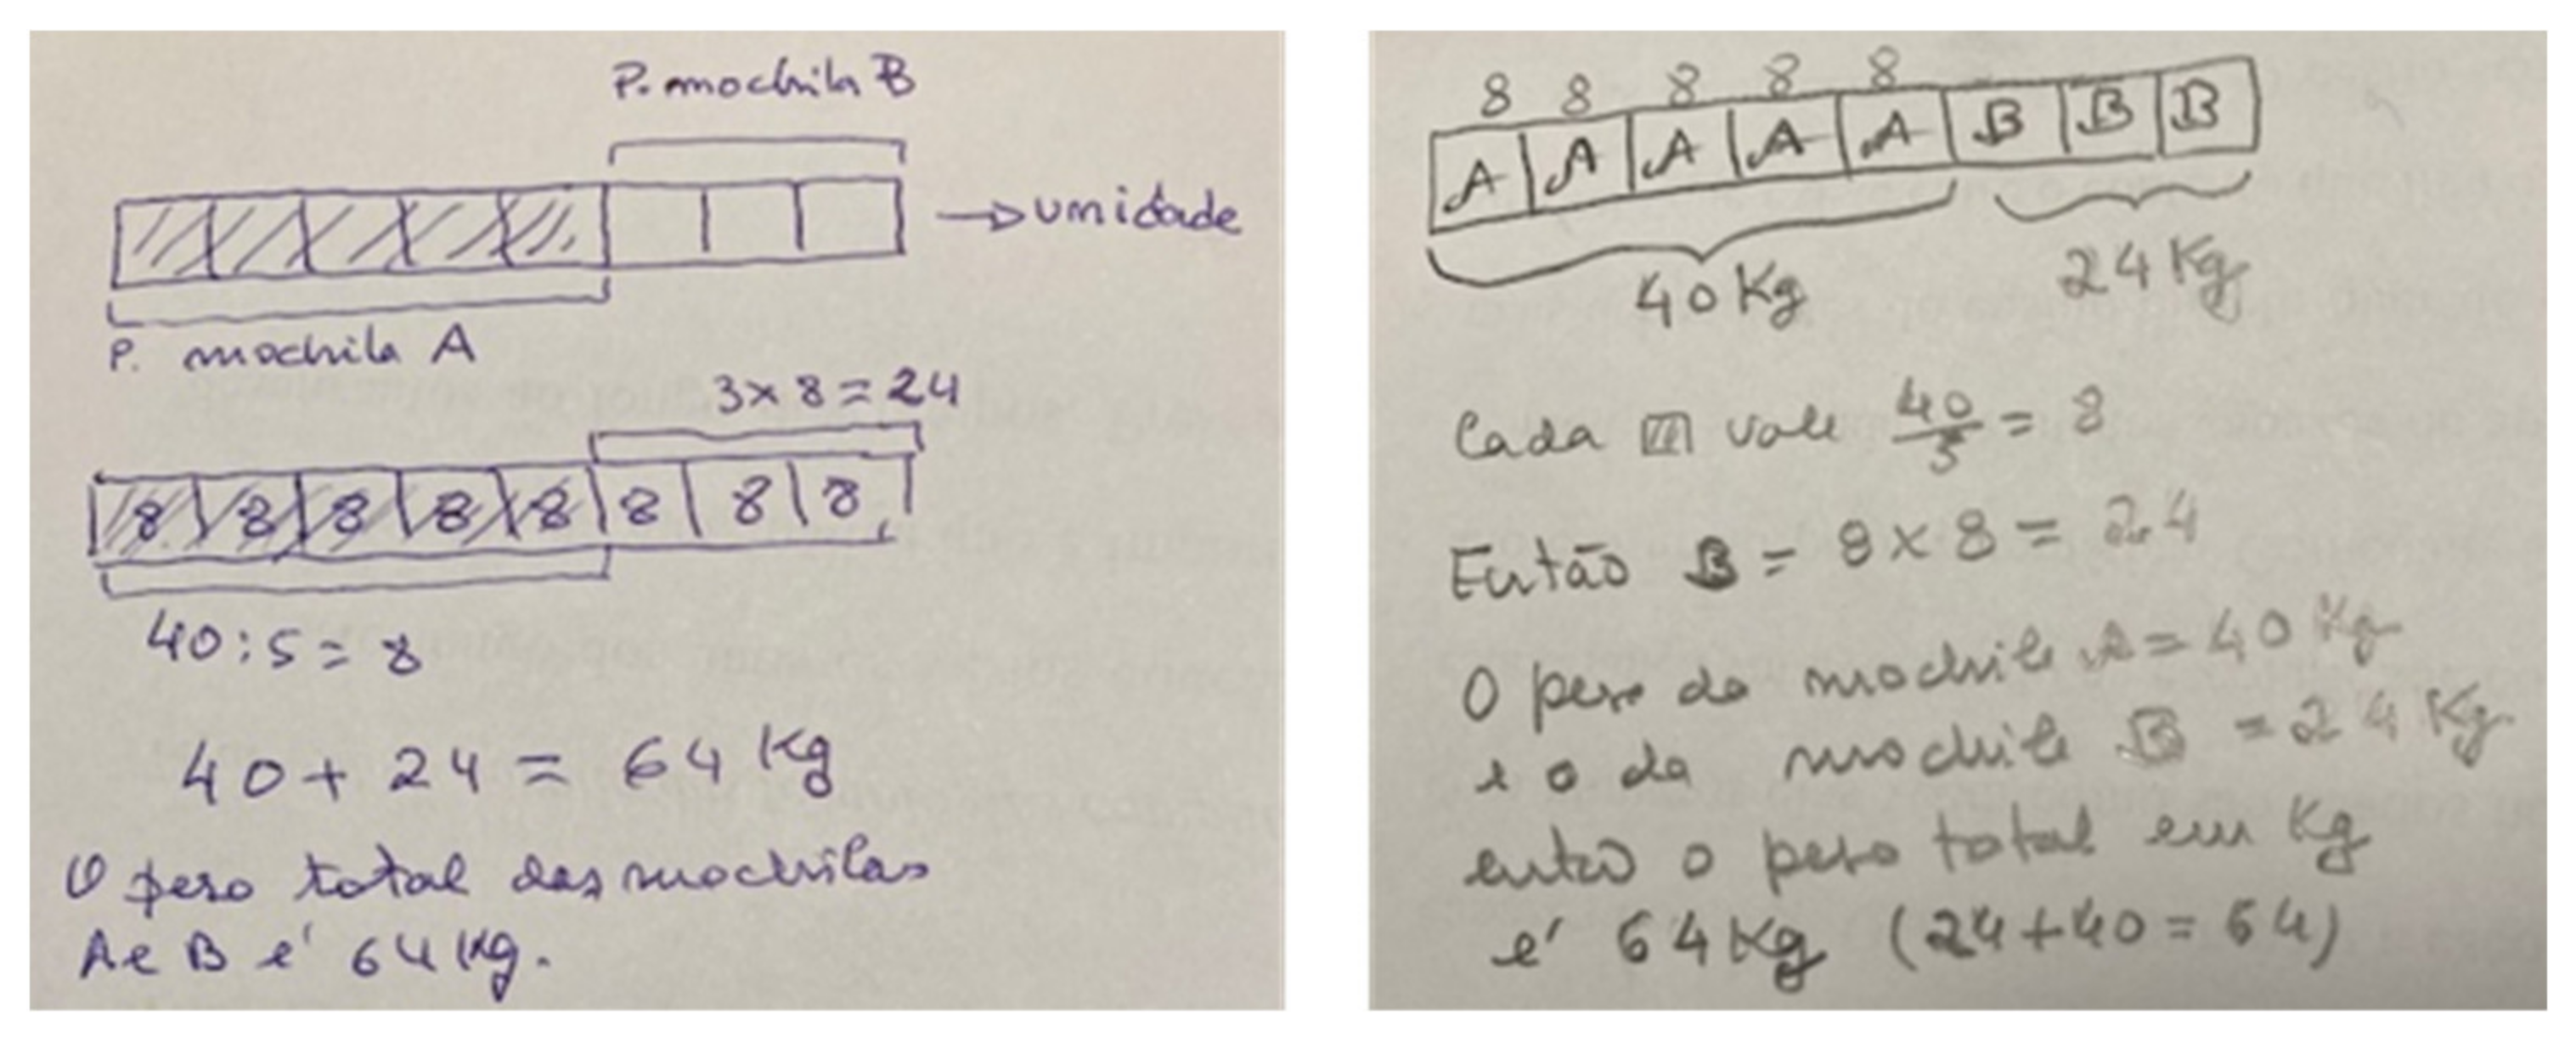
The problem involves the concept of fraction as ratio and, although being presented through a non-visual context, it can be considered as a multiple-solution task allowing the use of a diversity strategies and representations of different nature. The most common approach to this problem is certainly analytical resorting to mathematical tools related to the concept of ratio. This aspect can be supported by the fact that this is a routine task in regard to the work with rational numbers in teachers’ practices. However, another possible solution could be using the bar model, as shown in Figure 10. Starting with the unit divided into eight parts, as suggested by the ratio between the weight of the two backpacks (5:3), we can successively have the following representations arising from what is given and what is intended to be known:
Relying on these visual representations, the solver can use symbolic representations to continue to pursue the solution. Thus, 8 parts are worth 8 kg each, that is 8 × 8 = 64. Therefore, the total weight of the backpacks is 64 kg. The bar model generates a revealing image of the ratio interpretation in the sense that the numbers and its relations assume a clearer meaning.
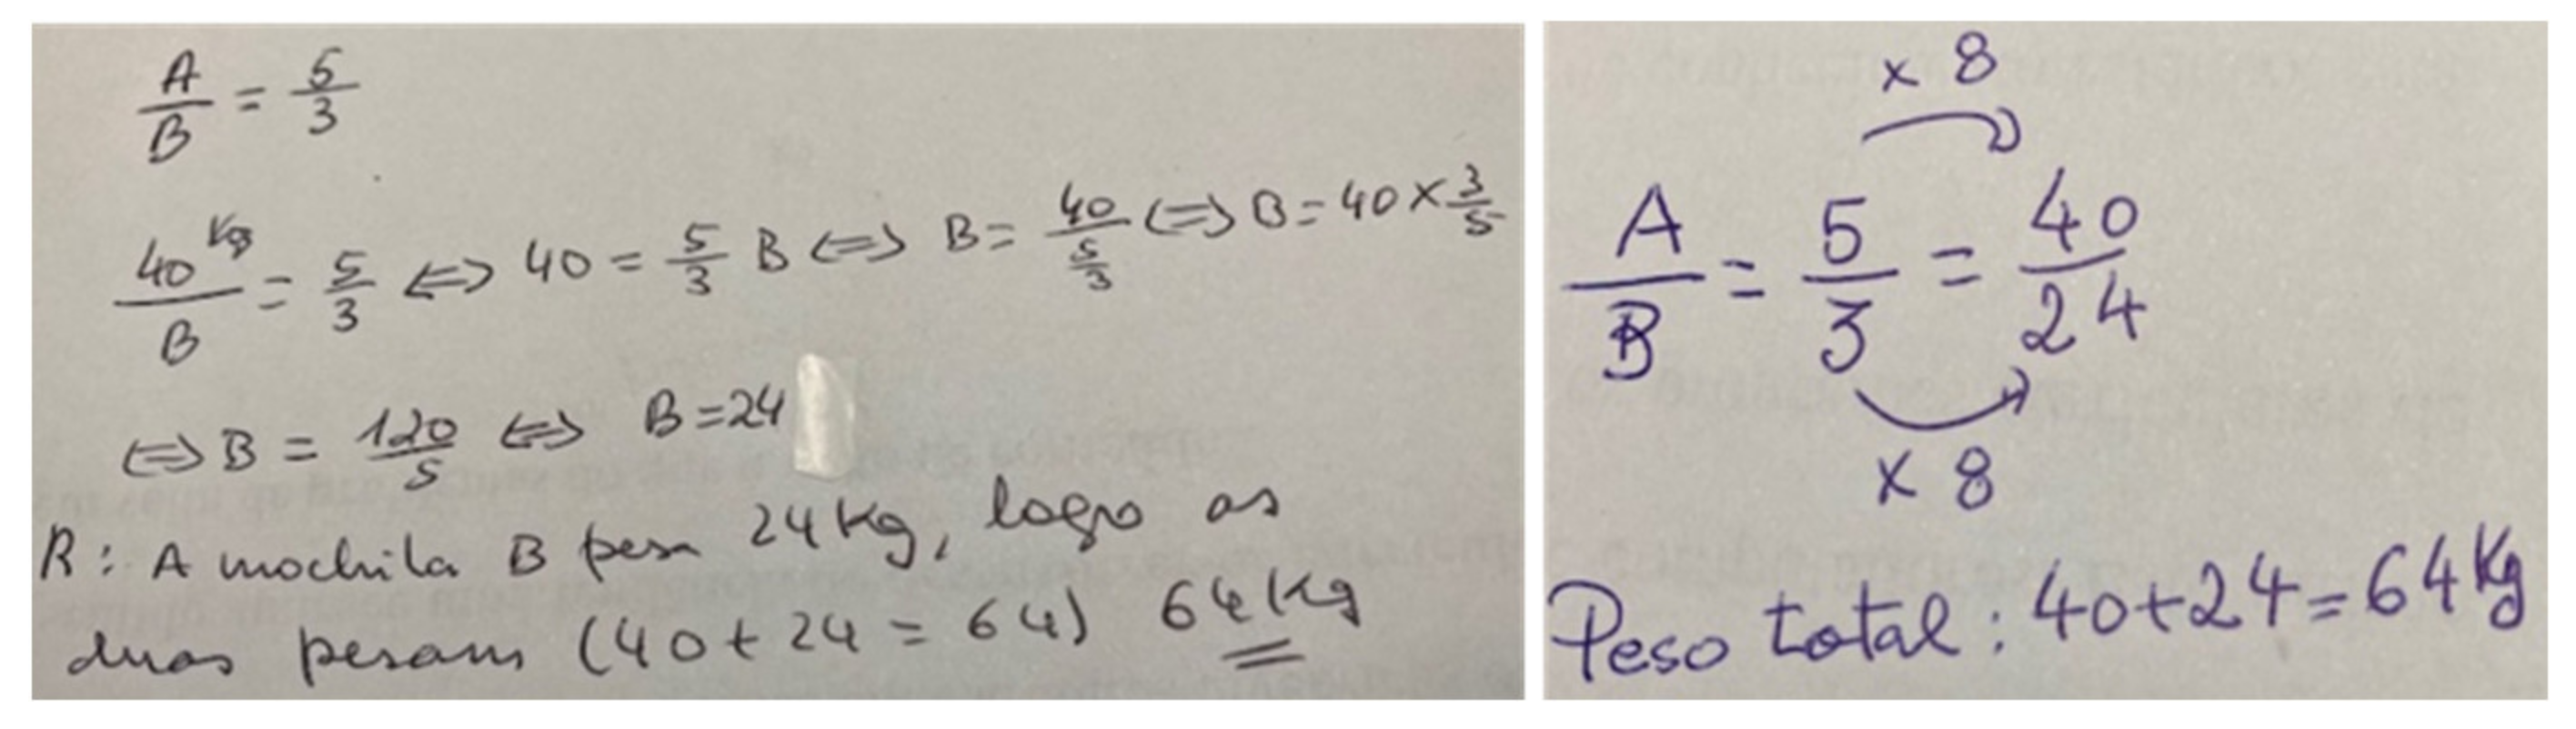
The analysis of the work developed by the participants while solving this problem before the intervention led us to choose two solutions, presented in Figure 11, as being representative of the emerging written productions.
In this particular task, the analytical solutions corresponded to 90% of the participants’ options, which could be expected due to their previous experiences as students but also due to the context of the problem (non-visual). These solutions either involved the use of the concept of proportion (left image) or a simpler approach involving the concept of ratio (right image). This task, being a routine problem, did not pose any difficulties to these future teachers. After the intervention, most of the pre-service teachers continued to use analytical solutions while solving the same problem; however, 36.4% presented visual solutions. This shows that the visual strategies were appropriated by some of the participants and used as alternative solutions to analytical approaches. Figure 12 shows two of the visual strategies applied, where the bar model was used as the main representation:
In both cases, a visual representation of the unit (weight of the two backpacks) was used and divided into eight parts, representing the relation between the weight of the backpacks. This image, emerging from the bar model, facilitated the participant’s reasoning, helping them quickly deduce the total weight. This type of solution was pointed out as having more potential or being more useful than analytical strategies in cases where students show difficulties related to meaningless numerical manipulation. In this task, visual representations were highlighted as a way to complement calculations and help students make informed decisions about the operations to use.
5.2. Task 5
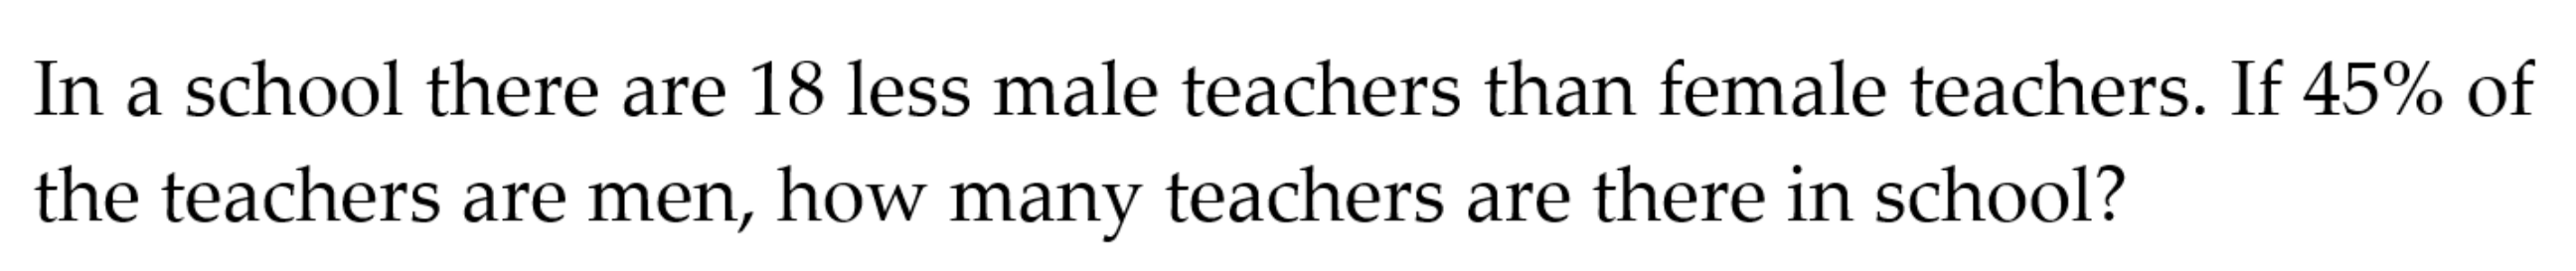
This task had the following statement (Figure 13):
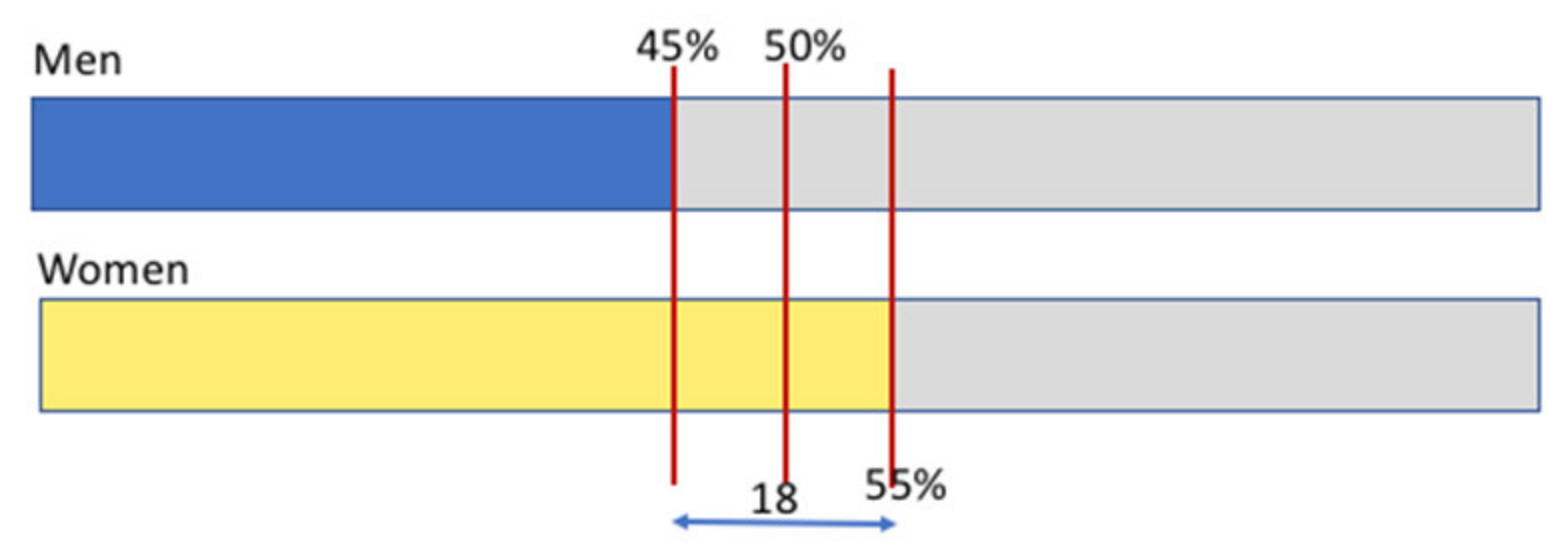
This problem involves the concept of percentage and has a higher level of cognitive demand compared to task 4. Its difficulty relies on not knowing the whole. As with all the other proposals, it is also a multiple-solution task that can be solved by using different approaches, but the most expected are the analytical ones due to the type of context (non-visual) and the representations involved (percentages). It is also important to state that the higher level of complexity underlying this problem may have a negative impact on the students’ performance, particularly if the option is the use of non-visual strategies. The choice for a visual model, such as the one we see in Figure 14, following the conditions of the statement, may provide a more understandable or even meaningful pathway for students with greater difficulties. Before using the visual representation, we can transform the percentages into ratios, as follows: 45% = 45/100 = 9/20 and consequently the women will be 55% = 55/100 = 11/20, and thus we will have:
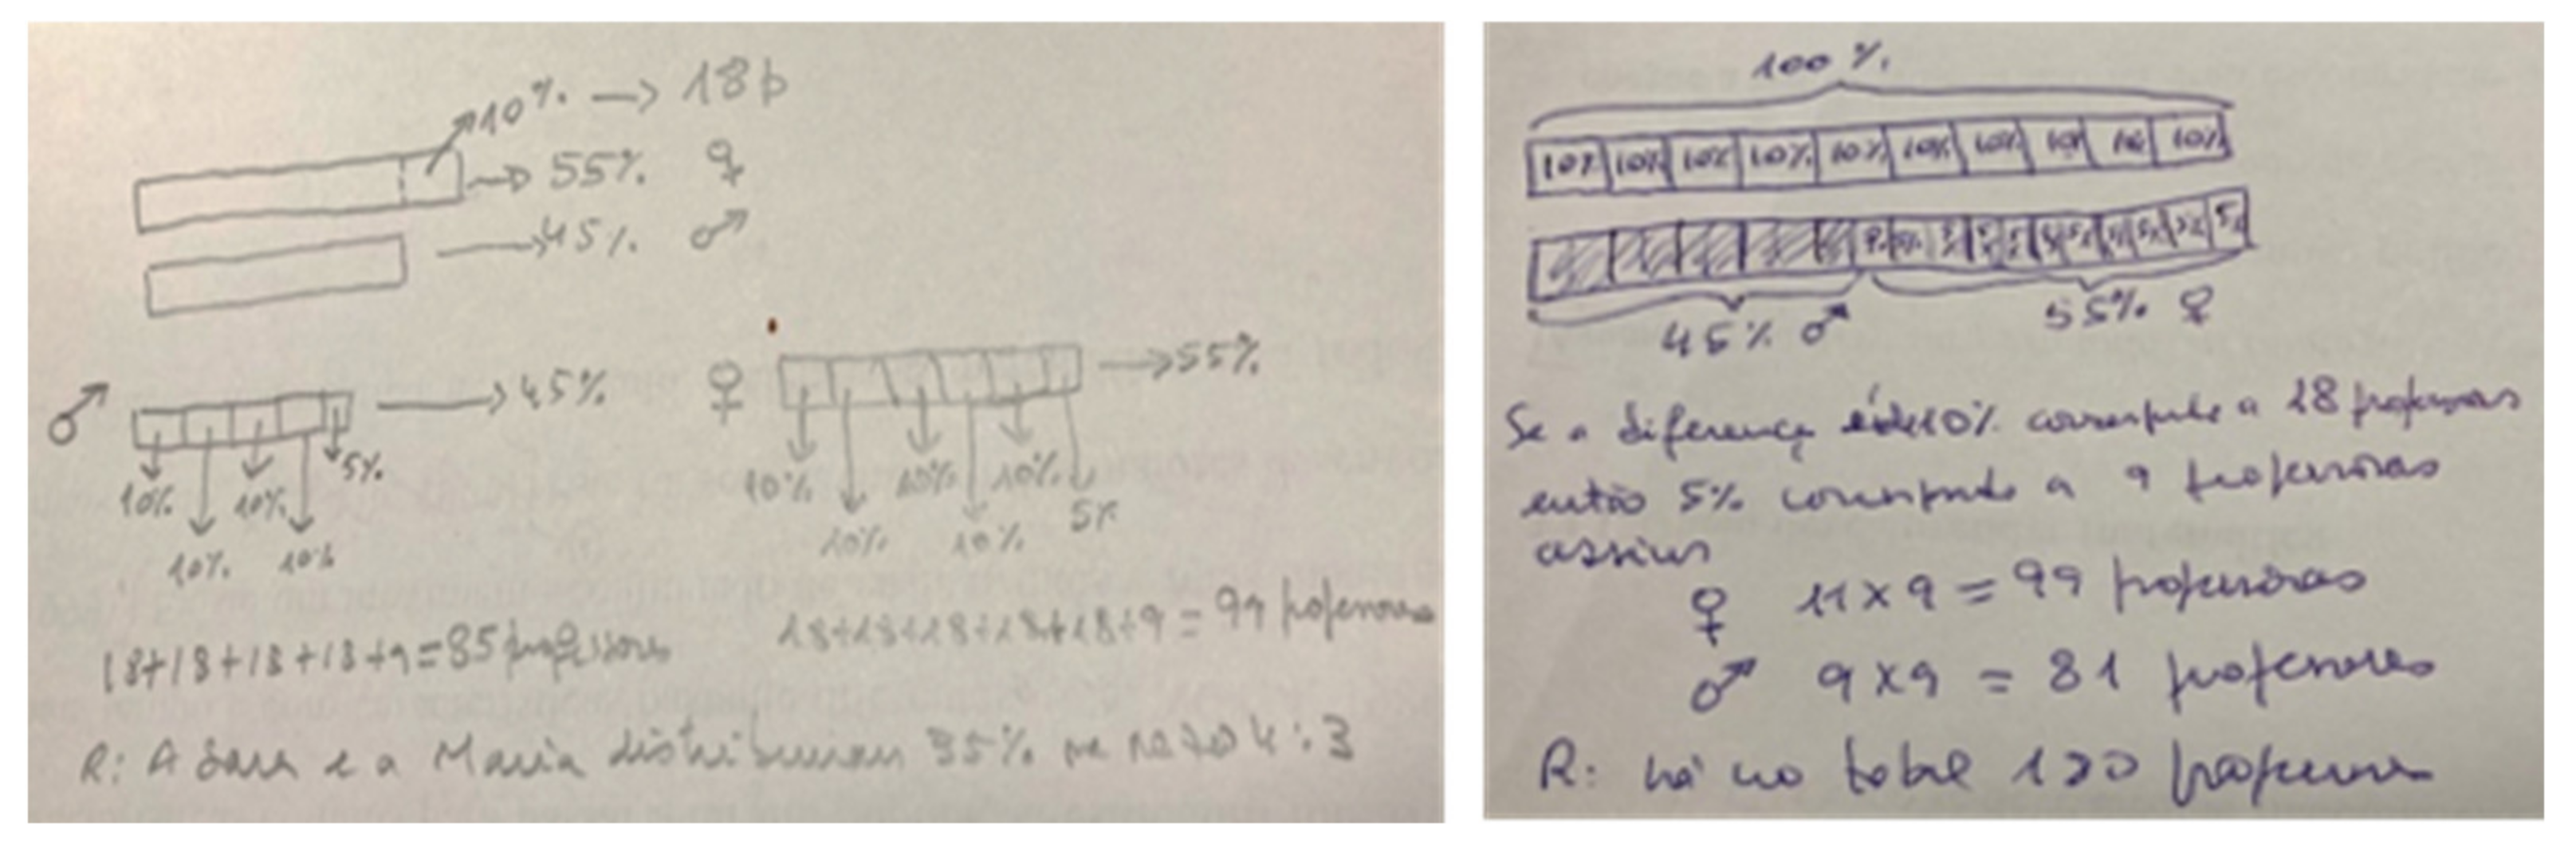
As there are 18 less men, there are 18 more women, each part corresponding to 8 women. As there are 20 parts in total (9 correspond to men and 11 correspond to women), there are 20 × 9 = 180 teachers. It can still be said that, of this total, 81 are men and 99 are women. Another visual solution consists of using the bar model, working directly with percentages, which becomes simpler and allows students to give meaning to the concept of percentage (Figure 15).
The percentage difference (10%) corresponds to 18 teachers, so 100%, which is the total number of teachers, will be 10 × 18 = 180.
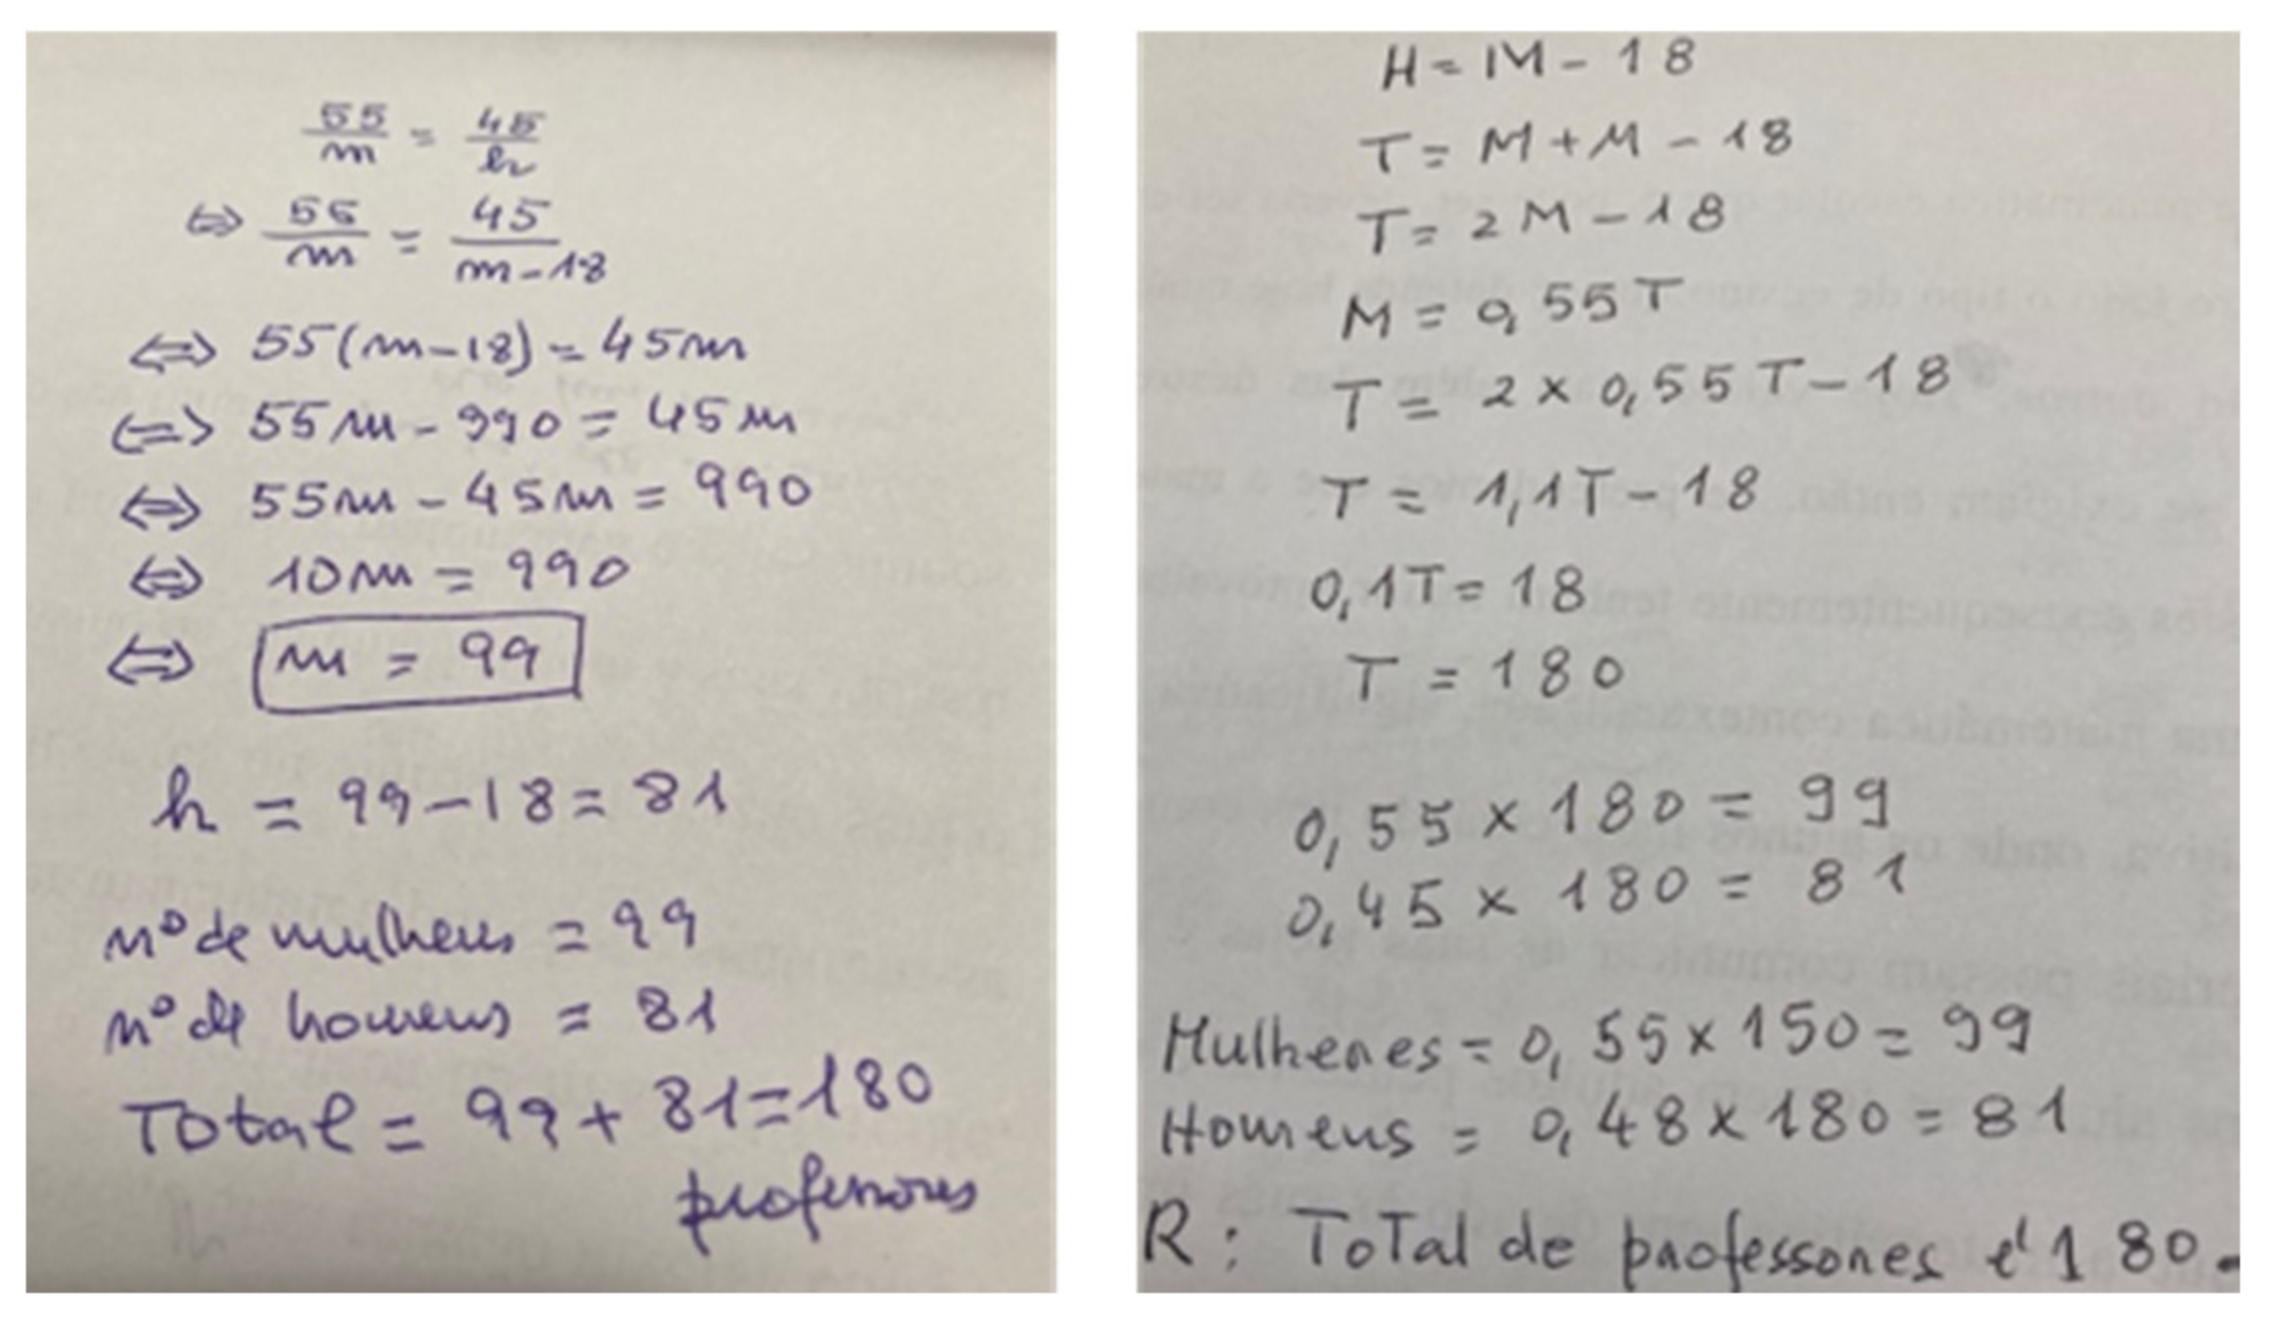
After analyzing the written productions of the participants before the intervention, we chose two solutions that illustrate the methods presented by the majority of the pre-service teachers when solving this problem (Figure 16).
All the participants chose analytical solutions to solve task 5, an outcome that was somewhat predictable due to the nature of the problem (unknown whole) and its context (non-visual). We may add that this problem took them a long time to solve because they did not know right away where to start, and many also reported that they were not satisfied with the solution they first came up with. Contrary to the other tasks, most of the participants submitted only one solution regarding this problem. Many of the pre-service teachers clearly exhibited mechanized data manipulation without meaning or relation to the context of the problem. This difficulty or incomprehension was notorious when the solutions were discussed and they were unable to explain some of the steps or even make themselves understood by their peers, manifesting insecurity in the way they solved the problem.
After the intervention, we noticed a significant shift in the strategies used. Although most of the pre-service teachers preferred to apply analytical methods, 44.4% presented visual approaches, mostly resorting to the bar model. This option was more evident in this task than in the previous one because, in this case, visual representations may facilitate problem solving, due to the unknown whole, reducing its’ level of complexity. Figure 17 shows two of the solutions that emerged during this stage.
As previously stated, there was a significant increase in the use of an alternative approach to analytic strategies. The visual representation of the bar gave the participants more confidence as solvers, but also as future teachers, as they were completely convinced of the power of a visual model like this to help with mathematical understanding. In both solutions, we see a clear association between visual representations and the meaning of numbers, which helps deduce, in a clear manner, the whole and the parts. This approach may help teachers in their practices when they are faced with difficulties posed by the students.
After this analysis, we need to state that the module was intended to reinforce the visual approaches to problem solving as it is traditionally a devalued topic in mathematics classes, despite its potential, not only in geometry but also in other mathematical topics. This reinforcement was not intended to present visualization as the most appropriate method or as being more adequate than analytical approaches, but as an alternative to problem solving, that is rarely used by teachers and can be an asset to students’ performance, depending on their learning style. In the tasks proposed, before and after the module, the participants were asked to present more than one way of solving each problem. A certain type of solution was never imposed, either visual or analytical. They were always free to choose the path with which they best identified. Many have changed their options after the module, favoring visual approaches, but others, despite recognizing the potential of those strategies, continued to prefer analytical approaches, either because of their learning style or because their previous experiences were deeply rooted. Some also stated that the analytical approach gave them more confidence in its accuracy. We can say that, throughout the teaching experience, there was an appropriation of visual models of solution, alternative to more traditional ones these future teachers were used to apply, which constitutes a learning indicator even in the case of individuals with more analytical learning styles.
6. Conclusions
Specific facts, formulas, algorithms, and procedures are powerful tools in mathematics. Although they are tools with which we do not create mathematics, it is important that they are acquired with understanding. The strategy seeing [4], with or without the use of visual contexts, contributes to meaningful learning, so it is important for the teacher to use other strategies, in addition to analytical ones, that help understand a situation for itself or allow for paving the way for another solution. Models (e.g., bar model) are often criticized because, if taught, they will not be very different from memorizing algorithms. In fact, there are a number of procedures that underlie its use. However, what distinguishes their use from the algorithms is that they are a powerful tool to make sense to students, assuming themselves as ways of thinking [26] and must be applied when necessary, since, from a certain stage, numerical processes are faster and more effective.
Rational numbers have a significant presence in the mathematics curricula, but traditionally students evidence difficulties or even a poor performance in this domain [15,16], which leads us, as teacher educators, to reflect on ways to overcome this situation. One of the main difficulties relies on the lack of fluency when it comes to conceptual knowledge compared to the fluent application of routine procedures that is usually acquired [6,17]. This aspect frequently emerges when students are confronted with non-routine problems that imply fluent reasoning concerning concepts and representations.
In addition, it is common that pre-service teachers reflect the same problems as their future students during the training period, reinforcing the need to confront them with the same approaches we expect them to use in their practices.
Given this scenario, it is important to use visual strategies, in alternative to analytical ones, and, in particular, the bar model, so that future teachers develop a deeper knowledge of the approach to this topic with their students. It is expected that they can refine this competence themselves, identifying the potential and opportunity of visual and analytical approaches. As Arcavi [12] and Presmeg [3] inferred, the use of visual representations must accompany the construction and use of symbolic representations. However, we are aware that the visual approach is not extensible to all types of problems and may not always be helpful. The possible potentialities and limitations of a visual aid will depend on the type of information that the student will be able to remove (or add), which depends on their style of thinking, previous knowledge, and past teaching experiences [3,12]. Thus, teachers must also be aware of these aspects in order to adjust their practices to develop students’ visual skills, as a further contribution to the understanding of rational numbers [4].
Results from this study showed that pre-service teachers felt more comfortable in using analytical strategies to solve multiple-solution problems with rational numbers due to their previous experiences as students. The teaching module they were exposed to motivated the use of visual approaches by many of the participants, that recognized these strategies as useful, either to solve non-routine problems, where conceptual knowledge is needed or to help give meaning to numeric manipulation. Some of these future teachers, despite maintaining their preference for analytical strategies, recognized the importance of contacting with alternative solution methods.
To conclude, the teacher must have a wide repertoire of tasks to propose to students in order to highlight some of the ideas that were discussed throughout this article. Strategies should be taught explicitly to students if they do not arise naturally. The work we have been conducting in terms of pre-service teacher training points out that future teachers themselves acquire fluency and flexibility in problem solving, while at the same time they have one more resource to interpret and solve many other situations with which they are confronted, in addition to increasing the didactical knowledge, essential for their future work.
Author Contributions
Conceptualization, A.B. and I.V.; methodology, A.B. and I.V.; validation, A.B. and I.V.; formal analysis, A.B. and I.V.; investigation, A.B. and I.V.; data curation, A.B. and I.V.; writing—original draft preparation, A.B. and I.V.; writing—review and editing, A.B. and I.V. All authors have read and agreed to the published version of the manuscript.
Funding
This research received no external funding.
Institutional Review Board Statement
The study was conducted according to the guidelines of the Declaration of Helsinki, and approved by Institutional Review Board of the Polythecnic Institute of Viana do Castelo (protocol code #PP-IPVC-01-2021, date of approval 23 April 2021).
Informed Consent Statement
Informed consent was obtained from all subjects involved in the study.
Data Availability Statement
The data presented in the study are available on request from the corresponding author. The data are nor publicly available due to privacy issues.
Acknowledgments
This work was developed in the context of the project PTDC/CED-EDG/32422/2017, supported by national funds through FCT—Foundation for Science and Technology, I. P.
Conflicts of Interest
The authors declare no conflict of interest.
Appendix A
Figure A1.
Problems posed Before the intervention.

Figure A2.
Problems posed After the intervention.

References
- Moss, J.; Case, R. Developing children’s understanding of the rational numbers: A new model and an experimental curriculum. J. Res. Math. Educ. 1999, 30, 122–147. [Google Scholar] [CrossRef] [Green Version]
- Pólya, G. How to Solve it: A New Aspect of Mathematical Method; Princeton University Press: Princeton, NJ, USA, 1945. [Google Scholar]
- Presmeg, N. Creative advantages of visual solutions to some non-routine mathematical problems. In Proceedings of the Problem@Web International Conference: Technology, Creativity and Affect in Mathematical Problem Solving, Faro, Portugal, May 2014; Carreira, S., Amado, N., Jones, K., Jacinto, H., Eds.; Universidade do Algarve: Faro, Portugal, 2014; Available online: https://sapientia.ualg.pt/handle/10400.1/3750 (accessed on 12 October 2021).
- Vale, I.; Pimentel, T.; Barbosa, A. The power of seeing in problem solving and creativity: An issue under discussion. In Broadening the Scope of Research on Mathematical Problem Solving: A Focus on Technology, Creativity and Affect; Amado, N., Carreira, S., Jones, K., Eds.; Springer: Cham, Switzerland, 2018; pp. 243–272. [Google Scholar]
- Tripathi, P.; Case, R. Developing mathematical understanding through multiple representations. Math. Teach. Middle Sch. 2008, 13, 438–445. [Google Scholar] [CrossRef]
- National Council of Teachers of Mathematics. Principles to Actions: Ensuring Mathematical Success for All; NCTM: Reston, VA, USA, 2014. [Google Scholar]
- Stylianou, D.; Silver, E. The role of visual representations in advanced mathematical problem solving: An examination of expert-novice similarities and differences. Math. Think. Learn. 2004, 6, 353–387. [Google Scholar] [CrossRef]
- Bruner, J. Toward a Theory of Instruction; Harvard University Press: Cambridge, MA, USA, 1966. [Google Scholar]
- Behr, M.; Harel, G.; Post, T.; Lesh, R. Rational number, ratio and proportion. In Handbook on Research of Teaching and Learning; Grouws, D., Ed.; McMillan: New York, NY, USA, 1992; pp. 296–333. [Google Scholar]
- Lesh, R.; Post, T.; Behr, M. Representations and translations among representations in mathematics learning and problem solving. In Problems of Representation in the Teaching and Learning of Mathematics; Javier, C., Ed.; Erlbaum: Hilsdale, MI, USA, 1987; pp. 33–40. [Google Scholar]
- Vale, I.; Barbosa, A. The importance of seeing in mathematics communication. J. Eur. Teach. Educ. Netw. 2017, 12, 49–63. [Google Scholar]
- Arcavi, A. The role of visual representations in the learning of mathematics. Educ. Stud. Math. 2003, 52, 215–241. [Google Scholar] [CrossRef]
- Woleck, K.R. Listen to their pictures: An investigation of children’s mathematical drawings. In The Roles of Representation in School Mathematics, 2001 Yearbook; Cuoco, A.A., Curcio, F.R., Eds.; NCTM: Reston, VA, USA, 2001; pp. 215–227. [Google Scholar]
- Krutetskii, V.A. The Psychology of Mathematical Abilities in Schoolchildren; University of Chicago Press: Chicago, IL, USA, 1976. [Google Scholar]
- Bailey, D.H.; Hoard, M.K.; Nugent, L.; Geary, D.C. Competence with fractions predicts gains in mathematics achievement. J. Exp. Child Psychol. 2012, 113, 447–455. [Google Scholar] [CrossRef] [Green Version]
- Pinto, H. O Desenvolvimento do Sentido da Multiplicação e da Divisão de Números Racionais. Ph.D. Thesis, Instituto de Educação da Universidade de Lisboa, Lisboa, Portugal, 2011. [Google Scholar]
- Behr, M.; Lesh, R.; Post, T.; Silver, E. Rational number concepts. In Acquisition of Mathematics Concepts and Processes; Lesh, R., Landau, M., Eds.; Academic Press: New York, NY, USA, 1983; pp. 92–126. [Google Scholar]
- Kieren, T. On the mathematical, cognitive and instructional foundations of rational numbers. In Number and Measurement: Papers from a Research Workshop; Lesh, R., Bradbard, D., Eds.; ERIC/SMEAC: Columbus, OH, USA, 1976; pp. 101–144. [Google Scholar]
- Lamon, S.J. Rational numbers and proportional reasoning: Toward a theoretical framework for research. In Second Handbook of Research on Mathematics Teaching and Learning, National Council of Teachers of Mathematics; Lester, F.K., Ed.; Information Age Publishing: Charlotte, NC, USA, 2007; pp. 629–668. [Google Scholar]
- Van den Heuvel-Panhuizen, M. The didactical use of models in realistic mathematics education: An example from a longitudinal trajectory on percentage. Educ. Stud. Math. 2003, 54, 9–35. [Google Scholar] [CrossRef]
- Cramer, K.; Wyberg, T. Efficacy of Different Concrete Models for Teaching the Part-Whole Construct for Fractions. Math. Think. Learn. 2009, 11, 226–257. [Google Scholar] [CrossRef]
- Owens, D.T. Study of the relationship of area concept and learning concepts by children in grades three and four. In Recent Research on Number Concepts, National Council of Teachers of Mathematics; Kieren, T.E., Ed.; ERIC/SMEAC: Columbus, OH, USA, 1980; pp. 629–668. [Google Scholar]
- Siegler, R.S.; Thompson, C.A.; Schneider, M. An Integrated Theory of Whole Number and Fractions Development. Cognitive Psychol. 2011, 62, 273–296. [Google Scholar] [CrossRef]
- Ng, S.F.; Lee, K. The model method: Singapore children’s tool for representing and solving algebraic word problems. J. Res. Math. Educ. 2009, 40, 282–313. [Google Scholar] [CrossRef]
- Beckman, S. Solving algebra and other story problems with simple diagrams: A method demonstrated in grade 4-6 texts used in Singapore. Math. Educ. 2004, 14, 42–46. [Google Scholar]
- Gravemeijer, K. What makes mathematics so difficult, and what can we do about it? In Educação Matemática: Caminhos e Encruzilhadas; Santos, L., Canavarro, A.P., Brocardo, J., Eds.; APM: Lisboa, Portugal, 2005; pp. 83–101. [Google Scholar]
- D’Ambrosio, B.S.; Mewborn, D.S. Children’s constructions of fractions and their implications for classroom instruction. J. Res. Math. Educ. 1994, 8, 150–161. [Google Scholar] [CrossRef]
- Uttal, D.H.; O’Doherty, K.; Newland, R.; Hand, L.L.; DeLoache, J. Dual Representation and the Linking of Concrete and Symbolic Representations. Child Dev. Perspect. 2009, 3, 156–159. [Google Scholar] [CrossRef]
- Opfer, J.; Siegler, R. Development of quantitative thinking. In The Oxford Handbook of Thinking and Reasoning; Holyoak, K., Morrison, R., Eds.; Oxford University Press: Oxford, UK, 2012; pp. 585–605. [Google Scholar]
- Gates, P. Social class and the visual in mathematics. In Proceedings of the 8th MES Conference, Portland, OR, USA, 21–26 June 2015; Mukhopadhyay, S., Greer, B., Eds.; Portland State University: Portland, OR, USA, 2015. [Google Scholar]
- Singapore Math. Challenging Word Problems; Marshall Cavandish Education: Hougang, Singapore, 2011. [Google Scholar]
- Vale, I.; Barbosa, A. Mathematical problems: The advantages of visual strategies. J. Eur. Teach. Educ. Netw. 2018, 32, 23–33. [Google Scholar]
- Erickson, F. Qualitative Methods in Research on Teaching. In Handbook of Research on Teaching; Wittrockk, M., Ed.; MacMillan: New York, NY, USA, 1986; pp. 119–161. [Google Scholar]
- Miles, M.; Huberman, A. Qualitative Data Analysis; Sage Publications: Newbury Park, CA, USA, 1994. [Google Scholar]
Figure 1.
Figure divided into quarters.

Figure 2.
Figure divided into three parts.

Figure 3.
Figure divided into five parts.

Figure 4.
Paper folding to obtain eight equal parts.

Figure 5.
Example 1.

Figure 6.
Visual solution for example 1.

Figure 7.
Example 2.

Figure 8.
A visual solution for example 2.

Figure 9.
Task 4.

Figure 10.
Visual solution for task 4.

Figure 11.
Solutions presented before the intervention.

Figure 12.
Solutions presented after the intervention.

Figure 13.
Task 5.

Figure 14.
Visual solution for task 5.

Figure 15.
Alternative visual solution for task 5.

Figure 16.
Solutions presented before the intervention.

Figure 17.
Solutions presented after the intervention.


Table 1.
Types of strategies used before and after the intervention.
| Before | After | ||||
|---|---|---|---|---|---|
| Problem/Task | Visual Strategies (%) | Non-Visual Strategies (%) | Problem/Task | Visual Strategies (%) | Non-Visual Strategies (%) |
| 1 | 62.5 | 37.5 | 1 | 33 | 67 |
| 2 | 11.1 | 88.9 | 2 | 100 | 0 |
| 3 | 50 | 50 | 3 | 75 | 25 |
| 4 | 10 | 90 | 4 | 36.4 | 63.6 |
| 5 | 0 | 100 | 5 | 44.4 | 55.6 |
| Total | 26.7 | 73.3 | Total | 57.8 | 42.2 |
Publisher’s Note: MDPI stays neutral with regard to jurisdictional claims in published maps and institutional affiliations. |
© 2021 by the authors. Licensee MDPI, Basel, Switzerland. This article is an open access article distributed under the terms and conditions of the Creative Commons Attribution (CC BY) license (https://creativecommons.org/licenses/by/4.0/).
Share and Cite
MDPI and ACS Style
Barbosa, A.; Vale, I. A Visual Approach for Solving Problems with Fractions. Educ. Sci. 2021, 11, 727. https://0-doi-org.brum.beds.ac.uk/10.3390/educsci11110727
AMA Style
Barbosa A, Vale I. A Visual Approach for Solving Problems with Fractions. Education Sciences. 2021; 11(11):727. https://0-doi-org.brum.beds.ac.uk/10.3390/educsci11110727
Chicago/Turabian StyleBarbosa, Ana, and Isabel Vale. 2021. "A Visual Approach for Solving Problems with Fractions" Education Sciences 11, no. 11: 727. https://0-doi-org.brum.beds.ac.uk/10.3390/educsci11110727
Note that from the first issue of 2016, this journal uses article numbers instead of page numbers. See further details here.