
Predictors of College Enrollment across the Life Course: Heterogeneity by Age and Gender

Sociology/Anthropology Department, Shippensburg University, Shippensburg, Pennsylvania, PA 17013, USA
Educ. Sci. 2021, 11(7), 344; https://0-doi-org.brum.beds.ac.uk/10.3390/educsci11070344
Submission received: 10 May 2021
/
Revised: 28 June 2021
/
Accepted: 6 July 2021
/
Published: 13 July 2021
(This article belongs to the Section Higher Education)
Abstract
:Undergraduate college-going is now undertaken well into adulthood, but knowledge about what leads individuals to enroll derives nearly entirely from the study of the “traditionally-aged”. I examine whether and how predictors of enrollment vary as individuals progress through the life-course using nationally representative data from the United States, following a cohort from ages 18–45. Measures of social background and academic preparation are only weakly predictive beyond age 24, while the effects of gender are largest after age 35. Marriage appears to be a barrier to enrollment among males and females, but only until age 25. Involuntary job loss spurs college-going most strongly among those aged 35 or older, and particularly among women. Among those over age 25, marital dissolution predicts enrollment positively among females but negatively among males.
1. Introduction
If college-going was ever restricted to new high school graduates, that era is past. Today, over one-third of American degree-seeking undergraduates are aged 25 or older. At public two-year colleges, this figure is 41%, and at proprietary institutions it rises to 70%. 54% of students at less selective public and nonprofit four-year colleges are older than 24, compared with 14% of students at selective colleges (Author’s calculations using the National Postsecondary Student Aid Study 2016 [1]. Many institutions have even higher representations of older students. For instance, in 2015, 70% of undergraduates at Granite State University (a four-year public university in New Hampshire), 76% at the College of New Rochelle (a four-year private non-profit college in New York), and 68% at Spokane Community College (a two-year public college in Washington) were at least 25 (Author’s calculations from the US Integrated Postsecondary Education Data System (IPEDS)).
Age-diversity is under-appreciated in higher education research [2]. One study found that only 41 of the over 3000 articles in top higher education journals between 1990 and 2003 focused on older students [3]. Agenda-setting research focuses nearly exclusively on residential institutions where older participants are scarce [4,5]). The most heavily-used American postsecondary datasets either exclude older participants by design (e.g., the Educational Longitudinal Study of 2002) or include only a non-representative subset (e.g., the Beginning Postsecondary Students Longitudinal Study (The BPS includes only first-time college-goers)).
Biases against older students are built into organizational practices. For instance, though many institutions hold night and evening classes, few make administrative offices or counseling services available at such times. In the USA, federal aid determinations made on the basis of prior year income do not accommodate workers seeking to reduce hours (and income) upon enrollment, forcing a choice between enduring a year of reduced income without aid or continuing to work at an intensity that endangers program completion.
Scholarly common-sense regarding college enrollment was forged mostly through the study of “traditionally-aged” students. Comparatively little is known about what propels enrollment among older individuals, and virtually nothing is known about how such determinants vary by age or by gender within each age group. Understanding how people at different life-stages vary in how and why they come to enroll is essential to understanding how to serve age-diverse students. Low completion rates among older students suggest considerable room for improvement [6,7].
Below, I explore whether applying a standard model of enrollment across the life-course is empirically justified. I model enrollment behavior among a cohort of individuals from ages 18 through 45 using widely-used predictors, and observe how well these models perform in different age ranges. Given well-documented gender differences in the life course, I also investigate whether age-varying differences themselves vary by gender.
2. Theory and Prior Research
2.1. Accounts of Non-Traditional Enrollment
Human capital and social reproduction theories dominate accounts of college-going. In the former, enrollment decisions result from rational deliberation on the costs and benefits of additional schooling [8]. Crucial are an individual’s stock of competencies (including prior school performance) and preferences, the price of schooling, and labor market conditions [9]. The latter emphasizes the translation of familial cultural and economic resources into academic performance and schools’ capacity to disguise intergenerational resource transmission as realized merit [10].
These paradigms also dominate accounts of non-traditional enrollment [11]. Human capital theory predicts a negative age gradient for enrollment because of rising opportunity costs from lost wages and because older workers have fewer years to recover educational investments [12]. Initial returns to college completion also appear lower for older graduates [13,14]. Adult enrollment may be a response to shifting relative wages or updated information regarding the labor market value of skills [15]. Social reproduction theory predicts that educational (dis)advantage will cumulate across the life course [16]. and that among adults without a college degree natal family resources will continue to enable educational upgrading [17].
Both theories have found empirical confirmation. Cognitive ability and prior schooling are consistently associated with adult college-going [15,18,19,20,21,22]. Adult college-going is also associated with social background, including maternal education [20,21], paternal occupational prestige and household income [11,15].
Models of non-traditional college-going emphasize family and labor market influences [23]. Enrollment is less common when young children are present [20,21] except among middle-class whites [24]. Among women, enrollment is commoner prior to marriage or following a divorce [20,21].
Established approaches assume that influences on enrollment do not vary in strength or direction across the life course. Models of non-traditional college-going emphasize factors that are different than those of standard models because they expect the distribution of relevant factors (e.g., responsibility for young children) to differ by age group, not because they expect the factors to have different effects.
2.2. Heterogeneity by Age
Life-course sociology and developmental psychology provide bases for supposing postsecondary participation to be differentially motivated across the life course. In life-course sociology, culturally-specific social ages “constitute a basis for self-definition and specify appropriate behavior” [25,26]. Behavior deviating from age-graded expectations entails costs, whether due to social sanctioning [27,28] or because of friction with institutions that assume normative life-courses [29]. Such sanctions are rarely necessary because most individuals voluntarily turn age scripts into personal time-tables [30].
Life course sociology suggests why motivations may vary across the life course, but provides little guidance as to how. In Erikson’s [31] theory of ego-development, individuals move from a self-oriented to a more altruistic motivational regime as they age into middle adulthood. Accordingly, mature undergraduates frequently cite as motivations a desire to role model for children or give back to their communities [32,33]. Older undergraduates are less concerned with the social aspects of college than younger students and are more motivated by interest in subject matter [34,35,36].
2.3. Gender, Age, and Enrollment
In the United States as well as in many other rich countries, women have long since overtaken men in postsecondary participation and attainment [37,38]. Since reversals of categorical inequality for important outcomes are exceedingly rare, the reversal of the gender gap in educational attainment has received considerable scholarly attention. Women’s relative success in the educational domain is particularly remarkable given that the movement toward gender equality in the labor market—where education is supposed to “pay off”—has simultaneously stalled.
According to human capital accounts, the female educational advantage is attributable to one of three sources. First, women are supposed to have a higher college wage premium relative to men, particularly at the household level [39]. Second, females are held to have an advantage in non-cognitive skills conducive to schooling success, and males to have greater incidence of behavioral problems that derail achievement [40,41]. Therefore, when barriers to schooling fell due to declining discrimination, declining fertility, or expanded labor market opportunities, women not only closed the gender gap but reversed it [38,42].
In feminist-constructivist accounts, by contrast, individuals’ preferences, expectations, and interests are profoundly shaped by prevailing social definitions of gender in ways that influence schooling behavior. For example, college majors are culturally gender-typed, and this gendering has a clear impact on major choices over and above measured students’ competencies and even their interests [43,44]. Some researchers allege that schooling as a social institution has itself been culturally coded as “female” (relative to the economy) and thus is incompatible with certain masculinities [45,46].
Research finds non-traditional enrollment to be commoner among women rather than men, and the college enrollment gap to be greater after age 24 [12,47,48,49]. This may be a response to early career expansions in the gender wage gap, or to women’s disproportionate household wage decline in the wake of divorce. Women in “pink collar” jobs may more readily perceive occupational ladders to be blocked by a lack of credentialing than men in “blue-collar” industries. Additionally, gendered family roles may render college-going more viable for middle-adult mothers relative to fathers. Males’ “breadwinner” identity may disincline them from temporarily reducing income to accommodate enrollment [50]. Women’s desire to role model academic commitment may be more compatible with college-going [51]. Thus, the impact of employment- or family-based factors may vary by gender over the life course.
3. Data and Methods
3.1. Data
Data are from the National Longitudinal Survey of Youth, 1979 cohort (NLSY-79). Funded and directed by the U.S. Bureau of Labor Statistics (BLS), the NLSY-79 is a sample (n = 12,686) representative of people born between 1957 and 1964 and living in the United States in 1979. Researchers initially gathered three samples: a cross-sectional sample (n = 6111), an oversample of African Americans, Latinxs, and economically disadvantaged non-Black, non-Latinxs (n = 5295), and a sample of military enlistees (n = 1280). The base year response rate was 87%. Initial interviews occurred in 1979, and subjects were re-interviewed annually from 1980 until 1994 and biennially since. The BLS discontinued 85% of the military sample and the full economically disadvantaged non-Black, non-Latinx sample (n = 1643) after 1984 and 1990, respectively. Accounting for deaths, response rates were above 75% through 2014, and above 90% through 1994. As of 2014 nearly half of eligible participants had completed every round and 81% completed at least 20 rounds.
College enrollment is decreasingly common as the life course progresses. Because there are few undergraduates older than their early 40s, I made direct use of data gathered through 2010 (Wave 24), allowing all respondents to reach age 45. My sample is representative of the American population that passed through ages 18–45 between 1979 and 2009.
My risk set includes all individuals aged 18–45 without a bachelor’s degree. Respondents 18 and older in 1979 enter the exposure window in that year, and younger respondents enter upon turning 18. Individuals leave the risk set upon earning their bachelor’s degree or exiting the survey. I excluded individuals who exited the survey permanently prior to age 35, and applied weights to adjust for non-random attrition (I regressed the binary indicator for attrition by 35 on a large set of background variables. The model correctly classified 88.3% of cases (sensitivity = 70.7%; specificity = 95.1%). I then multiplied the predicted probabilities from this regression by the base year sampling weight.). What results is 195,676 observations clustered within 8960 individuals. As Table 1 shows, there is no age at which all respondents are present. Because NLSY-79 respondents were between ages 16–22 in the base year of the sample, only younger cohorts are represented in data at ages 18–21. Sample representation peaks at 22, but a small number of participants reported earning a bachelor’s degree prior to this age, leading them to exit the risk set.
3.2. Variables
The dependent variable is any undergraduate enrollment by individual i in year t. I do not distinguish between enrollments in two- and four-year institutions, that are full- or part-time, or that are full- or part-year. Enrollment is established through contemporaneous or retrospective (following a period of non-response) self-report. I allow for multiple enrollment spells, which is crucial when studying non-traditional enrollment [48].
Predictor variables include time-invariant measures of demographics and socioeconomic background, time-invariant measures of high school performance and experience, and time-varying measures of family and labor force status. I employ indicator variables for respondents’ gender and race/ethnicity (Latinx and Black versus non-Hispanic White/Other), factors consistently associated with college attendance [37,52]. I measure parental educational as the attainment of the respondent’s mother or father, whichever was highest, recoded categorically based on the reported years of education (less than twelve is coded as “less than high school”, exactly twelve as “high school degree”, thirteen through fifteen as “some college”, and sixteen or more as “bachelor’s degree or higher”.). Family income was reported in the survey’s baseline year and is defined as a proportion of that year’s national median income, adjusted for household size (To make household income relative to a household-scaled median, I calculate:
Family Income = hhi⁄(17,000((a + 0.7k) ^ 0.7/2.35))
(a + pk)f is a Census Bureau household multiplier in which a is the number of adults and k the number of children [53]. The value of this multiplier is 2.35 for a family with two adults and two children, and $17,000 was the median income for such a family in 1979.
Human capital theory predicts greater educational investment by those of higher academic “ability” [9], which I capture in two measures. I measure cognitive performance through scores on the Armed Services Qualifying Test (AFQT) scores. The NLSY-79 collected data from respondents’ high school transcripts. Grade point averages are unavailable, but individual course grades were collected and coded on an integer scale from 0 to 4. I measure high school grades as an average of up to 12 grades per respondent.
Peer effects on school performance and educational attainment are well established [54]. I create an index of disadvantaged high school peers from three items gathered from surveys sent to respondents’ high school administrators: the percentage of students considered economically disadvantaged, the percentage of either Black or Latinx students, and the school’s dropout rate (Chronbach’s α = 0.61). Higher values indicate more disadvantaged high school peers. I include a dummy variable identifying individuals who dropped out of high school, because doing so places an additional barrier between individuals and a college degree. Disciplinary problems in high school may indicate an underlying combativeness towards authority, or an exposure to a harsh disciplinary regime. I create an indicator for those reporting any suspension or expulsion during high school.
Gender traditionalism may particularly limit the schooling of women. In the base year, respondents indicated their agreement with statements relating to gender roles. Examples include “a woman’s place is in the home, not in the office or shop” and “the employment of wives leads to more juvenile delinquency”. Responses were in Likert-item format. I combined the responses to five questions into an index (Chronbach’s α = 0.81) in which higher scores indicate higher traditionalism.
Prior research on non-traditional enrollment emphasizes the role of family responsibilities. The NLSY79 contains contemporaneous and retrospective questions regarding the timing of family and work transitions. I define marital status through time-varying indicators for never-married and formerly-married (divorced, separated, or widowed) against a currently-married reference. I also include time-varying dummy variables indicating the responsibility for preschool-aged and elementary-school-aged children against all others as the reference.
Human capital theory discusses immediate labor market circumstances as increasingly impactful for enrollment further into adulthood [55]. I include three measures of labor market conditions. Involuntary job loss is defined as having suffered layoff or termination during the prior year. I include a measure of cumulative labor market experience from weekly work-hour arrays, averaged across each year, normed to a 40-h week, and cumulated over consecutive years (Time-varying measures of earnings and tenure are not available. The NLSY-79 did not include retrospective earnings or tenure questions for non-survey years after 1994, nor for individuals who missed a data collection wave.). Finally, I measure the macro-economic context through the national rate of GDP growth in the prior year (from publicly-available Bureau of Economic Analysis data).
3.3. Event History Models
In modeling the timing of events using person-period data, a discreet-time proportional hazards model employing the complimentary log-log link function is appropriate (Mills 2011). The model takes the basic form
The dependent variable Y is equal to 1 if the individual i is enrolled in year t and 0 otherwise. The right side of the equation includes a vector X of time-invariant predictors and a vector Z of time-varying predictors. However, because degree programs are multi-year, temporal autocorrelation will be substantial. I address this through a lagged enrollment term:
Because individuals closer to completing a degree may be more likely to enroll, I include a time-varying cumulative measure of prior enrollments. I control for years since the last school enrollment (at any level) with linear, squared, and cubic terms and introduce a linear trend year term to control for period effects. Finally, I address the unobserved individual-level predisposition to enroll with a variance-correction model, which uses clustered standard errors and a robust variance-covariance matrix (when repeated events are modeled, the events are not independent. The common practice is to adjust the variance-covariance matrix to take individual-level effects into account [56,57].
I separately analyze three age ranges: 18–24 (“traditional” college-going age), 25–34 (young adulthood), and 35–45 (early middle adulthood). I also conduct analyses of enrollment separately by gender within age ranges. I control for age ranges with linear and squared terms.
4. Findings
4.1. Descriptive Findings
Postsecondary participation was common in this sample; over half of respondents enrolled at some point. And they were, overall, quite successful. 30% of the sample earned a bachelor’s degree, implying that the completion rate given enrollment was just over 50% (Table 2). As was true of the age cohorts of which it is representative, this sample is largely Caucasian, and only 20% of sample members’ parents had completed college. Seventeen percent of the sample dropped out of high school at some point.
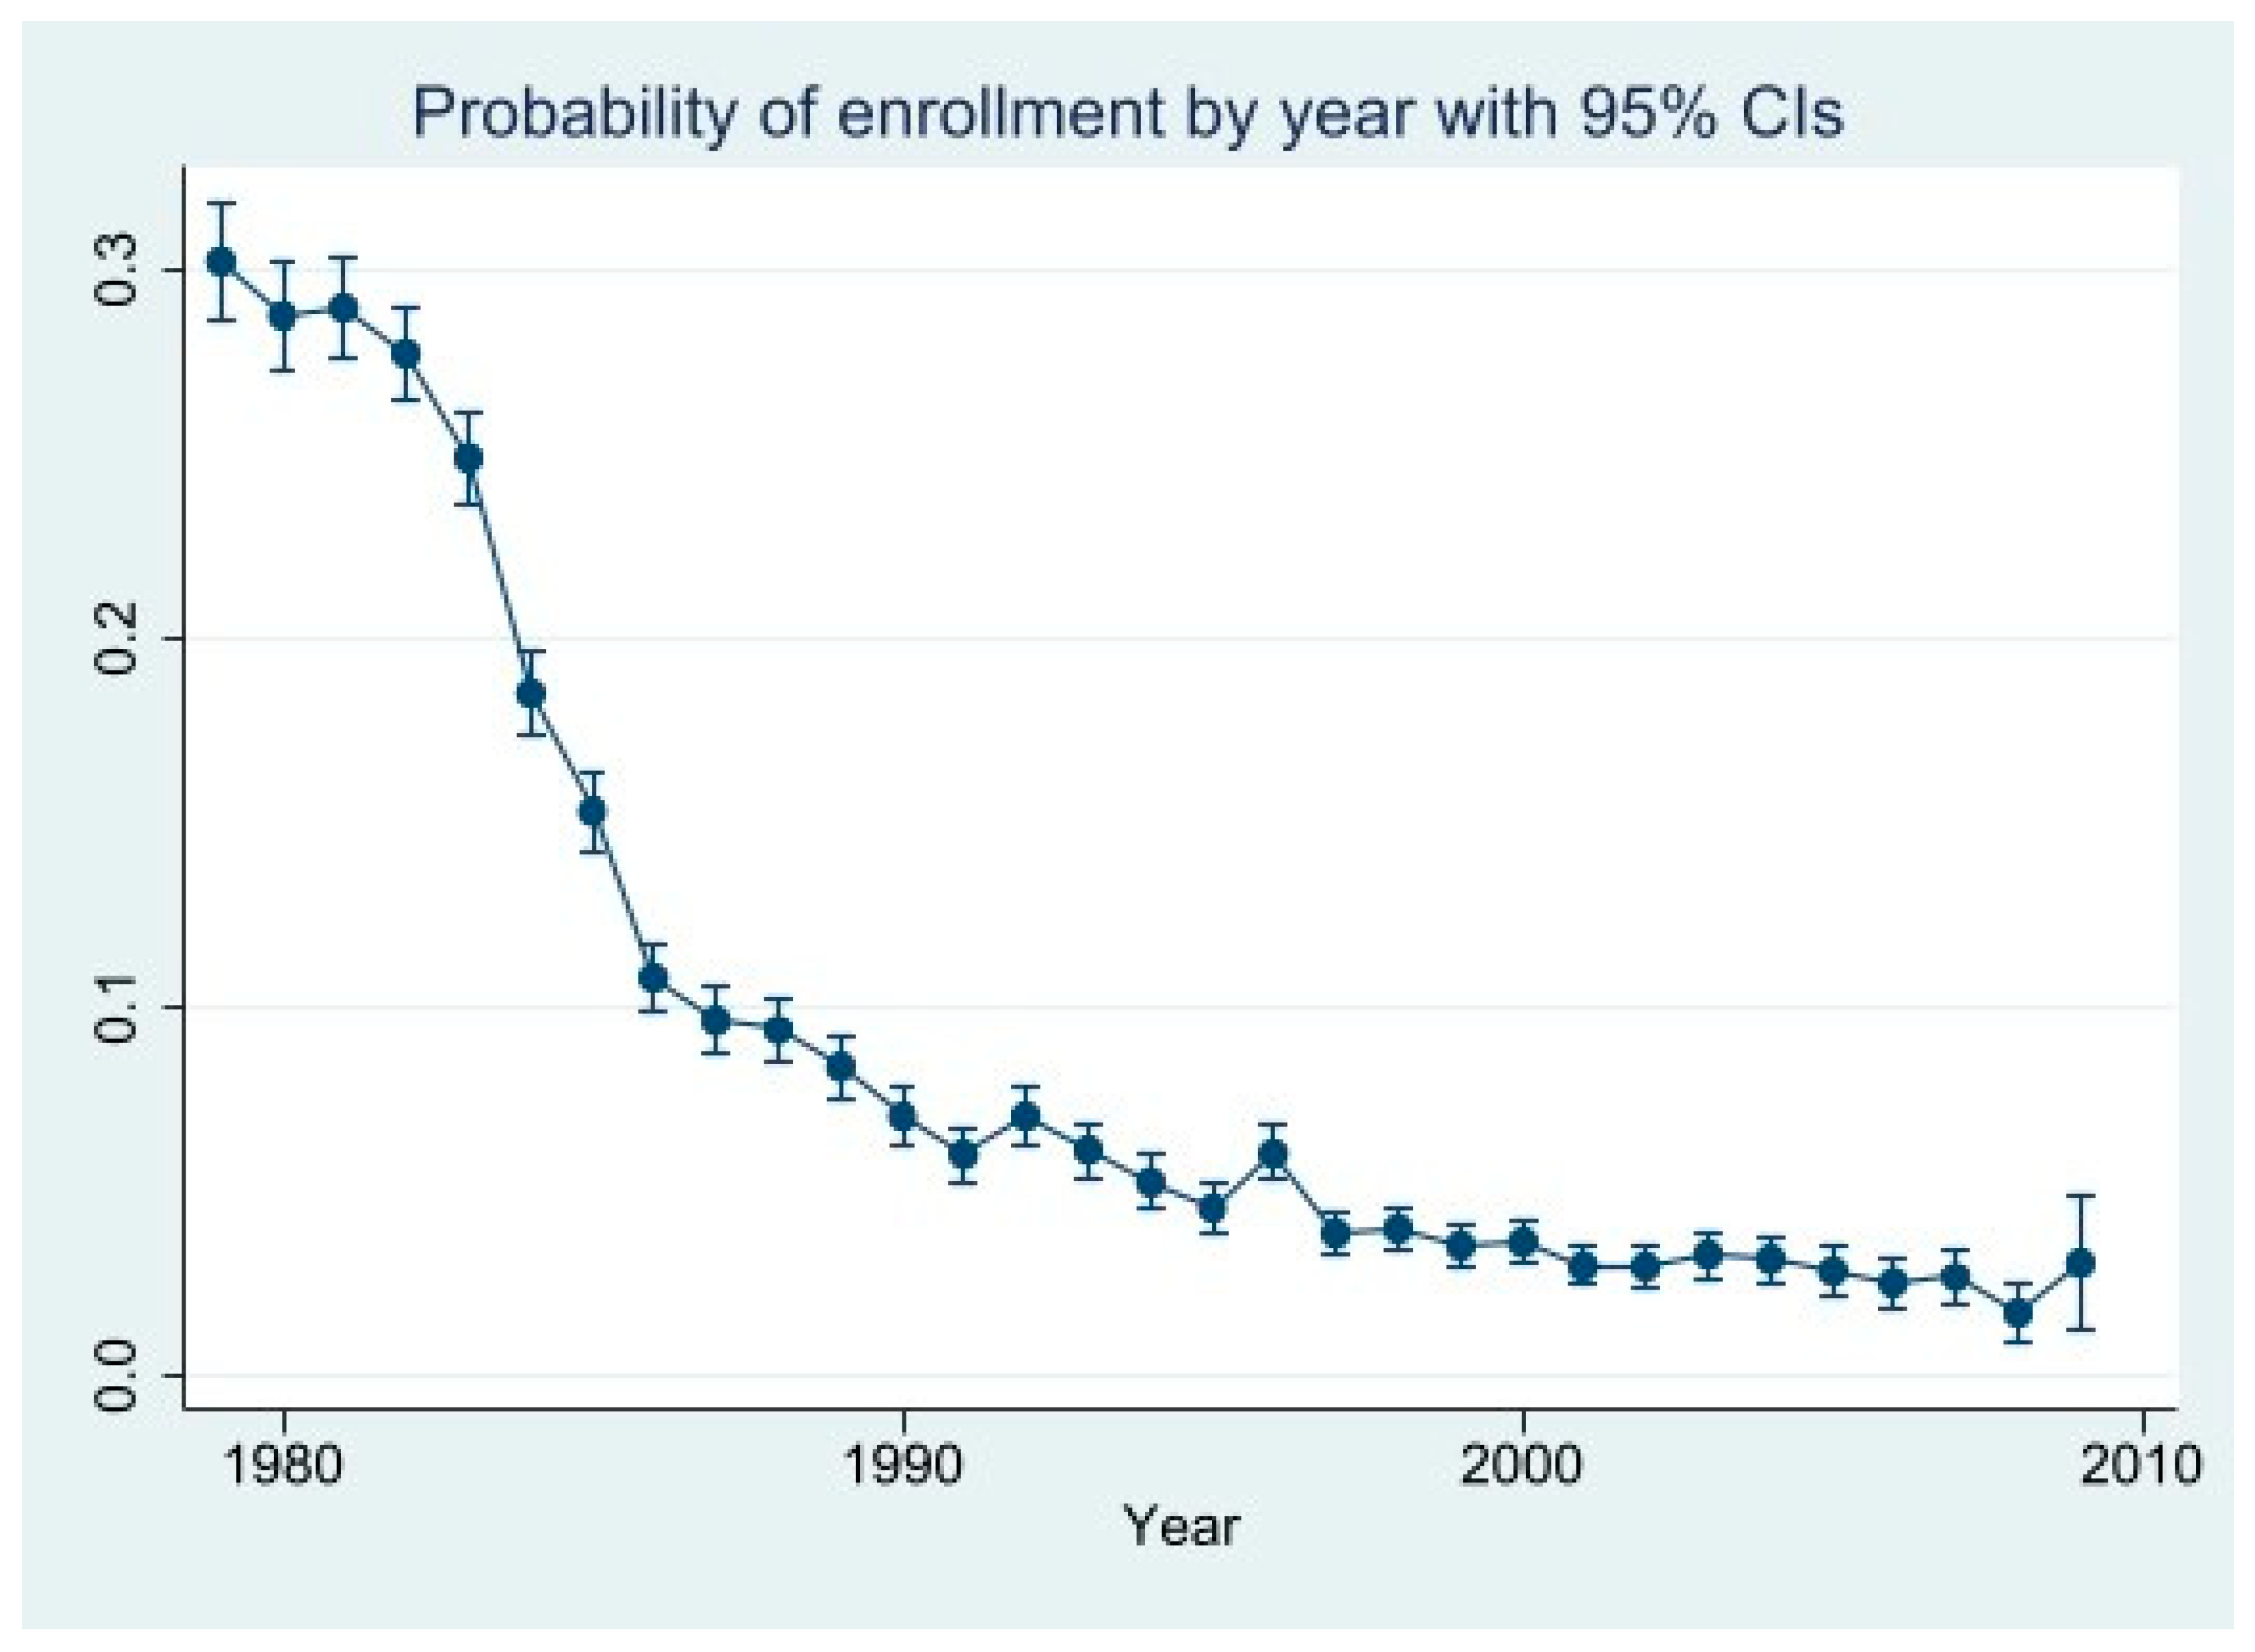
Figure 1 charts empirical enrollment rates by year. Enrollment peaked in 1979 at 30% and began to fall slowly thereafter. This drop can be understood by considering that the oldest sample members were 22 in the base year. Thus, respondents begin exiting the commonest years of college-going by 1981. Between 1984–1987 enrollment rates fell rapidly as the youngest respondents aged into their mid-20s. In 1991, when the youngest sample members were 27, just above 5% of the sample participated in any undergraduate education. This rate continued a steady but slow decline for the remainder of the period.
4.2. Heterogeneity by Age Group
I begin with a set of nested models predicting college enrollment among individuals aged 18–24 (Table 3). In the first column I include only race, gender, family background, and baseline factors (lagged enrollment, cumulative prior enrollments, etc.). In this age group, there are no net gender differences in enrollment. After controlling for SES, Latinxs are more likely to enroll than Whites, and Blacks are no more nor less likely to do so. Socioeconomic status, measured by both parental education and income, has a steep positive relationship with enrollment.
In the second column, I introduce academic variables and base-year gender attitudes. Doing so establishes that at similar levels of academic achievement, both African American and Latinx youths are more likely to enroll in college than Whites. Gender remains non-predictive. The introduction of academic variables substantially attenuates the coefficients on parental education and income variables, as expected. In the age groups, academic variables conform to expected patterns. High school grades and AFQT scores strongly predict enrollment, and histories of drop out and disciplinary problems are associated with a reduced probability of enrollment. Holding more traditional gender role beliefs also negatively predicts enrollment.
Work and family variables enter in the third column. Consistent with human capital predictions, greater labor market experience makes enrollment less likely, and involuntarily losing one’s job increases its likelihood. Relative to married individuals, the never-previously-married are more likely to attend college. Having preschool-aged dependents sharply lowers the odds of enrollment, but having elementary-school-aged dependents does not. Finally, enrollment is less common given a better economy in the prior year.
That very little of the foregoing is surprising should itself not be surprising. The correlates of enrollment among traditionally aged students accord with the established findings and theories because these findings and theories were forged through the empirical examination of precisely this age group. What remains to be seen is whether these results are similar at older ages.
Table 4 presents the same set of models for individuals aged 25–34. The prior pattern of no gender differences in enrollment recurs, but Blacks and Latinxs no longer enroll at higher rates than Whites. Indeed, Blacks appear less likely to enroll until academic background measures are controlled. Family socioeconomic background has a very weak relationship with enrollment even prior to the addition of academic measures. Those with college-educated parents are more likely to enroll than those whose parents did not finish high school, but this relationship is explained by high school performance.
The effects of academic variables are also much less sharp than they were at younger ages. High school grades and cognitive scores still seem to matter, but even these coefficients are much reduced. Dropping out of high school and disciplinary problems, which had clear negative impacts in traditional years, no longer have predictive value. However, in this age group, a net of other factors, among which having attended high school with disadvantaged peers, has a negative relationship with enrollment. The relationship between holding traditional gender roles and enrollment is near-identical among this age group and among the younger group.
As in younger ages, cumulative experience and a better economy are associated with lower odds of enrollment. In this age group, however, losing one’s job involuntarily does not seem to impact enrollment. This is surprising, given that older students are expected to be more impacted by immediate economic concerns. In this age group, the effect of being unmarried or divorced, relative to being married, remains positive but is not statistically significant. However, as with younger individuals, the presence of very small children appears to constrain enrollment.
On the whole, the established predictors of college-going are much less informative among young adults than among traditionally-aged individuals. That is, the coefficients have similar directions but diminished strength. The relationships between social and academic background and enrolment seem to fade with age. The effects of time-varying work and family variables are no stronger in this age group than at younger ages, and some observed relationships are weaker.
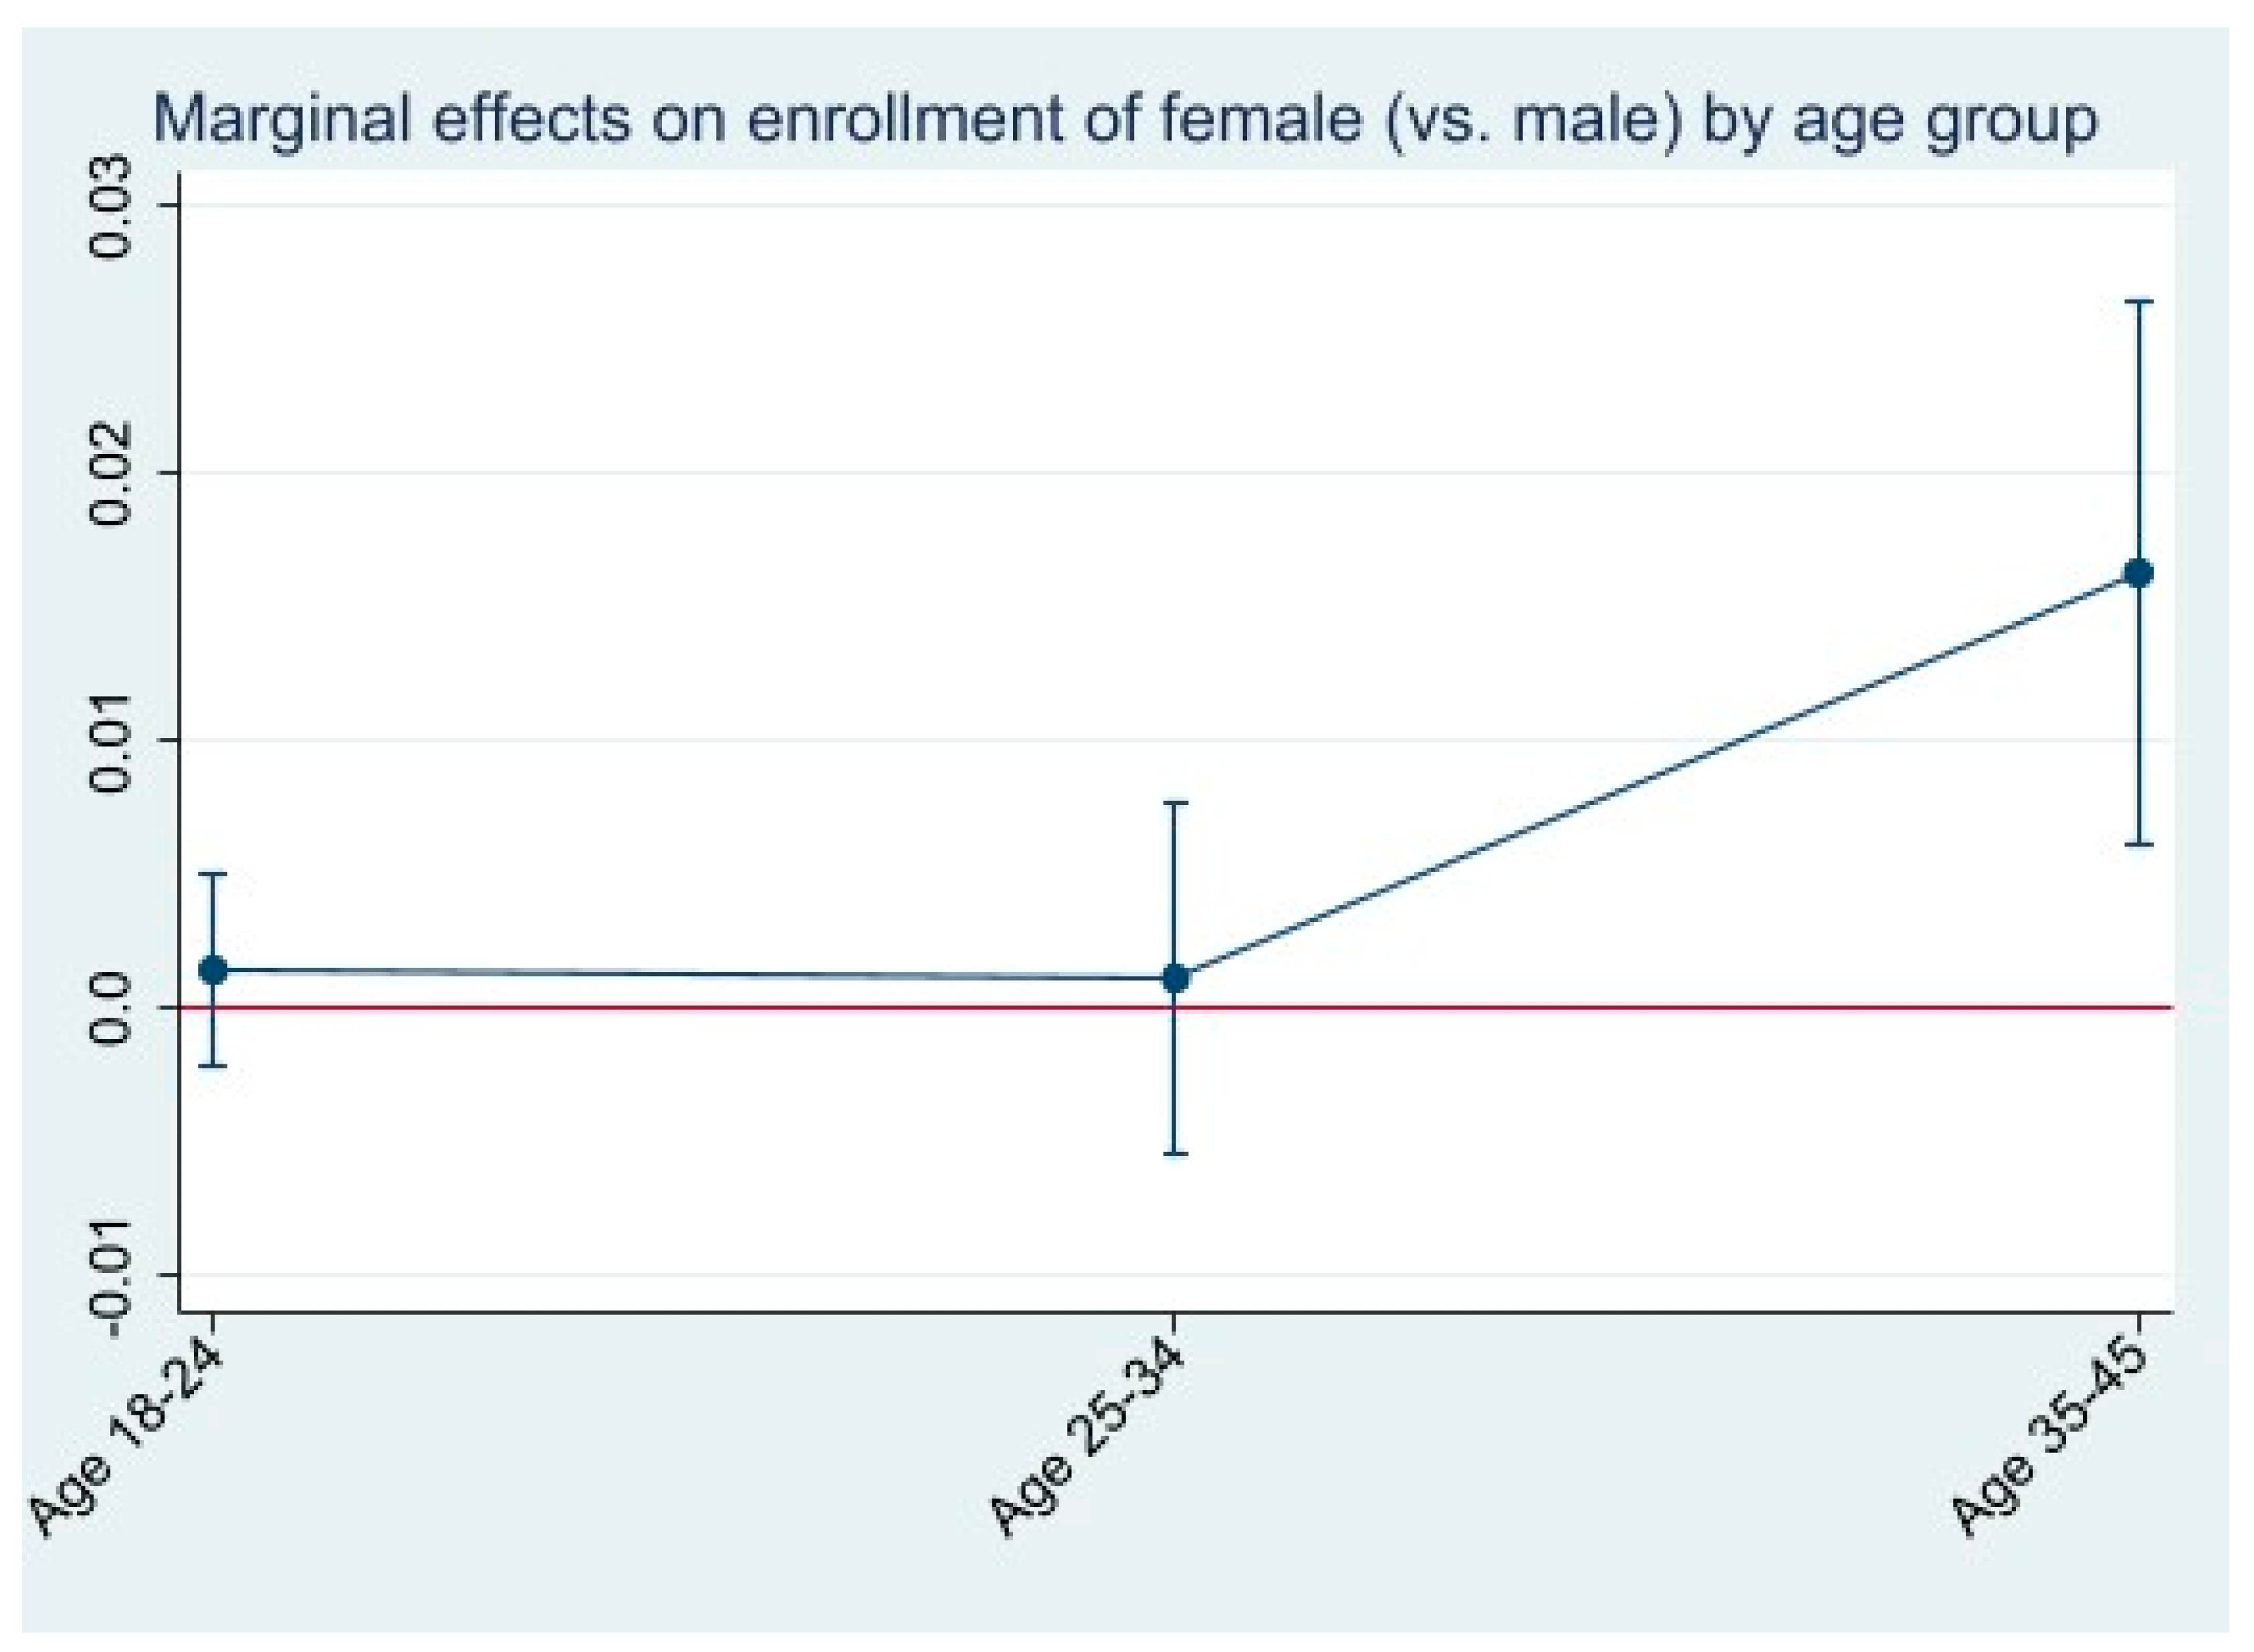
Table 5 moves this analysis further to ages 35–45. Here, gender becomes strongly predictive, with females more likely to enroll than males. This effect is strengthened, rather than explained, by the addition of academic controls. To confirm this finding, I combined age groups and regressed enrollment on the full set of controls, causing the gender and age group to interact. Figure 2 displays the marginal effects of gender by age group, confirming a statistically significant positive effect only among mid-life adults.
As was the case with traditionally-aged youths, among middle-adult individuals both Latinxs and African Americans appear more likely than Whites to enroll after controlling for academic background. However, as was the case with young adults, the socioeconomic background has little influence on enrollment behavior. Coefficients for academic variables, including cognitive scores, are even further reduced compared with young adults.
Responsibility for very young children continues to discourage enrollment, as does a faster-growing national economy. Otherwise, however, the effects of time-varying variables are different than in prior analyses. The effect of losing one’s job is considerably larger in middle adulthood than previously. Being never-married (relative to being married) seems to be negatively impactful in middle adulthood, while previously married individuals are no more likely to enroll.
4.3. Heterogeneity by Age and Gender
I present, in Table 6 and Table 7, full regression models for each age range, for females and males, respectively, to highlight key sources of gender variation across the life course. While racial differences in enrollment are gender-invariant, the influence of family socioeconomic status seems to work differently for males and females. In ages 18–24, parental education and income positively predict enrollment for both males and females, though among females the net effect of family income is apparent only before adding academic controls (not shown). Beginning in young adulthood, these effects vary strikingly. Parental education is positively related to enrollment among males into middle adulthood. But among females, this influence reverses after age 24. I examined a model including only class, race, and background measures (not shown) to investigate whether this pattern existed only the net of academic preparation, and this was not the case. While among females the relationship between family income and enrollment is non-significant after age 24, among males this effect reverses in young adulthood. Additional analyses revealed that this pattern does not depend on controlling for academic preparation or life-course measures either.
Table 6 and Table 7 provide no evidence of gender differences influencing academic preparation measures. Among both males and females, cognitive scores and high school grades positively predict enrollment, but their strength declines with age. Both disciplinary problems and dropout history cease to be predictive for both genders beyond traditional years. The relationship between school disadvantage and enrollment merits statistical significance only for females in young adulthood, but point estimates are similar by gender.
There are two suggestive gender differences in the influence of time-varying work and family measures. First, the association between losing one’s job involuntarily and subsequently enrolling in higher education appears larger for females than males, and particularly in young adulthood. Second, while after age 24 formerly married women are more likely to enroll in college than married women, formerly married men are less likely to enroll than their married counterparts. This effect is statistically significant only in young adulthood. For both males and females, the presence of small children discourages college participation into one’s mid-40s.
5. Discussion
The most striking finding above is the declining influence of social and academic background measures across the life course. This might be a result of the removal of cases from the risk set after students earn a bachelor’s degree. Effects are thus measured only among “survivors”. Social advantage and academic skill may “do their work” in traditional years, during which enrollment is sharply graded by these factors and in which the majority of college completion occurs. This can mute effects among survivors for three reasons. First, it may reduce variance in predictor variables, decreasing leverage. Second, if the effect of a predictor is non-linear, with greater effects at the higher reaches of its range, removing cases at the top of the distribution may remove the individuals among whom income or cognitive performance matters most. These concerns are restricted to continuously distributed predictors (e.g., family income, AFQT scores). Third, there may be negative selection into the “survivor” sample among privileged students according to an impactful unobserved measure. For example, presume that “intrinsic motivation” is commoner among those with wealthier parents, and also leads to greater college participation and completion. After traditional years, those remaining in the sample among the children of the wealthy will be those with lower intrinsic motivation, and parental income will no longer appear impactful.
These considerations do not invalidate the foregoing analysis, because in empirical reality those who are available to enroll in undergraduate education at older ages are the survivors. Thus, that among those who are older than 24, differences in social background or in high school achievement matter less for who will participate in higher education is useful knowledge. The other possibility is that the influence of one’s past fades in importance as one ages. Scars left by prior educational struggles may heal, and individual occupational mobility may lead to a muting of familial disadvantage over the course of adulthood.
Proximal events should be more directly impactful than ones at a greater remove. However, it is not the case that family and employment variables have a stronger influence on the enrollment of older adults than on that of 18–24-year-olds. The negative influence of cumulative labor force experience fades over the life course, even as labor force experience further cumulates and as variance in experience increases. In fact, the influence of family and work variables that I measure here accords with established expectations best among the traditionally aged. Some crucial life-course variables are missing from my analysis, but omitted variable bias is an unlikely explanation for the poor predictive performance of the conventional measures used here. I do not expect parental education or job experience to have a stronger influence on enrollment after factoring out contemporary household income.
The absence of gender differences until middle adulthood contrasts with consistent findings of female academic achievement relative to males [37]. This may be an artifact of the historical cohorts included in the data. NSLY-79 respondents moved through traditional college-going years during the early 1980s, when females were just beginning to eclipse males in college enrollment. Moreover, a bivariate analysis of gender and college-going among 18–24-year-olds in this data (not shown) reveals a small but statistically significant female advantage.
More significant is the growth of gender differences in middle adulthood, which accords with prior findings establishing female over-representation among older undergraduates relative to traditionally aged students [48]. There are three other phenomena that may be relevant here. First, echoing a growing body of research [52,58] disadvantaged minorities are more likely to enroll in the college net of socioeconomic background and academic preparation. Secondly, among males who reached age 25 without a degree, those from families in which income is high relative to education (e.g., the sons of better-paid blue-collar workers) were less likely to enroll than other males. This is not true of daughters from similar backgrounds. Finally, the effect of involuntary job loss seems greater on females than on males after age 24.
One possible explanation for these four findings is that for categorically disadvantaged individuals (females, Blacks and Latinxs), non-educational pathways to economic stability may be less available than they are to White males. There is evidence that well-paid blue-collar jobs remain monopolized by white males [59,60]. This may be due to biases among gatekeepers (employers or craft unions), exclusive job networks, or greater exposure in youth to same-gender role models in such trades. In comparison, the mobility pathway through higher education may be more accessible to females and racialized minorities.
That there is a gendered pattern in the relationship among parental education, parental income, and enrollment also accords with the thesis that education as an institution is “gendered”. Therefore, the composition of family capital (cultural/educational versus economic) matters in the expected way only for males: those from relatively cultural-capital-rich families invest more in education, while those in relatively economic-capital-rich families do not. Since school is gendered “female” relative to the economy, females on average resemble males from cultural-capital-rich families.
Finally, I find a gender-differentiated impact of divorce on enrollment, which accords with prior research [21]. The hypothesis that education is more relied upon by females than males in the absence of alternative routes to economic stability would explain why a positive effect is observed for females (but not males). It would not explain a negative effect among males. One possibility is that in the wake of marital breakdown, males and females perform parental responsibility in gendered ways. That is, males may double-down on a “provider” role, whereas females role model economic independence, meritocratic attainment, and moral role modeling through college-going.
6. Conclusions
Formal educational participation is now a life-course process. Today, individuals engage in formal education throughout adulthood, albeit differentially by age. Our conceptual apparatus for grasping college participation is only beginning to meet this reality. The established wisdom regarding why individuals enroll, persist, and complete was created almost entirely through the study of 18–24-year-olds, and we generally presume that with minor tweaks this wisdom can also be applied to older students.
In this study I tested the validity of this assumption. I found that family background and high school performance were excellent predictors of college-going among 18–24, but as individuals aged these measures’ association with enrollment rapidly attenuated and in some cases reversed. That this may be attributable to survivor effects does not lessen its importance: among those who remain, undergraduate participation is not sharply differentiated by class and high school performance. With prominent exceptions, time-varying family and work statuses seem also to have differential impacts on educational participation across the life-course, and among this cohort, the degree to which college-going is disproportionately female also varies by age.
That the factors influencing attendance and persistence may not be constant over the life-course is useful information for institutions seeking to serve age-diverse students. Marketing campaigns implicitly recognize this: institutions serving youth emphasize social opportunities, whereas marketing to adults does not. If varying processes of self-selection into education prevail across age groups, then what matters is not what varies between age groups, but what varies between those in different age groups who choose to enroll. Understanding these mechanisms can lead to a more precise tailoring of support services and instructional practices to support an age-diverse clientele. There is much to be learned in this regard. This study studies individuals who reached adulthood long ago, and so may not accurately describe the age-grading of college participation among more recent cohorts. Future research could test this study’s findings using cross-sectional data on contemporary college-goers.
Recognizing educational participation to be a life-course process requires a shift in analytical focus to trajectories of educational engagement as they unfold over time. This involves understanding educational processes as nested in the broader flow of individual lives, intertwined with family, labor-market, and other age-graded trajectories. These multidimensional processes themselves unfold within, and collectively contribute to, larger-scale processes of historical-institutional change. The historical eclipse of the “traditional student” beyond elite institutions has destroyed the wall insulating the academic universe from the broader world, and research must adjust to this reality.
Funding
This research received no external funding.
Institutional Review Board Statement
Not applicable.
Informed Consent Statement
Not applicable.
Data Availability Statement
Data publicly available through the US National Bureau of Labor Statistics. Contact the author for questions regarding Stata code.
Conflicts of Interest
The author declares no conflict of interest.
References
- National Center for Education Statistics Datalab. Available online: https://nces.ed.gov/datalab/index.aspx (accessed on 21 January 2020).
- Deil-Amen, R. The “traditional” college student: A smaller and smaller minority and its implications for diversity and access institutions. In Remaking College: The Changing Ecology of Higher Education; Kirst, M.W., Stevens, M.L., Eds.; Stanford University Press: Stanford, CA, USA, 2015; pp. 134–168. [Google Scholar]
- Donaldson, J.F.; Townsend, B.K. Higher education journals’ discourse about adult undergraduate students. J. Higiher Ed. 2007, 78, 27–50. [Google Scholar] [CrossRef]
- Arum, R.; Roksa, J. Academically Adrift: Limited Learning on College Campuses; University of Chicago Press: Chicago, IL, USA, 2011. [Google Scholar]
- Armstrong, E.A.; Hamilton, L.T. Paying for the Party: How College Maintains Inequality; Harvard University Press: Cambridge, MA, USA, 2013. [Google Scholar]
- Calcagno, J.C.; Crosta, P.; Bailey, T.; Jenkins, D. Does age of entrance affect community college completion probabilities? Evidence from a discrete-time hazard model. Ed. Eval. Pol. Anal. 2007, 29, 218–235. [Google Scholar] [CrossRef]
- Baum, S.; Bailey, T.; Bettinger, E.; Dynarski, S.; Hauptman, A.; Holzer, H.; Jacobs, J.; Little, K.; Long, B.T.; McPherson, M.; et al. Rethinking Pell Grants; College Board: New York, NY, USA, 2013. [Google Scholar]
- Manski, C.F. Adolescent econometricians: How do youth infer the returns to schooling. In Studies of Supply and Demand in Higher Education; Clotfelter, C., Rothschild, M., Eds.; University of Chicago Press: Chicago, IL, USA, 1993; pp. 43–60. [Google Scholar]
- Becker, G.S. Human Capital: A Theoretical and Empirical Analysis, with Special Reference to Education; University of Chicago Press: Chicago, IL, USA, 1964. [Google Scholar]
- Bourdieu, P.; Passeron, J.C. Reproduction in Education, Society and Culture; Sage: Beverly Hills, CA, USA, 1977. [Google Scholar]
- Elman, C.; Weiss, F. Adult educational participation and implications for employment in the US context. In Adult Learning in Modern Societies: An International Comparison from a Life-Course Perspective; Blossfeld, H., Kilpi-Jakonen, E., de Vilhena, D.V., Buchholz, S., Eds.; Edward Elgar: Northampton, MA, USA, 2014; pp. 79–97. [Google Scholar]
- Jepsen, C.; Montgomery, M. Back to school: An application of human capital theory for mature workers. Econ. Educ. Rev. 2012, 31, 168–178. [Google Scholar] [CrossRef] [Green Version]
- Monks, J. The impact of college timing on earnings. Econ. Educ. Rev. 1997, 16, 419–423. [Google Scholar] [CrossRef]
- Taniguchi, H. The influence of age at degree completion on college wage premiums. Res. Higher Educ. 2005, 46, 861–881. [Google Scholar] [CrossRef]
- Light, A. Hazard model estimates of the decision to reenroll in school. Labour Econ. 1995, 2, 381–406. [Google Scholar] [CrossRef]
- Kerckhoff, A.C.; Glennie, E. The Matthew effect in American education. Res. Soc. Educ. Social. 1999, 12, 35–66. [Google Scholar]
- Elman, C.; O’Rand, A.M. The effects of social origins, life events, and institutional sorting on adults’ school transitions. Soc. Sci. Res. 2007, 36, 1276–1299. [Google Scholar] [CrossRef]
- Bradburn, E.M.; Moen, P.; Dempster-McClain, D. Women’s return to school following the transition to motherhood. Soc. Forces 1995, 73, 1517–1551. [Google Scholar] [CrossRef]
- Astone, N.M.; Schoen, R.; Ensminger, M.; Rothert, K. School reentry in early adulthood: The case of inner-city African Americans. Soc. Educ. 2000, 73, 133–154. [Google Scholar] [CrossRef]
- Elman, C.; O’Rand, A.M. The race is to the swift: Socioeconomic origins, adult education, and wage attainment. Am. J. Soc. 2004, 110, 123–160. [Google Scholar] [CrossRef]
- Taniguchi, H.; Kaufman, G. Belated entry: Gender differences and similarities in the pattern of nontraditional college enrollment. Soc. Sci. Res. 2007, 36, 550–568. [Google Scholar] [CrossRef]
- Jacob, M.; Weiss, F. Class origin and young adults’ re-enrollment. Res. Soc. Strat. Mob. 2011, 29, 415–426. [Google Scholar] [CrossRef] [Green Version]
- Bean, J.P.; Metzner, B.S. A conceptual model of nontraditional undergraduate student attrition. Rev. Educ. Res. 1985, 55, 485–540. [Google Scholar] [CrossRef]
- Hostetler, A.J.; Sweet, S.; Moen, P. Gendered career paths: A life course perspective on returning to school. Sex Roles 2007, 56, 85–103. [Google Scholar] [CrossRef]
- Elder, G.H. Age differentiation and the life course. Annu. Rev. Soc. 1975, 1, 165–190. [Google Scholar] [CrossRef]
- Settersten, R.A.; Mayer, K.U. The measurement of age, age structuring, and the life course. Annu. Rev. Soc. 1997, 23, 233–261. [Google Scholar] [CrossRef] [Green Version]
- Neugarten, B.L.; Moore, J.W.; Lowe, J.C. Age norms, age constraints, and adult socialization. Am. J. Soc. 1965, 70, 710–717. [Google Scholar]
- Macmillan, R. ‘Constructing adulthood’: Agency and subjectivity in the transition to adulthood. Adv. Life Course Res. 2006, 11, 3–29. [Google Scholar] [CrossRef]
- Hogan, D.P. The variable order of events in the life course. Am. Soc. Rev. 1978, 43, 573–586. [Google Scholar] [CrossRef]
- Settersten, R.A. Age structuring and the rhythm of the life course. Handb. Life Course 2003, 1, 81–98. [Google Scholar]
- Erikson, E.H. Identity and the life cycle. Psychol Issue 1959, 1, 1–171. [Google Scholar]
- Reay, D.; Ball, S.; David, M. ‘It’s taking me a long time but I’ll get there in the end’: Mature students on access courses and higher education choice. Br. Educ. Res. J. 2002, 28, 5–19. [Google Scholar] [CrossRef]
- Wilsey, S.A. Comparisons of adult and traditional college-age student mothers: Reasons for college enrollment and views of how enrollment affects children. J. Coll. Stud. Dev. 2013, 54, 209–214. [Google Scholar] [CrossRef]
- McCune, V.; Hounsell, J.; Christie, H.; Cree, V.E.; Tett, L. Mature and younger students’ reasons for making the transition from further education into higher education. Teach. High. Educ. 2010, 15, 691–702. [Google Scholar] [CrossRef] [Green Version]
- Bye, D.; Pushkar, D.; Conway, M. Motivation, interest, and positive affect in traditional and nontraditional undergraduate students. Adult Educ. Q. 2007, 57, 141–158. [Google Scholar] [CrossRef]
- Johnson, M.L.; Taasoobshirazi, G.; Clark, L.; Howell, L.; Breen, M. Motivations of traditional and nontraditional college students: From self-determination and attributions, to expectancy and values. J. Contin. High. Educ. 2016, 64, 3–15. [Google Scholar] [CrossRef]
- Buchmann, C.; DiPrete, T.A. The growing female advantage in college completion: The role of family background and academic achievement. Am. Soc. Rev. 2006, 71, 515–541. [Google Scholar] [CrossRef]
- Goldin, C.; Katz, L.F.; Kuziemko, I. The homecoming of American college women: The reversal of the college gender gap. J. Econ. Perspect. 2006, 20, 133–156. [Google Scholar] [CrossRef] [Green Version]
- DiPrete, T.A.; Buchmann, C. Gender-specific trends in the value of education and the emerging gender gap in college completion. Demography 2006, 43, 1–24. [Google Scholar] [CrossRef]
- Jacob, B.A. Where the boys aren’t: Non-cognitive skills, returns to school and the gender gap in higher education. Econ. Educ. Rev. 2002, 21, 589–598. [Google Scholar] [CrossRef] [Green Version]
- Owens, J. Early childhood behavior problems and the gender gap in educational attainment in the United States. Soc. Educ. 2016, 89, 236–258. [Google Scholar] [CrossRef] [PubMed]
- Goldin, C. A grand gender convergence: Its last chapter. Am. Econ. Rev. 2014, 104, 1091–1119. [Google Scholar] [CrossRef] [Green Version]
- Barone, C. Some things never change: Gender segregation in higher education across eight nations and three decades. Soc. Educ. 2011, 84, 157–176. [Google Scholar] [CrossRef]
- Quadlin, N. From Major Preferences to Major Choices: Gender and Logics of Major Choice. Soc. Educ. 2020, 93, 91–109. [Google Scholar] [CrossRef]
- Morris, E.W. “Rednecks,”“Rutters,” and Rithmetic: Social Class, Masculinity, and Schooling in a Rural Context. Gend. Soc. 2008, 22, 728–751. [Google Scholar] [CrossRef]
- Heyder, A.; Kessels, U. Is school feminine? Implicit gender stereotyping of school as a predictor of academic achievement. Sex Roles 2013, 69, 605–617. [Google Scholar] [CrossRef]
- Wells, R.S.; Bills, D.B.; Devlin, M.E. The work-to-college transition: Postsecondary expectations and enrolment for young men and women in the US labour force. J. Vocat. Educ. Train. 2014, 66, 113–134. [Google Scholar] [CrossRef]
- Monaghan, D.B. Surviving the Gauntlet: Adult Undergraduates in American Higher Education. Doctoral Dissertation, CUNY Graduate Center, New York, NY, USA, 2015. [Google Scholar]
- Denice, P. Back to school: Racial and gender differences in adults’ participation in formal schooling, 1978–2013. Demography 2017, 54, 1147–1173. [Google Scholar] [CrossRef]
- Marks, A.; Turner, E.; Osborne, M. ‘Not for the likes of me’: The overlapping effect of social class and gender factors in the decision made by adults not to participate in higher education. J. Furth. High. Educ. 2003, 27, 347–364. [Google Scholar] [CrossRef]
- Wainwright, E.; Marandet, E. Parents in higher education: Impacts of university learning on the self and the family. Educ. Rev. 2010, 62, 449–465. [Google Scholar] [CrossRef]
- Ciocca Eller, C.; DiPrete, T.A. The paradox of persistence: Explaining the Black-White gap in bachelor’s degree completion. Am. Soc. Rev. 2018, 83, 1171–1214. [Google Scholar] [CrossRef]
- Citro, C.; Michaels, R. Measuring Poverty: A New Approach; National Academies Press: Washington, DC, USA, 1995. [Google Scholar]
- Sacerdote, B. Peer effects in education: How might they work, how big are they and how much do we know thus far? Handb. Econ. Educ. 2011, 3, 249–277. [Google Scholar]
- Elman, C.; O’Rand, A.M. Perceived job insecurity and entry into work-related education and training among adult workers. Soc. Sci. Res. 2002, 31, 49–76. [Google Scholar] [CrossRef]
- Box-Steffensmeier, J.M.; Zorn, C. Duration models for repeated events. J. Pol. 2002, 64, 1069–1094. [Google Scholar] [CrossRef]
- Box-Steffensmeier, J.M.; Jones, B.S. Event History Modeling: A Guide for Social Scientists; Cambridge University Press: Cambridge, UK, 2004. [Google Scholar]
- Bennett, P.R.; Lutz, A. How African American is the net black advantage? Differences in college attendance among immigrant blacks, native blacks, and whites. Soc. Educ. 2009, 82, 70–100. [Google Scholar] [CrossRef]
- Royster, D. Race and the Invisible Hand: How White Networks Exclude Black Men from Blue-Collar Jobs; University of California Press: Berkeley, CA, USA, 2003. [Google Scholar]
- Alexander, K.; Entwisle, D.; Olson, L. The Long Shadow: Family Background, Disadvantaged Urban Youth, and the Transition to Adulthood; Russell Sage: New York, NY, USA, 2014. [Google Scholar]
Figure 1.
Probability of postsecondary enrollment by year for full cohort.

Figure 2.
Marginal effect of gender on postsecondary enrollment, by age.


Table 1.
Frequency distribution of cases by age in the person-period data file.
| Age | Frequency | Age | Frequency |
|---|---|---|---|
| 18 | 4746 | 32 | 7148 |
| 19 | 5980 | 33 | 7118 |
| 20 | 7036 | 34 | 7077 |
| 21 | 7985 | 35 | 7053 |
| 22 | 8817 | 36 | 6963 |
| 23 | 8206 | 37 | 6865 |
| 24 | 7804 | 38 | 6775 |
| 25 | 7591 | 39 | 6674 |
| 26 | 7468 | 40 | 6588 |
| 27 | 7382 | 41 | 6490 |
| 28 | 7332 | 42 | 6379 |
| 29 | 7273 | 43 | 6275 |
| 30 | 7235 | 44 | 6184 |
| 31 | 7183 | 45 | 6049 |
Source: NLSY-79.
Table 2.
Descriptive statistics for analytic sample (N = 8960).
| Mean | SD | Min | Max | |
|---|---|---|---|---|
| Ever enrolled | 0.58 | 0 | 1 | |
| Earned bachelor’s | 0.30 | 0 | 1 | |
| Female | 0.46 | 0 | 1 | |
| White | 0.80 | 0 | 1 | |
| Latinx | 0.05 | 0 | 1 | |
| Black | 0.13 | 0 | 1 | |
| Parental education = Less than HS | 0.25 | 0 | 1 | |
| Parental education = HS gradute | 0.41 | 0 | 1 | |
| Parental education = Some college | 0.12 | 0 | 1 | |
| Parental education = bachelor’s/higher | 0.20 | 0 | 1 | |
| 1979 Family income (proportion of median) | 0.92 | 0.85 | 0 | 35.38 |
| Dropped out HS | 0.17 | 0 | 1 | |
| Average HS grades | 3.47 | 0.92 | 1 | 7 |
| School disadvantage | −0.15 | 0.72 | −2.69 | 9.22 |
| AFQT score | 49.29 | 28.99 | −35.38 | 112.82 |
| Discipline problem in HS | 0.21 | 0 | 1 | |
| Traditional gender values (1979) | 2.32 | 0.82 | 0.22 | 5 |
Source: NLSY-79.
Table 3.
Discreet-period hazard model of enrollment, ages 18–24.
| (1) | (2) | (3) | |
|---|---|---|---|
| Female | 0.998 | 0.959 | 1.005 |
| (0.026) | (0.027) | (0.029) | |
| Latinx | 1.143 *** | 1.383 *** | 1.353 *** |
| (0.041) | (0.057) | (0.057) | |
| Black | 0.991 | 1.405 *** | 1.306 *** |
| (Ref = White/other) | (0.029) | (0.057) | (0.055) |
| Parental education = HS | 1.580 *** | 1.276 *** | 1.292 *** |
| (0.076) | (0.061) | (0.064) | |
| Parental education = Some college | 1.842 *** | 1.443 *** | 1.429 *** |
| (0.100) | (0.078) | (0.080) | |
| Parental education = Bachelor’s/more | 2.341 *** | 1.625 *** | 1.566 *** |
| (Ref = Less than HS) | (0.125) | (0.087) | (0.087) |
| Family income 1979 | 1.152 *** | 1.068 ** | 1.057 * |
| (0.024) | (0.023) | (0.023) | |
| Ever dropped out HS | 0.382 *** | 0.393 *** | |
| (0.037) | (0.039) | ||
| HS grades | 1.142 *** | 1.130 *** | |
| (0.026) | (0.025) | ||
| Disadvantaged HS peers | 0.960 | 0.964 | |
| (0.022) | (0.022) | ||
| AFQT | 1.011 *** | 1.011 *** | |
| (0.001) | (0.001) | ||
| Discipline problem in HS | 0.815 *** | 0.824 *** | |
| (0.038) | (0.037) | ||
| Traditional gender beliefs | 0.927 *** | 0.937 ** | |
| (0.019) | (0.019) | ||
| Cumulative experience (years) | 0.872 *** | ||
| (0.012) | |||
| Involuntary unemployment (lag) | 1.059 * | ||
| (0.030) | |||
| Never married | 1.489 *** | ||
| (0.068) | |||
| Formerly married | 1.683 *** | ||
| (Ref = currently married) | (0.19) | ||
| Youngest child 0–5 years | 0.726 *** | ||
| (0.042) | |||
| Youngest child 6–12 years | 1.107 | ||
| (0.232) | |||
| GDP growth (lag) | 0.984 ** | ||
| (0.005) | |||
| Age | 0.172 *** | 0.159 *** | 0.140 *** |
| (0.0342) | (0.034) | (0.031) | |
| Age squared | 1.038 *** | 1.040 *** | 1.045 *** |
| (0.004) | (0.005) | (0.005) | |
| Years since school | 0.844 * | 0.887 | 0.934 |
| (0.058) | (0.060) | (0.067) | |
| Years since school squared | 0.983 | 0.961 | 0.962 |
| (0.034) | (0.026) | (0.030) | |
| Years since school cubed | 1.000 | 1.005 | 1.004 |
| (0.004) | (0.003) | (0.003) | |
| Prior enrollments | 1.344 *** | 1.267 *** | 1.260 *** |
| (0.023) | (0.024) | (0.024) | |
| Enrolled prior year | 4.017 *** | 3.536 *** | 3.496 *** |
| (0.209) | (0.194) | (0.195) | |
| Year | 0.971 *** | 0.973 *** | 0.994 |
| (0.007) | (0.007) | (0.007) | |
| Observations | 50,574 | 50,574 | 50,574 |
*** p < 0.001, ** p < 0.01, * p < 0.05; Constant term not displayed; Source: NLSY 79.
Table 4.
Discreet-period hazard model of enrollment, ages 25–34.
| (1) | (2) | (3) | |
|---|---|---|---|
| Female | 1.052 | 1.036 | 1.021 |
| (0.043) | (0.047) | (0.046) | |
| Latinx | 0.948 | 1.076 | 1.081 |
| (0.049) | (0.062) | (0.063) | |
| Black | 0.864 ** | 1.041 | 0.990 |
| (Ref = White/other) | (0.038) | (0.060) | (0.060) |
| Parental education = HS | 1.024 | 0.954 | 0.971 |
| (0.060) | (0.057) | (0.058) | |
| Parental education = Some college | 1.078 | 0.994 | 1.001 |
| (0.074) | (0.073) | (0.074) | |
| Parental education = Bachelor’s/more | 1.196 * | 1.055 | 1.048 |
| (Ref = Less than HS) | (0.086) | (0.075) | (0.074) |
| Family income 1979 | 0.984 | 0.946 | 0.955 |
| (0.033) | (0.033) | (0.033) | |
| Ever dropped out HS | 0.934 | 0.879 | |
| (0.072) | (0.066) | ||
| HS grades | 1.088 * | 1.088 * | |
| (0.037) | (0.037) | ||
| Disadvantaged HS peers | 0.929 * | 0.926 * | |
| (0.029) | (0.029) | ||
| AFQT | 1.005 *** | 1.006 *** | |
| (0.001) | (0.001) | ||
| Discipline problem in HS | 0.999 | 0.992 | |
| (0.059) | (0.060) | ||
| Traditional gender beliefs | 0.928 ** | 0.935 * | |
| (0.026) | (0.026) | ||
| Cumulative experience (years) | 0.972 *** | ||
| (0.0060) | |||
| Involuntary unemployment (lag) | 1.114 | ||
| (0.062) | |||
| Never married | 1.097 | ||
| (0.060) | |||
| Formerly married | 1.125 | ||
| (Ref = currently married) | (0.071) | ||
| Youngest child 0–5 years | 0.831 *** | ||
| (0.041) | |||
| Youngest child 6–12 years | 1.102 | ||
| (0.079) | |||
| GDP growth (lag) | 0.967 ** | ||
| (0.010) | |||
| Age | 0.916 | 0.934 | 1.013 |
| (0.145) | (0.147) | (0.161) | |
| Age Squared | 1.001 | 1.000 | 0.999 |
| (0.002) | (0.003) | (0.002) | |
| Years since school | 0.617 *** | 0.625 *** | 0.644 *** |
| (0.040) | (0.041) | (0.042) | |
| Years since school squared | 1.029 ** | 1.029 ** | 1.026 * |
| (0.011) | (0.011) | (0.010) | |
| Years since school cubed | 0.999 | 0.999 | 0.999 |
| (0.001) | (0.001) | (0.001) | |
| Prior enrollments | 1.128 *** | 1.115 *** | 1.115 *** |
| (0.012) | (0.013) | (0.013) | |
| Enrolled prior year | 2.232 *** | 2.269 *** | 2.322 *** |
| (0.239) | (0.245) | (0.251) | |
| Year | 1.025 ** | 1.029 ** | 1.040 *** |
| (0.009) | (0.009) | (0.009) | |
| Observations | 72,807 | 72,807 | 72,807 |
*** p < 0.001, ** p < 0.01, * p < 0.05; Constant term not displayed; Source: NLSY 79.
Table 5.
Discreet-period hazard model of enrollment, ages 35–45.
| (1) | (2) | (3) | |
|---|---|---|---|
| Female | 1.361 *** | 1.393 *** | 1.349 *** |
| (0.095) | (0.101) | (0.097) | |
| Latinx | 1.092 | 1.189 * | 1.202 * |
| (0.072) | (0.089) | (0.089) | |
| Black | 1.047 | 1.183 * | 1.201 * |
| (Ref = White/other) | (0.062) | (0.095) | (0.097) |
| Parental education = HS | 1.094 | 1.061 | 1.067 |
| (0.075) | (0.073) | (0.073) | |
| Parental education = Some college | 1.152 | 1.102 | 1.106 |
| (0.111) | (0.115) | (0.116) | |
| Parental education = Bachelor’s/more | 1.310 ** | 1.214 | 1.225 |
| (Ref = Less than HS) | (0.135) | (0.132) | (0.135) |
| Family income 1979 | 0.947 | 0.926 | 0.922 |
| (0.046) | (0.043) | (0.044) | |
| Ever dropped out HS | 0.993 | 0.970 | |
| (0.103) | (0.098) | ||
| HS grades | 1.025 | 1.025 | |
| (0.041) | (0.041) | ||
| Disadvantaged HS peers | 0.965 | 0.959 | |
| (0.042) | (0.041) | ||
| AFQT | 1.004 * | 1.004 * | |
| (0.001) | (0.001) | ||
| Discipline problem in HS | 1.032 | 1.032 | |
| (0.090) | (0.089) | ||
| Traditional gender beliefs | 1.018 | 1.009 | |
| (0.038) | (0.039) | ||
| Cumulative experience (years) | 0.996 | ||
| (0.005) | |||
| Involuntary unemployment (lag) | 1.277 ** | ||
| (0.117) | |||
| Never married | 0.834 * | ||
| (0.067) | |||
| Formerly married | 0.952 | ||
| (Ref = currently married) | (0.065) | ||
| Youngest child 0–5 years | 0.809 * | ||
| (0.072) | |||
| Youngest child 6–12 years | 1.067 | ||
| (0.072) | |||
| GDP growth (lag) | 0.955 * | ||
| (0.021) | |||
| Age | 0.665 | 0.640 * | 0.687 |
| (0.150) | (0.145) | (0.157) | |
| Age squared | 1.005 | 1.006 * | 1.005 |
| (0.002) | (0.002) | (0.003) | |
| Years since school | 0.704 *** | 0.698 *** | 0.702 *** |
| (0.035) | (0.035) | (0.035) | |
| Years since school squared | 1.015 ** | 1.016 ** | 1.016 ** |
| (0.005) | (0.005) | (0.005) | |
| Years since school cubed | 1.000 * | 1.000 * | 1.000 * |
| (0.001) | (0.0001) | (0.0001) | |
| Prior enrollments | 1.062 *** | 1.057 *** | 1.063 *** |
| (0.012) | (0.013) | (0.013) | |
| Enrolled prior year | 2.976 *** | 2.950 *** | 2.925 *** |
| (0.396) | (0.393) | (0.390) | |
| Year | 0.997 | 0.996 | 1.000 |
| (0.012) | (0.012) | (0.012) | |
| Observations | 72,295 | 72,295 | 72,295 |
*** p < 0.001, ** p < 0.01, * p < 0.05; Constant term not displayed; Source: NLSY 79.
Table 6.
Discreet-period hazard model of enrollment, females.
| (1) | (2) | (3) | |
|---|---|---|---|
| Ages 18–24 | Ages 25–34 | Ages 35–45 | |
| Latinx | 1.375 *** | 1.116 | 1.204 * |
| (0.078) | (0.084) | (0.107) | |
| Black | 1.281 *** | 1.049 | 1.178 |
| (Ref = White/other) | (0.073) | (0.077) | (0.109) |
| Parental education = HS | 1.279 *** | 0.849 * | 0.996 |
| (0.088) | (0.064) | (0.078) | |
| Parental education = Some college | 1.459 *** | 0.793 * | 0.983 |
| (0.113) | (0.071) | (0.104) | |
| Parental education = Bachelor’s/more | 1.674 *** | 0.826 * | 0.848 |
| (Ref = Less than HS) | (0.130) | (0.077) | (0.098) |
| Family income 1979 | 1.023 | 1.049 | 0.988 |
| (0.031) | (0.041) | (0.051) | |
| Ever dropped out HS | 0.483 *** | 0.881 | 0.971 |
| (0.064) | (0.096) | (0.115) | |
| HS grades | 1.124 *** | 1.098 * | 1.000 |
| (0.035) | (0.050) | (0.045) | |
| Disadvantaged HS peers | 0.968 | 0.913 * | 0.942 |
| (0.028) | (0.036) | (0.054) | |
| AFQT | 1.009 *** | 1.004 ** | 1.003 |
| (0.001) | (0.001) | (0.002) | |
| Discipline problem in HS | 0.870 * | 1.013 | 0.994 |
| (0.056) | (0.081) | (0.096) | |
| Traditional gender beliefs | 0.898 *** | 0.954 | 0.973 |
| (0.025) | (0.034) | (0.046) | |
| Cumulative experience (years) | 0.914 *** | 0.984 | 1.003 |
| (0.020) | (0.009) | (0.006) | |
| Involuntary unemployment (lag) | 1.040 | 1.201 * | 1.265 * |
| (0.040) | (0.094) | (0.131) | |
| Never married | 1.651 *** | 1.139 | 0.784 * |
| (0.094) | (0.078) | (0.078) | |
| Formerly married | 1.814 *** | 1.357 *** | 1.006 |
| (Re f= currently married) | (0.256) | (0.101) | (0.078) |
| Youngest child 0–5 years | 0.674 *** | 0.824 ** | 0.817 |
| (0.051) | (0.055) | (0.091) | |
| Youngest child 6–12 years | 1.001 | 1.120 | 1.175 * |
| (0.246) | (0.085) | (0.089) | |
| GDP growth (lag) | 0.992 | 0.971 * | 0.928 ** |
| (0.007) | (0.013) | (0.023) | |
| Age | 0.154 *** | 1.330 | 0.499 * |
| (0.045) | (0.273) | (0.137) | |
| Age squared | 1.043 *** | 0.995 | 1.009 * |
| (0.007) | (0.003) | (0.003) | |
| Years since school | 0.918 | 0.657 *** | 0.706 *** |
| (0.087) | (0.055) | (0.042) | |
| Years since school squared | 0.955 | 1.025 | 1.015 * |
| (0.040) | (0.013) | (0.005) | |
| Years since school cubed | 1.005 | 0.999 | 1.000 |
| (0.005) | (0.0005) | (0.0001) | |
| Prior enrollments | 1.259 *** | 1.120 *** | 1.067 *** |
| (0.033) | (0.017) | (0.014) | |
| Enrolled prior year | 3.192 *** | 2.199 *** | 2.596 *** |
| (0.234) | (0.302) | (0.400) | |
| Year | 0.988 | 1.023* | 0.991 |
| (0.010) | (0.012) | (0.015) | |
| Observations | 25,157 | 36,429 | 35,984 |
*** p < 0.001, ** p < 0.01, * p < 0.05; Constant term not displayed; Source: NLSY-79.
Table 7.
Discreet-period hazard model of enrollment, males.
| (1) | (2) | (3) | |
|---|---|---|---|
| Variables | Ages 18–24 | Ages 25–35 | Ages 35–45 |
| Latinx | 1.318 *** | 1.118 | 1.173 |
| (0.0814) | (0.0961) | (0.148) | |
| Black | 1.320 *** | 0.968 | 1.230 |
| (Ref = White/other) | (0.0812) | (0.0885) | (0.193) |
| Parental education = HS | 1.291 *** | 1.191 * | 1.298 |
| (0.0914) | (0.102) | (0.191) | |
| Parental education = Some college | 1.397 *** | 1.336 ** | 1.489 |
| (0.115) | (0.146) | (0.338) | |
| Parental education = Bachelor’s/more | 1.483 *** | 1.381 ** | 1.943 ** |
| (Ref = Less than HS) | (0.118) | (0.136) | (0.399) |
| Family income 1979 | 1.081 * | 0.862 ** | 0.889 |
| (0.0332) | (0.0485) | (0.0802) | |
| Ever dropped out HS | 0.319 *** | 0.952 | 1.055 |
| (0.0456) | (0.0964) | (0.183) | |
| HS grades | 1.138 *** | 1.075 | 1.059 |
| (0.0358) | (0.0519) | (0.0732) | |
| Disadvantaged HS peers | 0.958 | 0.934 | 1.015 |
| (0.0319) | (0.0481) | (0.0821) | |
| AFQT | 1.012 *** | 1.007 *** | 1.005 |
| (0.00117) | (0.00175) | (0.00352) | |
| Discipline problem in HS | 0.808 *** | 1.000 | 1.132 |
| (0.0495) | (0.0824) | (0.167) | |
| Traditional gender beliefs | 0.977 | 0.907 * | 1.069 |
| (0.0288) | (0.0384) | (0.0715) | |
| Cumulative experience (years) | 0.839 *** | 0.974 ** | 0.986 |
| (0.0154) | (0.00808) | (0.00752) | |
| Involuntary unemployment (lag) | 1.073 | 1.063 | 1.350 |
| (0.0438) | (0.0837) | (0.243) | |
| Never married | 1.301 *** | 1.051 | 0.906 |
| (0.0959) | (0.0901) | (0.115) | |
| Formerly married | 1.453 * | 0.776 * | 0.820 |
| (Ref = currently married) | (0.274) | (0.0858) | (0.113) |
| Youngest child 0–5 years | 0.824 * | 0.837 * | 0.759 |
| (0.0732) | (0.0606) | (0.109) | |
| Youngest child 6–12 years | 1.478 | 0.981 | 0.903 |
| (0.611) | (0.139) | (0.110) | |
| GDP growth (lag) | 0.977 ** | 0.963 * | 1.032 |
| (0.00812) | (0.0155) | (0.0413) | |
| Age | 0.137 *** | 0.779 | 1.388 |
| (0.0438) | (0.192) | (0.557) | |
| Age squared | 1.046 *** | 1.003 | 0.996 |
| (0.00782) | (0.00423) | (0.00502) | |
| Years since school | 0.947 | 0.629 *** | 0.698 *** |
| (0.102) | (0.0653) | (0.0679) | |
| Years since school squared | 0.969 | 1.029 | 1.019 |
| (0.0451) | (0.0171) | (0.0103) | |
| Years since school cubed | 1.003 | 0.999 | 1.000 |
| (0.00593) | (0.000742) | (0.000291) | |
| Prior enrollments | 1.268 *** | 1.115 *** | 1.061 * |
| (0.0353) | (0.0202) | (0.0274) | |
| Enrolled prior year | 3.721 *** | 2.386 *** | 3.706 *** |
| (0.306) | (0.403) | (1.009) | |
| Year | 0.999 | 1.058 *** | 1.012 |
| (0.0113) | (0.0150) | (0.0223) | |
| Observations | 25,417 | 36,378 | 36,311 |
*** p < 0.001, ** p < 0.01, * p < 0.05; Constant term not displayed; Source: NLSY-79.
Publisher’s Note: MDPI stays neutral with regard to jurisdictional claims in published maps and institutional affiliations. |
© 2021 by the author. Licensee MDPI, Basel, Switzerland. This article is an open access article distributed under the terms and conditions of the Creative Commons Attribution (CC BY) license (https://creativecommons.org/licenses/by/4.0/).
Share and Cite
MDPI and ACS Style
Monaghan, D.B. Predictors of College Enrollment across the Life Course: Heterogeneity by Age and Gender. Educ. Sci. 2021, 11, 344. https://0-doi-org.brum.beds.ac.uk/10.3390/educsci11070344
AMA Style
Monaghan DB. Predictors of College Enrollment across the Life Course: Heterogeneity by Age and Gender. Education Sciences. 2021; 11(7):344. https://0-doi-org.brum.beds.ac.uk/10.3390/educsci11070344
Chicago/Turabian StyleMonaghan, David B. 2021. "Predictors of College Enrollment across the Life Course: Heterogeneity by Age and Gender" Education Sciences 11, no. 7: 344. https://0-doi-org.brum.beds.ac.uk/10.3390/educsci11070344
Note that from the first issue of 2016, this journal uses article numbers instead of page numbers. See further details here.