
Organizational Differences among Universities in Three Socioeconomic Contexts: Finland, Spain and Ecuador. Relational Coordination Approach


 , ,
, , 
Abstract
:1. Introduction
Socioeconomic Contexts
2. Materials and Methods
2.1. Data Collection and Survey
2.2. Statistical Analysis
3. Results
3.1. Identification of Organizational Differences
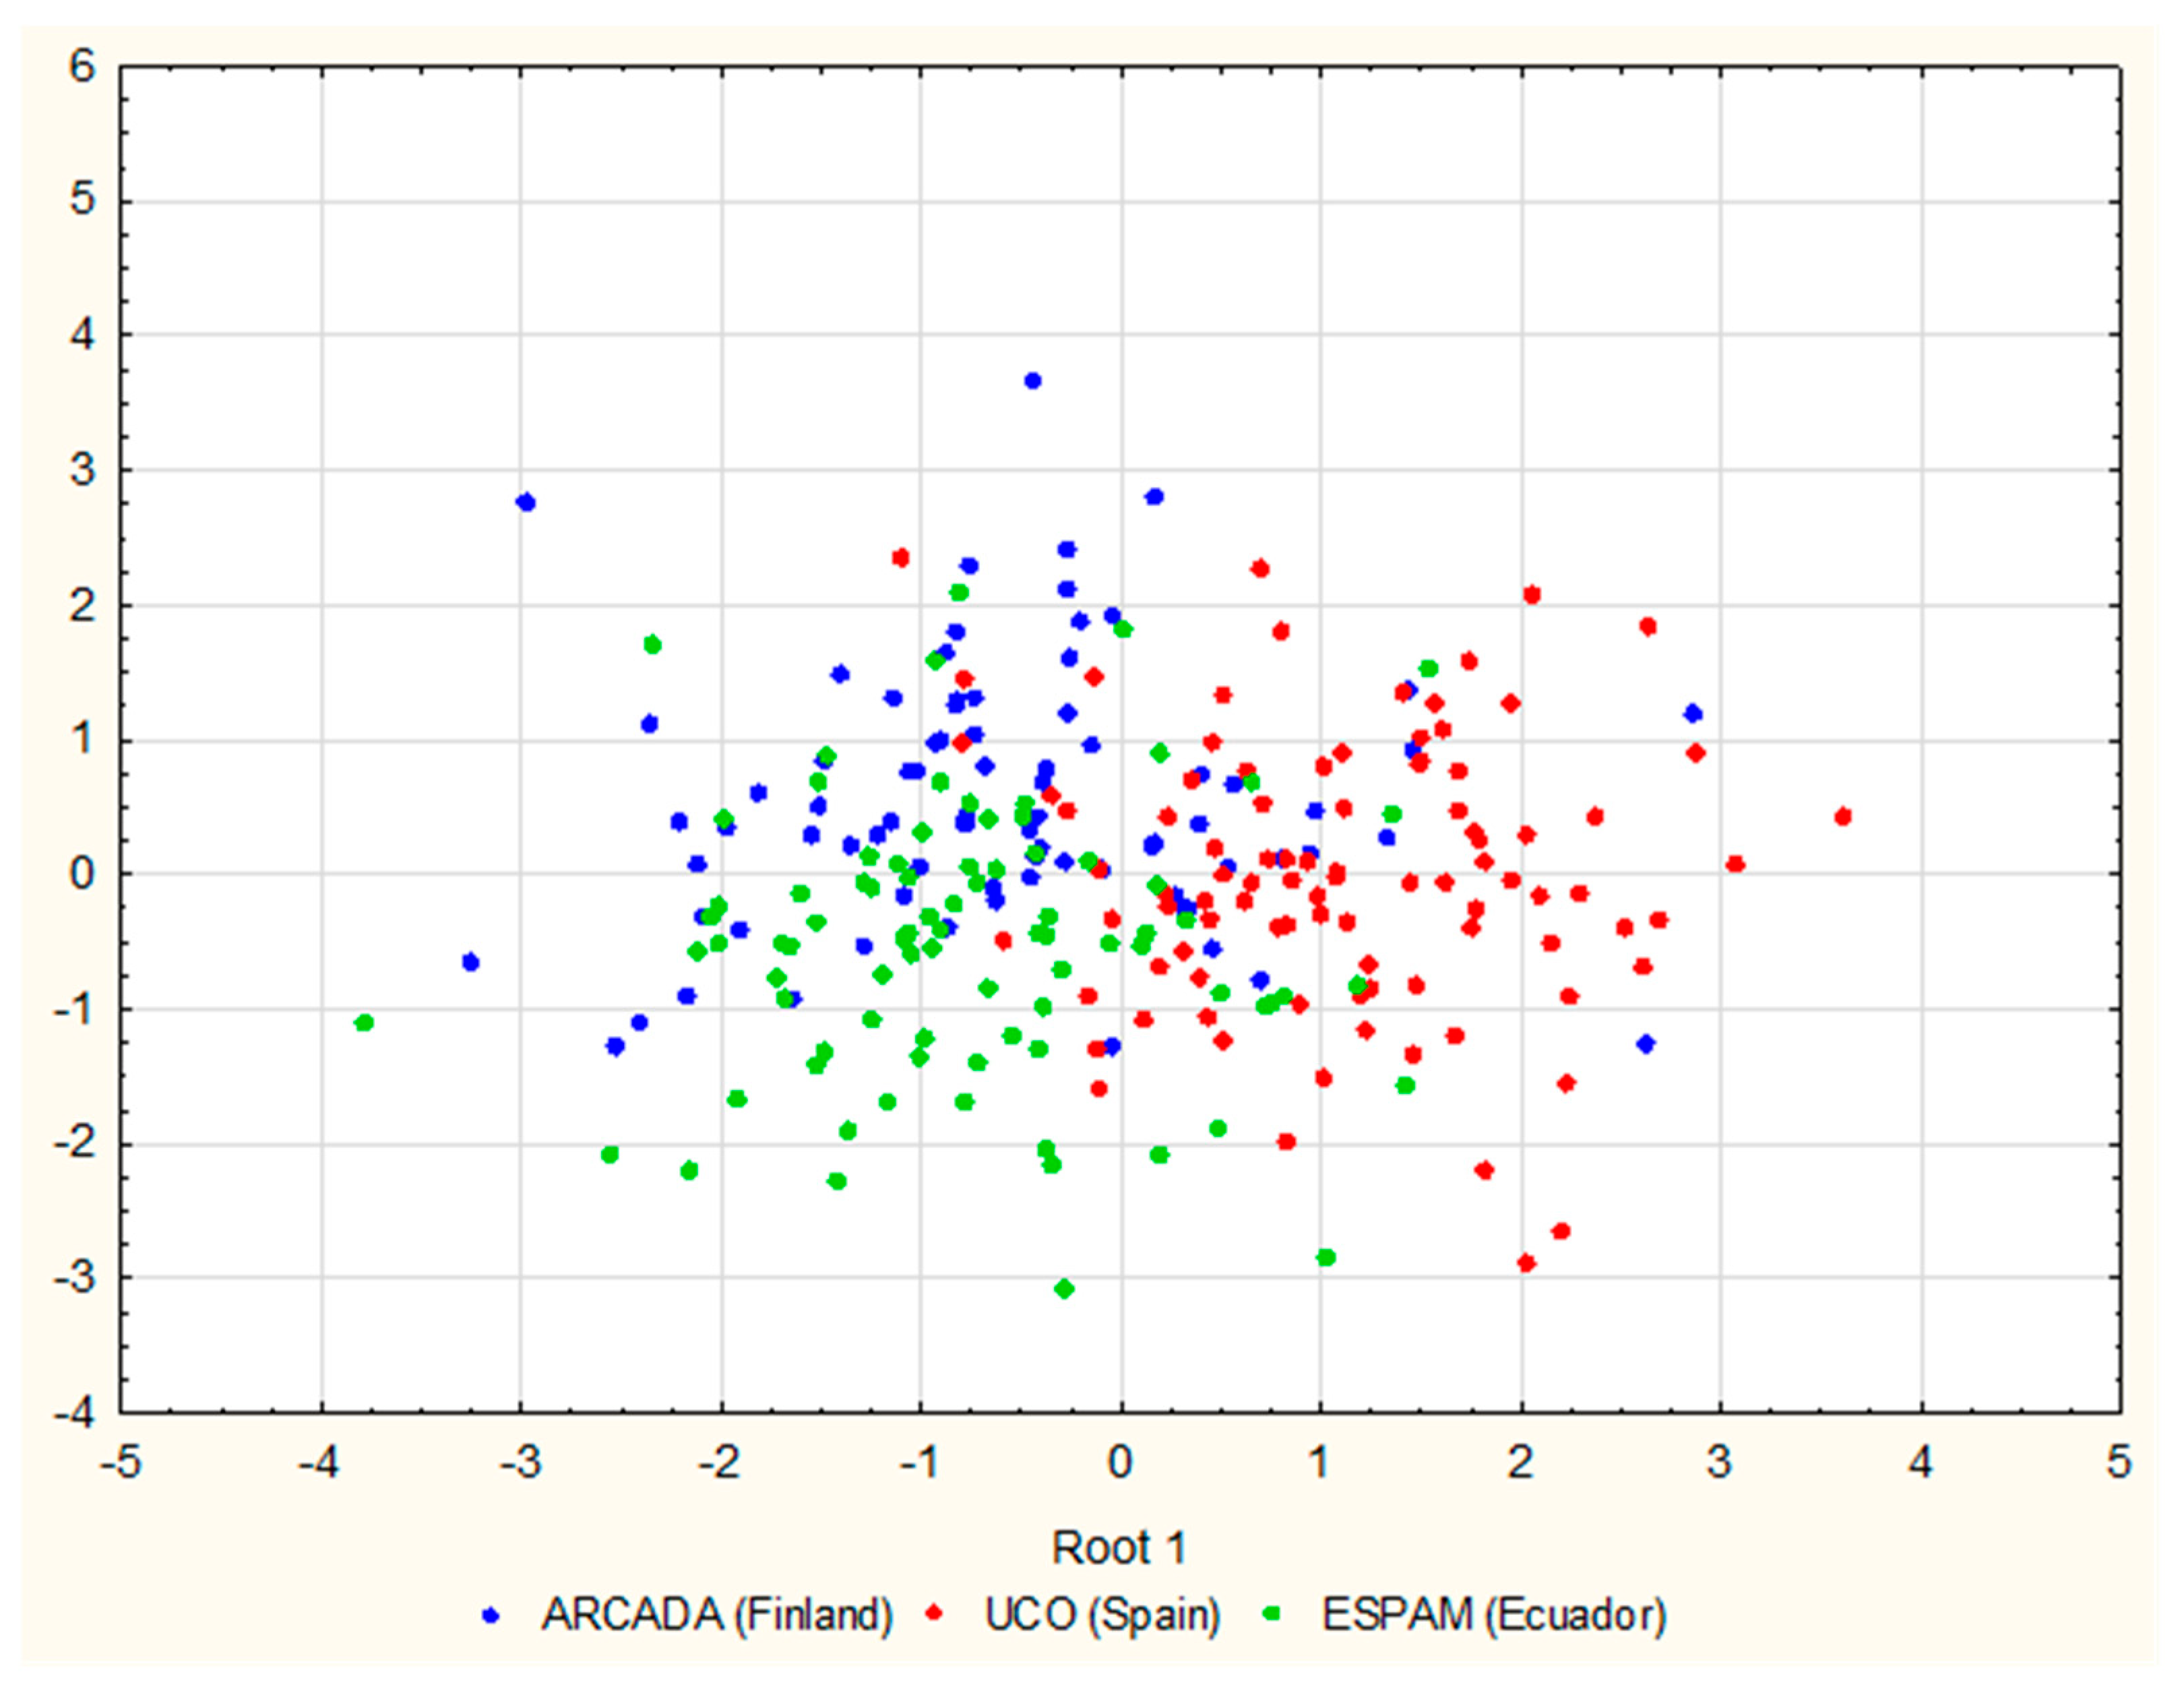
3.2. Discriminant Model Building
4. Discussion
5. Conclusions
Supplementary Materials
Author Contributions
Funding
Data Availability Statement
Acknowledgments
Conflicts of Interest
References
- Bartimote-Aufflick, K.; Bridgeman, A.; Walker, R.; Sharma, M.; Smith, L. The Study, Evaluation, and Improvement of University Student Self-Efficacy. Stud. High. Educ. 2016, 41, 1918–1942. [Google Scholar] [CrossRef]
- The Future of Jobs Report 2020. Available online: https://www.weforum.org/reports/the-future-of-jobs-report-2020/in-full/ (accessed on 15 July 2021).
- Gast, I.; Schildkamp, K.; Van-der-Veen, J.T. Team-Based Professional Development Interventions in Higher Education: A Systematic Review. Rev. Educ. Res. 2017, 87, 736–767. [Google Scholar] [CrossRef] [Green Version]
- Santos, J.M.; Horta, H. The Research Agenda Setting of Higher Education Researchers. High. Educ. 2018, 76, 649–668. [Google Scholar] [CrossRef] [Green Version]
- Kundu, A.; Sarkar, D.N.; Bhattacharya, A. The Effect of Uncertainty on the Formulation of Strategies: A Study of Selected Indian Organizations. SN Bus. Econ. 2021, 1, 7. [Google Scholar] [CrossRef]
- Faraj, S.; Sproull, L. Coordinating Expertise in Software Development Teams. Manag. Sci. 2000, 46, 1554–1568. [Google Scholar] [CrossRef]
- Margalina, V.M.; De-Pablos-Heredero, C.; Montes-Botella, J.L. Achieving Quality in E-Learning through Relational Coordination. Stud. High. Educ. 2017, 42, 1655–1670. [Google Scholar] [CrossRef]
- Fu, N.; Bosak, J.; Flood, P.C.; Ma, Q. Chinese and Irish Professional Service Firms Compared: Linking HPWS, Organizational Coordination, and Firm Performance. J. Bus. Res. 2019, 95, 266–276. [Google Scholar] [CrossRef] [Green Version]
- Gittell, J.H. Coordinating Mechanisms in Care Provider Groups: Relational Coordination as a Mediator and Input Uncertainty as a Moderator of Performance Effects. Manag. Sci. 2002, 48, 1408–1426. [Google Scholar] [CrossRef]
- Asadullah, M.A.; Haider, S.; Heredero, C.D.P.; Musaddiq, M. Effect of Ingratiation on Supervisor Satisfaction through Helping Behavior: A Moderated Mediation Model. Intang. Cap. 2016, 12, 1157–1191. [Google Scholar] [CrossRef] [Green Version]
- Gittell, J.H.; Logan, C.; Cronenwett, J.; Foster, T.C.; Freeman, R.; Godfrey, M.; Vidal, D.C. Impact of Relational Coordination on Staff and Patient Outcomes in Outpatient Surgical Clinics. Health Care Manag. Rev. 2020, 45, 12–20. [Google Scholar] [CrossRef] [PubMed]
- Haider, S.; Fernandez-Ortiz, A.; De-Pablos-Heredero, C. Organizational Citizenship Behavior and Implementation of Evidence-Based Practice: Moderating Role of Senior Management’s Support. Health Syst. 2017, 6, 226–241. [Google Scholar] [CrossRef]
- Haider, S.; De-Pablos-Heredero, C.; De-Pablos-Heredero, M. A Three-Wave Longitudinal Study of Moderated Mediation Between High-Performance Work Systems and Employee Job Satisfaction: The Role of Relational Coordination and Peer Justice Climate. Front. Psychol. 2020, 11, 792. [Google Scholar] [CrossRef] [PubMed]
- Gittell, J.H.; Seidner, R.; Wimbush, J. A Relational Model of How High-Performance Work Systems Work. Organ. Sci. 2010, 21, 490–506. [Google Scholar] [CrossRef] [Green Version]
- Havens, D.S.; Gittell, J.H.; Vasey, J. Impact of Relational Coordination on Nurse Job Satisfaction, Work Engagement and Burnout: Achieving the Quadruple Aim. J. Nurs. Adm. 2018, 48, 132–140. [Google Scholar] [CrossRef] [PubMed]
- Sánchez, M.d.G.; De-Pablos-Heredero, C.; Merodio, J.A.M. Coordinación relacional en la educación en línea. Interciencia Rev. De Cienc. Y Tecnol. De Am. 2015, 40, 869–874. [Google Scholar]
- Gallego, M.d.C.; De-Pablos-Heredero, C.; Medina-Merodio, J.-A.; Robina-Ramírez, R.; Fernandez-Sanz, L. Relationships among Relational Coordination Dimensions: Impact on the Quality of Education Online with a Structural Equations Model. Technol. Forecast. Soc. Chang. 2021, 166, 120608. [Google Scholar] [CrossRef]
- De-Pablos-Heredero, C.; Díaz-Ocampo, E.; Torres, Y.; Checa, C.; Barba, C.; García, A. Typology of relational coordination model in higher education: The case of universidad tecnica estatal de quevedo-ecuador. In EDULEARN19 Proceedings; IATED: Valencia, Spain, 2019; pp. 9616–9620. [Google Scholar]
- De-Pablos-Heredero, C.; Díaz-Ocampo, E.; Torres, Y.; Checa, C.; Barba, C.; García, A. Organizational quality level of universidad tecnica estatal de quevedo-ecuador. In INTED2020 Proceedings; IATED: Valencia, Spain, 2020; pp. 4921–4925. [Google Scholar]
- Checa, C.; De-Pablos-Heredero, C.; Torres, Y.G.; Montes-Botella, J.L.; Barba, C.; García, A. Focused Coordination Models towards Sustainability in Higher Education. Case of Quevedo State Technical University (Ecuador). Sustainability 2020, 12, 5760. [Google Scholar] [CrossRef]
- Caffarel-Serra, C.; Ortega-Mohedano, F.; Gaitán-Moya, J.-A. Investigación en Comunicación en la universidad española en el período 2007–2014. Prof. De La Inf. 2017, 26, 218–227. [Google Scholar] [CrossRef] [Green Version]
- Zee, M.; Koomen, H.M.Y. Teacher Self-Efficacy and Its Effects on Classroom Processes, Student Academic Adjustment, and Teacher Well-Being: A Synthesis of 40 Years of Research. Rev. Educ. Res. 2016, 86, 981–1015. [Google Scholar] [CrossRef]
- Ortega-Mohedano, J.; Rodríguez-Conde, M.J. Which Is or Should Be the Ideal Level of Participation of Students of Higher Education in Their Own Education?A Theoretical Model of Relations between the University and Their Students and the Quality of Higher Education. In Proceedings of the Sixth International Conference on Technological Ecosystems for Enhancing Multiculturality, Salamanca, Spain, 24 October 2018; ACM: New York, NY, USA; pp. 190–198. [Google Scholar]
- Kilgo, C.A.; Culver, K.C.; Young, R.L.; Paulsen, M.B. The Relationship Between Students’ Perceptions of “Good Practices for Undergraduate Education” and the Paradigmatic Development of Disciplines in Course-Taking Behavior. Res. High. Educ. 2017, 58, 430–448. [Google Scholar] [CrossRef]
- Addi-Raccah, A.; Gavish, Y. The LEA’s Role in a Decentralized School System: The School Principals’ View. Educ. Manag. Adm. Leadersh. 2010, 38, 184–201. [Google Scholar] [CrossRef]
- Lee, S.; Yu, J. Discriminant Model of BIM Acceptance Readiness in a Construction Organization. KSCE J. Civ. Eng. 2017, 21, 555–564. [Google Scholar] [CrossRef]
- Noël, N.M.; Trocchia, P.; Luckett, M. A Predictive Psychometric Model to Identify Personality and Gender Differences of College Majors. Int. J. Manag. Educ. 2016, 14, 240–247. [Google Scholar] [CrossRef]
- Bush, T. Preparation and Induction for School Principals: Global Perspectives. Manag. Educ. 2018, 32, 66–71. [Google Scholar] [CrossRef]
- Finlandia|Ranking Web de Universidades: Webometrics Clasifica 30000 Instituciones. Available online: https://webometrics.info/es/Europe_es/Finlandia (accessed on 8 August 2021).
- España|Ranking Web de Universidades: Webometrics Clasifica 30000 Instituciones. Available online: https://webometrics.info/es/Europe_es/Espa%C3%B1a (accessed on 8 August 2021).
- Ecuador|Ranking Web de Universidades: Webometrics Clasifica 30000 Instituciones. Available online: https://webometrics.info/es/Latin_America_es/Ecuador (accessed on 8 August 2021).
- Organisation for Economic Co-operation and Development. The Programme for International Student Assessment (PISA). Results from PISA 2018, Finland; Organisation for Economic Co-operation and Development: Paris, France, 2019; p. 10. [Google Scholar]
- Organisation for Economic Co-operation and Development (OECD). The Programme for International Student Assessment (PISA). Results from PISA 2018, Spain; Organisation for Economic Co-operation and Development (OECD): Paris, France, 2019; p. 9. [Google Scholar]
- Organisation for Economic Co-operation and Development (OECD). Educación En Ecuador. Resultados Del Informe PISA Para El Desarrollo 2018; Organisation for Economic Co-operation and Development (OECD): Paris, France, 2019; p. 152. [Google Scholar]
- World|Ranking Web of Universities: Webometrics Ranks 30000 Institutions. Available online: https://www.webometrics.info/en/WORLD (accessed on 15 July 2021).
- Ranking & Subjects. Available online: https://www.umultirank.org/study-at/arcada-university-of-applied-science-rankings/ (accessed on 15 July 2021).
- University of Córdoba. Available online: https://www.timeshighereducation.com/world-university-rankings/university-cordoba (accessed on 15 July 2021).
- ShanghaiRanking-Univiersities. Available online: http://www.shanghairanking.com/institution/university-of-cordoba (accessed on 15 July 2021).
- Universidad de Córdoba. Available online: https://www.topuniversities.com/universities/universidad-de-cordoba/undergrad (accessed on 15 July 2021).
- Ecuador Categorías de Universidades LISTADO 2021. Available online: https://informacionecuador.com/listado-categorias-de-universidades-ceaaces/ (accessed on 15 July 2021).
- Méndez, D.; Macía, F. Análisis factorial confirmatorio de la escala de actitudes hacia la estadística. Cuad. De Neuropsicol. 2007, 1, 337–345. [Google Scholar]
- Reips, U.-D.; Funke, F. Interval-Level Measurement with Visual Analogue Scales in Internet-Based Research: VAS Generator. Behav. Res. Methods 2008, 40, 699–704. [Google Scholar] [CrossRef]
- Gutiérrez-Cordero, M.L.; Segovia-Vargas, M.J.; Escamilla, M.R. Análisis del Riesgo de Caída de Cartera en Seguros: Metodologías de “Inteligencia Artificial” vs “Modelos Lineales Generalizados”. Econ. Inf. 2017, 407, 56–86. [Google Scholar] [CrossRef]
- Rivas, J.; Manuel Perea, J.; De-Pablos-Heredero, C.; Morantes, M.; Angon, E.; Barba, C.; García, A. Role of Technological Innovation in Livestock Breeding Programmes: A Case of Cereal-Sheep System. Ital. J. Anim. Sci. 2019, 18, 1049–1057. [Google Scholar] [CrossRef]
- Legendre, P.; Legendre, L. Chapter 11—Canonical analysis. In Developments in Environmental Modelling; Legendre, P., Legendre, L., Eds.; Numerical Ecology; Elsevier: Amsterdam, The Netherlands, 2012; Volume 24, pp. 625–710. [Google Scholar]
- Rencher, A.C. Interpretation of Canonical Discriminant Functions, Canonical Variates and Principal Components. Am. Stat. 1992, 46, 217–225. [Google Scholar] [CrossRef]
- Lacayo-Mendoza, A.; De-Pablos-Heredero, C. Managing Relationships and Communications in Higher Education Efficiently through Digital Social Networks: The Importance of the Relational Coordination Model. DYNA Rev. De La Fac. De Minas. Univ. Nac. De Colombia. Sede Medellín 2016, 83, 138–146. [Google Scholar] [CrossRef]
- De-Pablos-Heredero, C.; Haider, S.; Martinez, A.G. Relational Coordination as an Indicator of Teamwork Quality: Potential Application to the Success of e-Learning at Universities. Int. J. Emerg. Technol. Learn. 2015, 10, 4–8. [Google Scholar] [CrossRef] [Green Version]


| Characteristics of the Country | PISA Report [32,33]/PISA-D Report [34] | Ranking 3 | |||||||||||||
|---|---|---|---|---|---|---|---|---|---|---|---|---|---|---|---|
| Country | Population | GDP 1 | Public univ. | Non-public univ. | Political System | Mathematics and science average (pts.) | High performance students (%) | Socioeconomic impact (%) 2 | Student performance trend | Staff and resources quality | Qualified teaching by type of centre (%) | Bullying cases (%) | Lifestyle satisfaction (%) | Student growth mindset (%) | |
| Finland | 5,515,525 | 48,280 | 13 | 22 | Parliamentary republic | Mathem. 520 Science 552 | 12 | 11 | Decrease | Remain | Favoured: 94 Disadvantaged: 91 | 18 | 78 | 67 | ARCADA = 4589 |
| Spain | 46,797,754 | 29,350 | 64 | 56 | Parliamentary monarchy | Mathem. 481 Science 483 | 4 | 10 | Stable | Shortage | Favoured: 94 Disadvantaged: 98 | 17 | 74 | 62 | UCO = 679 |
| Ecuador | 17,084,359 | 6090 | 30 | 31 | Presidential constitutional republic | Mathem. 377 Science 399 | 1.4 | 25 | Decrease | Shortage | No data | No data | 87 | No data | ESPAM = 15,330 |
| Dimension | α Cronbach | Code | Question/Variable |
|---|---|---|---|
| COMMUNICATION | 0.703 | ACCURATE COMMUNICATION: Do the people who belong to these areas have the need to offer you information at certain times? | |
| 1. ACCUAdmin | Accurate communication with administrative officers | ||
| 2. ACCULect | Accurate communication with lecturers | ||
| 3. ACCUClass | Accurate communication with classmates | ||
| FREQUENT COMMUNICATION: Do people who belong to the following work areas communicate with you frequently? | |||
| 4. FREQAdmin | Frequent communication with administrative officers | ||
| 5. FREQLect | Frequent communication with lecturers | ||
| 6. FREQClass | Frequent communication with classmates | ||
| SOLVING PROBLEM COMMUNICATION: When any type of problem appears (study, logistics, documentation…), how much did the following profiles help you to solve your problem? | |||
| 7. SOLPROMyself | Problem-solving communication with myself | ||
| 8. SOLPROLect | Problem-solving communication with lecturers | ||
| 9. SOLPRORepres | Problem-solving communication with students’ representatives | ||
| 10. SOLPROAdmin | Problem-solving communication with administrative officers | ||
| 11. SOLPROClass | Problem-solving communication with classmates | ||
| RELATIONSHIP | 0.831 | SHARED KNOWLEDGE: How well do the following profiles know about your role in the university and the problems that arise? | |
| 12. SKNOWLect | Shared knowledge with lecturers | ||
| 13. SKNOWRepres | Shared knowledge with students’ representatives | ||
| 14. SKNOWAdmin | Shared knowledge with administrative officers | ||
| 15. SKNOWClass | Shared knowledge with classmates | ||
| MUTUAL RESPECT: How much do the following profiles respect your role at the university? | |||
| 16. RESPELect | Mutual respect with lectures | ||
| 17. RESPERepres | Mutual respect with students’ representatives | ||
| 18. RESPEAdmin | Mutual respect with administrative officers | ||
| 19. RESPEClass | Mutual respect with classmates | ||
| SHARED GOALS: How well do the following profiles share your goals at the university? | |||
| 20. SHARGOALLect | Shared goals with lecturers | ||
| 21. SHARGOALRepres | Shared goals with students’ representatives | ||
| 22. SHARGOALAdmin | Shared goals with administrative officers | ||
| 23. SHARGOALClass | Shared goals with classmates | ||
| SATISFACTION | 0.793 | STUDENT SATISFACTION: Indicate your degree of satisfaction with the following profiles. | |
| 24. SATISLect | Satisfaction with lectures | ||
| 25. SATISRepresent | Satisfaction with students’ representatives | ||
| 26. SATISAdmin | Satisfaction with administrative officers | ||
| 27. SATISMaterials | Satisfaction with materials | ||
| 28. SATISCommunic | Satisfaction with communication channels | ||
| 29. SATISContents | Satisfaction with training contents | ||
| Age | Gender | Field of Knowledge | ||||||||
|---|---|---|---|---|---|---|---|---|---|---|
| <25 | ≥25 | p-Value | Male | Female | p-Value | Social sciences | Engineering | Health sciences | p-Value | |
| ARCADA | 86 | 14 | ns | 54 | 46 | ns | 100 | - | - | *** |
| UCO | 88 | 12 | ns | 30 | 70 | *** | - | 10 | 90 | *** |
| ESPAM | 83 | 17 | ns | 56 | 44 | * | 15 | 72 | 13 | * |
| TOTAL | 86 | 14 | ns | 46 | 54 | *** | 38 | 27 | 35 | *** |
| Variable | University (A) | Satisfaction Level (B) | p-Value | |||||
|---|---|---|---|---|---|---|---|---|
| ARCADA | UCO | ESPAM | Low | High | University (A) | Satisfaction level (B) | Interactions (A × B) | |
| 1. ACCUAdmin | 2.75 a ± 0.10 | 2.60 a ± 0.10 | 3.38 b ± 0.10 | 2.67 ± 0.09 | 3.15 ± 0.08 | *** | *** | ns |
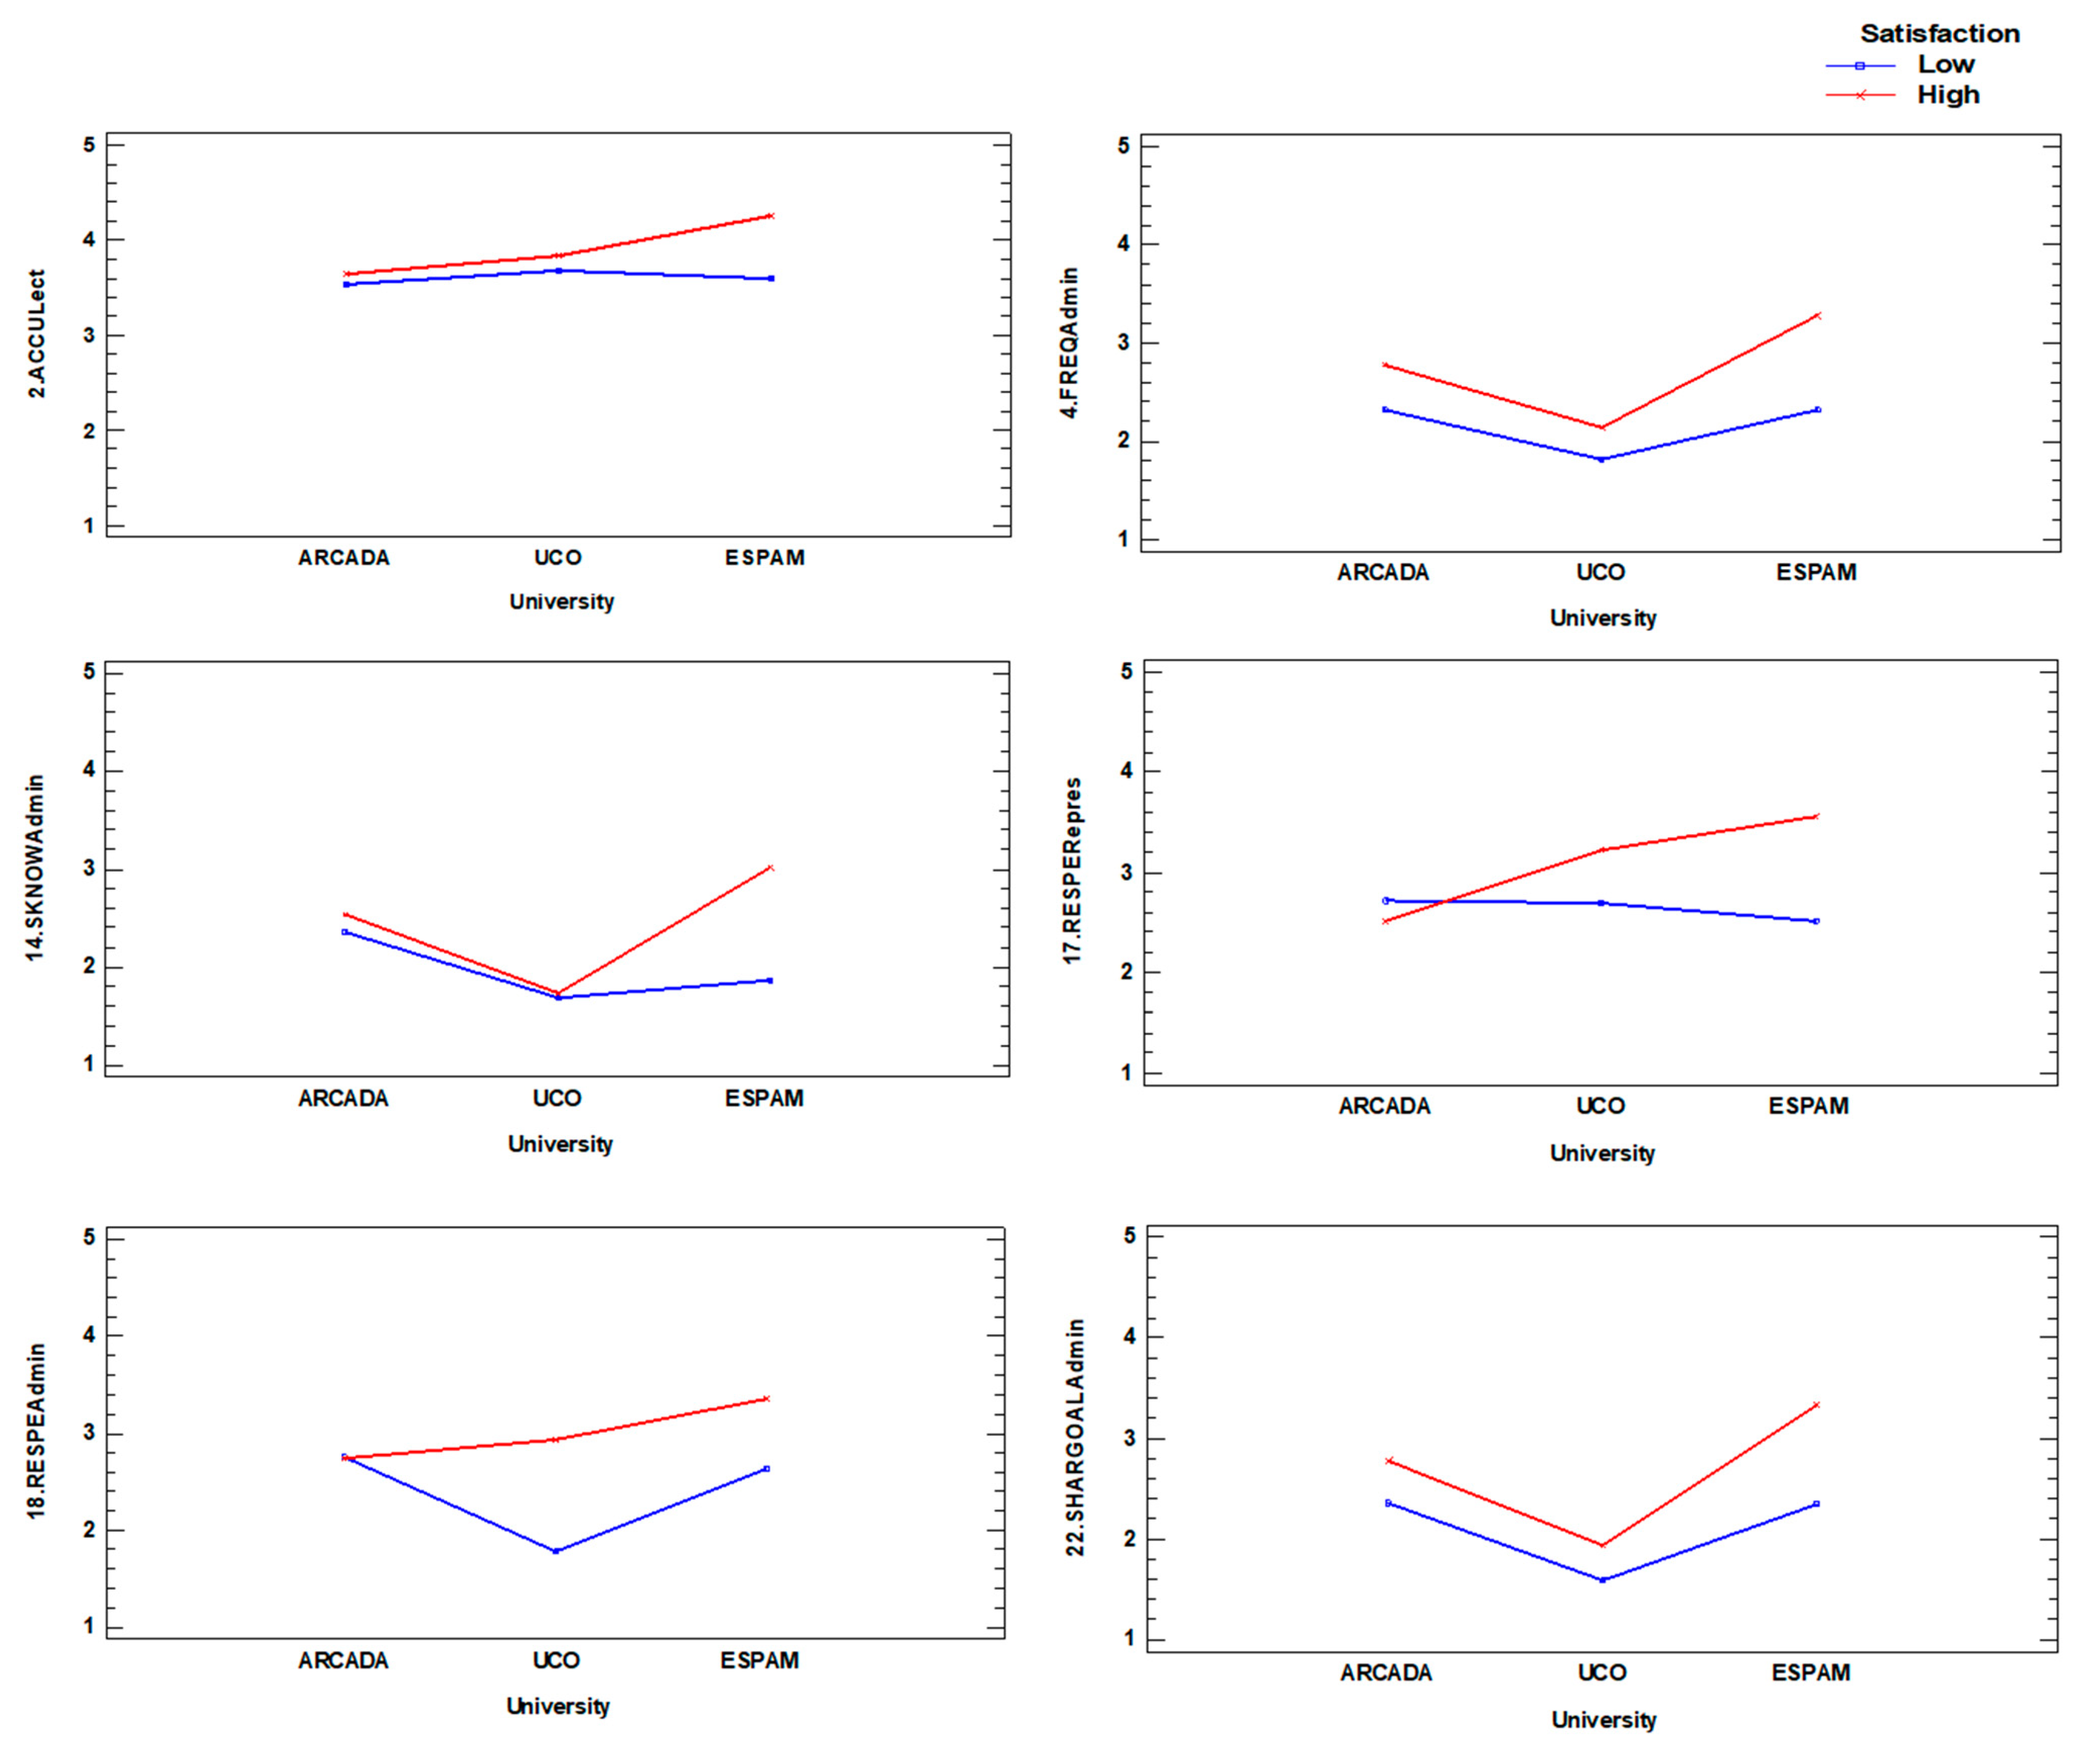
| 2. ACCULect | 3.57 a ± 0.09 | 3.77 ab ± 0.09 | 3.95 b ± 0.09 | 3.60 ± 0.07 | 3.92 ± 0.07 | ** | ** | ** |
| 3. ACCUClass | 3.67 a ± 0.10 | 3.76 a ± 0.10 | 3.84 a ± 0.10 | 3.67 ± 0.08 | 3.84 ± 0.08 | ns | ns | ns |
| 4. FREQAdmin | 2.54 b ± 0.09 | 1.99 a ± 0.09 | 2.81 c ± 0.10 | 2.16 ± 0.08 | 2.74 ± 0.07 | *** | *** | ** |
| 5. FREQLect | 3.44 a ± 0.09 | 3.54 a ± 0.09 | 3.83 b ± 0.09 | 3.36 ± 0.08 | 3.84 ± 0.07 | ** | *** | ns |
| 6. FREQClass | 4.08 ab ± 0.09 | 4.30 b ± 0.09 | 4.00 a ± 0.09 | 4.08 ± 0.08 | 4.17 ± 0.07 | ns | ns | ns |
| 7. SOLPROMyself | 4.20 ab ± 0.08 | 4.43 b ± 0.08 | 4.18 a ± 0.08 | 4.29 ± 0.07 | 4.25 ± 0.07 | ns | ns | ns |
| 8. SOLPROLect | 3.04 a ± 0.08 | 3.04 a ± 0.08 | 3.11 a ± 0.08 | 2.87 ± 0.07 | 3.26 ± 0.07 | ns | *** | ns |
| 9. SOLPRORepres | 2.13 a ± 0.11 | 2.51 b ± 0.11 | 2.47 b ± 0.11 | 2.18 ± 0.09 | 2.56 ± 0.09 | * | ** | ns |
| 10. SOLPROAdmin | 2.50 b ± 0.09 | 2.05 a ± 0.09 | 2.46 b ± 0.09 | 2.09 ± 0.08 | 2.59 ± 0.07 | *** | *** | ns |
| 11. SOLPROClass | 3.43 b ± 0.10 | 3.78 c ± 0.10 | 2.95 a ± 0.10 | 3.37 ± 0.08 | 3.40 ± 0.08 | *** | ns | ns |
| 12. SKNOWLect | 3.04 ab ± 0.11 | 2.85 a ± 0.10 | 3.16 b ± 0.10 | 2.81 ± 0.09 | 3.23 ±0.08 | ns | ** | ns |
| 13. SKNOWRepres | 2.36 a ±0.12 | 2.21 a ± 0.11 | 2.51 a ± 0.11 | 2.23 ± 0.10 | 2.48 ± 0.09 | ns | ns | ** |
| 14. SKNOWAdmin | 2.40 b ± 0.10 | 1.73 a ± 0.10 | 2.47 b ± 0.10 | 1.96 ± 0.09 | 2.44 ± 0.08 | *** | *** | *** |
| 15. SKNOWClass | 3.35 a ± 0.11 | 4.02 b ± 0.10 | 3.21 a ± 0.10 | 3.47 ± 0.09 | 3.59 ± 0.08 | *** | ns | ns |
| 16. RESPELect | 3.30 ± 0.11 | 3.62 ± 0.10 | 3.58 ± 0.10 | 3.27 ± 0.09 | 3.73 ± 0.08 | ns | *** | ** |
| 17. RESPERepres | 2.52 a ± 0.12 | 2.96 b ± 0.12 | 3.06 b ± 0.12 | 2.60 ± 0.10 | 3.09 ± 0.09 | ** | *** | ** |
| 18. RESPEAdmin | 2.65 b ± 0.12 | 2.33 a ±0.11 | 3.00 c ± 0.11 | 2.33 ± 0.10 | 2.99 ± 0.09 | *** | *** | ** |
| 19. RESPEClass | 3.42 a ± 0.10 | 4.15 b ± 0.09 | 3.53 a ± 0.09 | 3.62 ± 0.08 | 3.78 ± 0.07 | *** | ns | ns |
| 20. SHARGOALLect | 2.84 a ± 0.10 | 3.09 a ± 0.10 | 3.43 b ± 0.10 | 2.83 ± 0.08 | 3.41 ± 0.08 | *** | *** | ns |
| 21. SHARGOALRepres | 2.46 a ± 0.12 | 2.65 ab ± 0.12 | 2.85 b ± 0.12 | 2.33 ± 0.10 | 2.97 ± 0.09 | ns | *** | * |
| 22. SHARGOALAdmin | 2.55 b ± 0.10 | 1.77 a ± 0.10 | 2.85 c ± 0.10 | 2.09 ± 0.08 | 2.68 ± 0.08 | *** | *** | * |
| 23. SHARGOALClass | 3.46 a ± 0.10 | 4.03 b ± 0.10 | 3.46 a ± 0.10 | 3.59 ± 0.08 | 3.71 ± 0.08 | *** | ns | ** |
| Variable | Wilks’ | Partial | F-Remove | p-Value | Toler | 1-Toler |
|---|---|---|---|---|---|---|
| 2. ACCULect | 0.491 | 0.974 | 3.088 | * | 0.603 | 0.397 |
| 3. ACCUClass | 0.494 | 0.967 | 4.029 | * | 0.681 | 0.319 |
| 11. SOLPROClass | 0.516 | 0.927 | 9.279 | *** | 0.737 | 0.263 |
| 15. SKNOWClass | 0.493 | 0.971 | 3.568 | * | 0.549 | 0.451 |
| 19. RESPEClass | 0.494 | 0.967 | 3.960 | * | 0.643 | 0.357 |
| 20. SHARGOALLect | 0.518 | 0.924 | 9.726 | *** | 0.558 | 0.442 |
| 21. SHARGOALRepres | 0.491 | 0.973 | 3.290 | * | 0.457 | 0.543 |
| 22. SHARGOALAdmin | 0.550 | 0.869 | 17.672 | *** | 0.480 | 0.520 |
Publisher’s Note: MDPI stays neutral with regard to jurisdictional claims in published maps and institutional affiliations. |
© 2021 by the authors. Licensee MDPI, Basel, Switzerland. This article is an open access article distributed under the terms and conditions of the Creative Commons Attribution (CC BY) license (https://creativecommons.org/licenses/by/4.0/).
Share and Cite
Checa-Morales, C.; De-Pablos-Heredero, C.; Carreño, A.L.; Haider, S.; García, A. Organizational Differences among Universities in Three Socioeconomic Contexts: Finland, Spain and Ecuador. Relational Coordination Approach. Educ. Sci. 2021, 11, 445. https://0-doi-org.brum.beds.ac.uk/10.3390/educsci11080445
Checa-Morales C, De-Pablos-Heredero C, Carreño AL, Haider S, García A. Organizational Differences among Universities in Three Socioeconomic Contexts: Finland, Spain and Ecuador. Relational Coordination Approach. Education Sciences. 2021; 11(8):445. https://0-doi-org.brum.beds.ac.uk/10.3390/educsci11080445
Chicago/Turabian StyleCheca-Morales, Cristina, Carmen De-Pablos-Heredero, Angela Lorena Carreño, Sajid Haider, and Antón García. 2021. "Organizational Differences among Universities in Three Socioeconomic Contexts: Finland, Spain and Ecuador. Relational Coordination Approach" Education Sciences 11, no. 8: 445. https://0-doi-org.brum.beds.ac.uk/10.3390/educsci11080445