
Dynamic Surgical Waiting List Methodology: A Networking Approach


Facultad de Ciencias Sociales y Económicas, Universidad Católica del Maule, Avenida San Miguel, Talca 3605, Chile
*
Authors to whom correspondence should be addressed.
Mathematics 2022, 10(13), 2307; https://0-doi-org.brum.beds.ac.uk/10.3390/math10132307
Submission received: 26 May 2022
/
Revised: 24 June 2022
/
Accepted: 27 June 2022
/
Published: 1 July 2022
(This article belongs to the Special Issue Statistical Methods in Data Mining)
Abstract
:In Chile and the world, the supply of medical hours to provide care has been reduced due to the health crisis caused by COVID-19. As of December 2021, the outlook has been critical in Chile, both in medical and surgical care, where 1.7 million people wait for care, and the wait for surgery has risen from 348 to 525 days on average. This occurs mainly when the demand for care exceeds the supply available in the public system, which has caused serious problems in patients who will remain on hold and health teams have implemented management measures through prioritization measures so that patients are treated on time. In this paper, we propose a methodology to work in net for predicting the prioritization of patients on surgical waiting lists (SWL) embodied with a machine learning scheme for a high complexity hospital (HCH) in Chile. That is linked to the risk of each waiting patient. The work presents the following contributions; The first contribution is a network method that predicts the priority order of anonymous patients entering the SWL. The second contribution is a dynamic quantification of the risk of waiting patients. The third contribution is a patient selection protocol based on a dynamic update of the SWL based on the components of prioritization, risk, and clinical criteria. The optimization of the process was measured by a simulation of the total times of the system in HCH. The prioritization strategy proposed savings of medical hours allowing 20% additional surgeries to be performed, thus reducing SWL by 10%. The risk of waiting patients could drop by up to 8% annually. We hope to implement this methodology in real health care units.
Keywords:
surgical waiting list; multiple linear regression; prioritization; decision support systemsMSC:
37M051. Introduction
According to Jiang et al. [1], health systems are collapsing due to the care demands they face every day. Hospitals must make crucial decisions with the resources available to care for patients, and even then, it is not enough. One process that describes the above is the problem of surgical waiting lists. For example, in Chile, and according to a report prepared by the Ministry of Health, as of 31 December 2018, there was a list of 250,000 patients nationwide and with an average wait of 385 days. As of 31 December 2020, and due to the COVID-19 pandemic, the list increased to 254,000 patients with a significant increase in the average waiting days, reaching 525 days. The foregoing confirms what was stated by Escobar and García-Centeno [2]—waiting times increased between 7.6% and 19.4% as a result of the pandemic and, according to Bowers [3] and Sutherland et al. [4], that would make it increasingly complex to provide timely service to patients; according to García-Rojo et al. [5], Madanipour et al. [6], Cheng et al. [7], this situation would aggravate and put the health of patients at risk.
In such a scenario, the use of support systems for the coordination of tactical and operative decisions is fundamental for ensuring an effective and efficient provision of healthcare services. According to that mentioned by Castillo and Kelemen [8], these decision support systems help reduce administrative and management errors, patient adverse events, and care processes’ efficiency. For instance, in Sutherland et al. [4], Hilkhuysen et al. [9], Gutacker et al. [10], the authors show that the waiting list management, in the planning phase of surgeries, is one of the most critical operations in clinical decision making, but it is also critical in the decision-making of emergency services (see, e.g., Fields et al. [11]) or when scheduling therapeutical procedures such as radiotherapy (see, e.g., Riff et al. [12]). This means computing a correct ranking of patients and, as Rahimi et al. [13], Silva-Aravena et al. [14] point out, is crucial for ensuring the fairness and clinical effectiveness of the provided healthcare services.
In the care and prioritization process, physicians assess not only clinical conditions but also consider psychological and social components that are affecting the patient’s condition and therefore should be included in the overall evaluation of the process, i.e., in the stage of attention, prioritization, and scheduling of patients to the ward (see, e.g., Allepuz et al. [15], Harrison and Appleby [16]). Since then, some of the examples where biopsychosocial dimensions are included in the prioritization of patients have included the work by Silva-Aravena et al. [14], Mullen [17], Siciliani and Hurst [18], Siciliani et al. [19], Tamayo et al. [20].
From the point of view of disease prevention, it is vitally important to consider integrated care management and network collaboration to avoid complex health situations or investigate them in their early stages, to reduce the admission rate of SWL, or prevent patients from worsening their clinical condition when they enter the list. For this reason, authors such as Hungin and Rubin [21], Wadmann et al. [22], Abad [23], Cicchini et al. [24], Sidhu et al. [25] and others have considered that the development of government initiatives for health work is an essential network collaboration for both institutions and professionals, which would allow greater satisfaction of patients and better management of healthcare resources.
This motivates us to develop a prioritization methodology that includes the experts’ criteria of the clinical area linked to automated learning and networking strategies. Taking this, we designed a dynamic system that would reduce the risk of patients while they wait for surgery. With this proposed strategy, physicians could efficiently manage their medical hours and thus provide more care. The proposal determines an order of patients through a multiple linear regression based on historical information. The simulation of the results was carried out in 2021 with anonymous patients from an Otorhinolaryngology (ENT) unit in an HCH in Chile. The simulated results show that the created methodology satisfies the care demand, optimizes the hours of the health team, and reduces the SWL.
Our contribution and paper outline. This paper summarizes the following contributions. First, we build a dynamic networking system that allows us to predict the prioritization of anonymous patients who enter the SWL. The second contribution is a dynamic update of the model allowing a timely selection of patients, and optimizing the hours of the health team. The methodology included in this paper is an extension of the work presented in Silva-Aravena et al. [14], but it differs in that; (1) it proposes a work strategy in the network, i.e., Primary Health Care (PHC) physicians and specialist physicians from the ENT unit of HCH, including comptroller physicians, participate in the patient prioritization process; (2) it includes a strategy that combines the opinion of specialist physicians with the resolution of a machine learning model; (3) it can prioritize patients in less time (greater computational efficiency) and simplifies the problem and facilitates the understanding and decision-making of the health team; and (4) it would save around 112 medical hours annually, which would translate into a potential annual increase of 20% in surgeries and a decrease of up to 10% in SWL.
The paper is organized as follows. Section 2 presents the relevant literature in relation to the techniques and methods used to manage the prioritization of patients on the waiting list. In Section 3, we present the main methodology used in our work. The results obtained from the implementation of the designed system are presented in Section 4. A discussion is presented in Section 5. Finally, in Section 6 we draw conclusions and make suggestions for future work.
2. Related Literature
Next, this section presents a brief literature review on the main elements related to this work, considering the problem of waiting lists, decision support systems, the importance of networking, and some evidence of recent results.
2.1. Context of the Problem of Waiting Lists
According to Valente et al. [26], health problems constitute one of the priority objectives in the design of public policies, and to support management in this matter, some authors such as Rahimi et al. [13], Silva-Aravena et al. [14], Turner et al. [27] propose creating support systems for medical management.
According to Siciliani and Hurst [18], the management of surgeries in hospitals is one of the more complex health processes from the clinical, administrative, and budgetary points of view. Despite the efforts of organizations and countries to provide human (i.e., medical specialists in clinical areas and support), technological, administrative, and financial resources to deliver an effective service to the population, often they fail to resolve the demand carefully. According to Netten and Curtis [28], the previous situation generates dissatisfaction in patients and a more significant challenge for health services. Even more so, and according to Escobar and García-Centeno [2], the COVID-19 health scenario has worsened the situation.
So, the imbalance between supply and demand for health services has been the main problem for managing waiting lists. According to Bowers [3] and Sutherland et al. [4], it can lead to the death of patients. To solve this problem, Sutherland et al. [4], Hilkhuysen et al. [9], Gutacker et al. [10] state that an adequate characterization allows ordering and managing the demand of patients with surgical problems. Additionally, Mullen [17], Siciliani and Hurst [18], Siciliani et al. [19], suggest mathematical tools to improve problems caused by supply and demand gaps.
2.2. Decision Support Systems in Health Services
From the point of view of tools to support the management of waiting lists, authors such as Rahimi et al. [13] and Rahimi et al. [29] have used a combination of approaches that allow the prioritization of the patients (such as hierarchical processes, data analysis and dynamic aspects of the disease) and improvement of the effectiveness of the waiting list process. Along the same lines, Silva-Aravena et al. [14], de Almeida et al. [30], Rahimi et al. [31] have used the criteria of experts in the medical area and other mathematical approaches to measure the evolution of the priority of patients while they wait. Additional methods of management, which include predictive tools, have been used for patient prioritization. For example, Petwal and Rani [32] have exposed a hybrid metaheuristic strategy combined with a nature-inspired algorithm. Other authors such as Jiang et al. [1] propose the development of tools prioritization based on genetic algorithms and neural networks. Kilinc et al. [33] designed a decision tree-based tool for predicting surgical patients. On the other hand, Dash et al. [34] provides a combined procedure using machine learning, k-means, linked with mathematical programming to prioritize outpatients. Finally, Lei et al. [35] predicts the priority clinical evaluation using support vector regression (SVR) and support vector classification (SVC) to classify patients with Parkinson’s disease.
Successful projects, such as those noted by Rahimi et al. [13], Hadorn and the Steering Committee of the Western Canada Waiting List Project [36] and others, have contributed to improving the management of waiting lists in health services. In the first, a prioritization project was developed for five clinical units in Canada that included the participation of 19 health institutions, achieving effectiveness and reliability to prioritize patients according to the evaluation of the evaluation teams and providers of primary health care. Finally, in the second, the tool allowed an improvement by 30% of the effectiveness of patients within the maximum waiting times.
2.3. Importance of Networking in Health
Authors such as Gutiérrez Porlán et al. [37], Candón-Mena [38] and others have highlighted the importance of the work of collaborative networks, mainly in industries such as education. In the health area, meanwhile, the importance of collaborative and multidisciplinary work between health teams is known due to the urgency that this implies for patients’ quality of life. Different institutions and different types of professionals participate in these processes (i.e., physicians, nurses, kinesiologists, nutritionists, etc.), who, as a whole, contribute to the recovery of patients in all care processes, including the support of the internet of things in SWL (see, e.g., Oddershede et al. [39]). On the other hand, authors such as Sidhu et al. [25] and others have developed qualitative and comparative case studies to address the strategy of networks. Others, such as Turgeon et al. [40], Peduzzi and Agreli [41], have offered networking methodologies to better service patients, e.g., drugs for cancer treatment. In addition, the digital interconnection provided by the internet of things has also been addressed by authors such as Zeadally and Bello [42], Ghazal et al. [43], Philip et al. [44] to improve communication and networking systems between health institutions and teams.
2.4. Prioritization Systems in Chile: Recent Evidence
In Chile, the government has injected resources to minimize, in part, the problem of waiting lists, but it has not been enough. Some authors have tried to solve the problem with management tools, such as the proposal by Silva-Aravena et al. [14], Cisneros [45], Julio et al. [46]. Like the international literature, the works try to improve management through the opinion of physicians and to represent this experience with ad-hoc mathematical tools to show the reality of each health service in a particular way. However, none of them have included in the management process the previous level of patient care or primary health care, which could be strategic for prevention and control, from waiting lists.
2.5. Prioritization Justification of the Chosen Method
According to the literature review and the prioritization strategies exposed therein, we believe it is possible to optimize the SWL process from the moment of the patient’s first consultation in PHC until the second level of care stage in HCH. The former considers using a machine learning approach embedded in a networking protocol supported by a decision support system. The main justifications are presented below:
- In the surgical waiting list management process, it is essential to include all relevant patient information, i.e., clinical and non-clinical, that allows the design of mathematical and/or predictive models for prioritizing patients to optimize management and, as a consequence, for contributing to reducing waiting lists;
- There is not enough evidence of process optimization strategies to prioritize patients on the surgical waiting list in Chile, but only local developments are not linked to the healthcare network. Although the government has designed networking strategies, these have not been entirely effective given the existing gap between supply and demand.
Both findings reveal the urgency of developing management tools that allow the optimization of surgical waiting list processes through network collaboration between hospitals and PHC.
3. Novel Surgical Waiting List Management Strategy: Development of the Methodology
The design of this methodology was carried out in an ENT unit of an HCH in Chile during the year 2021. For the training and validation of the model, we have taken as a source of information a dataset that contains 20 psychosocial variables (see Table 1) and data from 205 anonymous patients published in Silva-Aravena et al. [47], (see also (https://docs.google.com/spreadsheets/d/1wgDxPN5MrnmCNyJCkml5vSPRoNqbOWxJ/edit?usp=sharing&ouid=113430872565444964982&rtpof=true&sd=true, accessed on 25 May 2022)). The design and implementation team comprised professionals from the ENT unit (five nurses and seven physicians with specialties in the area) and one engineer from the hospital management area.
The structure of our prioritization strategy is based on a data mining methodology for the health sector, CRISP-DM, which is widely studied by authors such as Arias et al. [48], Schröer et al. [49], Cunha et al. [50], Kolyshkina and Simoff [51]. This method, which is patient-centered and visualized in Figure 1, favors the understanding of the data mining design of this research and is associated with the following sequence of phases: (1) knowledge of the most critical processes and needs of the ENT unit surgical waiting list in the HCH, which is addressed in Section 3.1 and Section 3.2; (2) understanding of the anonymous data of patients on the waiting list analyzed in this work and in Silva-Aravena et al. [14], Silva-Aravena et al. [47]; (3) the data were prepared through various analyses, e.g., structure and description of variables, visualization techniques, and correlations, among other aspects; (4) the technique selected for this dataset and its analysis is the multiple linear regression model; (5) the designed model was validated with statistical and resampling hypothesis tests, such as LOOCV and k-folds cross-validation; finally, in (6) an implementation model between HCH and PHC is proposed. In the rest of the section, we will describe the development of all the components of the proposed strategy.
3.1. Characterization of Patients on the Surgical Waiting List of the ENT Unit
To characterize the ENT unit patients on SWL, we obtained from Silva-Aravena et al. [14] the general information about the patient—we observed their characteristics, the type of care, the diagnosis of admission to the waiting list, the name of the treating physician and whether they had other additional pathologies. We measured the patient’s psychosocial information; their ability to work, study, perform family activities, be cared for, care for a third party, their difficulty in moving to the hospital, their access, and their time on the waiting list. Finally, and from the patient’s clinical information, we generally measured the characteristics of the disease that caused admission to the waiting list, such as the level of pain, functional limitations, abnormal findings in the affected area, the progression, and severity of the disease, the probability of improvement with surgery, the development of comorbidities due to waiting, and the level of urgency, among others.
For this work, we included a new variable, physician score (Pscore), to calculate the score of patients based on the opinion of physicians from each patient on SWL. Other authors, such as Lei et al. [35] and others, used patient data from radiological images to calculate and be able to predict the score.
Table 2 shows both the variables and parameters that physician gave to each one. Thus, and with methodology from Silva-Aravena et al. [14] we obtained a score for each patient on SWL. The new variable, (Pscore), included as a new vector in the dataset, was used in this paper to predict the score of each patient.
Of the 205 anonymous patients, 105 were women and 100 were men. From an age point of view, 61.5% of the cases were between the ages of 0 and 20, 12.5% were between the ages of 21 and 40, 15.4% were between the ages of 41 and 60 and 10.6% of the cases were patients over 60.
3.2. Current Prioritization Strategy (SA)
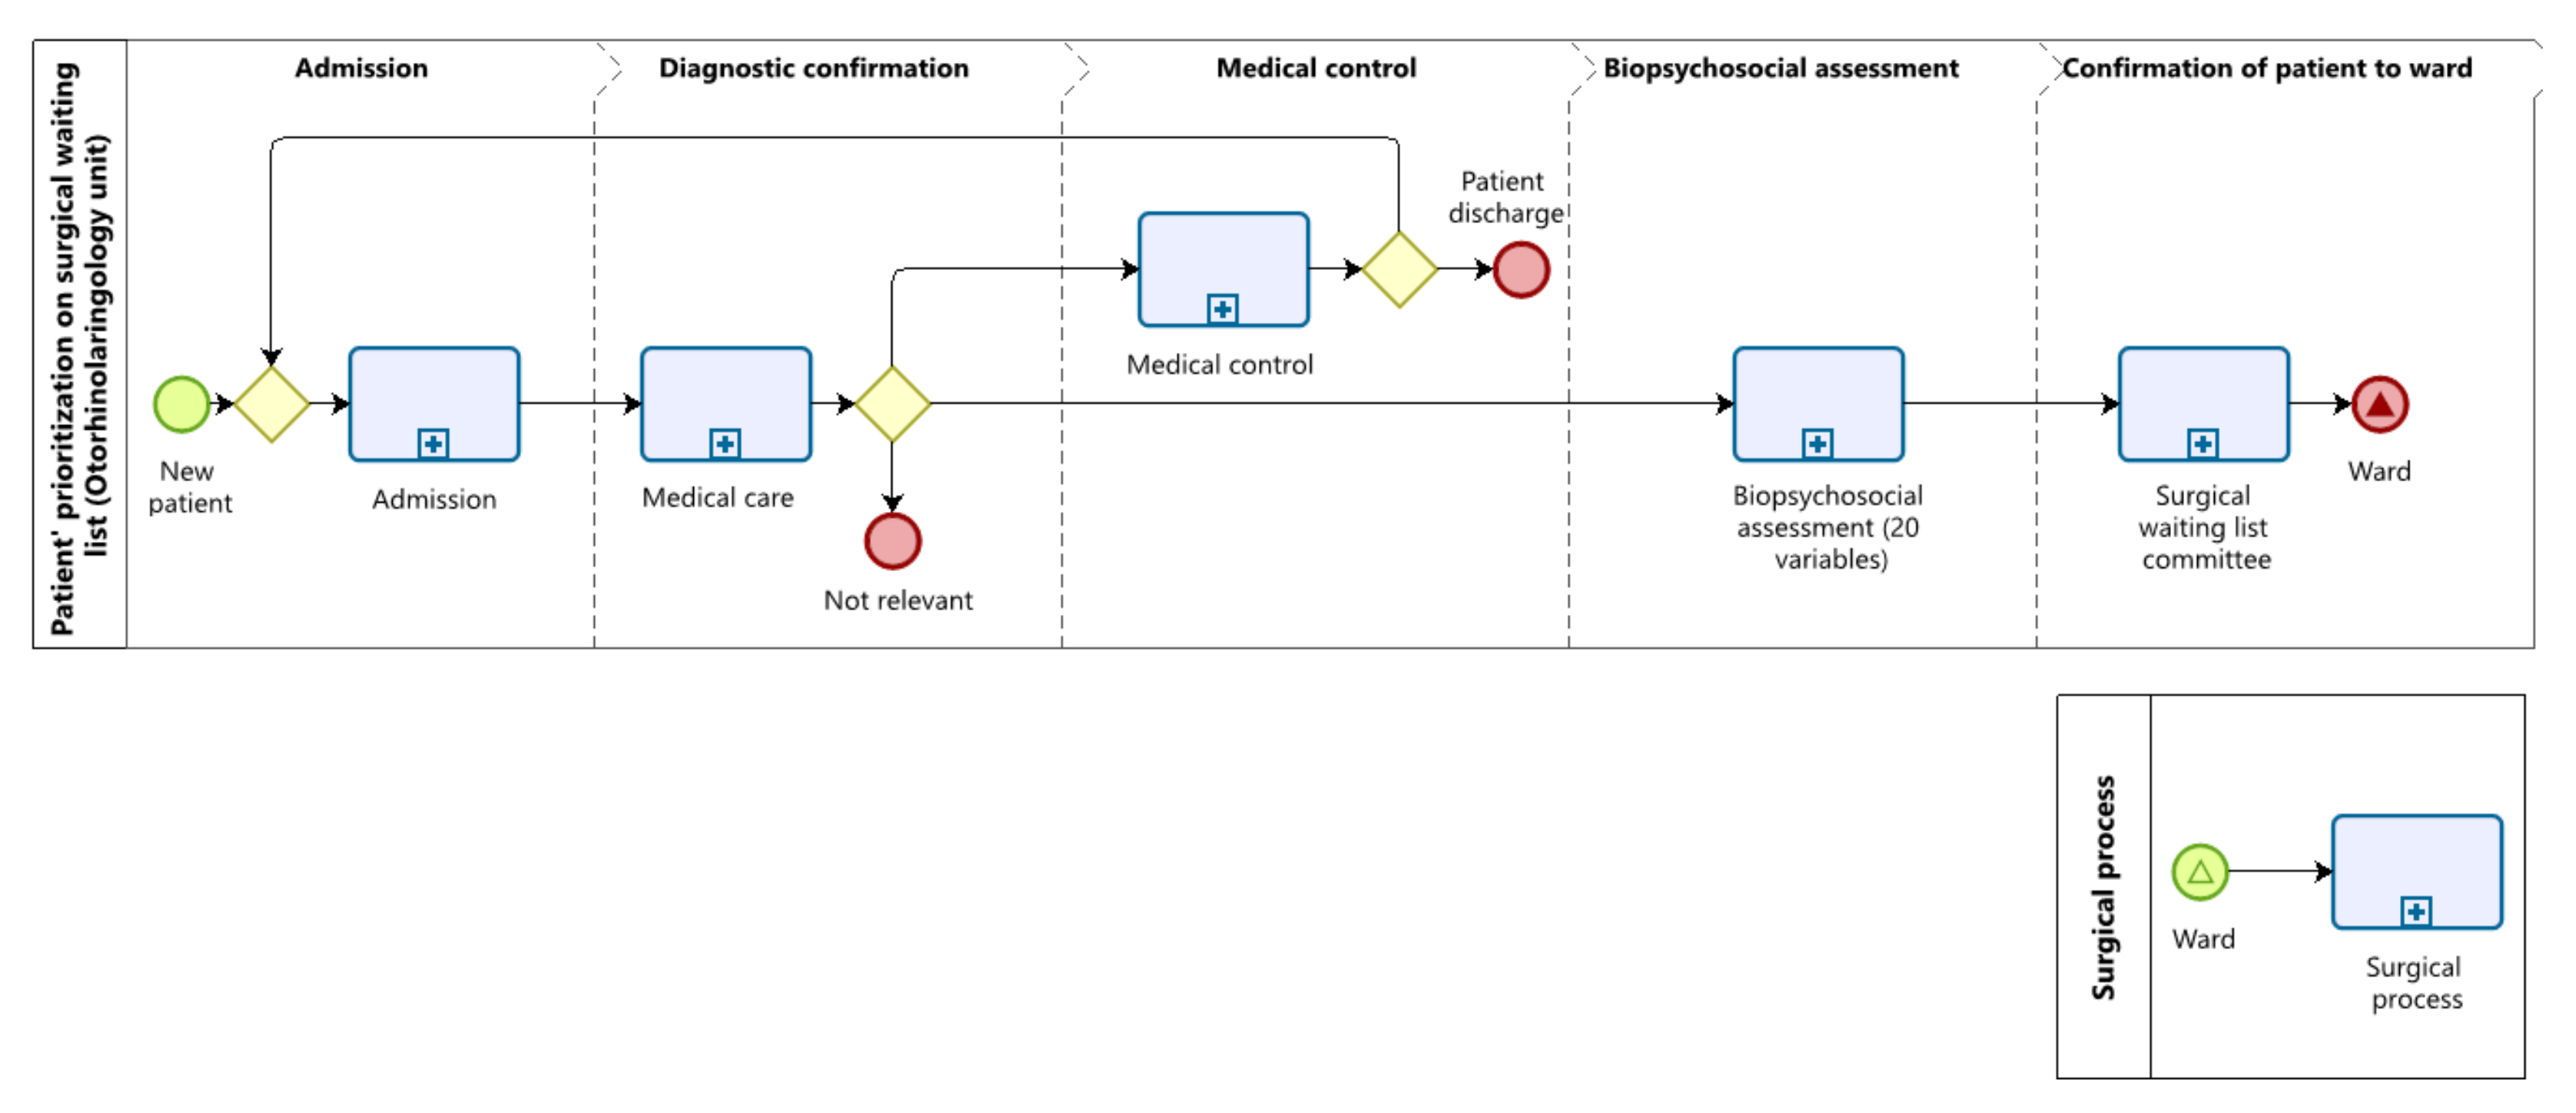
According to the HCH health information system records, about 10,000 people consult PHC annually for health problems associated with ENT. Of these, 6970 are referred to the HCH to be treated by a specialist physician in the area. In the hospital, the patient goes through the admission and consultation process of diagnostic confirmation of his/her disease, and after that, 4112 (59%) continue in medical control. Of these, 20% are discharged. In this way, 2788 (40%) enter the SWL process, and about 70 (1%) are declared as not pertinent (see Figure 2 and Table 3).
Figure 2 shows the SA prioritization strategy, proposed by Silva-Aravena et al. [14]. The process evidences the stages through which patients referred to the ENT unit go, i.e., admission, diagnostic confirmation, medical control, evaluation of the 20 prioritization variables, and confirmation of patients scheduled for the ward, as provided by the clinical committee. Table 3 shows a simulation of the prioritization process and the times associated with patient care through AS.
With respect to SA embedded in Figure 2, we take the following example. A particular patient, coming from PHC with a consultation order for surgical suspicion, presents his documentation in the ENT admission unit at HCH. Then, the admitter refers him to the attention box, where the doctor evaluates the patient’s medical history and diagnoses, thus being able to make three types of decisions: (1) the patient must continue under medical control since his problem is not surgical and must remain under continuous clinical monitoring; (2) the patient has a sufficient history of the disease and should be placed on the surgical waiting list; or (3) the patient is not relevant for care in the ENT unit. Suppose the doctor indicates that the patient should be placed on the waiting list for surgery at the exact moment of the consultation. In that case, the professional evaluates the 20 biopsychosocial variables to determine their level of prioritization. Suppose, in the previous process, the patient is highly prioritized. In that case, they will be evaluated by the Surgical Waiting List Committee, who will determine by consensus, after studying the necessary clinical and management history, if the patient goes on to the surgical process. If the Committee gives the go-ahead, the patient will soon undergo surgery. The above described is performed weekly and for the entire waiting list of prioritized patients.
The process stages follow a normal distribution of their care times, which were measured during one month in the ENT unit. The admission stage has a mean of 5 min and a standard deviation of 1 min. Both diagnostic confirmation and medical consultation have a mean of 15 min and a standard deviation of 3 min. The biopsychosocial evaluation stage has a mean of 2 min and a standard deviation of 0.5 min, and the confirmation of patients to the ward, carried out by the clinical committee, has a mean of 60 min and a standard deviation of 15 min. The total time of the simulated process was 374,129.38 min.
Table 2 shows that, despite the efforts made to manage the waiting lists, the number of patients who remain waiting as of 31 December of each year exceeds one thousand patients, since of the 2788 patients who enter the surgical waiting list, approximately 520 can be operated on annually with the resources available during business hours, and around 1200 are resolved with strategies for the purchase of medical services during non-business hours.
3.3. The New Dynamic Patient Selection Strategy in SWL (SB)
To develop the new dynamic surgery patient selection strategy, SB, we used information from 205 patients characterized by twenty predictor variables constructed by the seven physicians (see Table 1). When specialists apply these variables to each patient admitted to SWL, they obtain a prioritization measure—Pscore In this way, we obtained the first adjusted model, (1). Later, and to improve the quality of the model, we used the mixed selection method to select the variables statistically significant that require an MLR scheme, obtaining (2). Then we fit a model with those predictors that meet the statistical assumptions, which allowed us to create (3) finally. We performed the validation and estimation of its predictive quality for this model. We detail below the elements of the methodology, which was built with the support of the statistical software RStudio.
3.3.1. Multiple Linear Regression: Initial Model
The estimation of the parameters , , allowed us to adjust the prioritization given by the physicians considering the new vector, Pscore (see Figure 3), as a dependent variable, to then be able to obtain predicted physician score, . Tanto as are some of the variables used by the health team of the ENT unit that allows for characterizing patients (see Table 1). In this way, and with the elements mentioned above, we have formulated (1):
where is the intercept term, is the measure of error and are the estimated parameters. (1) has filed an adjusted R-Square of 0.9743, a F-statistic 387.4 and RSE of 0.03656. However, we find that some predictors are not statistically significant (i.e., have a p-value greater than : 0.05, reference value for each test t-statistic). To correct that, we used a criterion that allows selecting significant variables for a better fit.
3.3.2. Variables’ Selection
For the selection of the variables we used the mixed selection method, stepwise, which is a combination of forward and the backward selection. The new model starts without the inclusion of variables; then, and through the forward selection strategy, we added the variable that gives us a more excellent fit, which for this particular case, is Sever (see in Table 1). Then, we continued to add variables one-by-one. Hence, if at any point the p-value for one of the variables in the model rose above a certain threshold, we removed that variable from the model. We continued to perform these forward and backward steps until all variables in the model had a sufficiently low p-value. In this way, we obtained a new adjusted model with 15 predictor variables, (2).
where is the predicted physician score associated with the fifteen variables, is the intercept, s is the measure of error and the , , are the new adjusted parameters. Despite losing information with the five variables excluded by the mixed selection (i.e., Tlist, Opat, Diag, Acc, Ccrit), the results have not deteriorated, since an adjusted R-Square of 0.9741, an F-statistic 512.3 and an RSE of 0.0367 were obtained. To see if it is possible to reduce more variables without losing the quality of (2), we evaluated the presence of multicollinearity between the fifteen variables, using the variance inflation factor (VIF), the test of the Lagrange multiplier (Breusch–Godfrey), and a correlation matrix.
For VIF, some variables, such as Urg y Jclin, have a value greater than 5. According to this criterion, there is a suggestion of multicollinearity between the variables, excluding those exceeding that threshold from the model. We also evaluated the Breusch–Godfrey hypothesis test (p-value: 0.007028), confirming the presence of multicollinearity in the variables Urg, Jclin, Com, Hanor, Olim. Finally, with the correlation matrix’s visualization, we confirmed that the correlated and previously similar predictors should come out of the model. The Sever variable was taken as a reference, considering that it is the one that explains a more significant proportion of the variance. Figure 4 shows the variables that, with a correlation equal to or greater than 0.5 with respect to Sever, were removed from the model.
With the above criteria, we have fitted a new model, (3), which has ten predictors (i.e., Sever, Tsuen, Pmcx, Dest, Lfam, Ncuid, Rcuid, Dolor, Dtras, Dtrab) that are statistically significant and do not present multicollinearity problems. Below is (3), which represents the final fit of our predictive model.
where is the predicted physician score associated with the ten selected variables, is the intercept, g is the measure of error and , are the adjusted parameters that proportional (3). According to the characterization that each patient has in SWL, the patient has a score according to the medical evaluation, e.g., If a patient has his score will be 0.06, and if you have no problems to work, , its value will be 0.071. These values are explained in the Appendix B of Silva-Aravena et al. [14]. Now, if we calculate the score of a patient p using the new (see Table 1), and whose characterization is given by: ; ; ; ; ; ; ; ; ; and, , his SWL entry prioritization value and which is predicted by (3), , will be:
3.3.3. Training and Testing Process: Model Fit
For the (3) training process, we used a random sample of 50% of the available patient records, which is equivalent to 102 cases, and the rest of the information was used for the validation and testing stage, which will be used in Section 3.3.4. In this way, (3) simultaneously solves the problems of autocorrelation and the significance of the variables.
Although there was a loss of information due to the elimination of 50% of the variables of the original dataset, this did not affect the global evaluation of (3). In fact, the significance of the selected variables allowed us to obtain an RSE of 0.06822, an adjusted R-squared of 0.9104, a global F-statistic of 208.4 and a p-value < 2.2 × 10. The above results imply that; (1) there is a linear relationship between the selected predictors and the response variable, Pscore, confirmed with the global results of the F-statistic; (2) the importance of the selected variables was obtained with the mixed selection method; (3) the adjustment of (3) was confirmed with RSE and adjusted R-squared; and (4) the predictors provide a good fit to estimate Pscore.
3.3.4. Model’s Validation
For the validation of the model, we used the autocorrelation tests of the variables. In addition, we measured the residuals based on independence, normality, and constant variance. Subsequently, we compared the prioritization of anonymous patients, Pscore, and compared it with the predictive capacity of the model, Predscore. Figure 3 shows the linear relationship between Pscore and the physician predicted score, Predscore . We also performed cross-validation with resampling methods (see Table 4).
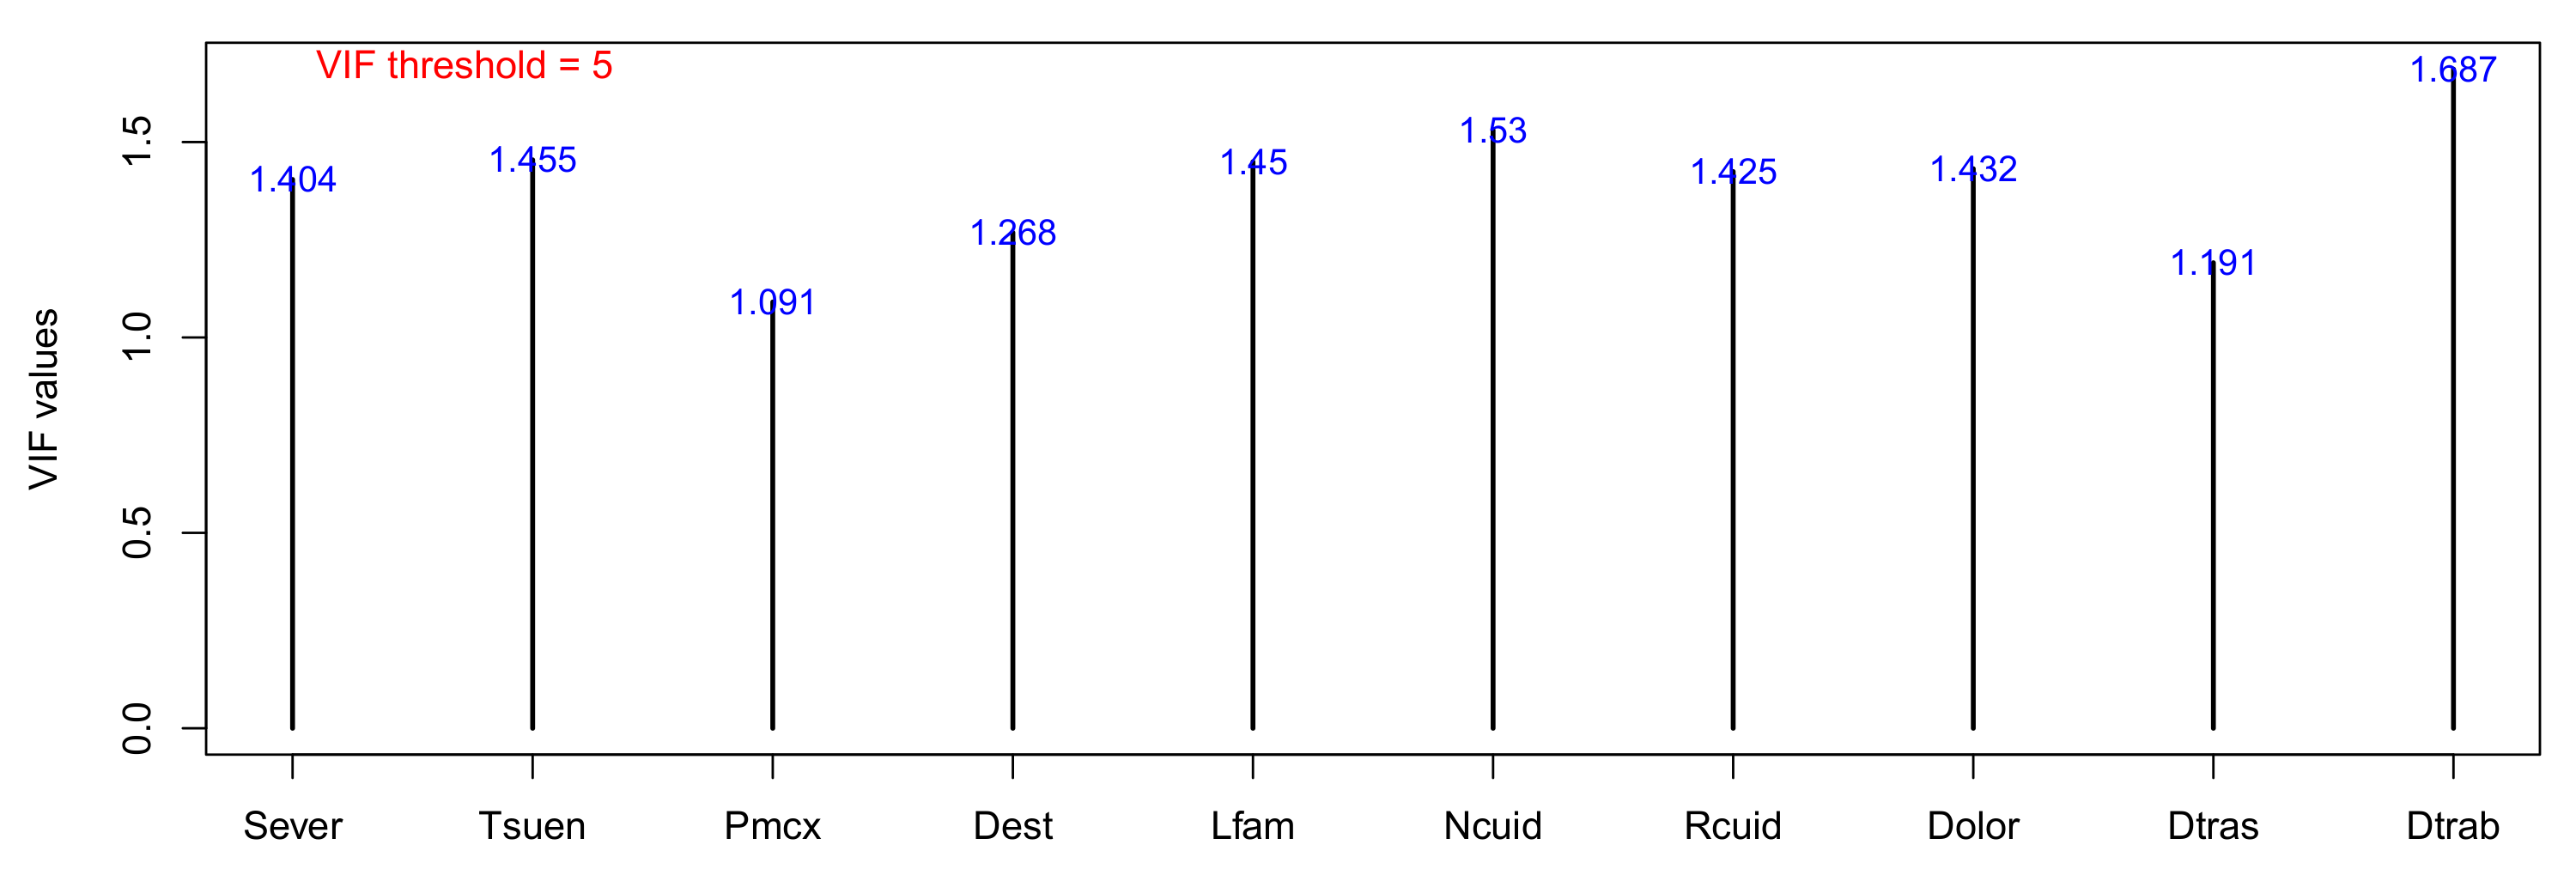
Figure 5 shows the correlation matrix of the variables selected for (3), which indicates that there is no multicollinearity between the predictor variables. Anyway, as some correlation problems are not detected with the matrix, we obtained the VIF of each selected variable. Considering the limit of tolerance of 5 VIF, the results presented in Figure 6 rule out autocorrelation problems between the variables. To confirm the above, we applied the Breauch–Godfrey test. A p-value of 0.5031 was obtained in the test result hypothesis, confirming the absence of autocorrelation in (3).
On the other hand, in Figure 7 we can see the constant shape of the residuals and a linear relationship between the 10 predictor variables and the response variable, Pscore. In other words, there is no evidence of a pattern that demonstrates any nonlinearity problem. To measure the independence of the residuals, we performed the Durbin–Watson test, obtaining a p-value of 0.2061, which confirms the independence of the residuals. On the other hand, we performed the Shapiro–Wilk test to evaluate the normality of the errors, which was confirmed with a p-value of 0.3492. To assess if the residuals are homoscedastic, we performed the studentized Breusch–Pagan test, which reported a p-value of 0.3291, confirming that the residuals are homoscedastic. That is, they have constant variance (see, Figure 7).
Is of particular interest for the validation of the model to measure the error of the unknown data (i.e., test data), by RMSE. To estimate RMSE, we used the cross-validation approaches: LOOCV, k-Fold Cross-Validation, and repeat k-Fold Cross-Validation. Table 4 shows the results of RMSE, R-squared and MAE, the latter used to quantify the (3) prediction. The results of the different both approaches confirm the performance of the model against the test data. On the other hand and to assess the quality (3) predictive, we obtained a Pearson correlation of 0.96 between Pscore and Predscore. Figure 3 shows the linear relationship of both variables.
The above tests and the certainty in predicting the priority of new patients confirm that, with a reduced model of variables, it is possible to replicate the priority given by physicians by comparing the level of importance of the selected variables for more automation and work prioritization in the network. This situation shows improvements in clinical times for greater medical productivity. The detail will be seen in Section 4 of the results.
The prediction of patient prioritization in SWL establishes an improved methodology for the unit of ENT from HCH. Additionally, and linked to the predictive priority model, we propose a scheme that dynamically quantifies the risk of patients and the choice of these as candidates for surgery. The details of the new strategy are presented below.
3.3.5. Determination of the Dynamic Risk Function
Once patient p has been assigned his predicted physician score of (3), , she must wait on the list until he is contacted for surgery. While she waits, her clinical condition evolves, which may lead to a change in the position of SWL and her level of risk.
The health teams, both PHC and HCH, need to know the complete information of each patient p who enters SWL for timely and effective medical decision-making in the choice and surgical scheduling, where the waiting time becomes fundamentally critical for patients.
The elements present in the dynamic determination of the waiting patient hazard function are: (1) the amount of time that patient p has spent in SWL, which is compared to the maximum amount of time that patient p, has to wait, as directed by the physician at the time the patient is admitted to SWL; (2) a factor that measures the number of additional pathologies of patient p, which is determined by the health team and is updated each time patient p sis diagnosed with an additional pathology, and different from that of admission to SWL (see Table 5); and (3) the impact of the type of diagnosis of admission to SWL according to the criteria of the medical team (see Table 6). In this way, the level of risk, , is defined as:
where is the value obtained by the health team and the consensus classification given by them to the type of diagnosis of admission to SWL, where are the most complex and serious diagnoses, and the most minor complex (see Table 6). On the other hand, is a factor provided by ENT physicians that quantifies the additional pathologies of the patient upon admission to the SWL or when they develop during the time on hold. In that sense, and for each , the physicians were consulted to assign a factor between 0 (not relevant) and 2 (very relevant); let be the factor assigned by the consensus of the physicians to each of patient p in , where . Table 5 shows the consensus factor assigned to each of the additional common pathologies in the ENT unit is given by:
On the other hand, is the clinical judgment of the maximum waiting time, and is the date of SWL admission. Both PHC physicians and the HCH ENT unit health team can update of the patients in SWL and the medical history each time a patient consults. All this depends on the privilege they have (see, Figure 8 and Figure 9).
Figure 8, Figure 9 and Figure 10 represent the decision support system (DSS), enabling collaborative and networked work between PHC and HCH. For example, if a physician belongs to PHC, she will complete the required elements in Figure 8; when a patient consults for their health status, symptoms lead to suspicion of a surgical diagnosis linked to ENT. In this way, the doctor registers the variables Dest, Lfam, Ncuid, Rcuid, Dtras, Dtrab and Dolor, and refers the patient to the ENT unit at HCH. Then, the patient will be treated by an ENT specialist physician at HCH, who, after clinical and diagnostic evaluation, will confirm, modify or reject the diagnosis given to the patient at PHC. If the evaluation confirms that the diagnosis is surgical and not urgent, the specialist must complete the variables Sever, Tsuen, Pmcx y Cj, obtaining the level of priority and risk given by the system to the patient admitted to the waiting list. Immediately, the same specialist doctor will be able to observe the location of said patient to monitor and control the evolution of the disease during the time they remain on hold (see Figure 10).
For instance, take two patients, p and , who were admitted to the SWL on the same day and where the treating physicians indicated month and months, respectively. In addition, and the first month after being added to the list, patient p was diagnosed with two additional pathologies, high blood pressure, and diabetes (i.e., with a factor of 1.9 = 1.0 + 0.9). Patient , meanwhile, has not developed additional pathologies during his waiting time (i.e., with a factor of 0). Finally, the SWL admission diagnosis for patient p was a tonsil tumor, and for patient chronic sinusitis (see Table 6). Thus, the level of risk after six months on hold for each patient is given by:
so, although both patients have been waiting for 6 months for a surgery, patient p is 4.17 times more at risk than patient , i.e., . It is evident that, even when both were admitted to the SWL on the same day, the level of risk and severity of patient p has grown with greater magnitude. Therefore, they are a higher priority for surgery than patient .
The antecedents above demonstrate the importance of the traceability and availability of information on patients on the surgical waiting list for adequate decision-making that benefits clinical and administrative network work proposed by the SB strategy of this paper. For a better understanding of SB, embedded in Figure 11, we take the following example. The HCH and PHC health team defines in consensus the 10 variables of (3) that will be measured for each patient. Then, and at PHC, the physician will evaluate seven variables, see Figure 8, of patients suspected to be in need of surgery and will be referred by the same system to the Otolaryngology unit of the HCH. Then, the incoming patient reviews the patient’s history and sends him to the attention box, where the doctor evaluates the diagnostic opinion of the PHC doctor plus the clinical history and diagnosis of the patient at that time, thus being able to make three types of decision: (1) the patient must continue under medical control since his problem is not surgical and must continue under continuous clinical follow-up; (2) the patient has a sufficient history of the disease and must be included on the surgical waiting list; or (3) the patient is not relevant to care in the ENT unit. If the specialist doctor excludes that the patient should be placed on the waiting list for surgery, at the exact moment of the consultation, the professional evaluates only three biopsychosocial variables and adds the clinical judgment of maximum waiting time (see and Figure 9) to then determine the level of prioritization of the patient. If, in the previous process, the patient is highly prioritized, they will be evaluated by the Surgical Waiting List Committee, who will determine by consensus, after studying the necessary clinical and management history, if the patient goes on to the surgical process. If the Committee gives the go-ahead, the patient will soon undergo surgery. The above described is performed weekly and for the entire waiting list of prioritized patients.
As we will describe in the next section, the health team has defined a patient selection mechanism. To do this, we have constructed a predicted physician score, , linked to a dynamic mechanism that quantifies patients’ risk level, . These elements are part of the new SWL management SB strategy through collaborative network work.
3.3.6. Patients Selection Protocol
The final component of our DSS is the automated and weekly selection that the health teams carry out, taking the orderly proposal of patients made by the system with the updated information from the SWL. The patient selection algorithm, , is composed of the sum of and , as follows:
for example, if patients p and had a predicted prioritization of and at the time of entering SWL, and their risk level obtained after spending six months waiting (i.e., y ). Therefore, the order of selection for surgery would be:
that is, patient p with would be the first patient selected for surgery, and with the second. The above analysis is calculated for the entire SWL.
Networking can be seen in Figure 8, Figure 9 and Figure 10, where PHC and ENT physicians interact and update each DSS record each time patients consult. Therefore, the patient selection protocol is developed according to the following procedure:
- Patients with health problems associated with ENT visit the physicians at PHC, who, in the case of surgical suspicion, complete in the DSS the information of seven variables of (3) (i.e., Dest, Lfam, Ncuid, Rcuid, Dtras, Dtrab, Dolor). This was defined by a patient assessment protocol between PHC physicians and ENT specialty physicians (see the system in Figure 8 and the process in Figure 11). The PHC physician will also add the additional pathologies that the patient has, and the system will automatically calculate , which the ENT specialist in step 2 can also update.
- The patient admitted to the DSS is referred by the same system and using a referred medical care order to the ENT specialist, who evaluates the patient’s clinical condition and confirms if his diagnosis is surgical. If so, the physician completes the three missing variables of (3) (i.e., Sever, Tsuen, Pmcx). The DSS automatically calculates the predicted score, , (see the the system in Figure 9 and process in Figure 11). The specialist physician will also add the maximum time that patient p should remain on hold, .;
- Each day the order of the SWL will change depending on the dynamic risk of each patient, . so and every week, the ENT clinical committee will manage the resources required to perform as many surgeries as possible according to the order of the list provided by (see Figure 10). SWL patients will remain controlled and monitored until their surgical turn corresponds.;
- If a patient undergoes surgery and after his first post-surgical medical control in the ENT unit, he will leave the SWL and be referred to the PHC for preventive follow-up. This process would be carried out for each prioritized patient selected by the committee and whose surgical problem is resolved;
The procedure described above is performed automatically by the devised tool. The list of all patients whose surgeries are proposed to be scheduled within the informed available operating-room time corresponds to the list of selected patients. The clinical team refines this list according to additional considerations that are not included in the DSS; for instance, surgeons’ availability, special clinical supplies’ availability, and unexpected changes in the patient’s conditions, among other situations.
4. Main Results of Methodology
The methodology results were agreed with the medical teams of the PHC and the ENT unit of the HCH, where patients with different types of surgical diagnoses and the position of each of them in the SWL were reviewed. The results presented below show that the new SB strategy supports the management of health teams and improves patient attention. This new proposed strategy efficiently uses patient prioritization, impacting timely, just, and equitable selection, thus improving care for each patient.
4.1. Efficiency of the Prioritization Process
Table 3 and Table 7 show the difference in times, measured in minutes, obtained by simulating both strategies, SA and SB, respectively. Table 7 shows that by following the methodology proposed in this work, the times of the health team are optimized, saving around 112 h per year, which is the total process time, measured in minutes between SA and SB, i.e., h.
4.2. Surgical Performance
According to the protocol defined by the Chilean Ministry of Health, a significant outpatient surgical intervention is a procedure in a ward that must be performed by one or two physicians, who allocate an average of 1 h per surgical act. All this depends on the characteristics of the surgery, the patient’s condition, the available resources, and the complexity of the surgery itself. However, and as observed in the data provided by the HCH ward system, the surgeries classified by ENT physicians as less severe (i.e., = 4, see Table 6) have been preferably performed in 1 h and by one ENT physician. Then, and assuming that only surgeries of said group are performed and according to the hours saved in Section 4.1 by means of the SB strategy, about 20% of additional surgeries would be produced during business hours, around 100, with the resources available (i.e., if with SA there are 520 surgeries on average per year, with SB there would be 620 (see Section 3.2)). The foregoing would allow an annual reduction of up to 10% of the SWL, considering that at the cutoff date of 31 December of each year about 1000 patients waiting in the ENT unit (see Table 2).
4.3. Reduction of the Risk of Patients on the SWL
As we have pointed out, the dynamism of the level of risk of patients in SWL evolves daily, being able to alter the order of selection of patients to the ward. For this reason, with the health team, we decided to compare the elements associated with the risk function and its quantification, taking the average of one month as a reference. For SA and SB, we use the month of August in 2020 and 2021, respectively. As shown in Table 8, there is a lower monthly average waiting time for SB than SA, . The previous is due to the greater efficiency of the process (optimization of medical hours), which has allowed physicians to suggest shorter waiting times for patients, . On the other hand, and due to networking with PHC, a more timely investigation of patients has been generated, which translates into a lower monthly average number of additional pathologies, and diagnoses of less severe admissions to SWL, []. Thus, SB demonstrates an 8% lower SWL risk level than SA.
5. Discussion
The methodology presented in this work and due to the ease for PHC and ENT physicians to interpret the results of waiting patients, the multiple linear regression techniques turns out to be effective in predicting the score of new patients admitted to SWL in this unit, a technique that also satisfies the assumptions and statistical hypotheses with the available data. However, this prediction of patient priority could also be effective using other available machine learning methods that are competent with multiple linear regression (i.e., regression decision tree, support vector machine, among others).
Several works, such as García-Rojo et al. [5], Madanipour et al. [6], Cheng et al. [7] and others have shown the risk, consequences, and impact that the COVID-19 pandemic has caused on surgery waiting lists. However, unlike these works, our proposal offers the possibility for health teams to work in coordination and as a network, contributing to carrying out personalized clinical actions and controlling patients’ risk levels during the pandemic period.
On the other hand, and if this methodology needs to be replicated and scaled to other HCH units or to other hospitals in the network with SWL problems, it is imperative to analyze each case independently, since the clinical conditions of the patients differ from one unit to another and/or from one hospital to another, and where other types of variables are likely to come into play, which may not be linear with respect to the priority and dynamic risk of patients.
Despite the advantages offered by the proposed methodology, we believe that it is necessary to consider the evaluation and selection of patients through a control mechanism, such as, for example, a controlling doctor, who could evaluate the opinions that each doctor incorporates for each patient, at the time of prioritization. Due to the experience of specialist professionals, there may be natural clinical variability, which could differ from the opinions of primary care physicians. This situation could cause differences when selecting the most urgent patients for surgery in this line of sensitivity. For this reason, it is essential to have technical protocols prepared by the consensus of the participating health team.
On the other hand, the Clinical Committee meets weekly to decide which patient to schedule for surgery (see Section 3.3.6), which should be held in a consensus meeting. This selection decision is due to additional management components that are analyzed and discussed among physicians. For example, suppose the patient prioritized as No. 1 requires a particular element for his surgery (machine, supplies, equipment, etc.) and the hospital does not have it. In that case, the institution must manage that resource, and the patient will be operated on in time and as soon as possible when they have everything they need. Therefore, they will schedule patients 2, 3, and so on, as long as they have all the necessary resources for surgery. For the reasons mentioned above, this process continues to be manual since clinical considerations must be evaluated as well as management considerations that are not contemplated in this work.
Regarding the data division for model training, we use 80%, 70%, 60%, and 50% of training. As there was no significant difference between the different strategies, we finally opted for a 50%. However, other alternatives can be implemented, such as using cross-validation with stratification to generate another division of the data. This implementation can give continuity to work and offer improvements to what is proposed.
Although we were able to replicate the priority given by physicians in Silva-Aravena et al. [14] using 50% of the variables and using new relative weights or betas, it is mandatory to consult the clinical opinion in the decision process since, for (3), the outliers or the variability of a particular case could be highly sensitive to the results. In addition, there are qualitative and resource management considerations available to medical experts to complement better decision-making in prioritization, risk assessment, and patient selection for surgery. In the same way, and as the present model has been built thanks to the opinion of the physicians of the ENT and PHC unit, it is necessary to consult the opinion of specialists in other hospitals and network-linked services to know and minimize the variability and bias of the opinions of the physicians regarding the management of the SWL.
6. Conclusions and Future Work
In the present work, we have developed a methodology for the selection of new and anonymous patients in SWL—the SB strategy—which contemplates a mathematical algorithm that measures, on the one hand, the dynamic risk of the patients, and on the other hand, a prioritization scheme based on a multiple linear regression model. For this, we used the registry of 205 anonymous cases of SWL patients from the ENT unit of HCH. Then, and through the use of the mixed selection method, we discovered those relevant variables of (3), which, with new , allowed us to replicate and predict the priority of patients through . With this new strategy it is possible to predict the prioritization results of the previous strategy, SA. This methodology provides new elements and a greater degree of effectiveness in the management of SWL, since the health team can determine the selection of new patients with a greater degree of automation and in less time, thereby benefiting the patients and the management of the ENT unit.
From a methodological point of view, the new prioritization proposal complies with the statistical assumptions associated with multiple linear regression models. In addition, and in the component that measures patients’ risk in SWL, we include the criteria of specialists in the clinical area. This experience allowed us to mathematically model the risk function for each new patient who enters the waiting list. This combination and dynamism allows for characterizing, prioritizing, and selecting patients, favoring the management of the health team.
The new strategy presented in this article (SB) was compared with the strategy used by physicians (SA). The reduction of time to prioritize patients in SWL decreases by 112 h per year, which translates into approximately 100 additional surgeries per year and an average 10% reduction in SWL. On the other hand, the risk of SWL decreases by 8%. Likewise, by reducing the prioritization variables from 20 to 10, greater computational efficiency is produced, simplifying the problem and discovering greater understanding on the part of the health team in decision-making. This methodology will help reduce SWL in the ENT unit since it will improve efficiency (optimization of medical hours) and effectiveness (more potential surgeries), allowing greater patient satisfaction. These types of strategies must be developed with health teams for the benefit of patients and be constantly validated over time.
In order to successfully implement this type of strategy in other health services, it is necessary to have the variables, relevant attributes and/or criteria of the experts in each area and have the data to be able to model, train, and validate the strategy robustness of algorithms with similar characteristics on patient prioritization and selection systems.
We hope to implement new simulations of our methodology using new kinds of data and variables in health care units. We also intend to implement this methodology in a system belonging to an actual HCH unit.
Author Contributions
Conceptualization, F.S.-A., J.M.; Formal analysis, F.S.-A.; Funding acquisition, F.S.-A.; Investigation, F.S.-A., J.M.; Methodology, F.S.-A., J.M.; Project administration, F.S.-A.; Software J.M.; Supervision, J.M.; Visualization, F.S.-A.; Writing—original draft, F.S.-A.; Writing—review & editing, F.S.-A., J.M. All authors have read and agreed to the published version of the manuscript.
Funding
F. Silva-Aravena was funded by the ANID PFCHA/DOCTORADO BECAS CHILE/2018—21180528.
Data Availability Statement
Conflicts of Interest
The authors declare no conflict of interest.
References
- Jiang, S.; Chin, K.; Wang, L.; Qu, G.; Tsui, K. Modified genetic algorithm-based feature selection combined with pre-trained deep neural network for demand forecasting in outpatient department. Expert Syst. Appl. 2017, 82, 216–230. [Google Scholar] [CrossRef]
- Escobar, L.D.P.; García-Centeno, M.C. Impacto de la covid-19 sobre las listas de espera quirúrgicas. Rev. Esp. Salud Pública 2021, 95, 12. [Google Scholar]
- Bowers, J. Waiting list behaviour and the consequences for NHS targets. J. Oper. Res. Soc. 2010, 61, 246–254. [Google Scholar] [CrossRef]
- Sutherland, J.; Crump, R.; Chan, A.; Liu, G.; Yue, E.; Bair, M. Health of patients on the waiting list: Opportunity to improve health in Canada? Health Policy 2016, 120, 749–757. [Google Scholar] [CrossRef] [PubMed]
- García-Rojo, E.; Manfredi, C.; Santos-Pérez-de-la Blanca, R.; Tejido-Sanchez, A.; Garcia-Gomez, B.; Aliaga-Benitez, M.; Romero-Otero, J.; Rodriguez-Antolin, A. Impact of COVID-19 outbreak on urology surgical waiting lists and waiting lists prioritization strategies in the post-COVID-19 era. Actas Urol. Esp. (Engl. Ed.) 2021, 45, 207–214. [Google Scholar] [CrossRef]
- Madanipour, S.; Al-Obaedi, O.; Ayub, A.; Iranpour, F.; Subramanian, P. Resuming elective hip and knee arthroplasty in the COVID-19 era: A unique insight into patient risk aversion and sentiment. Ann. R. Coll. Surg. Engl. 2021, 103, 104–109. [Google Scholar] [CrossRef]
- Cheng, K.K.; Anderson, M.J.; Velissaris, S.; Moreton, R.; Al-Mansour, A.; Sanders, R.; Sutherland, S.; Wilson, P.; Blaikie, A. Cataract risk stratification and prioritisation protocol in the COVID-19 era. BMC Health Serv. Res. 2021, 21, 153. [Google Scholar] [CrossRef]
- Castillo, R.S.; Kelemen, A. Considerations for a successful clinical decision support system. CIN Comput. Inform. Nurs. 2013, 31, 319–326. [Google Scholar] [CrossRef]
- Hilkhuysen, G.; Oudhoff, J.; Rietberg, M.; Van der Wal, G.; Timmermans, D. Waiting for elective surgery: A qualitative analysis and conceptual framework of the consequences of delay. Public Health 2005, 119, 290–293. [Google Scholar] [CrossRef]
- Gutacker, N.; Siciliani, L.; Cookson, R. Waiting time prioritisation: Evidence from England. Soc. Sci. Med. 2016, 159, 140–151. [Google Scholar] [CrossRef] [Green Version]
- Fields, E.; Okudan, G.; Ashour, O. Rank aggregation methods comparison: A case for triage prioritization. Expert Syst. Appl. 2013, 40, 1305–1311. [Google Scholar] [CrossRef]
- Riff, M.; Cares, J.; Neveu, B. RASON: A new approach to the scheduling radiotherapy problem that considers the current waiting times. Expert Syst. Appl. 2016, 64, 287–295. [Google Scholar] [CrossRef]
- Rahimi, S.; Jamshidi, A.; Ruiz, A.; Aït-Kadi, D. A new dynamic integrated framework for surgical patients’ prioritization considering risks and uncertainties. Decis. Support Syst. 2016, 88, 112–120. [Google Scholar] [CrossRef]
- Silva-Aravena, F.; Álvarez-Miranda, E.; Astudillo, C.A.; González-Martínez, L.; Ledezma, J.G. Patients’ Prioritization on Surgical Waiting Lists: A Decision Support System. Mathematics 2021, 9, 1097. [Google Scholar] [CrossRef]
- Allepuz, A.; Espallargues, M.; Martínez, O. Criterios para priorizar a pacientes en lista de espera para procedimientos quirúrgicos en el Sistema Nacional de Salud. Rev. Calid. Asist. 2009, 24, 185–191. [Google Scholar] [CrossRef]
- Harrison, A.; Appleby, J. English NHS waiting times: What next? J. R. Soc. Med. 2009, 102, 260–264. [Google Scholar] [CrossRef] [Green Version]
- Mullen, P. Prioritising waiting lists: How and why? Eur. J. Oper. Res. 2003, 150, 32–45. [Google Scholar] [CrossRef]
- Siciliani, L.; Hurst, J. Tackling excessive waiting times for elective surgery: A comparative analysis of policies in 12 OECD countries. Health Policy 2005, 72, 201–215. [Google Scholar] [CrossRef]
- Siciliani, L.; Moran, V.; Borowitz, M. Measuring and comparing health care waiting times in OECD countries. Health Policy 2014, 118, 292–303. [Google Scholar] [CrossRef] [Green Version]
- Tamayo, M.; Besoaín, Á.; Rebolledo, J. Determinantes sociales de la salud y discapacidad: Actualizando el modelo de determinación. Gac. Sanit. 2018, 32, 96–100. [Google Scholar] [CrossRef]
- Hungin, A.P.S.; Rubin, G.P. Management of dyspepsia across the primary-secondary healthcare interface. Dig. Dis. 2001, 19, 219–224. [Google Scholar] [CrossRef]
- Wadmann, S.; Strandberg-Larsen, M.; Vrangbæk, K. Coordination between primary and secondary healthcare in Denmark and Sweden. Int. J. Integr. Care 2009, 9, e04. [Google Scholar] [CrossRef]
- Abad, L.G. El trabajo en red colaborativo: Desafíos y posibilidades. Cuad. Trab. Soc. 2020, 33, 141. [Google Scholar] [CrossRef] [Green Version]
- Cicchini, A.; Agrelo, D.; Galarza, E. Beneficios del Trabajo en Red a Propósito de una Lesión Grave de Mano. 2021. Available online: https://repositorio.hospitalelcruce.org/xmlui/handle/123456789/1159?show=full (accessed on 25 May 2022).
- Sidhu, M.; Pollard, J.; Sussex, J. Vertical integration of primary care practices with acute hospitals in England and Wales: Why, how and so what? Findings from a qualitative, rapid evaluation. BMJ Open 2022, 12, e053222. [Google Scholar] [CrossRef]
- Valente, R.; Testi, A.; Tanfani, E.; Fato, M.; Porro, I.; Santo, M.; Santori, G.; Torre, G.; Ansaldo, G. A model to prioritize access to elective surgery on the basis of clinical urgency and waiting time. BMC Health Serv. Res. 2009, 9, 1. [Google Scholar] [CrossRef] [Green Version]
- Turner, C.; Bishay, H.; Bastien, G.; Peng, B.; Phillips, R. Configuring policies in public health applications. Expert Syst. Appl. 2007, 32, 1059–1072. [Google Scholar] [CrossRef]
- Netten, A.; Curtis, L. Unit Costs of Health and Social Care; Canterbury University: Christchurch, New Zealand, 2001. [Google Scholar]
- Rahimi, S.; Jamshidi, A.; Ruiz, A.; Aït-Kadi, D. Multi-criteria decision making approaches to prioritize surgical patients. In Health Care Systems Engineering for Scientists and Practitioners; Springer: Berlin/Heidelberg, Germany, 2016; pp. 25–34. [Google Scholar]
- De Almeida, J.R.; Noel, C.W.; Forner, D.; Zhang, H.; Nichols, A.C.; Cohen, M.A.; Wong, R.J.; McMullen, C.; Graboyes, E.M.; Divi, V.; et al. Development and validation of a Surgical Prioritization and Ranking Tool and Navigation Aid for Head and Neck Cancer (SPARTAN-HN) in a scarce resource setting: Response to the COVID-19 pandemic. Cancer 2020, 126, 4895–4904. [Google Scholar] [CrossRef] [PubMed]
- Rahimi, S.A.; Dery, J.; Lamontagne, M.E.; Jamshidi, A.; Lacroix, E.; Ruiz, A.; Ait-Kadi, D.; Routhier, F. Prioritization of patients access to outpatient augmentative and alternative communication services in Quebec: A decision tool. Disabil. Rehabil. Assist. Technol. 2020, 17, 8–15. [Google Scholar] [CrossRef] [PubMed]
- Petwal, H.; Rani, R. Prioritizing the Surgical Waiting List-Cosine Consistency Index: An Optimized Framework for Prioritizing Surgical Waiting List. J. Med. Imaging Health Inform. 2020, 10, 2876–2892. [Google Scholar] [CrossRef]
- Kilinc, D.; Gel, E.S.; Demirtas, A. Intelligent Teletriage and Personalized Routing to Manage Patient Access in a Neurosurgery Clinic. IISE Trans. Healthc. Syst. Eng. 2021, 11, 224–239. [Google Scholar] [CrossRef]
- Dash, C.S.K.; Behera, A.K.; Nayak, S.C. 14 Online Clinic Appointment System Using Support Vector Machine. In Cognitive Computing Using Green Technologies: Modeling Techniques and Applications; CRC Press: Boca Raton, FL, USA, 2021; p. 239. [Google Scholar]
- Lei, H.; Huang, Z.; Zhang, J.; Yang, Z.; Tan, E.; Zhou, F.; Lei, B. Joint detection and clinical score prediction in Parkinson’s disease via multi-modal sparse learning. Expert Syst. Appl. 2017, 80, 284–296. [Google Scholar] [CrossRef]
- Hadorn, D.; the Steering Committee of the Western Canada Waiting List Project. Setting priorities for waiting lists: Defining our terms. CMAJ 2000, 163, 857–860. [Google Scholar]
- Gutiérrez Porlán, I.; Román García, M.; Sánchez Vera, M.d.M. Estrategias para la Comunicación y el Trabajo Colaborativo en red de los Estudiantes Universitarios = STRATEGIES for the Communication and Collaborative Online Work by University Students. 2018, pp. 91–100. Available online: https://www.torrossa.com/en/resources/an/4241277# (accessed on 25 May 2022).
- Candón-Mena, J. Innovación, economía y trabajo colaborativo en la red: El ejemplo del software libre. In Economía Colaborativa...¿ De Verdad? Laborum: Murcia, Spain, 2018; Available online: https://idus.us.es/handle/11441/83034 (accessed on 25 May 2022).
- Oddershede, A.M.; Macuada, C.J.; Quezada, L.E.; Montt, C.A. Automation Factors Influencing the Operation of IoT in Health Institutions: A Decision Support Methodology. Int. J. Comput. Commun. Control 2020, 15. Available online: http://univagora.ro/jour/index.php/ijccc/article/view/3878 (accessed on 25 May 2022). [CrossRef]
- Turgeon, M.K.; Lee, R.M.; Gamboa, A.C.; Yopp, A.; Ryon, E.L.; Goel, N.; Wang, A.; Lee, A.Y.; Luu, S.; Hsu, C.; et al. Impact of hepatitis C treatment on long-term outcomes for patients with hepatocellular carcinoma: A United States Safety Net Collaborative Study. HPB 2021, 23, 422–433. [Google Scholar] [CrossRef]
- Peduzzi, M.; Agreli, H.F. Teamwork and collaborative practice in Primary Health Care. Interface-Comun. Saúde Educ. 2018, 22, 1525–1534. [Google Scholar]
- Zeadally, S.; Bello, O. Harnessing the power of Internet of Things based connectivity to improve healthcare. Internet Things 2021, 14, 100074. [Google Scholar] [CrossRef]
- Ghazal, T.M.; Hasan, M.K.; Alshurideh, M.T.; Alzoubi, H.M.; Ahmad, M.; Akbar, S.S.; Al Kurdi, B.; Akour, I.A. IoT for smart cities: Machine learning approaches in smart healthcare—A review. Future Internet 2021, 13, 218. [Google Scholar] [CrossRef]
- Philip, N.Y.; Rodrigues, J.J.; Wang, H.; Fong, S.J.; Chen, J. Internet of Things for in-home health monitoring systems: Current advances, challenges and future directions. IEEE J. Sel. Areas Commun. 2021, 39, 300–310. [Google Scholar] [CrossRef]
- Cisneros, M. Priorización de Listas de Espera de Cirugía para la Gestión de Pabellones Quirúrgicos del Hospital Pediátrico Dr. Exequiel González Cortés. Master’s Thesis, Universidad de Chile, Santiago, Chile, 2010. [Google Scholar]
- Julio, C.; Wolff, P.; Yarza, M. Modelo de gestión de listas de espera centrado en oportunidad y justicia. Rev. Méd. Chile 2016, 144, 781–787. [Google Scholar] [CrossRef]
- Silva-Aravena, F.; Álvarez-Miranda, E.; Astudillo, C.A.; González-Martínez, L.; Ledezma, J.G. On the data to know the prioritization and vulnerability of patients on surgical waiting lists. Data Brief 2020, 29, 105310. [Google Scholar] [CrossRef]
- Arias, E.B.N.; Nuñez, B.M.G.; Fernández, L.N.; Pupo, J.M.R. CRISP-DM y K-means neutrosofía en el análisis de factores de riesgo de pérdida de audición en niños. Rev. Asoc. Latinoam. Cienc. Neutrosóficas 2021, 16, 73–81. [Google Scholar]
- Schröer, C.; Kruse, F.; Gómez, J.M. A systematic literature review on applying CRISP-DM process model. Procedia Comput. Sci. 2021, 181, 526–534. [Google Scholar] [CrossRef]
- Cunha, A.F.; Ferreira, D.; Neto, C.; Abelha, A.; Machado, J. A CRISP-DM Approach for Predicting Liver Failure Cases: An Indian Case Study. In International Conference on Applied Human Factors and Ergonomics; Springer: Berlin/Heidelberg, Germany, 2021; pp. 156–164. [Google Scholar]
- Kolyshkina, I.; Simoff, S. Interpretability of machine learning solutions in public healthcare: The CRISP-ML approach. Front. Big Data 2021, 4, 660206. [Google Scholar] [CrossRef]
Figure 1.
CRISP-DM method of this research.

Figure 2.
SWL prioritization process, according to SA.

Figure 3.
Pearson’s correlation coefficient evidences a strong linear relationship of the test data between the Pscore (priority given by physicians to patients using 20 variables) and Predscore (), associated with the final fitted model (3). *** There is a robust linear relationship between the predicted score from the test data and the initial score, Pscore.

Figure 4.
Correlation matrix of the variables used in (2). Multicollinearity is displayed when comparing the variable with the highest fit, Sever, with respect to the predictor variables Urg, Jclin, Com, Hanor, Olim.
Figure 4.
Correlation matrix of the variables used in (2). Multicollinearity is displayed when comparing the variable with the highest fit, Sever, with respect to the predictor variables Urg, Jclin, Com, Hanor, Olim.

Figure 5.
Correlation matrix of variables of the final adjusted model, (3). Absence of multicollinearity between the predictor variables is visualized.
Figure 5.
Correlation matrix of variables of the final adjusted model, (3). Absence of multicollinearity between the predictor variables is visualized.

Figure 6.
Variance inflation factor (VIF) of each predictor variable of (3). The tolerable limit to avoid collinearity problems between variables is 5.
Figure 6.
Variance inflation factor (VIF) of each predictor variable of (3). The tolerable limit to avoid collinearity problems between variables is 5.

Figure 7.
Residuals with constant variance. Linear fit of the predictor variables of (3).
Figure 7.
Residuals with constant variance. Linear fit of the predictor variables of (3).

Figure 8.
The patient consults in PHC. If the PHC physician suspects a surgical diagnosis for the surgical waiting list, he/she completes the variables and pathologies from the patient and refers him/her to ENT units, see Figure 9.
Figure 8.
The patient consults in PHC. If the PHC physician suspects a surgical diagnosis for the surgical waiting list, he/she completes the variables and pathologies from the patient and refers him/her to ENT units, see Figure 9.

Figure 9.
When the patient reaches the ENT unit, the ENT physician evaluates the patient, and confirms, modifies, or rejects the patient’s diagnosis. If he/she confirms or modifies the diagnosis, he/she completes the prioritization variables SWL and calculates the risk and priority of the patient.
Figure 9.
When the patient reaches the ENT unit, the ENT physician evaluates the patient, and confirms, modifies, or rejects the patient’s diagnosis. If he/she confirms or modifies the diagnosis, he/she completes the prioritization variables SWL and calculates the risk and priority of the patient.

Figure 10.
In this Figure, the health team can see the list of shortlisted patients and decide who will go to the ward soon.
Figure 10.
In this Figure, the health team can see the list of shortlisted patients and decide who will go to the ward soon.

Figure 11.
Prioritization process based on the proposed networking strategy, SB.


Table 1.
The variables used by the physicians of the ENT unit to prioritize patients on the surgical waiting list with their weights of relative importance, , (see, Silva-Aravena et al. [14] and the of the SB strategy proposed in this work (see (3)).
| Variable | Definition | |||
|---|---|---|---|---|
| 0 | Intercept | Intercept | - | −0.0292 |
| 1 | Sever | Severity | 0.081 | 0.58 |
| 2 | Urg | Urgency | 0.076 | |
| 3 | Jclin | Maximum waiting time | 0.066 | |
| 4 | Tsuen | Sleep disorder | 0.063 | 0.60 |
| 5 | Tlist | Time on list | 0.062 | |
| 6 | Pmcx | Expected improvement due to surgery | 0.055 | 0.20 |
| 7 | Dest | Capacity to study | 0.054 | 0.24 |
| 8 | Com | Chances of developing comorbities | 0.053 | |
| 9 | Lfam | Capacity of participating in family activities | 0.053 | 0.63 |
| 10 | Hanor | Affected area | 0.052 | |
| 11 | Opat | Presence of other pathologies | 0.047 | |
| 12 | Diag | Diagnosis | 0.046 | |
| 13 | Olim | Other limitations | 0.045 | |
| 14 | Ncuid | Need of a caregiver | 0.043 | 0.56 |
| 15 | Rcuid | Patient cares for another person | 0.043 | 0.51 |
| 16 | Dolor | Pain sale | 0.040 | 0.20 |
| 17 | Dtrab | Capacity to work | 0.038 | 0.22 |
| 18 | Acc | Type of residence area | 0.033 | |
| 19 | Dtras | Difficulty in transfering | 0.028 | 0.80 |
| 20 | Ccrit | Need for clinical bed | 0.023 |
Table 2.
Number of patients who remain in SWL annually in the ENT unit of HCH.
| Date | n |
|---|---|
| 31 December 2015 | 998 |
| 31 December 2016 | 1200 |
| 31 December 2017 | 1123 |
| 31 December 2018 | 1108 |
| 31 December 2019 | 1307 |
| 31 December 2020 | 1136 |
| 31 December 2021 | 1028 |
Table 3.
Prioritization of patients in SWL according to SA in the ENT unit, HCH (in minutes).
| Stage | Patients | Minimun | Average | Maximum | Total |
|---|---|---|---|---|---|
| Admission | 6970 | 1.47 | 5.02 | 9.21 | 34,989.40 |
| Diagnostic confirmation | 6970 | 4.92 | 15.01 | 25.27 | 104,619.70 |
| Medical control | 4112 | 4.20 | 15.03 | 25.86 | 61,803.36 |
| Biospychosocial assessment | 2788 | 0.41 | 1.99 | 3.69 | 5448.12 |
| Confirmation of patient to ward | 2788 | 48.33 | 59.95 | 71.24 | 167,140.60 |
| Total process time | – | – | – | – | 374,101.18 |
Table 4.
Different cross-validation methods for measuring the performance of the predictive (3) with the test data sets.
Table 4.
Different cross-validation methods for measuring the performance of the predictive (3) with the test data sets.
| Resampling Method | RMSE | R-Squared | MAE |
|---|---|---|---|
| LOOCV | 0.0703 | 0.9045 | 0.0573 |
| 5-Fold | 0.0708 | 0.9014 | 0.0579 |
| 10-Fold | 0.0705 | 0.9090 | 0.0573 |
| 10-Fold, repeated 3 times | 0.0696 | 0.9061 | 0.0573 |
Table 5.
Additional pathologies or conditions that ENT patients in SWL commonly present. The medical team agreed upon the group and the Factor of each one.
Table 5.
Additional pathologies or conditions that ENT patients in SWL commonly present. The medical team agreed upon the group and the Factor of each one.
| Pathology or Status | Factor |
|---|---|
| Valvulopathy or other heart disease | 1.8 |
| Risk of malignancy | 1.6 |
| Sleep apnea syndrome | 1.4 |
| Chronic lung disease | 1.4 |
| Immunosuppression | 1.3 |
| Rheumatoid arthritis | 1.1 |
| Arterial hypertension | 1.0 |
| Diabetes | 0.9 |
| Risk of infectious complications | 0.8 |
| Hearing loss | 0.8 |
| Depression/Anxiety | 0.5 |
| Neurological complications | 0.5 |
| Gastrointestinal disorders | 0.3 |
| Down’s Syndrome | 0.2 |
Table 6.
Diagnostic Types, , most common admissions to SWL in ENT units, and defined in consensus by the health team.
Table 6.
Diagnostic Types, , most common admissions to SWL in ENT units, and defined in consensus by the health team.
| Diagnostic Name | Diagnostic Type |
|---|---|
| Tonsil tumor | 1 |
| Nostril tumor | 1 |
| Middle ear tumor | 1 |
| Glottis tumor | 1 |
| Subglottic tumor | 1 |
| Maxillary sinus tumor | 1 |
| Ethmoid sinus tumor | 1 |
| Frontal sinus tumor | 1 |
| Sphenoid tumor | 1 |
| Other tumors | 1 |
| Tonsil and adenoid hypertrophy | 2 |
| Adenoid hypertrophy | 2 |
| Tonsil hypertrophy | 2 |
| Chronic mastoiditis | 3 |
| Middle ear cholesteatoma | 3 |
| External ear cholesteatoma | 3 |
| Nasal septum deviation | 3 |
| Nasal turbinate hypertrophy | 3 |
| Nasal polyp | 3 |
| Tear duct obstruction | 4 |
| Frontal mucocele | 4 |
| Tympanic membrane perforation | 4 |
| Chronic tonsillitis | 4 |
| Inflammatory polyposis | 4 |
| Chronic sinusitis | 4 |
Table 7.
Simulation of the network prioritization process for new patients in SWL, measured in minutes, according to the new SB strategy.
Table 7.
Simulation of the network prioritization process for new patients in SWL, measured in minutes, according to the new SB strategy.
| Stage | Patients | Minimun | Average | Maximum | Total |
|---|---|---|---|---|---|
| Admission | 6970 | 1.05 | 5.00 | 8.36 | 34,850.00 |
| Diagnostic confirmation | 6970 | 4.51 | 14.94 | 24.56 | 104,131.80 |
| Medical control | 4112 | 4.30 | 14.98 | 25.05 | 61,597.76 |
| Biospychosocial assessment | 2788 | 0.08 | 0.16 | 0.2 | 446.08 |
| Confirmation of patient to ward | 2788 | 48.15 | 59.66 | 72.11 | 166,332.08 |
| Total process time | – | – | – | – | 367,357.72 |
Table 8.
Comparison of the monthly risk level of the SA and SB strategies of the SWL. The values are expressed as a monthly average, August 2020 for SA and August 2021 for SB.
Table 8.
Comparison of the monthly risk level of the SA and SB strategies of the SWL. The values are expressed as a monthly average, August 2020 for SA and August 2021 for SB.
| Strategy | [t − t.] | cj. | ap.(t) | r.(t) | |
|---|---|---|---|---|---|
| SA | 41.3 | 18 | 2.90 | 1.20 | 6.39 |
| SB | 36.1 | 15 | 2.64 | 0.83 | 5.88 |
Publisher’s Note: MDPI stays neutral with regard to jurisdictional claims in published maps and institutional affiliations. |
© 2022 by the authors. Licensee MDPI, Basel, Switzerland. This article is an open access article distributed under the terms and conditions of the Creative Commons Attribution (CC BY) license (https://creativecommons.org/licenses/by/4.0/).
Share and Cite
MDPI and ACS Style
Silva-Aravena, F.; Morales, J. Dynamic Surgical Waiting List Methodology: A Networking Approach. Mathematics 2022, 10, 2307. https://0-doi-org.brum.beds.ac.uk/10.3390/math10132307
AMA Style
Silva-Aravena F, Morales J. Dynamic Surgical Waiting List Methodology: A Networking Approach. Mathematics. 2022; 10(13):2307. https://0-doi-org.brum.beds.ac.uk/10.3390/math10132307
Chicago/Turabian StyleSilva-Aravena, Fabián, and Jenny Morales. 2022. "Dynamic Surgical Waiting List Methodology: A Networking Approach" Mathematics 10, no. 13: 2307. https://0-doi-org.brum.beds.ac.uk/10.3390/math10132307
Note that from the first issue of 2016, this journal uses article numbers instead of page numbers. See further details here.