
Opinion Mining of Green Energy Sentiment: A Russia-Ukraine Conflict Analysis


1
Department of Applied Economics I, Universidad Rey Juan Carlos, Paseo de los Artilleros s/n, 28032 Madrid, Spain
2
Departament of Quantitative Economics, Universidad de Oviedo, Avda. del Cristo s/n, 33006 Oviedo, Spain
*
Author to whom correspondence should be addressed.
Mathematics 2022, 10(14), 2532; https://0-doi-org.brum.beds.ac.uk/10.3390/math10142532
Submission received: 6 July 2022
/
Revised: 18 July 2022
/
Accepted: 19 July 2022
/
Published: 21 July 2022
(This article belongs to the Special Issue Advances in Mathematical Methods for Economy and Sustainable Development Goals)
Abstract
:In this paper, we assess sentiment and emotion regarding green energy through employing a social listening analysis on Twitter. Knowing the sentiment and attitude of the population is important because it will help to promote policies and actions that favor the development of green or renewable energies. We chose to study a crucial period that coincides with the onset of the 2022 Ukrainian–Russo conflict, which has undoubtedly affected global energy policies worldwide. We searched for messages containing the term “green energy” during the days before and after the conflict started. We then performed a semantic analysis of the most frequent words, a comparative analysis of sentiments and emotions in both periods, a dimensionality reduction analysis, and an analysis of the variance of tweets versus retweets. The results of the analysis show that the conflict has changed society’s sentiments about an energy transition to green energy. In addition, we found that negative feelings and emotions emerged in green energy tweeters once the conflict started. However, the emotion of confidence also increased as the conflict, intimately linked to energy, has driven all countries to promote a rapid transition to greener energy sources. Finally, we observed that of the two latent variables identified for social opinion, one of them, pessimism, was maintained while the other, optimism, was subdivided into optimism and expectation.
Keywords:
green energy; Twitter social listening; Ukraine–Russia conflict; sentiment and emotion analysisMSC:
62P25; 91D151. Introduction
The Sustainable Development Agenda approved by the United Nations (UN) in 2015 is embodied in 17 Sustainable Development Goals (SDGs) and 169 associated targets to be achieved by 2030. This marked a significant milestone in global debate on issues ranging from education, gender equality, and the elimination of poverty to the fight against climate change, defense of the environment, and the design of our cities. One of these SDGs affects green energy. SDG 7 seeks to guarantee access to affordable, reliable, sustainable, and modern energy for all [1]. This goal includes: 7.1. assuring universal access to energy services, 7.2. increasing the share of renewable energy in the pool of energy sources, 7.3. doubling the global rate of improvement in energy efficiency, 7.A. enhancing international cooperation to facilitate access to clean energy research and technology, and 7.B. expanding the infrastructure and upgrading technology to supply modern and sustainable energy services for all in developing countries [2]. However, green energy does not only appear in SDG 7 as there are other goals such as SDG 13 (Climate Action) that are closely related to energy. At the end of the 20th century, the energy markets were oriented toward freedom of investment decisions [3] but interest in caring for the environment and mitigating climate change had also started to raise interest in green energies. Green energy is clean and non-polluting energy that comes from 100% renewable sources, making it a more environmentally friendly and sustainable alternative to fossil fuels. Finally, taking into account the statement by the International Renewable Energy Agency (IRENA), asserting that doubling the share of renewable energies worldwide to 36% in 2030 would mean an increase in employment of more than 24 million people in the sector compared to the current 9.2 million and that the global economy would grow by 1.1% (the equivalent of 1.3 billion dollars), we can find significant synergies between green energy and others SDGs, such as SDG 1 (No Poverty), SDG 2 (Zero Hunger), SDG 3 (Good Health and Well-being), and SDG 8 (Decent Work and Economic Growth) [4,5,6]. However, the adoption of the SDGs is taking place at a time when the world is facing serious social and economic problems, particularly the COVID-19 pandemic and the Ukrainian–Russo conflict. In this work, we aim to analyze how the 2022 Ukrainian–Russo conflict has affected social interest in green energy.
The terms “green energy”, “renewable energy”, and “clean energy” are often confused. Green energy is energy that comes from natural sources, such as the sun. Renewable energy is energy generated from resources that are continuously replenished, such as water. Clean energy is energy whose generation does not produce polluting emissions. There is consensus that all renewable energies are clean, but not all clean energies are renewable. Thus, nuclear energy is considered clean but not renewable energy. The difference between green and renewable energy raises more debate, for example, whether hydropower, which may require the modification of riverbeds and have an environmental impact, can be considered green energy.
The Intergovernmental Panel on Climate Change (IPCC) has published its Sixth Assessment Report (AR6), which will serve as the basis for the first global stocktaking of the Paris Agreement under the United Nations Framework Convention on Climate Change (UNFCCC) in 2023. The AR6 unequivocally shows the relationship between human activity and its responsibility for causing global warming. The IPCC indicates that without deep reductions in greenhouse gas (GHG) emissions in all sectors it will not be possible to limit global warming to 1.5 °C. This reduction requires global GHG emissions to be reduced by 43% by 2030, which also includes a substantial reduction in the level of methane emissions. However, despite all the recommendations included in the AR6, the prospects for improvement are not very good, due in part to the ongoing conflict in Ukraine, as some countries are reverting to coal and liquefied gas, which increase emissions.
The 2022 Ukrainian–Russo conflict is causing substantial damage to the global economy. In [7], the author proved that after the war individuals expect lower economic growth and higher inflation, this effect being larger if the country has higher energy-import dependency. In [8], the authors studied the impact of the conflict on the returns of stock markets all over the world and concluded that, as expected, the conflict had significant negative returns in all cases, these negative returns being larger in those countries that condemned the invasion and/or are geographically close to the conflict. In this vein, Ref. [9] also found a negative impact of the conflict on stock markets, but they argued that variation at the country level is not only due to geographic proximity to conflict zones, but also to the importance of trade and economic ties with conflict countries. In spite of this, Ref. [10] analyzed the impact of the Russia–Ukraine conflict from a capital market perspective and found that investors’ views on a possible acceleration of the green energy transition do not seem to be affected.
The Russo–Ukrainian conflict has led to sanctions against Russia and the goal of moving away from dependence on Russian gas and oil, resulting in other countries facing new dilemmas in their ambitious green energy transition plans. It should be noted that in the short term, many countries are once again thinking about coal and promoting new gas infrastructure as a way out of the current supply and price crisis. Although Frans Timmermans, Executive Vice-President of the European Commission, has indicated that “Putin’s war in Ukraine demonstrates the urgency of accelerating our green transition”, the increase in subsidies for oil and gas extraction casts doubt on the fulfillment of the commitment to reduce GHG emissions and expand renewable energies.
In the case of Europe, the International Energy Agency (IEA) has made a strong call for more renewable energy to reduce its dependence on Russia. Europe’s high energy dependency on Russia has hampered European efforts to counter 2022 Ukrainian–Russo conflict with sanctions, leaving the heavy lifting to the US, which has banned imports of Russian oil and gas.
In the midst of this difficult situation, the European Commission issued a statement on 8 March 2022, titled “REPowerEU: Joint European action for more affordable, secure and sustainable energy” in which it set out what measures should be implemented in the coming months to make Europe independent of fossil fuels originating in Russia. The REPowerEU plan calls for accelerating the use of renewable fuels (green hydrogen and biomethane) to replace gas and improvements in energy efficiency using renewable energy sources. European Commission President Ursula von der Leyen has said that the green transition must be accelerated. Executive Vice-President Frans Timmermans added that renewable energy is a cheap, clean, and inexhaustible source of energy that would create jobs in Europe.
The 2022 Ukrainian–Russo conflict is having medium and long-term repercussions that will boost green technologies which were previously being unevenly adopted by different countries. In this regard, the United Kingdom has drawn up a new energy strategy that affects sectors such as nuclear and renewable energies. Germany, despite missing its renewables deployment targets between 2010 and 2020, is bringing forward its deadline for a complete transition to renewables in its electricity sector to 2035. Italy has initiated talks to import green hydrogen from large solar installations set up in states such as Algeria and Libya. In the case of Spain, the installation of renewables has continued to grow at a considerable rate—although not without some peaks and troughs—reaching over 50% of electricity production by 2021. By the end of 2021, Europe and the United Kingdom had the capacity to produce around 49% of their electricity from renewable energies, almost twice as much as the United States.
The news and opinions that have been reaching us through the Internet about the 2022 Ukrainian–Russo conflict and green energy condition social opinion. One type of social opinion is the one collected through social networks such as Twitter, Facebook, Instagram, and LinkedIn, among others.
In [11], the authors emphasized the importance and validity of social networks as gauges of human activity and sensors of human opinion. This is one of the reasons why the use of Twitter as a source of information to learn about public opinion is increasingly common in studies of different topics of general interest such as climate change [12], sustainability [13], financial education [14], marketing strategies [15], and the 2022 Ukrainian–Russo conflict [16,17,18], among others.
Another relevant aspect is that the use of Twitter data allows us to capture the sentiment of society about a topic in an immediate and current way, which is a great advantage compared to information collected through surveys, whether they are periodic or punctual. Through the opinions expressed in social networks, it is possible to know the emotions and attitudes of public opinion on a topic. This sentiment analysis, also called opinion mining, is performed with the help of natural language processing (NLP) [19].
In this paper, we examine the real-time effects of the 2022 Ukrainian–Russo conflict on the public’s perception of green energy using sentiment analysis on an extended sample of tweets. Knowing the trends of different topics of great interest to society, such as green energy, facilitates strategic decision-making by politicians, investors, and consumers. We utilize a collection of over 160,000 tweets from 16 February to 3 March 2022, that discuss green energy generated. The tweets were archived using the open-source program R. Our findings provide initial evidence of the immediate effects of the conflict, notably that green energy responded pessimistically to the negative events of the conflict. However, a high degree of hope regarding the future of green energy was perceived in the second period. Since the conflict started, a new debate has opened up about the need for a transition towards sustainable and green energy.
Our study reveals that once the impact of the conflict and the related negative emotions and sentiment passed, the light of a new opportunity to transit towards greener energy sources appeared, and sentiments such as trust or joy returned in our social listening. This is in line with the results obtained by [20], who argued for using the opportunity presented by the need to eliminate energy dependence on Russian oil and gas to encourage governments to implement policies that promote the transition to green energy. In this vein, Ref. [21] points out that the crisis arising from the situation in Ukraine can accelerate energy transition policies in the EU, although while these policies are being implemented the EU must secure energy supplies despite the sanctions imposed on Russia. Thus, Ref. [22] find that Europe is likely to invest heavily in green energy and also in liquefied petroleum gas (LPG) import facilities to reduce energy dependence on Russia.
This work is novel and original in carrying out a text analysis of social listening on green energy in this period.
The remainder of the paper is arranged as follows. Section 2 is a brief review of some of the literature on sentiment analysis and green energy. The following section is devoted to the methodology and data. The main results are provided in Section 4 and, finally, conclusions are discussed in Section 5.
2. Literature Review
Twitter is one of the most important and popular social media platforms. Since its appearance in 2006, millions of people have used Twitter to share opinions and reflections and it has become a very large source of information. Active users often learn about important news through Twitter before any other means. Currently, there are more than 1.3 billion Twitter accounts, publishing about 500 million tweets every day [23]. In the last reporting quarter of 2021, the number of global monetizable daily active users (mDAU) on Twitter amounted to 217 million users and it is expected to grow upwards of 329 million in 2022 [24].
There is no doubt about the importance and validity of social networks as gauges of human activity and sensors of human opinion [25]. Although not everyone uses social networks to express their opinions, their widespread use supports their usefulness to gauge the opinions, attitudes, and sentiments of the general public [26]. In [27], the authors review the methods employed by different researchers using Twitter to measure public opinion and sentiment.
Twitter has been the subject of academic analyses that have focused on studying it as a means of information and communication in various fields, notably in relation to political and social issues, its use by populist politicians, during election campaigns (see [28,29] and the references therein), and concerning the COVID-19 pandemic [30,31]. Moreover, numerous researchers have shown how, in times of crisis and conflict, social networks play a key role in mobilizing people behind a common cause [32].
A good example is the 2022 Ukrainian–Russo conflict. In [17], the real-time effects of the escalating Ukrainian crisis on a series of economic indicators was examined and it was noted that most indices experienced a negative response to the conflict, with crude oil registering a strong, persistent response. In [18], 33 million tweets were analyzed and it was found that most of them contain hashtags showing solidarity with the Ukrainian people. In [33], this result was also obtained. These authors also explored the importance of information warfare and misinformation on social media during the conflict. In [16], the authors found that Twitter deleted a significant number of tweets and users since the conflict began. They found that most of them misused Twitter, taking advantage of the Ukrainian government’s call for cryptocurrency donations by distributing unverified crypto addresses. In [34], tweets related to the conflict in Ukraine were collected since its beginning, showing how negative feelings of sadness or rage were mostly related to tweets associated with Ukraine, as well as those in support of the country.
Another topic of interest in social media is climate change (see [35] for a review of the literature). In [12], the authors analyzed Twitter activity in Spain and the UK related to climate change and found that it was significantly related to the public demonstration and strike that happened in spring 2019. In Spain, the highest peak of social activity during their period of study occurred on June 29 when Europe was suffering an intense heatwave and Spain registered extreme temperatures. In [36], communication about climate change on Twitter was analyzed. The authors focused on gender differences and found that men were more skeptical than women, who are more interested in the anthropogenic impact on the climate.
Concern about climate change necessarily leads to a focus on energy efficiency and the use of green or renewable energy. Again, social media can be useful to know the opinion of the population on this topic, and Twitter can help us to perform this social listening and know the pulse of society in real time. One of the most recent studies in this area is that of [37], who analyzed a sample of tweets related to green energy during 2020 and found that the highest number of tweets coincided with events such as the anniversary of Earth Day or the broadcast of an election debate in which climate change was included for the first time. They also found that the majority of tweets were in English. Many other studies have analyzed views on alternative energies (renewable, green, clean) using social listening [38,39,40,41,42]. Most of these works analyze the sentiments derived from different tweets.
Thus, in [37] the sentiments revealed by tweets about green energy were analyzed, showing that they were mostly positive. The same result was obtained in [12], where the opinion on Twitter in the UK and Spain about climate change and energy were studied and it was found that the populations of both countries support renewable energy. In [38], the authors analyzed the discourse on Twitter related to renewable energy during 2017 and found that positive emotions were quadruple negative emotions; joy being the most frequent feeling. Similarly, in [39] there was evidence of a positive relationship between public sentiment toward solar energy and renewable policies. Sentiment analysis was used by [40,41] to compare renewable energy sources. They found an optimistic attitude of people towards renewable sources of energy. A systematic review of the literature on the population’s opinion on renewable energies was made by [42]. They found that the majority conclude that the population supports the use of renewable energies. In [43], the authors indicated that it is important to understand the public’s concerns. In this way, a method can be created to resolve their objections to renewable energy in order to further expand renewable energy.
3. Methodology
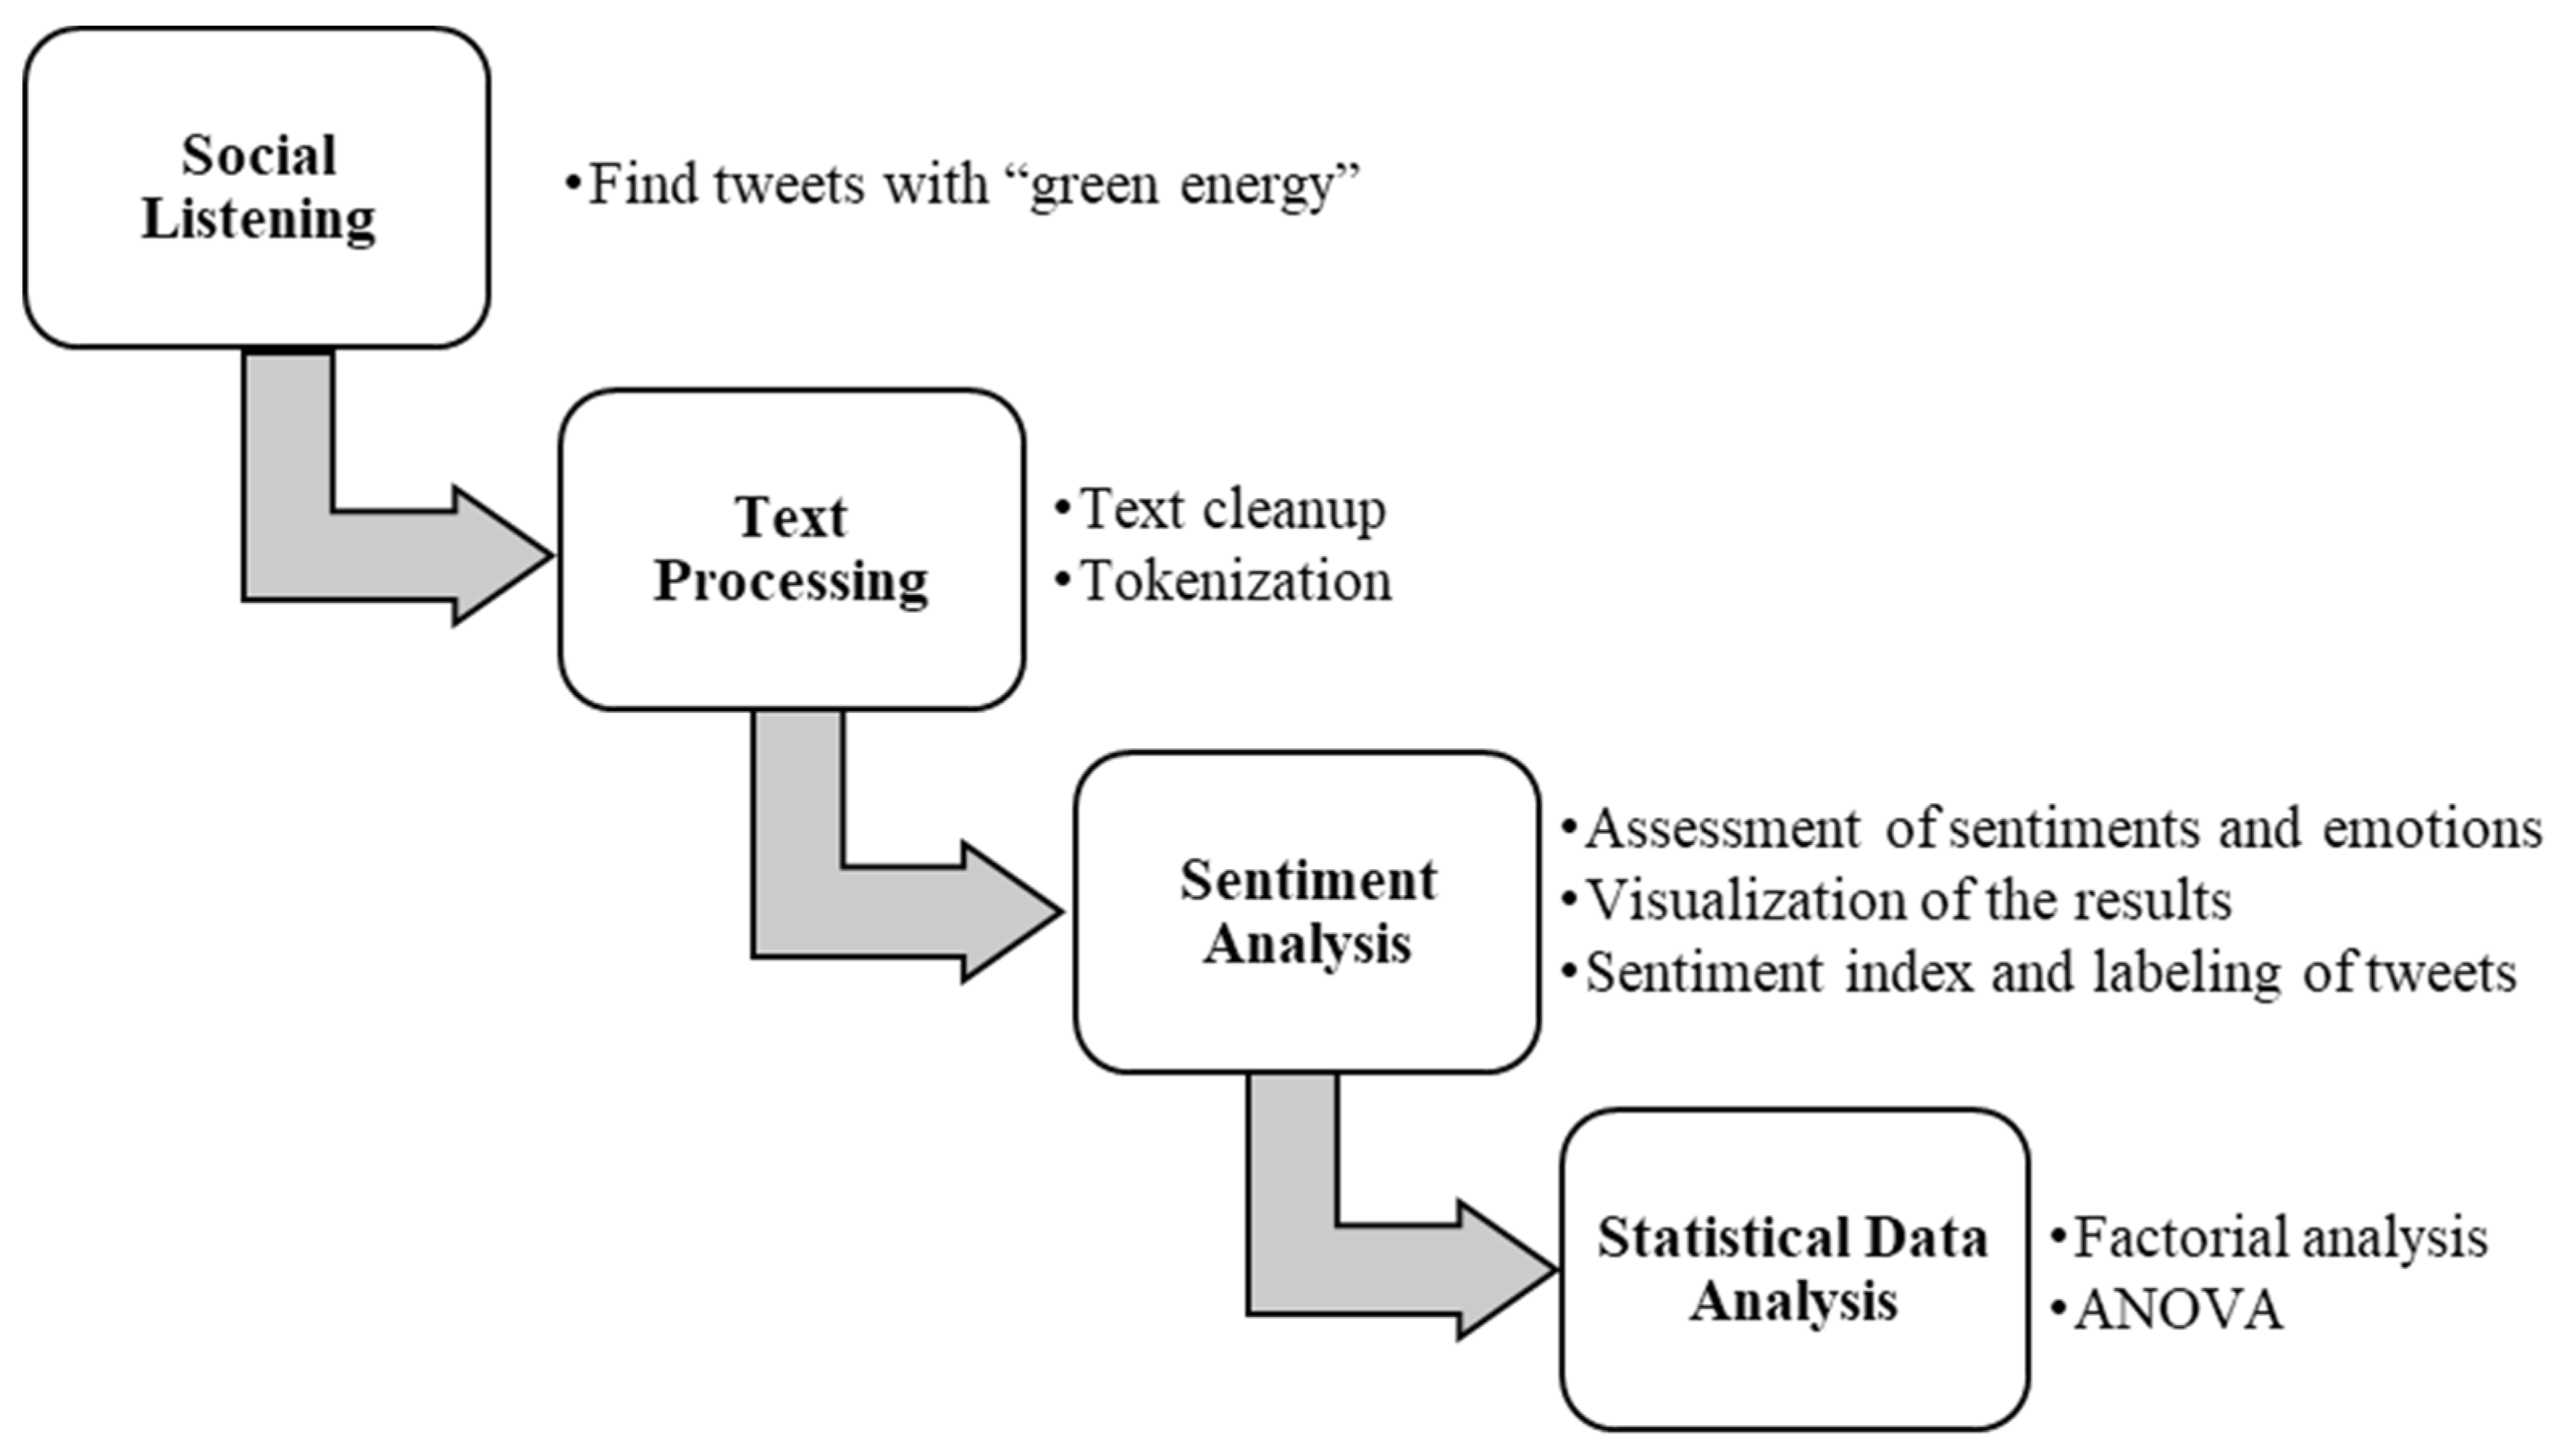
In this research, we carried out a social listening analysis on green energy before and after 24 February 2022, the day when Russia invaded Ukraine. The methodology behind the analysis of this search is summarized in Figure 1.
Social listening. In the first stage of the methodology, a database was created from tweets obtained by searching for the term “green energy” on the social network Twitter. The search was performed several times a day from 16 February 2022, to 3 March 2022. For this purpose, a script was developed using the R programming language with the Rtweet library, which facilitated communication with the Twitter graphical application interface (API). Repeated tweets were eliminated from the search results, obtaining a representative sample of the messages written by Twitter users during the period studied.
Text processing. Secondly, the text of the downloaded messages was cleaned with the help of R libraries (tidyverse, tidytext, stringi, and topicmodel) so that it could be analyzed later. Once the text was cleaned, words lacking semantic interest for the context of the study were removed. For this purpose, a dictionary of sensitive words to be eliminated was created from the stopwords dictionary provided by the tidytext library and from the words directly related to the studied topic that had little value in the analysis. The final result of the text processing was a corpus with clean text that could be analyzed using natural language processing (NLP) techniques.
Sentiment analysis. In the third phase, the emotions and sentiments conveyed in the studied social listening were identified. For this purpose, lexicon-based sentiment analysis was performed, comparing the text of the tweets with terms from the NRC dictionary of the R package syuzhet [44]. This dictionary was selected due to its ability to identify the sentiment and emotion of each word. Ten new variables associated with each tweet were constructed: eight capturing the emotion and two measuring the latent sentiment in the message. The construction of these variables was based on quantification of the words that each of the tweets used and that corresponded to the feelings (negative and positive) and emotions (anger, anticipation, disgust, fear, joy, sadness, surprise, and trust) of the NRC dictionary.
In addition, a daily comparative analysis of feelings and emotions was performed. The results were visualized in daily data graphs and a stepwise analysis, before and after the conflict. A frequency analysis of the most repeated words in the social listening was performed and represented in daily word clouds showing the 500 most repeated words and the most frequent bigrams in each period. For this purpose, the Wordcloud library of R was used.
In order to polarize the messages, and according to the NRC dictionary, a Sentiment Index (SI) was defined from the variables generated in the second step of the methodology [40]. For the ith tweet with words, we calculated its sentiment index as follows:
where and ; is the jth word of the ith tweet. According to the value of this index, the tweets could be labeled into three groups:
- if the tweet is positive,
- if the tweet is negative, and
- if the tweet is neutral.
Statistical Data Analysis. In the last stage of the methodology, multivariate statistical analysis techniques were used. A reduction of the dimensions of the feelings and emotions by stage was carried out from a Factor Analysis (FA). For this, Principal Component Analysis (PCA) was used and factors were extracted following the Kaiser method [45] with an orthogonal rotation (Varimax) to improve interpretability. This technique allowed us to identify how sentiments and emotions were grouped in each of the observed stages as well as the established relationship between them.
The factorial model expressed in matrix form is:
where is the data matrix, is the matrix of factor loadings, is the matrix of factor scores, and is the vector of single factors. Furthermore, the variance of the variable is decomposed as follows:
where is the factor loading of the variable in the factor .
The variability that is explained by the factors extracted from the observed variables corresponds to the first summand of Equation (3). To improve the interpretability of the result, the varimax factorial rotation method was used and the new factor loadings were calculated under the condition of minimizing the number of variables with high factor loadings in one factor.
where is the matrix of the factor loadings for the rotated factors, is a rotation of that verifies its same properties, and is an orthogonal matrix. The square of the factorial loading indicates the percentage of the variable that is explained by each factor . The variables of the feelings and emotions were grouped in the factors in which they reached a higher percentage of explainability. Variables classified in the same factor have similar behavior in social listening.
In addition, tweets were classified into two groups: those that had been retweeted and those that had not. An analysis of variance (ANOVA) was performed for each of the studied periods, considering each of the sentiments and emotions as an independent variable. This analysis provides information on the sentiment that most sensitized the social networks in each of the studied periods.
An ANOVA model with one factor was proposed for each of the 10 sentiment and emotion variables in each period of study for the two groups: tweets and retweets.
where is the mean of the variable in each group and is a random variable.
To estimate the model, a hypothesis test was performed:
H0:
The two training methods produce identical results.
H1:
The two training methods do not produce identical results.
Where, the contrast statistic follows a t-student probability distribution, as a particular case of the general statistic when there are more than two groups:
If the null hypothesis for the contrast is rejected, then we would be accepting that the studied variable has different behavior in the two samples with a significance of 5%. This technique allows us to compare the sentiments and emotions of the retweeted and non-re-tweeted messages.
4. Data Collection
Twitter data mining was conducted from 16 February 2022, through 3 March 2022. To see how the 2022 Ukrainian–Russo conflict affected social listening of green energy, the period analyzed was divided into period 1 (from 16 to 21 February), which covers the days before the outbreak of the conflict, and period 2 (from 22 February to 3 March), which covers the first days of the conflict.
All tweets containing the keyword string ‘green energy’ were systematically searched several times a day and all repeated tweets were removed. We extracted only the tweets that were written in the English language. The Twitter query used in the search was: tweets<- search_tweets (‘“green energy”’, token = twitter_token, urs = T, n = 18,000, lang = “en”, type = “mixed”, include_rts = TRUE, since = ‘2022-0x-xx’, until = ‘2022-0x-xx’, output_file_name = “tweets.csv”).
The final search provided a total of 285,992 tweets and 90 variables. To ensure that all of the studied days had the same representativeness, a simple random sample of 10,000 daily tweets was selected. The final database for the study consisted of 160,000 tweets. We differentiated between tweets and retweets (see Table 1). The percentage of tweets and retweets in each of the periods did not vary considerably. Moreover, the percentage of retweets was almost double that of tweets in both periods.
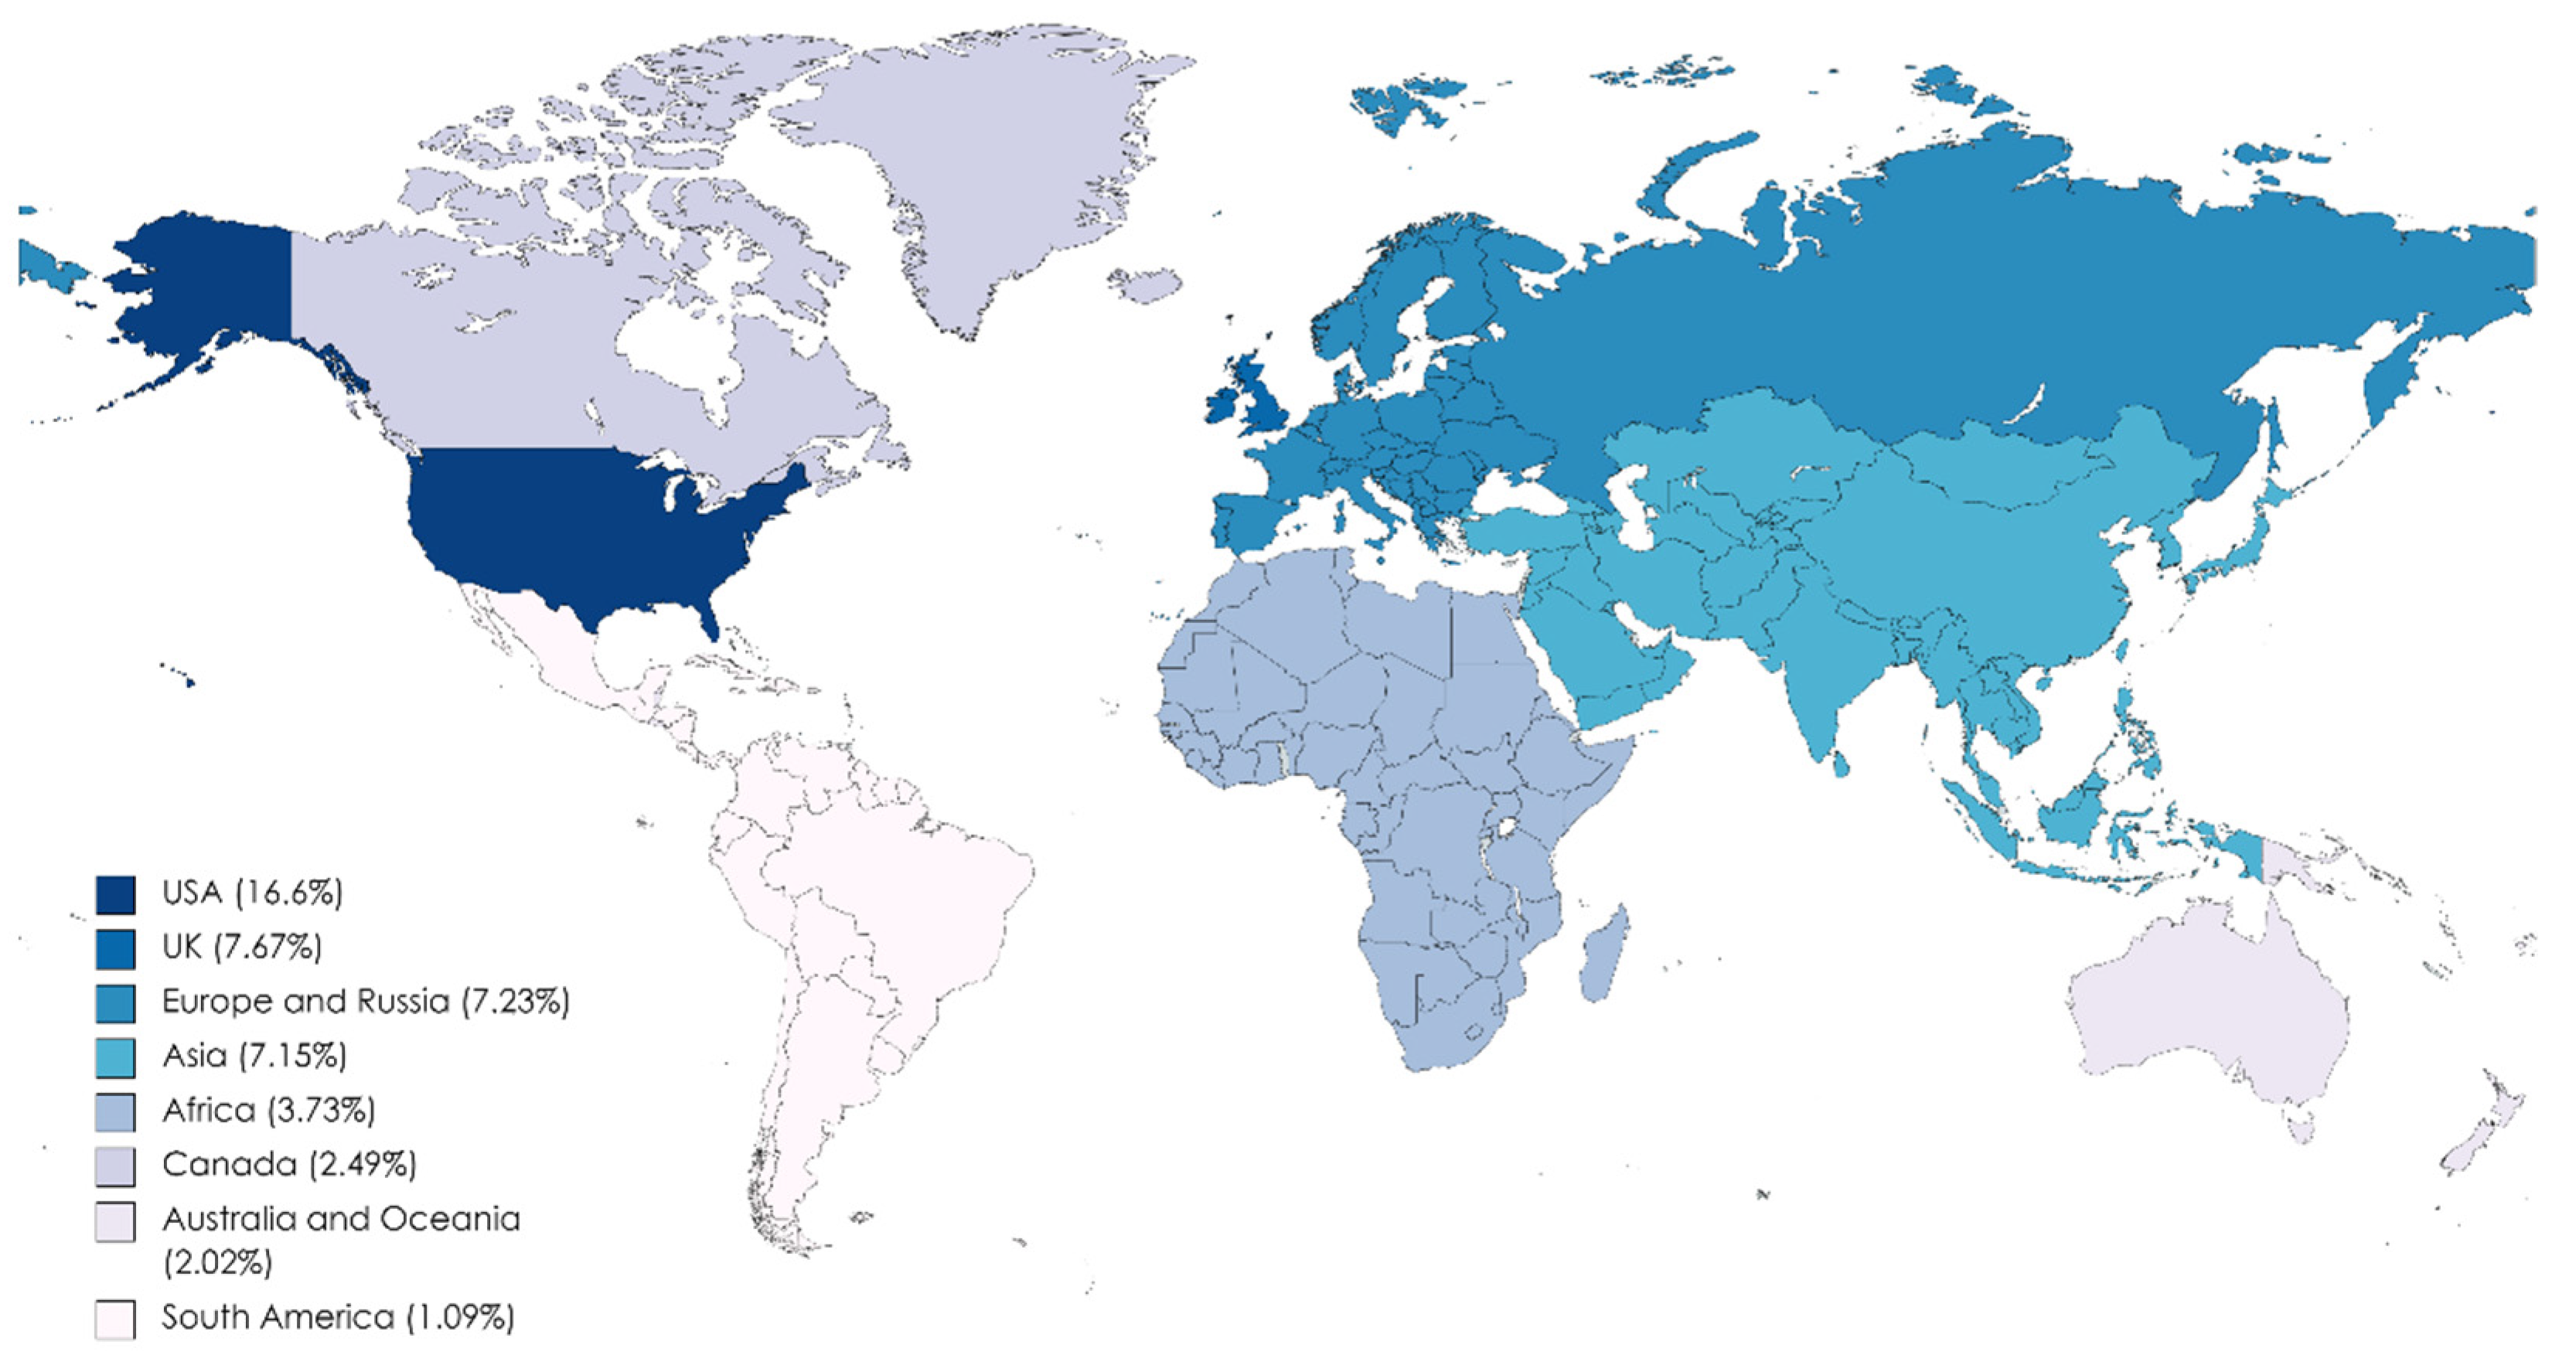
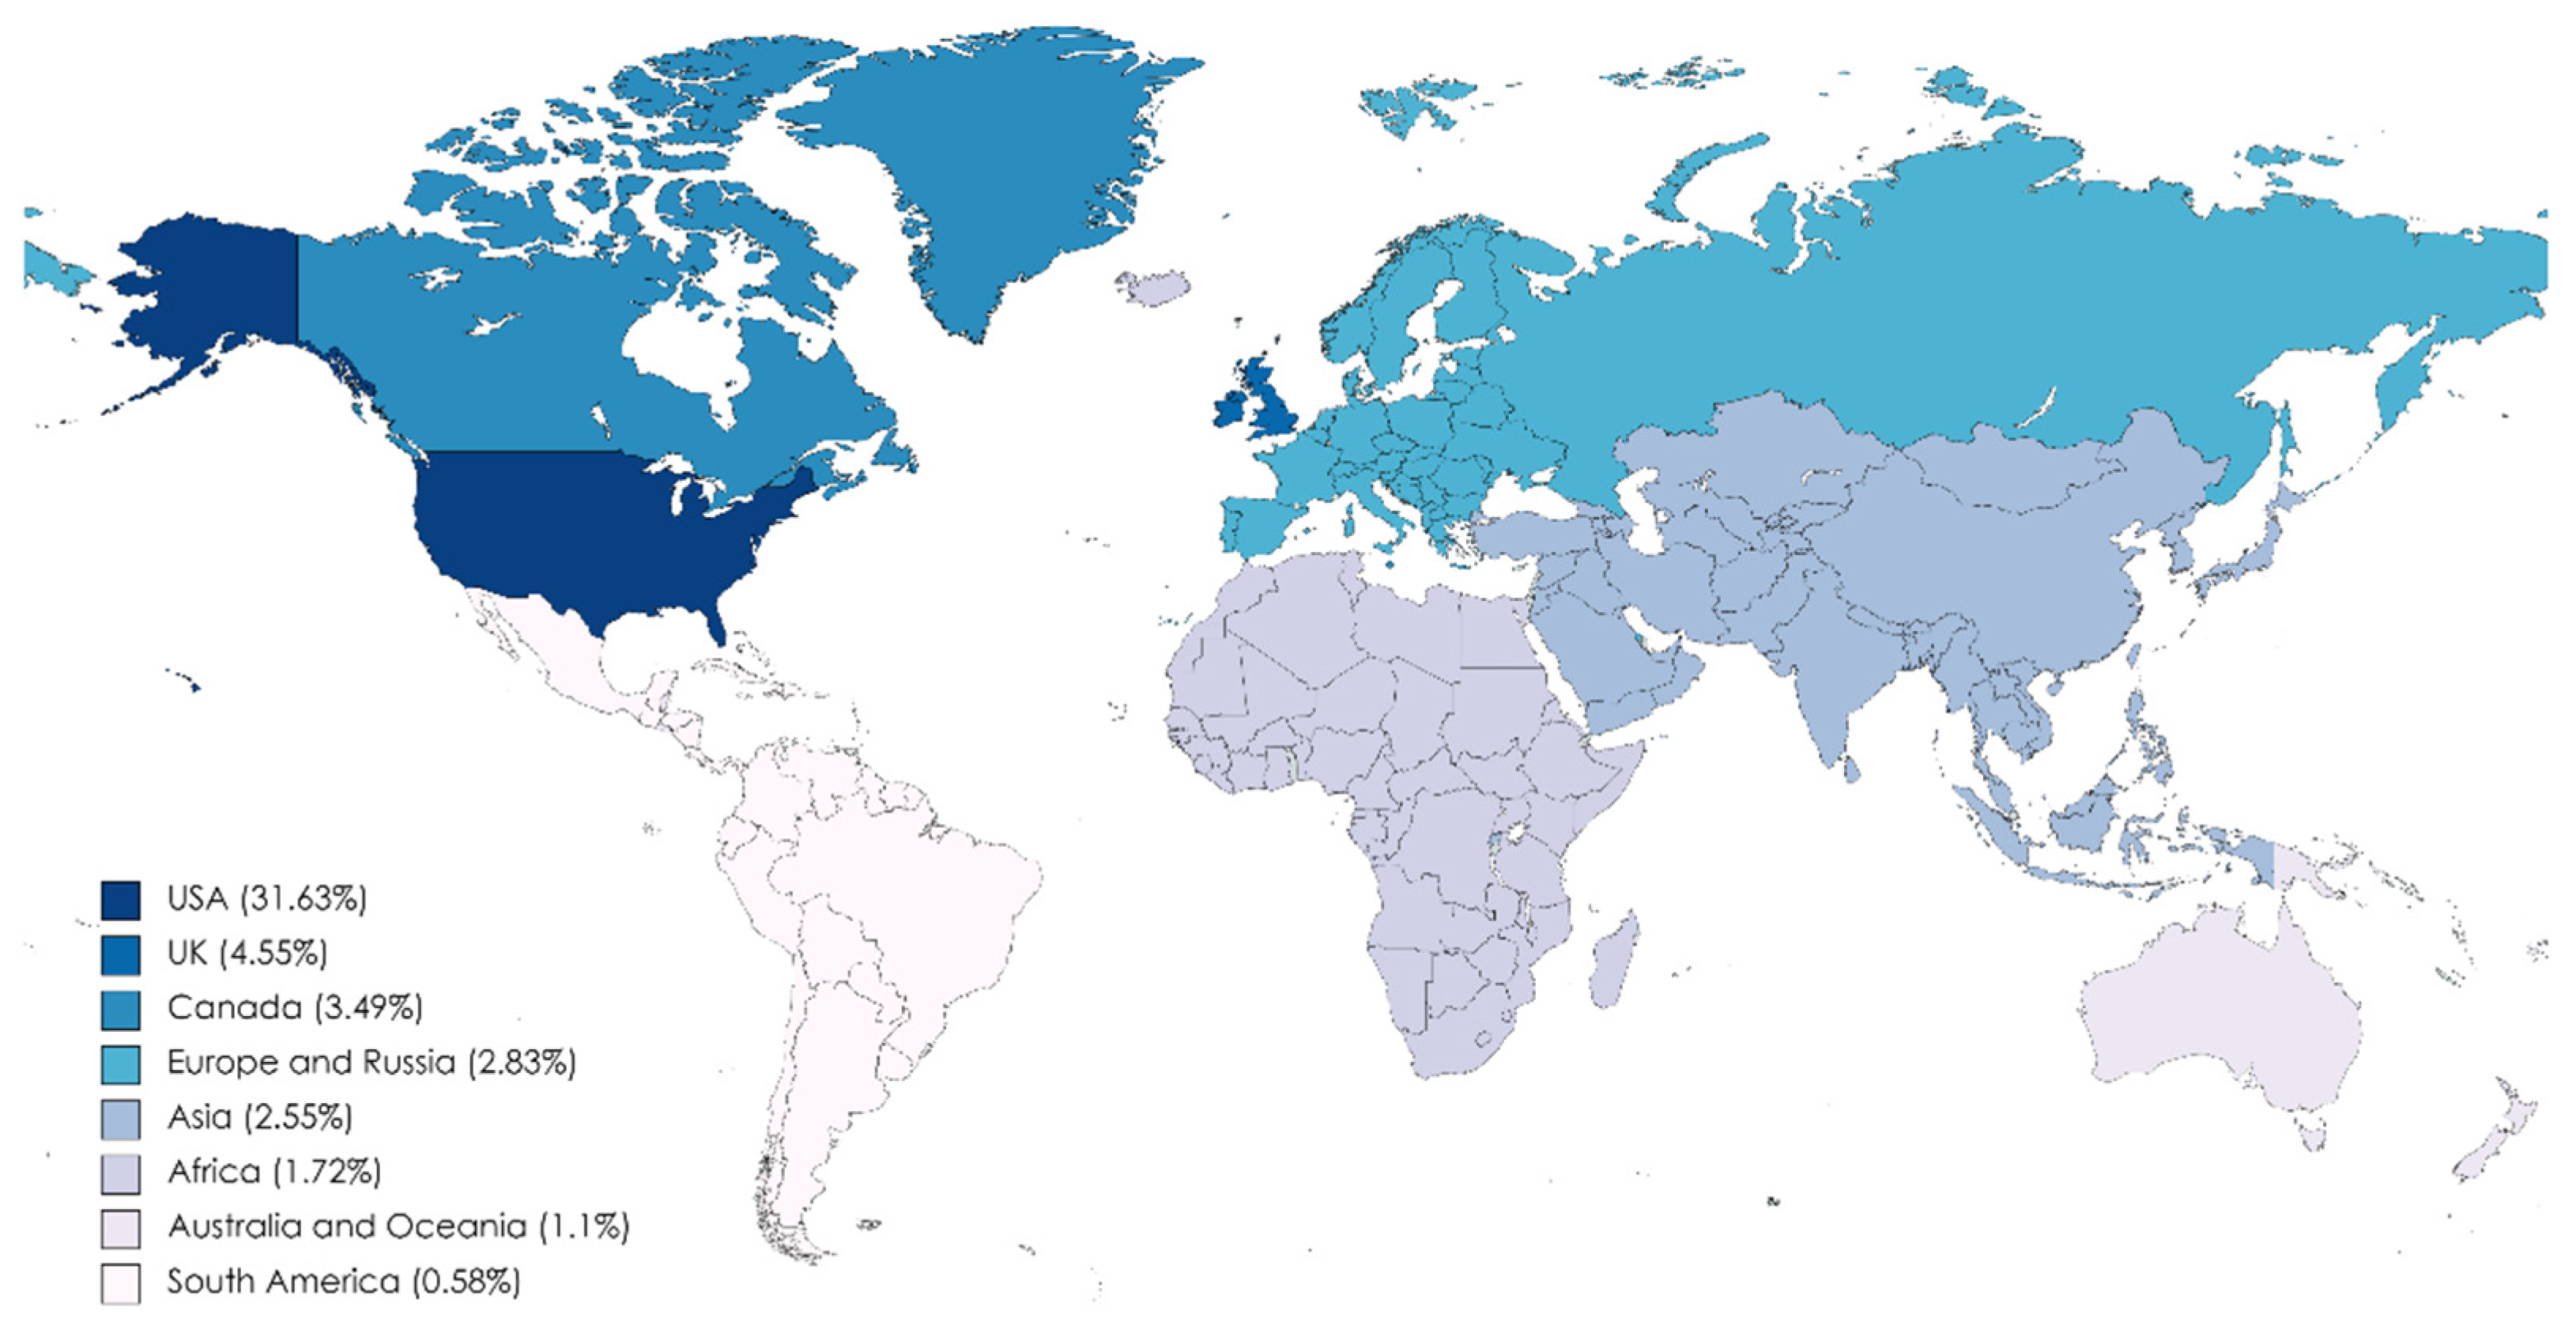
Through a geographical analysis of the tweets for each period (Figure 2 and Figure 3), we can see how in both cases more than half of the tweets could not be classified; 52.03% and 51.56%, respectively. Given that the language chosen in the search was English, it is logical that most tweets would originate in the United States and the United Kingdom.
5. Results and Discussion
5.1. Wordclouds toward Green Energy
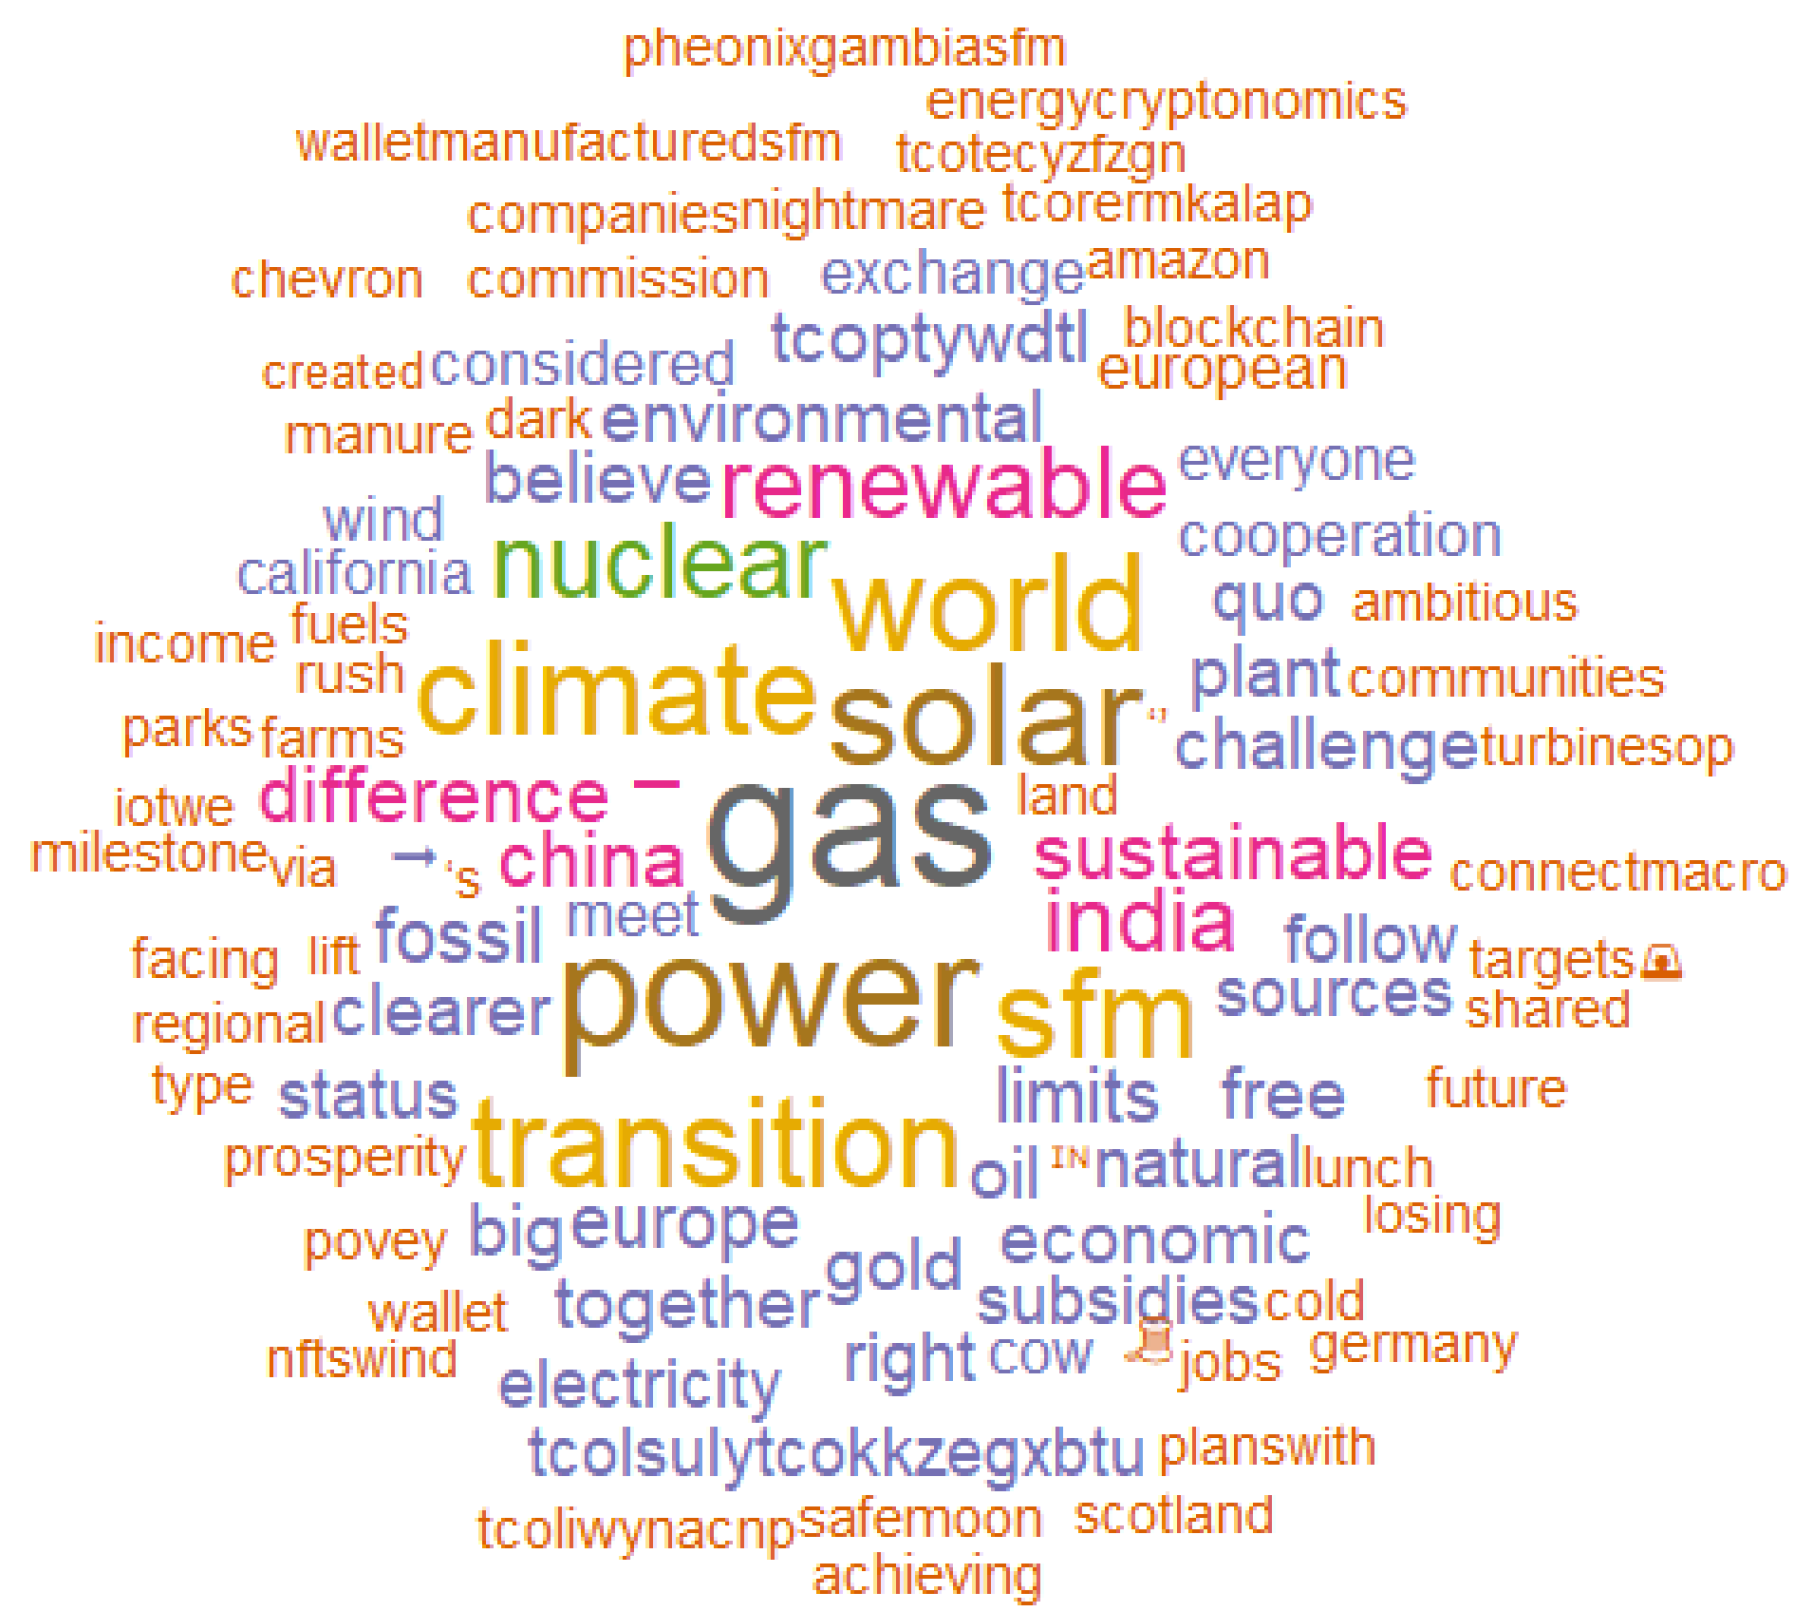
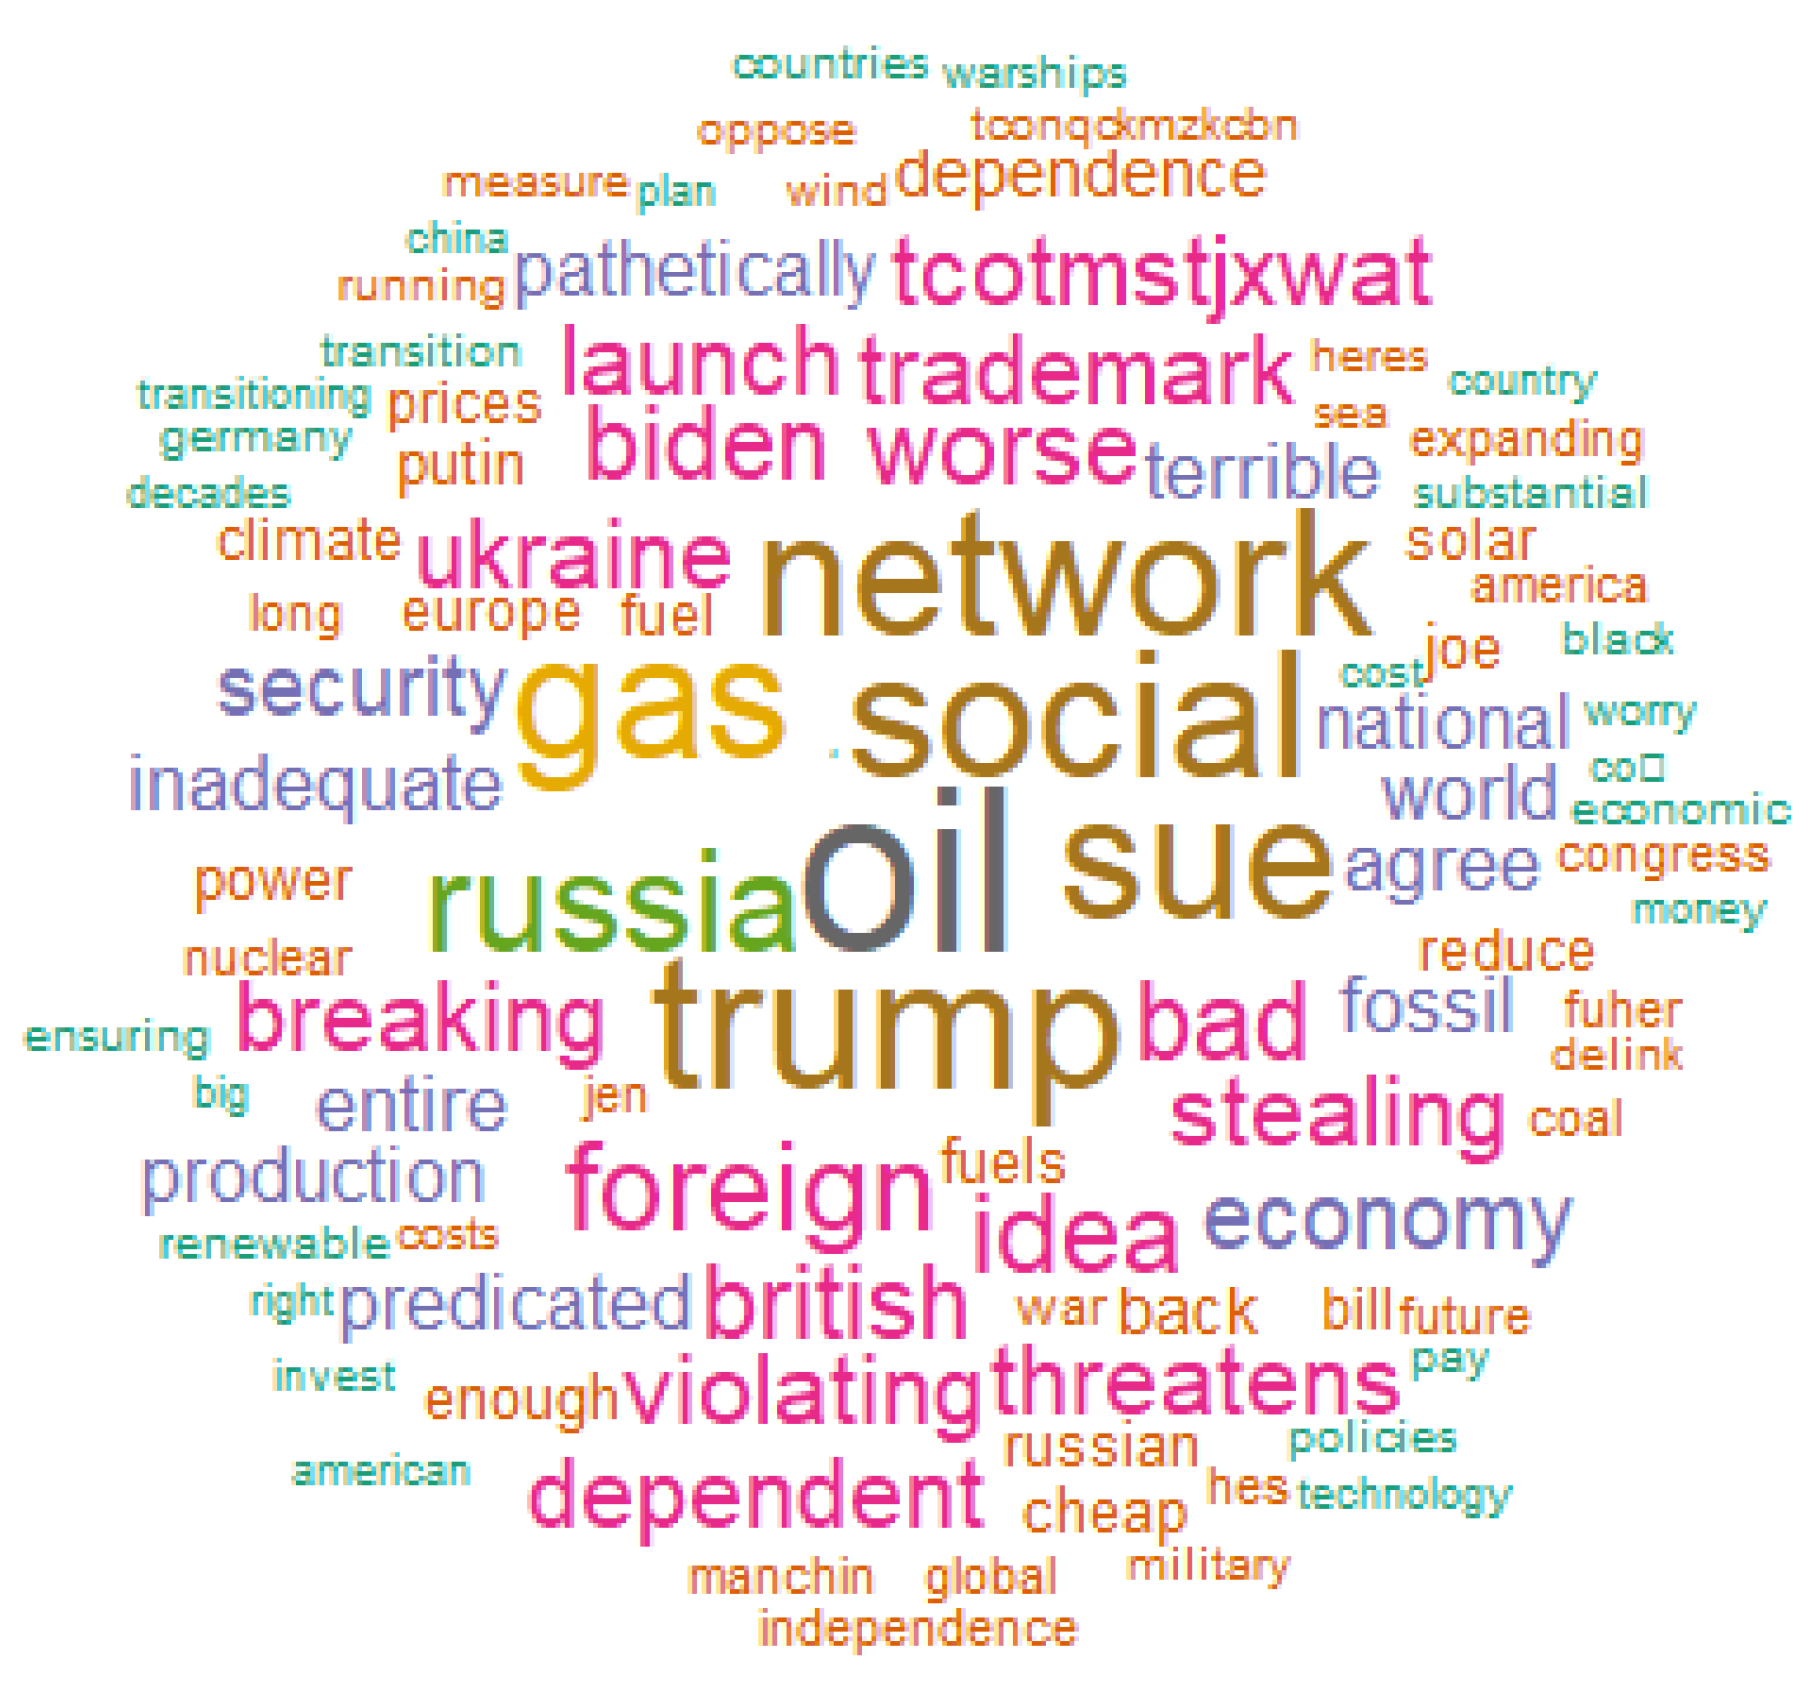
To identify the most notable topics and concepts related to the keyword green energy used in the downloaded tweets, an analysis of the 100 most common words in each period was considered. Figure 4 and Figure 5 show that people talked about green energy and different green energy sources, moving towards green energy in the pre-conflict period, and about sues, threatens, dependency, violating trademark, and terrible idea during the period immediately following the conflict. This reflects how the political discourse was introduced into the green energy debate after the start of the conflict on February 24. It is worth noting that if we look at the energy context, words like solar, climate, nuclear, and renewable, which appeared before the conflict, do not appear after the conflict. These words are replaced by oil, demand, grid, social, Trump, and Russia. The only word related to the energy sector that continued to appear was gas. Note the appearance of other words such as Ukraine, Biden, bad, and violating.
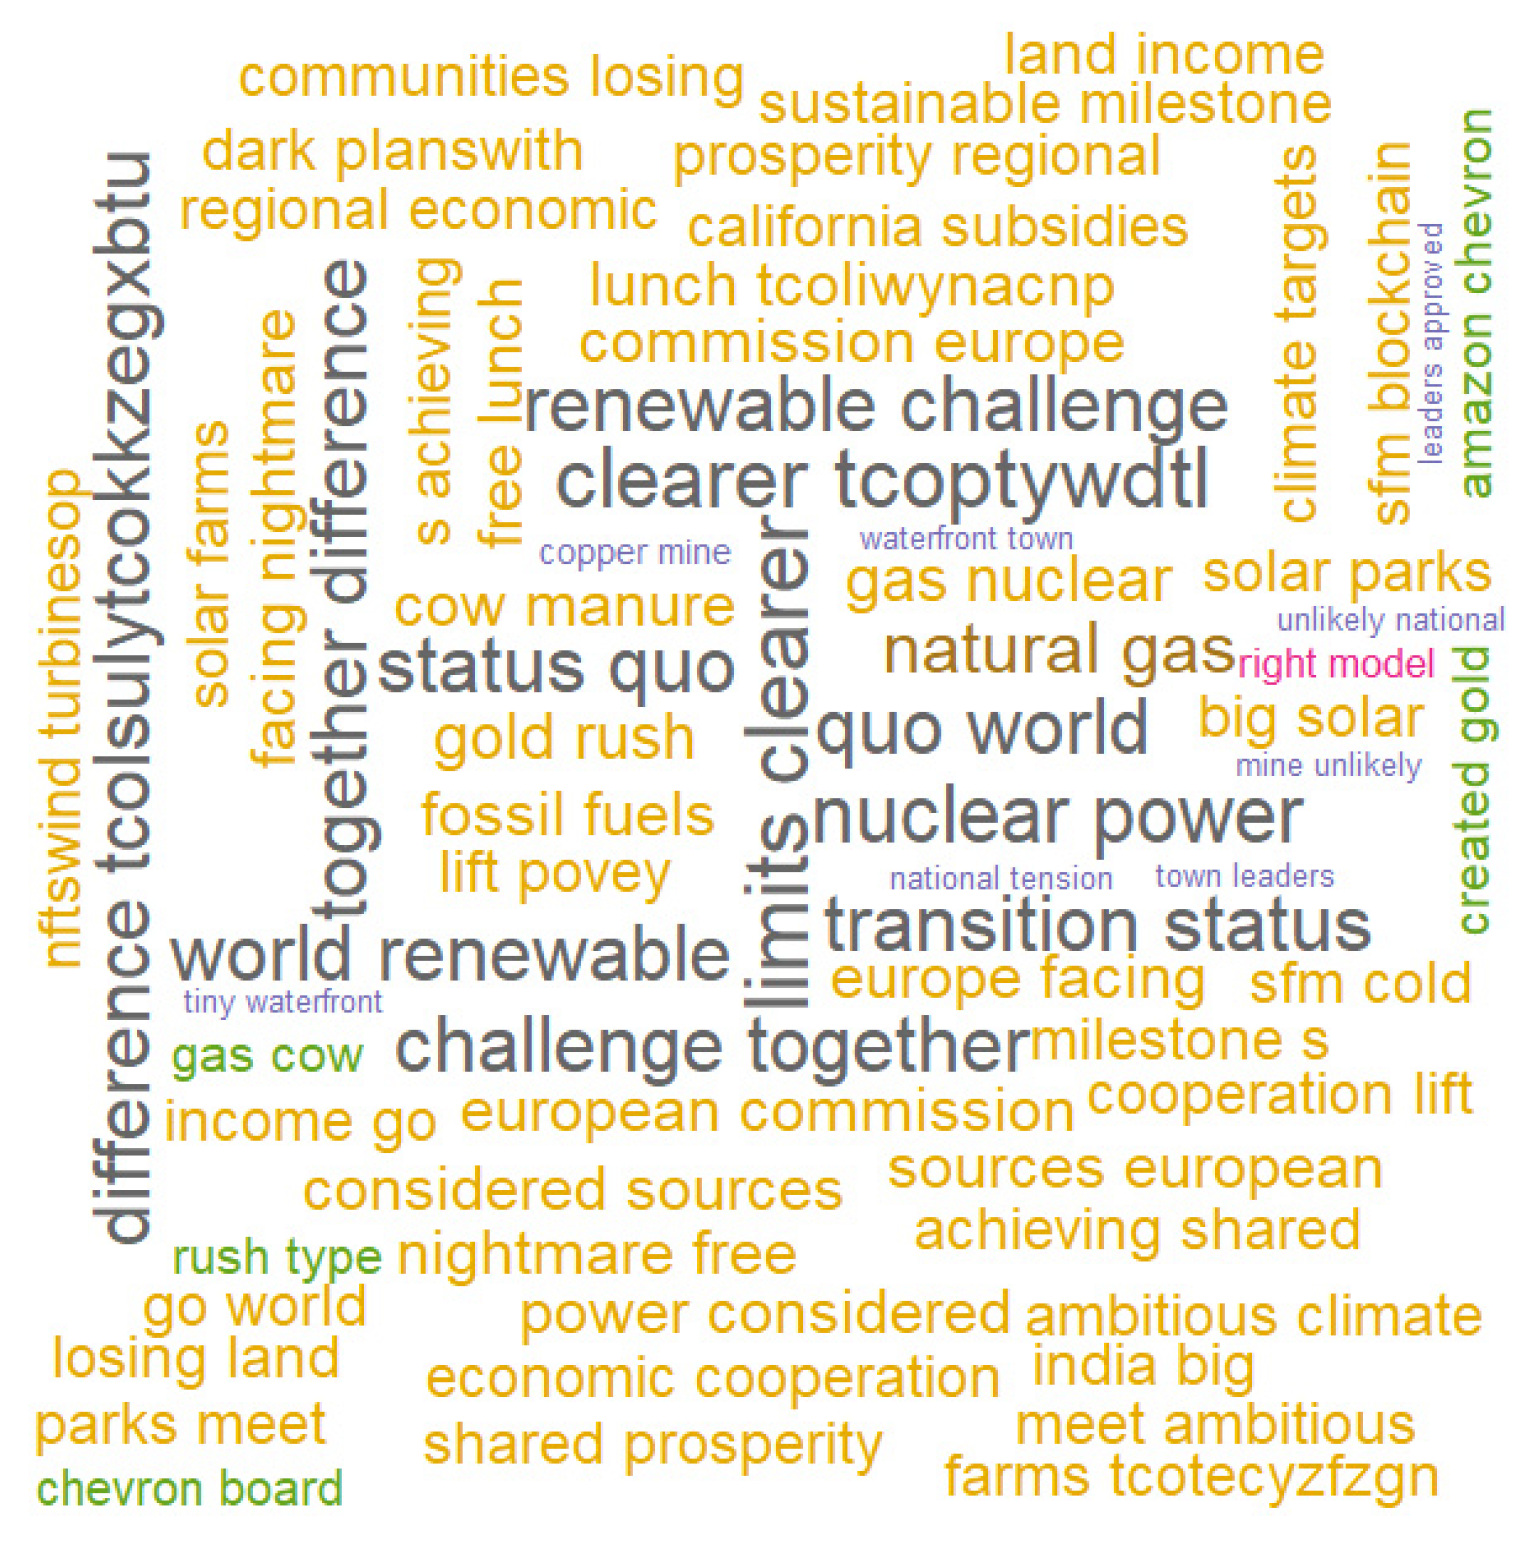
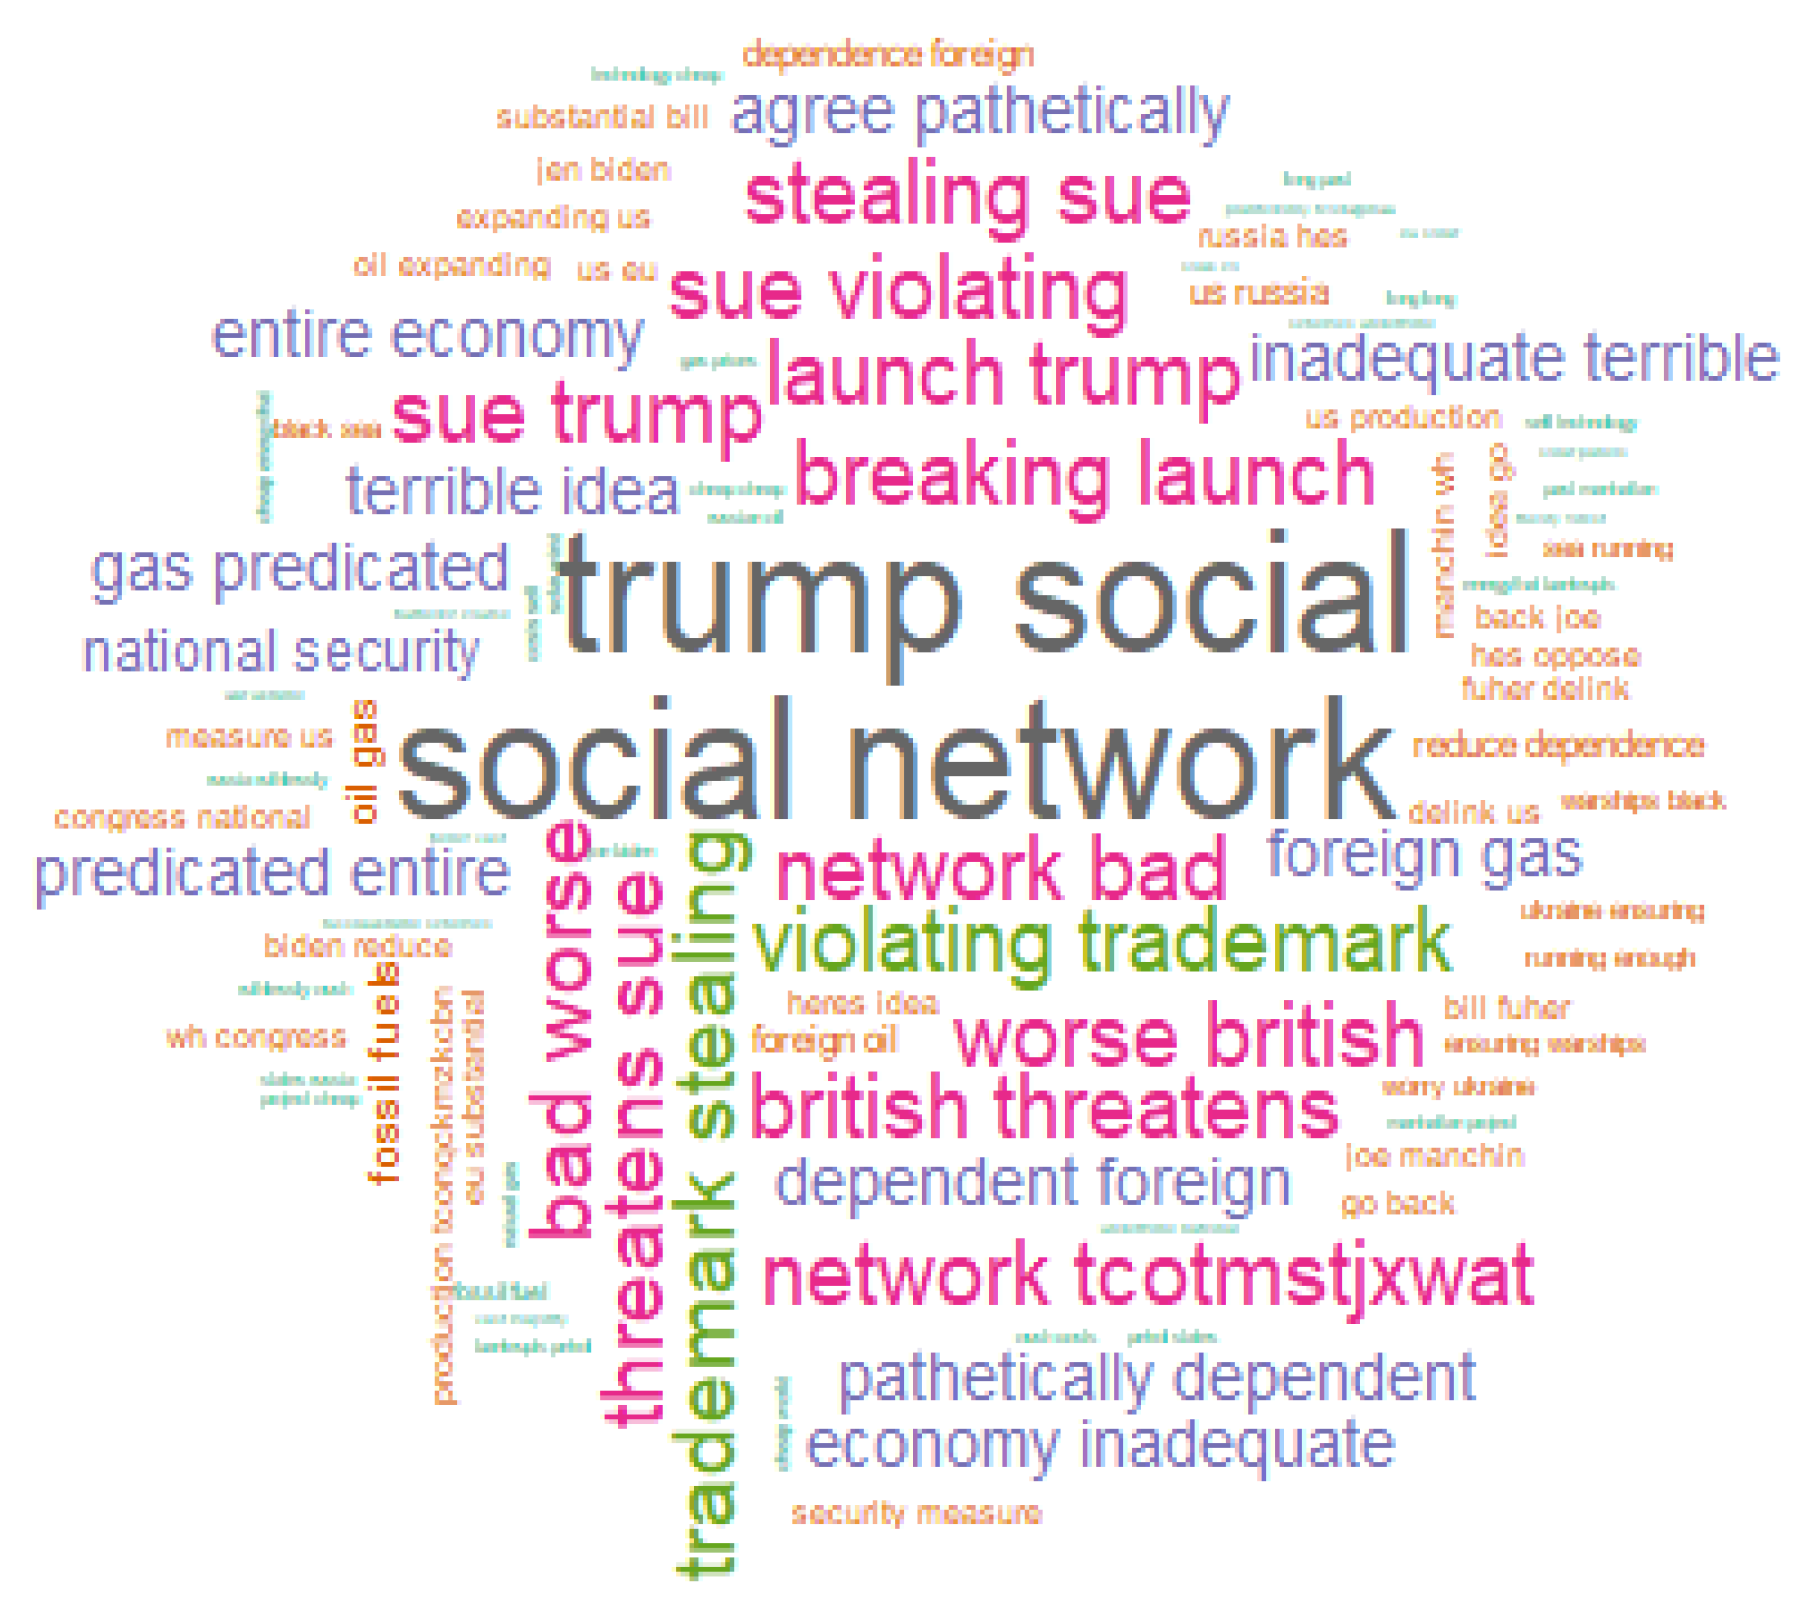
Looking at the 100 most common word bigrams, this change in the content of social discourse could also be observed. Before 22 February (see Figure 6), the discourse focused on issues directly related to energy with bigrams such as world renewable, transition status, renewable challenge, and others in a similar sense. After 22 February (see Figure 7), the 2022 Ukrainian–Russo conflict crept into the discourse and it became more economic and political, showing the concern of society for the reality that was being experienced. Thus, bigrams such as social network, Trump social, bad, worse, threatens sue, stealing sue, violating trademark, and terrible idea appear in the debate. There are also other bigrams reflecting how the 2022 Ukrainian–Russo conflict has posed a threat to international agreements and Russia’s energy dependence as pathetically dependent, economy inadequate, or dependent foreign. None of the most repeated bigrams no longer referred to purely energy issues or were directly related to green or renewable energy. This shows how the mood of the population concerned about green energy changed in relation to the outbreak of the conflict.
5.2. Sentiment and Emotion Analysis
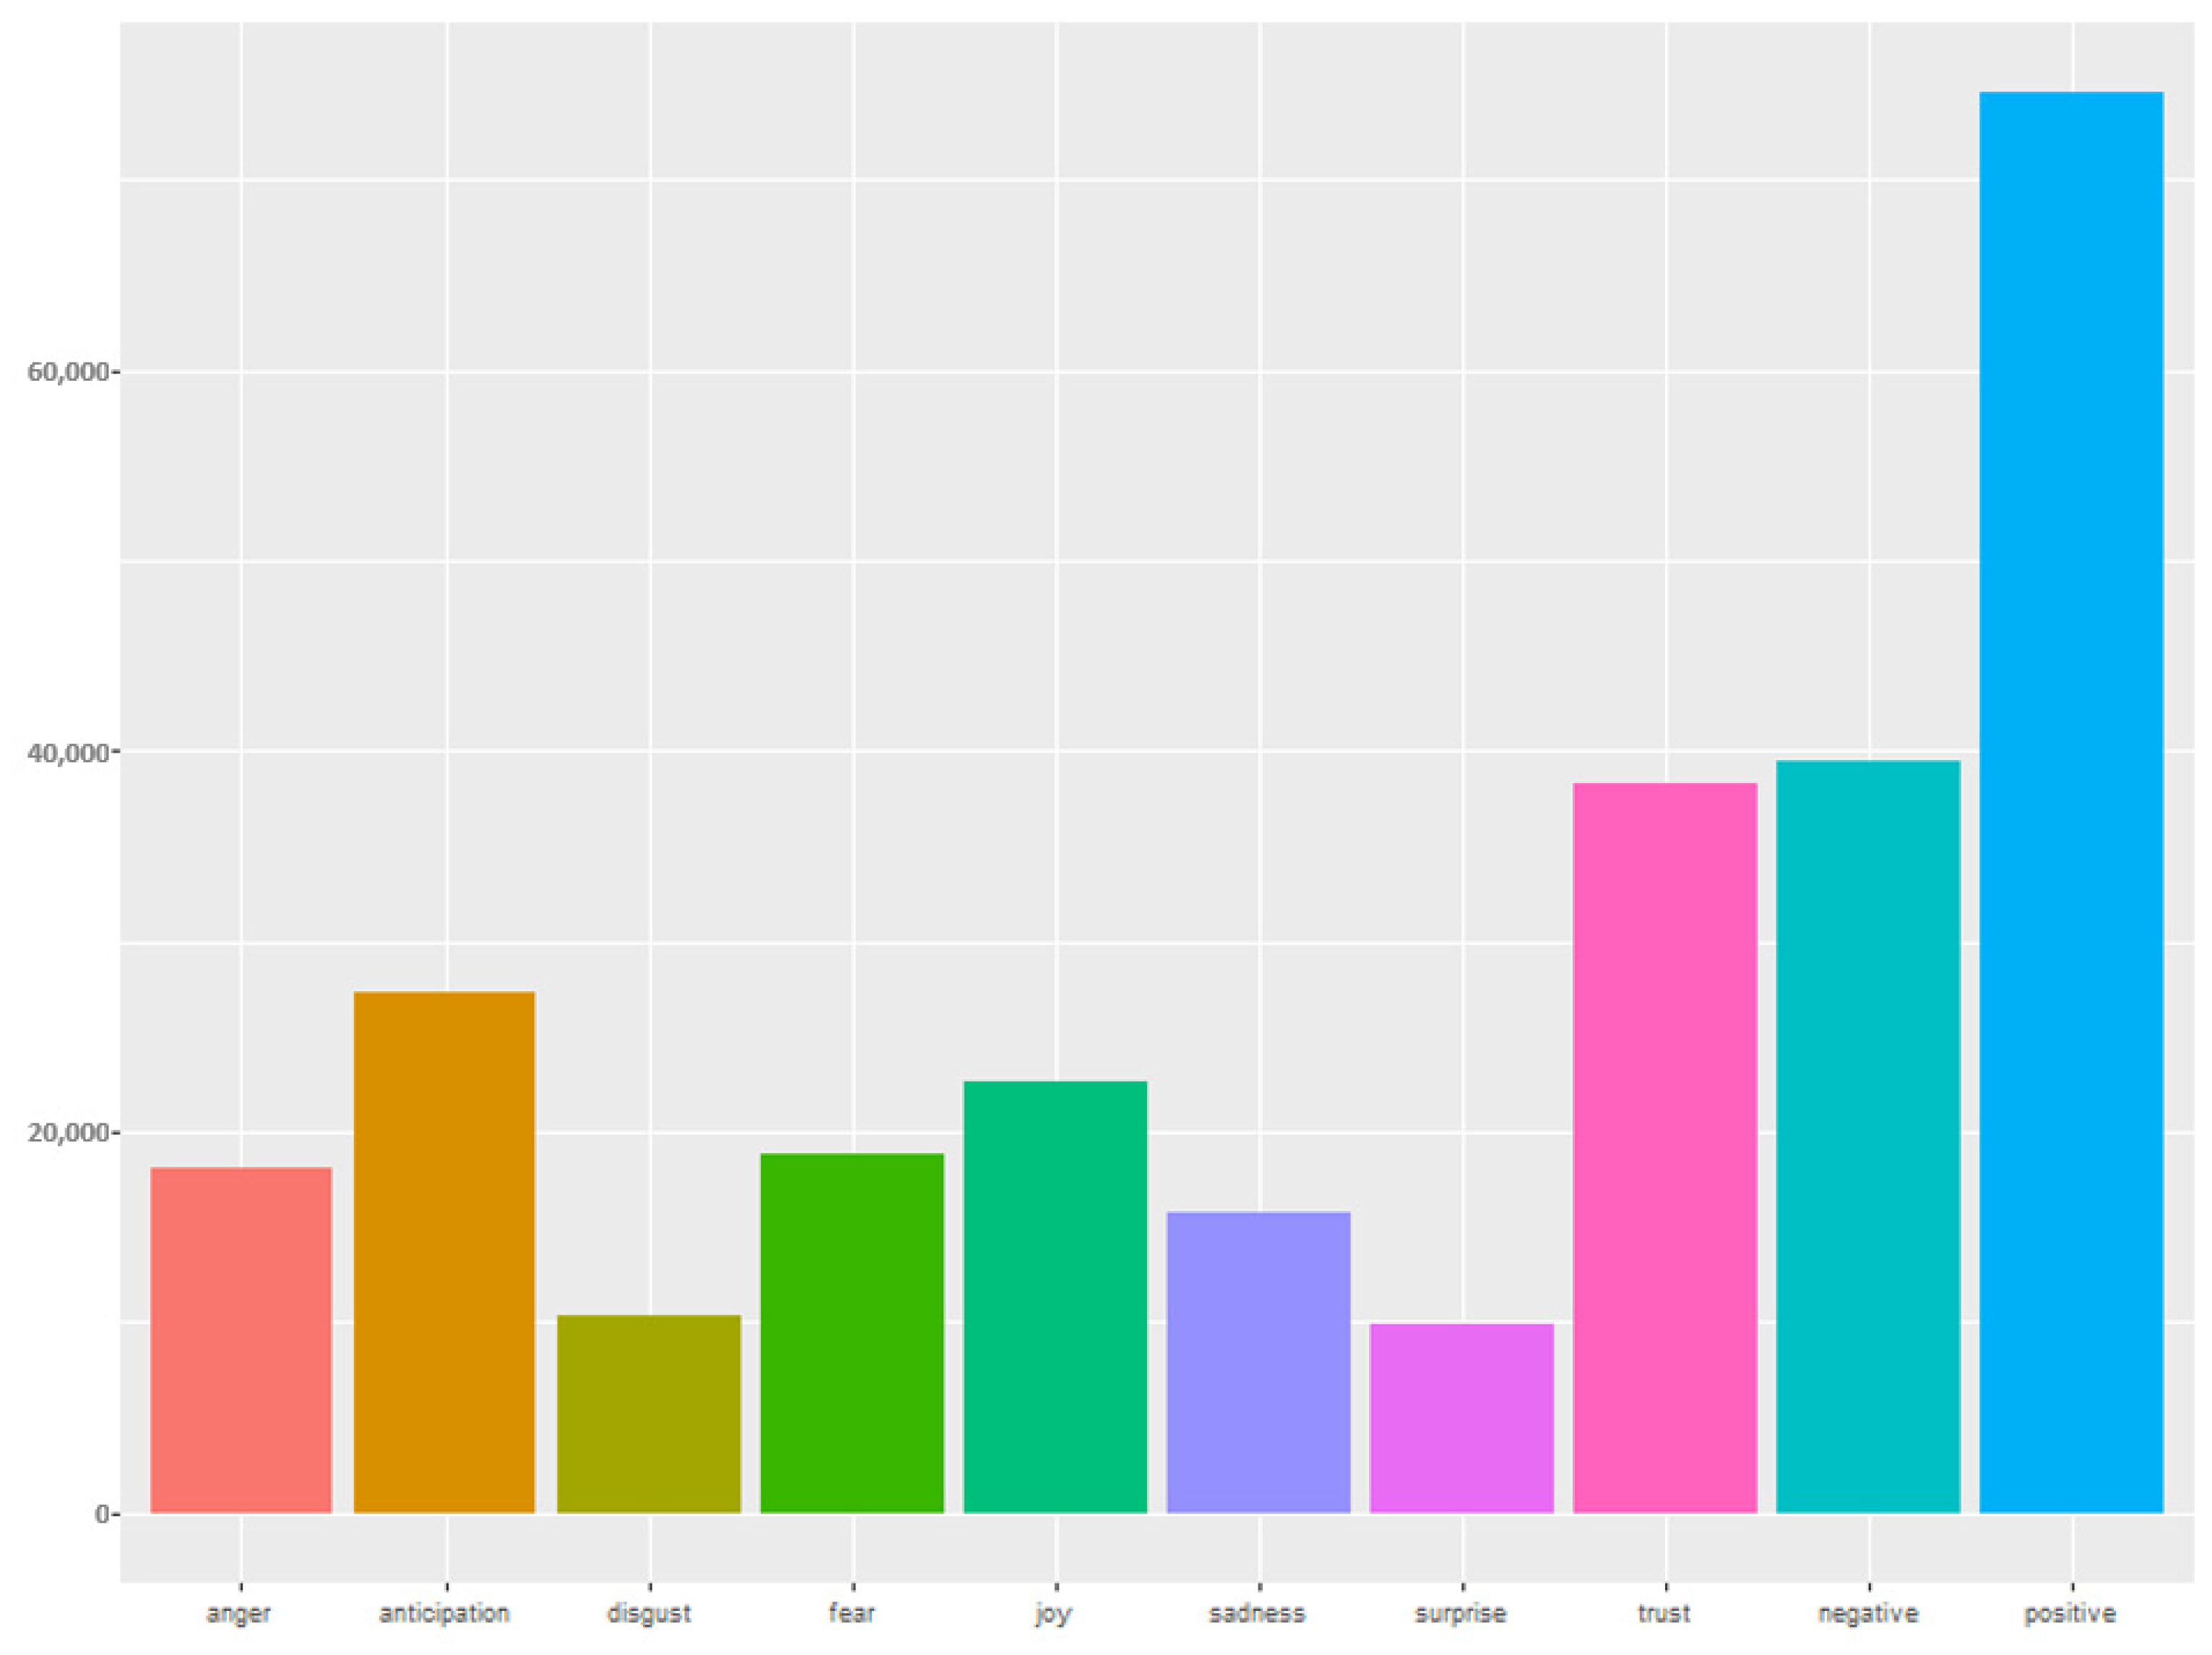
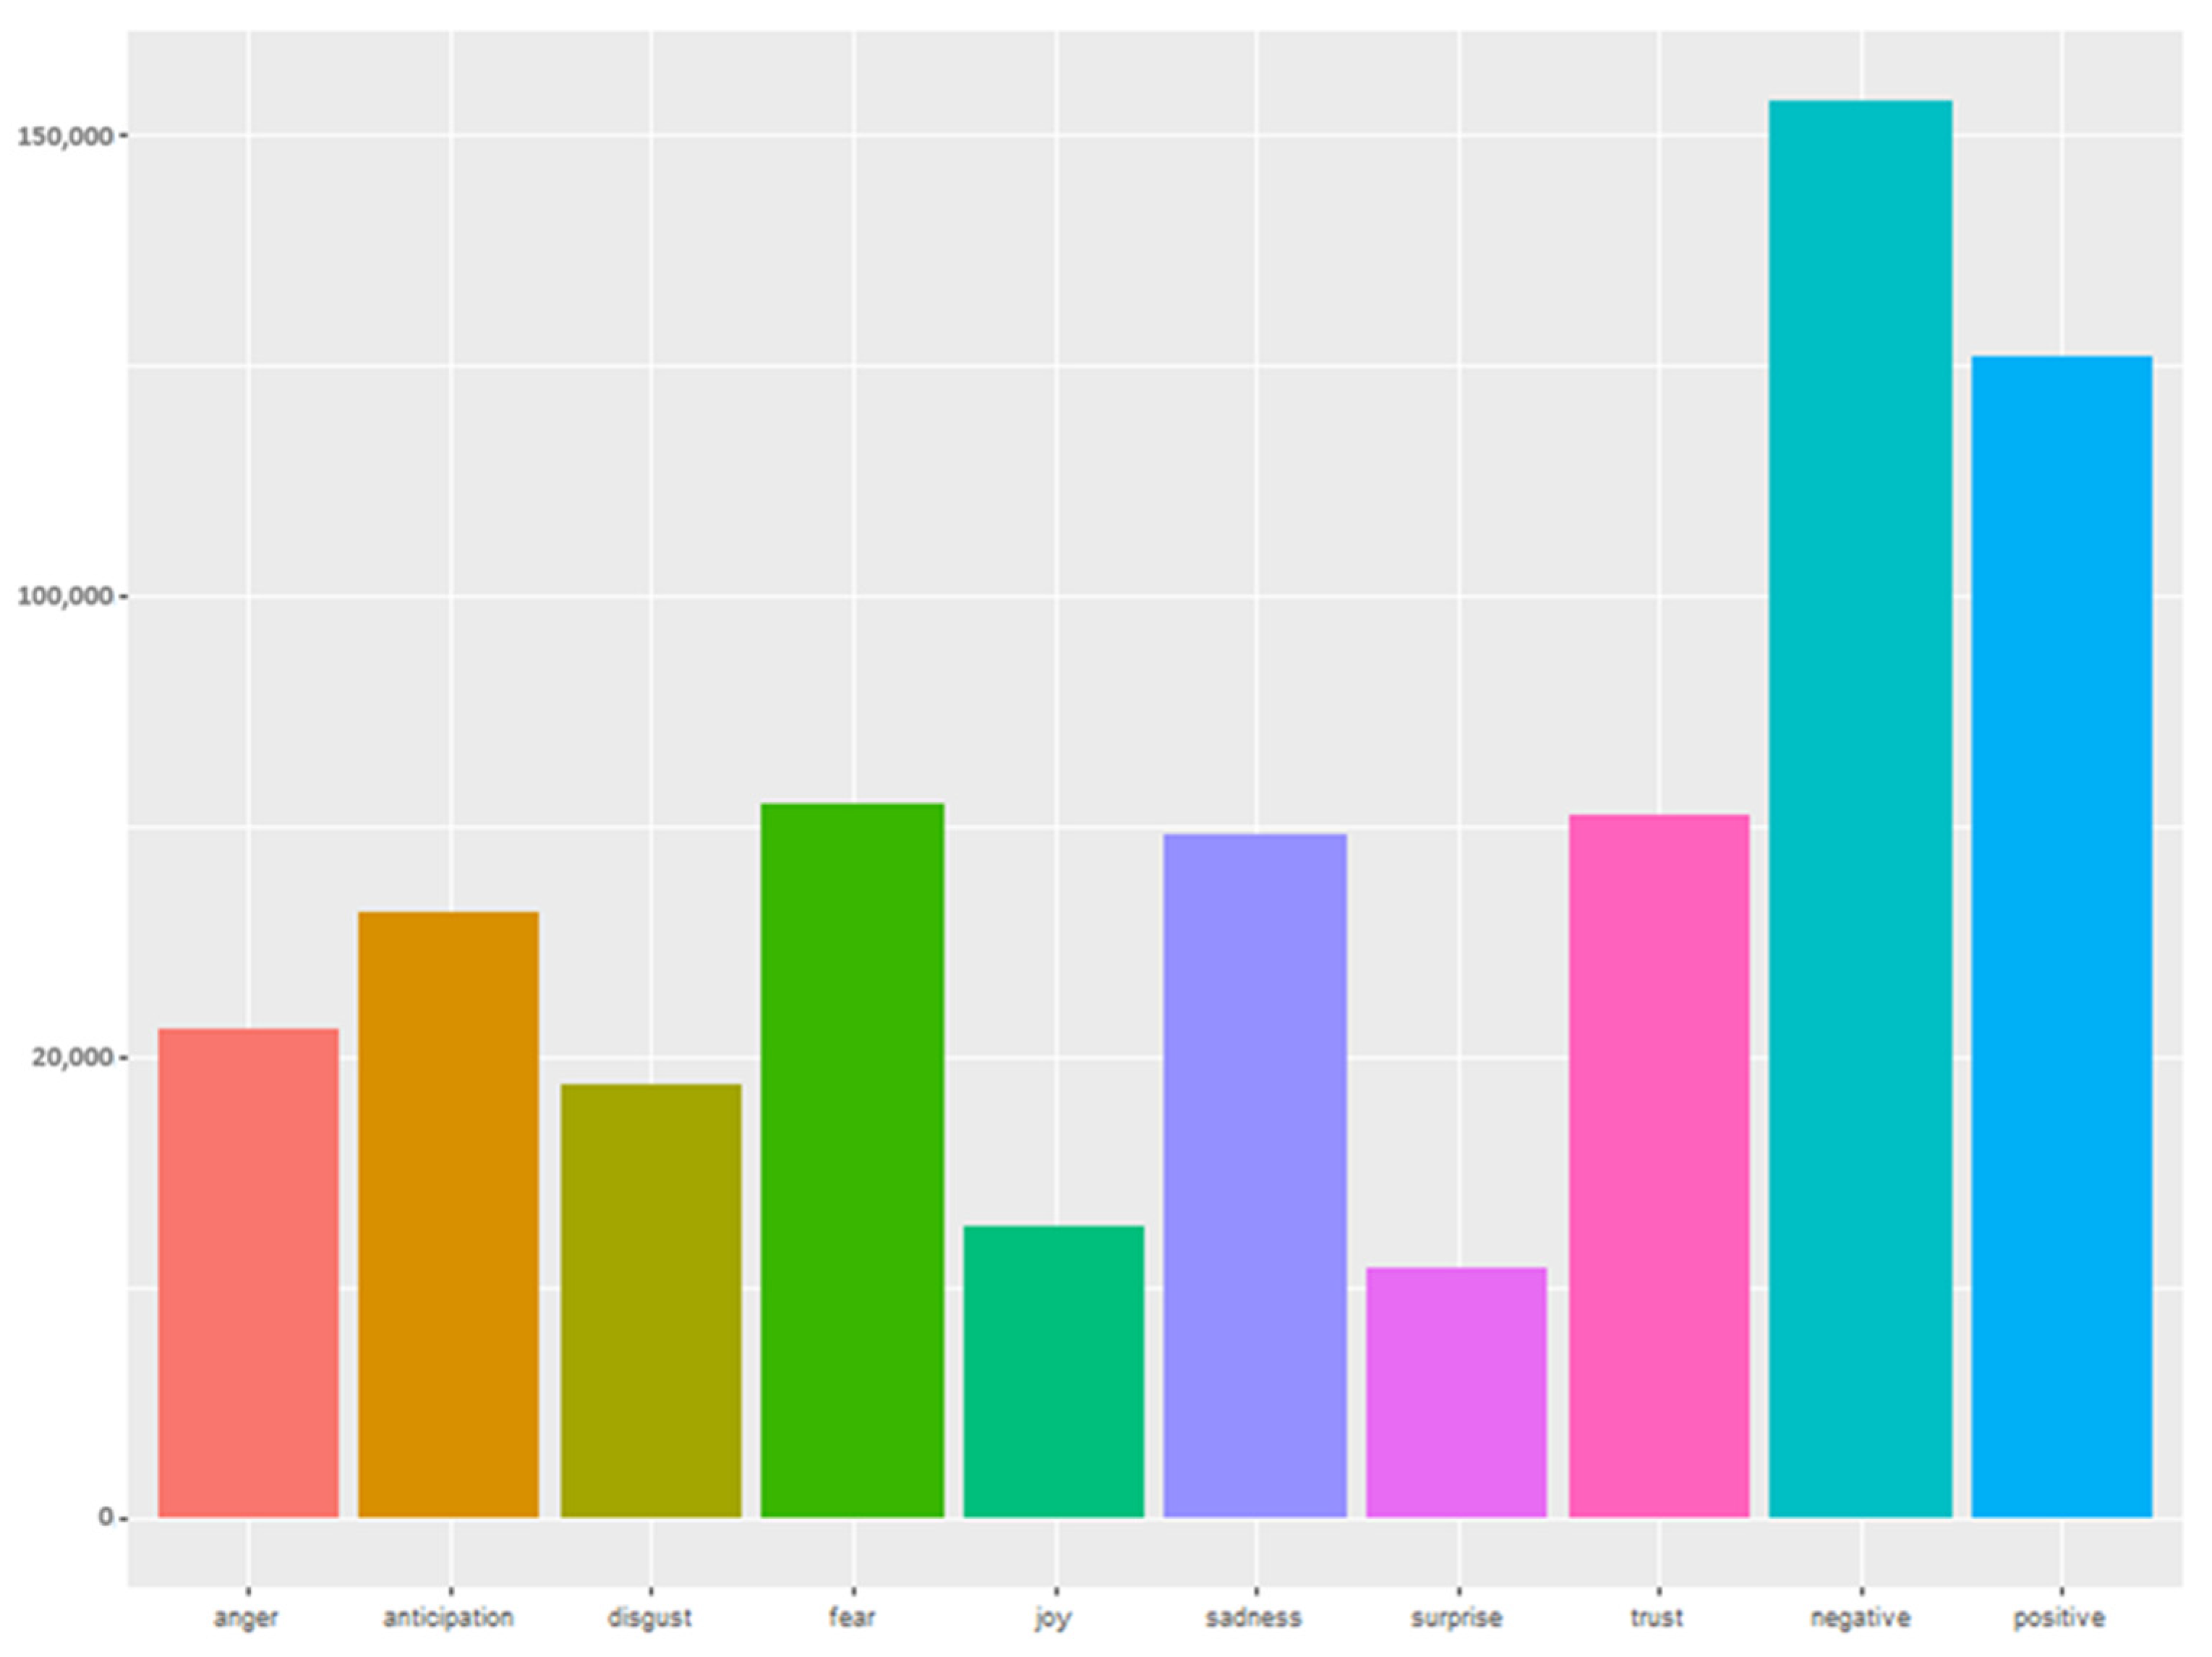
The green energy debate is sensitive to the emotional state of the person tweeting. This is why an important aspect of the analysis carried out was to study the sentiments and emotions linked to the tweets collected from each tweeter. Table 2 shows summary statistics of the sentiments and emotions for our dataset during the two considered periods. Eight emotions were commonly found in a sentence: anger, anticipation, disgust, fear, joy, sadness, surprise, and trust. When analyzing these emotions related to the sentiments, we can see how the emotions related to negative feelings increased during the conflict period, and of particular relevance is the increase in the emotions of disgust, sadness, and fear.
If we focus on the sentiment analysis extracted from the analyzed tweets, a change can be observed in both periods (see Figure 8 and Figure 9). In the first period, the number of positive words was 84% higher than negative ones. While once the conflict started, the number of negative words was 22% higher than positive ones. As already mentioned, the literature that has analyzed the sentiment of the tweets referring to green and renewable energy has always found positive sentiment. This leads us to believe that the increase in negative sentiment is due to the economic, political, and social uncertainty posed by the 2022 Ukrainian–Russo conflict.
Figure 8 and Figure 9 show how all negative emotions increased from period 1 to period 2. In period 2 of the social listening, the number of words related to disgust, fear, and sadness more than doubled compared to period 1. Anger increased by approximately 33%. At the same time, the number of words related to positive emotions practically remained the same except for those related to joy, which decreased significantly. The results obtained for period 1 are consistent with those obtained in other research on sentiment analysis for green energy, renewable energy, or climate change. The appearance of the Ukrainian–Russo conflict in the global panorama has presented an important turn in the debate on green energy [22].
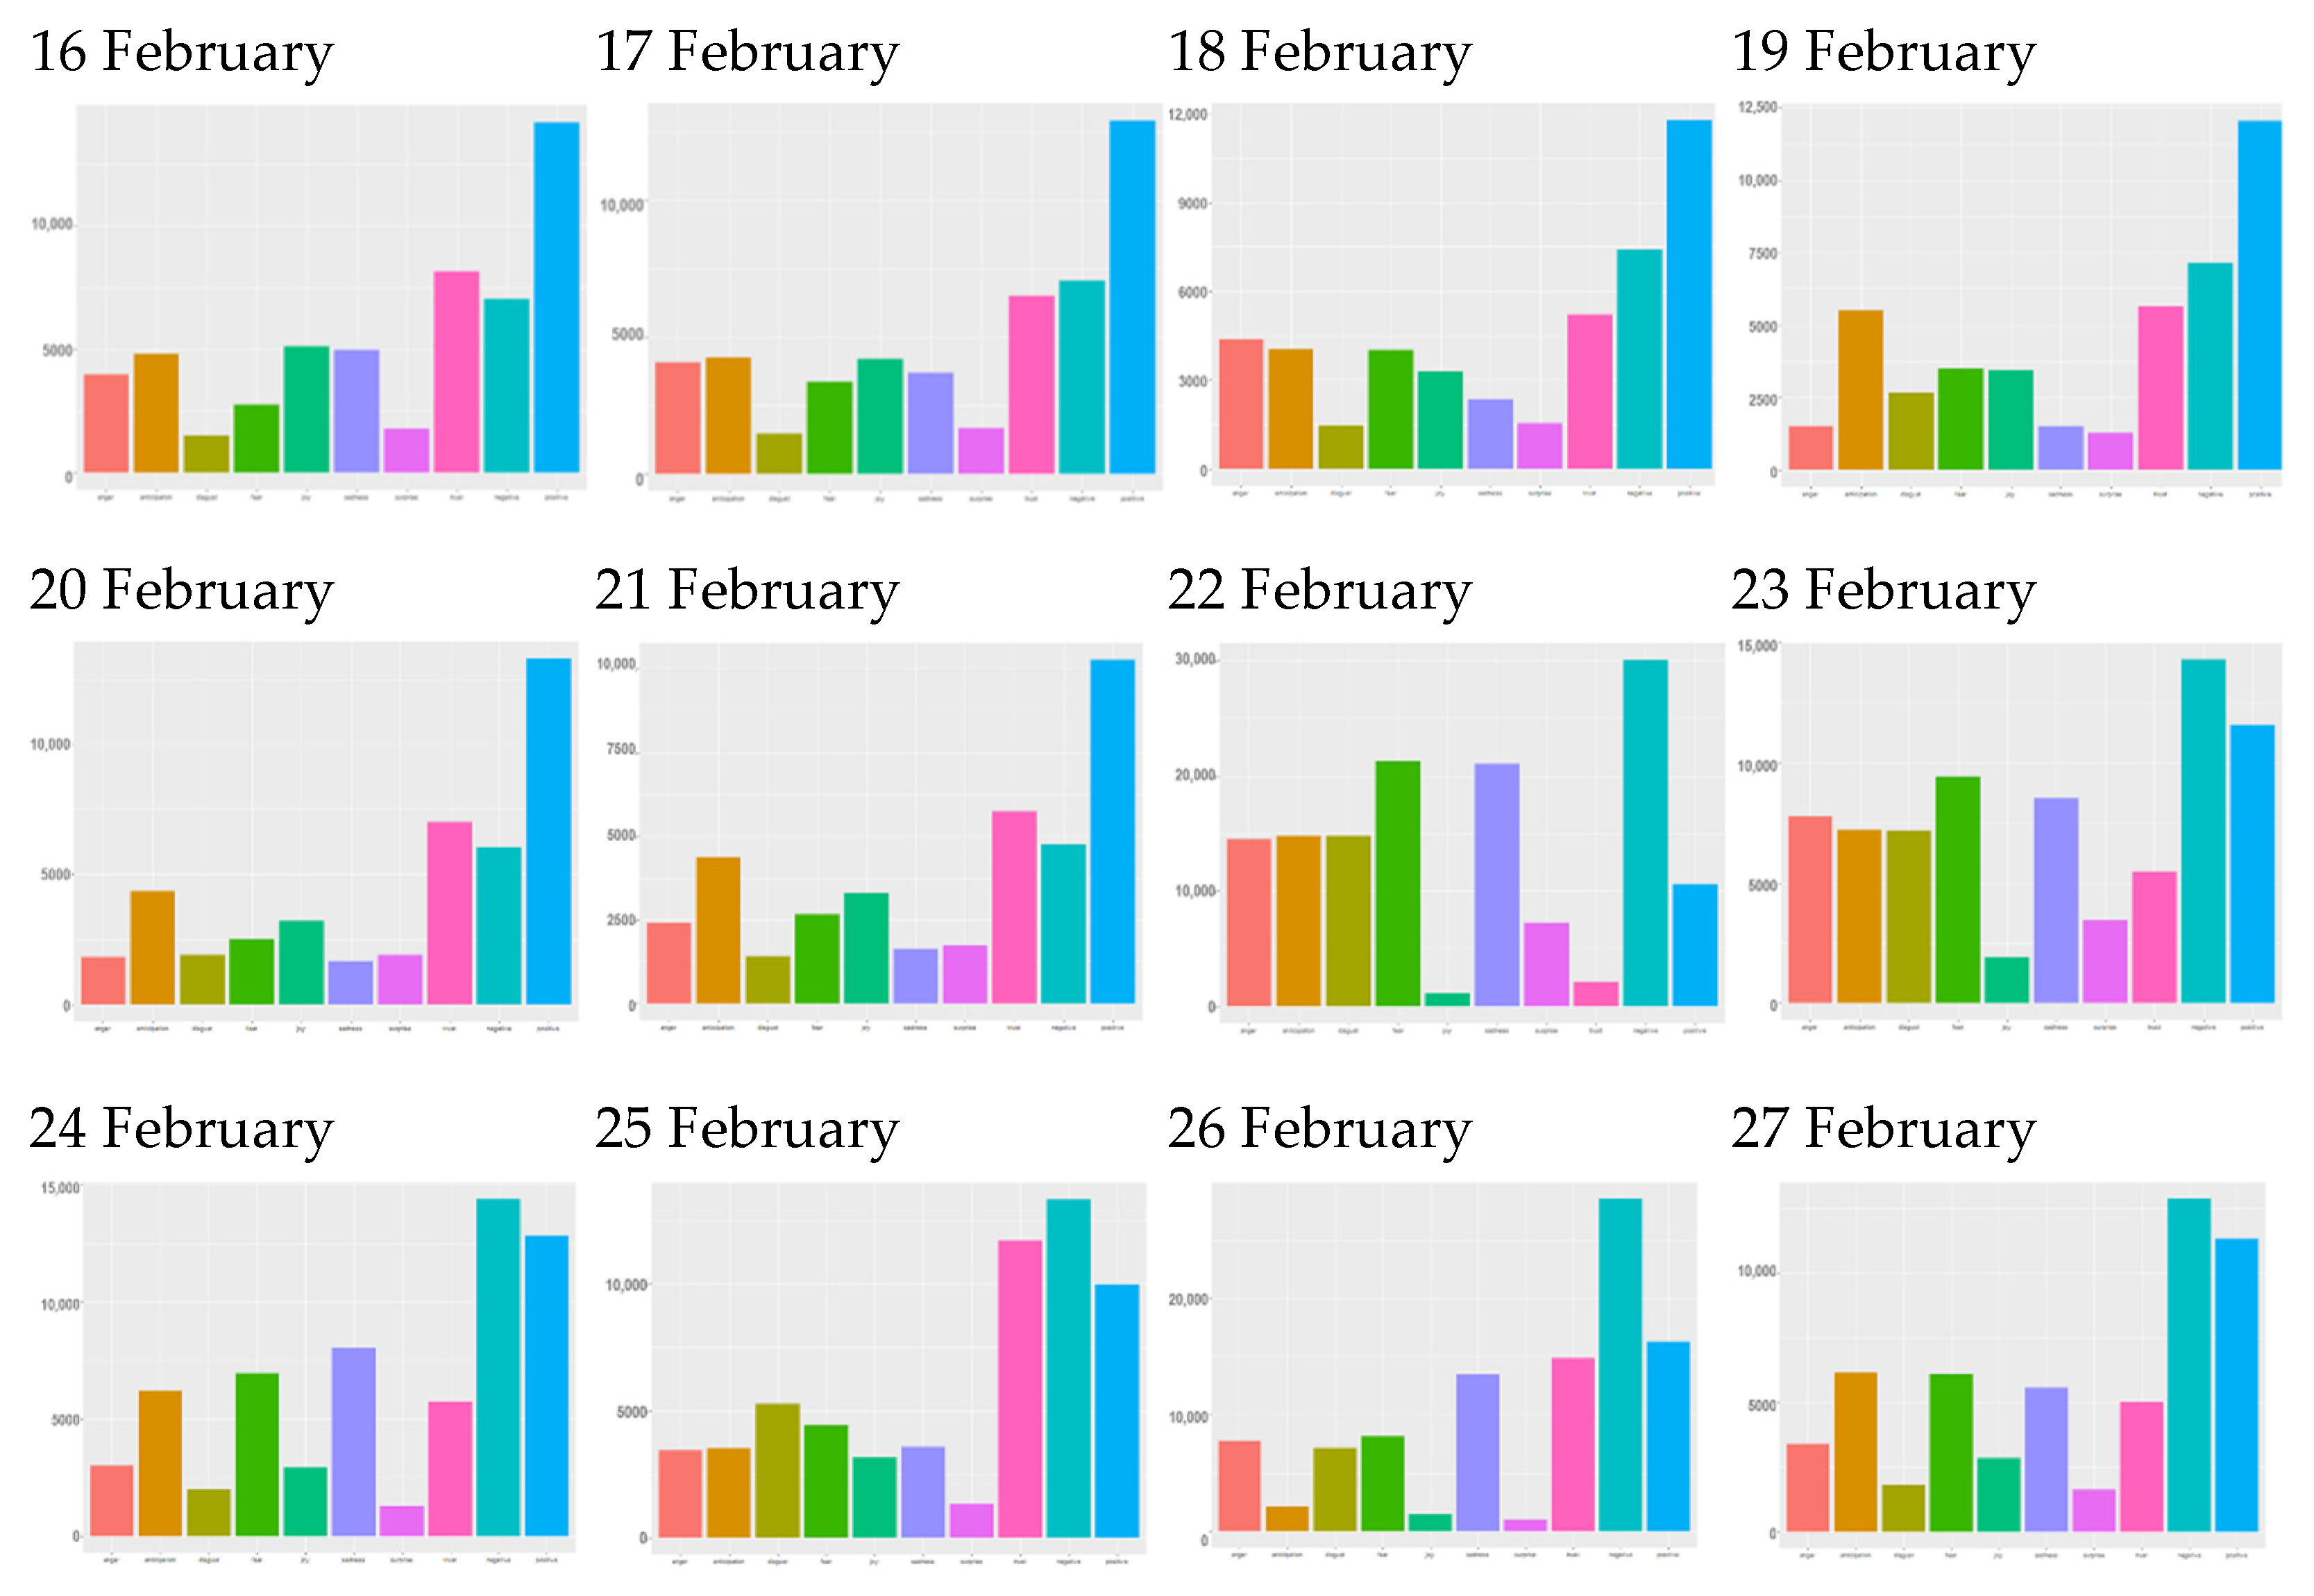
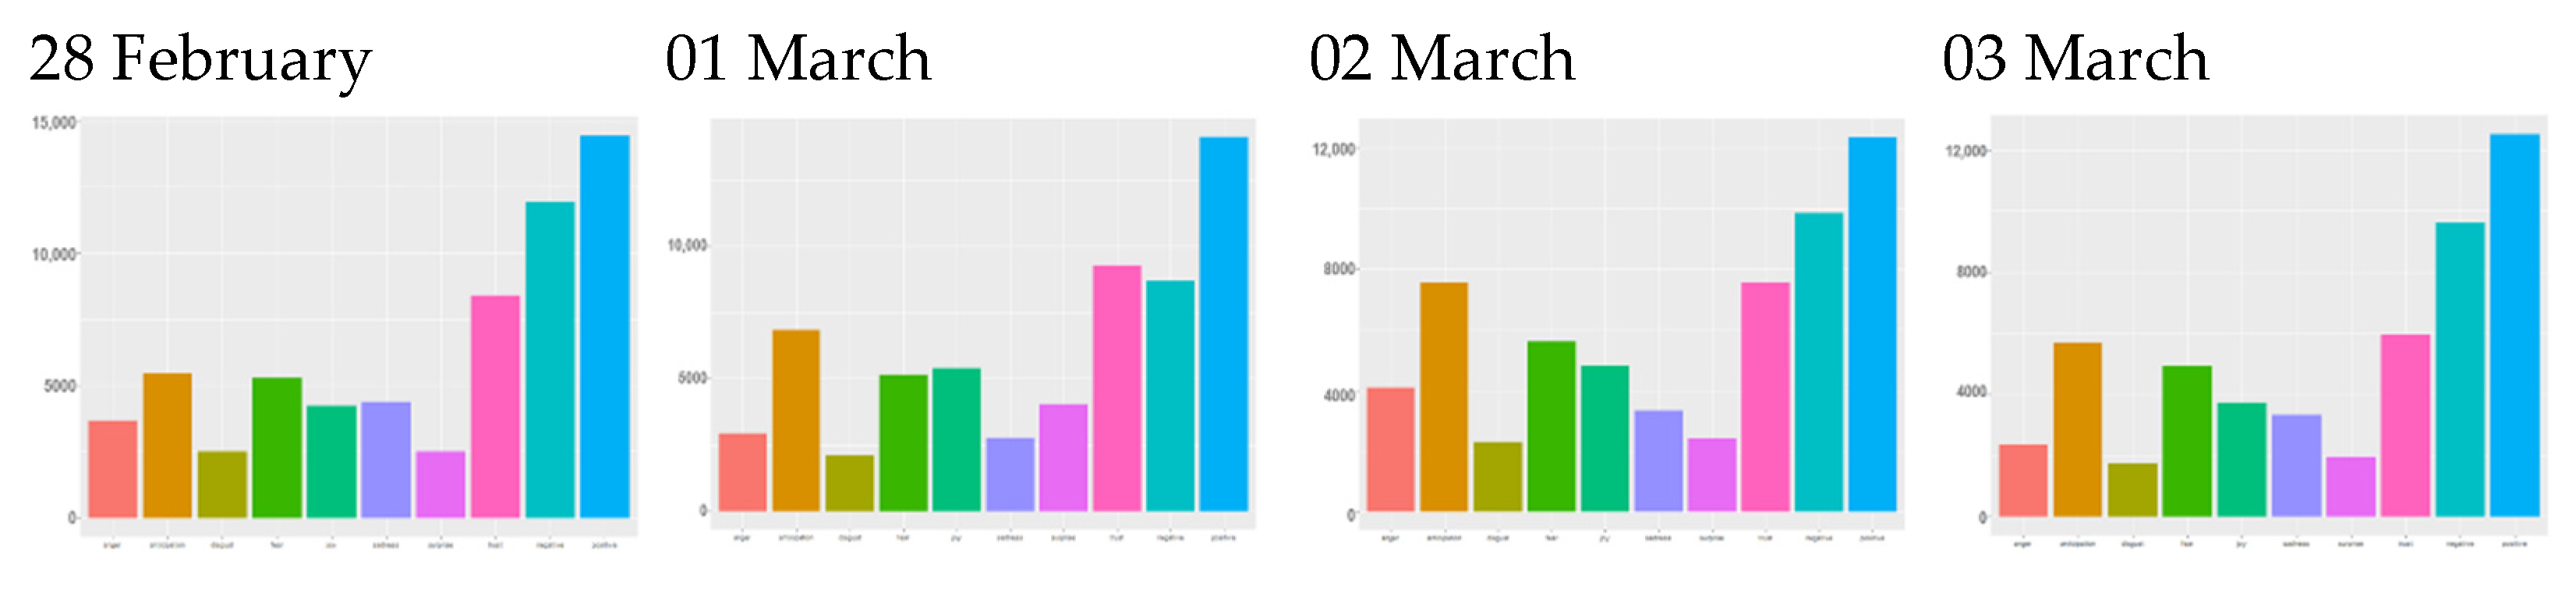
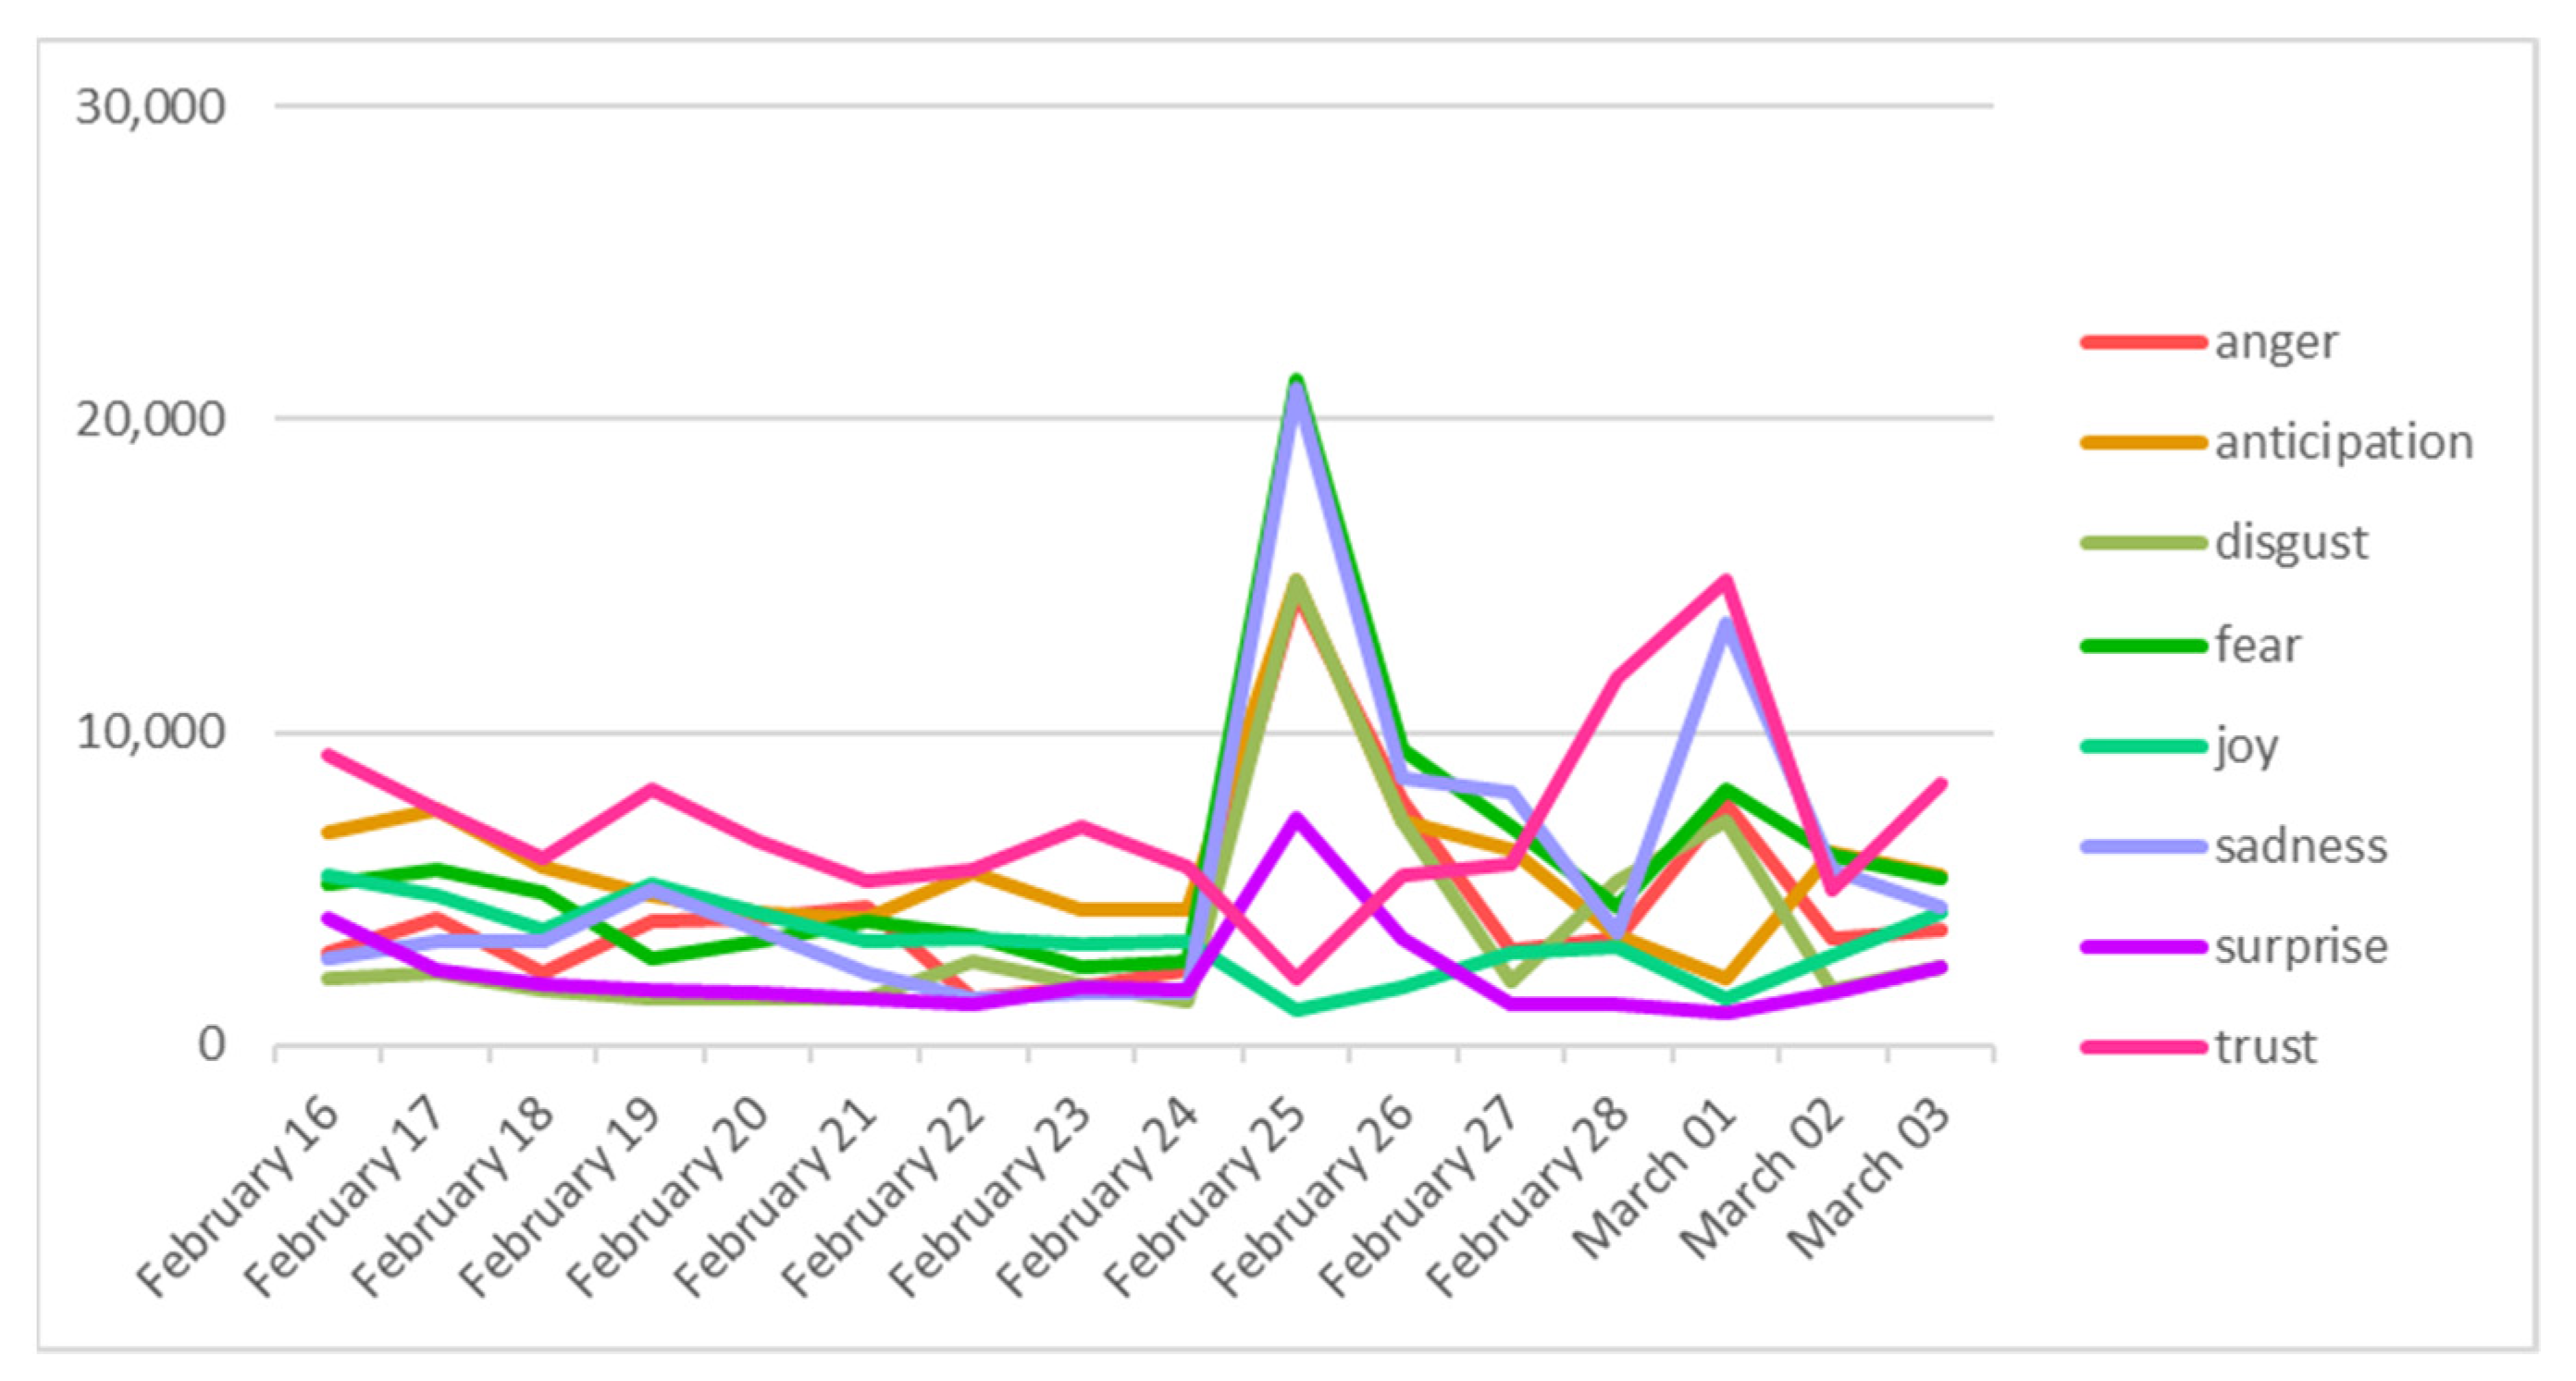
Figure 10 displays a daily sentiment analysis with samples of 10,000 tweets per day. No differences in sentiments or emotions were observed on all days of period 1. On 22 February there was a very significant change in the trend as negative sentiments were nearly triple the positive ones. From 22 February until 27 February, negative sentiments continued to be higher than positive ones, remaining at very high levels until the end of period 2. This change also affected the emotions most related to negative sentiments, such as anger, disgust, fear, and sadness. Regarding the emotions related to the positive sentiments, the decrease in joy stands out.
When we analyze the sentiments that our Twitter search returned, we can see the impact of the actual Ukrainian–Russo conflict on the sentiment of the global population concerned about green energy. The first thing we notice is a considerable increase in negative sentiments on 22 February, accompanied by a decrease in trust. Traditionally, sentiment on Twitter toward green or renewable energy has always been positive, and this remained the case until two days before the start of the Ukrainian–Russo conflict. On that day, 22 February, the world woke up to the news that Russia was recognizing the separatist regions of Donbas and had deployed its troops there (Available online: https://elpais.com/internacional/2022-02-23/ucrania-se-prepara-para-los-peores-escenarios-y-refuerza-a-su-ejercito-en-el-donbas.html (accessed on 30 March 2022)). The same day, the Wall Street Journal published an article titled “U.S. Adds Sanctions After Saying Russia Invaded Ukraine”. From that moment on, the whole world considered a conflict in Ukraine a certainty and some European countries, such as Germany, started to sanction Russia, which suspended the NordStream 2 gas pipeline. There was also a significant increase in negative emotions in the tweets that came out on that day: fear, anger, disgust, and sadness. These emotions had been maintaining stable and relatively low levels in the previous days. At the same time, positive feelings such as joy and trust fell sharply.
February 23 could be considered a transition day; positive feelings recovered to their previous levels, but negative feelings did not fall. As for emotions, only a slight increase in trust and joy stands out. This was possibly because even though it was known that a 2022 Ukrainian–Russo conflict would be imminent, it had not yet begun.
On February 24, the conflict began. Negative feelings and sadness were still present in the tweets. The world was in expectation.
From February 25 onwards, bad news began to arrive from Ukraine, and the exodus of Ukrainians to bordering countries began. Among the emotions observed on that day, a significant increase in trust stands out. It should not be forgotten that we are analyzing the social listening on green energy. The conflict highlighted the issue of energy dependence, especially from Europe but also from other parts of the world, on a country like Russia, which the political elites say they “cannot trust”. This makes it necessary to look for other sources of energy and to move towards cleaner, renewable, and more efficient energies, which is why trust values were so high. These high trust values may also be driven by the U.S. Department of Energy’s (DOE) announcement of a comprehensive strategy to secure the U.S. clean energy supply chain (Available online: https://www.energy.gov/articles/doe-releases-first-ever-comprehensive-strategy-secure-americas-clean-energy-supply-chain (accessed on 30 March 2022)).
On 28 February, there was a trend change in tweet sentiments; this day was the first one in which positive sentiments once again outweighed negative ones, albeit slightly. On that day, the European Commission announced measures to combat the energy crisis and the UN Panel anticipated that the effects of climate change may be more severe than expected (Impacts of Climate Change Now Severe and Widespread, U.N. Panel Says). All this led to the need to rethink world energy policy and gave hope for a shift toward the increased use of clean and renewable energies. This motivated the emotions of trust and anticipation to remain at high levels without reducing, for example, the emotion of fear.
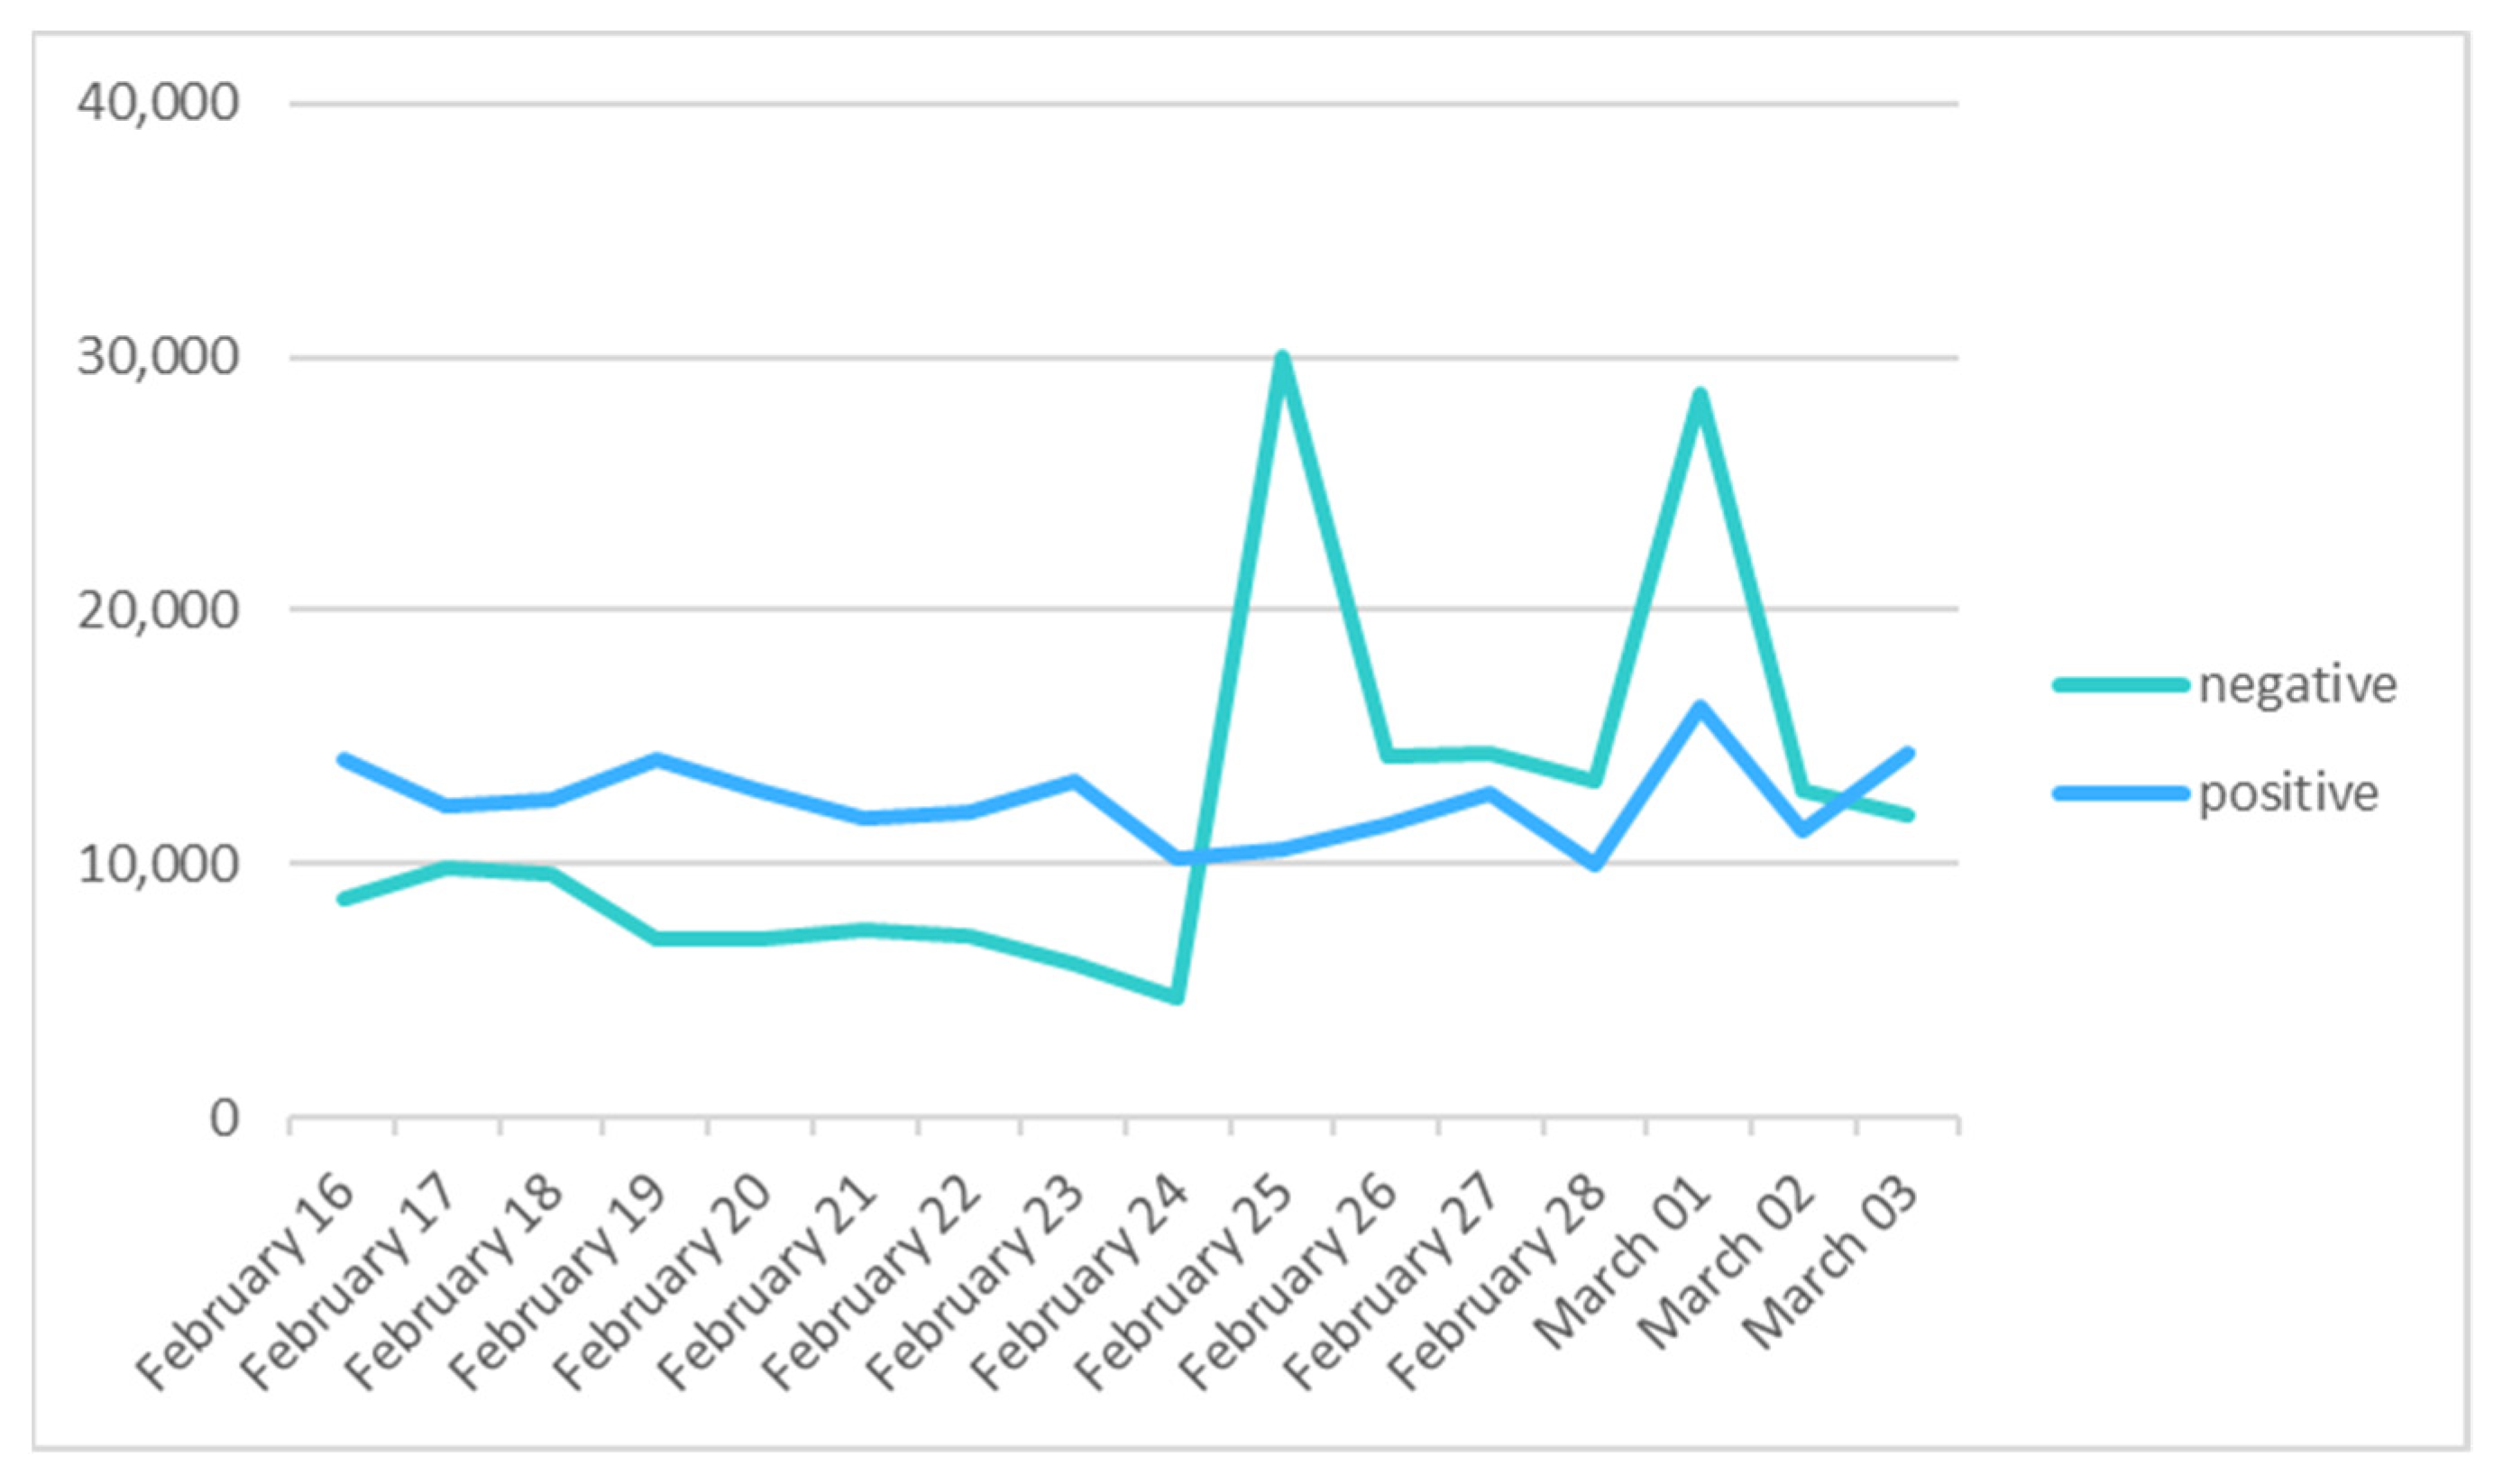
During the period of conflict onset, we observe very volatile behavior in the sentiments and emotions revealed in our social listening (see Figure 11 and Figure 12). Once the outbreak of the conflict has passed, sentiments and emotions seem to recover their usual levels, with the level of negative sentiments remaining slightly elevated. This reveals that this highly volatile behavior is conjunctural with the 2022 Ukrainian–Russo conflict.
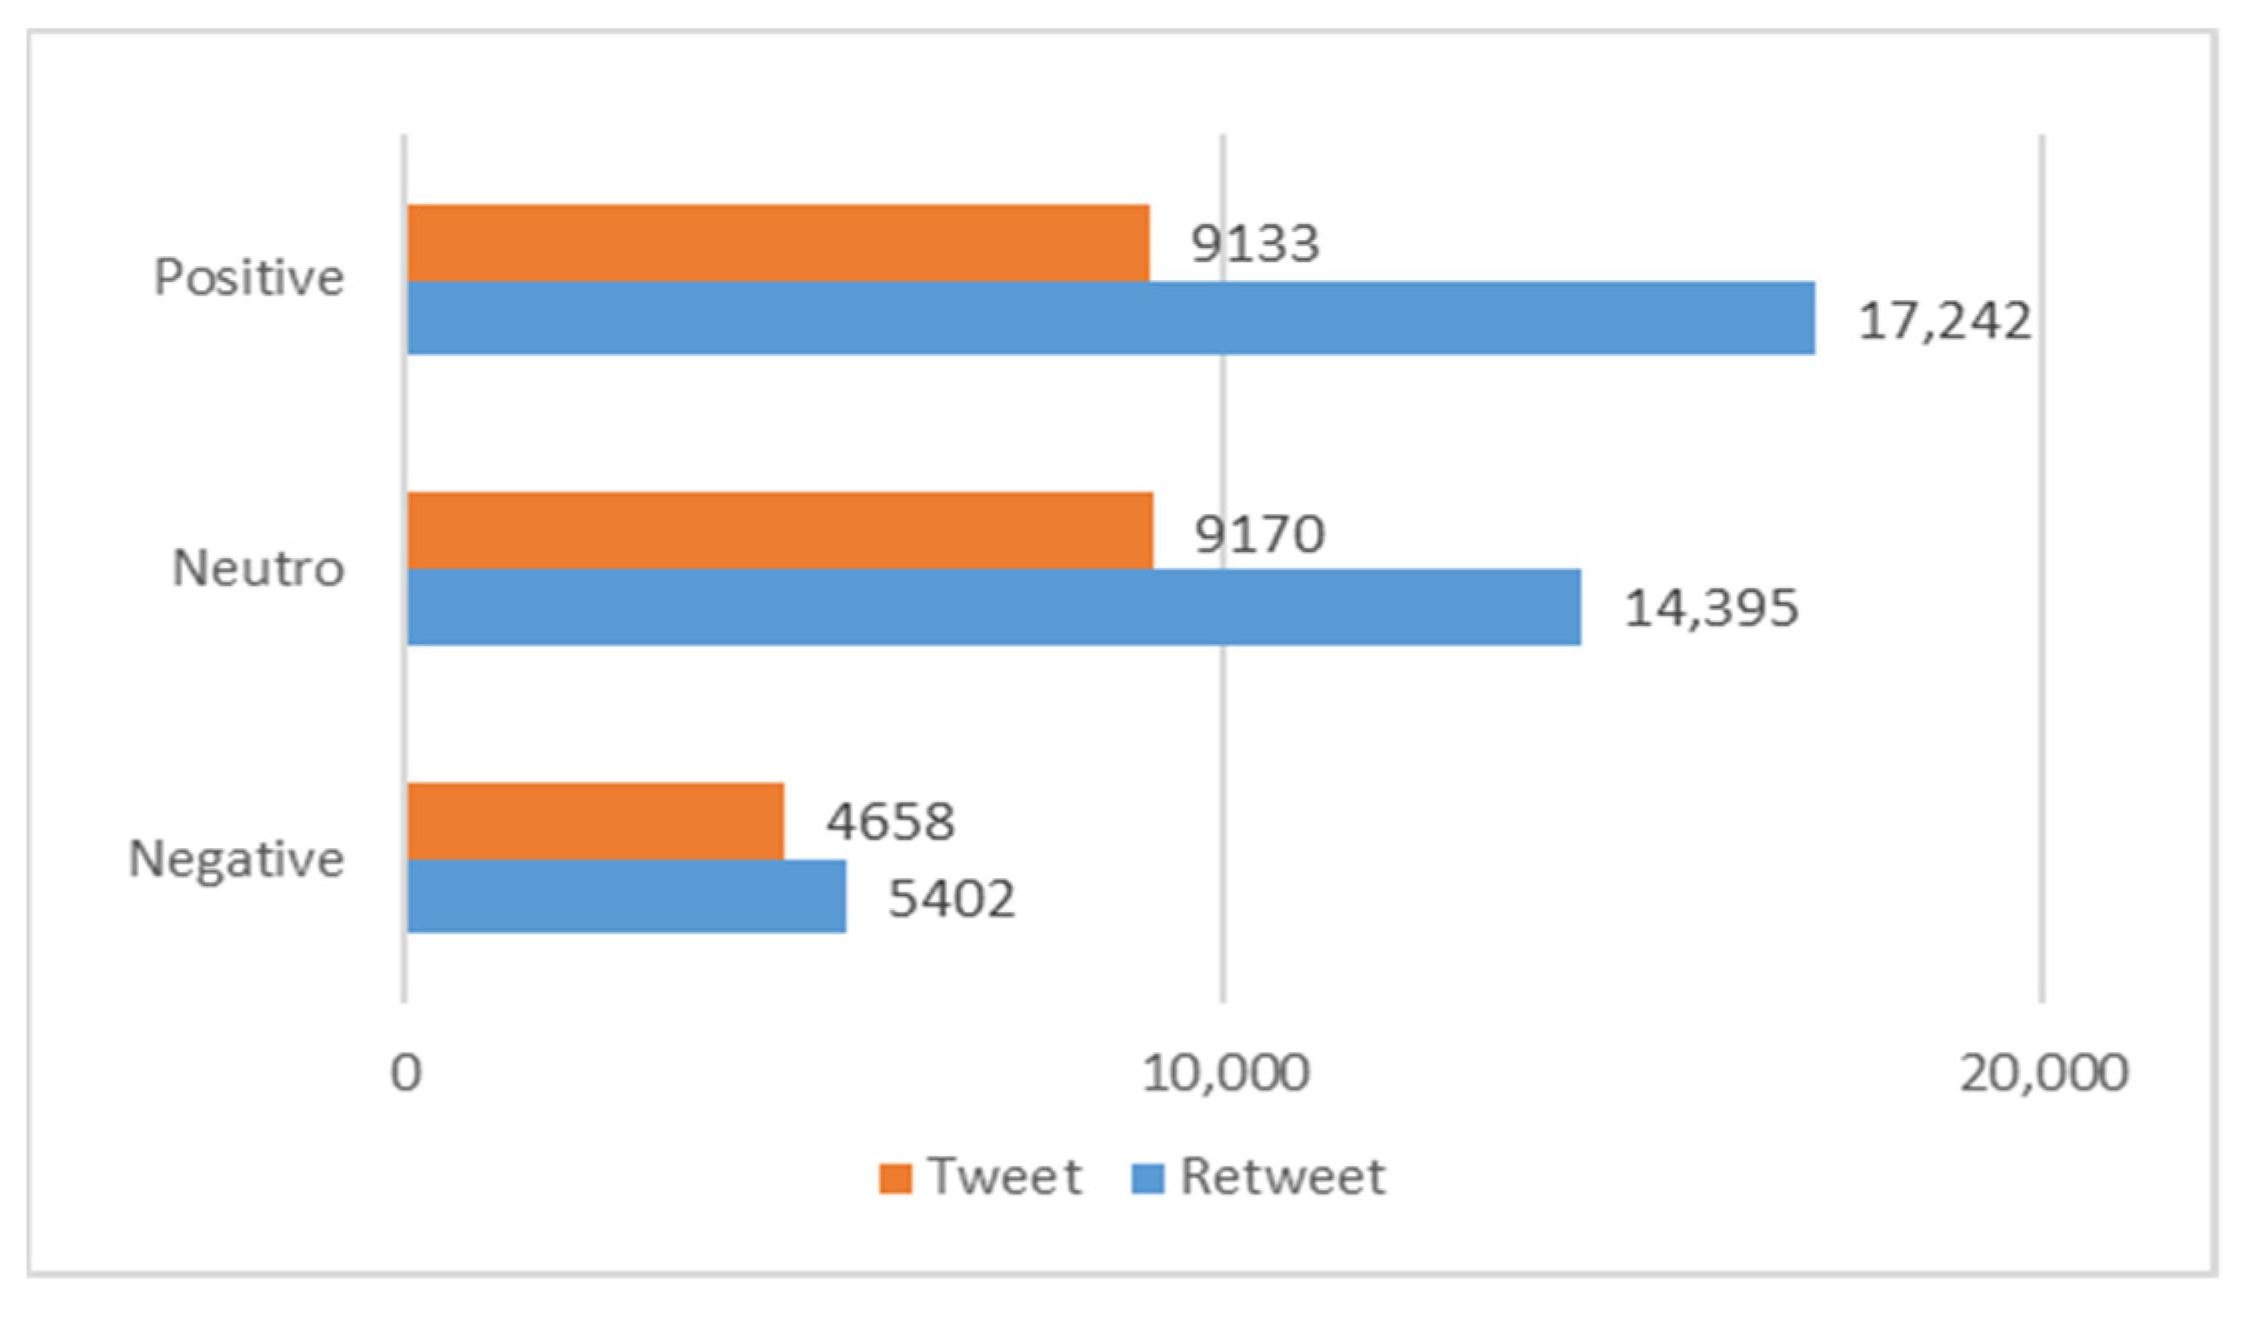
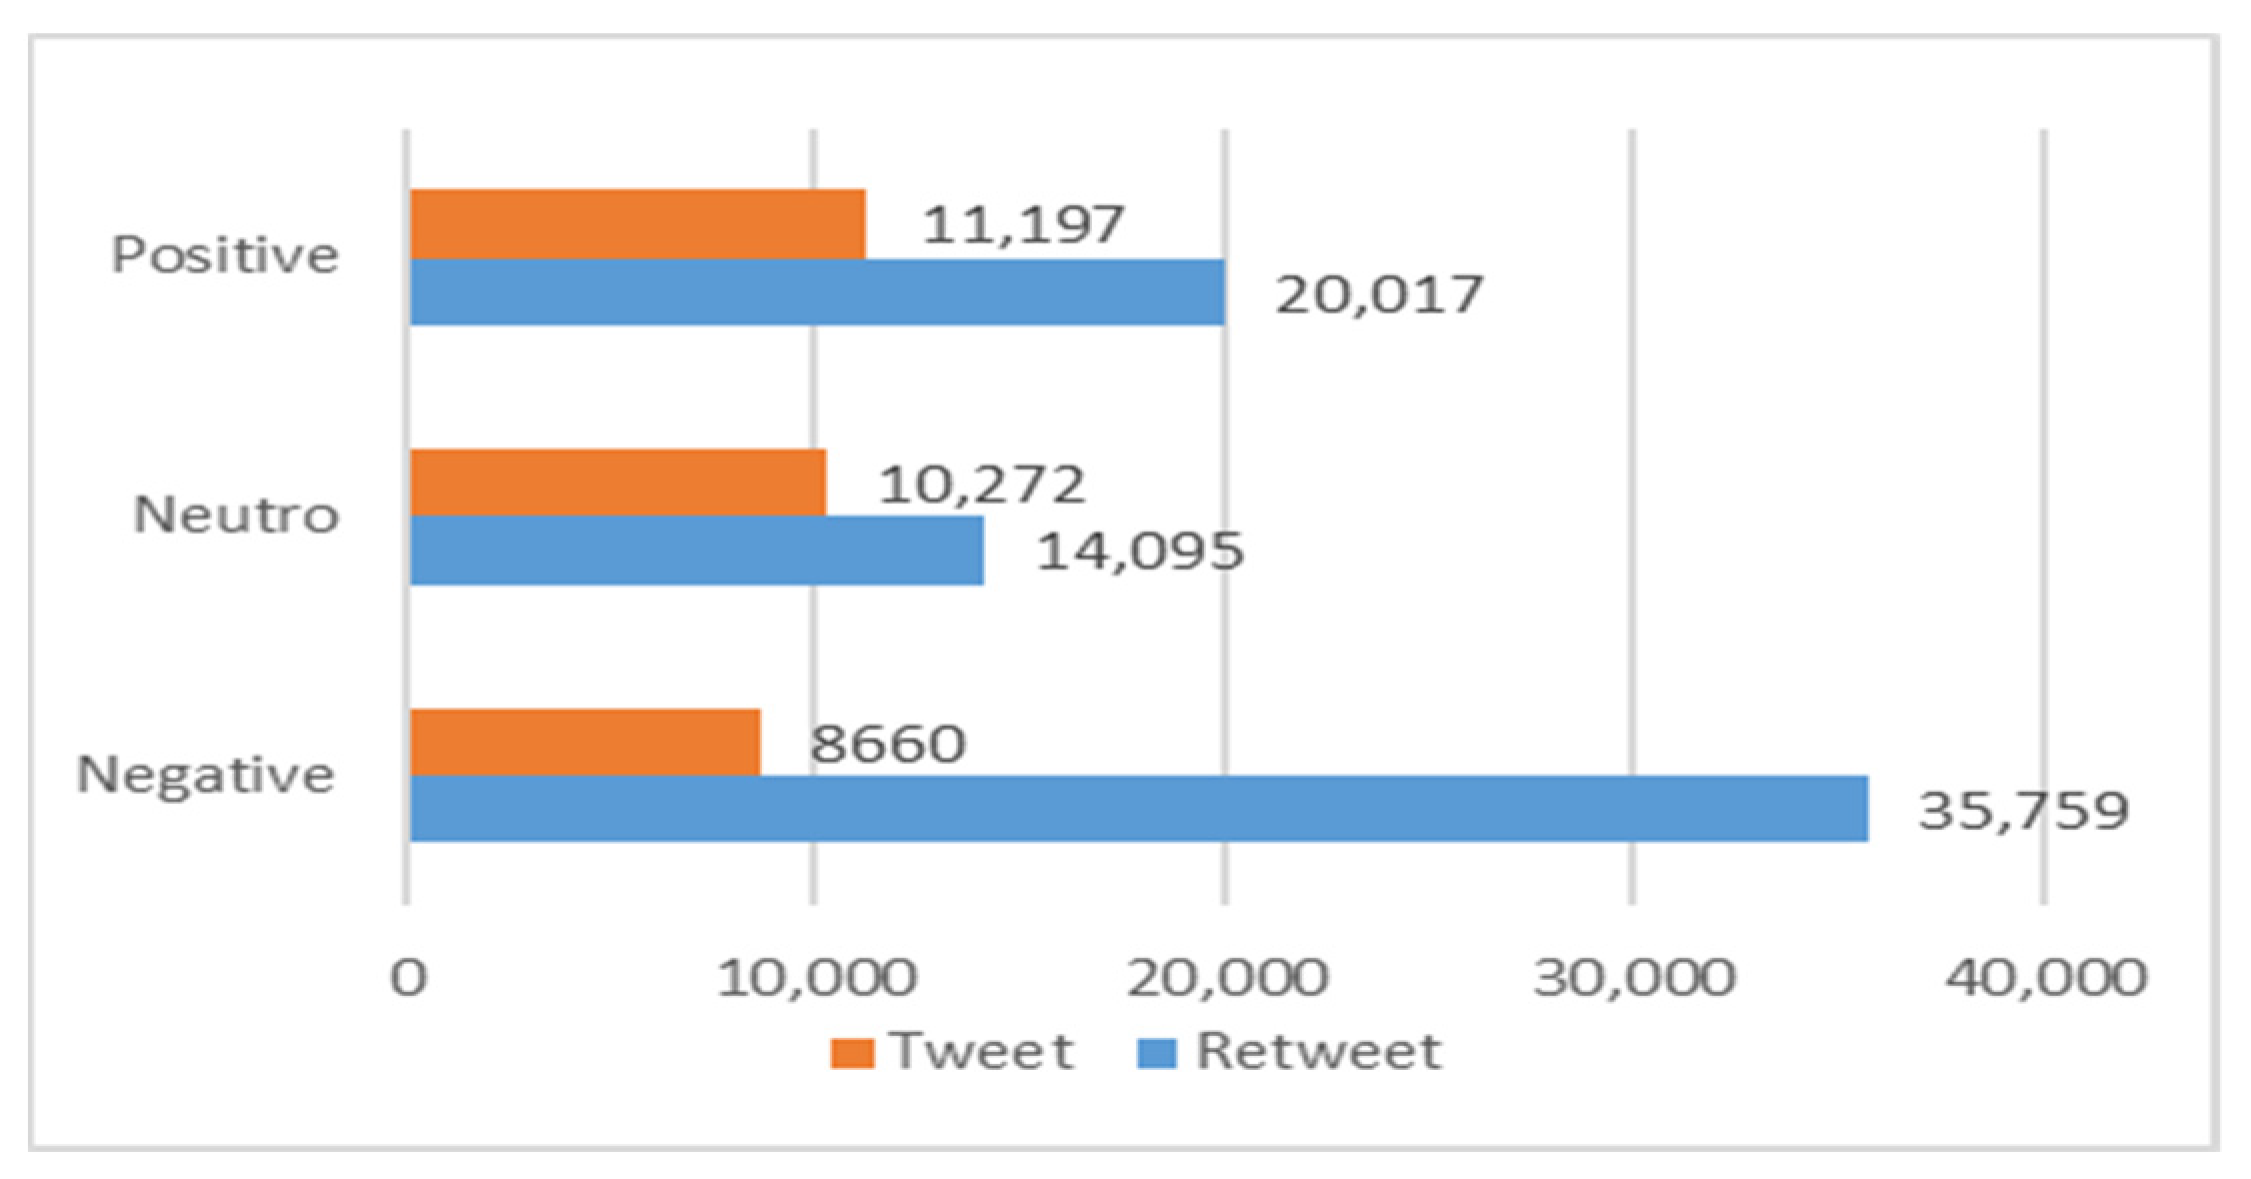
According to the Sentiment Index SI, we classified the tweets and retweets with three labels: negative, neutral, and positive. A radical change was observed in both periods (see Figure 13 and Figure 14). In the first period, the percentage of positive tweets (43.96%) was almost triple the percentage of negative ones (16.77%). While in period 2, the percentage of negative tweets (44.42%) exceeded the positive ones (31.21%).
In [38], the authors stated that retweeting is a way to express individuals’ support or opposition to a topic, so taking this into consideration could give us more information about opinions on green energy from social listening. As shown in Table 1, the percentage of retweets in period 2 (69.87%) was higher than in period 1 (61.73%). The analysis of tweets and retweets shows clear differences in terms of sentiments towards the green energy debate in both periods. As observable in Figure 8 and Figure 9, people were more optimistic when retweeting about green energy in period 1 with 46.6% positive retweets.
The opposite occurred with the words used in period 2, where more retweets related to green energy were classified as negative (51.2%).
5.3. Statistical Data Analysis
In this phase, following the methodology described above, an FA was carried out to comprise and relate the sentiment and emotion information found before. As before, we distinguished two periods: before and after the conflict. For the period before the conflict, the FA detected two factors according to the Kaiser criterion, the first factor explains almost 35% of the data variability and the second slightly more than 22% (Table 3), that explain about 57% of the variance. Table 3 also shows that the value of the Kaiser–Meyer–Olkin (KMO) statistic was greater than 0.75 and a test of independence, whose statistic follows a distribution, had an associated significance of 0. These results indicate the appropriateness of the variables used for the use of FA.
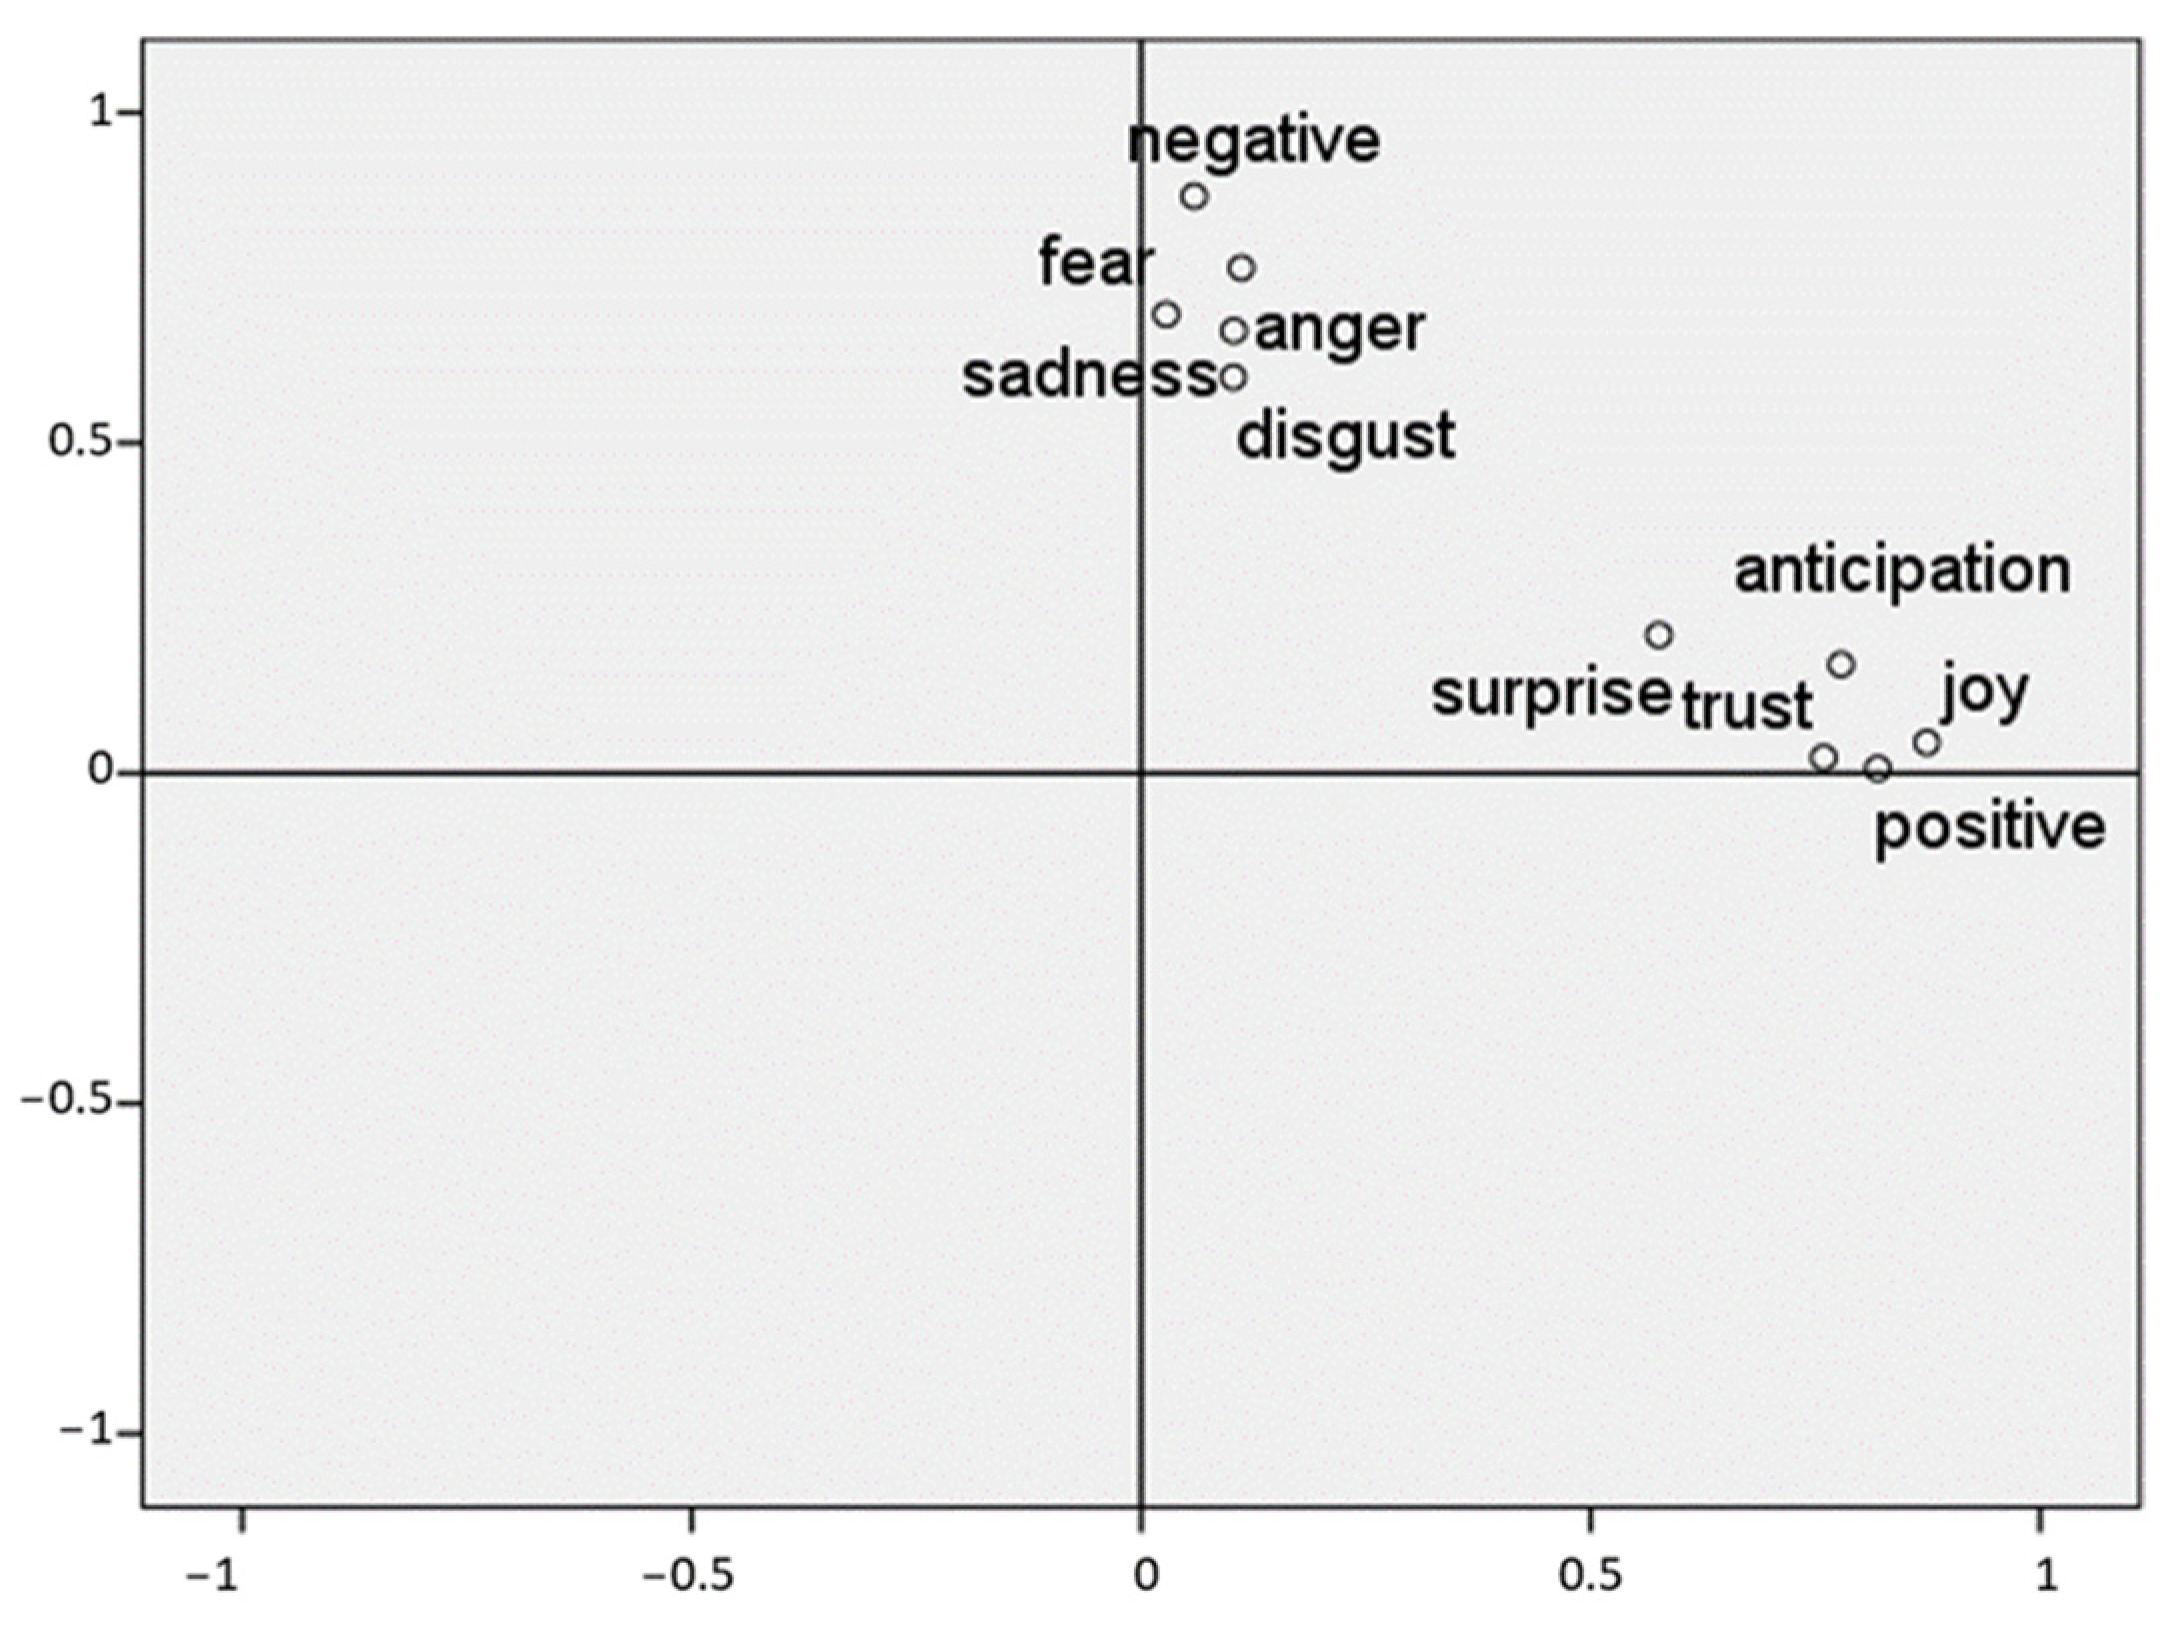
As expected, after optimizing the explainability of the factors extracted from a Varimax rotation, positive sentiment as well as the emotions of anticipation, joy, surprise, and trust were present in the first factor. Negative sentiment along with the remainder of the emotions formed the second factor. The relationship between these factors is shown in Figure 15.
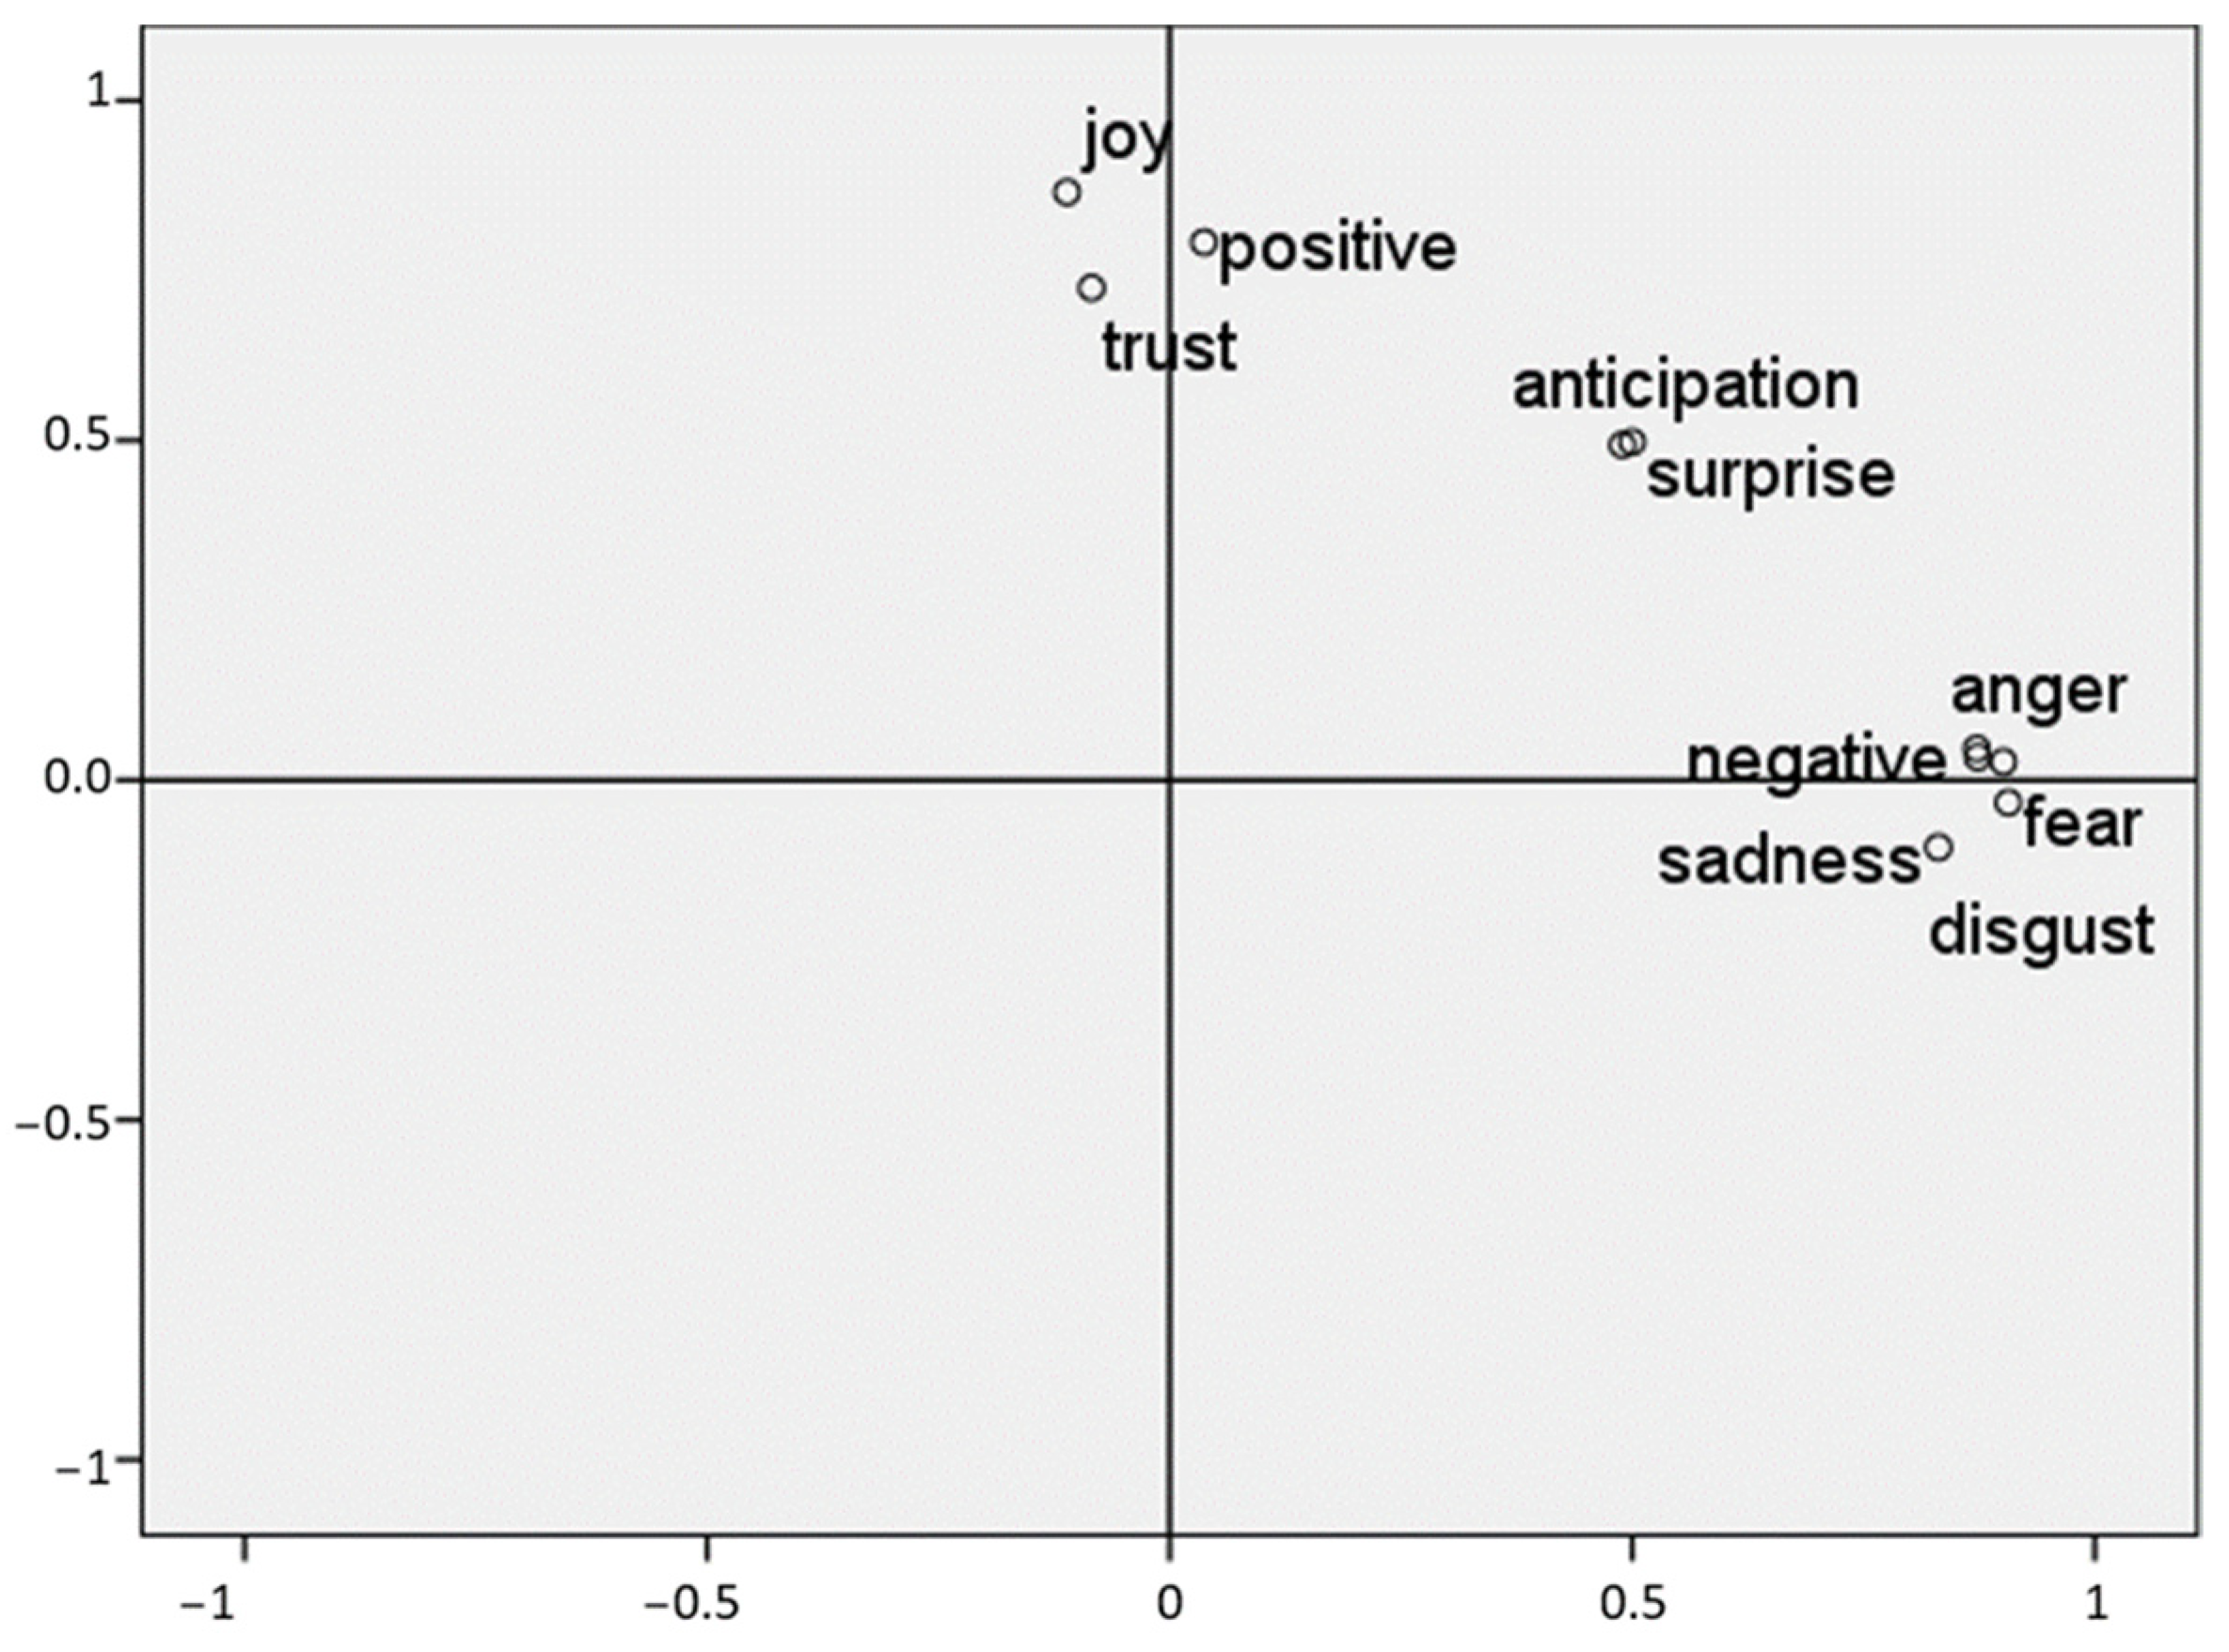
For the period after the conflict (Figure 16), the factor analysis detected three components that jointly explained over 78% of the variance. Table 4 presents the pattern matrix that reports the contribution of each variable to the factor and the statistical indicators of the appropriateness of the variables for the FA. The first component was formed by negative sentiment and the emotions of anger, disgust, fear, and sadness. Positive sentiment and the emotions of joy and trust formed the second component. Finally, the third component included the emotions of anticipation and surprise.
Before the conflict, emotions and sentiments are grouped into only two factors, distinguishing the positive from the negative, however, the conflict has influenced social listening, dividing the optimistic perception. It is observed that the variability of the feelings of a purely positive nature (joy, trust, and positive) are separated from the emotions that reflect uncertainty (anticipation and surprise).
These results indicate that in the period immediately prior to the conflict, only two components were relevant: one positive and principal, optimism, and the other negative with less importance, pessimism. Once the conflict began, the negative component acquired greater relevance. In addition to the positive component, which appeared in second place, a third component emerged that reflected society’s expectations about how the uncertainty of this new scenario could affect green energy. In this second period, the labels assigned to the factors were pessimism (factor 1), optimism (factor 2), and expectation (factor 3).
Finally, we analyzed, using an ANOVA methodology, the behavior of sentiments in tweets and retweets before and after the outbreak of the conflict. Table 5 and Table 6 show the behavior of the different sentiments and emotions, separated by tweets and retweets. The equality of means test rejected the hypothesis with a significance of 5% for all but one variable in both periods. The emotion of fear did not show significantly different mean behavior between tweets and retweets in period 1, however, it did in period 2. The mean values of anger, anticipation, the feeling of confidence, and positive emotions for tweets were lower than those for retweets in both considered periods. However, tweets and retweets showed different behaviors for the remainder of the emotions and feelings in both periods. Before the beginning of the conflict, retweets reflecting disgust, sadness, surprise, or negative emotions had a lower level of these feelings than tweets. This was reversed in period 2, with retweets conveying the emotion of fear also increasing. This behavior reflects how a political crisis can change people’s feelings about green energy. The case of joy was different. In period 1, the feeling of joy was higher in tweets than retweets, with these levels reversing in period 2.
6. Conclusions
Sentiment analysis entails studying and analyzing the opinions, feelings, evaluations, attitudes, and emotions that people include in written documents on a given topic. Knowing the trends of different topics of great interest to society, such as green energy, climate change or others political, socioeconomic or environmental issues, facilitates strategic decision-making by politicians, investors and consumers.
In this paper, sentiment analysis of social listening on green energy was presented. We analyzed the emotions and sentiments expressed when talking about green energy on Twitter, one of the most prominent social media platforms.
The Ukrainian–Russo conflict is causing substantial damage to the global economy. Most production sectors are being affected by increases in prices of some raw materials and, above all, energy. In this sense, one of the sectors most affected by this crisis is the energy sector, which is currently experiencing one of its worst energy crises. To analyze whether the emotions and sentiments of tweets on the topic of green energy have been affected by this conflict, we considered two time periods—before and after the 2022 Ukrainian–Russo conflict started.
We compared tweets referring to green energy in these two periods against positive and negative sentiments as well as the emotions of anger, anticipation, disgust, fear, joy, sadness, surprise, and trust. We observed that there was a remarkable growth in negative sentiments once the conflict started due to the economic, political, and social uncertainty that the conflict has generated among the world population. In relation to emotions, the number of words in period 2 related to negative emotions increased considerably while those related to positive emotions practically remained the same. This shows that the 2022 Ukrainian–Russo conflict has given rise to an important turn in the debate on green energy.
The daily analysis supports this conclusion, although it also showed how the increase in trust on some days of the second period was related to the arrival of news that advocated an energy transition toward green energies.
Factor analysis allowed us to observe two latent variables in the first period; one optimistic and the other pessimistic. In the first period, the optimistic one had more weight. However, in the second period, the pessimistic variable had more weight and the optimistic variable was broken down into two variables: one that continued to reflect optimism and the other that contained the uncertainty (anticipation and surprise) experienced in this second period with respect to green energy.
If we distinguish between tweets and retweets, we can observe how there was a considerable increase in retweets related to negative sentiment in the second period. Regarding emotions, we observed that, in general, retweets corresponding to negative emotions increased, with sadness standing out in particular because the average number of words related to this emotion used in each retweet was triple that in tweets.
On a theoretical level, the obtained results increase the understanding of how the tweeters view and engage with the concept of green energy. This has practical implications for stakeholders in developing strategies for reaching and engaging audiences on Twitter and for politicians to ensure that the political energies are well received by society.
The limitations we can highlight in this study mainly concern the data sample. It is important to note that Twitter limits data collection, and only a part of the total volume of tweets can be retrieved. Therefore, we cannot be sure to what extent the data sample is representative of the population of tweeters.
This study presents opportunities for further research. In this sense, unsupervised classification techniques of matching learning could be used to identify different profiles regarding characteristics of social interest, such as gender, location, and others. Another line of future research could be to observe and create a temporal database of social listening. This is a challenge that would allow us to quickly identify changes in the perception of the consequences of an energy transition to green energy. It would also be possible to estimate predictive models of social opinion on green energies.
Author Contributions
This article is a joint work of the three authors. R.I.-A., R.Q.-G. and M.A.-P. contributed by conducting literature review, data analysis, and writing, and reading and approving the final manuscript. All authors have read and agreed to the published version of the manuscript.
Funding
This research is supported by grants from FICYT (AYUD/2021/50878).
Data Availability Statement
The dataset generated during the current study is available from the corresponding author on request.
Acknowledgments
We are grateful to the editors and anonymous reviewers for their helpful comments and discussions, which improved the quality of the article considerably.
Conflicts of Interest
The authors declare no conflict of interest.
References
- Katila, P.; Colfer, C.J.P.; De Jong, W.; Galloway, G.; Pacheco, P.; Winkel, G. Sustainable Development Goals; Cambridge University Press: Cambridge, UK, 2019. [Google Scholar]
- Büyüközkan, G.; Karabulut, Y.; Mukul, E. A novel renewable energy selection model for United Nations’ sustainable development goals. Energy 2018, 165, 290–302. [Google Scholar] [CrossRef]
- Mir, M.C. Evaluación de los Planes Energéticos Nacionales en España (1975–1998). Rev. Hist. Ind. 1999, 12, 161–178. [Google Scholar]
- Fuso-Nerini, F.; Tomei, J.; To, L.S.; Bisaga, I.; Parikh, P.; Black, M.; Mulugetta, Y. Mapping synergies and trade-offs between energy and the Sustainable Development Goals. Nat. Energy 2017, 3, 10–15. [Google Scholar] [CrossRef] [Green Version]
- Development Report. In The Future is Now—Science for Achieving Sustainable Development; United Nations: New York, NY, USA, 2019. Available online: https://sustainabledevelopment.un.org/content/documents/24797GSDR_report_2019.pdf (accessed on 4 March 2020).
- Fonseca, L.M.; Domingues, J.P.; Dima, A.M. Mapping the Sustainable Development Goals Relationships. Sustainability 2020, 12, 3359. [Google Scholar] [CrossRef] [Green Version]
- Depalo, D. Gloomy Expectations after the Invasion of Ukraine. SSRN 2022. Available online: https://ssrn.com/abstract=4141374 (accessed on 13 July 2022).
- Boungou, W.; Yatie, A. The Impact of the Ukraine-Russia War on World Stock Market Returns. Econ. Lett. 2022, 215, 110516. [Google Scholar] [CrossRef]
- Ahmed, S.; Hasan, M.M.; Kamal, M.R. Russia-Ukraine crisis: The effects on the European stock market. Eur. Financ. Manag. 2022; accepted author manuscript. [Google Scholar] [CrossRef]
- Nerlinger, M.; Utz, S. The impact of the Russia-Ukraine conflict on the green energy transition—A capital market perspective. Swiss Financ. Inst. Res. 2022, 22, 49. [Google Scholar] [CrossRef]
- Kirlenko, A.P.; Molodtsova, T.; Stepchenkova, S.O. People as sensors: Mass media and local temperature influence climate change discussion on Twitter. Glob. Environ. Change 2015, 30, 92–100. [Google Scholar] [CrossRef]
- Loureiro, M.A.; Alló, M. Sensing climate change and energy issues: Sentiment and emotion analysis with social media in the U.K. and Spain. Energy Policy 2020, 143, 111490. [Google Scholar] [CrossRef]
- Ballestar, M.T.; Cuerdo-Mir, M.; Freire-Rubio, M.T. The concept of sustainability on social media: A social listening approach. Sustainability 2020, 12, 2122. [Google Scholar] [CrossRef] [Green Version]
- Muñoz-Céspedes, E.; Ibar-Alonso, R.; de Lorenzo Ros, S. Financial Literacy and Sustainable Consumer Behavior. Sustainability 2021, 13, 9145. [Google Scholar] [CrossRef]
- Bulearca, M.; Bulearca, S. Twitter: A viable marketing tool for SMEs? Glob. Bus Manag. Res. 2010, 2, 296–309. [Google Scholar]
- Pohl, J.S.; Seiler, M.V.; Assenmacher, D.; Grimme, C. A Twitter Streaming Dataset collected before and after the Onset of the War between Russia and Ukraine in 2022. SSRN 2022, 4066543. [Google Scholar] [CrossRef]
- Polyzos, E.S. Escalating Tension and the War in Ukraine: Evidence Using Impulse Response Functions on Economic Indicators and Twitter Sentiment. SSRN 2022, 4058364. [Google Scholar] [CrossRef]
- Blankenship, M.; Saladino, C.J.; Brown, W.E. Ukraine-Russia War: Nevada Twitter and Disinformation Trends. Elect. Gov. Fact Sheet 2022, 3, 1–4. Available online: https://digitalscholarship.unlv.edu/bmw_lincy_elect/3 (accessed on 18 May 2022).
- Liu, B. Sentiment Analysis and Opinion Mining. Synthesis Lectures on Human Language Technologies; Morgan & Claypool: San Rafael, CA, USA, 2012. [Google Scholar]
- Gatto, A. The energy futures we want: A research and policy agenda for energy transitions. Energy Res. Soc. Sci. 2022, 89, 102639. [Google Scholar] [CrossRef]
- Mišík, M. The EU needs to improve its external energy security. Energy Policy 2022, 165, 112930. [Google Scholar] [CrossRef]
- Liadze, I.; Macchiarelli, C.; Mortimer-Lee, P.; Juanino, P.S. The Economic Costs of the Russia Ukraine Conflict. NIESR Policy Paper 2022, 32. [Google Scholar]
- Twitter Usage Statistics. Available online: https://www.internetlivestats.com/twitter-statistics/ (accessed on 9 April 2022).
- Statista. Available online: https://0-www-statista-com.brum.beds.ac.uk/statistics/970920/monetizable-daily-active-twitter-users-worldwide/ (accessed on 9 April 2022).
- Cody, E.M.; Reagan, A.J.; Mitchell, L.; Dodds, P.S.; Danforth, C.M. Climate Change Sentiment on Twitter: An Unsolicited Public Opinion Poll. PLoS ONE 2015, 10, e0136092. [Google Scholar] [CrossRef] [Green Version]
- Bollen, J.; Pepe, A.; Mao, H. Modeling public mood and emotion: Twitter sentiment and socio-economic phenomena. In Proceedings of the 5th International AAAI Conference on Weblogs and Social Media, Barcelona, Spain, 17–21 July 2011; Ademic, L., Baeza-Yates, R., Counts, S., Eds.; AAAI Press: Palo Alto, CA, USA, 2011; pp. 450–453. [Google Scholar]
- Giachanou, A.; Crestani, F. Like it or not: A survey of twitter sentiment analysis methods. ACM Comput. Surv. 2016, 49, 1–41. [Google Scholar] [CrossRef]
- Campos-Domínguez, E. Twitter y la comunicación política. Prof. Inf. 2017, 26, 785–793. [Google Scholar] [CrossRef] [Green Version]
- Arce-García, S.; Vila, F.; Fondevila-Gascón, J.F. Análisis del discurso de Twitter en los debates electorales de 2019 en España: Un estudio algorítmico comparado. Commun. Soc. 2022, 35, 45–61. [Google Scholar] [CrossRef]
- Hammer, C.C.; Boender, T.S.; Thomas, D.R. Social media for field epidemiologists (# SoMe4epi): How to use Twitter during the# COVID19 pandemic. Int. J. Infect. Dis. 2021, 110, S11–S16. [Google Scholar] [PubMed]
- Zhang, S.; Sun, L.; Zhang, D.; Li, P.; Liu, Y.; Anand, A.; Xie, Z.; Li, D. The COVID-19 Pandemic and Mental Health Concerns on Twitter in the United States. Health Data Sci. 2022. [Google Scholar] [CrossRef]
- Nganji, J.T.; Cockburn, L. Use of Twitter in the Cameroon Anglophone crisis. Behav. Inf. Technol. 2020, 30, 267–287. [Google Scholar] [CrossRef] [Green Version]
- Chen, E.; Ferrara, E. Tweets in time of conflict: A public dataset tracking the twitter discourse on the war between Ukraine and Russia. arXiv 2022, arXiv:2203.07488. Available online: https://github.com/echen102/ukraine-russia (accessed on 18 May 2022).
- Shevtsov, A.; Tzagkarakis, C.; Antonakaki, D.; Pratikakis, P.; Ioannidis, S. Twitter Dataset on the Russo-Ukrainian War. arXiv 2022, arXiv:2204.08530. [Google Scholar] [CrossRef]
- Pearce, W.; Niederer, S.; Özkula, S.M.; Sánchez Querubín, N. The social media life of climate change: Platforms, publics, and future imaginaries. WIREs Clim Chang. 2019, 10, e569. [Google Scholar] [CrossRef] [Green Version]
- Holmberg, K.; Hellsten, I. Gender differences in the climate change communication on Twitter. Internet Res. 2015, 25, 811–828. [Google Scholar] [CrossRef] [Green Version]
- Zarrabeitia-Bilbao, E.; Morales-i-Gras, J.; Rio-Belver, R.M.; Garechana-Anacabe, G. Green Energy: Identifying Development Trends in Society Using Twitter Data Mining to Make Strategic Decisions. Prof. Inf. 2022, 31, 1. [Google Scholar] [CrossRef]
- Corbett, J.; Savarimuthu, B.T.R. From tweets to insights: A social media analysis of the emotion discourse of sustainable energy in the United States. Energy Res. Soc. Sci. 2022, 89, 102515. [Google Scholar] [CrossRef]
- Kim, S.Y.; Ganesan, K.; Dickens, P.; Panda, S. Public Sentiment toward Solar Energy-Opinion Mining of Twitter Using a Transformer-Based Language Model. Sustainability 2021, 13, 2673. [Google Scholar] [CrossRef]
- Jain, A.; Jain, V. Renewable Energy Sources for Clean Environment: Opinion Mining. Asian J. Water Environ. Pollut. 2019, 16, 9–14. [Google Scholar] [CrossRef]
- Jain, A.; Jain, V. Sentiment classification of twitter data belonging to renewable energy using machine learning. J. Inf. Optim. Sci. 2019, 40, 521–533. [Google Scholar] [CrossRef]
- Qazi, A.; Hussain, F.; Rahimi, N.A.; Hardaker, G.; Alghazzawi, D.; Shaban, K.; Haruna, K. Towards Sustainable Energy: A Systematic Review of Renewable Energy Sources, Technologies, and Public Opinions. IEEE Access 2019, 7, 63837–63851. [Google Scholar] [CrossRef]
- Jeong, S.Y.; Kim, J.W.; Joo, H.Y.; Kim, Y.S.; Moon, J.H. Development and Application of a Big Data Analysis-Based Procedure to Identify Concerns about Renewable Energy. Energies 2021, 14, 4977. [Google Scholar] [CrossRef]
- Mohammad, S.M.; Turney, P.D. NRC Emotion Lexicon; National Research Council: Ottawa, ON, Canada, 2013. [Google Scholar] [CrossRef]
- Kaiser, H.F. The application of electronic computers to factor analysis. Educ. Psychol. Meas. 1960, 20, 141–151. [Google Scholar] [CrossRef]
Figure 1.
Methodology.

Figure 2.
Geographical representation of Twitter activity in period 1 (Source: Own data, created with mapchart.net (accessed on 4 April 2022)).
Figure 2.
Geographical representation of Twitter activity in period 1 (Source: Own data, created with mapchart.net (accessed on 4 April 2022)).

Figure 3.
Geographical representation of Twitter activity in period 2 (Source: Own data, created with mapchart.net (accessed on 4 April 2022)).
Figure 3.
Geographical representation of Twitter activity in period 2 (Source: Own data, created with mapchart.net (accessed on 4 April 2022)).

Figure 4.
Wordcloud period 1.

Figure 5.
Wordcloud period 2.

Figure 6.
Wordcloud by bigrams period 1.

Figure 7.
Wordcloud by bigrams period 2.

Figure 8.
Analysis of sentiments and emotions graph (period 1).

Figure 9.
Analysis of sentiments and emotions graph (period 2).

Figure 10.
Daily sentiments and emotions.


Figure 11.
Daily evolution of sentiments.

Figure 12.
Daily evolution of emotions.

Figure 13.
Polarity of tweets and retweets (period 1).

Figure 14.
Polarity of tweets and retweets (period 2).

Figure 15.
Relationships between the components extracted in the FA, period 1.

Figure 16.
Relationships between the components extracted in the FA, period 2.


Table 1.
Number of tweets and retweets.
| Period 1 | Period 2 | Total | |||
|---|---|---|---|---|---|
| Tweet | 22,961 | 38.27% | 30,129 | 30.13% | 53,090 |
| Retweet | 37,039 | 61.73% | 69,871 | 69.87% | 106,910 |
Table 2.
Summary statistics of sentiments and emotions.
| Anger | Anticipation | Disgust | Fear | Joy | Sadness | Surprise | Trust | Negative | Positive | ||
|---|---|---|---|---|---|---|---|---|---|---|---|
| Period 1 | Mean | 0.3043 | 0.4573 | 0.1760 | 0.3094 | 0.3745 | 0.2621 | 0.1632 | 0.6385 | 0.6622 | 1.2394 |
| Std.Dev. | 0.5702 | 0.6986 | 0.4399 | 0.5659 | 0.6279 | 0.6337 | 0.4089 | 0.8389 | 0.8748 | 1.2212 | |
| Minimum | 0.0000 | 0.0000 | 0.0000 | 0.0000 | 0.0000 | 0.0000 | 0.0000 | 0.0000 | 0.0000 | 0.0000 | |
| Maximum | 4.0000 | 5.0000 | 4.0000 | 5.0000 | 5.0000 | 4.0000 | 4.0000 | 5.0000 | 7.0000 | 9.0000 | |
| Period 2 | Mean | 0.5303 | 0.6567 | 0.4699 | 0.7736 | 0.3146 | 0.7412 | 0.2704 | 0.7594 | 1.5355 | 1.2595 |
| Std.Dev. | 0.7955 | 0.8263 | 0.7638 | 1.0025 | 0.6078 | 1.0157 | 0.4893 | 0.9228 | 1.4719 | 1.0941 | |
| Minimum | 0.0000 | 0.0000 | 0.0000 | 0.0000 | 0.0000 | 0.0000 | 0.0000 | 0.0000 | 0.0000 | 0.0000 | |
| Maximum | 8.0000 | 5.0000 | 4.0000 | 8.0000 | 6.0000 | 7.0000 | 4.0000 | 7.0000 | 10.0000 | 10.0000 |
Table 3.
Total explained variance and goodness-of-fit test in period 1.
| Factor | Initial Eigenvalues | ||
|---|---|---|---|
| Total | % Variance | % Accumulated | |
| 1 | 3.464 | 34.641 | 34.641 |
| 2 | 2.235 | 22.349 | 56.990 |
| 3 | 0.821 | 8.214 | 65.204 |
| 4 | 0.773 | 7.726 | 72.930 |
| 5 | 0.718 | 7.182 | 80.112 |
| 6 | 0.521 | 5.207 | 85.319 |
| 7 | 0.480 | 4.801 | 90.120 |
| 8 | 0.390 | 3.896 | 94.016 |
| 9 | 0.331 | 3.313 | 97.329 |
| 10 | 0.267 | 2.671 | 100.000 |
| Kaiser–Meyer–Olkin measure of sampling adequacy | 0.8 | ||
| Bartlett’s sphericity: | approximation | 209,559.06 | |
| gl | 45 | ||
| Sig. | 0.000 | ||
Source: Output SPSS results.
Table 4.
Total explained variance and goodness-of-fit test in period 2.
| Factor | Initial Eigenvalues | ||
|---|---|---|---|
| Total | % Variance | % Accumulated | |
| 1 | 4.418 | 44.182 | 44.182 |
| 2 | 2.247 | 23.471 | 67.653 |
| 3 | 1.071 | 10.707 | 78.360 |
| 4 | 0.542 | 5.416 | 83.776 |
| 5 | 0.395 | 3.954 | 87.729 |
| 6 | 0.377 | 3.766 | 91.495 |
| 7 | 0.325 | 3.254 | 94.749 |
| 8 | 0.225 | 2.253 | 97.002 |
| 9 | 0.172 | 1.717 | 98.719 |
| 10 | 0.128 | 1.281 | 100.000 |
| Kaiser-Meyer-Olkin measure of sampling adequacy | 0.822 | ||
| Bartlett’s sphericity: | Chi-square approximation | 65,4034.576 | |
| gl | 45 | ||
| Sig. | 0.000 | ||
Source: Output of SPSS results.
Table 5.
ANOVA Period 1, for tweets (0) and retweets (1).
| Variable | Group | Mean | Standard Deviation | Standard Error | Confidence Interval (95%) | Min. | Max. | F | Sig. | |
|---|---|---|---|---|---|---|---|---|---|---|
| Lower Limit | Upper Limit | |||||||||
| Anger | 0 | 0.2895 | 0.58499 | 0.00386 | 0.282 | 0.2971 | 0 | 4 | 24.951 | 0 |
| 1 | 0.3135 | 0.56067 | 0.00291 | 0.3077 | 0.3192 | 0 | 3 | |||
| Anticipation | 0 | 0.4292 | 0.70449 | 0.00465 | 0.42 | 0.4383 | 0 | 5 | 60.187 | 0 |
| 1 | 0.4747 | 0.69433 | 0.00361 | 0.4676 | 0.4817 | 0 | 4 | |||
| Disgust | 0 | 0.1991 | 0.48071 | 0.00317 | 0.1929 | 0.2053 | 0 | 4 | 102.603 | 0 |
| 1 | 0.1617 | 0.41201 | 0.00214 | 0.1575 | 0.1659 | 0 | 3 | |||
| Fear | 0 | 0.3132 | 0.61983 | 0.00409 | 0.3052 | 0.3212 | 0 | 5 | 1.706 | 0.191 |
| 1 | 0.307 | 0.52979 | 0.00275 | 0.3016 | 0.3124 | 0 | 5 | |||
| Joy | 0 | 0.3669 | 0.64627 | 0.00427 | 0.3586 | 0.3753 | 0 | 5 | 5.387 | 0.02 |
| 1 | 0.3792 | 0.61623 | 0.0032 | 0.3729 | 0.3854 | 0 | 4 | |||
| Sadness | 0 | 0.2696 | 0.54179 | 0.00358 | 0.2626 | 0.2766 | 0 | 4 | 5.253 | 0.022 |
| 1 | 0.2574 | 0.68451 | 0.00356 | 0.2505 | 0.2644 | 0 | 3 | |||
| Surprise | 0 | 0.2051 | 0.47071 | 0.00311 | 0.199 | 0.2112 | 0 | 4 | 392.848 | 0 |
| 1 | 0.1372 | 0.36296 | 0.00189 | 0.1335 | 0.1409 | 0 | 4 | |||
| Trust | 0 | 0.5993 | 0.80368 | 0.0053 | 0.5889 | 0.6097 | 0 | 5 | 81.167 | 0 |
| 1 | 0.6628 | 0.85914 | 0.00446 | 0.654 | 0.6715 | 0 | 4 | |||
| Negative | 0 | 0.7187 | 0.9382 | 0.00619 | 0.7066 | 0.7309 | 0 | 7 | 156.051 | 0 |
| 1 | 0.6271 | 0.83117 | 0.00432 | 0.6186 | 0.6355 | 0 | 7 | |||
| Positive | 0 | 1.1092 | 1.17923 | 0.00778 | 1.094 | 1.1245 | 0 | 9 | 425.606 | 0 |
| 1 | 1.3201 | 1.23967 | 0.00644 | 1.3075 | 1.3327 | 0 | 7 | |||
Source: Output of SPSS results.
Table 6.
ANOVA Period 2, for tweets (0) and retweets (1).
| Variable | Group | Mean | Standard Deviation | Standard Error | Confidence Interval (95%) | Min. | Max. | F | Sig. | |
|---|---|---|---|---|---|---|---|---|---|---|
| Lower Limit | Upper Limit | |||||||||
| Anger | 0 | 0.3743 | 0.64859 | 0.00374 | 0.3669 | 0.3816 | 0 | 8 | 1686.142 | 0 |
| 1 | 0.5975 | 0.84224 | 0.00319 | 0.5913 | 0.6038 | 0 | 5 | |||
| Anticipation | 0 | 0.4863 | 0.72533 | 0.00418 | 0.4781 | 0.4945 | 0 | 5 | 1867.716 | 0 |
| 1 | 0.7302 | 0.85578 | 0.00324 | 0.7238 | 0.7365 | 0 | 5 | |||
| Disgust | 0 | 0.2722 | 0.63428 | 0.00365 | 0.265 | 0.2794 | 0 | 4 | 2975.97 | 0 |
| 1 | 0.5552 | 0.79834 | 0.00302 | 0.5493 | 0.5611 | 0 | 4 | |||
| Fear | 0 | 0.4367 | 0.7122 | 0.0041 | 0.4287 | 0.4448 | 0 | 8 | 5119.011 | 0 |
| 1 | 0.9189 | 1.07221 | 0.00406 | 0.9109 | 0.9268 | 0 | 5 | |||
| Joy | 0 | 0.3778 | 0.65578 | 0.00378 | 0.3704 | 0.3852 | 0 | 6 | 468.246 | 0 |
| 1 | 0.2874 | 0.58379 | 0.00221 | 0.283 | 0.2917 | 0 | 6 | |||
| Sadness | 0 | 0.3325 | 0.6056 | 0.00349 | 0.3257 | 0.3394 | 0 | 7 | 7503.576 | 0 |
| 1 | 0.9174 | 1.10237 | 0.00417 | 0.9092 | 0.9256 | 0 | 4 | |||
| Surprise | 0 | 0.2577 | 0.51339 | 0.00296 | 0.2519 | 0.2635 | 0 | 4 | 29.432 | 0 |
| 1 | 0.276 | 0.47842 | 0.00181 | 0.2724 | 0.2795 | 0 | 4 | |||
| Trust | 0 | 0.6452 | 0.87235 | 0.00503 | 0.6353 | 0.655 | 0 | 7 | 665.081 | 0 |
| 1 | 0.8087 | 0.93948 | 0.00355 | 0.8017 | 0.8156 | 0 | 7 | |||
| Negative | 0 | 0.9555 | 1.12207 | 0.00646 | 0.9429 | 0.9682 | 0 | 10 | 7175.241 | 0 |
| 1 | 1.7856 | 1.53299 | 0.0058 | 1.7742 | 1.7969 | 0 | 7 | |||
| Positive | 0 | 1.1177 | 1.21355 | 0.00699 | 1.104 | 1.1314 | 0 | 10 | 729.638 | 0 |
| 1 | 1.3207 | 1.03236 | 0.00391 | 1.313 | 1.3283 | 0 | 10 | |||
Source: Output of SPSS results.
Publisher’s Note: MDPI stays neutral with regard to jurisdictional claims in published maps and institutional affiliations. |
© 2022 by the authors. Licensee MDPI, Basel, Switzerland. This article is an open access article distributed under the terms and conditions of the Creative Commons Attribution (CC BY) license (https://creativecommons.org/licenses/by/4.0/).
Share and Cite
MDPI and ACS Style
Ibar-Alonso, R.; Quiroga-García, R.; Arenas-Parra, M. Opinion Mining of Green Energy Sentiment: A Russia-Ukraine Conflict Analysis. Mathematics 2022, 10, 2532. https://0-doi-org.brum.beds.ac.uk/10.3390/math10142532
AMA Style
Ibar-Alonso R, Quiroga-García R, Arenas-Parra M. Opinion Mining of Green Energy Sentiment: A Russia-Ukraine Conflict Analysis. Mathematics. 2022; 10(14):2532. https://0-doi-org.brum.beds.ac.uk/10.3390/math10142532
Chicago/Turabian StyleIbar-Alonso, Raquel, Raquel Quiroga-García, and Mar Arenas-Parra. 2022. "Opinion Mining of Green Energy Sentiment: A Russia-Ukraine Conflict Analysis" Mathematics 10, no. 14: 2532. https://0-doi-org.brum.beds.ac.uk/10.3390/math10142532
Note that from the first issue of 2016, this journal uses article numbers instead of page numbers. See further details here.