Article

Pearson Correlation and Discrete Wavelet Transform for Crack Identification in Steel Beams

by
Morteza Saadatmorad
1,
Ramazan-Ali Jafari Talookolaei
1,
Mohammad-Hadi Pashaei
1,
Samir Khatir
2,3 and
Magd Abdel Wahab
3,*
1
School of Mechanical Engineering, Babol Noshirvani University of Technology, Babol 4714871167, Iran
2
Faculty of Civil Engineering, Ho Chi Minh City Open University, Ho Chi Minh City 700000, Vietnam
3
Soete Laboratory, Faculty of Engineering and Architecture, Ghent University, Technologiepark Zwijnaarde 903, B-9052 Zwijnaarde, Belgium
*
Author to whom correspondence should be addressed.
Submission received: 20 June 2022 / Revised: 21 July 2022 / Accepted: 21 July 2022 / Published: 29 July 2022
(This article belongs to the Special Issue Advanced Numerical Methods in Computational Solid Mechanics)

Abstract

:
Discrete wavelet transform is a useful means for crack identification of beam structures. However, its accuracy is severely dependent on the selecting mother wavelet and vanishing moments, which raises a significant challenge in practical structural crack identification. In this paper, a novel approach is introduced for structural health monitoring of beams to fix this challenge. The approach is based on the combination of statistical characteristics of vibrational mode shapes of the beam structures and their discrete wavelet transforms. First, this paper suggests using regression statistics between intact and damaged modes to monitor the health of beam structures. Then, it suggests extracting quasi-Pearson-based mode shape index of the beam structures to use them as an original signal in discrete wavelet transforms. Findings show that the proposed approach has several advantages compared with the conventional mode shape signal processing by the discrete wavelet transforms and significantly improves damage detection’s accuracy.

1. Introduction

Damage detection of structures at the early stages plays a vital role in their health [1,2,3]. In addition, timely damage detection saves many repair costs. Many damage detection methods have been developed to monitor structures’ health and detect their damages in recent decades [4,5,6]. Vibration-based damage detection is a large class of damage detection methods [7,8,9]. The modal characteristics such as structures’ stiffness, natural frequencies, and mode shapes are used to detect damage in structures [10].
In [11], it was proved that the local stiffness at the damage region reduces due to the damage. Moreover, in a study, it was reported that the existence of damage decreases the natural frequencies of the structures [12]. In practice, obtaining the structures’ stiffness and natural frequencies corresponding to higher modes is impossible. Thus, mode shapes are suitable modal characteristics for simple damage detection in many structures. So far, many mode-shape-based damage detection methods have been developed by various researchers. Yazdanpanah et al. [13] proposed an indicator for damage detection in beam structures using mode shape data. Moreover, Ratcliffe et al. [14] applied a modified Laplacian indicator on the mode shapes’ data to detect damages in beam structures. Dahak et al. [15] present a damage detection approach by combining the mode shape and the curvature of beam structures. This investigation was based on the global first derivative of the beam’s mode shape. However, a practical signal processing-based damage detection method called wavelet transform can process mode shapes locally. So far, many investigations have been conducted for damage detection in beam structures by using wavelet transform. Generally, there are two main classes of wavelet transforms for the beam structures’ one-dimensional signal processing: one-dimensional continuous wavelet transforms (1D-CWTs) and one-dimensional discrete wavelet transforms (1D-DWTs). In these transforms, signals are processed to localize the damage’s position and severity via the signal information obtained from the damaged structure [16]. Wavelets transform a signal into sub-signals to indicate the damaged signal’s discontinuity [17]. Janeliukstis et al. [18] performed an empirical investigation by 1D-CWTs for damage localization of beam structure based on mode shapes’ signal. Moreover, Montanari et al. [19] utilized the 1D-CWTs to localize the cracks of beam structures. Rucka et al. [20] studied the application of 1D-CWTs to detect beams’ damage.
However, a significant weakness of the wavelet transform is that its accuracy depends on the amount of vanishing moments and the mother wavelet function. In other words, changing the amount of vanishing moments may change the outcome of the damage detection. Dependence on the accuracy of damage detection on the mentioned parameters is a significant disadvantage for detecting the damage because misidentifying it may have irreparable outcomes. Investigations have shown that, especially for low-level damages, this dependence is significantly increased, and the performance of the wavelet transform is impaired. In order to fix this problem and improve the accuracy of damage detection by 1D-DWTs in beam structures, this paper proposes creating a regression-based signal obtained from the correlations of the intact and damaged mode shapes. The importance of the study is that in this study, for the first time, it was suggested to use the Pearson-based coefficient of damage mode shape for feeding in 1D-wavelet transform to have accurate and robust damage detection.

2. Basic Formulations

2.1. Finite Element Modeling

The equation of motion based on the finite element model (FEM) for the free vibration on the beam is presented as follows [21]:
[ M ] { x ¨   ( t ) } + [ K ] { x ( t ) } = 0
where [ M ] and [ K ] denote the mass and stiffness matrices in the global coordinate, respectively. Likewise, the { x ¨   ( t ) } and { x ( t ) } show the acceleration and displacement vectors, respectively.
By assuming the response { x } = { φ } e i ω t , the Equation (1) is rewritten as follows:
[ M ] { ω 2 { φ } } + [ K ] { φ } = 0
For the i t h mode, Equation (2) is rewritten as follows [22]:
[ M ] { ω i 2 { φ i } } + [ K ] { φ i } = 0
where ω i shows the i t h natural frequency, and φ i is its corresponding i t h mode shape. Equation (4) is named as the i t h eigenvalue equation. Assuming ω i 2 = λ i , Equation (3) can be written in the following standard form [23]:
[ M ] { λ i { φ i } } + [ K ] { λ i } = 0
The matrices [ K ] and [ M ] are obtained by assembling the element stiffness matrix [ K e ] and the element mass matrix [ M e ] , respectively. The element stiffness matrix and the element mass matrix for the steel beam structures are expressed as follows:
[ K e ] = E I l e 3 [ 12 6 l e 12 6 l e 4 l e 2 6 l e 4 l e 2 12 6 l e Sym 4 l e 2 ]
[ M e ] = m l e 420 [ 156 22 l e 54 13 l e 4 l e 2 13 l e 3 l e 2 156 22 l e Sym 4 l e 2 ]
The natural frequencies are obtained from the following equation:
d e t e r m i n a n t ( [ K ] λ i [ M ] ) = 0
Finally, the mode shapes are obtained from the following expression:
[ [ M ] { λ i } + [ K ] ] { φ i } = 0

2.2. Regression

Regression is an index in which the relationship between one or more independent variables and a dependent variable is estimated. The regression analysis has different types, and one of the most widely used regression analyses is linear regression analysis. In this paper, linear regression examines the modal shape’s data points to examine the beam structure’s health.
Consider a dataset as { φ i i n t a c t ,   φ i o p e r a t i o n a l } i = 1 n containing n data points. When φ i i n t a c t and φ i o p e r a t i o n a l are considered as dependent (intact mode shape) and (damaged mode shape) independent variables; respectively, a linear regression can be expressed as follows:
φ i i n t a c t = β 0 + β 1 φ i o p e r a t i o n a l + ϵ
The above equation shows a line equation with an additional term called error ϵ . The parameters of this linear model are the vertical intercept β 0 and the slope of the line β 1 . The slope of the line in the linear regression model indicates the sensitivity of the independent variable. The vertical intercept represents the value of the dependent variable, which is calculated as zero for the value of the independent variable. Alternatively, the constant value or the vertical intercept can be considered the average value of the dependent variable for deleting the independent variable. There are several ways to define and minimize an error ϵ . The criterion used in the simple linear regression model is to minimize the sum of squares of error. Since the mean of the error values is zero, it is known that the sum of the squares of the error will be minimal when the data distribution is normal. As a result, the normality of the dependent variable or residual data is one of the essential assumptions for a simple linear regression model.
In order to compute the Pearson-based correlation between the intact and damaged modes, the following expression is used by setting φ i o p e r a t i o n a l = κ i and φ i i n t a c t = ζ i :
C ( i ) = ( κ i κ i ¯ ) ( ζ i ζ i ¯ ) ( κ i κ i ¯ ) 2 ( ζ i ζ i ¯ )      i = 1 ,   2 ,   ,   n
where ζ i ¯ and κ i ¯ are mean of the (intact mode shape, subtractable from arrays of the vector ζ i ) dependent and mean of the (damaged mode shape, subtractable from arrays of the vector κ i ) independent variables. Moreover, C i are the quasi-correlation coefficients. n is the number of sampling points of the signal. Finally, the Pearson-based correlation coefficients mode shape index are defined as follows:
R ( i ) = κ i ( κ i κ i ¯ ) ( ζ i ζ i ¯ ) ( κ i κ i ¯ ) 2 ( ζ i ζ i ¯ )

2.3. One-Dimensional Discrete Wavelet Transform

An important type of wavelet transform is a one-dimensional discrete wavelet transform. The one-dimensional discrete wavelet transforms for the signal R(i) are defined as follows:
R ( i ) = κ i ( κ i κ i ¯ ) ( ζ i ζ i ¯ ) ( κ i κ i ¯ ) 2 ( ζ i ζ i ¯ ) = A j ( i ) + j < J D j ( i )
where A j show approximation signals at level j, D j are detail signals at level j.
The approximation signals at level j are obtained as follows [24]:
A j ( i ) = k = + c A j , k ϕ j , k ( i )
where c A j , k are approximation coefficients at level j. ϕ j , k ( i ) indicate scaling functions at level j.
The detail signals at level j denote expressed as follows [24]:
D j ( i ) = k ϵ Z c D j , k ψ j , k ( i )
where c D j , k are detail coefficients at level j. ψ j , k ( i ) indicate wavelet functions.

3. Proposed Approach

In this section, the proposed approach is presented. The approach is based on statistical features of intact and damaged mode shapes related to the beam structures, and discrete wavelet transforms. As seen in Figure 1, in the first step, the health of beam structure is monitored by the regression applied between intact and damaged mode shapes. For practical applications, the first intact and mode shapes can be used. Note that the pair mode shapes are obtained either experimentally or numerically. As seen in Figure 1, when the regression factor (R) is equal to 1, it means that the beam structure is intact, and when it is between 0 and 1, it means that the beam structure has experienced damage, at least. If 0 < R < 1 , the damage detection process begins according to the flowchart shown in Figure 2.
As seen in Figure 2, for the proposed damage detection approach, the quasi-Pearson-based correlation signal between the intact and damaged mode shapes is calculated to use as the processing signal in the one-dimensional discrete wavelet transform instead of using a damaged mode shape signal. Therefore, in this study, damage detection is performed based on the Pearson-based correlation coefficients between the intact and damaged mode shapes in order to improve the power of damage detection by the one-dimensional discrete wavelet transform and eliminate the weakness related to selecting the best mother wavelet and vanishing moments.

4. Results

4.1. Numerical Results

The FEM is applied to calculate the intact and damaged mode shapes of beam structure for the numerical investigation. As indicated in Figure 3, the beam is divided into 40 elements (81 nodes). The constant properties of the studied steel beam structure are tabulated in Table 1.
According to Figure 3, the damage is applied to element number twenty. Moreover, each element has three nodes. In the numerical investigations, four damage scenarios are applied on the beam to investigate the performance of our proposed method. Damages are applied by reducing the stiffness of the twentieth element as follows [25]:
[ K e ] d = α [ K e ] D = [ K e ] [ K ] e d [ K ] e × 100 = [ K ] e α [ K ] e   [ K ] e × 100 = ( 1 α ) × 100
where D is damage level, [ K ] e d is stiffness of the damage element. Moreover, α is a constant ( 0 < α < 1 ).

4.2. Numerical Investigations for Structural Health Monitoring

In this section, numerical investigations are performed for structural health monitoring. According to Table 2, four different damage scenarios are considered to evaluate the performance of our regression-based approach for structural health monitoring of beam-like structures.
The 90% damage is applied to the twentieth element (i.e., in nodal coordinate, nodes 39, 40, and 41) in the first damage scenario. In the second, third, and fourth damage scenarios, 70%, 50%, and 30% of damages are applied to the same location (i.e., nodes 39, 40, and 41), respectively. Figure 4 shows eight mode shapes obtained from four different damage scenarios. As seen in this figure, damage causes the shift of the intact mode shapes in all scenarios. Moreover, results show that as the damage level increases, the shift increases. This finding was reported in the literature that stated that damage shifts mode shapes. As seen in Figure 4, the location of damage cannot be determined using mode shape directly. The damaged mode shapes provide a qualitative tool for structural health monitoring. This qualitative way is considered a weakness when the level of damage is low. For fixing this problem, this paper proposes a quantitative approach called regression.
As mentioned, the regression index R can show the health of the beam, if the regression index is R = 1 , then the beam structure is intact, and when it is between 0 and 1, it means that the structure has experienced damage, at least. Figure 5 shows the regression diagram between the first mode and the first mode. As expected, the value of the regression index is R = 1 .
On the other hand, Figure 6 shows the regression diagram for the four considered scenarios. This figure shows that the regression index 0 < R < 1 is different for the four different scenarios considered. The findings demonstrate that as the damage level increases, the R decreases. Moreover, Figure 6 shows that even for low-level damages, reporting R is possible. In contrast, when the level of damage, it is challenging to detect the difference between intact and damaged modes.
After it is specified using the regression index that the beam is damaged. Our proposed method is tested. Figure 7a shows the original signal s (damaged mode shape) and the results of their one-dimensional discrete wavelet transform.

4.3. Numerical Investigations for Damage Detection

After the structural health monitoring health phase, if 0 < R < 1, the beam structure has experienced damage. Thus, damage detection should be performed to prevent further losses. This section presents numerical investigations for damage detection. According to Table 3, three different damage scenarios are considered for evaluating the performance of our proposed damage detection method. Similar to the structural health monitoring health phase, in this section, damages of all damage scenarios are located at element number 20 (i.e., in nodal coordinate, nodes 39, 40, and 41). In the first, second, and third scenarios, damages levels are 90%, 70%, and 10%.
After it is specified using the regression index (R) that the beam is damaged. Our proposed method is tested. Figure 7a shows the original signal s (damaged mode shape) and the results of its one-dimensional discrete wavelet transform. The wavelet family Symlet decomposes the signal s, and the vanishing moment is equal to 2 for this figure. The damage level in this figure equals 90%, and the damage is located at the twentieth element. Results of numerical investigations for damage detection are presented in Figure 7, Figure 8, Figure 9, Figure 10, Figure 11, and Figure 12. These results prove that the performance approach acts better than the conventional. Figure 7b, Figure 8b, Figure 9b, Figure 10b, Figure 11b and Figure 12b demonstrate that using the vanishing moments 5, damage detection both by model shape signals and Pearson-based mode shape signal brings accurate results. However, for vanishing moments 2, the proposed Pearson-based mode shape signals bring better damage detection results than the conventional mode shape signals.
The results of the one-dimensional discrete wavelet transform for mode shape signals and Pearson-based signals for two vanishing moments (i.e., 2 and 5) are shown in Figure 7, Figure 8, Figure 9, Figure 10, Figure 11 and Figure 12 to simultaneously investigate the effect of both using the proposed Pearson-based signals in the result and increasing the order of vanishing moments. In the results presented in Figure 7, Figure 8, Figure 9, Figure 10, Figure 11 and Figure 12, a1 indicates the approximation signal at level 1, and d1 indicates the detail signal at level 1. The approximation a1 is the high-scale, low-frequency component of the original signal. The detail d1 is the low-scale, high-frequency component of the original signal. Therefore, it is expected to search the damage’s location in the detail signals.
By comparing the images shown in Figure 7, Figure 8, Figure 9, Figure 10, Figure 11 and Figure 12, it is found that our proposed approach eliminates the need for selecting vanishing moments. It is also seen that our proposed method introduces a good alternative for mode shape signals to improve the accuracy of damage detection. Thus, using the Pearson-based correlation coefficients of the mode shapes instead of the mode shapes in the wavelet transform can improve the damage detection’s accuracy, especially in low-level damages. Moreover, the findings show that the damage location, if detected, appears in the detail signals and the approximation signals, as expected, are a general approximation of the signals. The results show that it is possible to identify damage and cracks in the structure using wavelet transformation of Pearson-based correlation coefficients at level 1; as a result, there is no need to choose vanishing moments. This is an important advantage over the conventional wavelet transform because it eliminates trial and error efforts for the selection of the best mother wavelet function.

4.4. Experimental Results

Careful design and maintenance of various structures such as buildings, bridges, dams, airplanes, trains, beams, etc., is essential. One of the requirements for the design and maintenance of structures is their dynamic analysis. Due to the unavailability of analytical solutions for complex structures, with different loads and boundary conditions, as well as errors such errors resulting from the application of inappropriate assumptions and theories, errors in modeling the details of complex structures, and lack of accurate information about the properties materials, numerical approximation models such as the finite element method also face problems. Therefore, modal testing is a suitable tool to achieve the dynamic properties of the structure.
In order to implement the modal test, the intact steel beam is used, as shown in Figure 13. Then, according to Figure 13a, the intact beam is cracked to be used to have the corresponding cracked beam, as shown in Figure 13. The beams are suspended with a soft clamp to implement free-free boundary conditions as seen in Figure 13b. A DJB A120V accelerometer is used to measure acceleration. This accelerometer is installed at point 4 of the structure. An 8202BK vibrating hammer equipped with an 8200BK dynamometer is used to apply force to the structure. A 2647A amplifier is also used to convert the power signal. The steel beam is divided into 10 points. The accelerometer is fixed at point 4, and at all points, the impact force is applied with a hammer. This test is performed once for a healthy beam and once for a damaged beam.
In order to have damage on the steel beam, at a distance of 30 cm from the head of the beam, slot-shape damage with 0.5 mm deep and 1 mm wide across the width of the beam is created using a CNC milling machine (Figure 14a). Also, Figure 14b shows the cracked steel beam and its free-free boundary conditions.
As mentioned, the modal test is performed at all beams’ points (the accelerometer is fixed at point 4, and the hammer is moved at other points). The test frequency range is 0 to 100 Hz. The frequency response functions obtained for the intact beam (Figure 15) have been calculated using the BK3560D analyzer and Pulse 8 software by performing experiments and measuring force and acceleration signals.
At the end of the experiment, the mentioned frequency response functions are sent to the Icats software and analyzed. After this analysis, the natural frequencies, damping coefficients, and the beam modes’ shape are obtained. The natural frequencies and damping coefficients are reported in Table 4. Moreover, the normalized mode shapes of the steel beam in intact conditions are presented in Table 5.
Then, after applying damage to the beam, the test is performed again in the same way as before. The accelerometer is installed at point 4, and a hammer blow is applied at all points. The test frequency range is 0 to 100 Hz. The frequency response functions obtained for the damaged beam (Figure 16) have been calculated using the BK3560D analyzer and Pulse 8 software by performing experiments and measuring force and acceleration signals.
After testing, the obtained frequency response functions are sent to the Icats software and analyzed. After this analysis, the natural frequencies, damping coefficients, and the damaged beam modes’ shape are obtained. The natural frequencies and damping coefficients are reported in Table 6. Moreover, the normalized mode shapes of the steel beam in the damaged conditions are presented in Table 7. Moreover, the plot of experimental intact and cracked mode shapes is presented in Figure 17 with the red line and blue line, respectively.
Experimental findings demonstrate that damage causes reduced natural frequencies (Table 3 and Table 5). Moreover, similar to the numerical study, damage causes shift mode shapes (Figure 17). Experimental results verify that our proposed method for structural health monitoring is effective (Figure 18). In addition, the experimental findings verify that our proposed method improves the performance of the conventional 1D-DWT (Figure 19 and Figure 20).

5. Conclusions

In this study, a novel strategy for structural health monitoring and damage detection of the beam structure is present to improve the efficiency of the one-dimensional discrete wavelet transforms 1D-DWT. For structural health monitoring of beam structures, it is proposed to use regression index ( R ) to know damage conditions numerically. The regression index is beneficial, especially for level damages and great damage-sensitive application of beam structures. There is no apparent difference between intact and damaged mode shapes under low-level damages. Findings show that the performance approach acts better than the conventional. In addition, findings demonstrate that using the vanishing moments 5, damage detection both by model shape signals and Pearson-based mode shape signal brings accurate results. However, for vanishing moments 2, the proposed Pearson-based mode shape signals bring better damage detection results than the conventional mode shape signals. In order to verify the performance of our proposed method in practice, experimental investigations are performed. The experimental results demonstrate the efficiency of using the Pearson-based coefficients of vibrational mode shapes of the beam structures instead of damaged mode shaped to process by 1D-DWT.

Author Contributions

Conceptualization, M.S.; methodology, M.S.; software, M.S.; validation, M.S., R.-A.J.T., S.K., M.-H.P. and M.A.W.; formal analysis, M.S., R.-A.J.T., S.K., M.-H.P. and M.A.W.; investigation, M.S.; resources, M.S.; data curation, M.S.; writing—original draft preparation, M.S.; writing—review and editing, M.S.; visualization M.S.; supervision, R.-A.J.T., S.K., M.-H.P. and M.A.W., project administration, M.A.W.; funding acquisition, M.A.W. All authors have read and agreed to the published version of the manuscript.
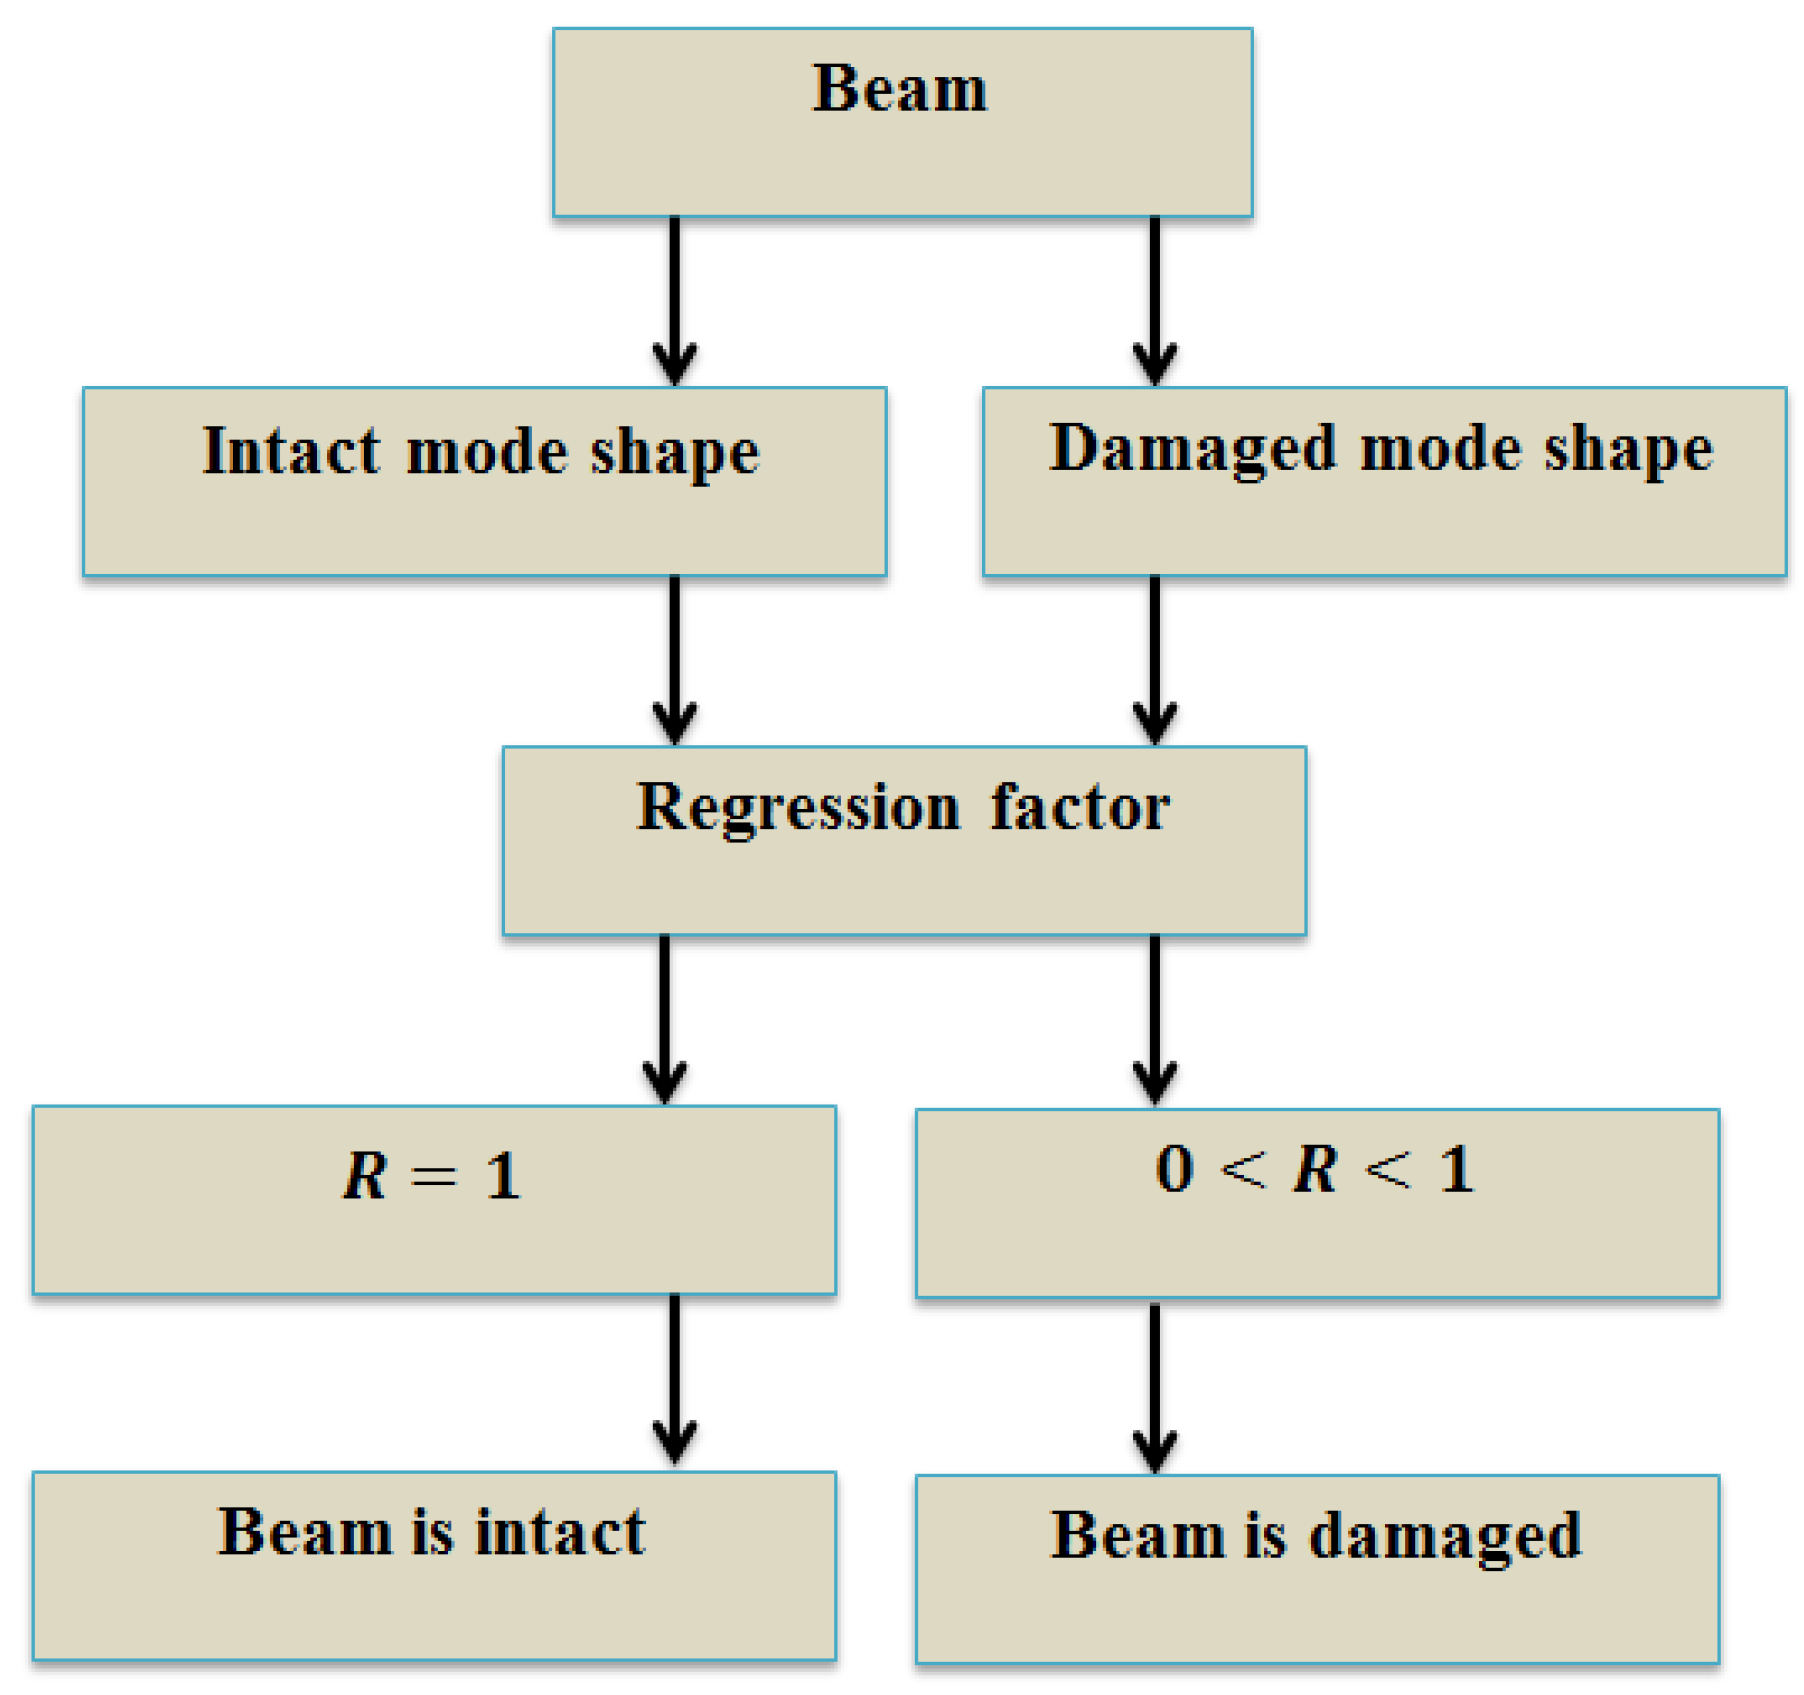
Funding

The authors acknowledge the financial support of Babol Noshirvani University of Technology, School of Mechanical Engineering, Iran.

Institutional Review Board Statement

Not applicable.

Informed Consent Statement

Informed consent was obtained from all subjects involved in the study.

Data Availability Statement

Not applicable.

Conflicts of Interest

The authors declare no conflict of interest.

References

  1. Sun, Z.; Nagayama, T.; Nishio, M.; Fujino, Y. Investigation on a Curvature-Based Damage Detection Method Using Displacement under Moving Vehicle. Struct. Control Health Monit. 2017, 25, e2044. [Google Scholar] [CrossRef]
  2. Zhou, Z.; Wegner, L.D.; Sparling, B.F. Data Quality Indicators for Vibration-Based Damage Detection and Localization. Eng. Struct. 2021, 230, 111703. [Google Scholar] [CrossRef]
  3. Guo, J.; Hu, C.-J.; Zhu, M.-J.; Ni, Y.-Q. Monitoring-Based Evaluation of Dynamic Characteristics of a Long Span Suspension Bridge under Typhoons. J. Civ. Struct. Health Monit. 2021, 11, 397–410. [Google Scholar] [CrossRef]
  4. Fathi, A.; Limongelli, M.P. Statistical Vibration-Based Damage Localization for the S101 Bridge, Flyover Reibersdorf, Austria. Struct. Infrastruct. Eng. 2020, 17, 1–15. [Google Scholar] [CrossRef]
  5. Guan, D.Q.; Liu, L. The Damage Identification of Multilayer Frame Structure Containing Sheet Crack by Wavelet Analysis. Appl. Mech. Mater. 2012, 193–194, 1001–1004. [Google Scholar] [CrossRef]
  6. Alvandi, A.; Cremona, C. Assessment of vibration-based damage identification techniques. Journal of sound and vibration. J. Sound Vib. 2006, 292, 179–202. [Google Scholar]
  7. Yam, L.H.; Yan, Y.J.; Jiang, J.S. Vibration-based damage detection for composite structures using wavelet transform and neural network identification. Compos. Struct. 2003, 60, 403–412. [Google Scholar] [CrossRef]
  8. Benaissa, B.; Hocine, N.A.; Khatir, S.; Riahi, M.K.; Mirjalili, S. YUKI Algorithm and POD-RBF for Elastostatic and Dynamic Crack Identification. J. Comput. Sci. 2021, 55, 101451. [Google Scholar] [CrossRef]
  9. Park, H.S.; Oh, B.K. Damage Detection of Building Structures under Ambient Excitation through the Analysis of the Relationship between the Modal Participation Ratio and Story Stiffness. J. Sound Vib. 2018, 418, 122–143. [Google Scholar] [CrossRef]
  10. Yang, Y.; Liu, H.; Mosalam, K.M.; Huang, S. An Improved Direct Stiffness Calculation Method for Damage Detection of Beam Structures. Struct. Control Health Monit. 2012, 20, 835–851. [Google Scholar] [CrossRef]
  11. Niu, Z. Frequency Response-Based Structural Damage Detection Using Gibbs Sampler. J. Sound Vib. 2020, 470, 115160. [Google Scholar] [CrossRef]
  12. Pisani, M.A.; Limongelli, M.P.; Giordano, P.F.; Palermo, M. On the Effectiveness of Vibration-Based Monitoring for Integrity Management of Prestressed Structures. Infrastructures 2021, 6, 171. [Google Scholar] [CrossRef]
  13. Yazdanpanah, O.; Seyedpoor, S.M.; Bengar, H.A. A New Damage Detection Indicator for Beams Based on Mode Shape Data. Struct. Eng. Mech. 2015, 53, 725–744. [Google Scholar] [CrossRef]
  14. Ratcliffe, C. P Damage detection using a modified Laplacian operator on mode shape data. J. Sound Vib. 1997, 204, 505–517. [Google Scholar] [CrossRef]
  15. Dahak, M.; Touat, N.; Kharoubi, M. Damage Detection in Beam through Change in Measured Frequency and Undamaged Curvature Mode Shape. Inverse Probl. Sci. Eng. 2018, 27, 89–114. [Google Scholar] [CrossRef]
  16. Staszewski, W.J. Intelligent Signal Processing for Damage Detection in Composite Materials. Compos. Sci. Technol. 2002, 62, 941–950. [Google Scholar] [CrossRef]
  17. Kim, H.; Melhem, H. Damage Detection of Structures by Wavelet Analysis. Eng. Struct. 2004, 26, 347–362. [Google Scholar] [CrossRef]
  18. Janeliukstis, R.; Rucevskis, S.; Wesolowski, M.; Chate, A. Experimental Structural Damage Localization in Beam Structure Using Spatial Continuous Wavelet Transform and Mode Shape Curvature Methods. Measurement 2017, 102, 253–270. [Google Scholar] [CrossRef]
  19. Montanari, L.; Spagnoli, A.; Basu, B.; Broderick, B. On the Effect of Spatial Sampling in Damage Detection of Cracked Beams by Continuous Wavelet Transform. J. Sound Vib. 2015, 345, 233–249. [Google Scholar] [CrossRef]
  20. Rucka, M.; Wilde, K. Application of continuous wavelet transform in vibration based damage detection method for beams and plates. J. Sound Vib. 2006, 297, 536–550. [Google Scholar] [CrossRef]
  21. Ferreira, A.J.M.; Araújo, A.L.; Neves, A.M.A.; Rodrigues, J.D.; Carrera, E.; Cinefra, M.; Soares, C.M.M. A finite element model using a unified formulation for the analysis of viscoelastic sandwich laminates. Compos. Part B Eng. 2013, 45, 1258–1264. [Google Scholar] [CrossRef] [Green Version]
  22. Benaroya, M.; Nagurka, M.L. Mechanical Vibration: Analysis, Uncertainties, and Control; CRC Press/Taylor & Francis: Boca Raton, FL, USA, 2010. [Google Scholar]
  23. Ferreira, A.J.M. Matlab Codes for Finite Element Analysis; Springer: Berlin/Heidelberg, Germany, 2014. [Google Scholar]
  24. Bagheri, A.; Ghodrati Amiri, G.; Khorasani, M.; Bakhshi, H. Structural Damage Identification of Plates Based on Modal Data Using 2D Discrete Wavelet Transform. Struct. Eng. Mech. 2011, 40, 13–28. [Google Scholar] [CrossRef]
  25. Saadatmorad, M.; Jafari-Talookolaei, R.A.; Pashaei, M.H.; Khatir, S. Damage detection on rectangular laminated composite plates using wavelet based convolutional neural network technique. Compos. Struct. 2021, 278, 114656. [Google Scholar] [CrossRef]
Figure 1. Flowchart of beam structure’s health monitoring by regression indicator.
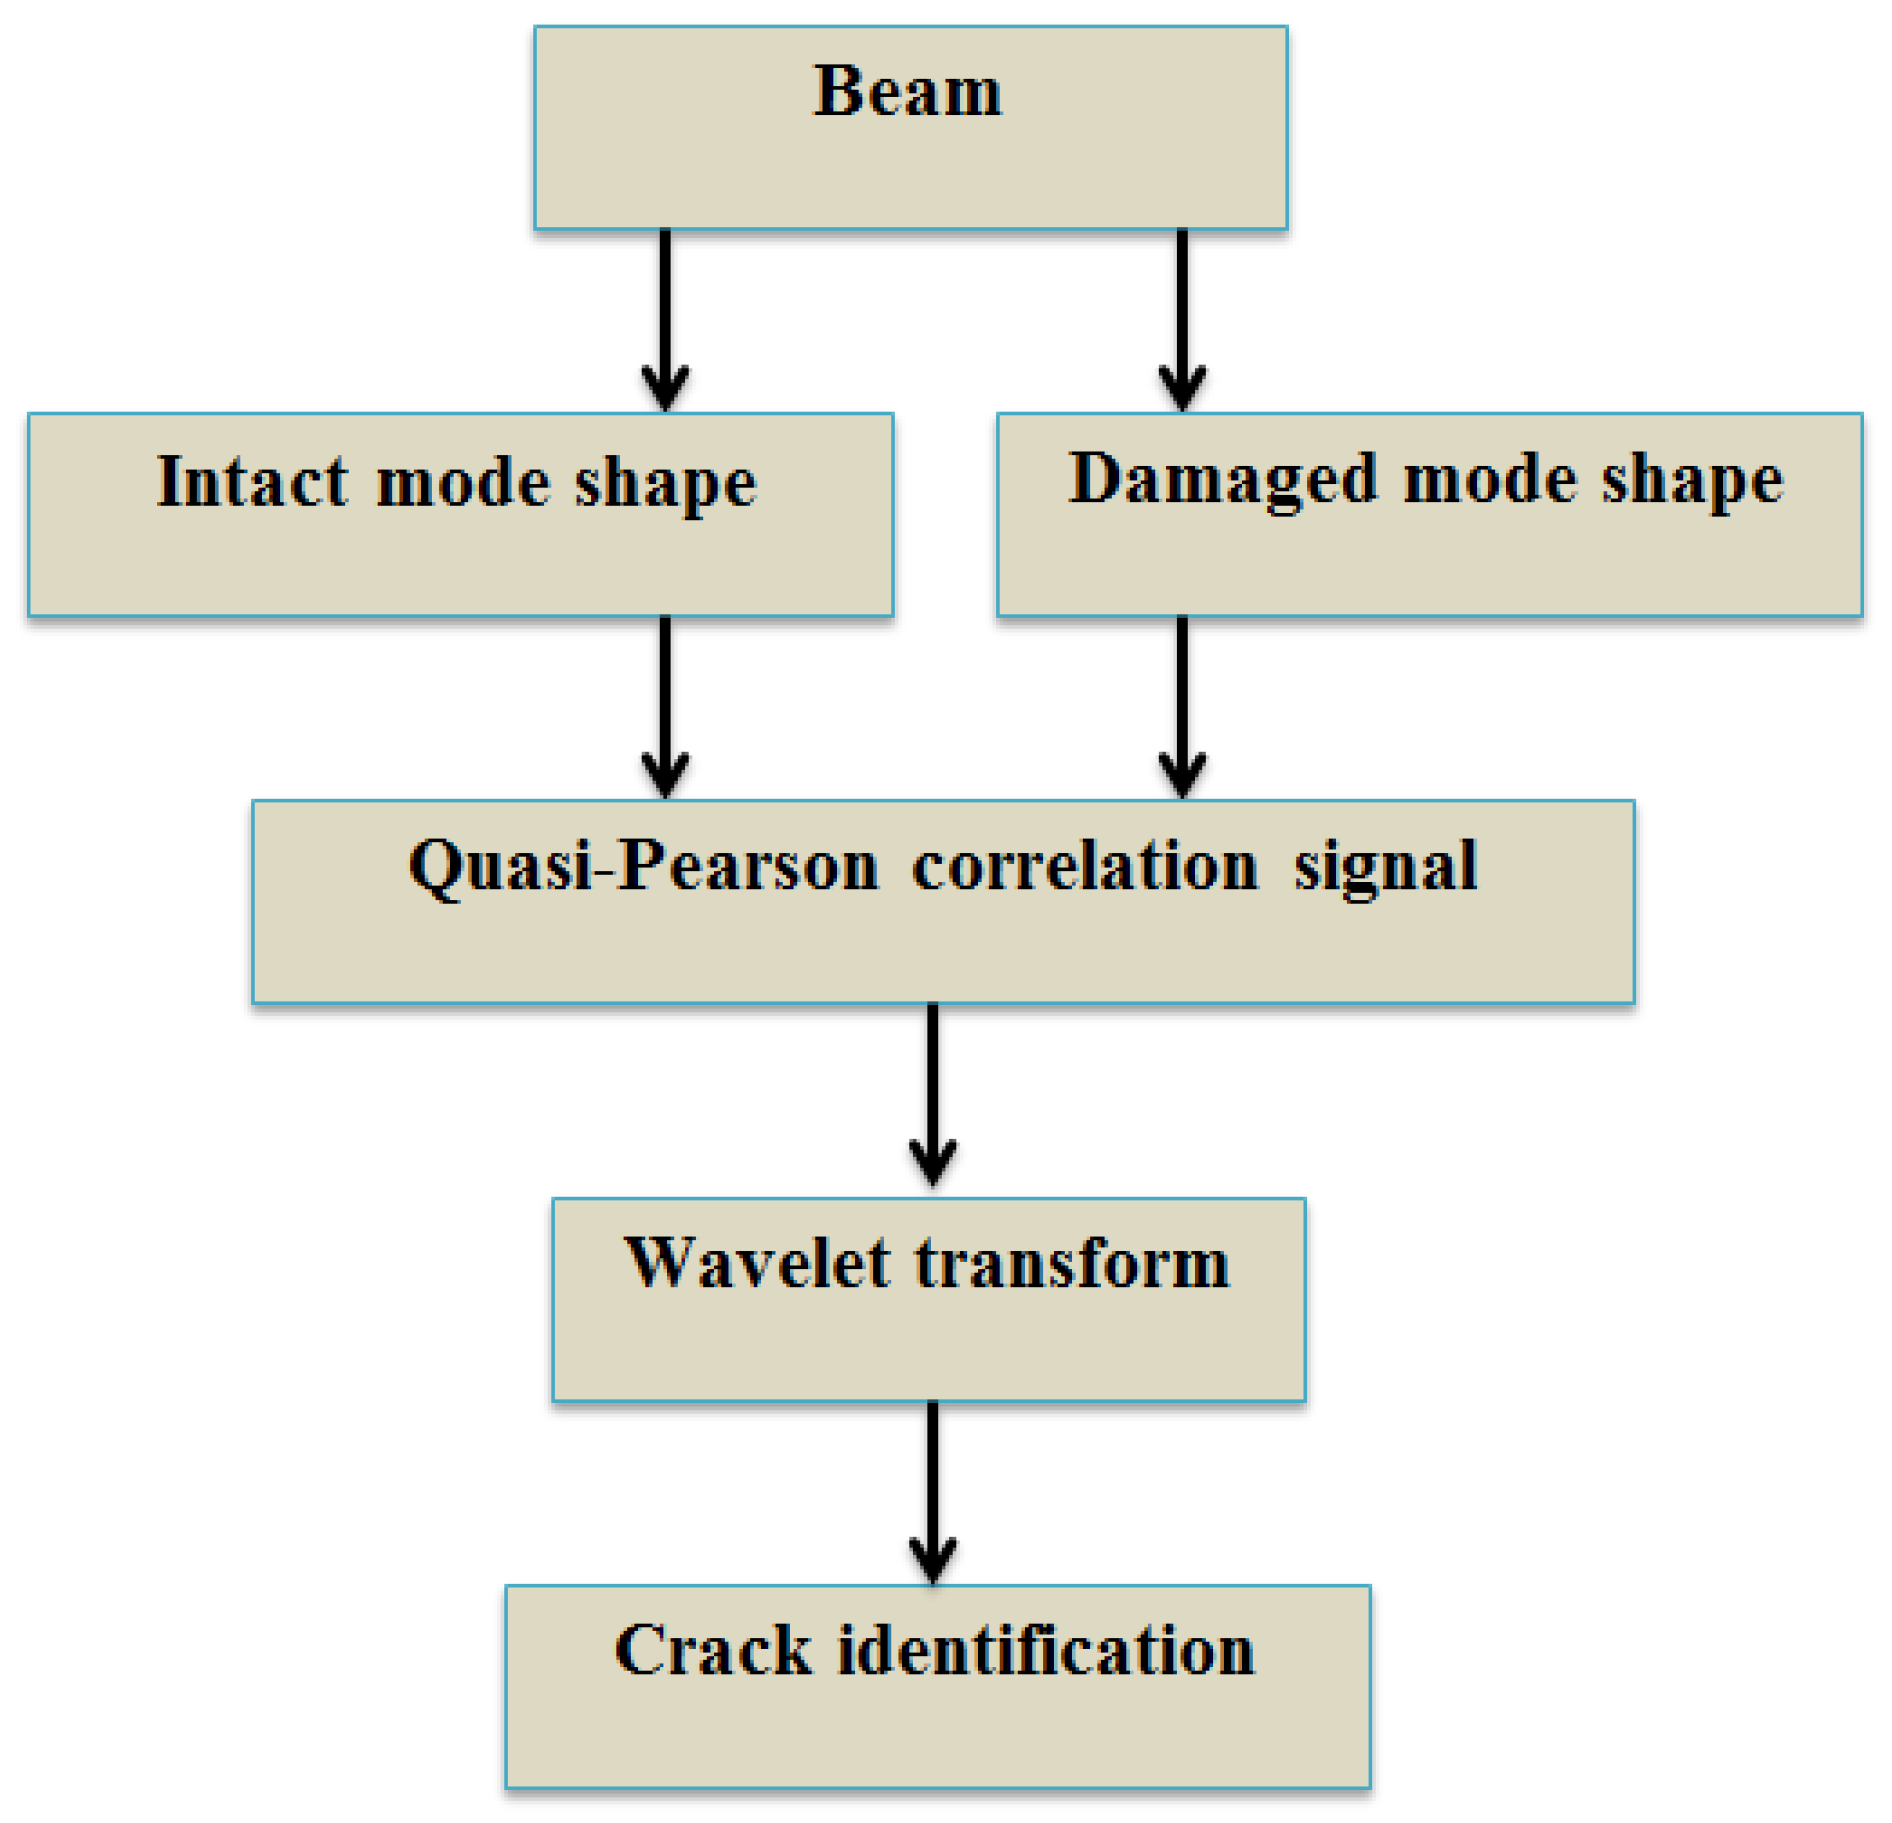
Mathematics 10 02689 g001
Figure 2. Flowchart of beam structure’s damage detection by combining the abilities of the Pearson-based correlation coefficient and the one-dimensional discrete wavelet transform.
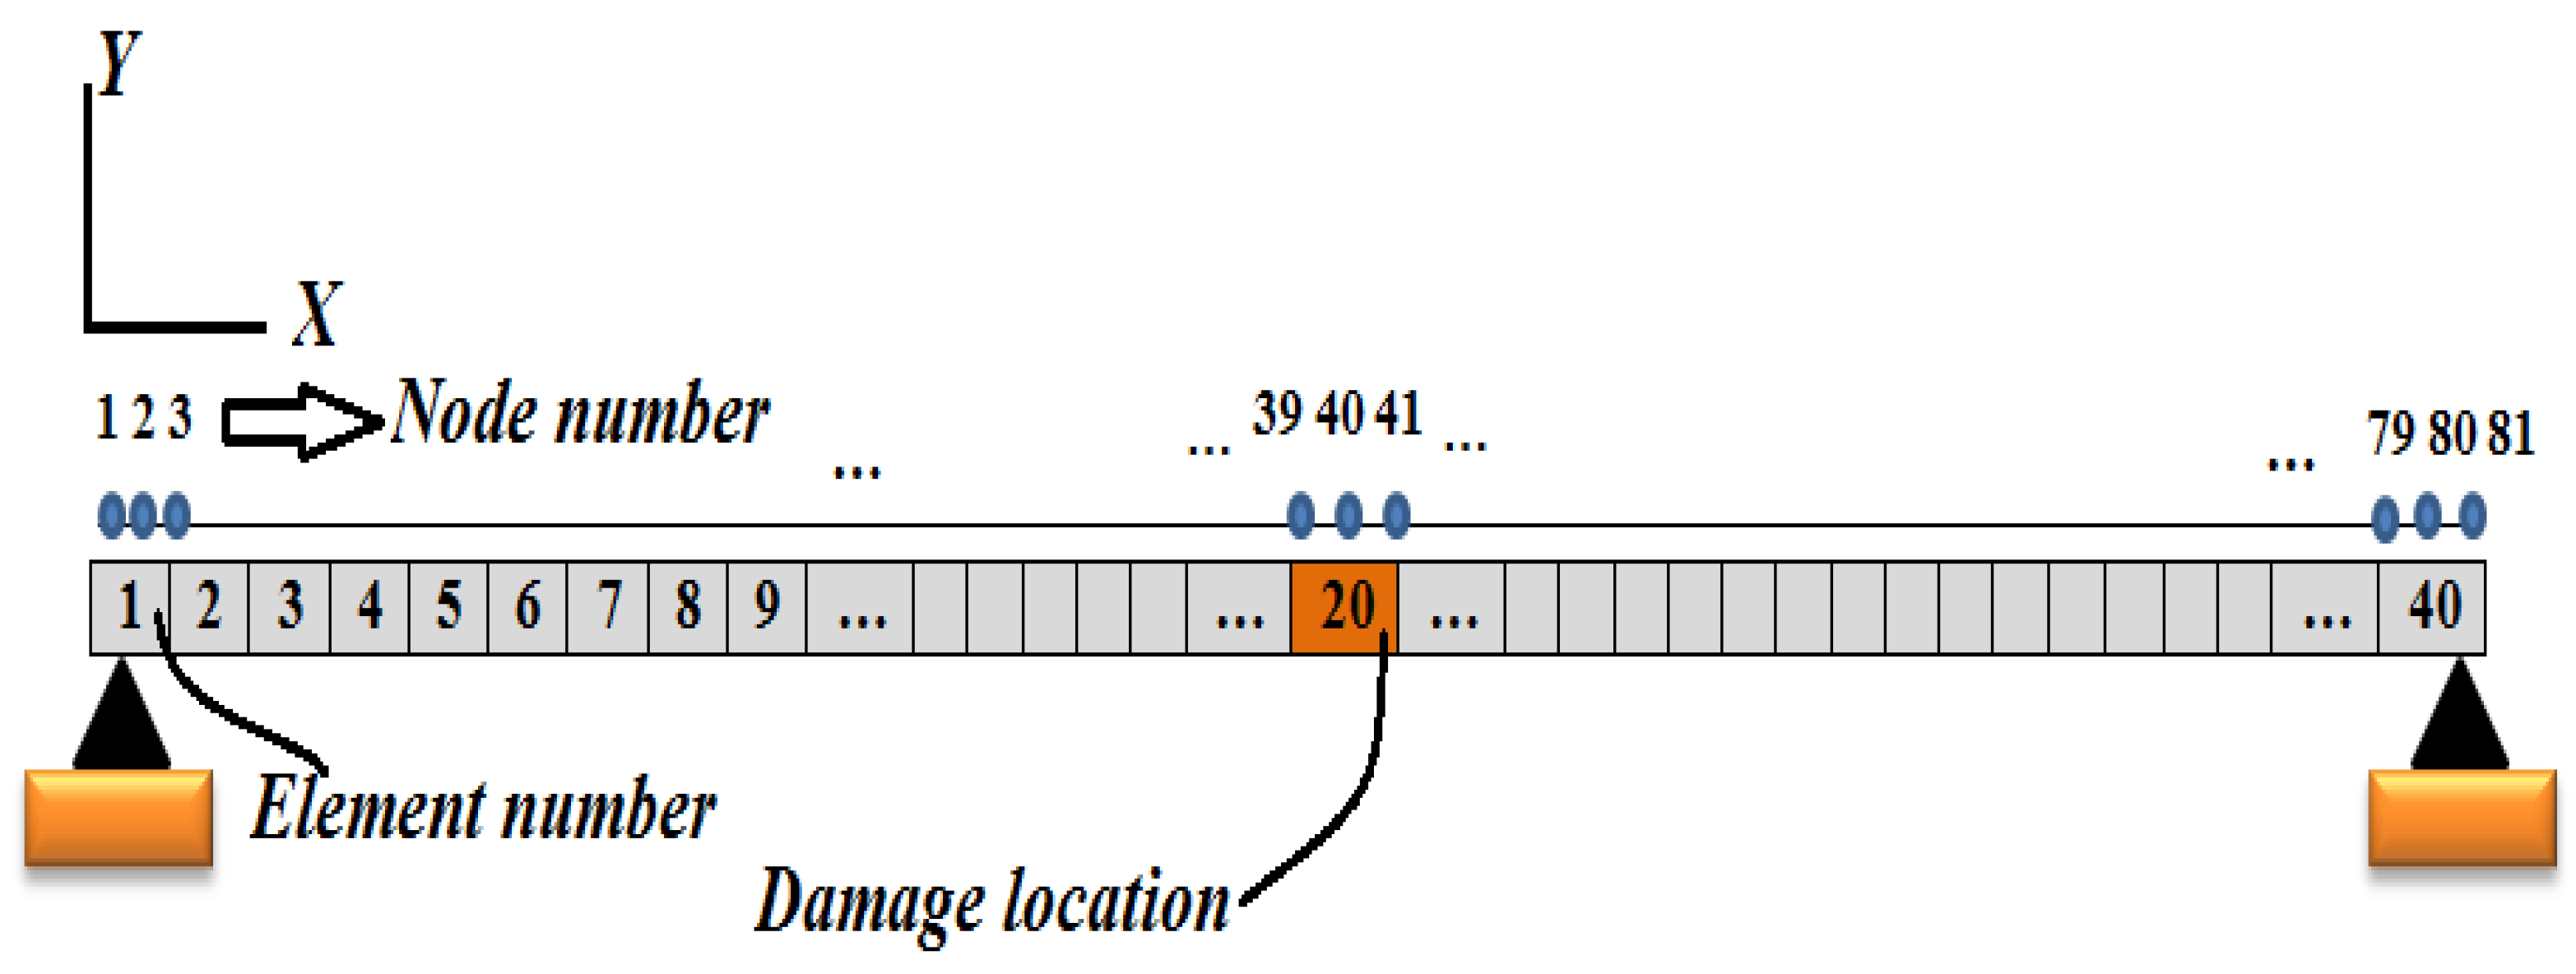
Mathematics 10 02689 g002
Figure 3. The considered beam in numerical investigation.
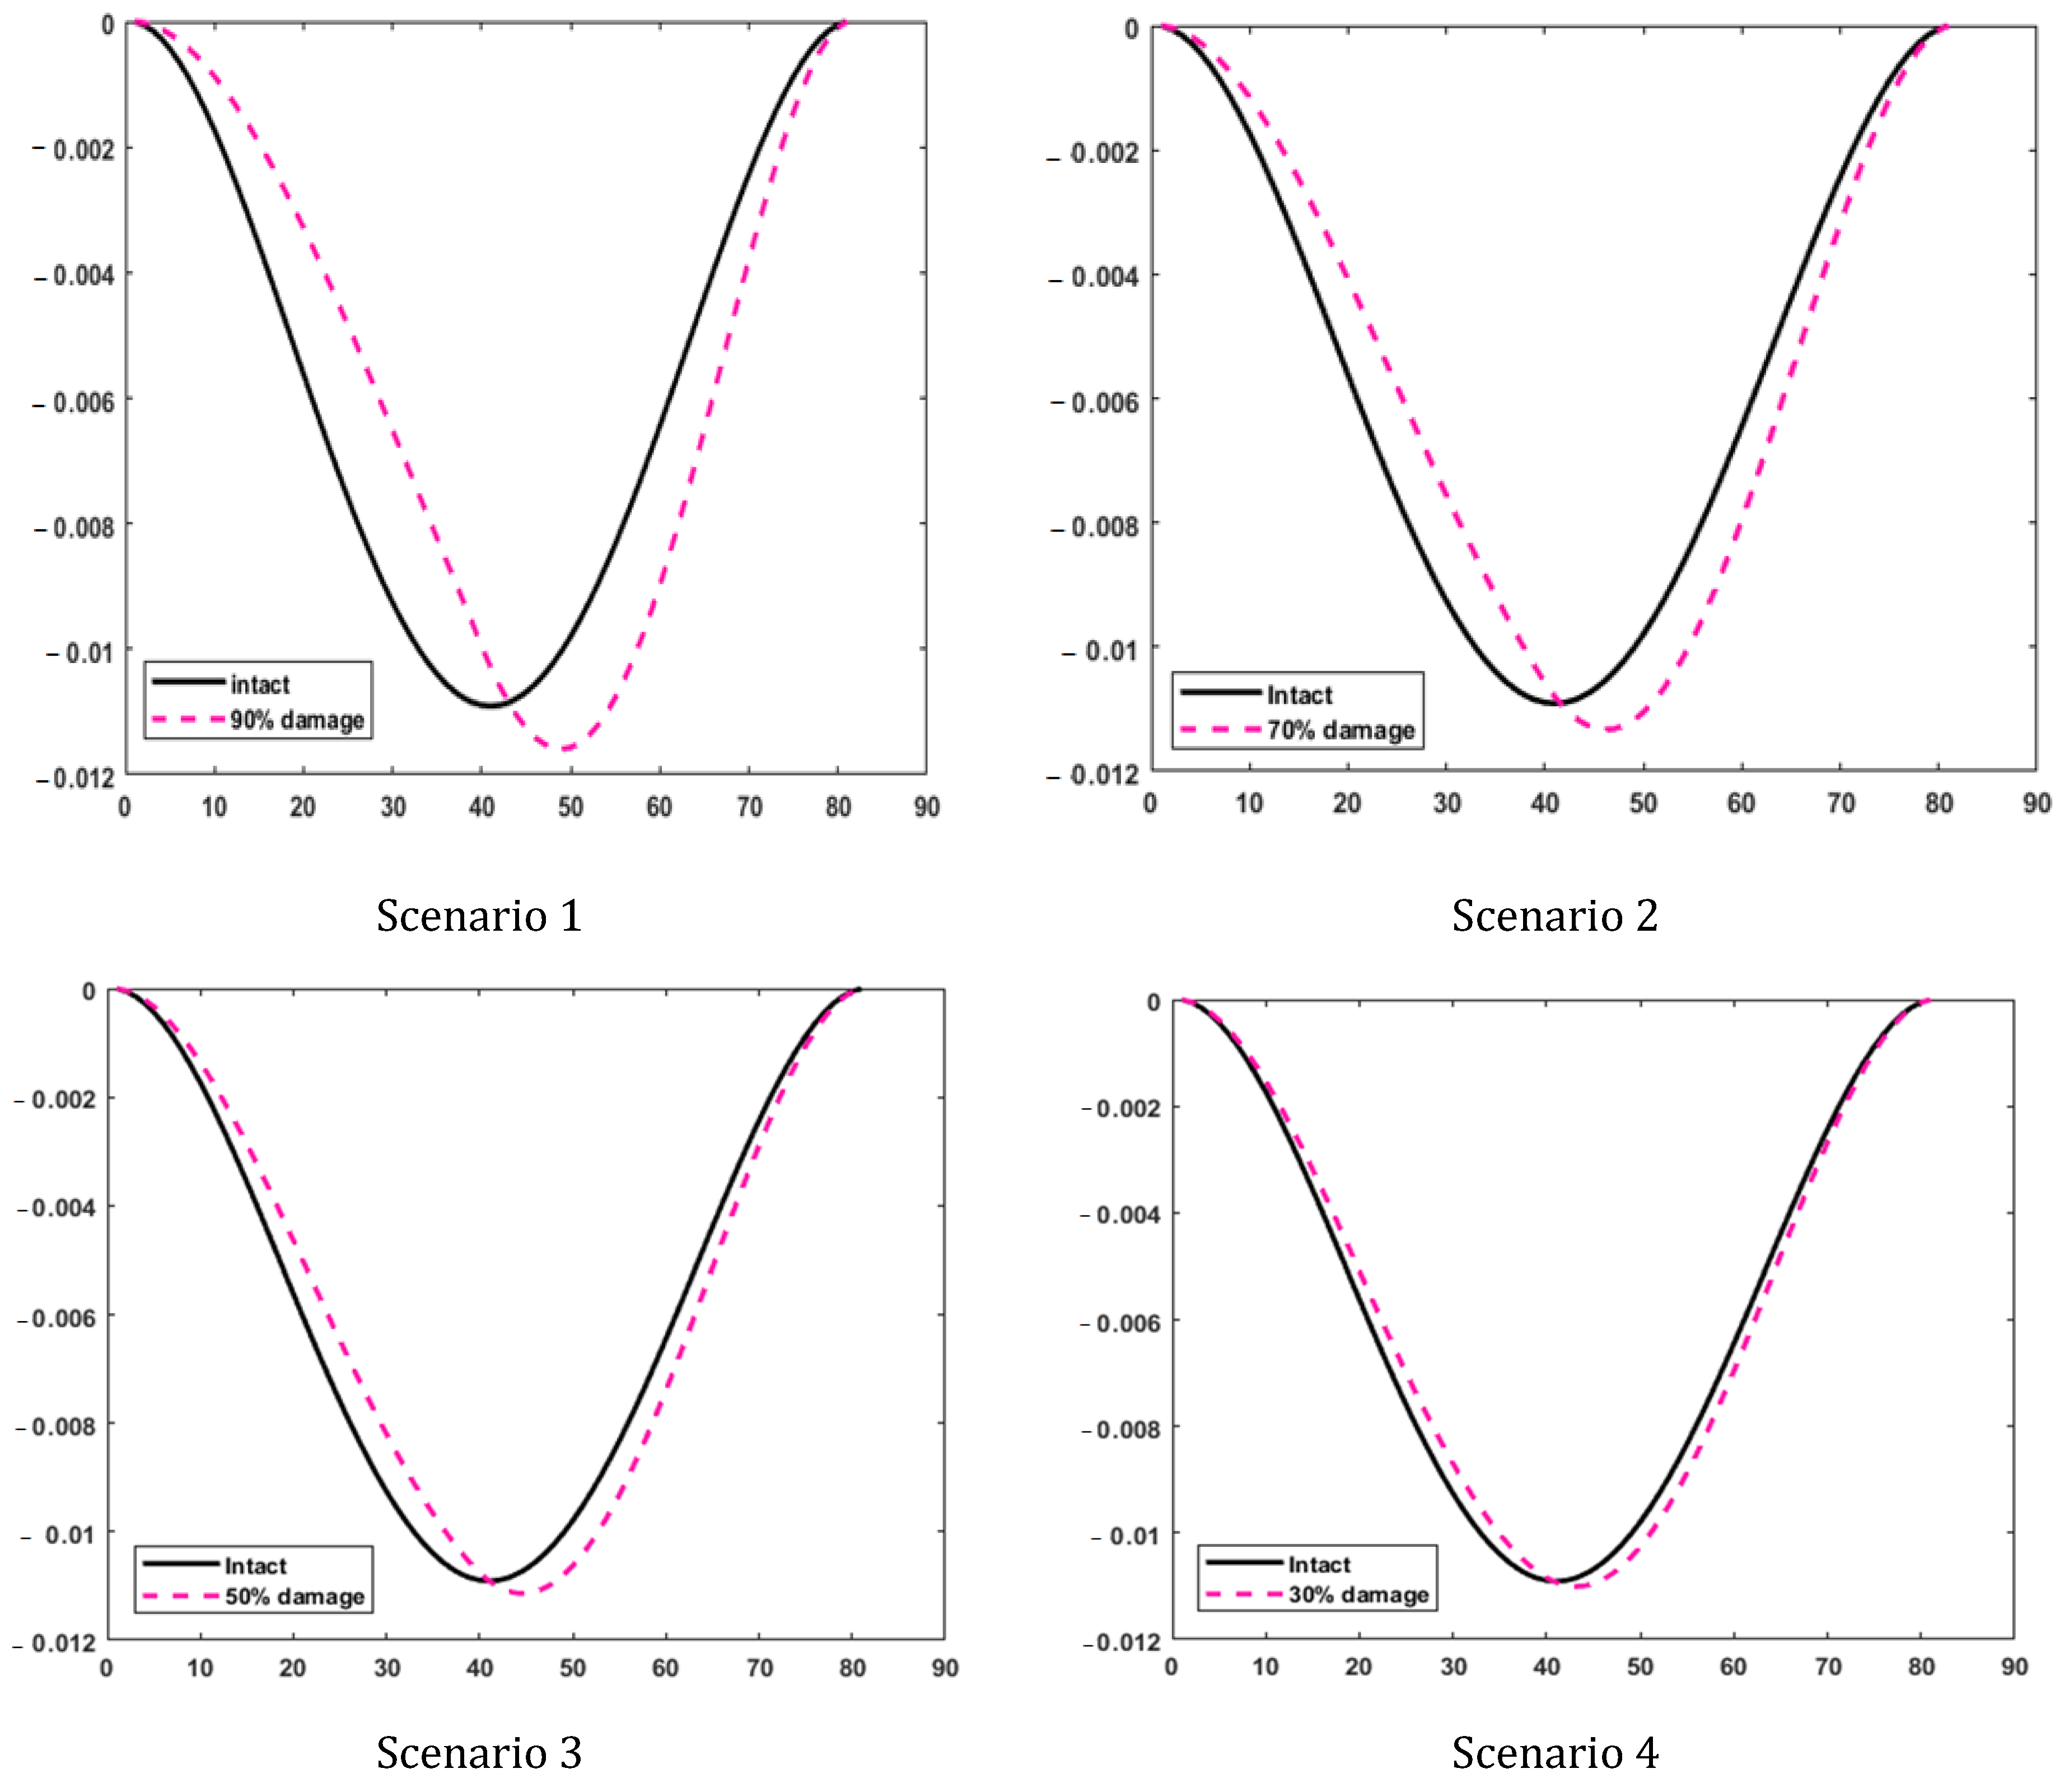
Mathematics 10 02689 g003
Figure 4. Differences in intact and damaged modes for four considered damage scenarios.
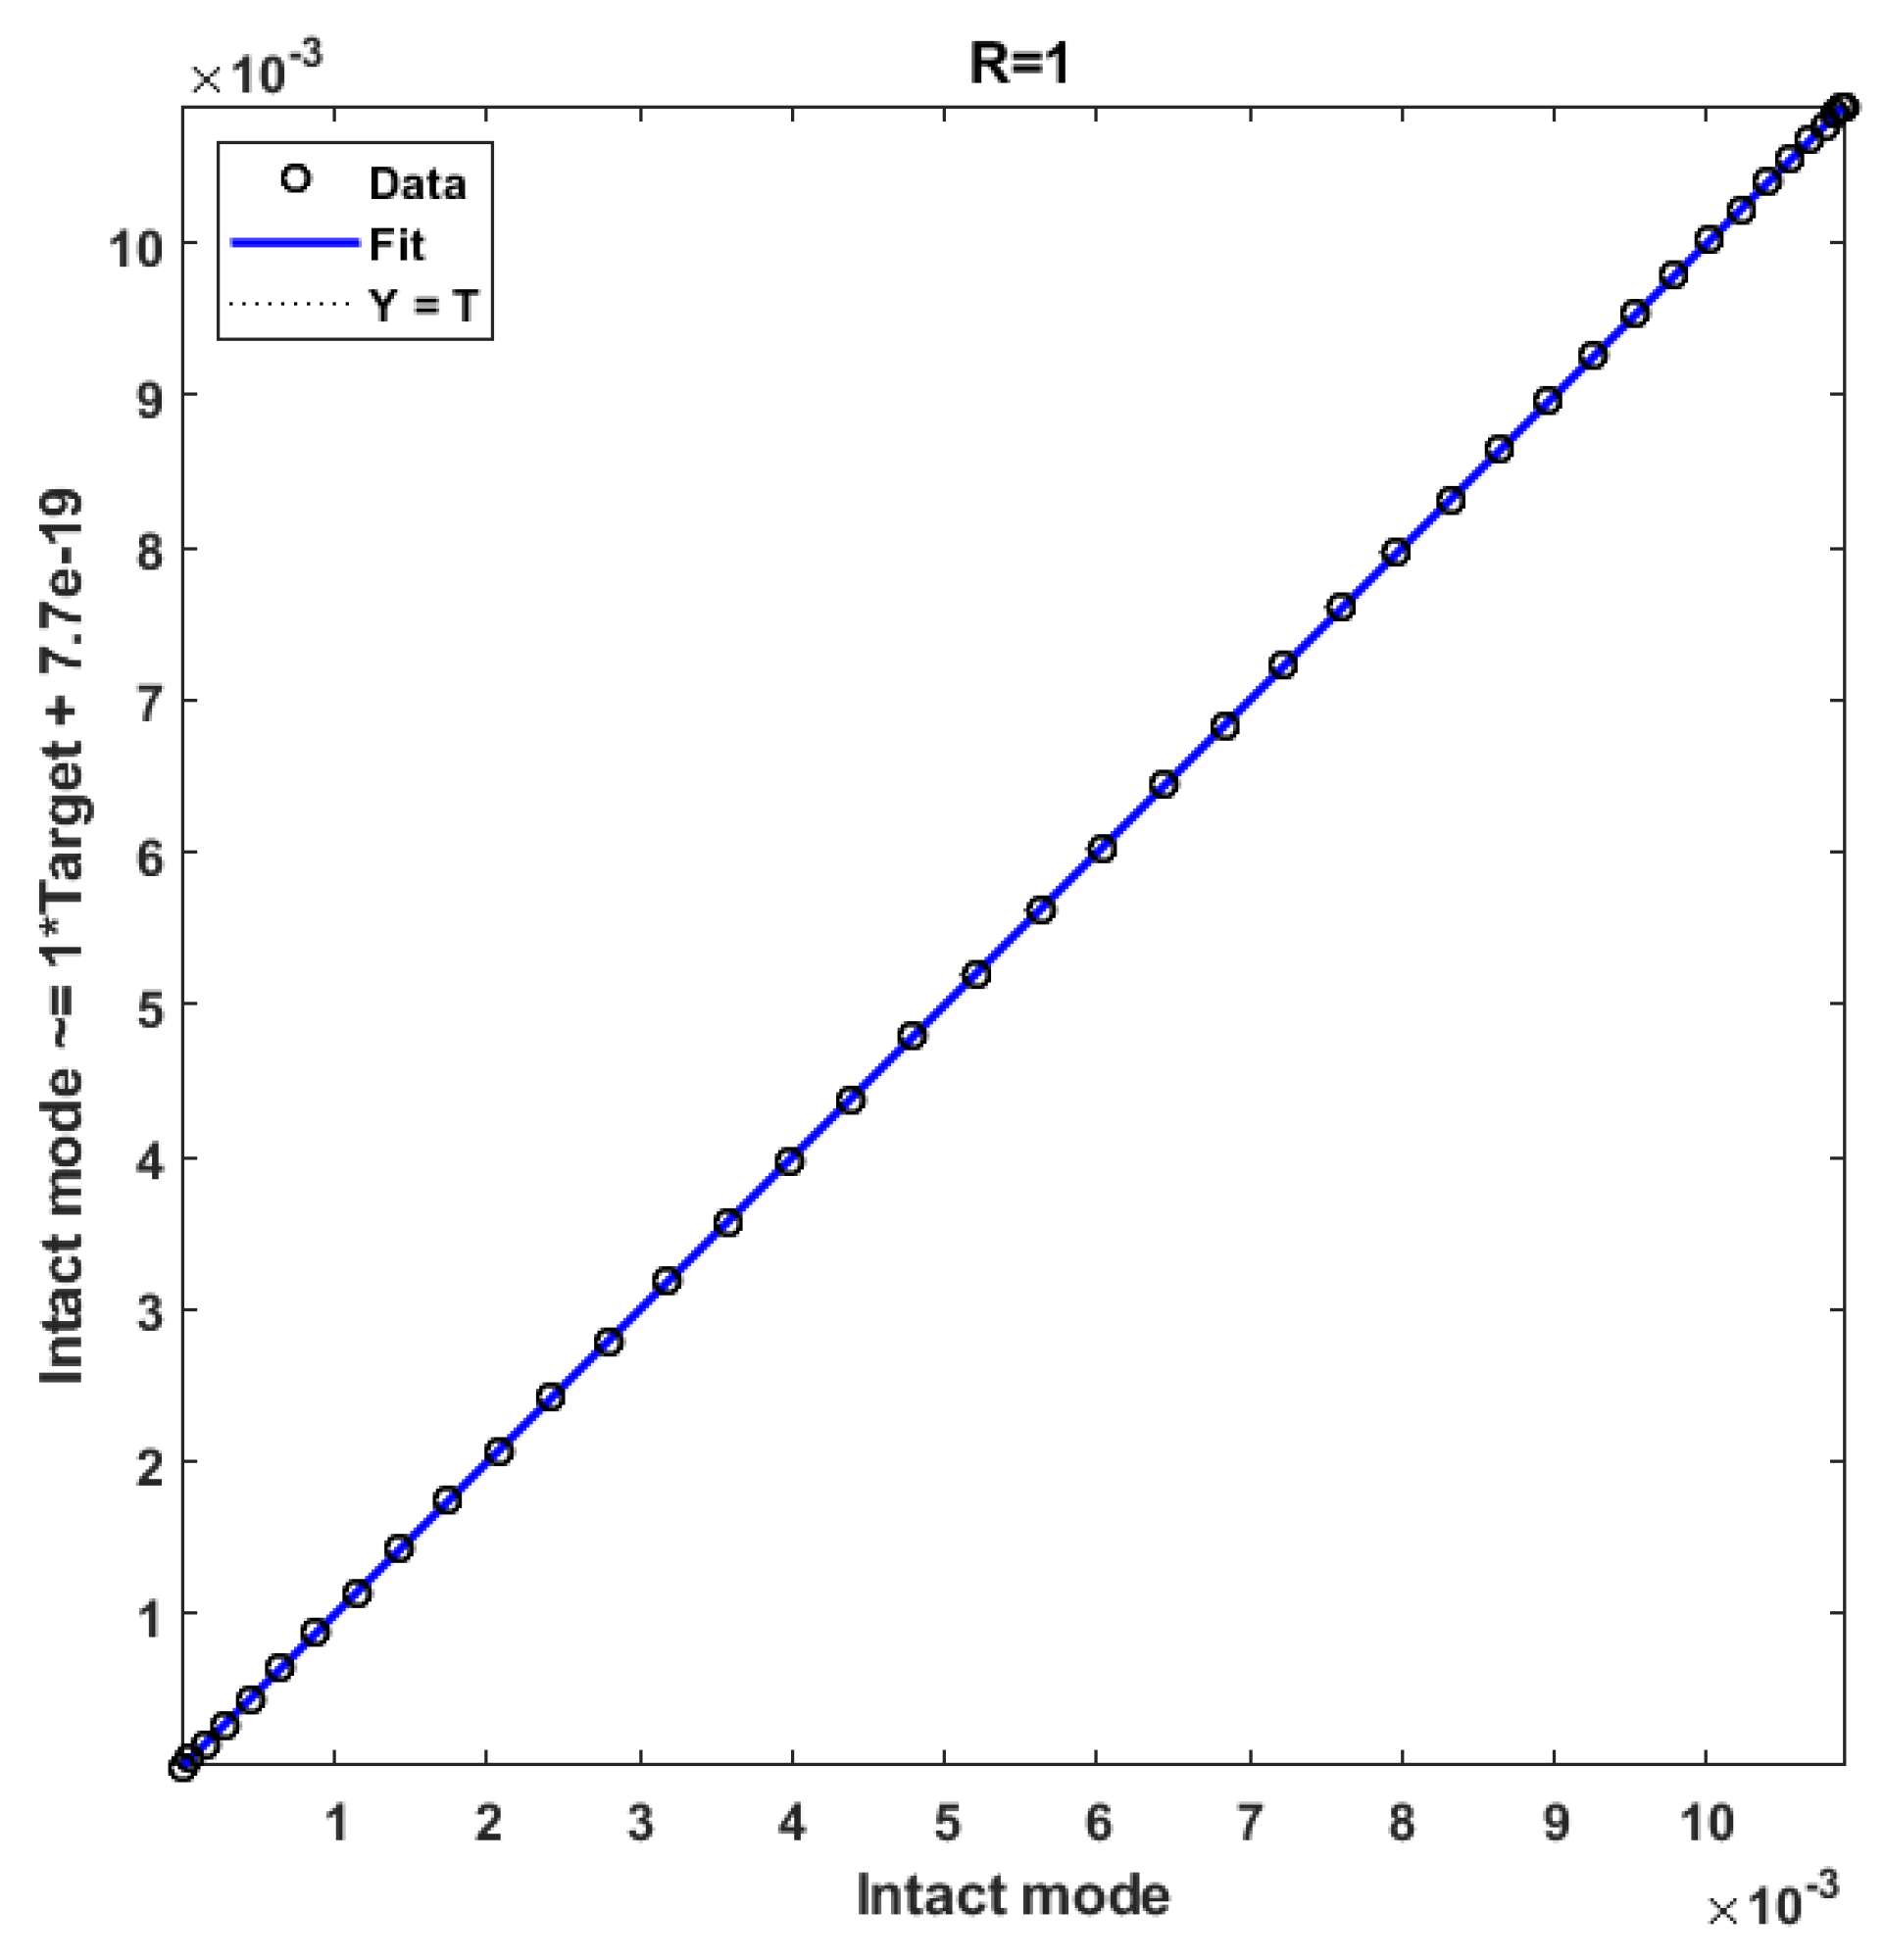
Mathematics 10 02689 g004
Figure 5. Regression diagram for two intact modes.
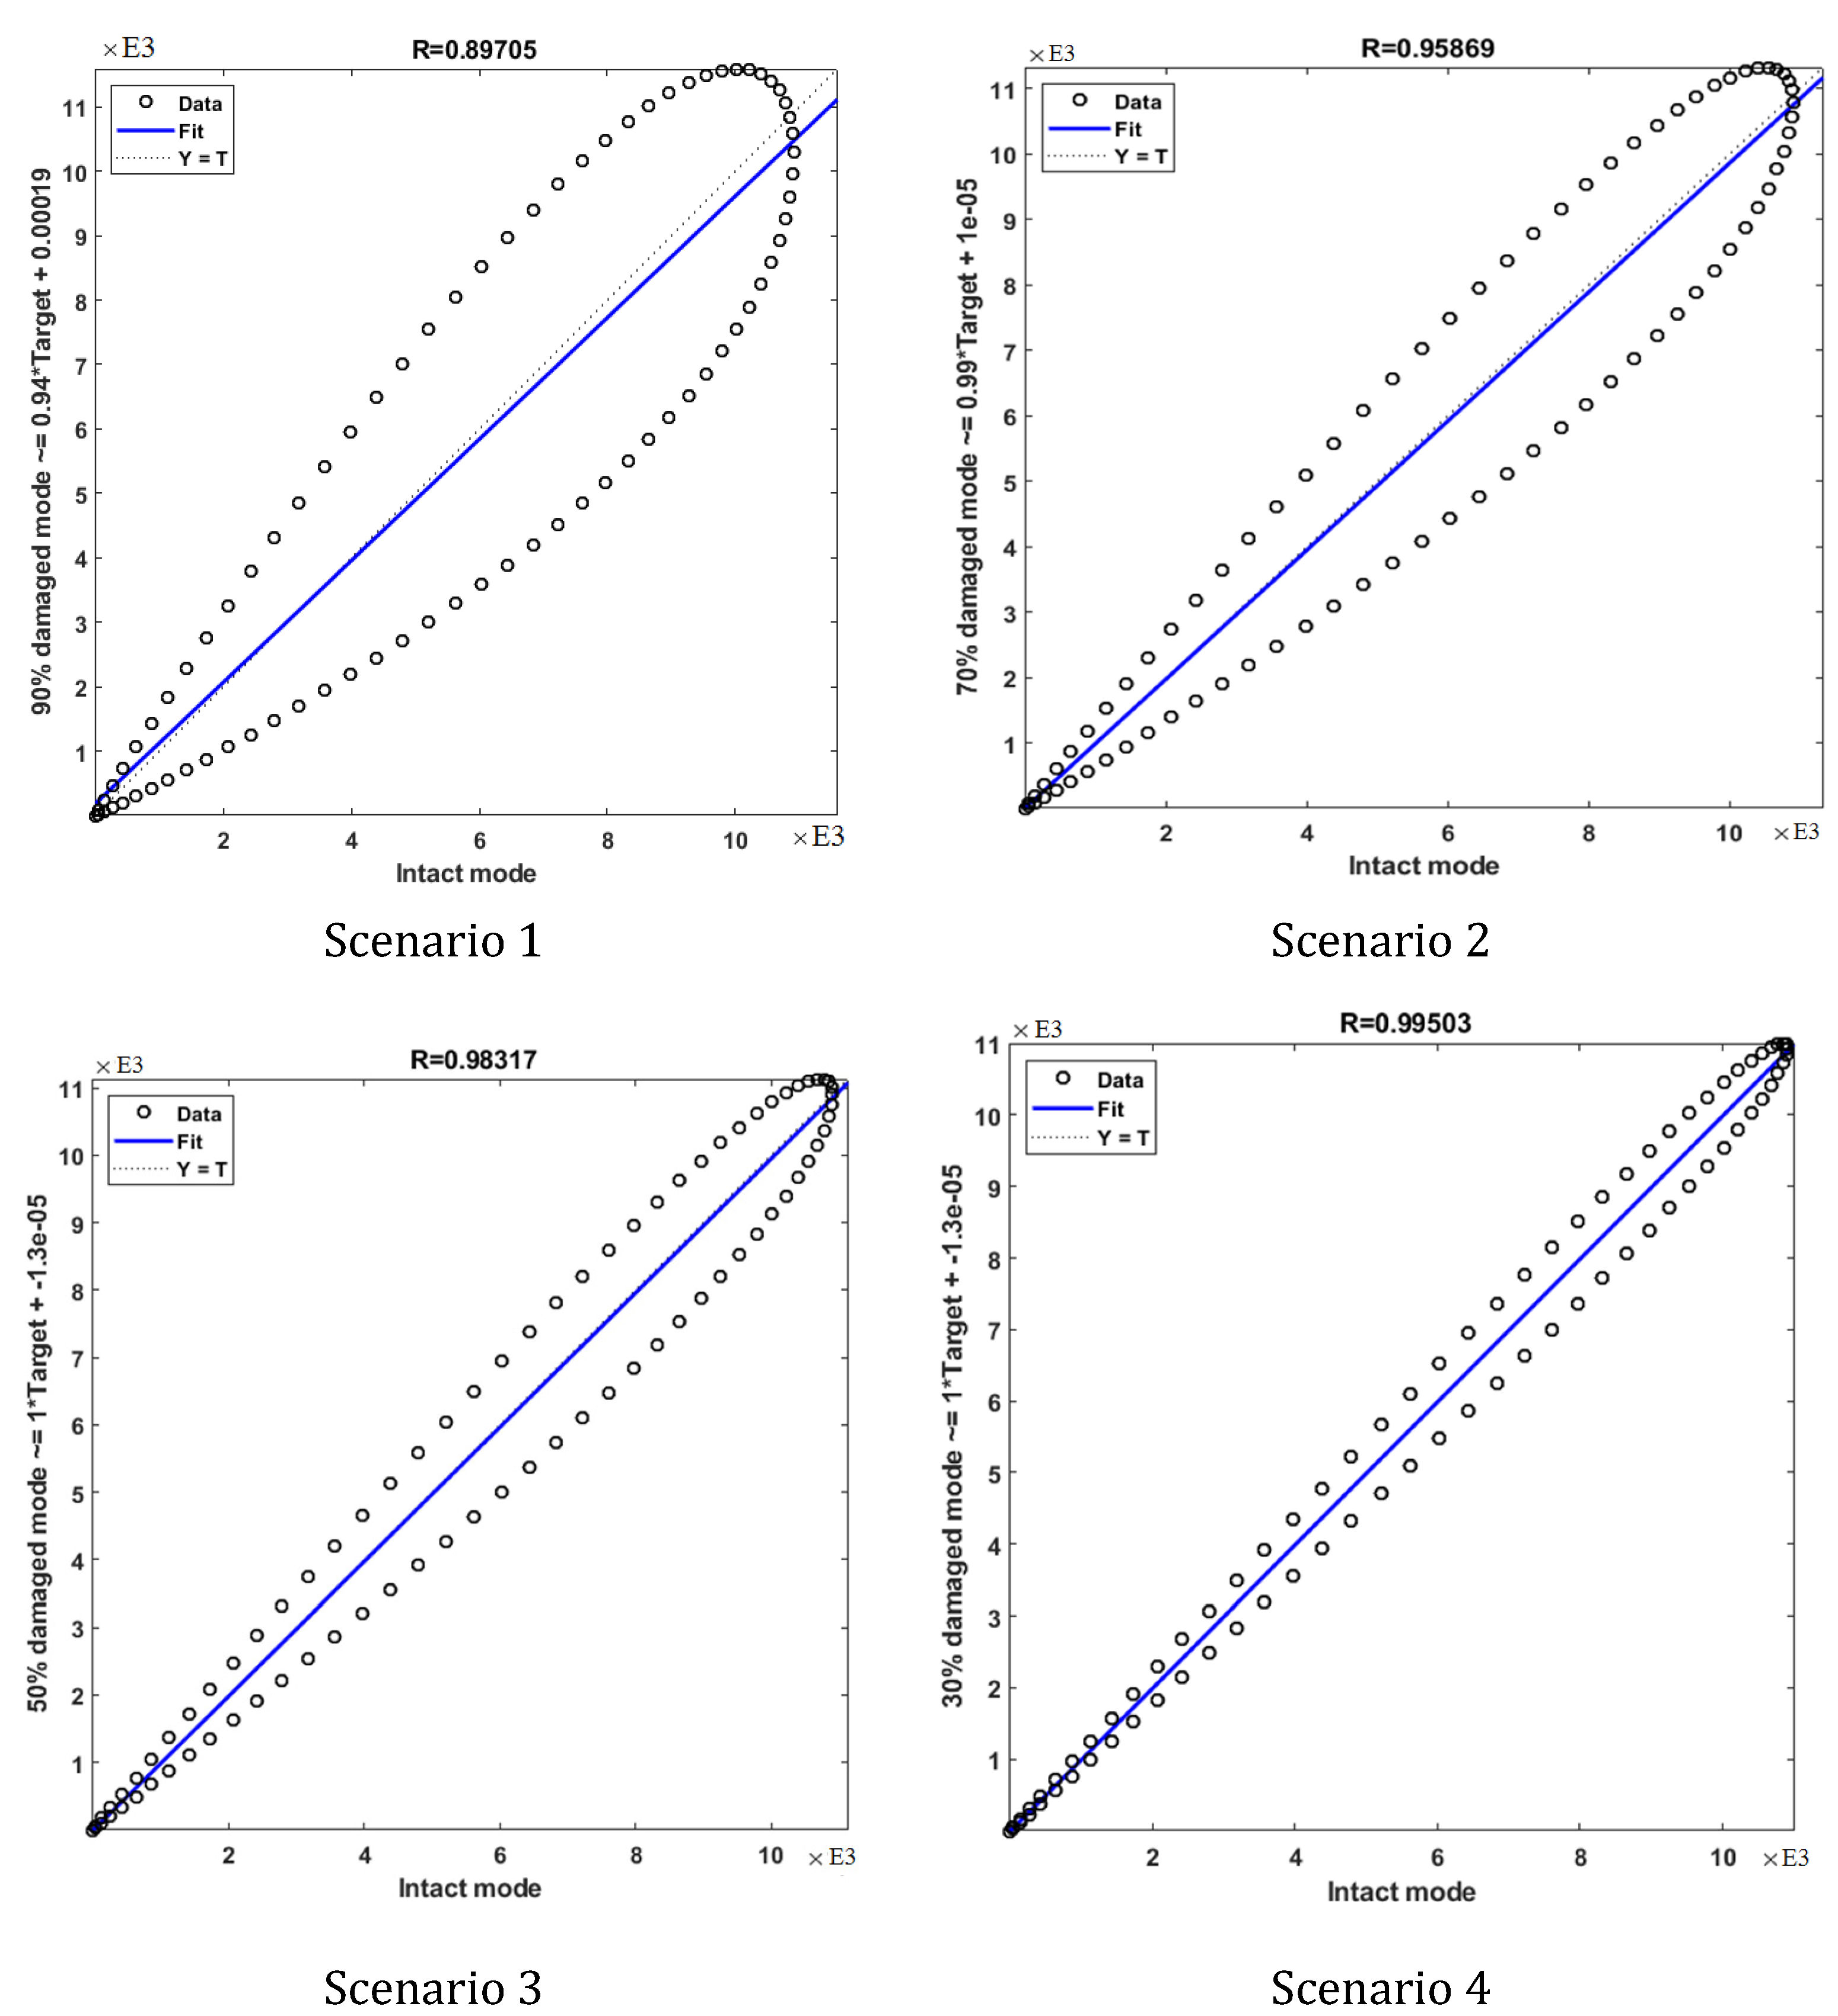
Mathematics 10 02689 g005
Figure 6. Regression diagram for the four considered scenarios.
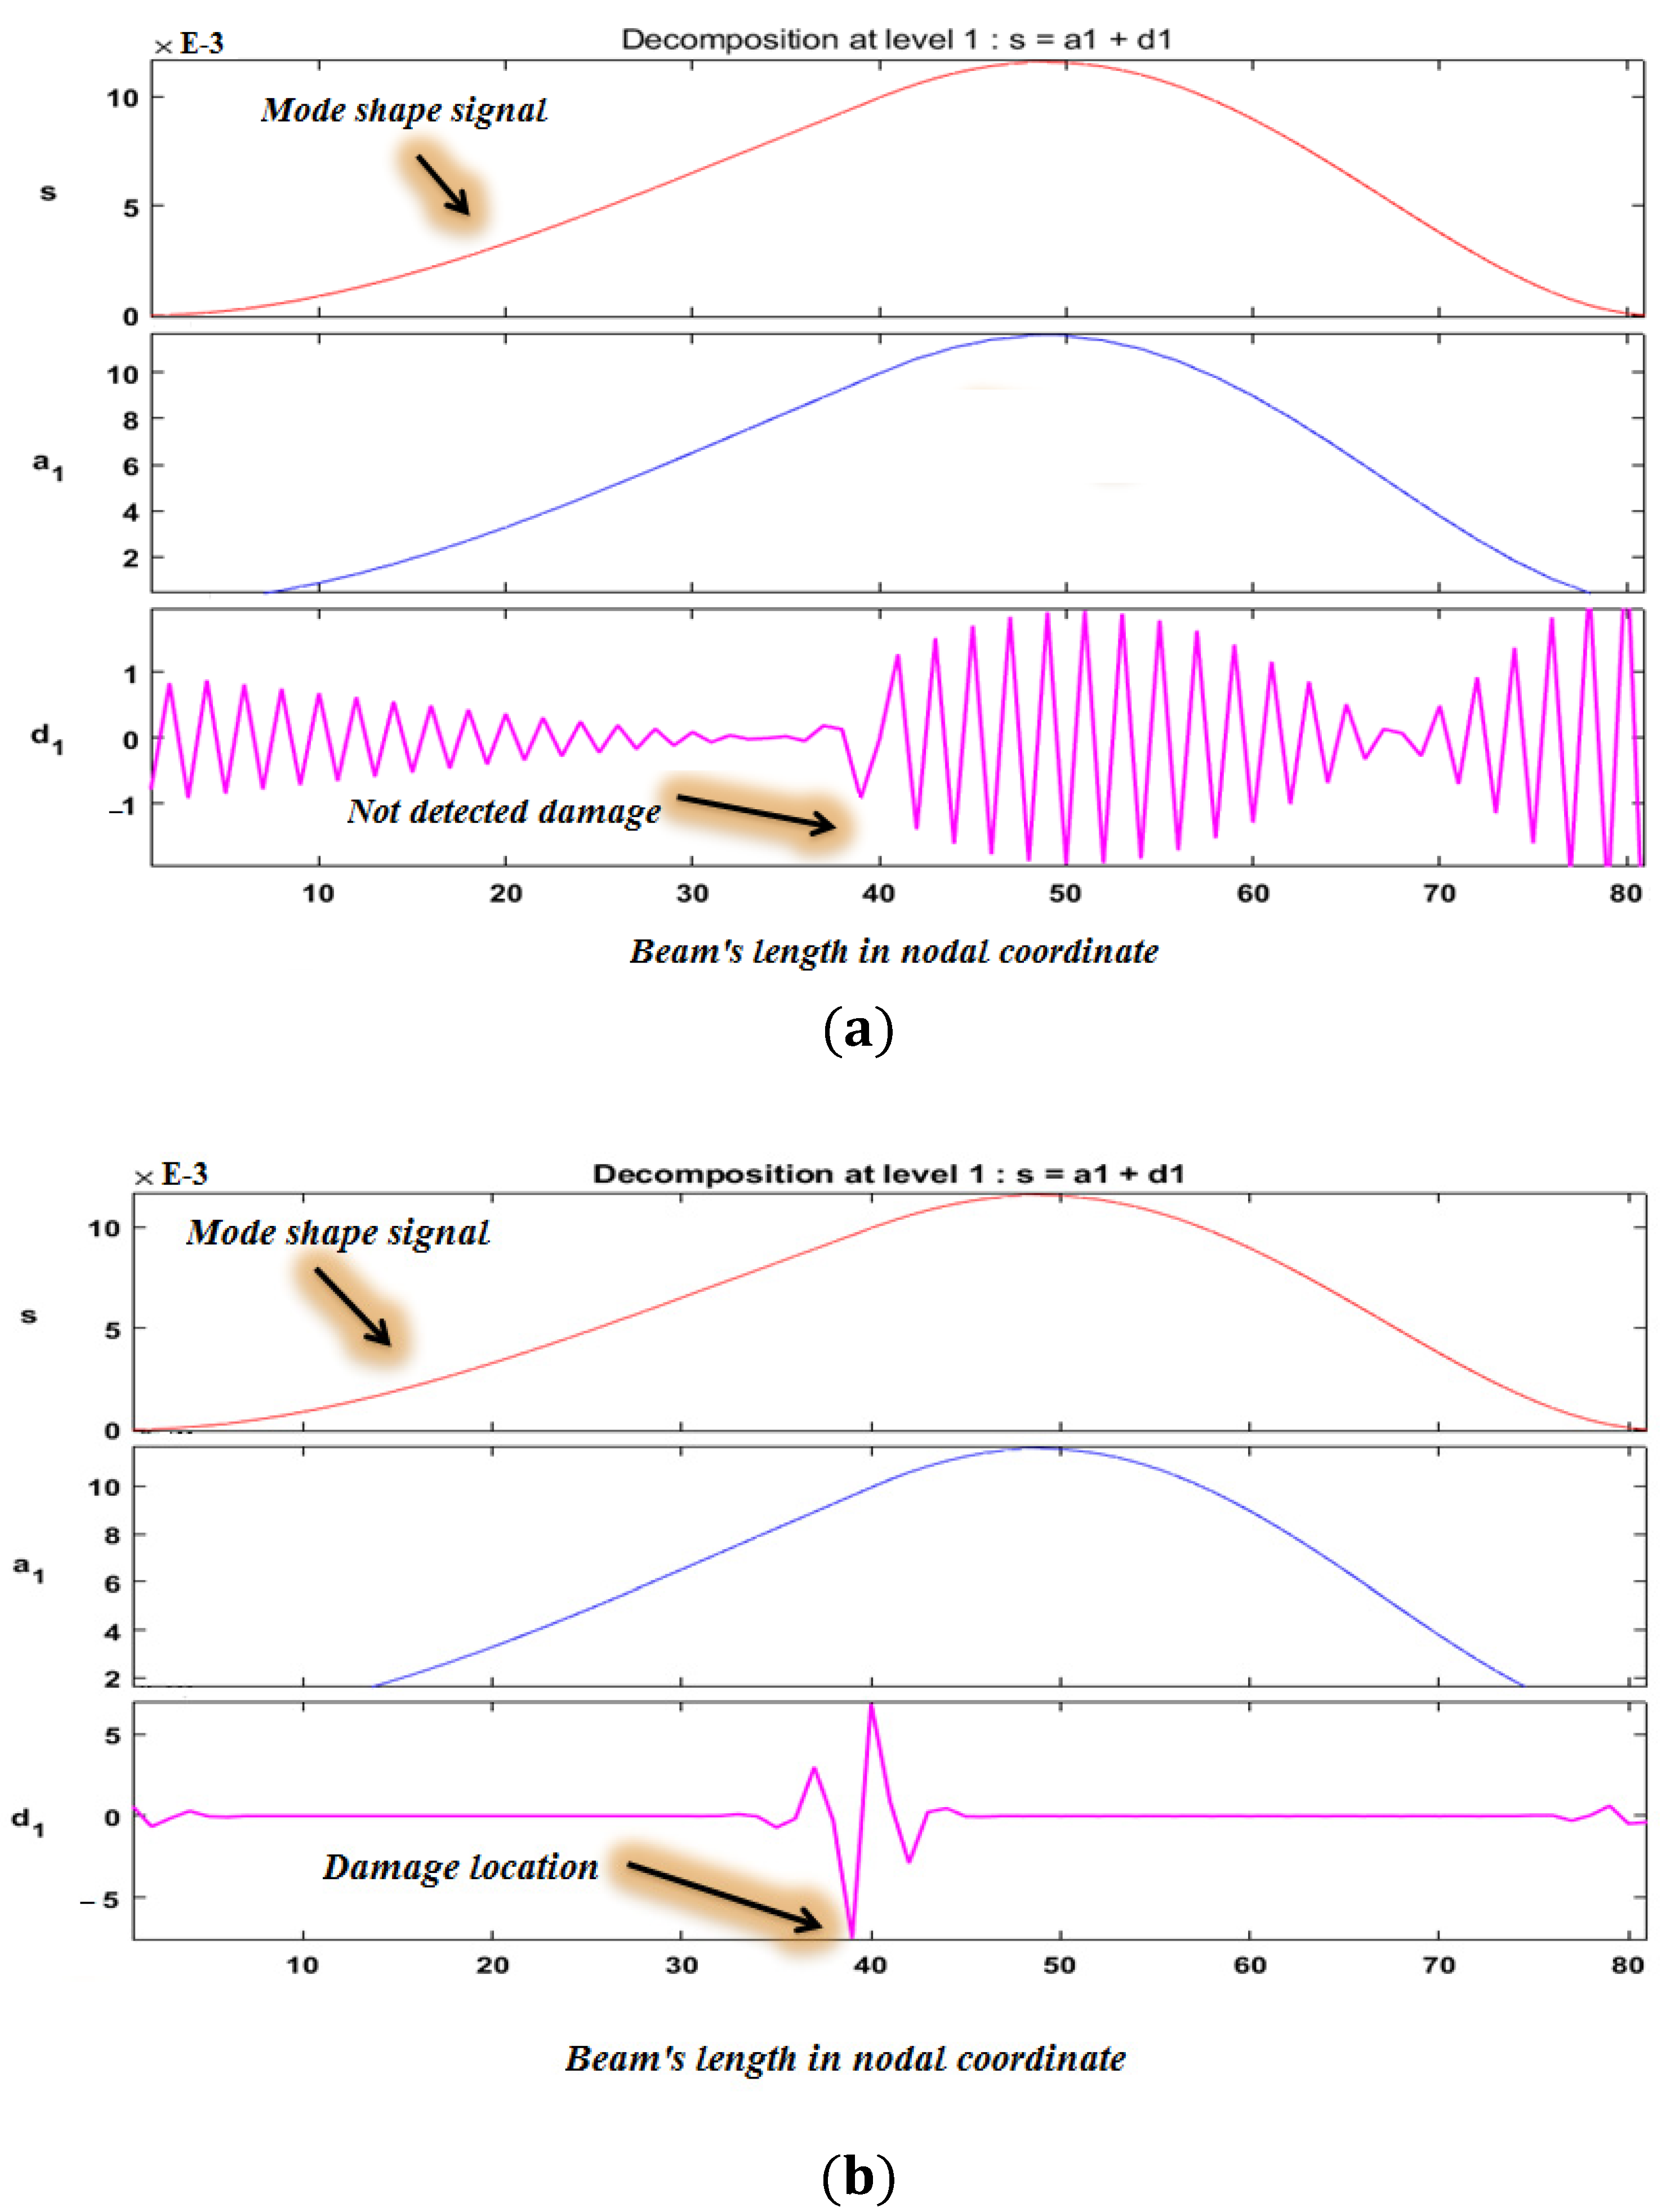
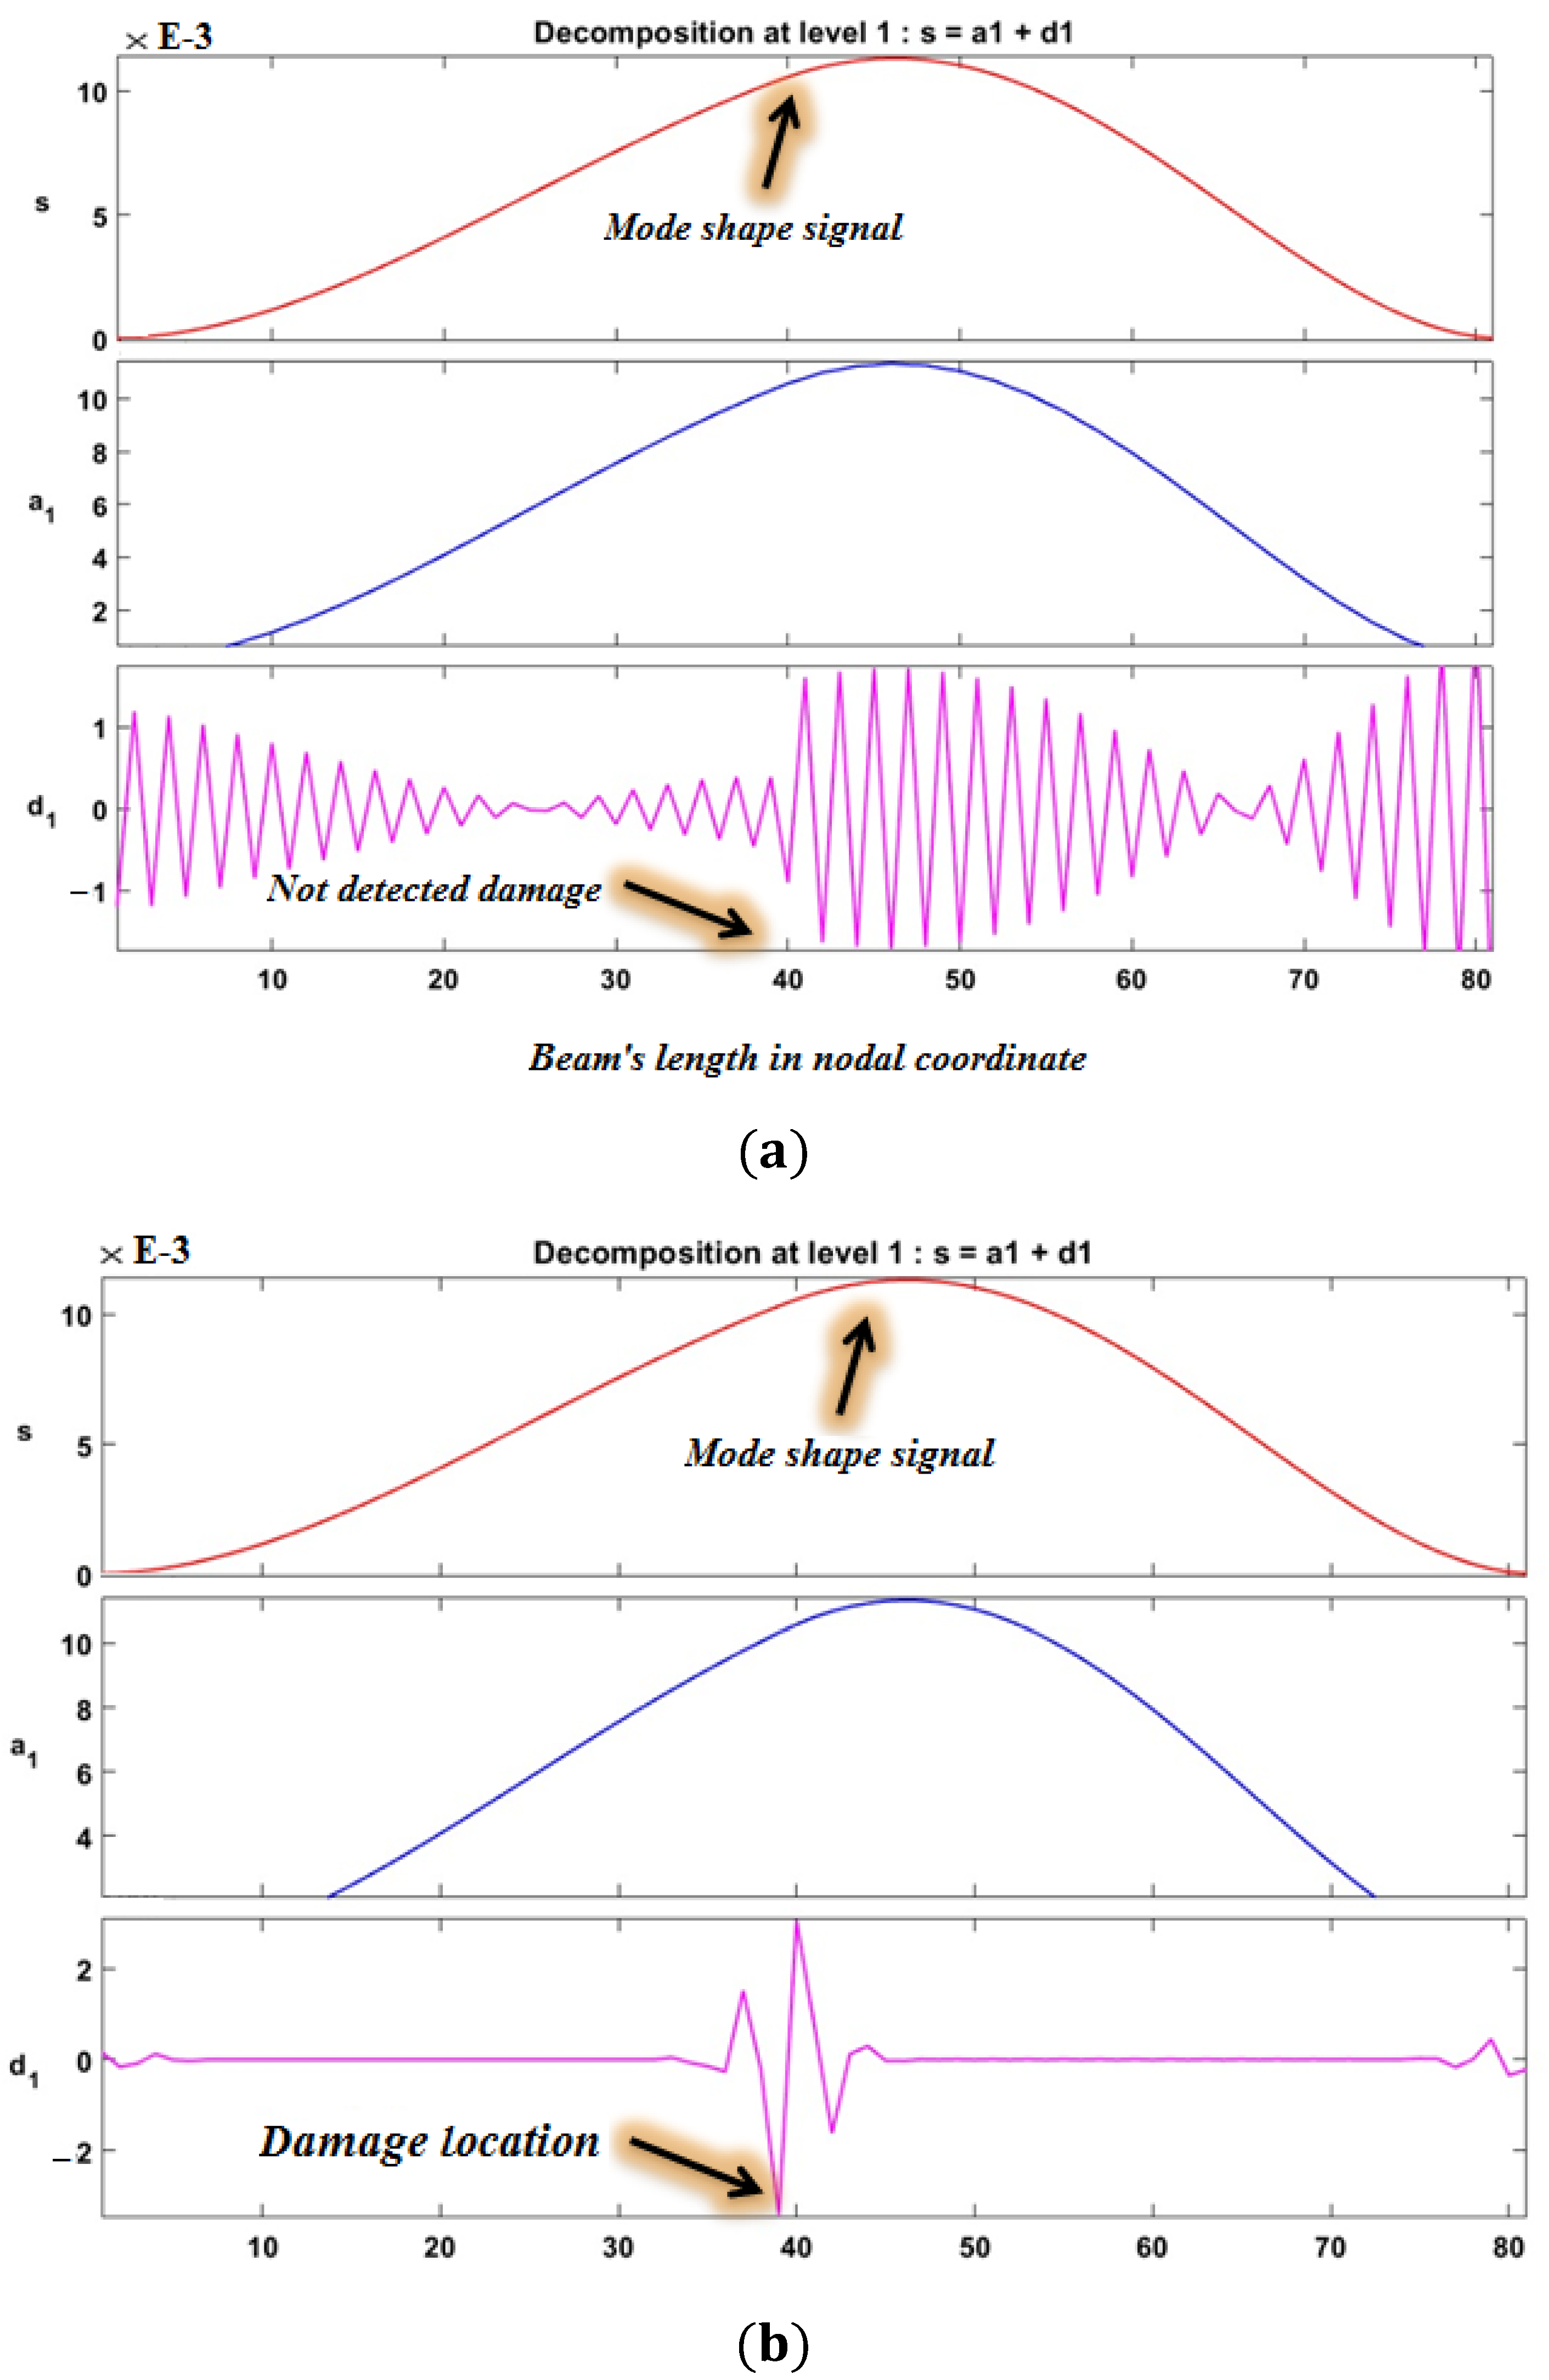
Mathematics 10 02689 g006
Figure 7. The effect of increasing the vanishing moments on the accuracy of damage detection by 1D-DWT from the damaged mode shape signal by 90% damage: (a) vanishing moments = 2, (b) vanishing moments = 5.
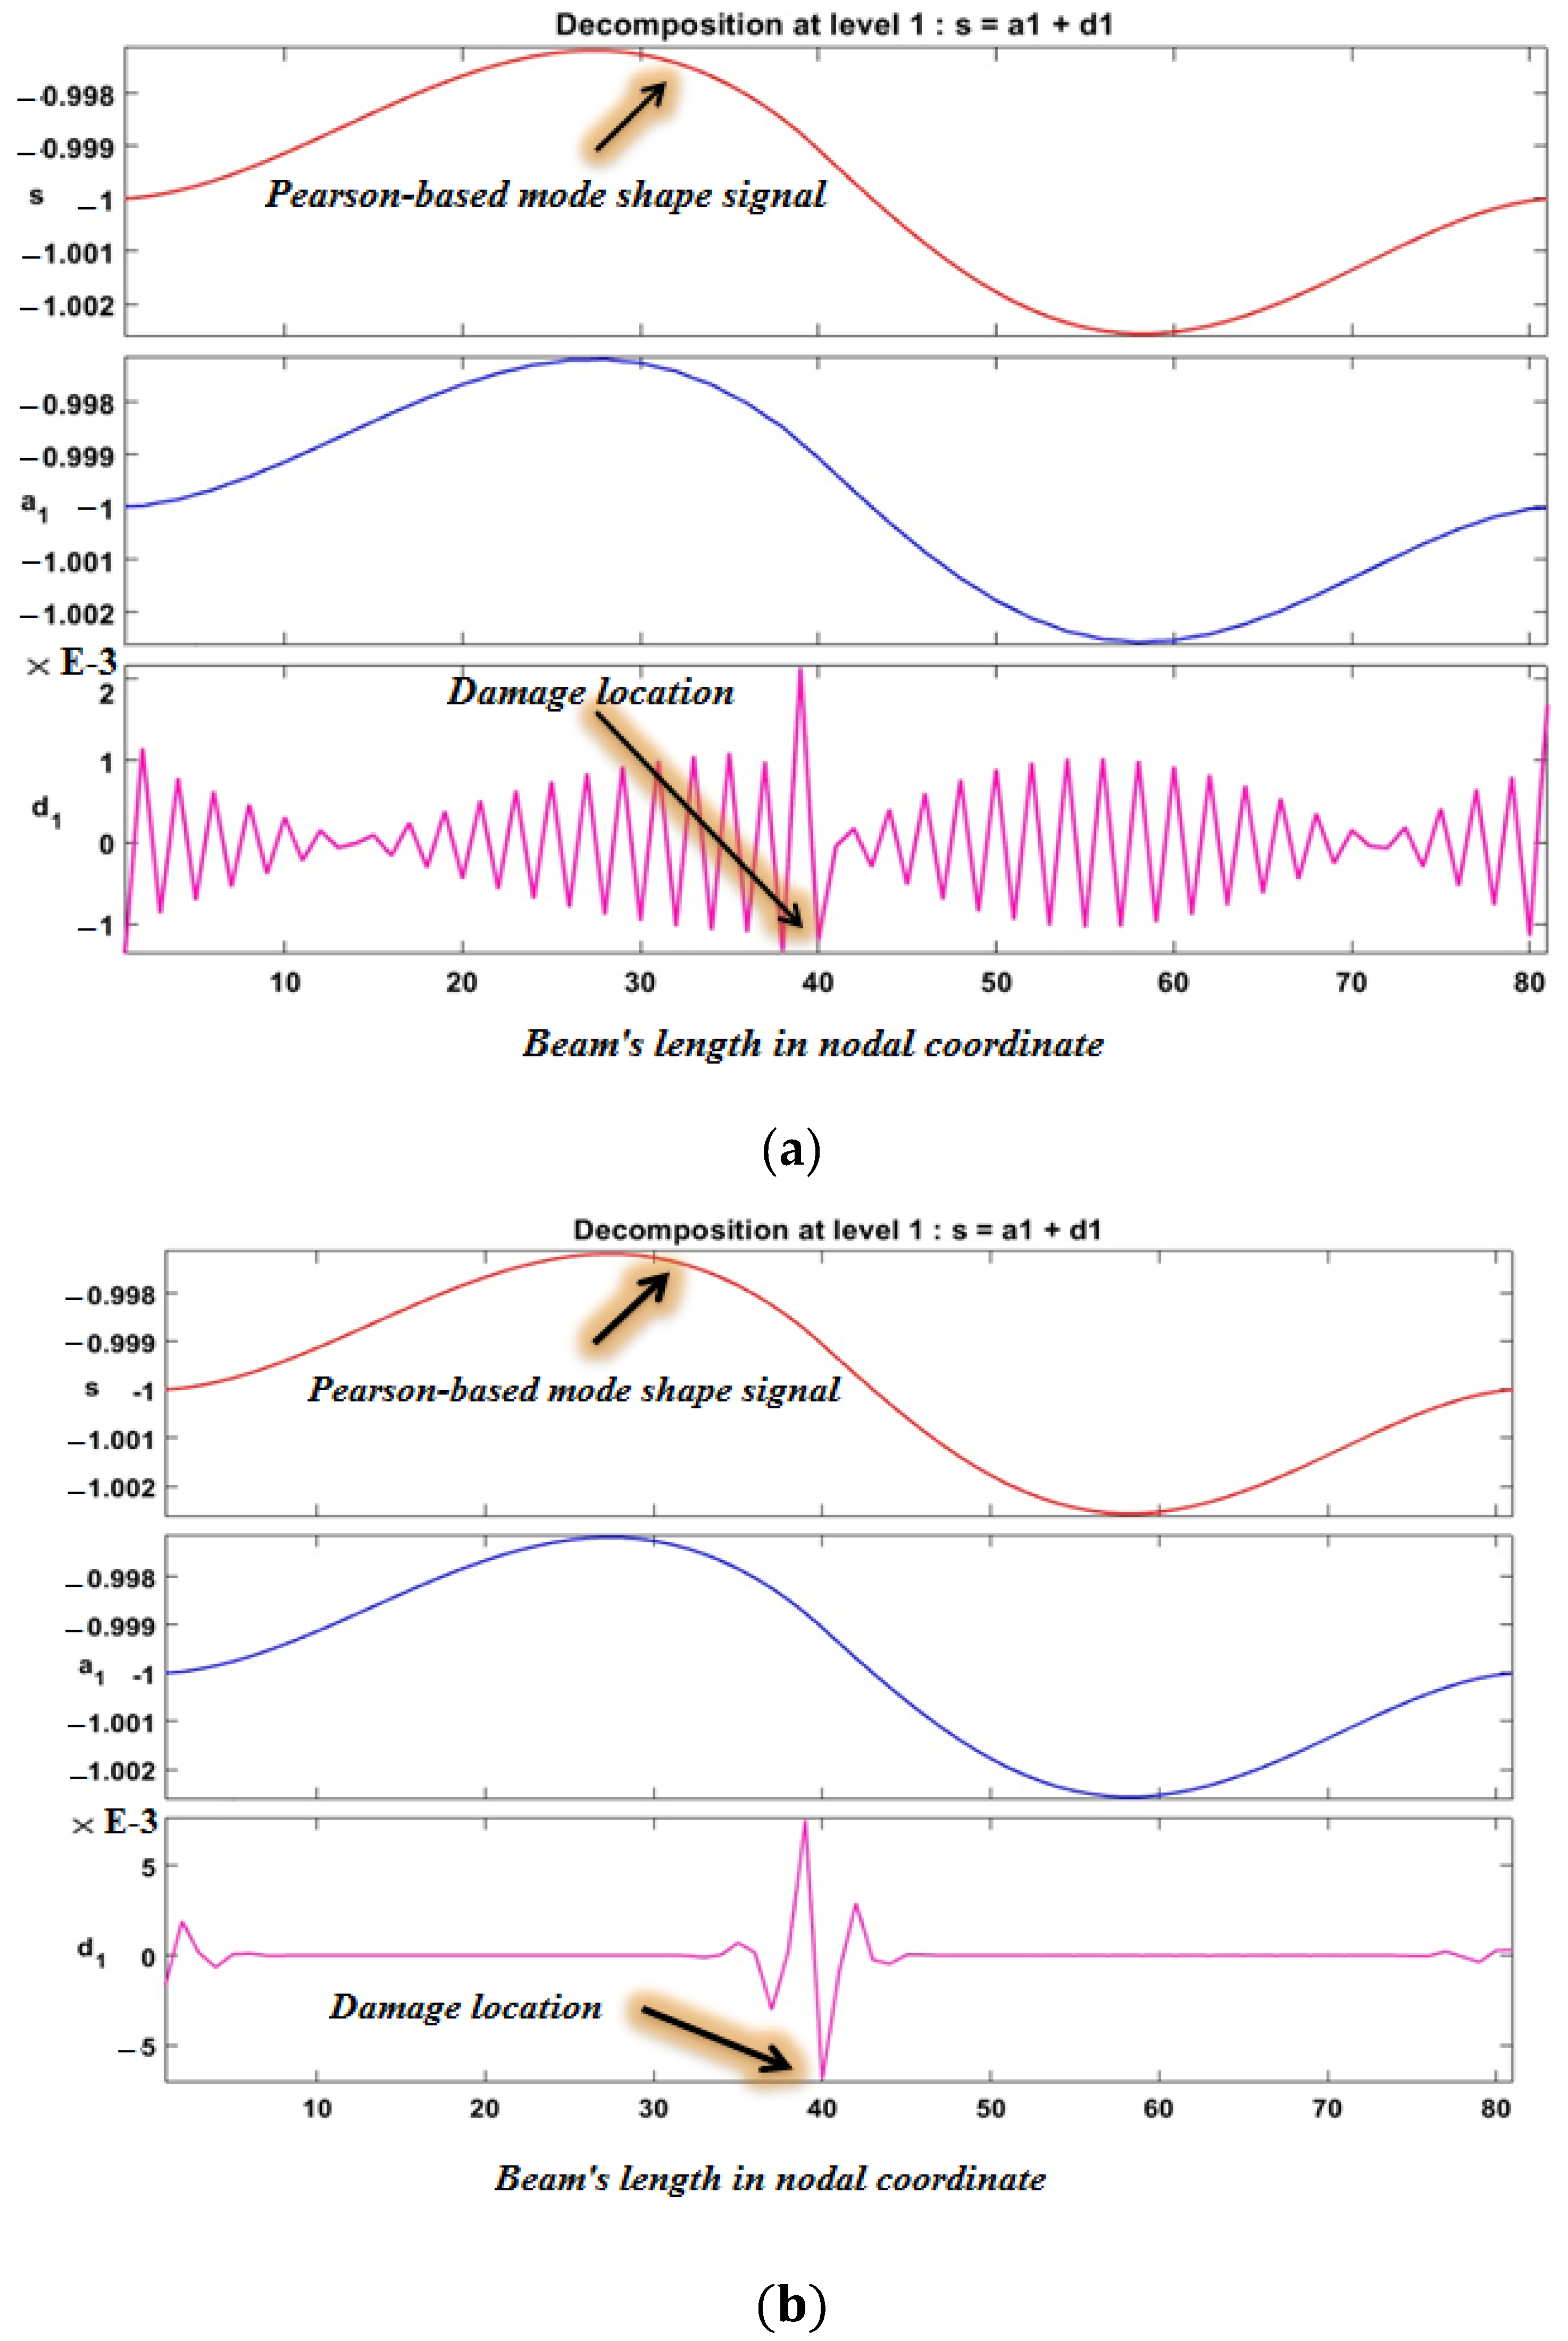
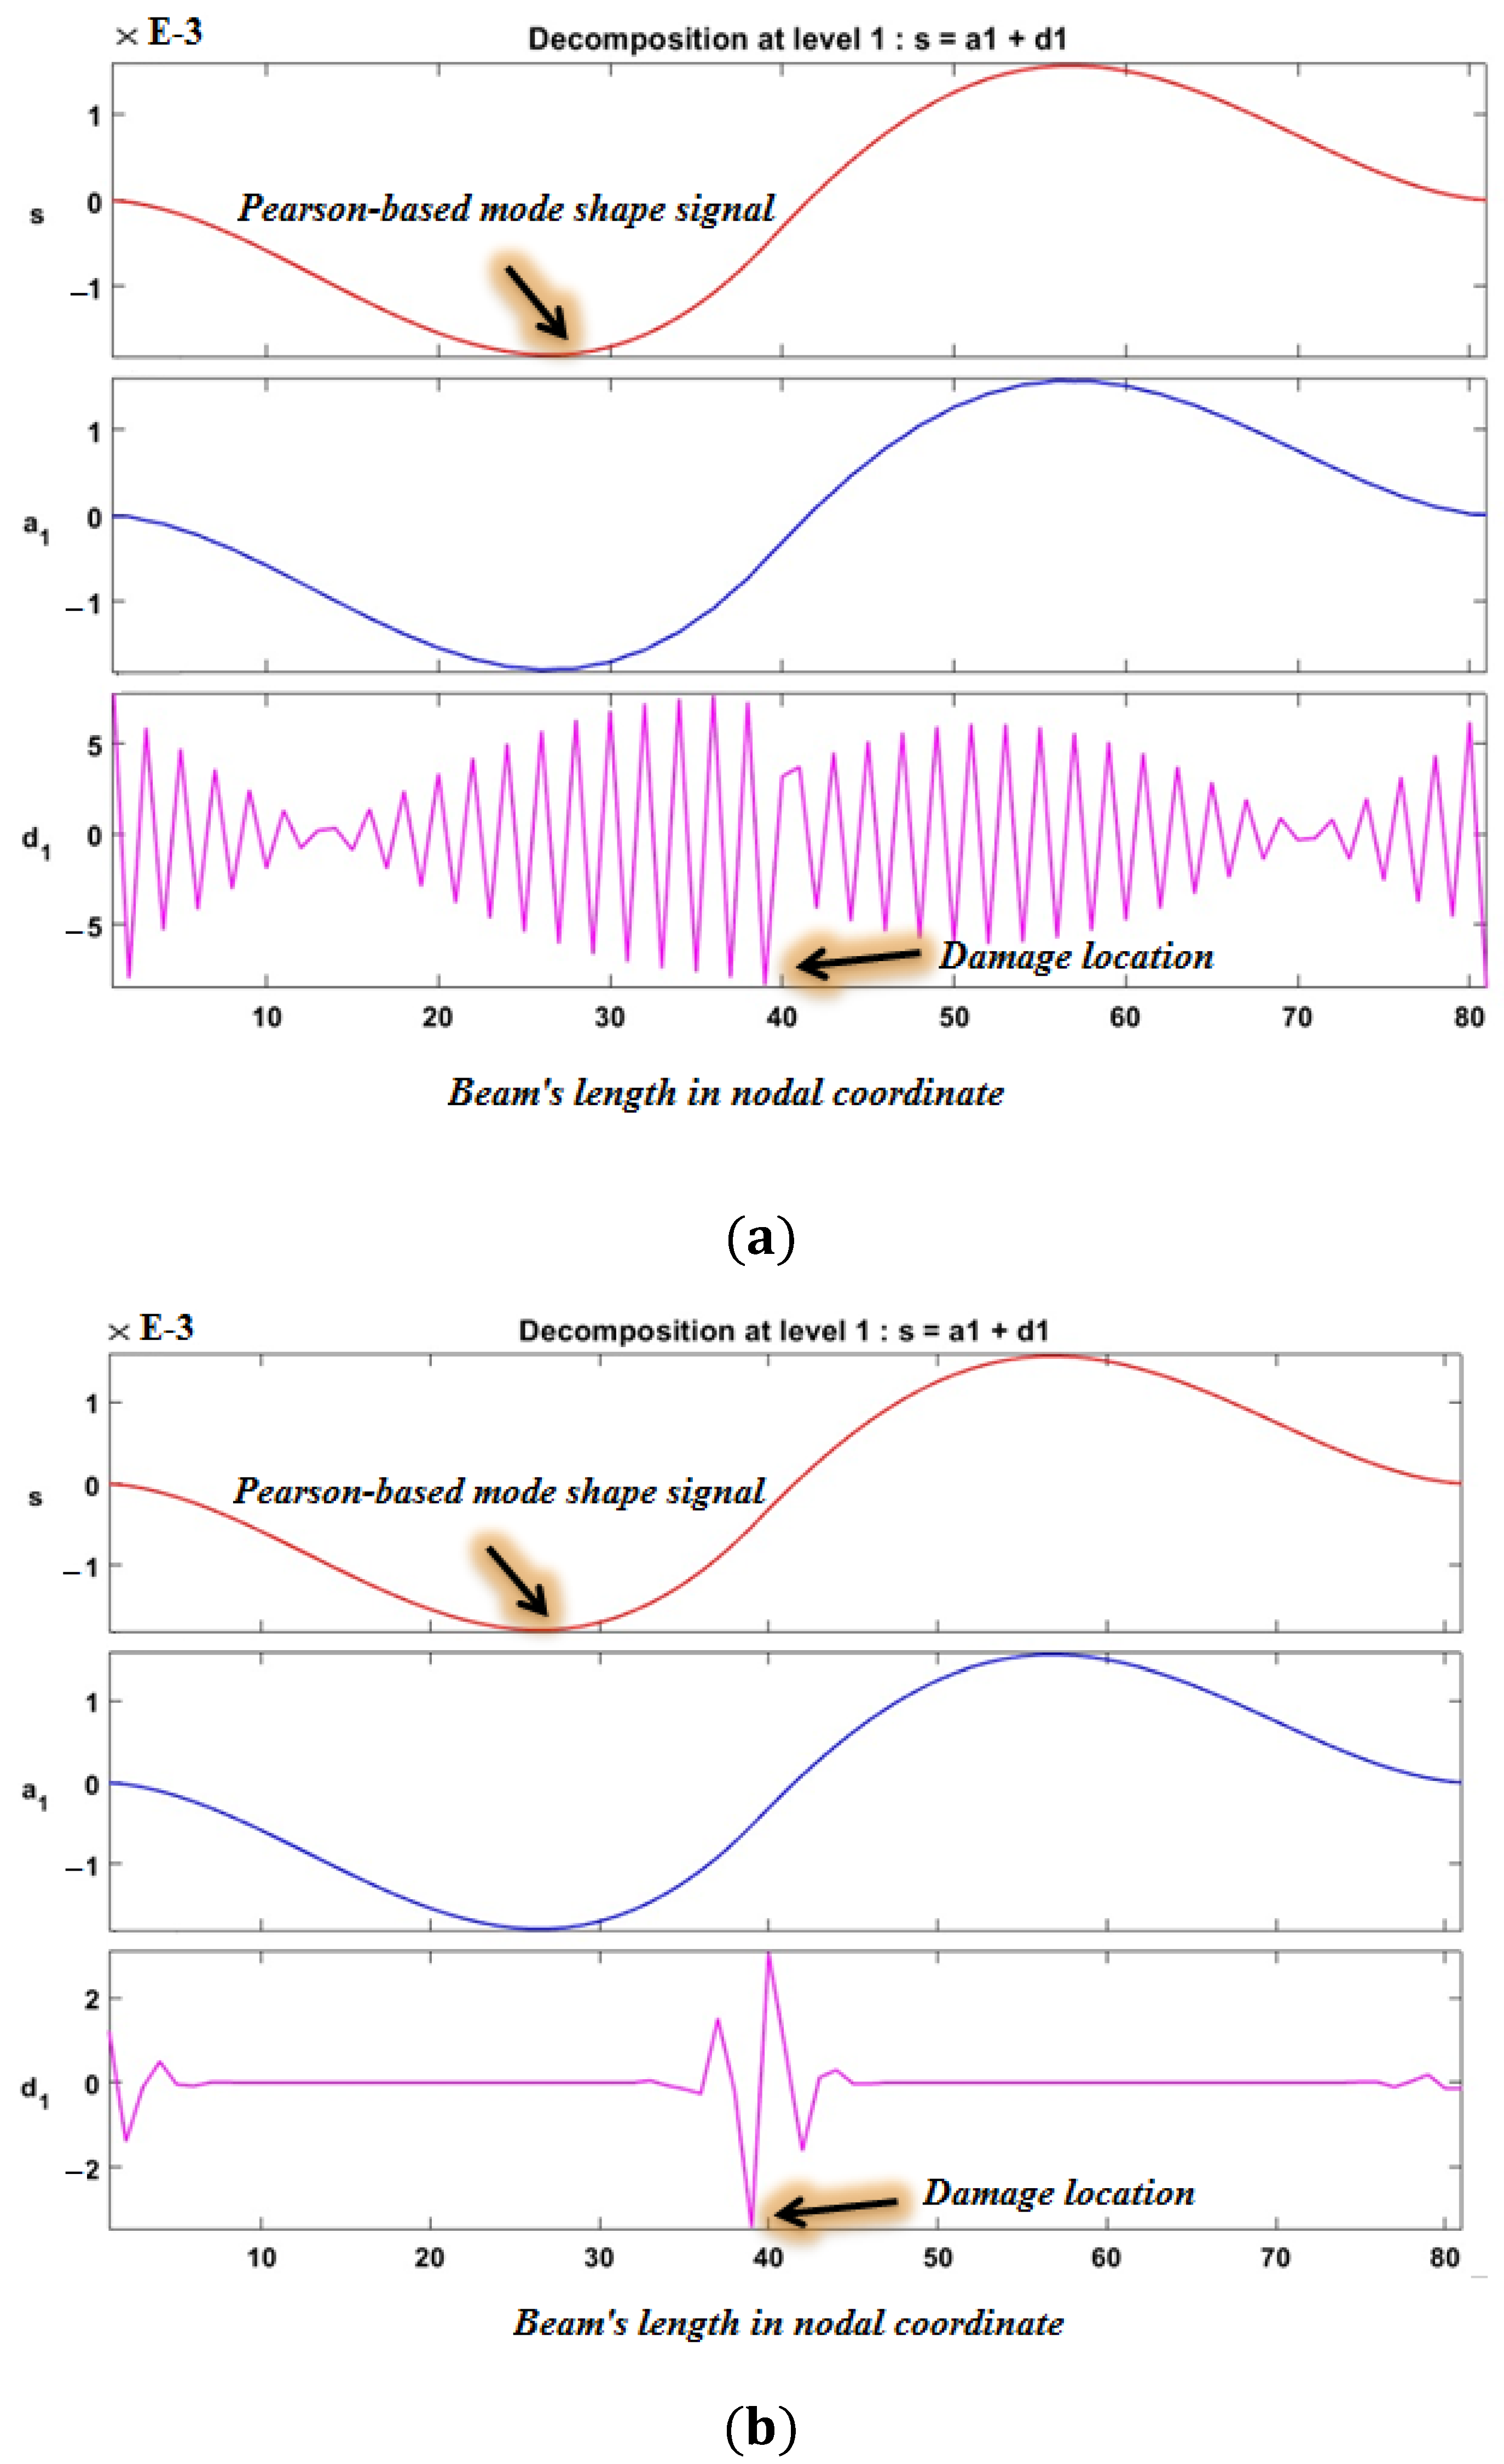
Mathematics 10 02689 g007
Figure 8. The effect of increasing the vanishing moments on the accuracy of damage detection by 1D-DWT from the quasi-Pearson-based mode shape signal by 90% damage: (a) vanishing moments = 2, (b) vanishing moments = 5.
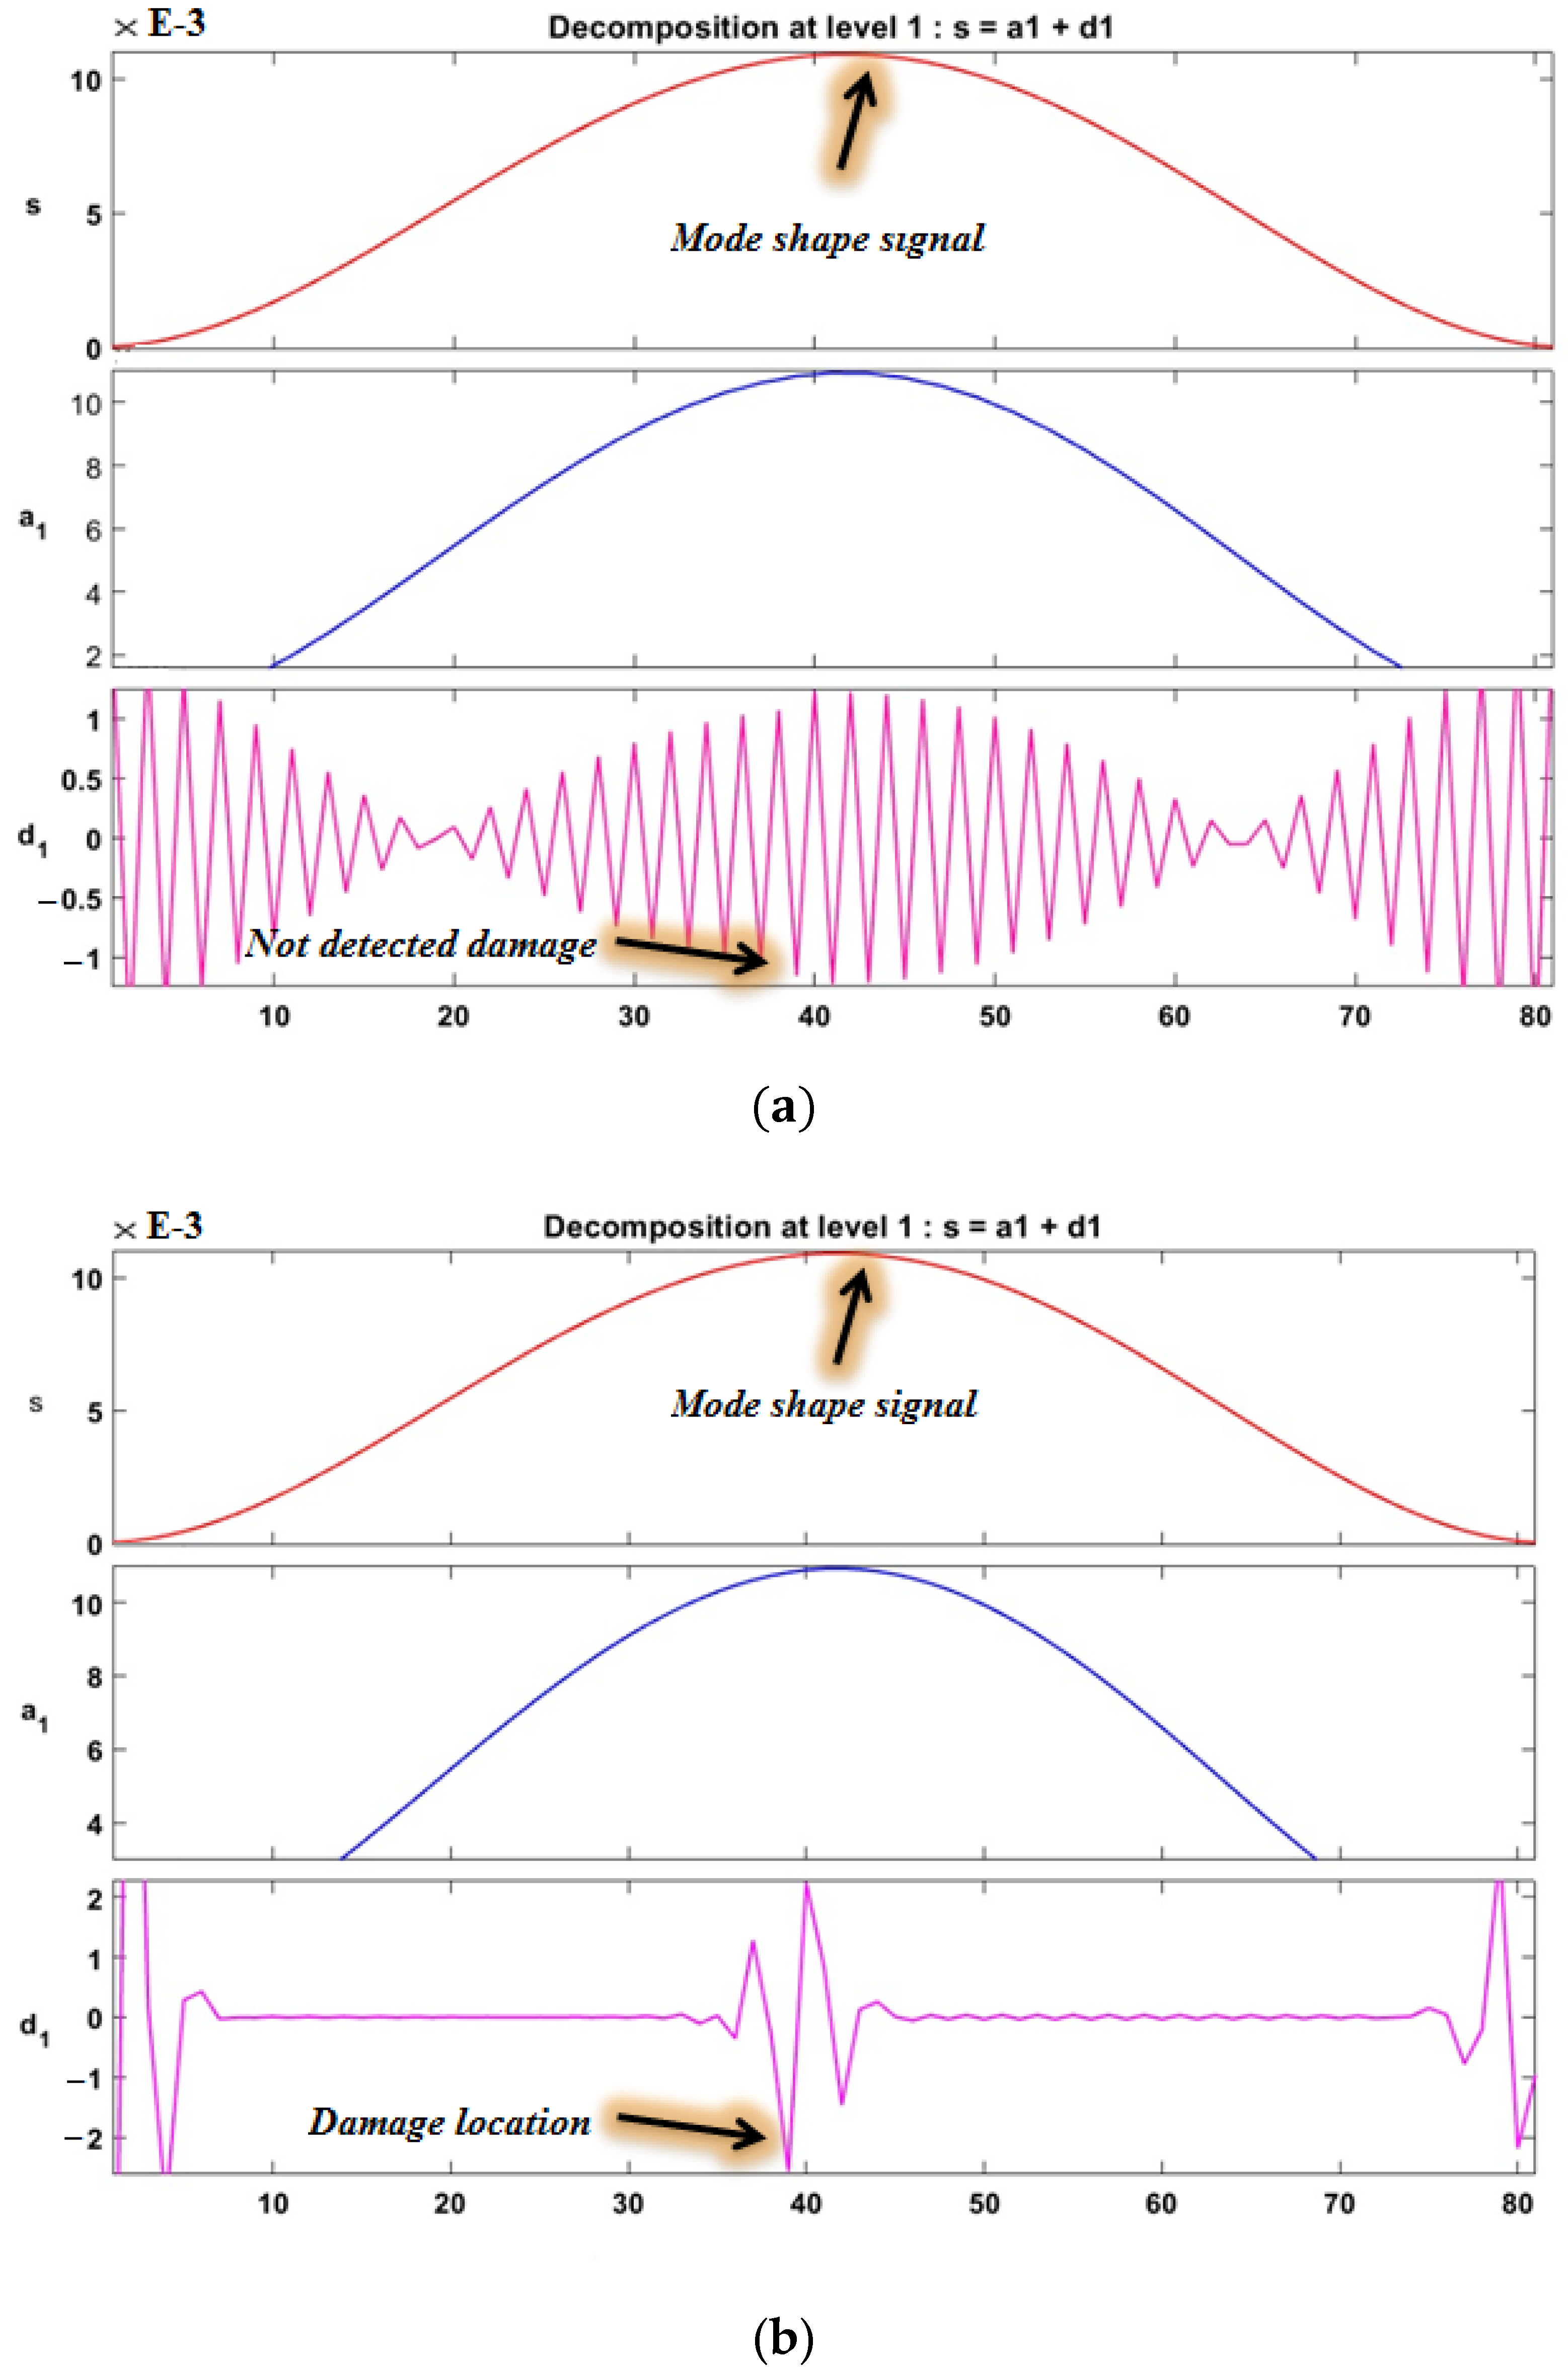
Mathematics 10 02689 g008
Figure 9. The effect of increasing the vanishing moments on the accuracy of damage detection by 1D-DWT from the damaged mode shape by 70% damage: (a) vanishing moments = 2, (b) vanishing moments = 5.
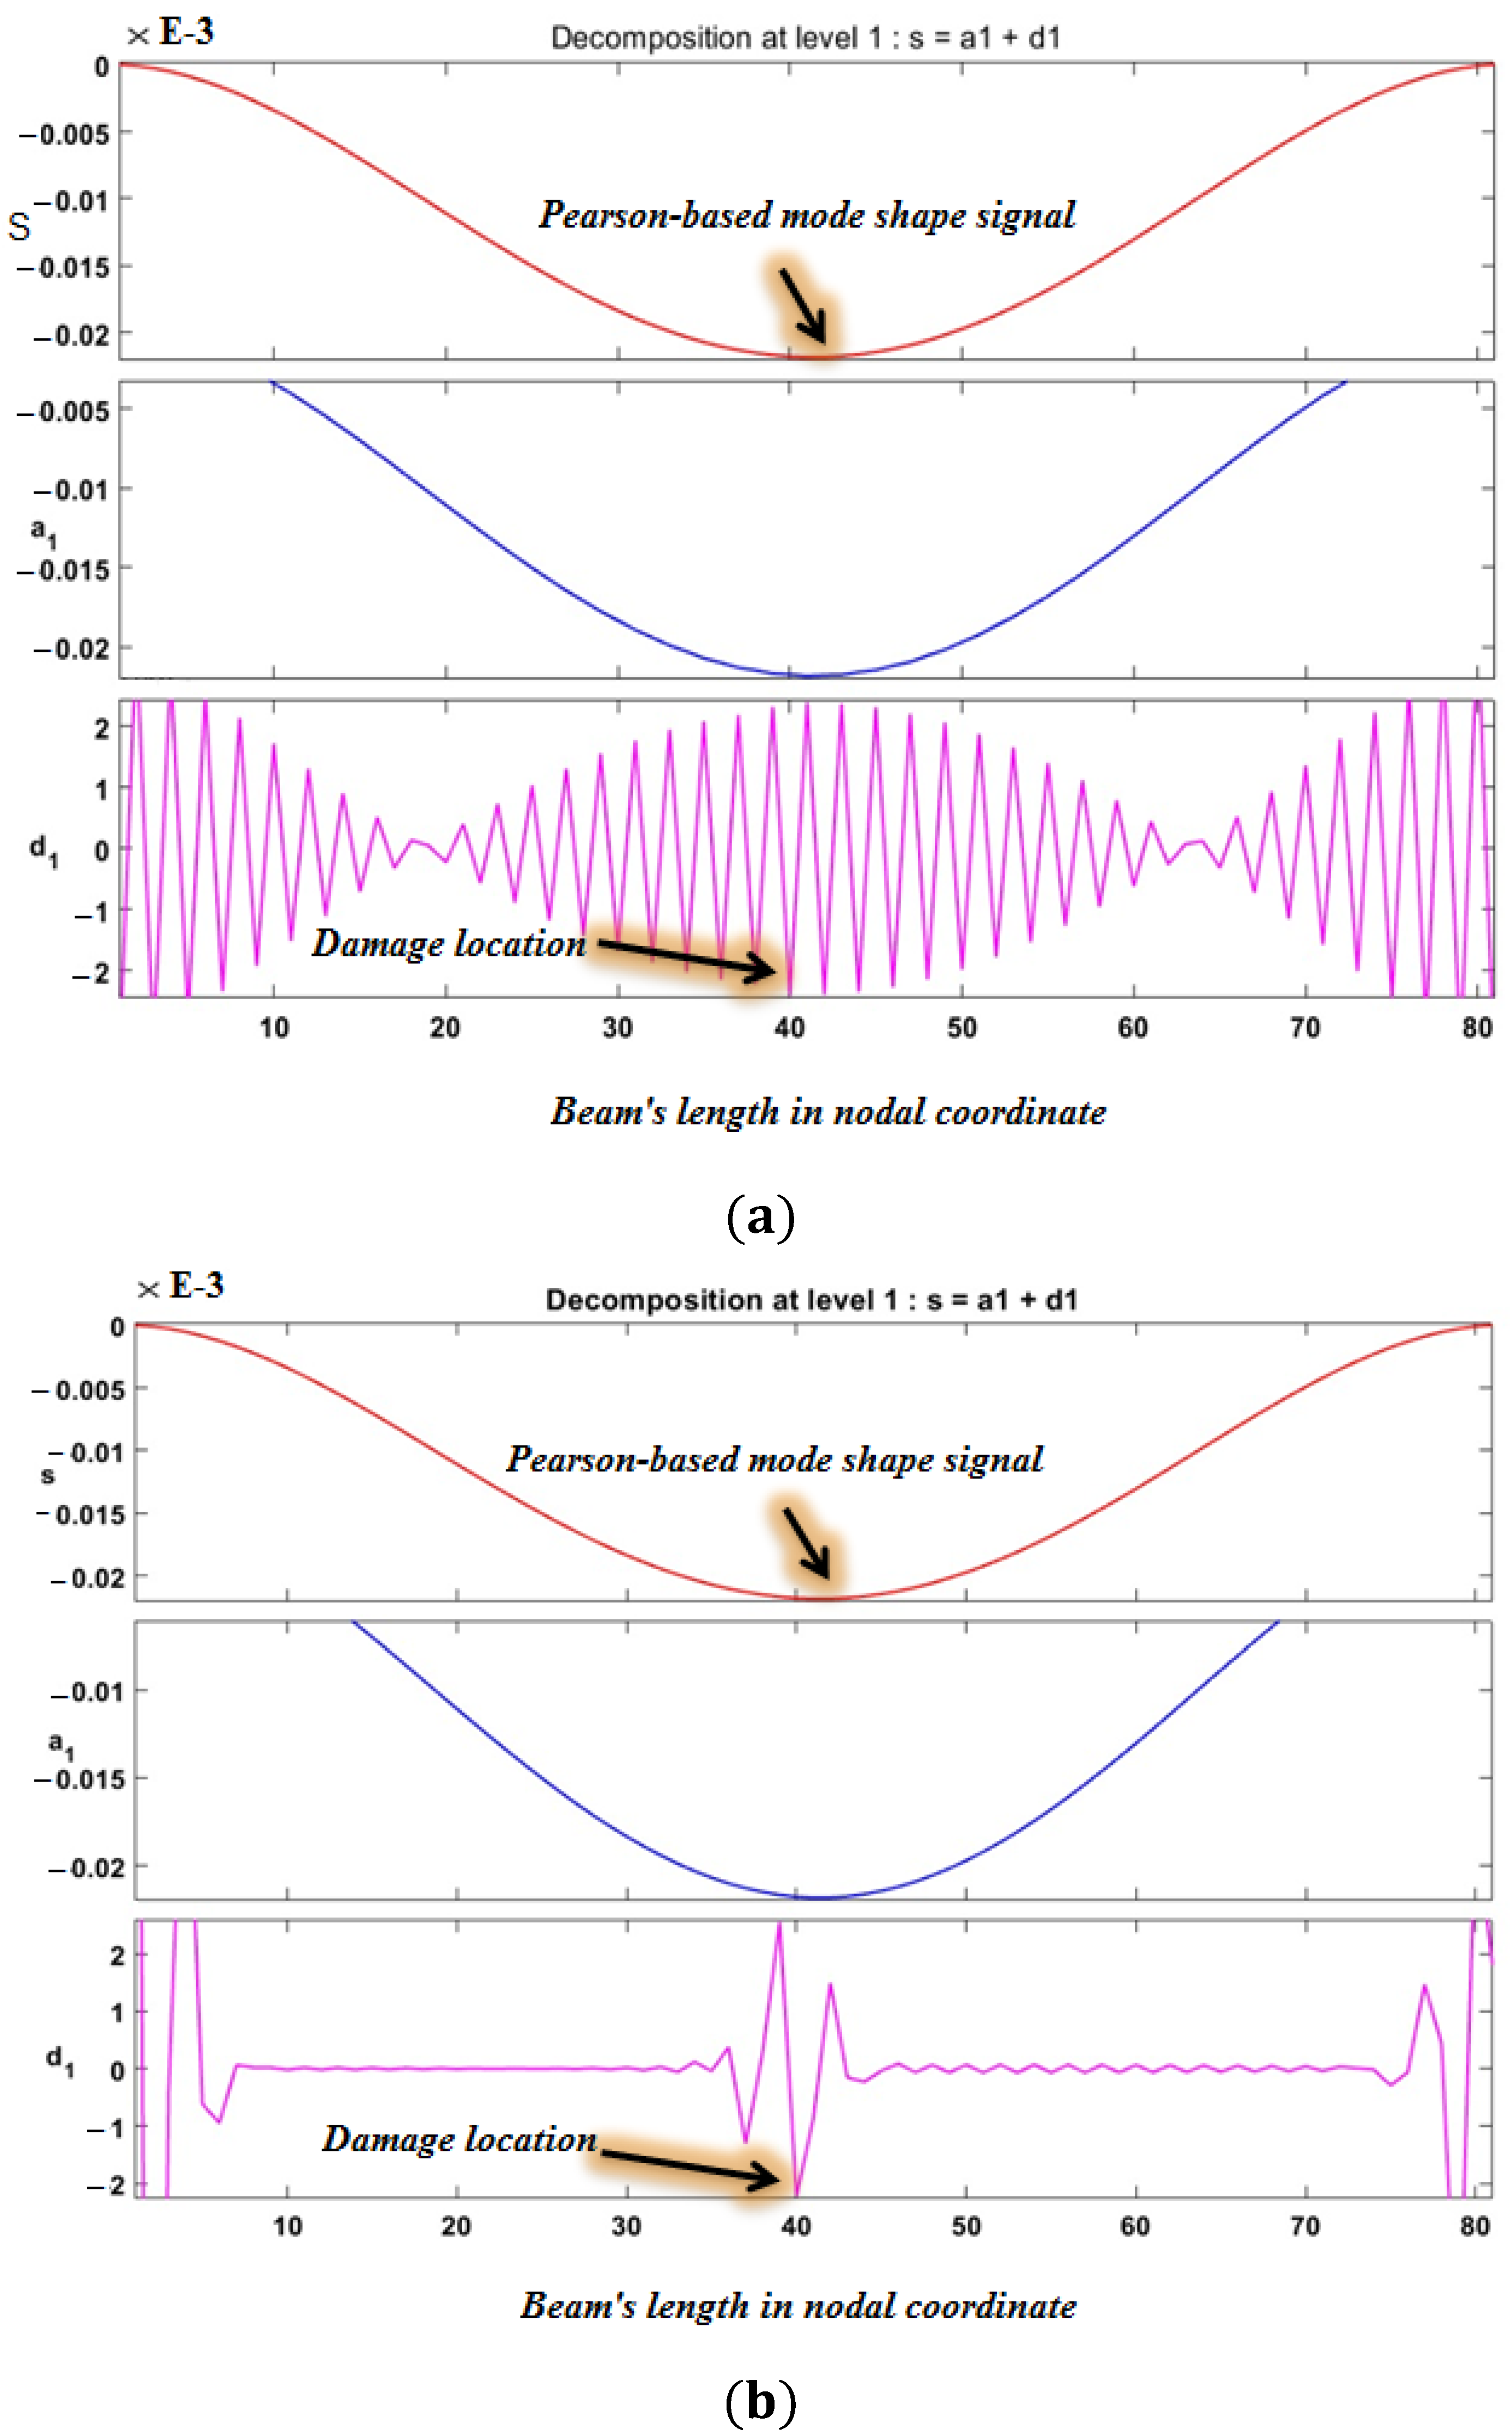
Mathematics 10 02689 g009
Figure 10. The effect of increasing the vanishing moments on the accuracy of damage detection by 1D-DWT from the quasi-Pearson-based mode shape signal by 70% damage: (a) vanishing moments = 2, (b) vanishing moments = 5.
Mathematics 10 02689 g010
Figure 11. The effect of increasing the vanishing moments on the accuracy of damage detection by 1D-DWT from the quasi-Pearson-based coefficient extracted from intact and damaged mode shapes by 70% damage: (a) vanishing moments = 2, (b) vanishing moments = 5.
Mathematics 10 02689 g011
Figure 12. The effect of increasing the vanishing moments on the accuracy of damage detection by 1D-DWT from the quasi-Pearson-based coefficient extracted from intact and damaged mode shapes by 10% damage: (a) vanishing moments = 2, (b) vanishing moments = 5.
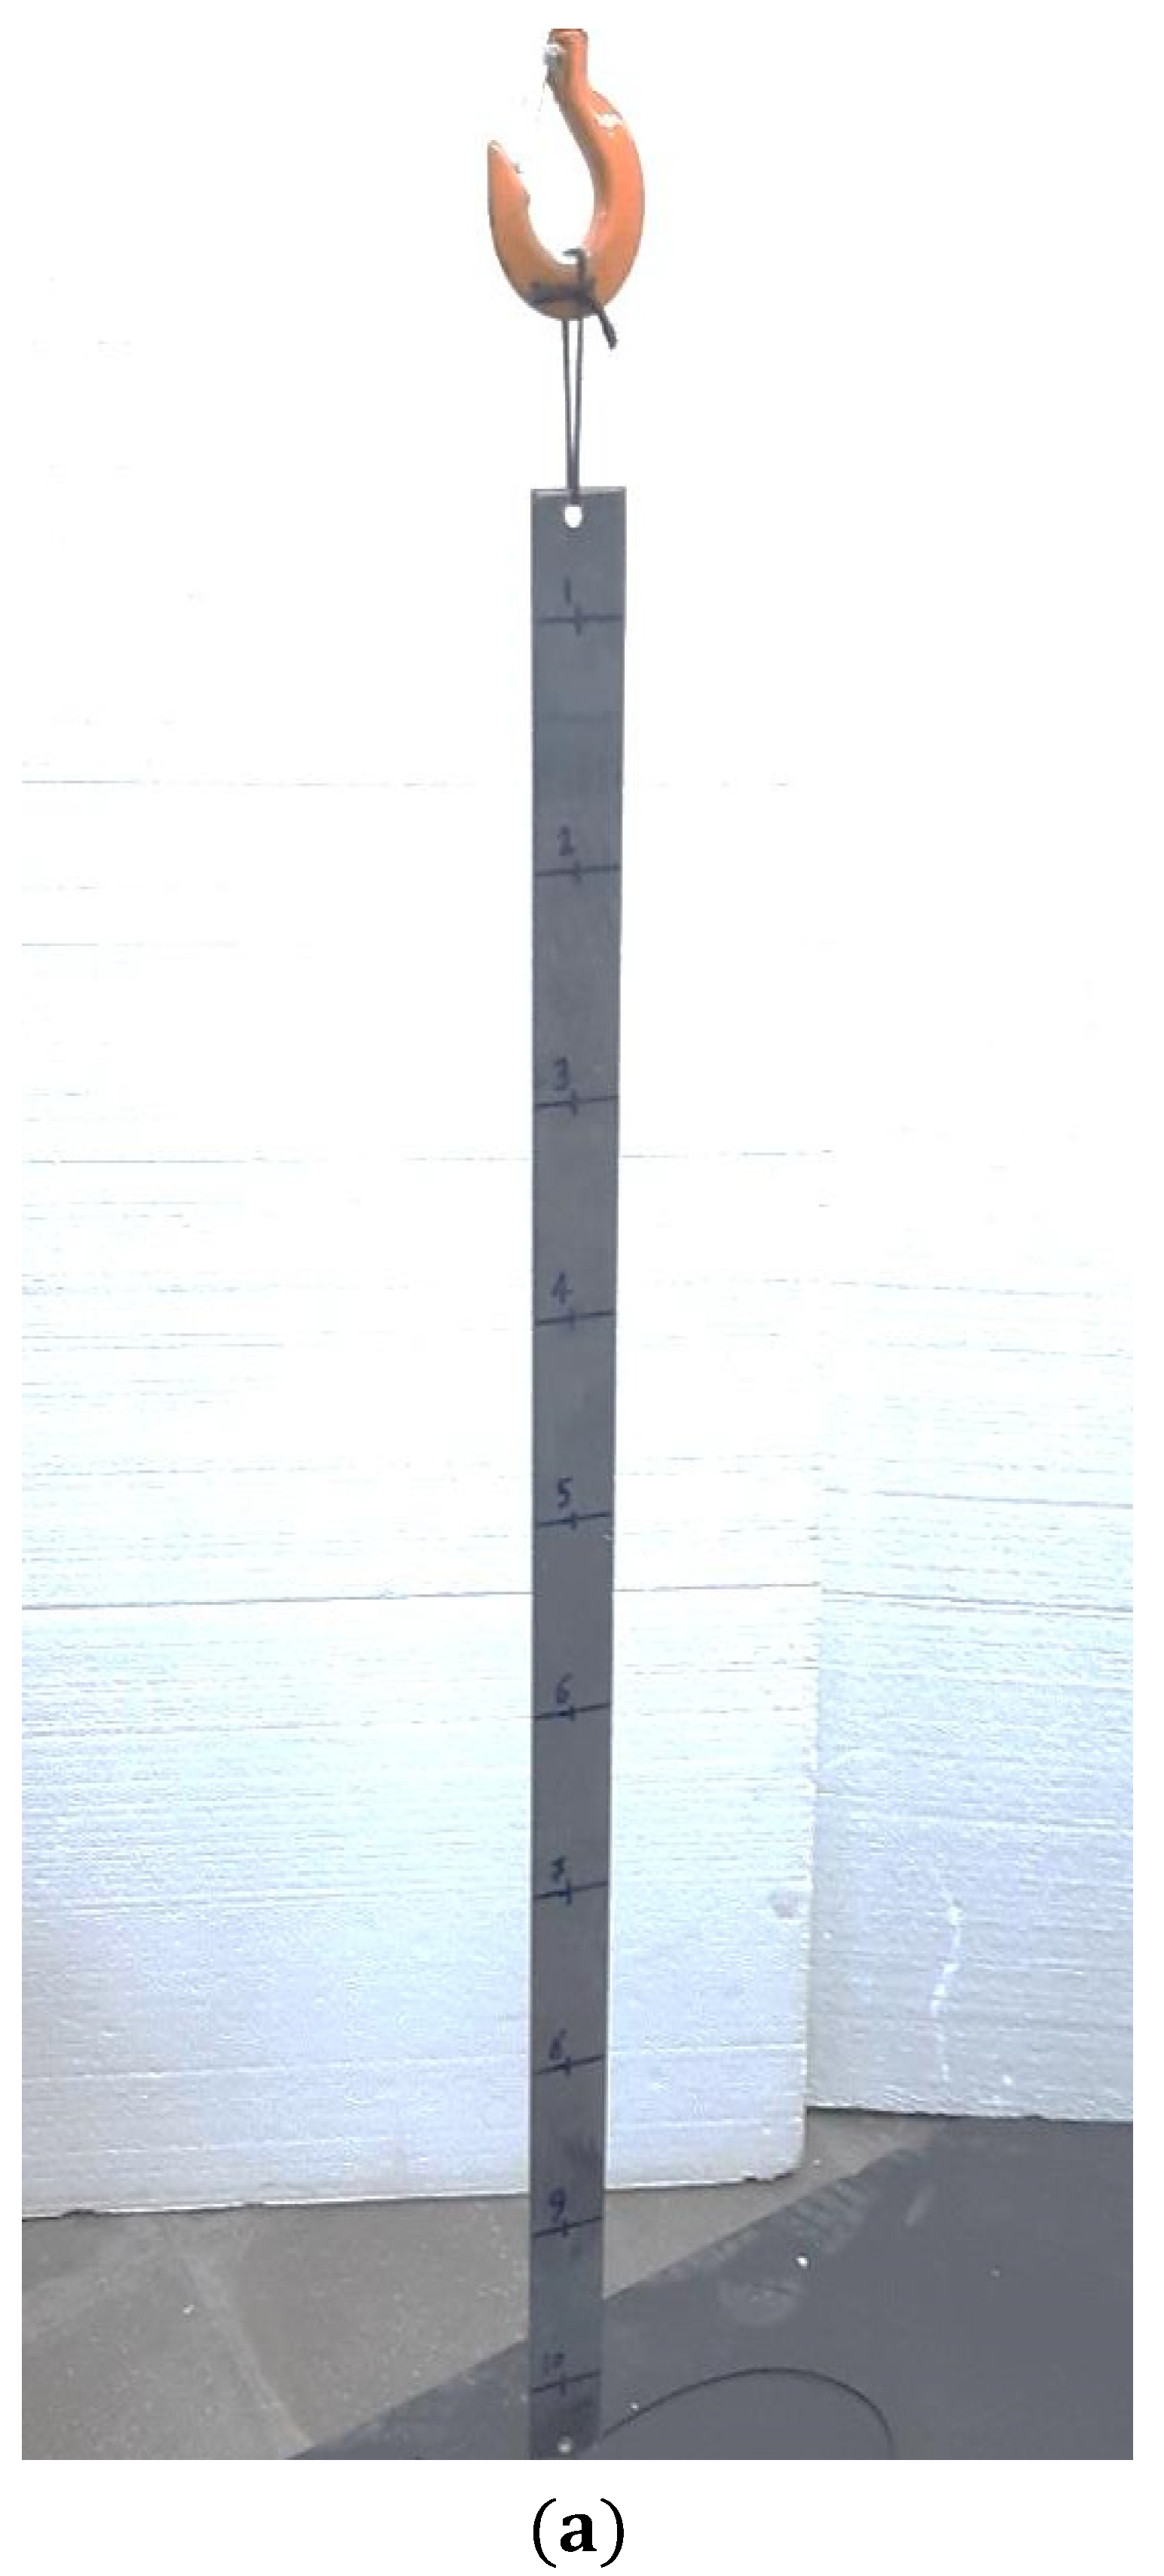
Mathematics 10 02689 g012
Figure 13. Intact steel beam and its divisions.
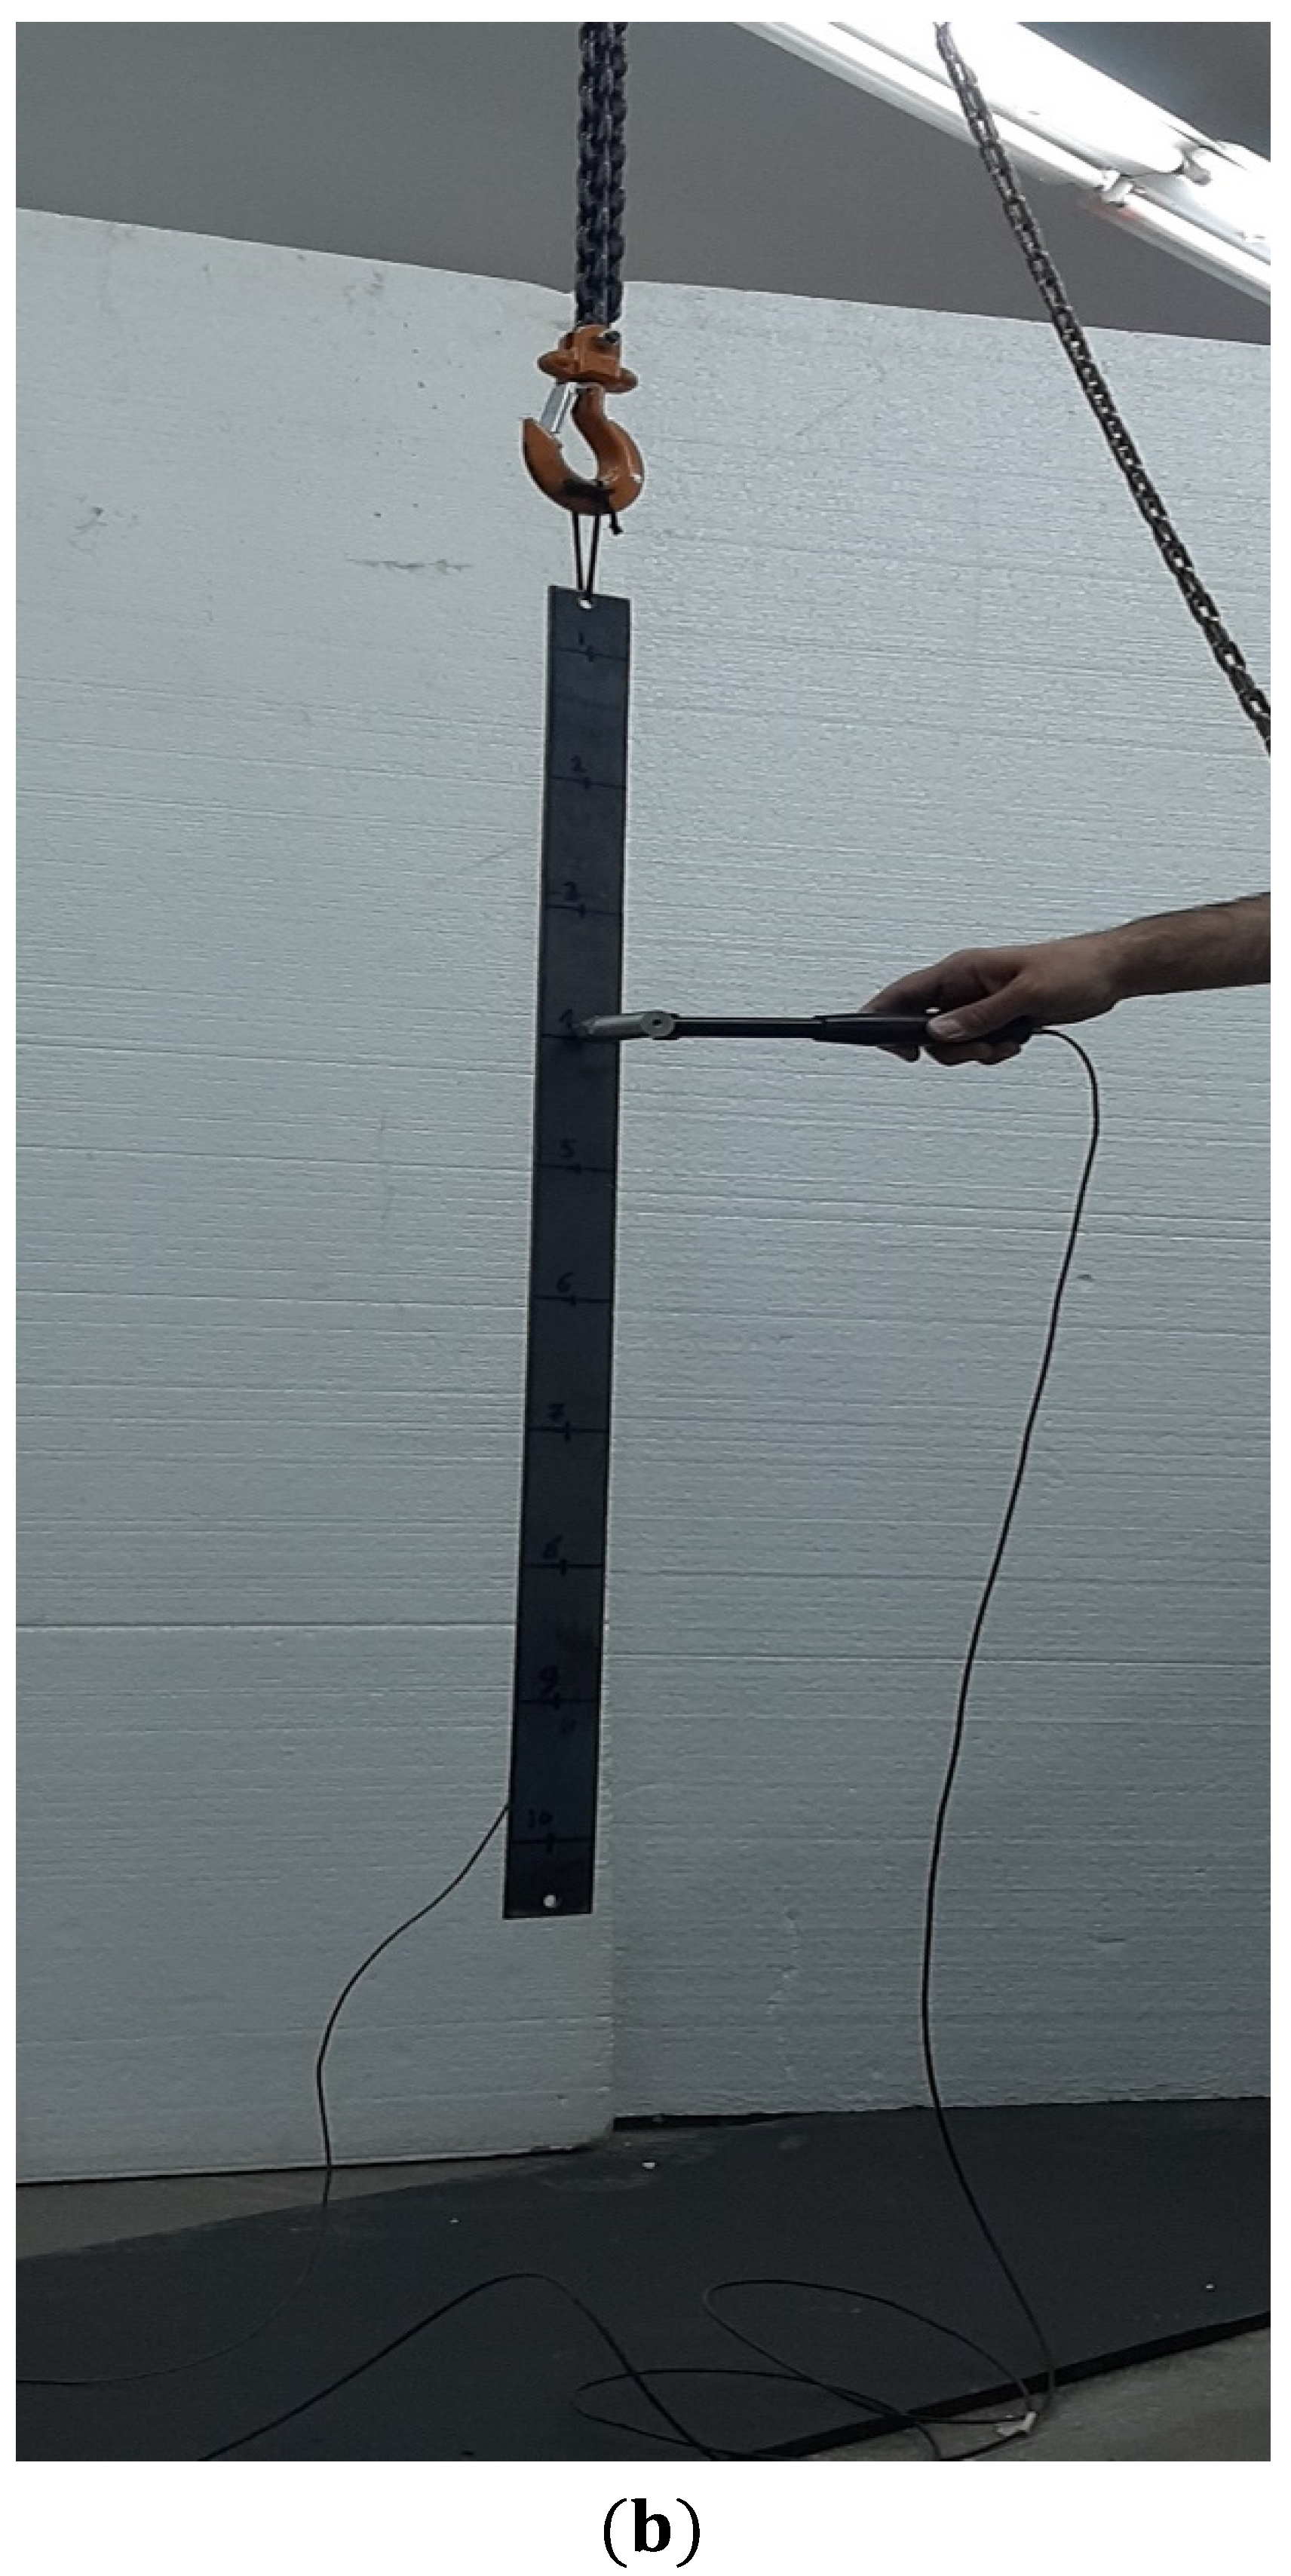
Mathematics 10 02689 g013aMathematics 10 02689 g013b
Figure 14. (a) Using CNC milling machining for creating damage on the steel beam, (b) the cracked steel beam and its free-free boundary conditions.
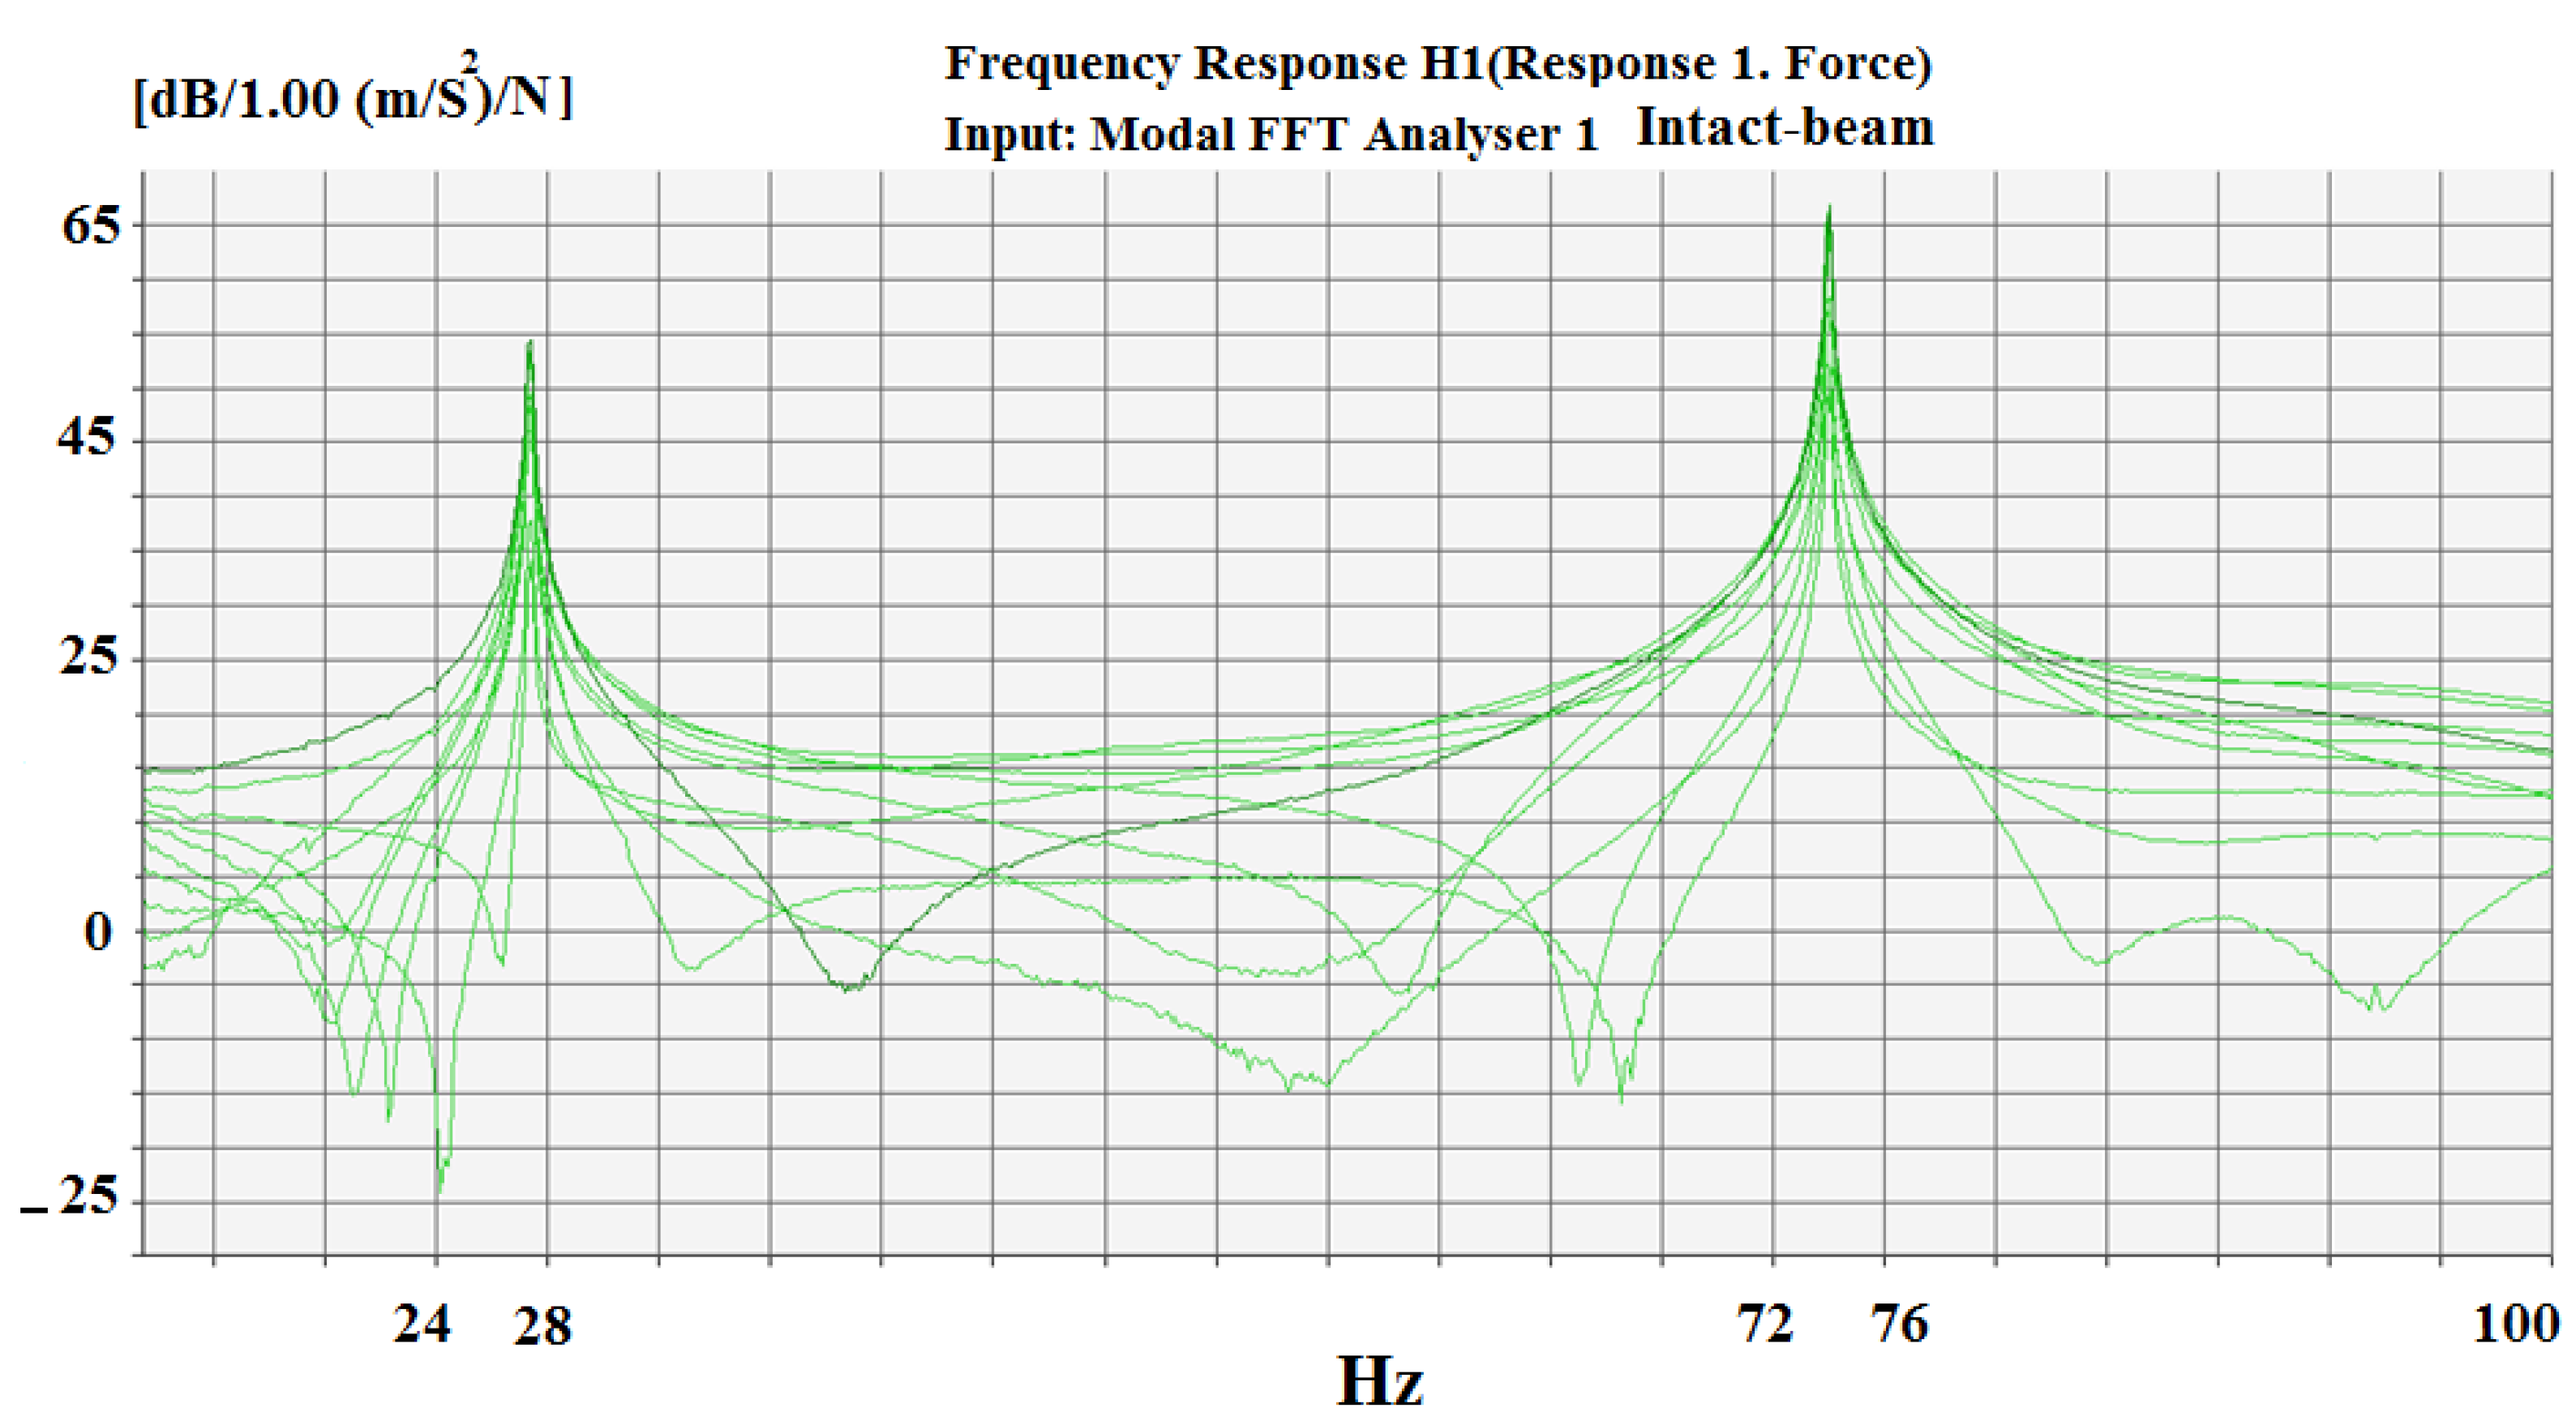
Mathematics 10 02689 g014
Figure 15. The frequency response functions obtained for the intact beam.
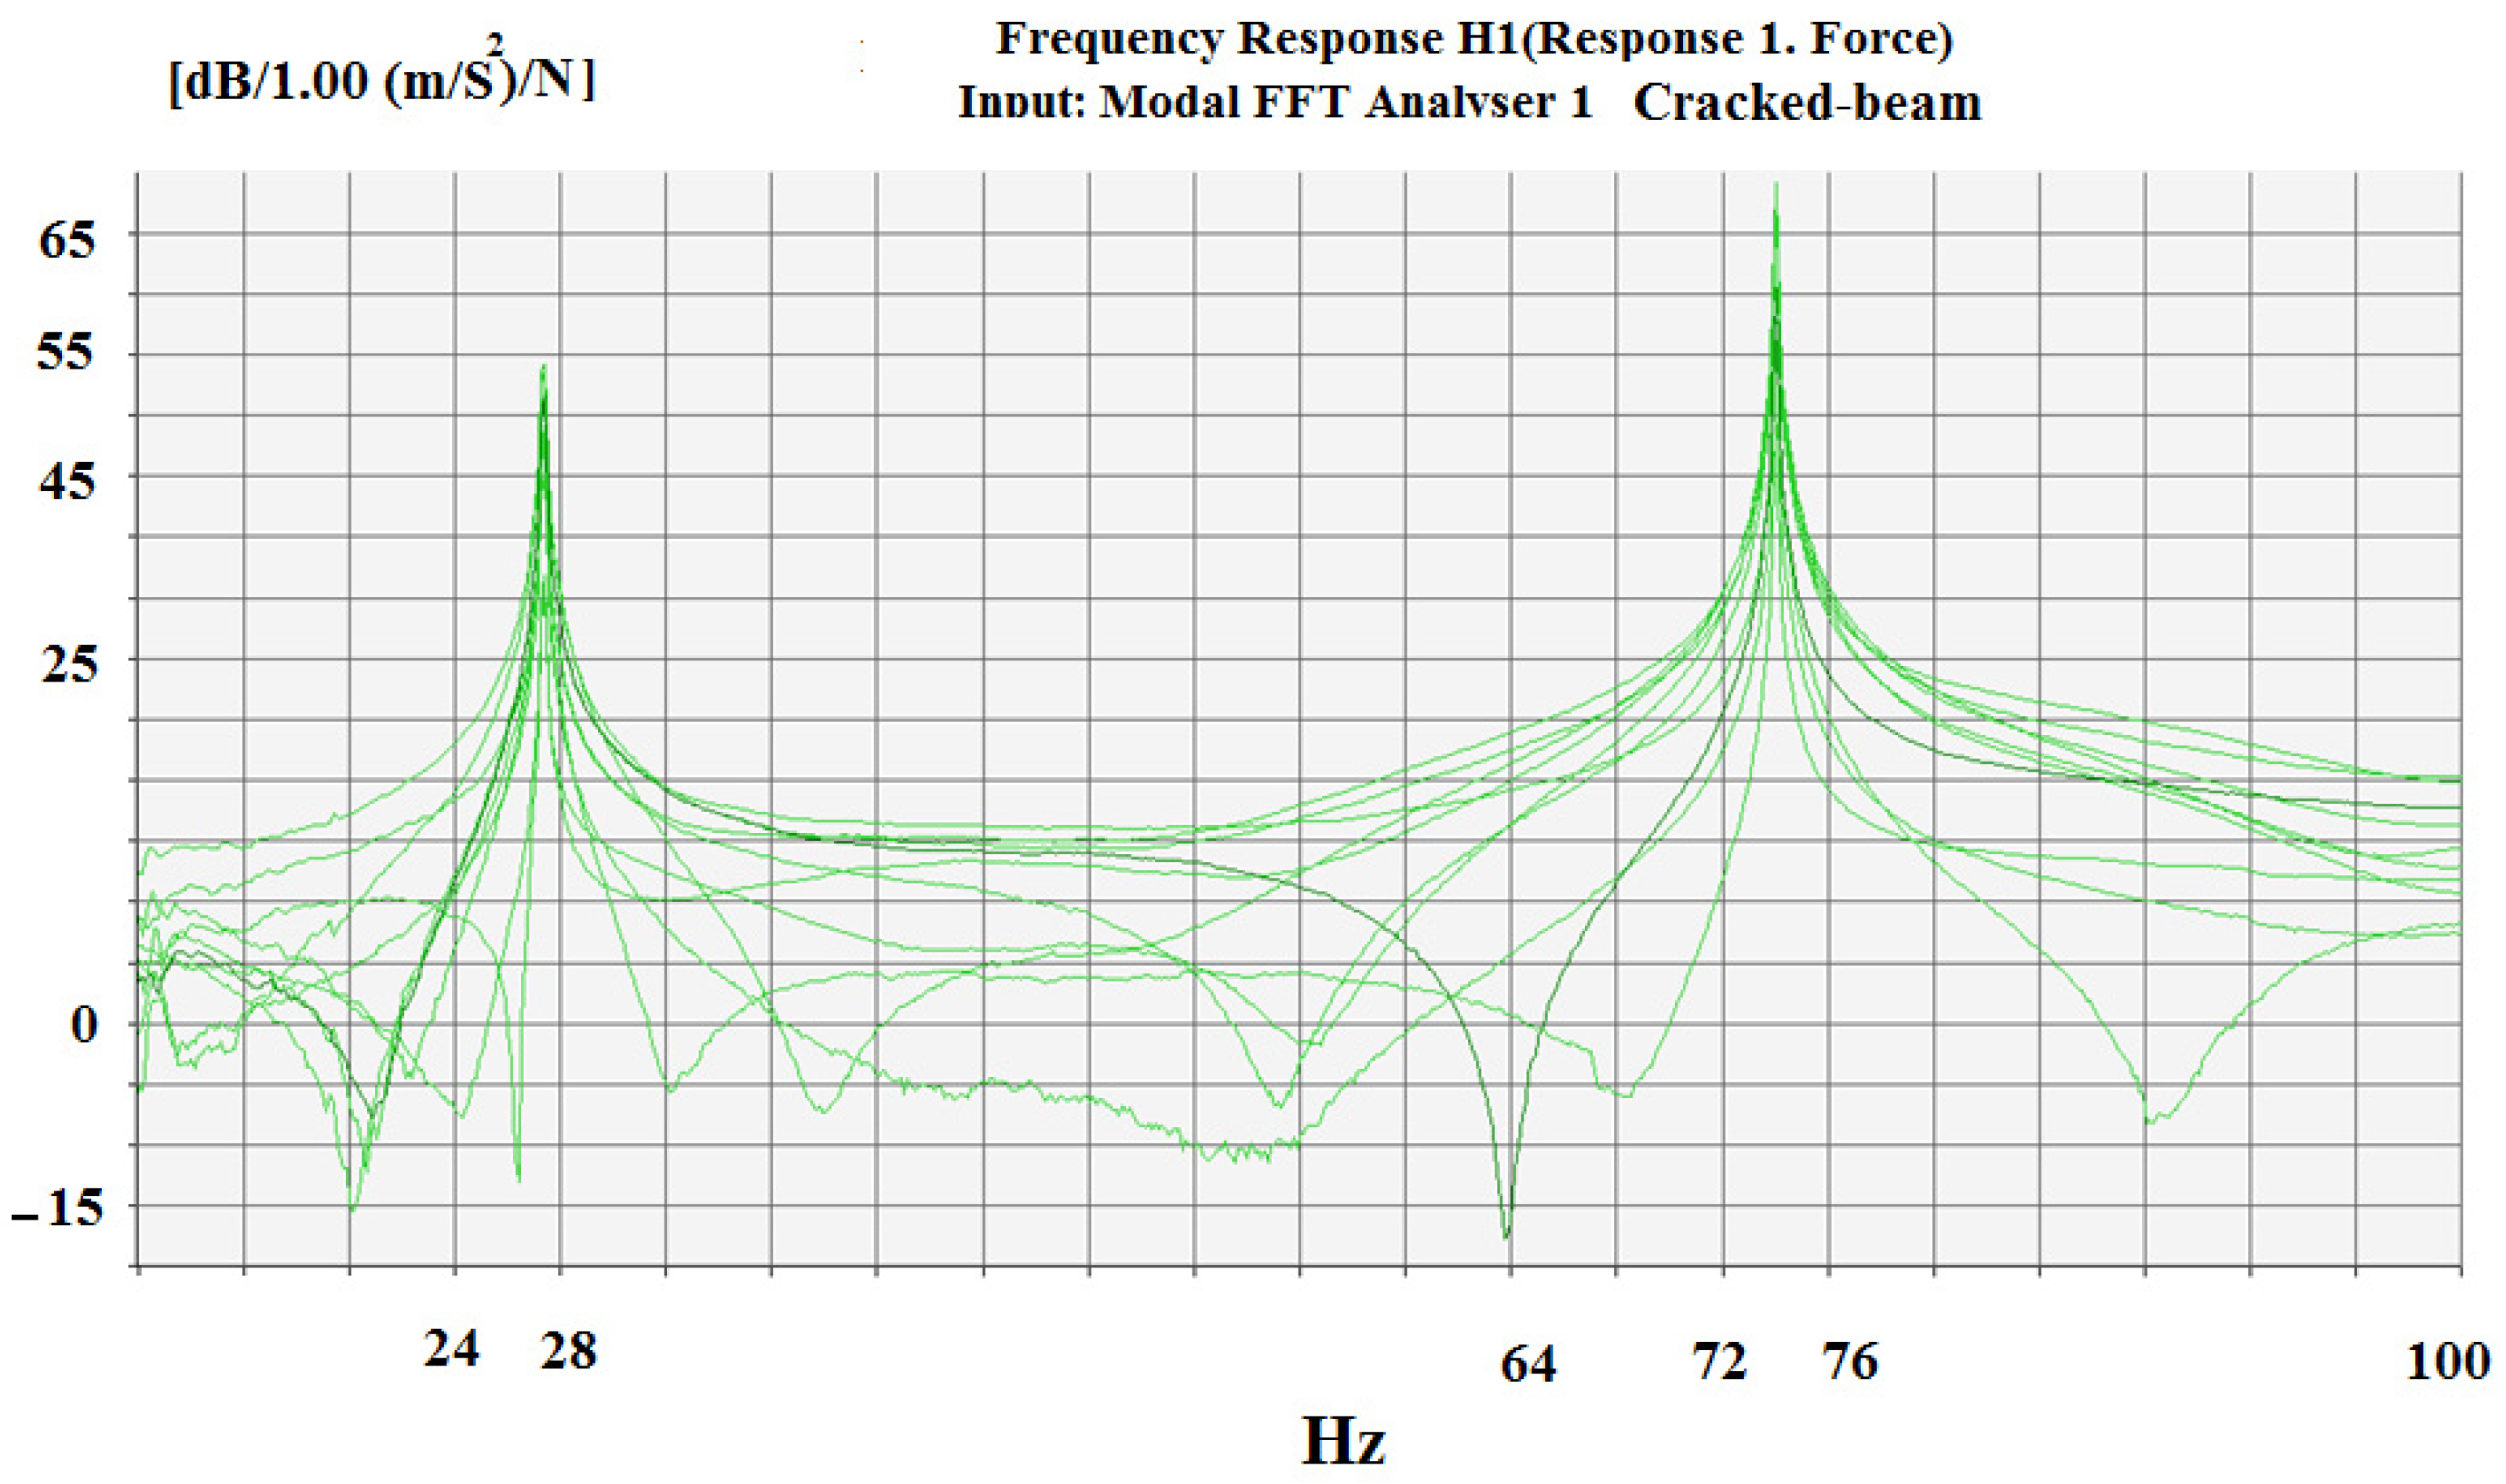
Mathematics 10 02689 g015
Figure 16. The frequency response functions obtained for the damaged beam.
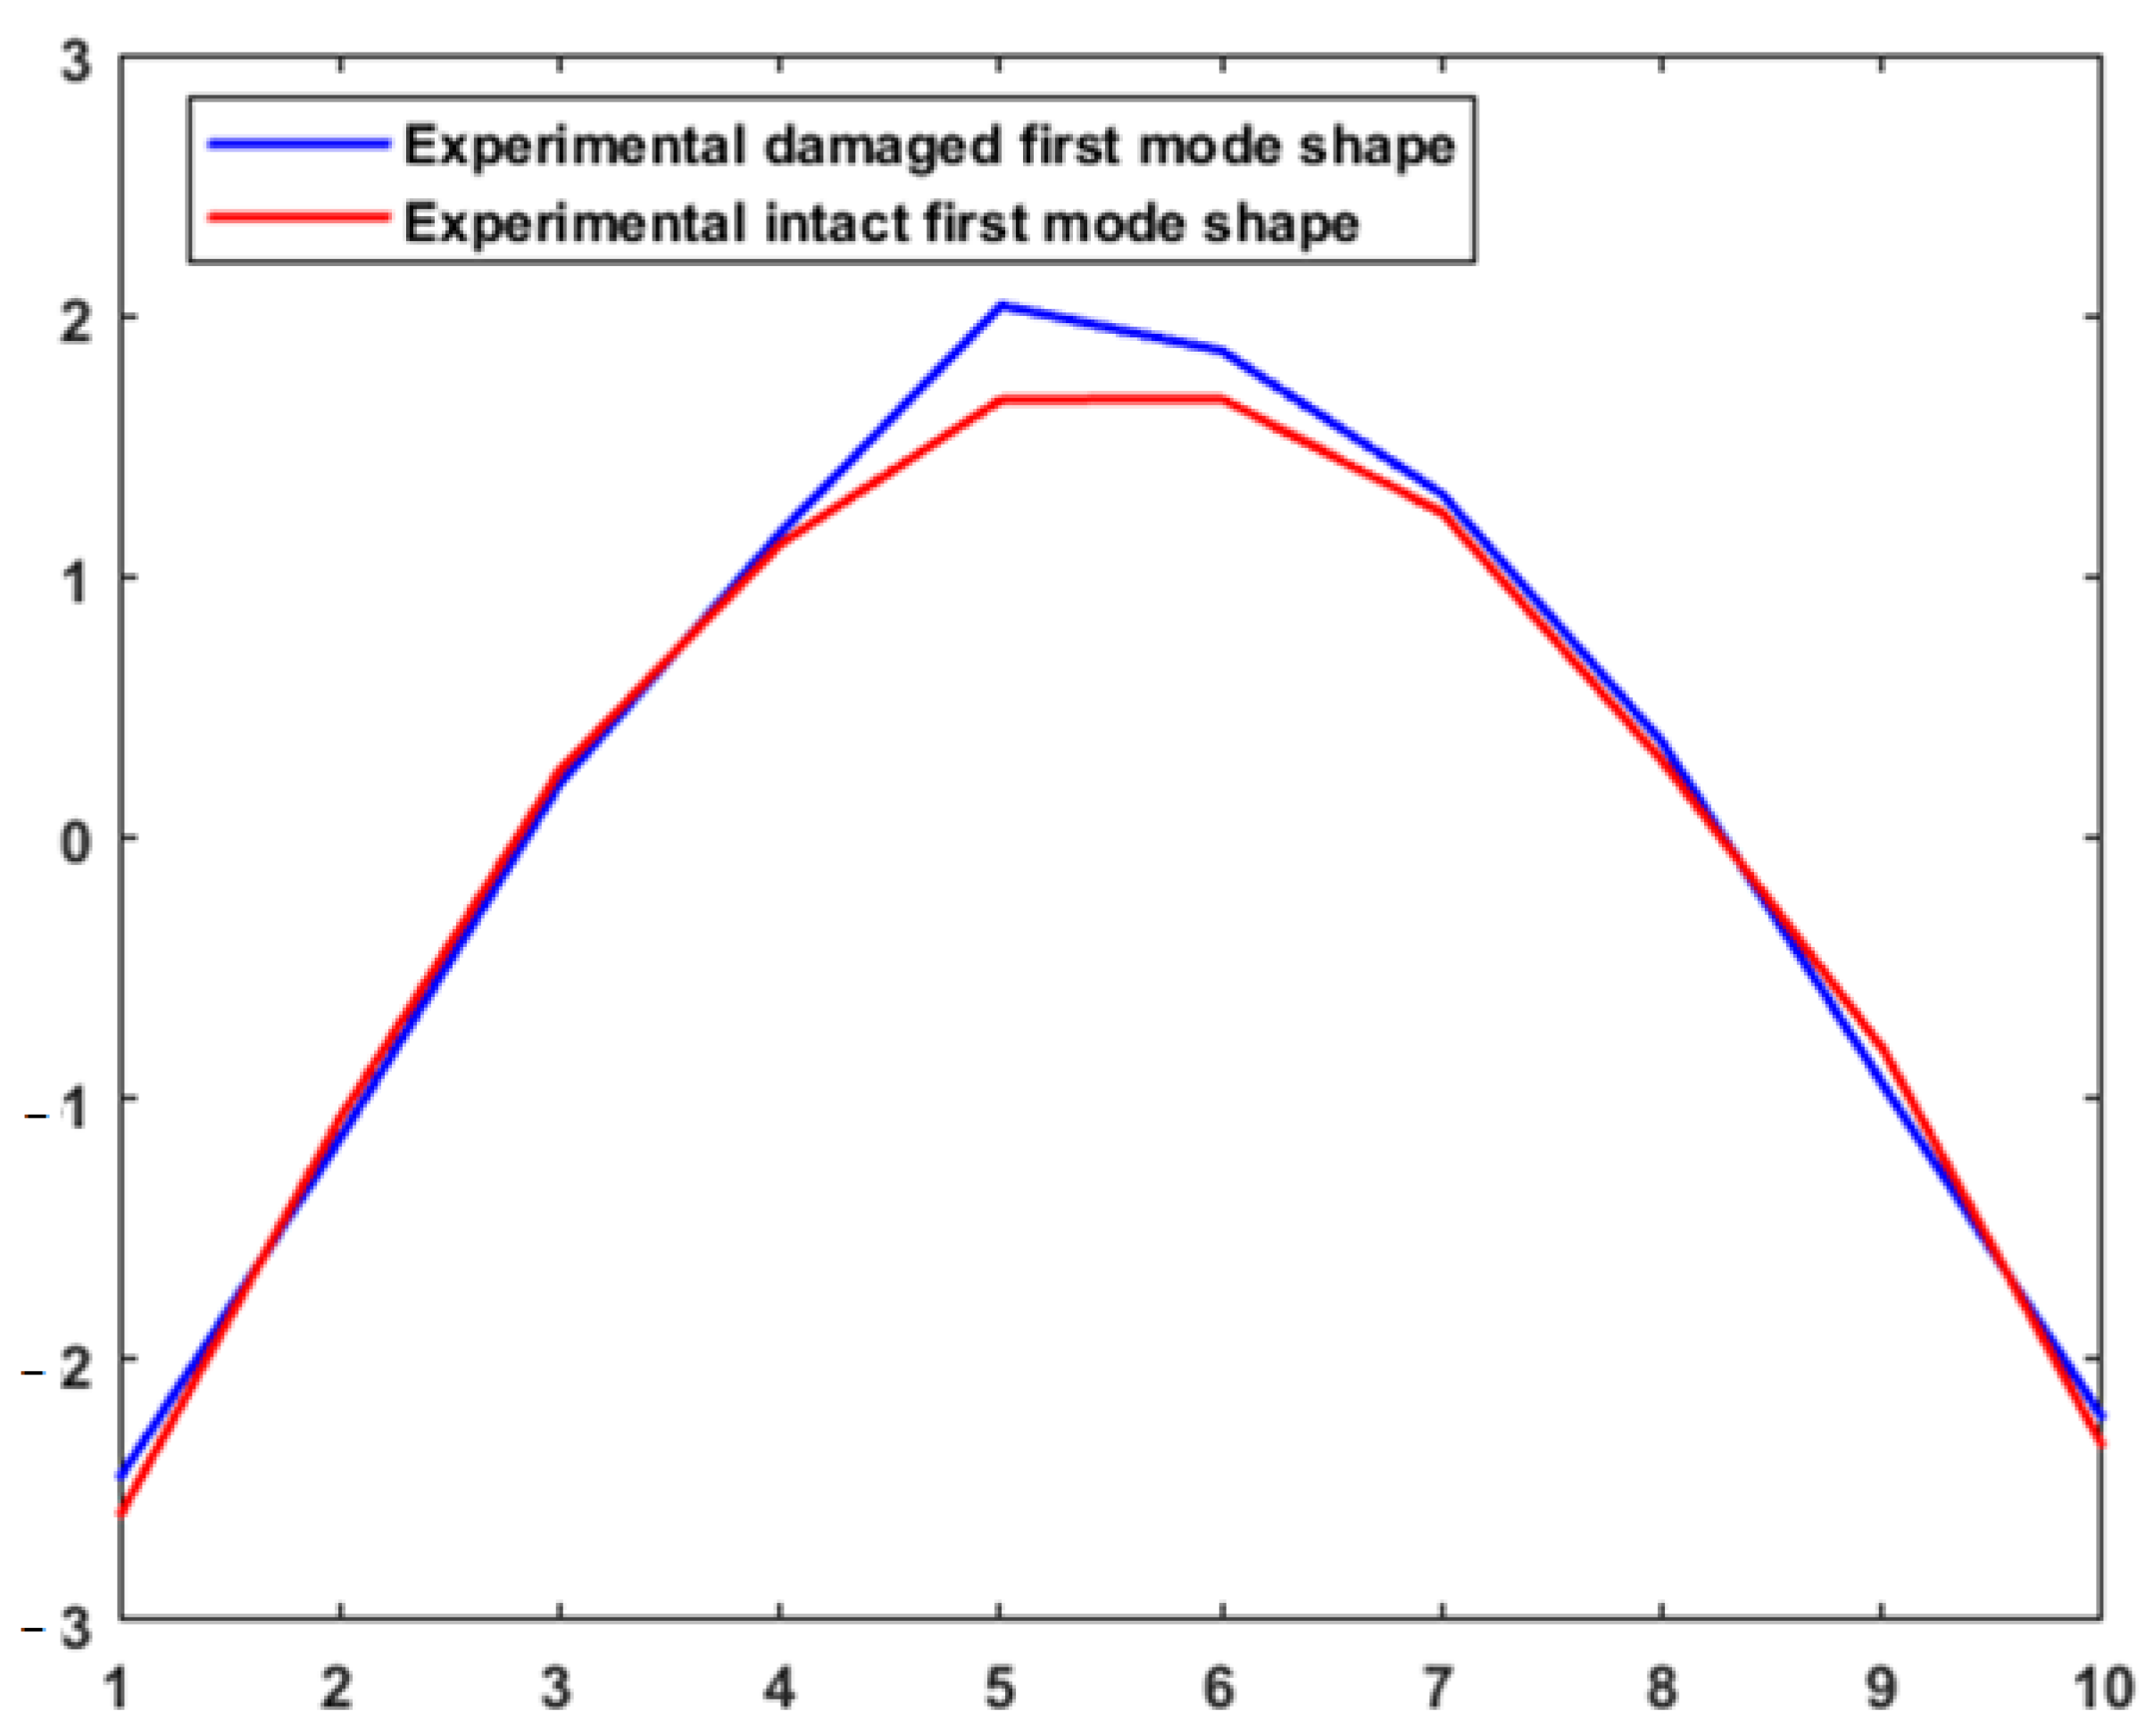
Mathematics 10 02689 g016
Figure 17. Experimental damaged and intact first mode shapes.
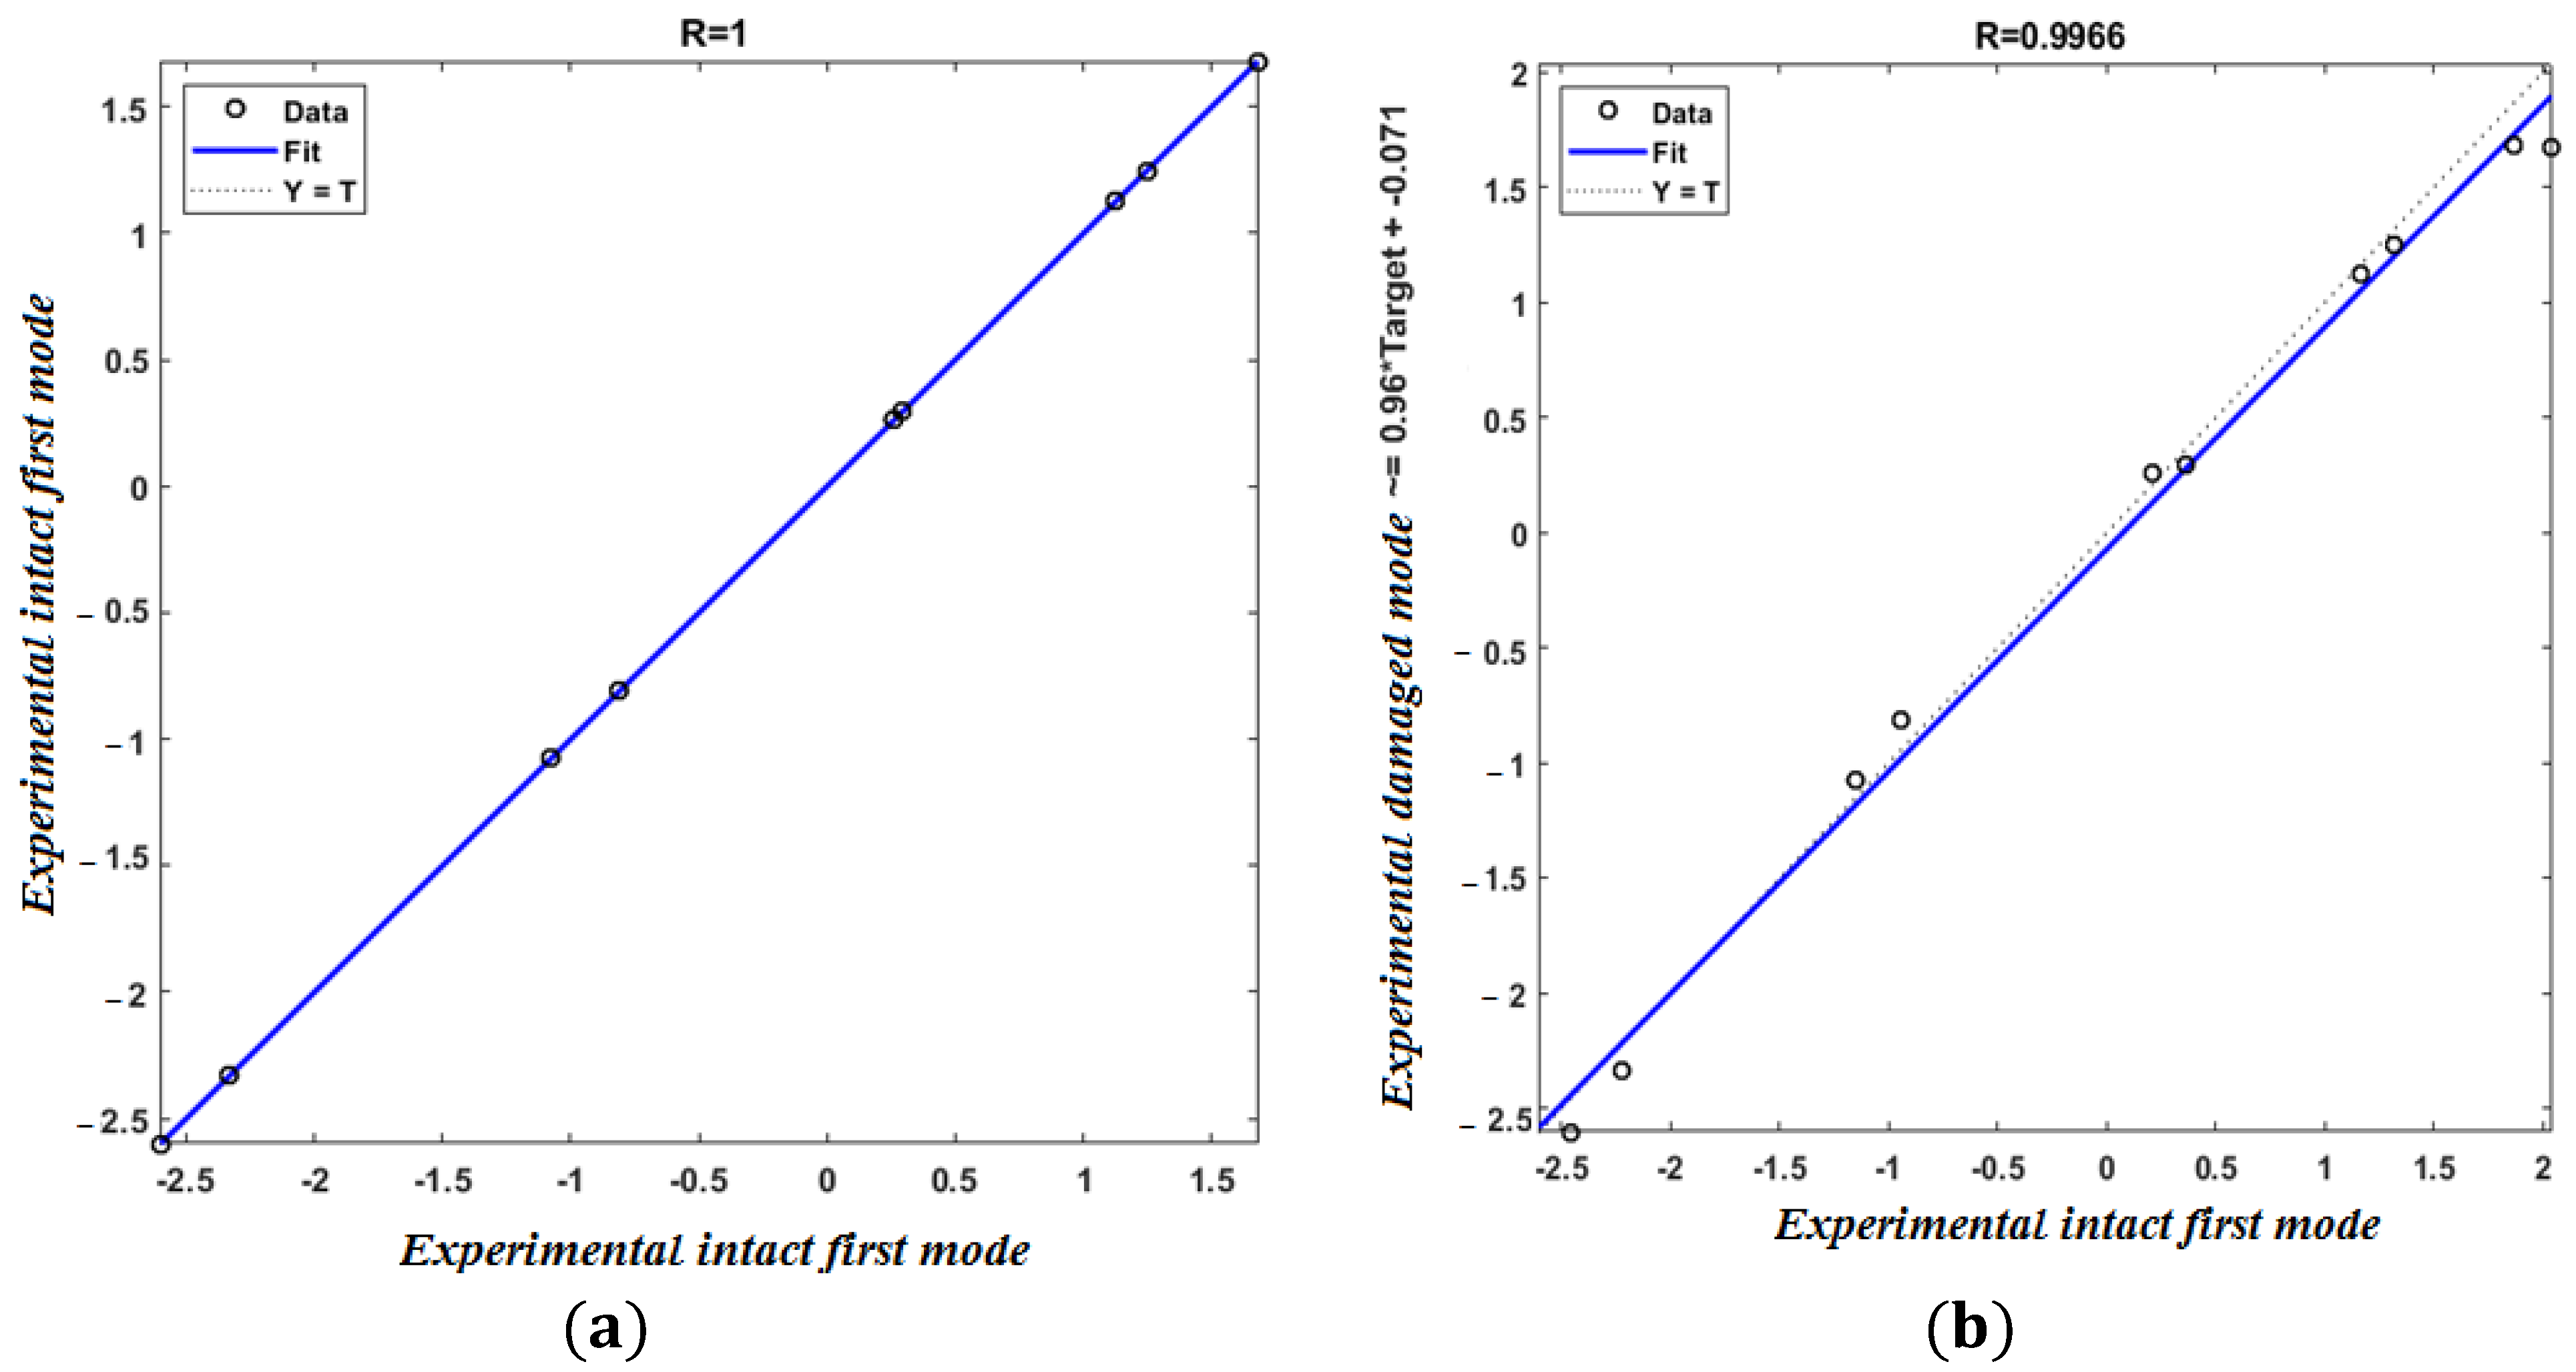
Mathematics 10 02689 g017
Figure 18. Regression plot for (a) regression diagram for two experimental intact mode shapes and (b) regression diagram for experimental damaged and intact mode shapes.
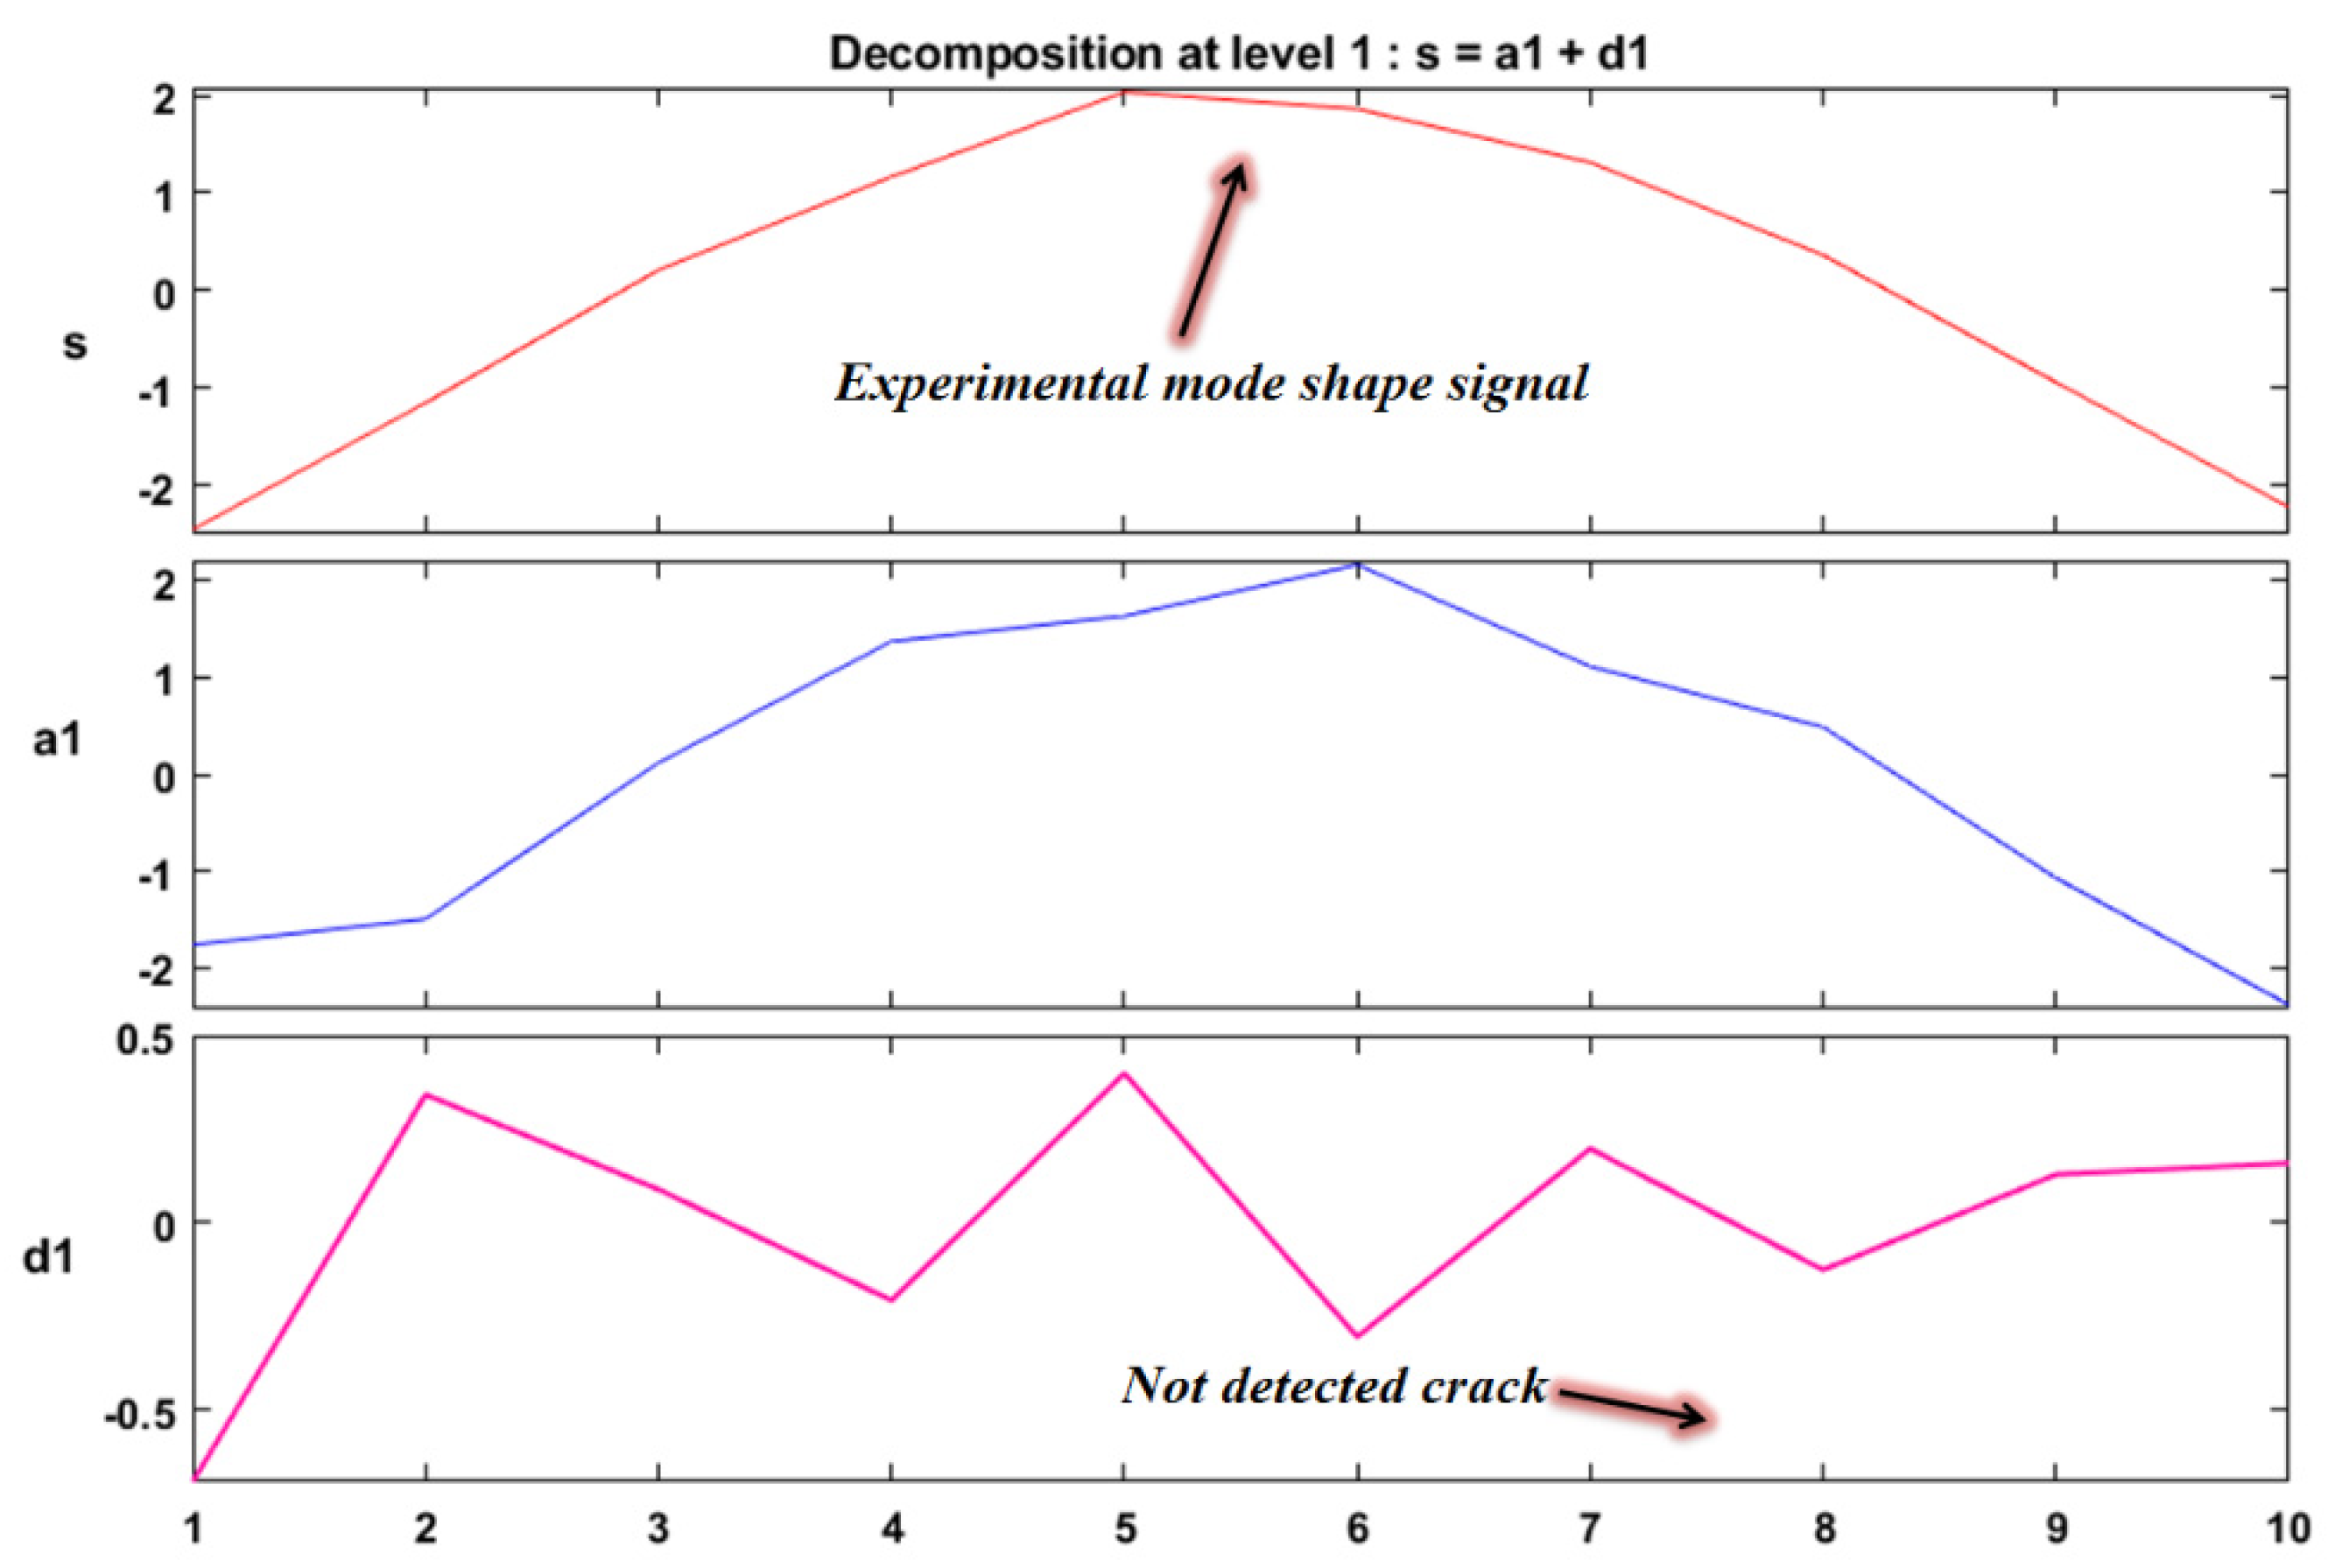
Mathematics 10 02689 g018
Figure 19. Damage detection by 1D-DWT from experimental damaged mode shape.
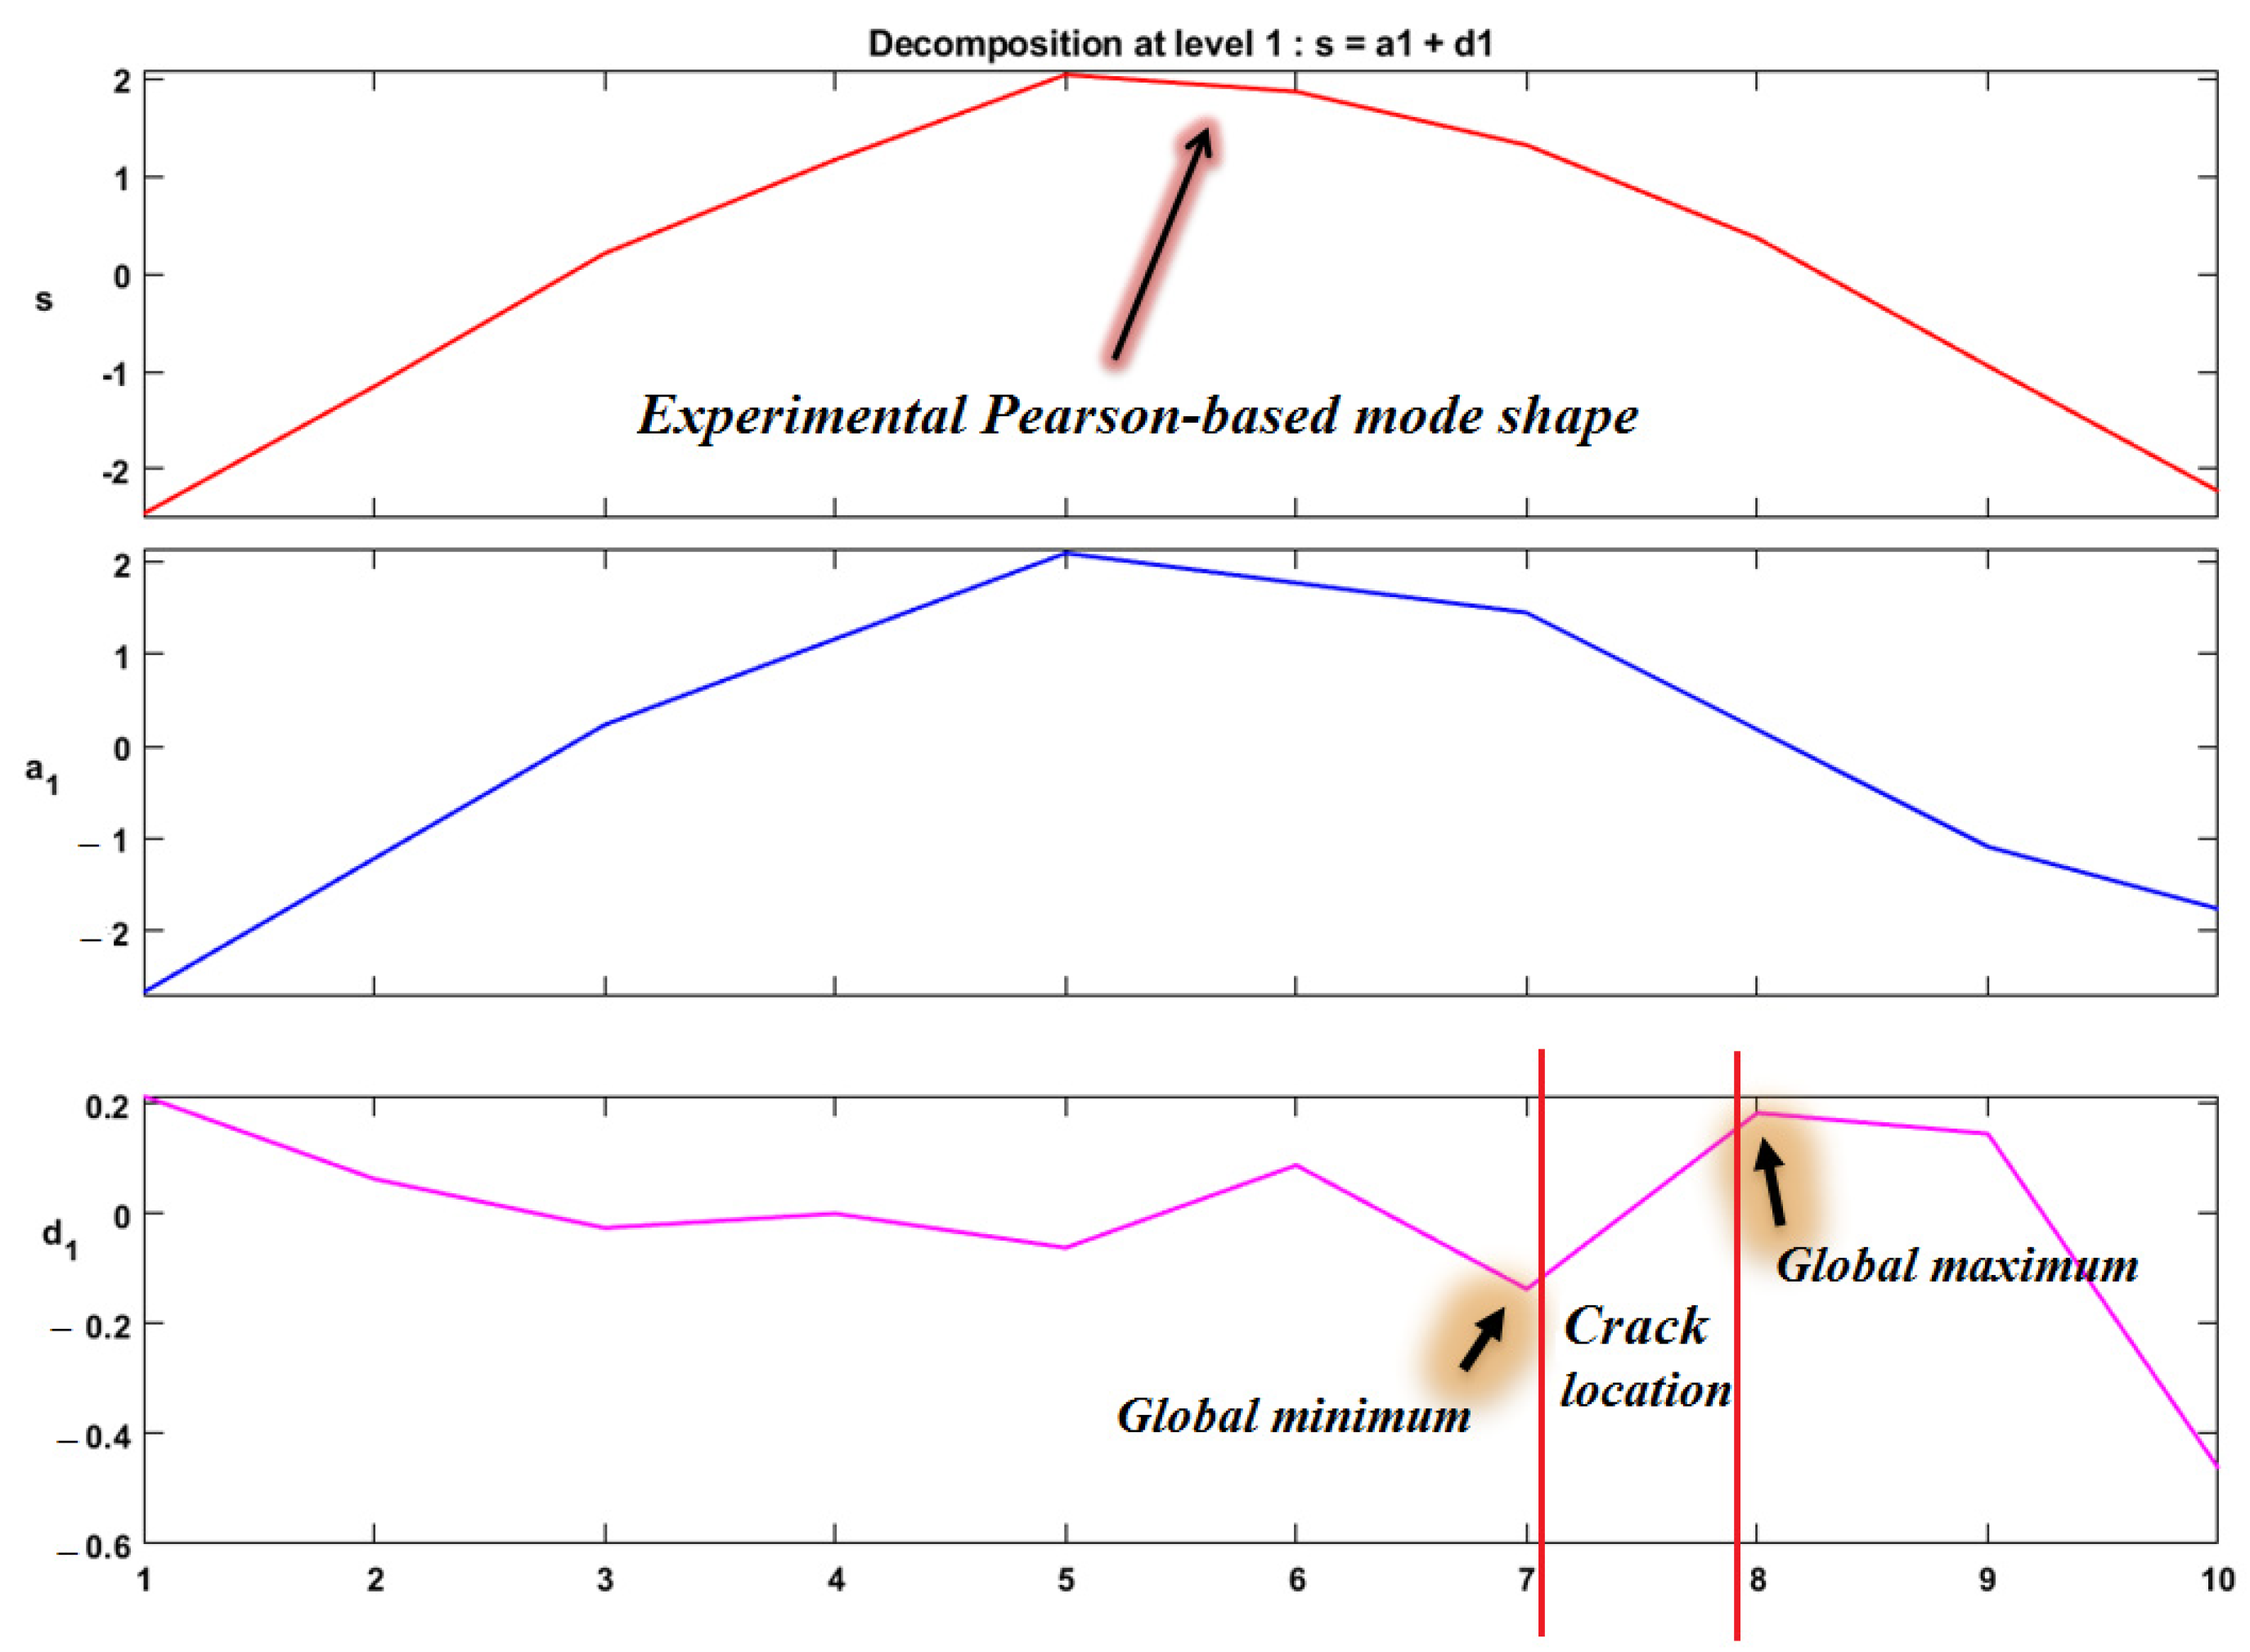
Mathematics 10 02689 g019
Figure 20. Damage detection by 1D-DWT from the Pearson-based coefficient extracted from experimental intact and damaged mode shapes.
Mathematics 10 02689 g020
Table 1. The constant properties of the studied beam structure.
PropertySymbolValue (Unit)
Cross-sectional area (m2)A1.82 × 10−4
Moment of inertia (m4)I1.46 × 10−9
Density (kg/m3)ρ2685
Total length of beams (m)L0.5
length of each element (m)le0.1
Table 2. Four damage scenarios for structural health monitoring.
Scenarios No.Damage LocationDamage Level
Element No.Nodes No.
12039, 40, 4190%
22039, 40, 4170%
32039, 40, 4150%
42039, 40, 4130%
Table 3. Three damage scenarios for structural health monitoring.
Scenarios No.Damage LocationDamage Level
Element No.Nodes No.
12039, 40, 4190%
22039, 40, 4170%
32039, 40, 4110%
Table 4. Experimental natural frequencies and damping coefficients of the intact steel beams.
Mode Number12
Frequency (Hz)27.30973.9782
Structural Damping coefficient0.00370.0019
Table 5. Experimental normalized mode shapes obtained from the modal test of the intact steel beam.
Node NumberMode 1Mode 2
1−2.599334−2.051736
2−1.0765460.222916
30.2602431.82904
41.1259641.509068
51.6779290.790353
61.68134−0.780846
71.246111−1.89759
80.294394−2.135082
9−0.808516−0.486373
10−2.3318911.687432
Table 6. Experimental natural frequencies and damping coefficients of the damaged steel beams.
Mode Number12
Frequency (Hz)27.30373.9384
Structural Damping coefficient0.00350.0012
Table 7. Experimental normalized mode shapes obtained from the modal test of the damaged steel beam.
Node NumberMode 1Mode 2
1−2.455124−1.785898
2−1.1534950.273122
30.2094851.536691
41.1681281.984244
52.0385650.724189
61.864971−0.814256
71.316461−1.883213
80.365667−1.860149
9−0.942927−0.424004
10−2.2253171.283471
Publisher’s Note: MDPI stays neutral with regard to jurisdictional claims in published maps and institutional affiliations.

