
Co-Occurrence-Based Double Thresholding Method for Research Topic Identification


1
Department of Computer and Information Technology, Politehnica University of Timisoara, V. Parvan 2, 300223 Timisoara, Romania
2
Department of Electrical and Computer Engineering, Stony Brook University, State University of New York, Stony Brook, NY 11794-2350, USA
3
Department of Automation and Applied Informatics, Politehnica University of Timisoara, V. Parvan 2, 300223 Timisoara, Romania
*
Authors to whom correspondence should be addressed.
Mathematics 2022, 10(17), 3115; https://0-doi-org.brum.beds.ac.uk/10.3390/math10173115
Submission received: 29 June 2022
/
Revised: 26 July 2022
/
Accepted: 29 August 2022
/
Published: 30 August 2022
(This article belongs to the Special Issue Artificial Intelligence and Machine Learning Based Methods and Applications)
Abstract
:Identifying possible research gaps is a main step in problem framing, however it is increasingly tedious and expensive considering the continuously growing amount of published material. This situation suggests the critical need for methodologies and tools that can assist researchers in their selection of future research topics. Related work mostly focuses on trend analysis and impact prediction but less on research gap identification. This paper presents our first approach in automated identification of feasible research gaps by using a double-threshold procedure to eliminate the research gaps that are currently difficult to study or offer little novelty. Gaps are then found by extracting subgraphs for the less-frequent co-occurrences and correlations of key terms describing domains. A case study applying the methodology for electronic design automation (EDA) domain is also discussed in the paper.
Keywords:
research gap; natural language processing; co-occurrence matrix; double-thresholding methodMSC:
68T501. Introduction
Identifying potential research gaps is one of the main steps leading toward successful problem framing and then fruitful research achievements. It is rooted in the systematic and comprehensive review of the scientific literature and other related material. With the exponential growth in the number of publications and published work, this activity becomes increasingly laborious and time-consuming, indicating a critical need for automatic tools to assist researchers when selecting their future research themes.
In an effort to automatize research gaps identification, natural language processing (NLP) provides an effective starting point in extracting valuable information from the published body of knowledge, such as by employing term co-occurrence analysis techniques [1]. Such techniques are able to map entire scientific fields to offer cues for identifying unexplored, insufficiently investigated, and mature/well-explored areas [2], hence orienting research towards new and potentially hot topics.
Present NLP research does not directly tackle research gap identification, as it is mainly focused on identifying research trends and fronts. For this, three basic scientometric approaches, as well as their diverse combinations, are employed [3]: (a) exploring the dynamics of scientific production in order to model the growth of scientific knowledge within a given domain [4], a representative example in this respect being the identification of the research trends in the field of tourism based on the areas of dispersion and concentration of the scientific information, coupled with the investigation of the scientific influence and productivity of publications [5]; (b) citation network analysis that traces the interest and relevance of a topic within the scientific community, based on the evolution and dynamics in the number of citations, including its diverse forms like patent citation analysis [6] or co-citation analysis [7]; (c) content analysis. To investigate which scientific areas are rising in popularity using content analysis, a widely used approach is to employ co-word analysis [8,9] and topic modeling to extract the main topics from a relevant scientific document corpus and to explore their time evolution [10,11,12,13,14].
Even though the mentioned research directions have offered unique insights into research domain dynamics, they do not address the discovery of new research gaps and problems. Trend analysis predicts the likely evolution of a research domain and its impact, including the number of citations that a published paper is expected to receive. However, traditional trend analysis does not study the potential connections across different domains and trends, even though many current research needs have a cross-disciplinary nature.
To the best of our knowledge, this work provides the first attempt to automatize the identification of feasible research gaps by analyzing the correlations between a chosen set of key terms (specific to the scientific domain of interest), followed by a double-threshold procedure to discard the research gaps that are difficult to study with the existing knowledge or may offer little novelty. To discover feasible research gaps from a given scientific domain described as an undirected graph of key terms, the method extracts the subgraphs characterized by less-frequent and hence unsolidified links, or, in other words, by key term co-occurrences lying in a particular interval that assures the needed levels of expected novelty and likely success of the research topic.
This paper makes the following contributions:
- A formalization of the feasible research gap identification problem using graph theory and term co-occurrences. Considering that any given scientific domain can be represented as an undirected weighted graph characterized by a finite set of nodes (i.e., key terms) and its corresponding cost adjacency matrix in the form of co-occurrence matrix extracted from publication corpus, this paper is the first that formalizes the feasible research gap discovery process as a subgraph extraction problem driven by novelty and success expectations concepts.
- A NLP methodology to solve this problem by using term co-occurrence analysis and a carefully tailored double-threshold method able to retain only the research gaps that are characterized by adequate novelty and success expectations.
- An illustrative case study on applying the proposed methodology for the electronic design automation (EDA) domain.
The rest of the paper is structured as follows. Section 2 formalizes the feasible research gap discovery problem. Section 3 and Section 4 present a new double-threshold method and the proposed methodology to solve this problem, respectively. In Section 5 a case study for extracting feasible research gaps within a specified scientific area from EDA is presented. Finally, conclusions are summarized in Section 6.
2. Problem Formulation
Our goal is to automatically identify research gaps that have the potential to be studied with current theories, methods, and technologies to produce a novel contribution. A set of key terms (e.g., keywords) describes the scientific area where the research gap identification process is focused. We formulated this problem as a graph theoretic problem, as follows.
Let us consider a weighted undirected graph , where each of the n key terms describing a scientific area is a vertex from the set , is the set of edges, and weight associates the correlation of a pair of key terms with the corresponding edge. Research gap identification finds all the induced connected subgraphs of a specified order s of graph G that assure a correlation between key terms that can provide sufficient novelty and success expectations.
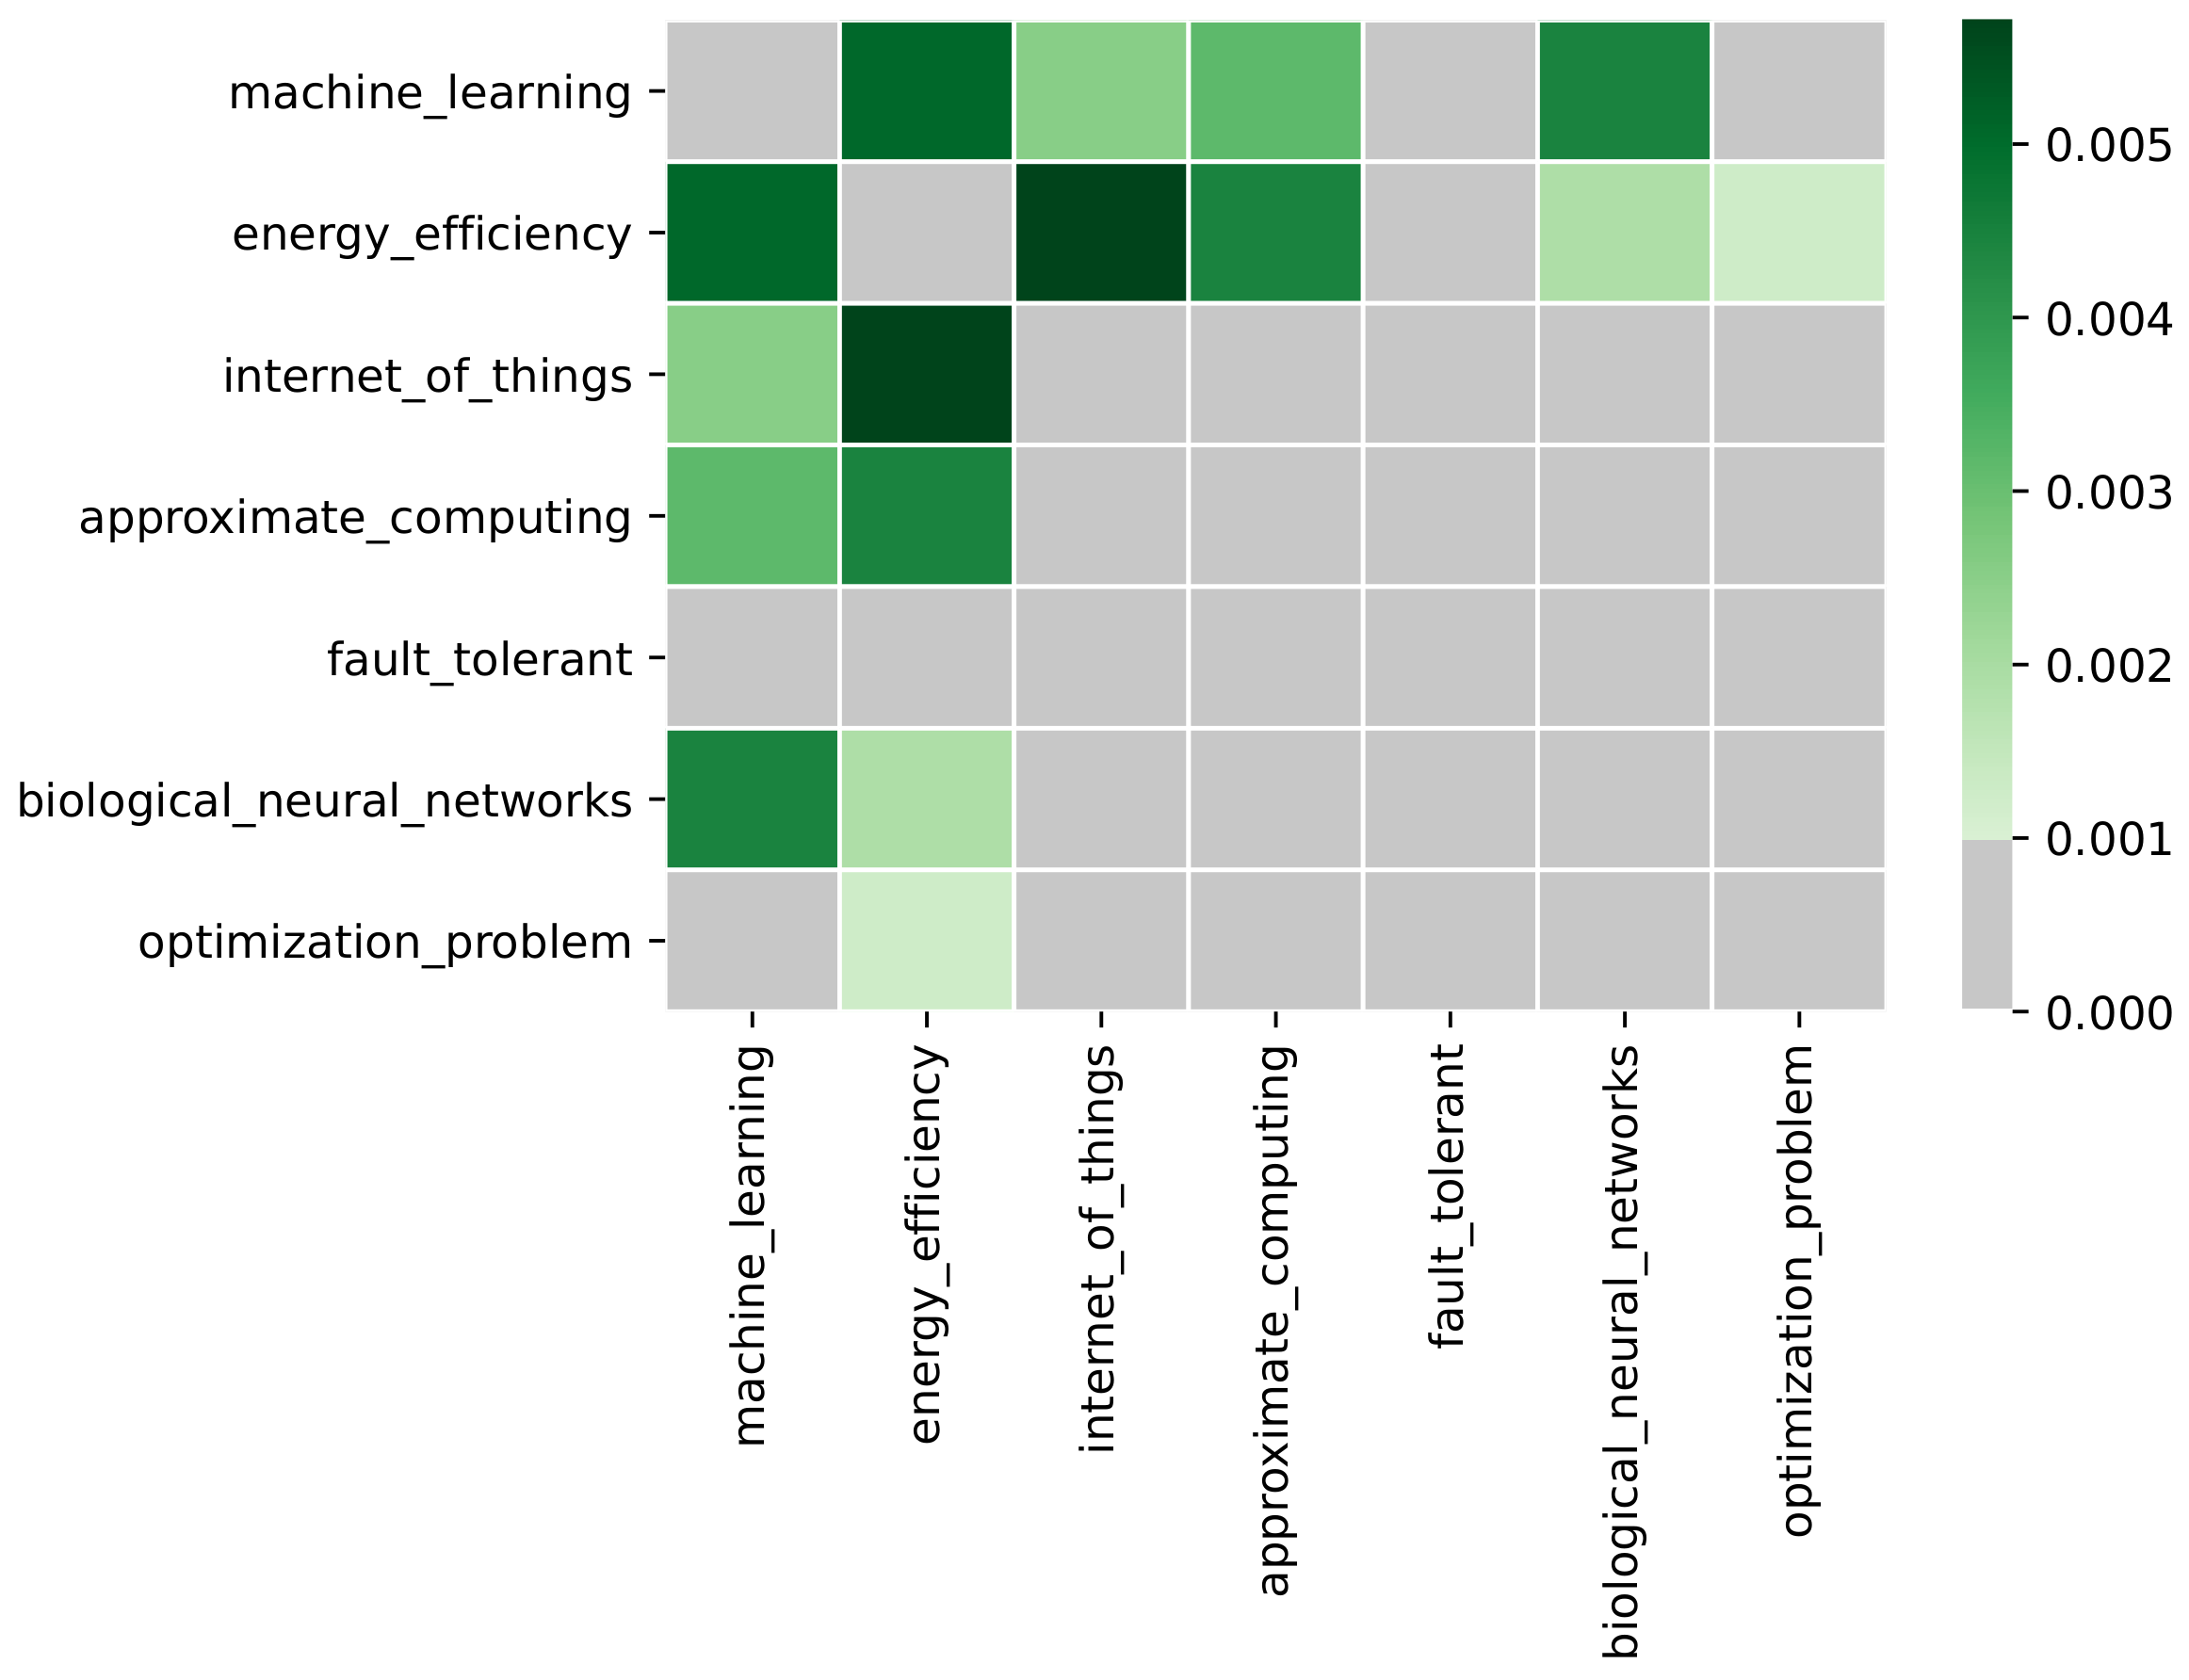
Co-occurrence is a popular solution in natural language processing (NLP) research to model the correlation between terms [15,16]. It refers to the frequency of the simultaneous presence of two terms in the documents of a corpus [17]. The higher the co-occurrence value, the stronger the expected semantic relationship between terms. Similarly, using term co-occurrences, we described the weighted undirected graph by its symmetric cost adjacency matrix in the form of the co-occurrence matrix M of order n, where n is the number of the selected key terms that characterize the scientific domain under investigation. Each element is the number of documents in which both key terms and occur, normalized by the total number of documents in the considered corpus. Thus, and can be interpreted as the average frequency in which the two terms appear in the same document.
Solving research gap identification required the addressing of two related subproblems: (a) finding a suitable condition for the correlation between two key terms to suggest feasibility in the suggested research themes (i.e., sufficient novelty and success expectations); (b) extracting the feasible research gap proposals by finding all the induced connected subgraphs [18], where the feasibility condition, identified by the first subproblem, is met for all edges. The next section proposes a solution to the first subproblem, while an integrated research gap identification methodology is presented in Section 4.
3. Double-Threshold Method to Identify Potential Research Gaps
Since not every research gap is a viable starting point for new research projects, it is important to identify the research gaps that provide enough scientific novelty at a given time moment using the available methods and materials. To address this issue, we proposed a new double-threshold method to identify the feasible research gaps based on the term co-occurrence matrix.
3.1. Modeling
To develop a method for identifying feasible research gaps based on the NLP approach, we first analyzed the underlying information behind the co-occurrence of two key terms, denoted by and , in a document corpus. We observed the following two aspects:
- A very low value for not only indicates that the two terms are hardly encountered in the same document but may also suggest that the current state of knowledge is not well developed to link them or that the two terms may be incompatible. Hence, selecting terms with a co-occurrence lower than threshold may likely result in an unfeasible research theme, in this sense playing the role of “critical mass”. We denoted this threshold as success threshold since is expected to offer a more likely successful ratio. Note that the successful integration of the two terms and in a new research topic gets higher when raising the co-occurrence value.
- A very high value of generally indicates that the link between the two terms and is strong as the two terms were often encountered together in the same document. This situation may derive from an intensively studied term connection, suggesting that including the two terms in the newly framed research topic might likely be a lesser source of novelty. Thus, selecting terms that have a co-occurrence higher than threshold may result in a research theme with small novelty. We named as the novelty threshold, where may provide an acceptable novelty. Note that the potential novelty induced by the two terms and inside a new research topic is continuously decreasing for over the interval contrary to the success ratio that is continuously increasing over the same interval.
3.2. Double-Threshold Method
We argue that in the co-occurrence matrix for selected terms only the elements belonging to the interval must be retained, where is the indicator for the expected success rate of a research theme and is the novelty threshold. Table 1 summarizes the procedure to identify feasible research gaps based on the double-threshold method using the co-occurrence matrix for the selected context terms and the key term. For , the research gap is valueless since its novelty prospects are reduced, while for , the research gap cannot be likely tackled using existing theories, materials, and methods.
Term co-occurrences are corpus-dependant. For example, a document corpus that characterizes a broader scientific domain offers lower co-occurrence values for the same pairs of key terms and . Consequently, the selection of the novelty and success thresholds needs to be a result of an exploratory corpus analysis.
3.2.1. Success and Novelty Thresholds Selection
Given a statistically significant document corpus of size , the novelty and success threshold values can be found using the following three-step procedure:
- Extract the key term topics from the document corpus using appropriate NLP topic modeling techniques, and then identify the most relevant p key terms within each of the r topics.
- Compute all co-occurrences between the most relevant p key terms within each of the r topics. These co-occurrences, denoted by , are calculated in the same way as , i.e., the number of documents in which both key terms and occur, normalized by the total number of documents in the considered corpus.
- Select the success threshold and the novelty threshold by trimming the ends of the distribution.
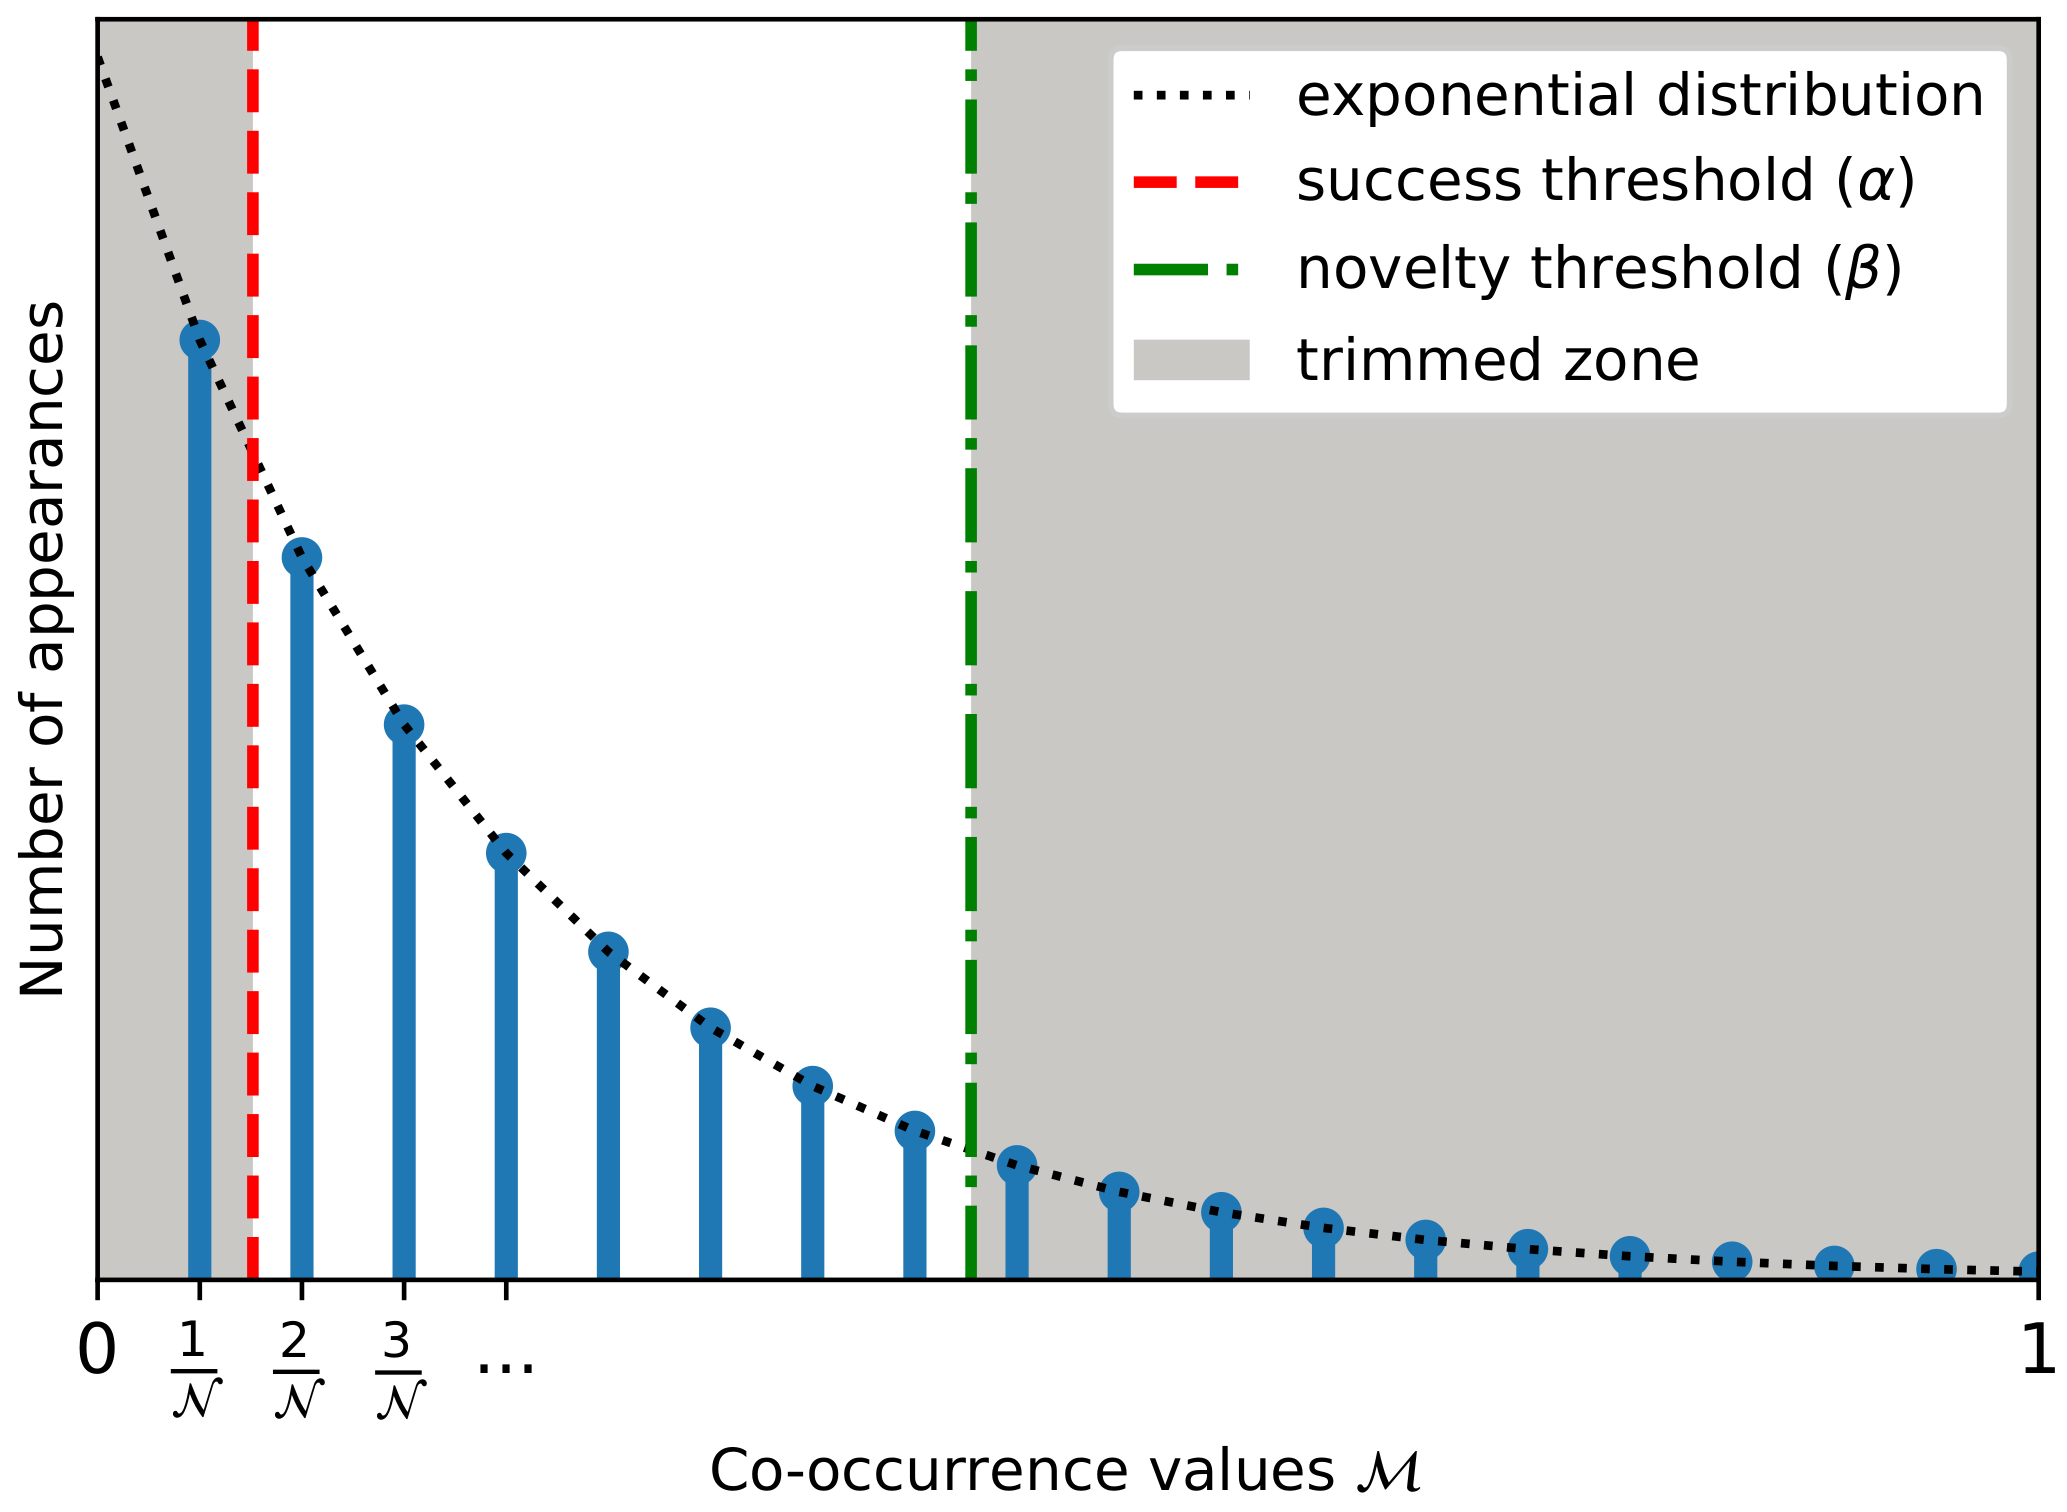
To identify a suitable procedure to select the two thresholds, we analyzed the probability distribution of the values within the considered statistically significant document corpus of size . We found that the terms co-occurrence values have two important properties: (i) considering the way they are computed, may take only particular values inside interval, namely multiples of ; (ii) their distribution is heavily skewed to zero, with no negative values and few observations deviating far from zero. Thus, we can model the distribution of the term co-occurrences as an exponential-like distribution, where and act as two thresholds producing a two-sided trimmed exponential distribution (Figure 1). Neglecting the null values of , we may select and such that each of the thresholds filters out approximately 10–30% of the values, a practical selection being and , with and being the first and third quartiles.
Using the success and novelty thresholds, we retain only the values inside the interval , which are considered in the acceptance range.
It is noteworthy to mention that our double-threshold approach can be tailored to cope with the researcher’s risk profile. For this, similar to the definition of financial risk tolerance [19], we could define research risk tolerance as being the maximum amount of uncertainty that a researcher is willing to accept when framing a new research theme. According to the researcher’s risk tolerance, we can classify research theme framing in three categories, each of them being characterized by a chosen pair of success and novelty thresholds :
- 1
- Conservative framing—low research risk described by ;
- 2
- Moderate framing—median research risk described by ;
- 3
- Aggressive framing—high research risk described by .
Here, the success threshold values hold , while the novelty threshold values hold . All six threshold values must be selected using the third step of the above thresholds selection procedure.
4. Proposed Methodology
The methodology proposed to automatically recommend feasible research gaps extracted from a given scientific area described by a chosen set of key terms is as follows:
- 1
- Select a suitable document corpus to identify the research gaps. For this, top-tier journal or conference papers within the scientific domain that encapsulates the given set of key terms are suitable options.
- 2
- Calculate the co-occurrence matrix corresponding to the set of key terms to describe the weighted undirected graph . A recent subset of documents from corpus can be used, e.g., no older than two years for timely research gaps.
- 3
- Apply the double threshold procedure described in Section 3 to drop all edges from for which lays outside the interval. By this, a new graph , with the corresponding adjacency matrix , is obtained. In order to derive the success threshold and the novelty threshold , the entire document corpus is used to obtain more statistically significant values.
- 4
- Provide the list of feasible gap recommendations using the double-thresholded version of the co-occurrence matrix to extract all induced connected subgraphs [18] of order s from , where s is the number of key terms considered to adequately depict a feasible research gap.
To help rank the recommendations, for each feasible gap the mean co-occurrence value (i.e., average co-occurrence for the induced connected subgraph of order s) is computed using the following formula:
where the summation includes only the co-occurrences for the induced connected subgraph edges that describe the feasible research gap, and the denominator is the number of all possible edges within the subgraph. The higher this metric is, the higher the success is and the lower the novelty.
At the end of this methodology, a set of feasible research gap proposals (i.e., sets of key terms), ranked by corresponding the mean co-occurrence values, is offered to the user, and the researcher is invited to drop all unrealistic gaps (such as gaps with no meaning) and to select one based on his/her goals and expertise.
5. Case Study
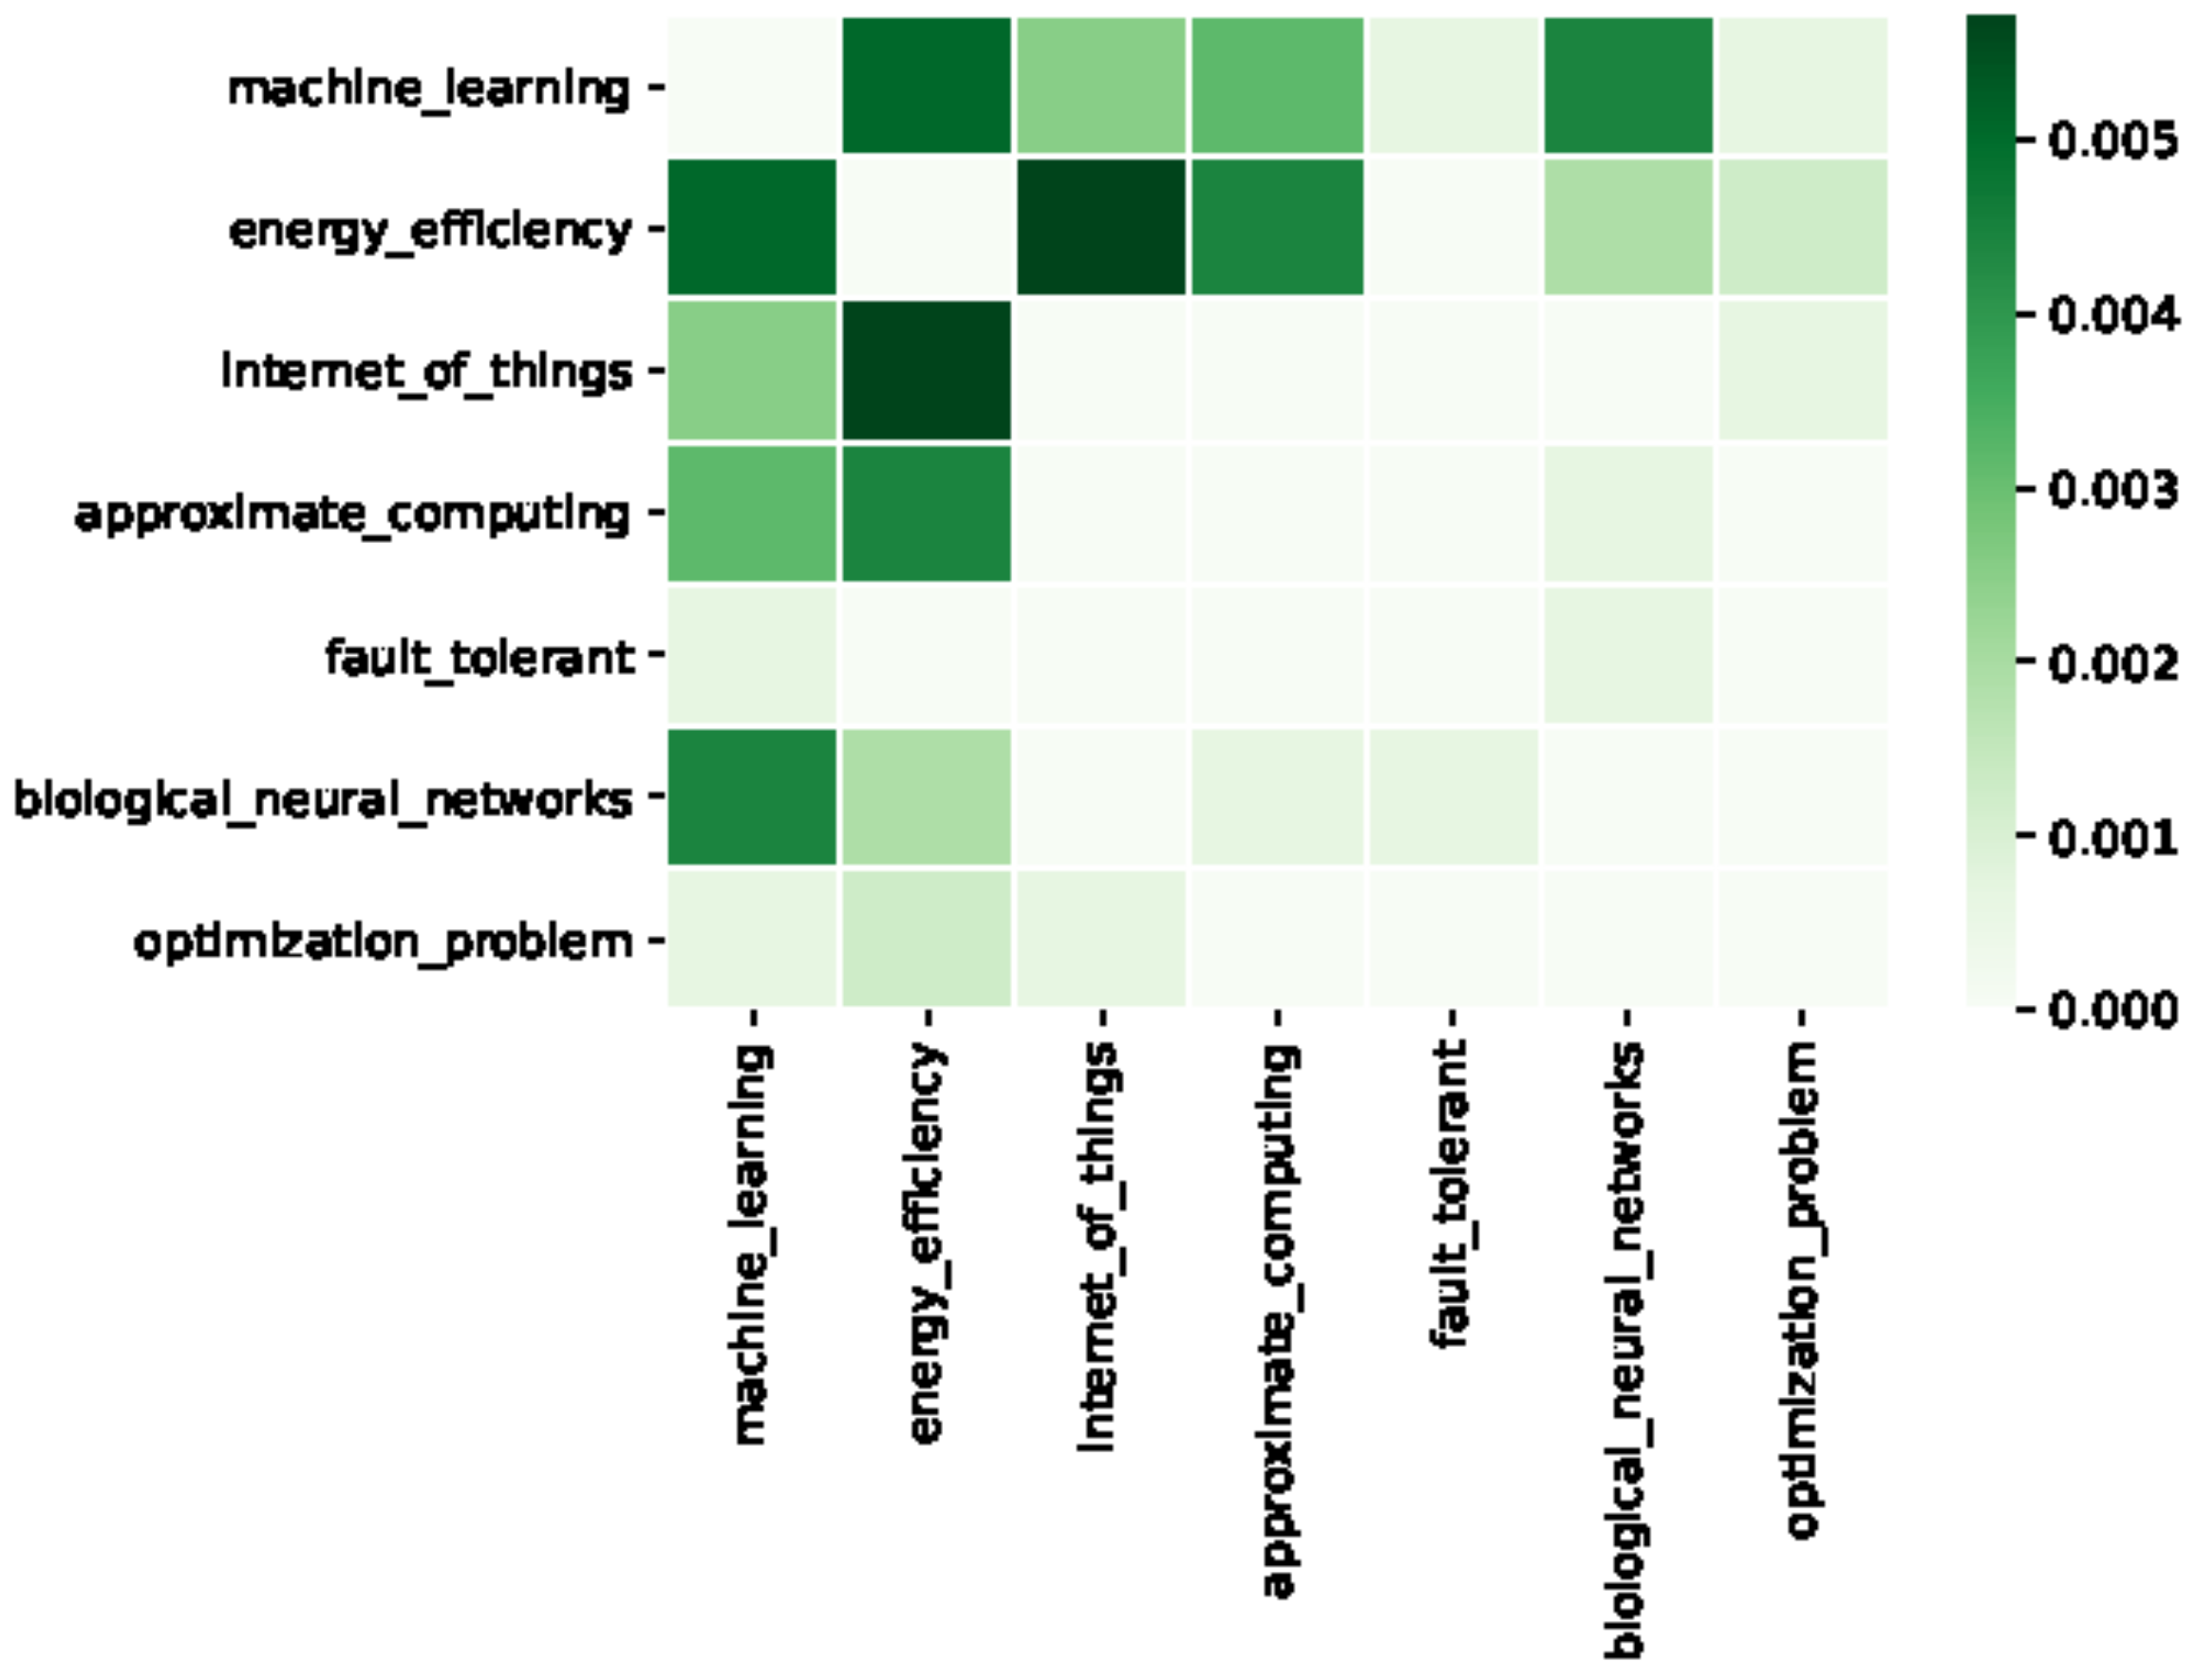
We evaluated the proposed methodology for research gap identification for the electronic design automation (EDA) scientific domain. Research in this area can be described by a set of key terms containing the following elements: ‘machine learning’, ‘energy efficiency’, ‘internet of things’, ‘approximate computing’, ‘fault tolerant’, ‘biological neural networks’, and ‘optimization problem’. Other similar sets can be found as well. Details about each of the four steps of the methodology are presented next.
- 1
- We selected IEEE Transactions on Computer-Aided Design of Integrated Circuits and Systems (TCAD), a top tier EDA journal, to build a suitable document corpus for our methodology. After extracting journal paper metadata from the IEEEXplore database, a compound abstract was produced for each journal paper by concatenating its title, keywords, and abstract. All compound abstracts were transformed in sequences of relevant terms (i.e., processed abstracts) by using the TagMe entity linking tool [20] with the link-probability parameter set to 0.1.
- 2
- 3
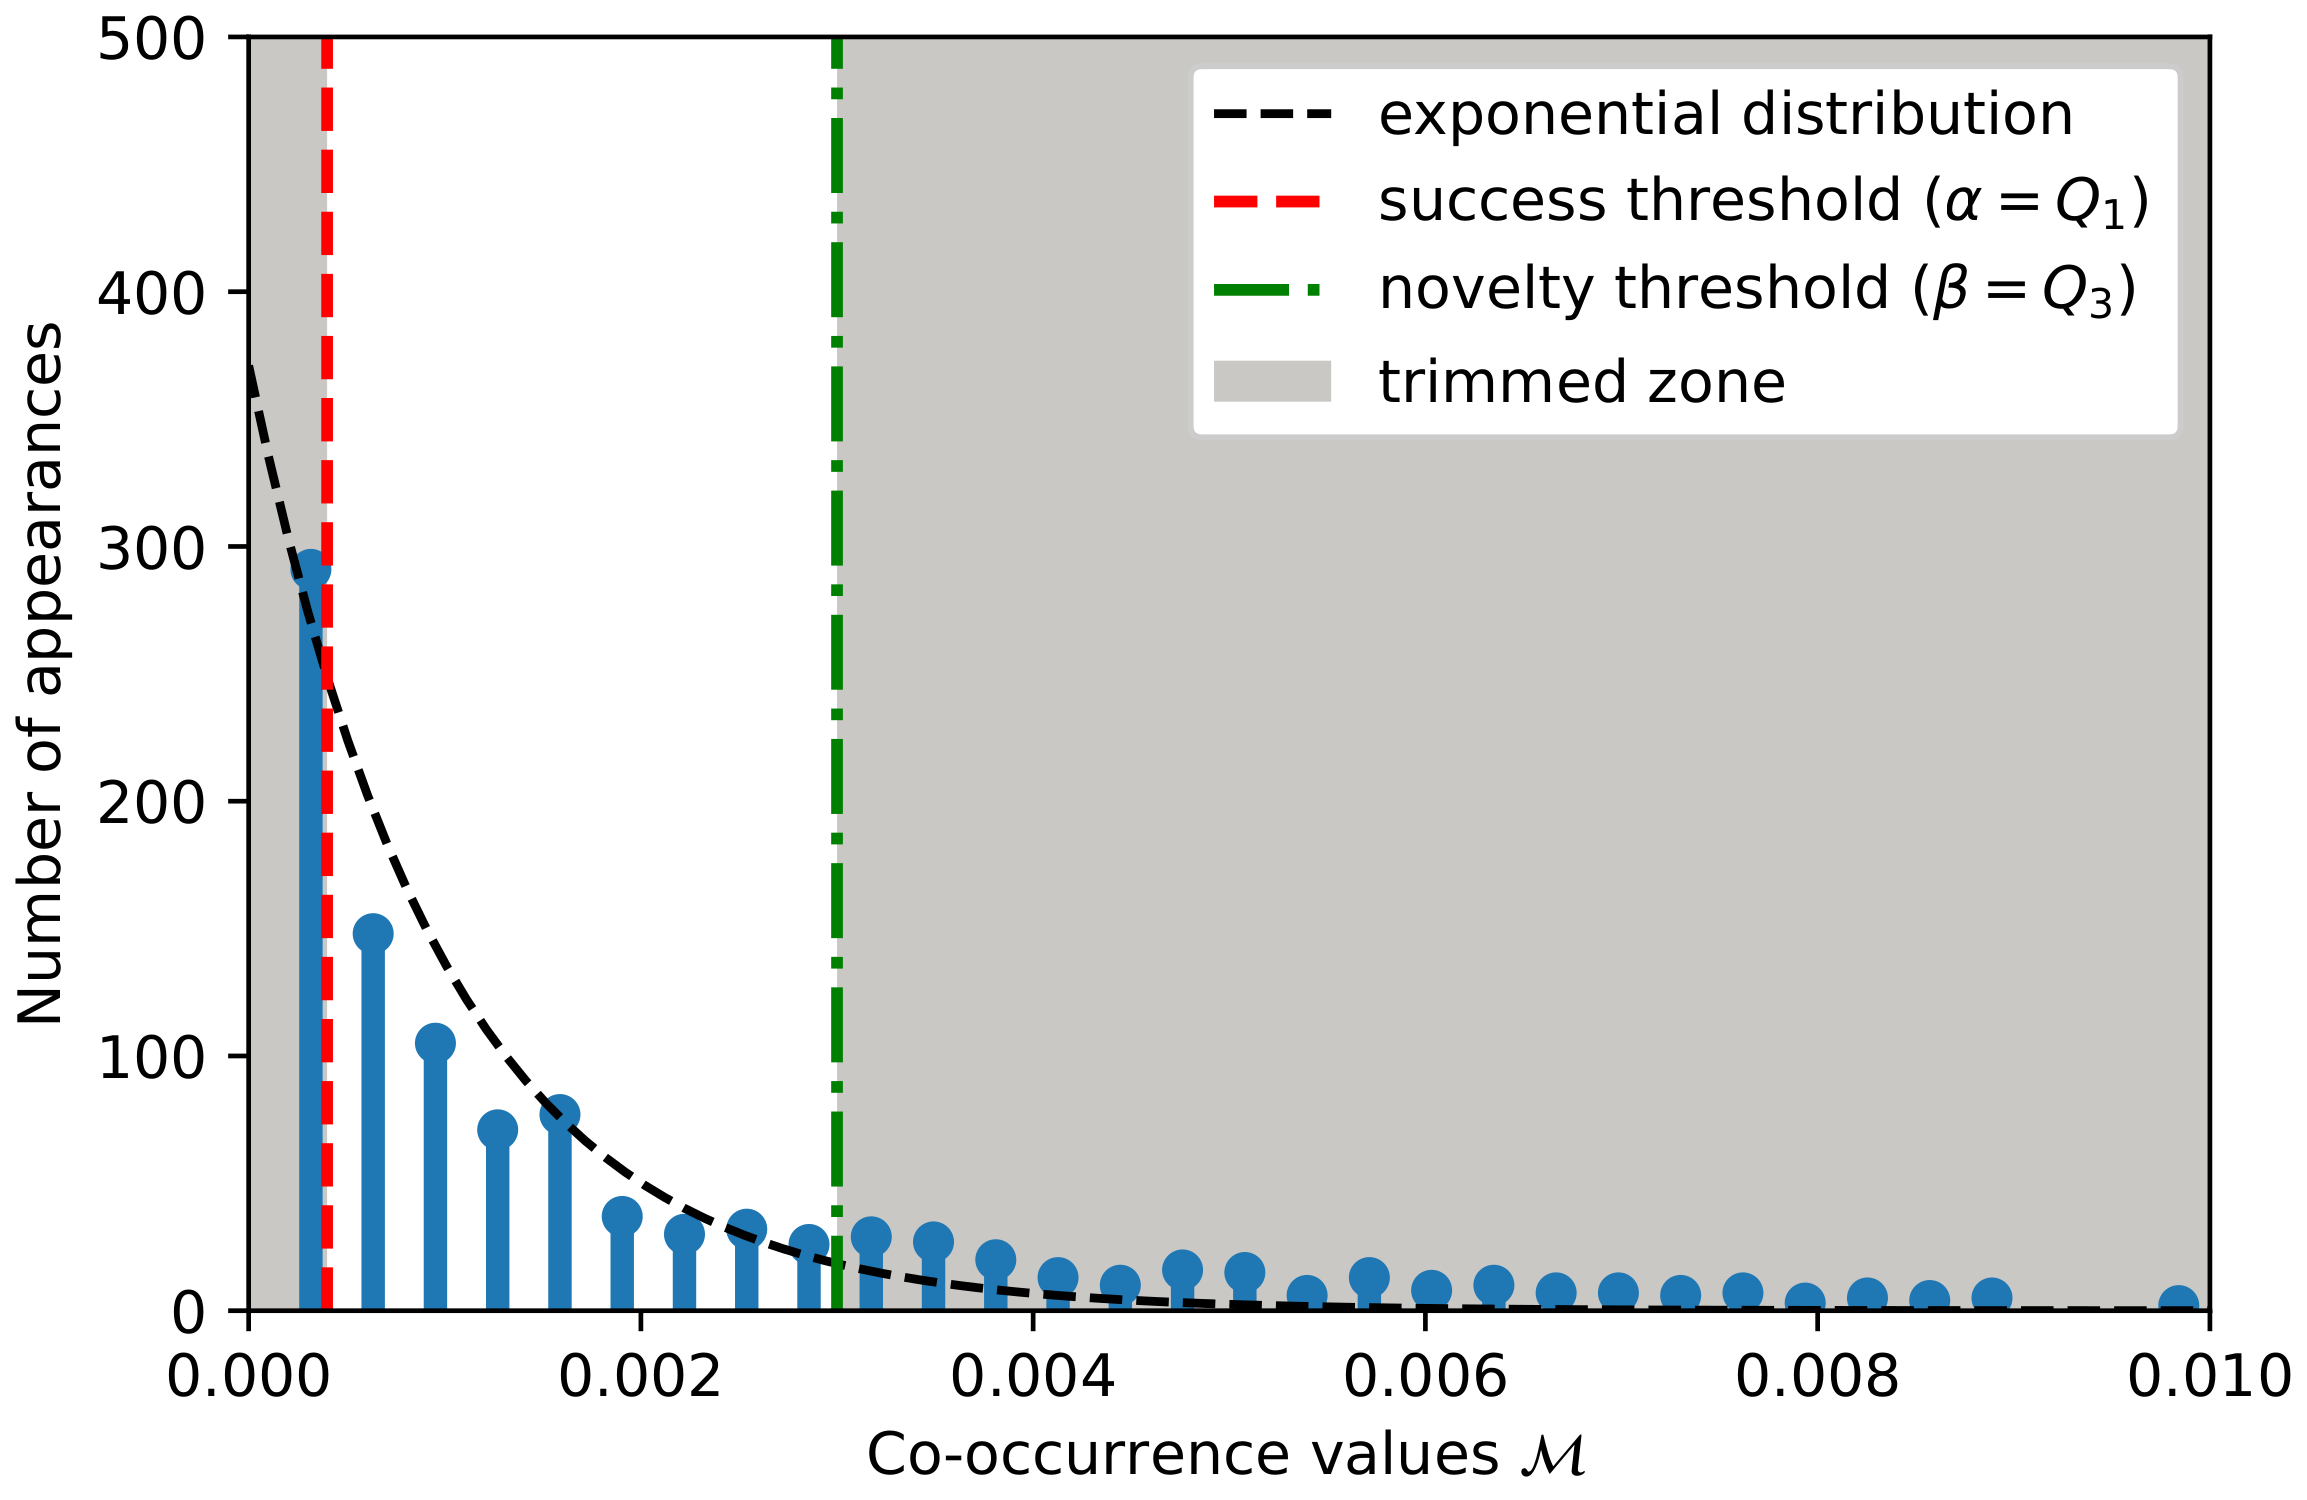
- To apply the double threshold procedure described in Section 3, we first derived the success threshold and the novelty threshold using the entire document corpus (i.e., TCAD papers from 2010 to 2020). For this, we performed a latent Dirichlet allocation (LDA) topic modeling [21] for topics, and selected the most relevant terms within each of the topics to obtain the co-occurrences. The histogram of the co-occurrences and the selection of the and thresholds according to the procedure described in Section 3.2.1 are presented in Figure 4.
- 4
- Assuming that a set of four key terms are appropriate to characterize a potential research gap, we extracted the following list of feasible research gaps (i.e., all induced connected subgraphs of order s = 4), ranked by their corresponding value:
- (a)
- ‘machine learning’, ‘energy efficiency’, ‘internet of things’, ‘approximate computing’; .
- (b)
- ‘machine learning’, ‘energy efficiency’, ‘internet of things’, ‘biological neural networks’; .
- (c)
- ‘machine learning’, ‘energy efficiency’, ‘approximate computing’, ‘biological neural networks’; .
- (d)
- ‘machine learning’, ‘energy efficiency’, ‘internet of things’, ‘optimization problem’; .
- (e)
- ‘machine learning’, ‘energy efficiency’, ‘approximate computing’, ‘optimization problem’; .
- (f)
- ‘energy efficiency’, ‘internet of things’, ‘approximate computing’, ‘biological neural networks’; .
- (g)
- ‘machine learning’, ‘internet of things’, ‘approximate computing’, ‘biological neural networks’; .
- (h)
- ‘energy efficiency’, ‘internet of things’, ‘biological neural networks, ‘optimization problem’; .
- (i)
- ‘energy efficiency’, ‘approximate computing’, ‘biological neural networks’, ‘optimization problem’; .
From these research gap recommendations, we selected two potential research topics, and we offer their textual descriptions in Table 2.
Figure 2.
Heatmap visualization of the co-occurrence matrix M.

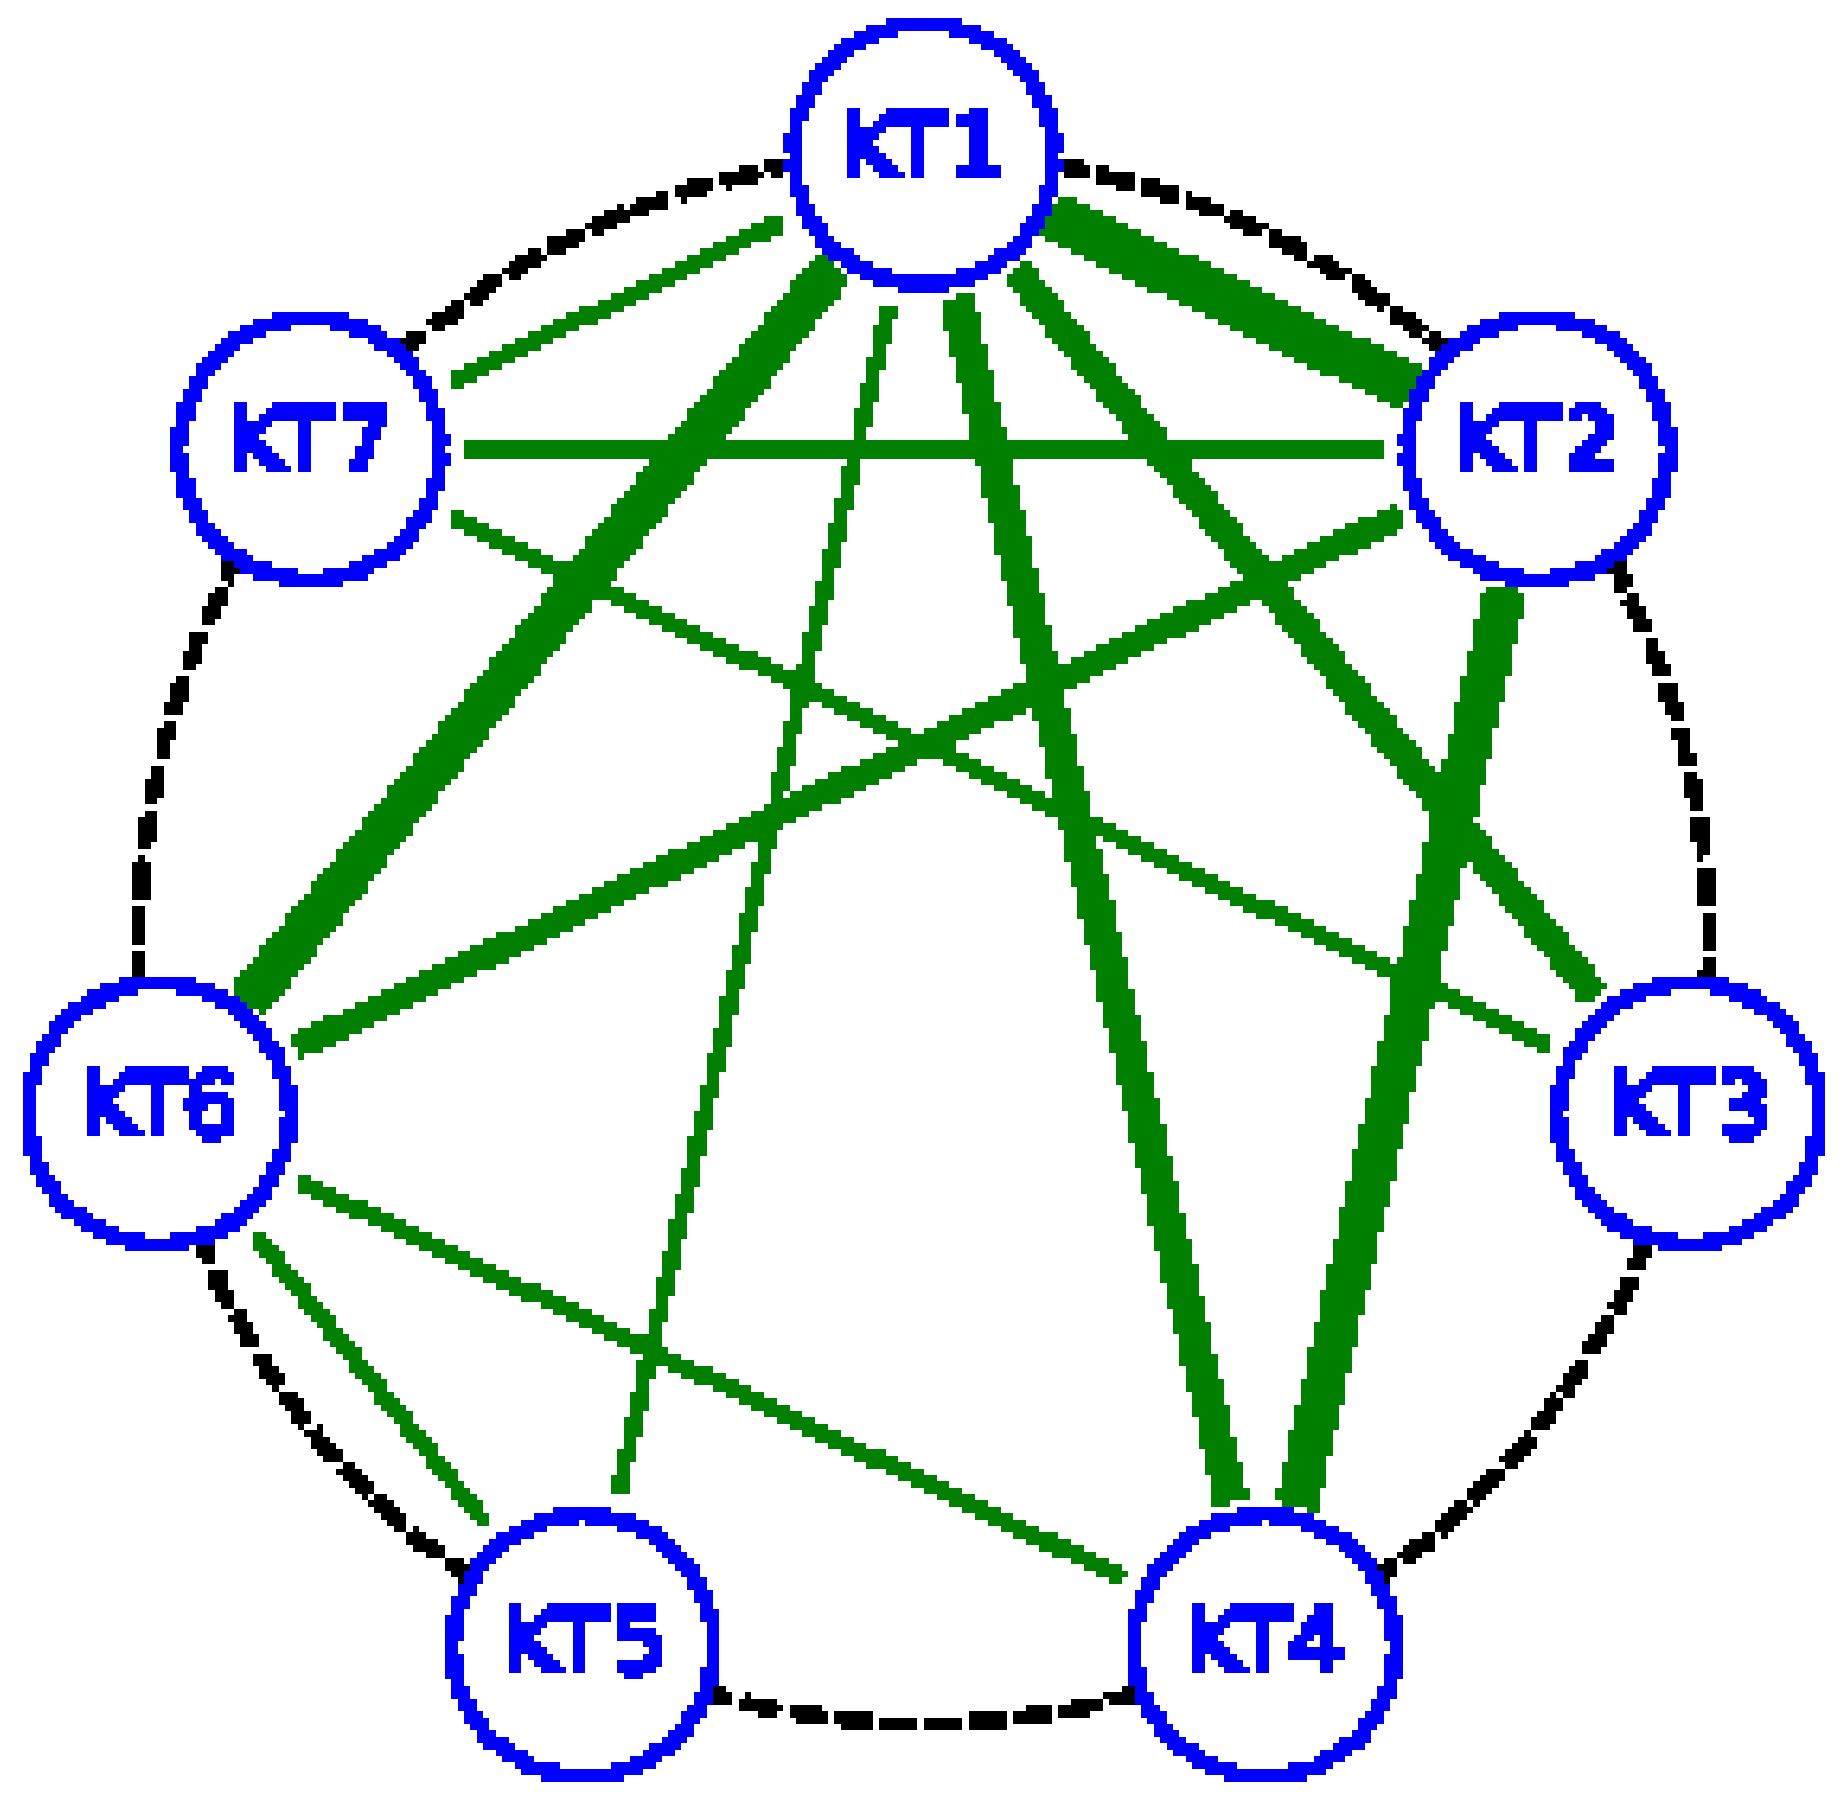
Figure 3.
The original graph G of key terms.

Figure 4.
Histogram of the co-occurrences and threshold values selection.

Figure 5.
Visualization of feasible research gaps using heatmap.

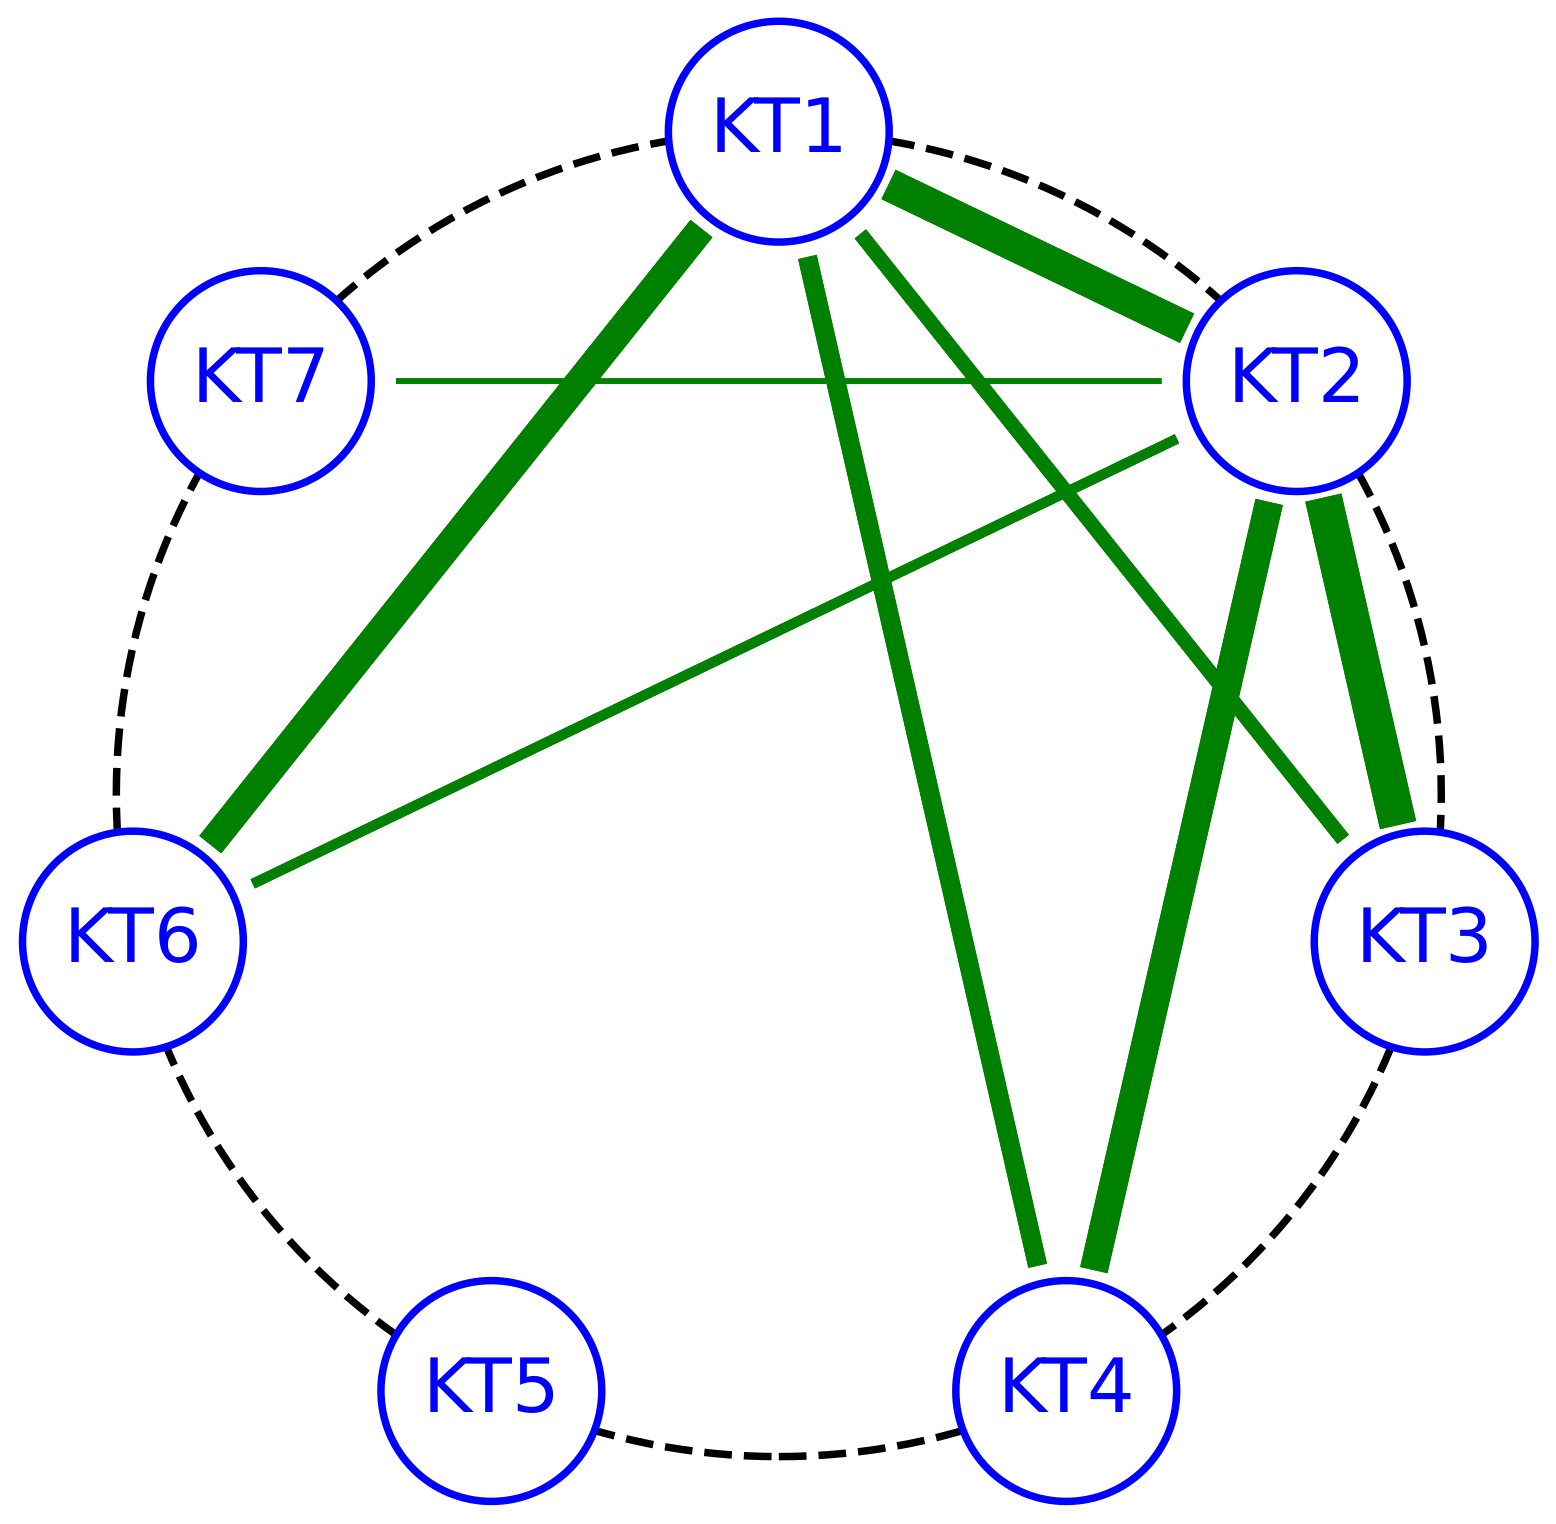
Figure 6.
Visualization of feasible research gaps using chord diagram.


Table 2.
Potential research topics in the EDA domain.
| No. | Feasible Research Gap Terms | Research Theme Description | |
|---|---|---|---|
| 1. | KT1: machine learning KT3: internet of things KT4: approximate computing KT6: biological neural networks | Biological neural networkinspired algorithms for approximate computing inMLfor IoTapplications. | |
| 2. | KT1: machine learning KT2: energy efficiency KT3: internet of things KT7: optimization problem | Design of integrated circuits for IoT applicationsoptimizedfor energy efficiencyby means of ML. |
If we consider the researcher risk categories described in the last paragraph of Section 3.2 (i.e., conservative framing ; moderate framing ; aggressive framing ) and the number of terms to characterize possible research gaps , a sample of recommendations was produced, as presented in Table 3.
6. Conclusions
Identifying potential research gaps is a main step toward successful problem framing and hence fruitful research achievements. This activity has become very cumbersome due to the increase in the number of publications and published papers. Hence, automatic tools are necessary to assist researchers to select their future research themes. Related techniques can explore research trends by mapping scientific fields’ unexplored or insufficiently investigated areas, but do not study potential connections across different domains and trends, even though current research needs are often cross-disciplinary in nature.
This paper discusses a method for automated identification of feasible research gaps by graph-theoretic analysis of the correlations between key terms (specific to the scientific domain of interest), followed by a double-threshold procedure to discard the research gaps that are difficult to study with the existing knowledge or may offer little novelty. The method extracts the subgraphs for the less-frequent graph links to express research key terms that are likely to be part of problem descriptions of expected novelty and likely success. A case study uses the proposed method to find research gaps for the electronic design automation (EDA) domain. Starting from a document corpus based on IEEE TCAD, the method extracted subgraphs for less-frequent co-occurring keywords for different researcher risk profiles. The subgraphs were then utilized for research gap description.
Future work will focus on extending the method by devising algorithms to automatically select the parameters of the methods, such as the co-occurrence distributions, and the two threshold values. We also plan to enhance our method by including a citation analysis component and to use other publication corpora for EDA, as well as experiment with different domains.
Author Contributions
Conceptualization, C.-D.C.; methodology, C.-D.C., A.D. and D.-I.C.; software, C.-D.C. and A.D.; validation, C.-D.C. and A.D.; formal analysis, C.-D.C., A.D. and D.-I.C.; investigation, C.-D.C., A.D. and D.-I.C.; resources, A.D. and D.-I.C.; data curation, C.-D.C., A.D. and D.-I.C.; writing—original draft preparation, C.-D.C. and A.D.; writing—review and editing, C.-D.C., A.D. and D.-I.C.; supervision, A.D. and D.-I.C. All authors have read and agreed to the published version of the manuscript.
Funding
This research received no external funding.
Institutional Review Board Statement
Not applicable.
Informed Consent Statement
Not applicable.
Data Availability Statement
Not applicable.
Conflicts of Interest
The authors declare no conflict of interest.
References
- Manning, C.; Schutze, H. Foundations of Statistical Natural Language Processing; MIT Press: Cambridge, MA, USA, 1999. [Google Scholar]
- Sedighi, M. Application of word co-occurrence analysis method in mapping of the scientific fields (case study: The field of Informetrics). Libr. Rev. 2016, 65, 52–64. [Google Scholar] [CrossRef]
- Mazov, N.; Gureev, V.; Glinskikh, V. The methodological basis of defining research trends and fronts. Sci. Tech. Inf. Process. 2020, 47, 221–231. [Google Scholar]
- Liu, X.; Jiang, T.; Ma, F. Collective dynamics in knowledge networks: Emerging trends analysis. J. Inf. 2013, 7, 425–438. [Google Scholar]
- Vega-Muñoz, A.; Arjona-Fuentes, J.M.; Ariza-Montes, A.; Han, H.; Law, R. In search of ‘a research front’ in cruise tourism studies. Int. J. Hosp. Manag. 2020, 85, 102353. [Google Scholar]
- Ge, Y.; Hao, G.; Xiang, L. Technology evolution network model and simulation based on patent citation network. J. Syst. Simul. 2021, 33, 591. [Google Scholar]
- Upham, S.; Small, H. Emerging research fronts in science and technology: Patterns of new knowledge development. Scientometrics 2010, 83, 15–38. [Google Scholar] [PubMed]
- Akimushkin, C.; Amancio, D.R.; Oliveira, O.N., Jr. On the role of words in the network structure of texts: Application to authorship attribution. Phys. A Stat. Mech. Appl. 2018, 495, 49–58. [Google Scholar] [CrossRef]
- Sulis, E.; Humphreys, L.; Vernero, F.; Amantea, I.A.; Audrito, D.; Di Caro, L. Exploiting co-occurrence networks for classification of implicit inter-relationships in legal texts. Inf. Syst. 2022, 106, 101821. [Google Scholar] [CrossRef]
- Chen, J.; Wei, W.; Guo, C.; Tang, L.; Sun, L. Textual analysis and visualization of research trends in data mining for electronic health records. Health Policy Technol. 2017, 6, 389–400. [Google Scholar]
- Sivanandham, S.; Kumar, A.S.; Pradeep, R.; Sridhar, R. Analysing research trends using Ttopic modelling and trend prediction. In Soft Computing and Signal Processing; Springer: Berlin/Heidelberg, Germany, 2021; pp. 157–166. [Google Scholar]
- Mohammadi, E.; Karami, A. Exploring research trends in big data across disciplines: A text mining analysis. J. Inf. Sci. 2022, 48, 44–56. [Google Scholar] [CrossRef]
- Muñoz-Leiva, F.; Viedma-del Jesús, M.; Sánchez-Fernández, J.; López-Herrera, A. An application of co-word analysis and bibliometric maps for detecting the most highlighting themes in the consumer behaviour research from a longitudinal perspective. Qual. Quant. 2012, 46, 1077–1095. [Google Scholar]
- Chen, X.; Chen, J.; Wu, D.; Xie, Y.; Li, J. Mapping the research trends by co-word analysis based on keywords from funded project. Procedia Comput. Sci. 2016, 91, 547–555. [Google Scholar] [CrossRef]
- Bird, S.; Klein, E.; Loper, E. Natural Language Processing with Python: Analyzing Text with the Natural Language Toolkit; O’Reilly Media, Inc.: Sebastopol, CA, USA, 2009. [Google Scholar]
- Hardeniya, N.; Perkins, J.; Chopra, D.; Joshi, N.; Mathur, I. Natural Language Processing: Python and NLTK; Packt Publishing Ltd.: Birmingham, UK, 2016. [Google Scholar]
- He, Q. Knowledge discovery through co-word analysis. Libr. Trends 1999, 48, 133–159. [Google Scholar]
- Gross, J.L.; Yellen, J. Handbook of Graph Theory; CRC Press: Boca Raton, FL, USA, 2003. [Google Scholar]
- Grable, J.E. Financial risk tolerance and additional factors that affect risk taking in everyday money matters. J. Bus. Psychol. 2000, 14, 625–630. [Google Scholar] [CrossRef]
- Ferragina, P.; Scaiella, U. TagMe: On-the-fly annotation of short text fragments (by Wikipedia entities). In Proceedings of the International Conference on Information and Knowledge Management, Toronto, ON, Canada, 25–29 October 2010; pp. 1625–1628. [Google Scholar]
- Blei, D.; Ng, A.; Jordan, M. Latent Dirichlet Allocation. J. Mach. Learn. Res. 2003, 3, 993–1022. [Google Scholar]
Figure 1.
Distribution of terms co-occurrence values in a corpus of size .

Table 1.
Double-threshold approach for identifying feasible research gaps.
| Succes | low | high | high |
| Novelty | high | high | low |
| Research Gap Type | Unfeasible | Feasible | None |
Table 3.
Research topic examples considering research risk.
| No. | Feasible Research Gap Terms | Research Theme Description | Scenario |
|---|---|---|---|
| 1. | KT1: machine learning KT2: energy efficiency KT3: internet of things | UsingMLfor energy-efficient IoT. | conservative |
| 2. | KT1: machine learning KT3: internet of things KT4: approximate computing KT6: biological neural networks | Biological neural networkinspired algorithms for approximate computing inMLfor IoTapplications. | moderate |
| 3. | KT1: machine learning KT2: energy efficiency KT3: internet of things KT7: optimization problem | Design of integrated circuits for IoT applicationsoptimizedfor energy efficiencyby means of ML. | moderate |
| 4. | KT1: machine learning KT4: approximate computing KT5: fault tolerant KT7: optimization problem | Approximate computingfor solving optimization problemsinfault tolerant ML. | aggressive |
| 5. | KT1: machine learning KT2: energy efficiency KT5: fault tolerant KT6: biological neural networks | Biological neural networkinspired methods for fault tolerantand energy- efficient ML. | aggressive |
Publisher’s Note: MDPI stays neutral with regard to jurisdictional claims in published maps and institutional affiliations. |
© 2022 by the authors. Licensee MDPI, Basel, Switzerland. This article is an open access article distributed under the terms and conditions of the Creative Commons Attribution (CC BY) license (https://creativecommons.org/licenses/by/4.0/).
Share and Cite
MDPI and ACS Style
Curiac, C.-D.; Doboli, A.; Curiac, D.-I. Co-Occurrence-Based Double Thresholding Method for Research Topic Identification. Mathematics 2022, 10, 3115. https://0-doi-org.brum.beds.ac.uk/10.3390/math10173115
AMA Style
Curiac C-D, Doboli A, Curiac D-I. Co-Occurrence-Based Double Thresholding Method for Research Topic Identification. Mathematics. 2022; 10(17):3115. https://0-doi-org.brum.beds.ac.uk/10.3390/math10173115
Chicago/Turabian StyleCuriac, Christian-Daniel, Alex Doboli, and Daniel-Ioan Curiac. 2022. "Co-Occurrence-Based Double Thresholding Method for Research Topic Identification" Mathematics 10, no. 17: 3115. https://0-doi-org.brum.beds.ac.uk/10.3390/math10173115
Note that from the first issue of 2016, this journal uses article numbers instead of page numbers. See further details here.