
Machine Learning Prediction of University Student Dropout: Does Preference Play a Key Role?


1
Department of Financial and Actuarial Economics & Statistics, Universidad Complutense de Madrid, 28223 Madrid, Spain
2
Faculty of Exact and Technological Sciences, Universidad Nacional de Concepción, Concepción 010123, Paraguay
*
Author to whom correspondence should be addressed.
Mathematics 2022, 10(18), 3359; https://0-doi-org.brum.beds.ac.uk/10.3390/math10183359
Submission received: 7 August 2022
/
Revised: 5 September 2022
/
Accepted: 13 September 2022
/
Published: 16 September 2022
(This article belongs to the Special Issue Advances in Artificial Intelligence and Statistical Techniques with Applications to Health and Education)
Abstract
:University dropout rates are a problem that presents many negative consequences. It is an academic issue and carries an unfavorable economic impact. In recent years, significant efforts have been devoted to the early detection of students likely to drop out. This paper uses data corresponding to dropout candidates after their first year in the third largest face-to-face university in Europe, with the goal of predicting likely dropout either at the beginning of the course of study or at the end of the first semester. In this prediction, we considered the five major program areas. Different techniques have been used: first, a Feature Selection Process in order to identify the variables more correlated with dropout; then, some Machine Learning Models (Support Vector Machines, Decision Trees and Artificial Neural Networks) as well as a Logistic Regression. The results show that dropout detection does not work only with enrollment variables, but it improves after the first semester results. Academic performance is always a relevant variable, but there are others, such as the level of preference that the student had over the course that he or she was finally able to study. The success of the techniques depends on the program areas. Machine Learning obtains the best results, but a simple Logistic Regression model can be used as a reasonable baseline.
Keywords:
student dropout; machine learning; Feature Selection; Artificial Neural Networks; Support Vector Machines; decision trees; logistic regressionMSC:
62-07; 62H12; 62P251. Introduction
Dropping out at the university level is a problem for education systems around the world, as well as for academic and financial managers from different institutions, teachers, and students themselves. University dropouts have an economic and social impact, in addition to the students’ negative self-perception due to the feeling of failure and frustration that is generated. In 2017, the average percentage of university dropouts in public institutions the Bachelor’s level remained at around 30% in OECD member countries [1]. For the European community, student dropout is a major challenge since one of its objectives is to improve the knowledge and skills to meet the needs of the labor market and to implement a more productive and socially equitable environment [2].
Previous studies carried out in Spain indicate that the phenomenon is linked to the students’ type of degree program. The program areas with the highest dropout rate are the Arts and Humanities (45.9%), while science degrees have the lowest percentage (16.6%), and it takes place mainly from the first year onwards [3,4,5]. These studies have also emphasized the time students spend per week studying in different program areas, and it has been observed that the longer the study time, the lower the dropout rate [6].
A problem that has been widely addressed is the design of predictive systems to anticipate the risk of students dropping out of higher education and identify students with a high probability of dropping out to implement retention policies [7]. To this end, several educational data mining techniques have been implemented, such as the use of Decision Trees, K-Nearest Neighbors (KNN), Support Vector Machines (SVM), Bayesian Classification, Artificial Neural Networks (ANN), Logistic Regression, a combination of classifiers and others (Agrusti et al., 2020). Machine learning techniques have also been used to predict students’ academic performance [8,9].
According to Behr et al. [6], the development of an accurate prediction model for student dropout should be the focus of further empirical research, identifying groups of students with similar dropout motives, detecting the reason for dropping out may reveal details within the dropout process and the development of early warning systems and individual or group support mechanisms for at-risk students in order to prevent dropout at an early stage. The objective of this work is the development of statistical methods that allow the early detection of student dropout. The statistical models to be implemented are those typified in the literature as Learning Analytics or Educational Data Mining. These data analysis techniques, although novel, are already a reference in recent international scientific publications in the area of statistics and Big Data and remain a subject of research for their scope and usefulness with complex data from institutional educational platforms. This research will allow significant advances in the prevention of university dropout, as well as help address the economic and social impacts of this phenomenon.
Referential Framework
University dropout is a polysemic concept, and for its use, it needs a clear definition in order to avoid ambiguity. Larsen et al. [10] analyzed the different aspects and use of the term and defined it in a negative sense as the “non-completion” of a given university program of study. It is necessary to differentiate the level at which dropout occurs, in that students may change degrees but remain in the field of study, move to another university for different reasons, or drop out of the university system [6].
In the report by Fernández-Mellizo [11] on the dropout of undergraduate students in on-site universities in Spain, it was defined as the dropout of any undergraduate university study, excluding the change of degree. It was calculated with respect to a cohort of new entrants and was limited to students enrolled for the first time in a degree program and who did not re-enroll for two consecutive years. In particular, dropping out after the first year refers to the number of new students who, having enrolled in the first year, have not enrolled in the following two years. The dropout rate is obtained by dividing this number by the total number of new students. According to this report, the first year is the most delicate moment from the point of view of dropouts, and after this moment, the probability of dropping out decreases.
In order to reduce the dropout rate, it is necessary to identify the factors and the profile of students who dropped out of university studies. In a previous study [12], the main predictors were identified as the student’s time commitment, whether part-time or full-time, the access score, and the area of knowledge. In this study, multilevel logistic regression and decision tree techniques were applied with a mainly descriptive purpose.
One of the purposes of this work is to predict and identify students at risk of dropping out as accurately and quickly as possible. A feature of data mining techniques that allow combining determinants from several areas, e.g., personal, academic and non-academic characteristics, to a single rule to predict dropout, program change, or continuation of studies [13]. For a review of data mining in education, see [14] for an example.
According to Frawley et al. [15], data mining is the non-trivial extraction of implicit, previously unknown, and potentially useful information from data through machine learning algorithms with the purpose of identifying patterns or relationships in a data set, being one of its main tasks in predictive modeling. In this study, a set of data mining techniques, including Decision Tree, KNN, SVM, ANN and Logistic Regression, are implemented with the purpose of contrasting the results obtained, drawing conclusions from coinciding results, and assessing the relevant information provided by some of these techniques in a specific way.
2. Materials and Methods
2.1. The Dataset
The proposed analysis of student dropouts and the determination of the most relevant variables was carried out using data obtained from the Integrated Institutional Data System (Sistema Integrado de Datos Institucionales—SIDI) of the Universidad Complutense de Madrid (UCM), a well-known Spanish public university and the third largest on-site university in Europe.
The data identify enrolled first-year students in the 17–18 academic year of 10 degrees taught at the university in five different areas: Social Sciences and Law, Sciences, Health Sciences, Engineering and Arts and Humanities (Figure 1).
The students have been characterized according to a set of variables that can be grouped into three categories: socio-economic variables, enrollment variables, and academic performance variables during the first semester of university. The first category includes variables, such as gender, age, parents’ or guardians’ level of education, municipality of residence, and nationality, among others. The second group has variables such as type of school (public or private), university entrance mark, number of degree preferences for the student, and entrance study (school, professional training, and entrance specialization). Finally, among the variables of the first semester of the university are the amount of the enrollment fee, the number of European Credit Transfer System (ECTS) (enrolled and passed), the average mark for the first semester, and whether the student holds a scholarship. The list and description of all the variables used are detailed in Appendix A. The number of students enrolled for the first time in the different degrees in each of the academic years is shown in Table 1.
2.2. Data Processing
Once the database of students has been obtained, the processing of those who dropped out after the first year begins. According to the definition of dropout considered in this study, a student drops out when they do not enroll for any ECTS in the following two years. Table 1 shows the number of students who have dropped out of the degree in which they enrolled, the dropout has been verified both by the number of ECTS enrolled and by the payment of the enrollment fee.
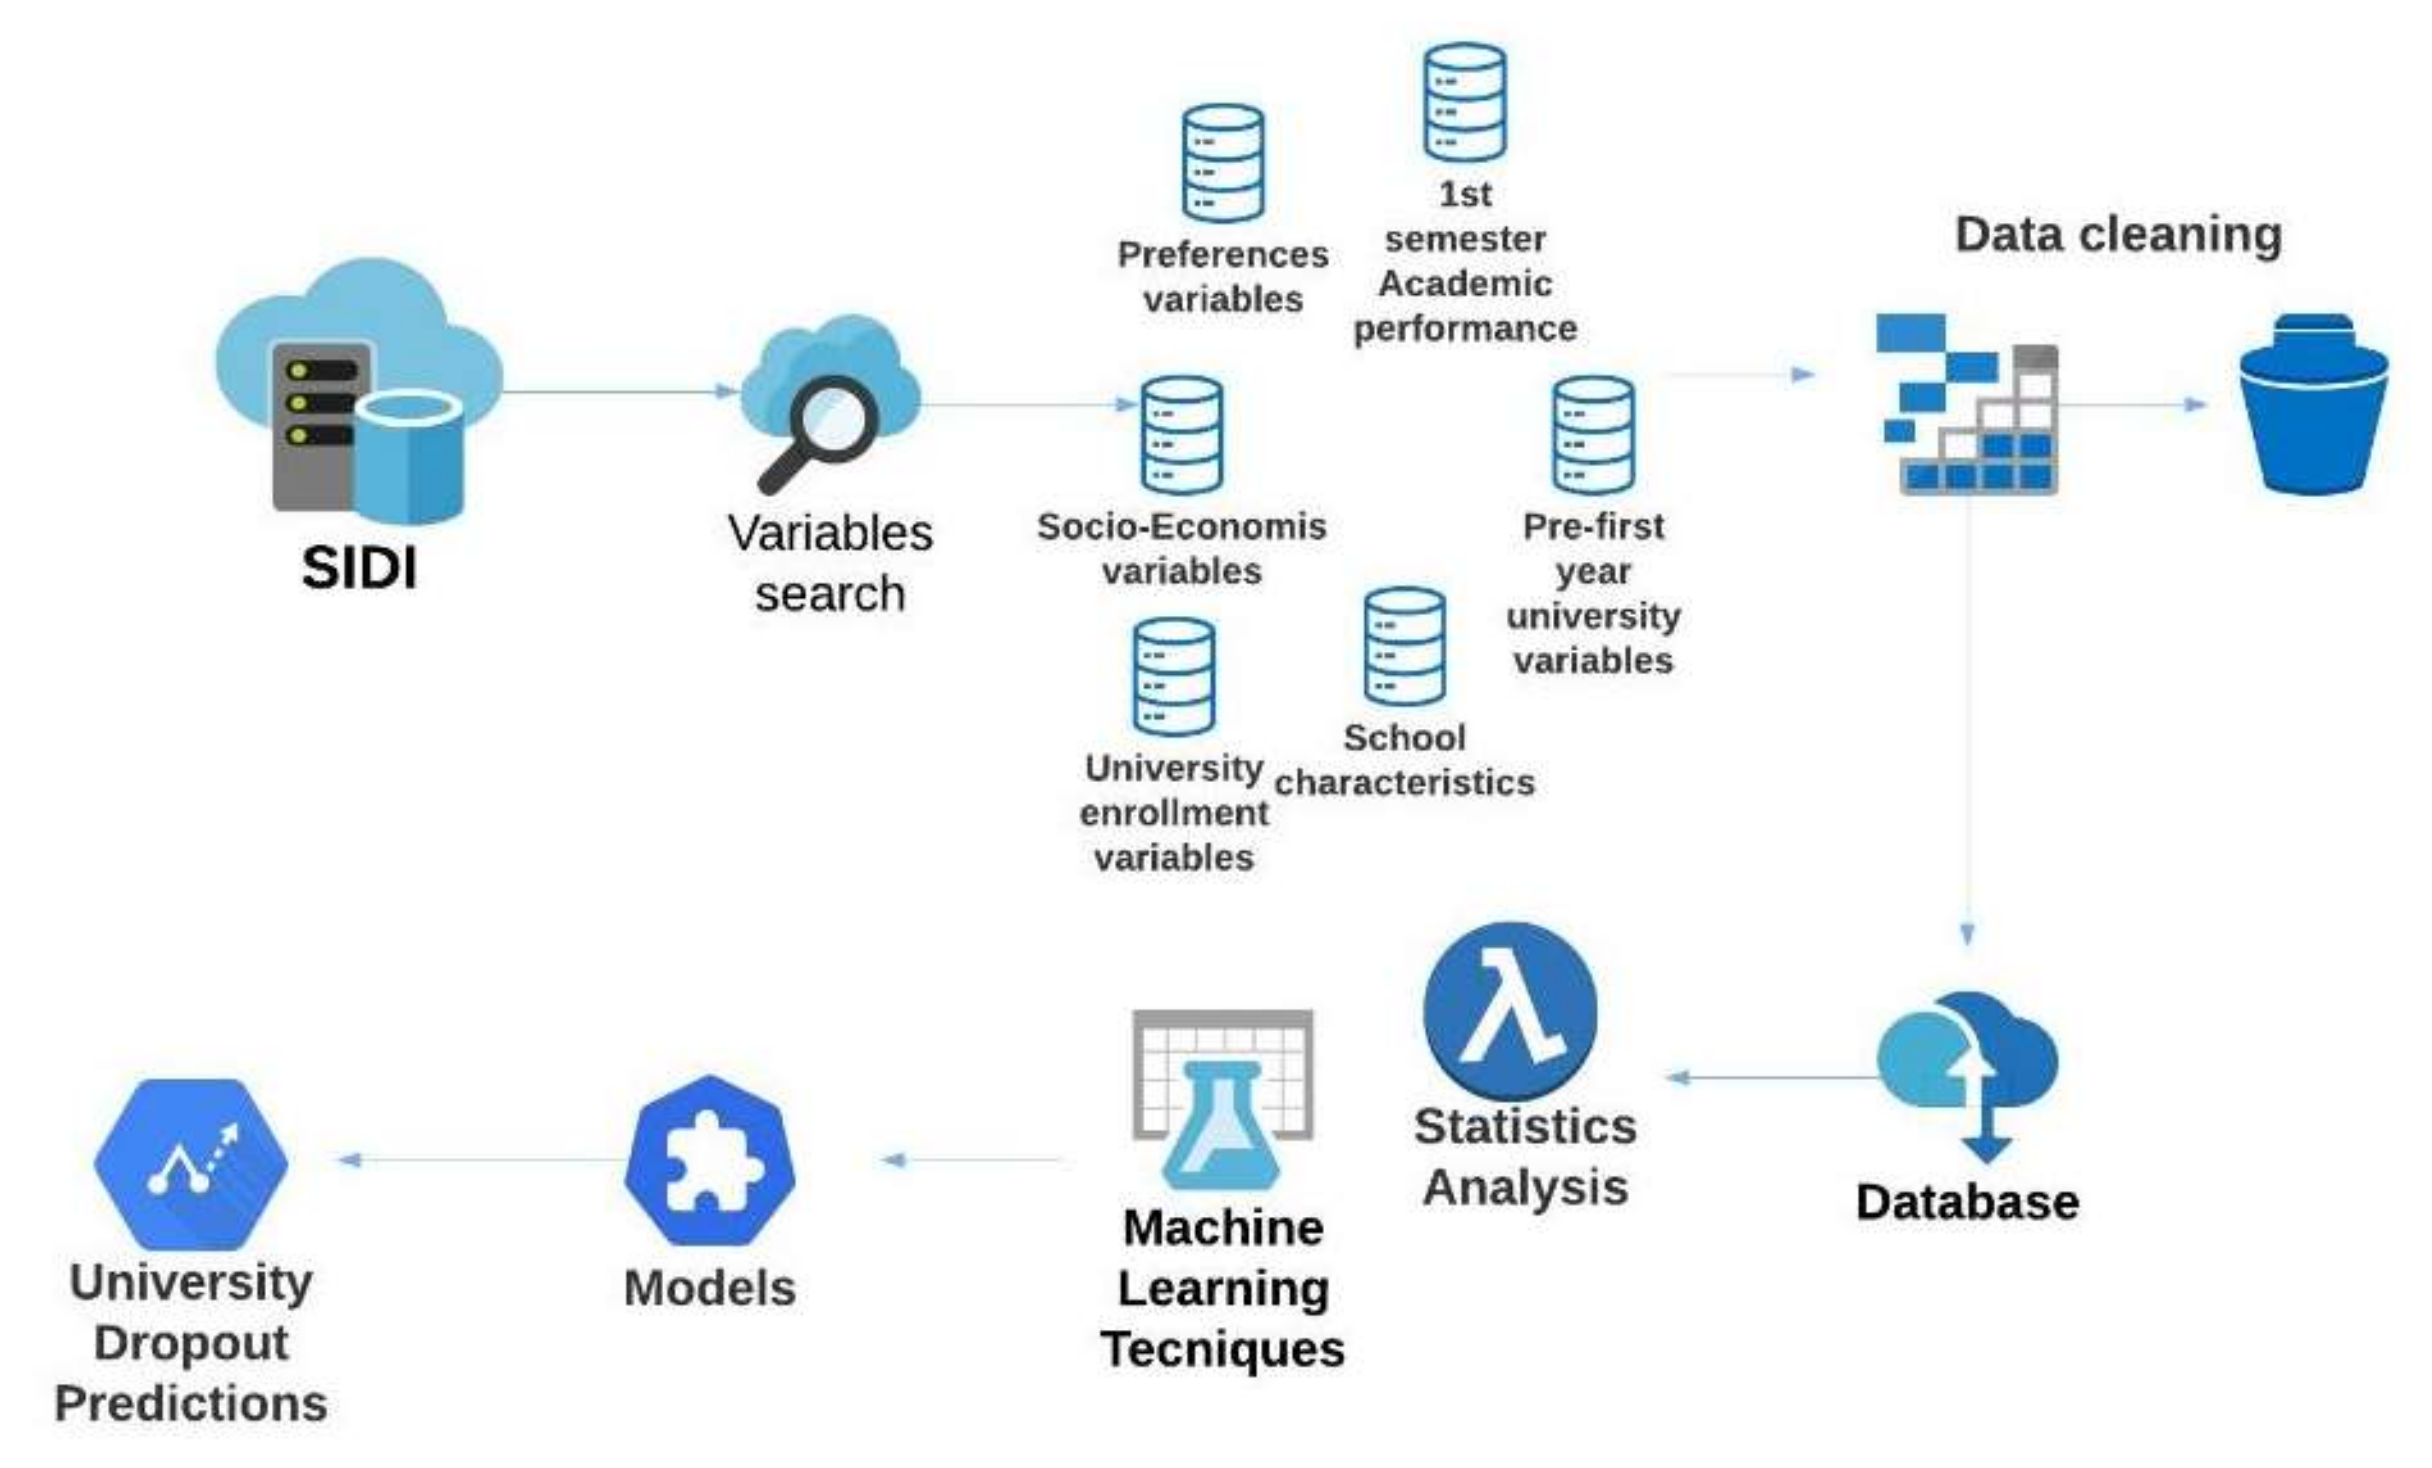
The steps we followed to obtain University Dropouts Predictions are illustrated in Figure 2. First, search for the most relevant variables to predict dropout. Second, clean the data taking care of missing data and errors. Third, code the database to perform statistical analysis and machine learning techniques. Fourth, perform the statistical analysis of the preliminary variables and the application of the machine learning models. Finally, analyze the predictions of dropouts and the techniques used.
2.3. Machine Learning Methods
Machine Learning is generally divided into three categories: supervised, unsupervised and semi-supervised. Supervised learning is the task of mapping inputs to the corresponding output, where there is a prior set of input–output pairs given as examples [16,17]. Supervised learning methods whose target variable is discrete are called supervised classification.
In this study, Feature Selection (FS) is implemented in the first stage, and then five predictive machine learning methods are applied: ANN, SVM, KNN, Decision Tree and Logistic Regression. These techniques were chosen considering the effectiveness demonstrated in related works consulted in the literature [18,19].
For model training, the dataset was divided into two parts: training (70%) and test (30%). The performance of each technique was measured through the confusion matrices and the accuracy in predicting dropout and non-dropout [7].
2.3.1. Feature Selection
Feature selection (FS) aims to select a smaller and appropriate subset of features (predictor variables) to improve classification efficiency so the redundant and unimportant features can be removed. FS favors minimizing overfitting, reducing data dimensionality, improving accuracy, eliminating irrelevant data, and speeding up training, among many other advantages. FS does not transform the original set of variables, thus preserving the interpretation and validating them in line with the objective of the analysis. FS methods are generally classified into filters, wrappers, embedded and hybrids [20].
The filter methods prove to be fast, scalable, computationally simple and classifier-independent. Multivariate filter methods consider feature dependencies and interaction with the classification algorithm [21]. One of the most commonly used filter methods is the so-called Correlation-based Feature Selection. This method uses the correlation coefficient to determine the features that are strongly correlated with the target variable and, at the same time, have a low inter-correlation with the other features [22].
For the ranking of the variables, one variable at a time and its relationship to the target variable is considered. The importance value of each variable is calculated as 1-p, where p is the p-value of the test statistic between the candidate variable and the target variable.
2.3.2. Artificial Neural Networks
ANN are considered one of the most efficient machine learning techniques. As their name suggests, they are computational networks that attempt to simulate the decision process in networks of neurons of a biological central nervous system. ANNs have been used in different scientific fields for prediction, classification and modeling tasks. Several studies have used this technique to predict student performance and to determine the factors that influence the educational process [23].
The ANN model is based on three main layers: an input layer, which links the input signal to the neuron through a set of weights . The next step involves a hidden layer, which compiles the bias values and also the input signals. This layer is weighted by the corresponding weights of the neuron. Lastly, the output layer is applied to limit the amplitude of the output of the neuron utilizing the activation transfer function. To increase or decrease the net output of the neuron, a bias must be added [24,25].
ANN is represented as the following mathematical structure of a neuron k:
where represents the linear combiner, are the input signals, are the weights for neuron k, is the bias value, is the activation transfer function, and is the output signal of the neuron; a detailed explanation can be found in [26]. Multilayer perceptron (MLP) and radial basis function (RBF) networks are widely used as supervised training methods.
According to [27], MLP is applied to classification problems by using the error back-propagation algorithm. The main objective of this algorithm is to minimize the estimation error by calculating all the weights of the network, and systematically updating these weights to achieve the best neural network configuration.
The ability of ANNs to learn from provided examples makes it a powerful and flexible technique, but its effectiveness is related to the amount of data and the proper selection of the neural network architecture.
2.3.3. Support Vector Machines
SVM has been used to predict student performance, risk of failure, and overall, as a predictive technique in educational data mining [19] and is a widely used supervised learning approach for classification analysis. It transforms the training data into a high-dimensional feature space and determines an optimal linear solution by means of a separating hyperplane [17].
Consider the non-linear transformation in order to represent the input vectors in a new feature space . The kernel function indicates similarity, which is obtained by scalar product between two given vectors in the transformed space [24,28]. The most used kernel function is:
Given the problem of binary classification consisting of N examples of training. Each example is indicated by a tuple where X corresponds to the set of attributes, for example i, and the class denomination is indicated by . The learning task with SVM can be formalized as the following constrained optimization problem [29]:
A test case Z can be classified using the equation , where is a Lagrange multiplier, b is a parameter, and is a kernel function.
SVM is a technique known to adapt well to high-dimensional data; as a limitation, it can be noted that its performance depends on the proper selection of its parameters and the kernel function.
2.3.4. K-Nearest Neighborhood
The KNN algorithm is a simple nonparametric classification method. It has achieved excellent results in previous studies on university dropouts [30]. The classification of an object is based on the assumption that data points similar to each other belong to the same class [31].
According to [32], the k-Nearest Neighborhood classifies an object O by taking into account the class of the object which is most similar to O. To begin, we need to find an objective way to measure the similarity. It is possible to achieve this by representing objects in the training set as numerical vectors being n is the number of features of each object. In order to give an objective measure that states how similar two objects are, it is possible to use any distance function defined in the n-dimensional space, for instance, the Euclidean distance function. The Euclidean distance function for two objects x and y is shown in Equation (4):
The object C in the training set with the smallest distance to O will be the nearest to O assigning C to this class. Different approach assigns the set S of the first k objects nearest to O and selects the class in which most of the objects in S belong. Ties are arbitrarily broken.
The strengths of KNN include its interpretability and easy implementation; however, it can take longer to run for larger datasets.
2.3.5. Decision Tree
The Decision Tree has been shown to effectively predict students’ academic performance, dropout and retention behaviors [33,34]. Decision Trees use a recursive partitioning mechanism for their construction. At each node, the data is divided into two distinct groups according to a given criteria; these groups are further divided into smaller subsets with the same procedure, and so on, until their completion.
Consider representing a set of attributes of a set Ω of objects. In the Decision Tree approach, each node i is related to an attribute Ai and a subset of objects in Ω. The tree structure includes a root node, internal nodes and leaf nodes. The root node contains all the objects in Ω. Internal node i comes from the root node, and Si is the subset of Ω associated to i. A leaf node contains all objects of the same class. The procedure to classify an object starts from the root node and inspects each node i until a leaf node is reached [32].
The CHAID (CHi-squared Automatic Interaction Detector) is one of the oldest decision tree algorithms [35]. It uses the Chi-square independence test to decide on the splitting rule for each node. The Pearson chi-square statistic is calculated as follows:
where is the observed cell frequency and is the expected cell frequency for cell from the independence model. The corresponding p-value is calculated as , where follows a chi-square distribution with d = (J − 1)(I − 1) degrees of freedom.
Decision Tree has a simple and easily understandable schematic representation. Its main limitation is that it can overfit the data.
2.3.6. Logistic Regression
Logistic Regression is a very popular classification model used in different program areas and problems, including educational data mining and dropout prediction [36]. It is analogous to linear regression but uses a categorical target field instead of a numerical one, instead of a numeric one.
The LR considers n data records xi1, …, xip, which represent p input variables. Each record contains an observation yi. The observations y1, …, yn are binary (values 0 or 1). The LR methodology is based on estimating the probability that the observation is 1.
The problem presented by linear probabilistic models as LR, in terms of the existence of out-of-range predictions (negative or greater than one), is due to the fact that they use a probability function that depends linearly on the explanatory variables, which would be solved by narrowing the probability distribution. To solve this problem, the regression function is transformed with a function F:
where . This model is called the Logit model, due to the transformation function F, and it is the most common regression model for binary target variables.
Logistic Regression is a traditional classification technique, easy to implement and interpret. Due to the initial assumptions, the technique has limitations with non-linear and correlated data. More details on the Logistic Regression algorithm can be found at [31].
2.4. Predictor Importance
Predictor importance uses sensitivity analysis to determine the reduction in variance in the target variable attributable to each predictor. Let Y represent the target variable and Xj the predictors, where j = 1, …, k. Predictor importance is then computed as the normalized sensitivity:
where and is the unconditional output variance.
In this work, the method of calculating the importance of the predictor indicated above was used in the ANN, SVM, Logistic Regression and Decision Tree machine learning methods [31]. The determination of predictors with the highest importance for the KNN method is based on the envelope approach of Cunningham and Delany [37]. The predictors of greatest importance sequentially consider the variable that causes the greatest decrease in error rate or sum of squares error.
3. Results
3.1. Preliminary Analysis
First, we categorized the groups of students into those who dropped out in the first year and those who did not. Then, we analyzed the statistical patterns of the different variables in both groups in order to find significant differences. To this end, it is possible to opt for inference techniques such as Chi-square or t-test, depending on the nature of the variables (Table 2 and Table 3). Some relevant outcomes of the study are highlighted below, i.e., the significant differences at 99%, 95% and 90%. See Appendix B for details.
Significant differences have been found linked to the degree and the area to which they belong with regard to the percentage of students who dropped out of the degree program in the first year. The degree with the highest dropout rate is Computer Engineering (38.6%), followed by Economics (28.4%) and Art History (25.1%). In the rest of the degrees, the dropout rate is between 10 and 15%, where Psychology has the lowest rate (10.6%) and Business Administration and Management the highest (15.2%). The areas with the highest dropout rates are Humanities and Engineering, with 25.1% and 23.1%, respectively.
The gender differences are significant; men are dropping out more than women, 18.4% compared to 12.8%. The university entrance specialties in which most students drop out in the first year of their studies are Arts (38.9%) and Health Sciences (26.7%), and the lowest are Technical Sciences (12.9%) and Humanities and Social Sciences (17.2%).
The dropout rate is lower when the students’ parents have attended higher education, around 13%, and rises when they have only primary, secondary, or no education (15–18%). In the case of illiterate parents, the dropout rate is very low (less than 5%), but this is a very small group.
Scholarship holders drop out in a lower proportion than students who do not have a scholarship (14.2% compared to 17.1%). In relation to the type of grant, there is a significant difference between those with a state grant, who dropped out to a greater extent (14.6%) compared to those with a grant from the university itself, where only 5.2% dropped out.
The dropout rate is 7% higher when students enter with entering after a retake exam, even though it is a very small group, 38.5% of elite sportsmen and women drop out in the first year.
If the same analysis is carried out for qualitative variables differentiating by areas to which the university degrees under study belong, the following significant results can be found. In the area of Social Sciences and Law, students entering from Arts and Health Sciences drop out in a very high percentage, 50% and 35.3% respectively, although these are small groups. In Humanities, greater differences are observed between dropouts and non-dropouts when the mother has attended higher education (15.3%), and when she did not (25%). A higher percentage of dropouts is observed in students who attended the retake exam (34.9%) and when the gender is male (34.3%). On the contrary, in Science, no gender differences are observed and it is worth noting there are no students who entered with an extraordinary entrance exam. In Health Sciences, there are differences in the number of dropouts between students who studied science in high school (7.2%) and those who did not (19%). Finally, in Engineering, it is worth highlighting that a large number of students dropped out when they entered the program from a vocational learning route and that, although the percentage of women is very small, the percentage of men who dropped out is still higher (25%) compared to the 7.7%.
In the quantitative variables, significant differences can also be observed between students who dropped out and those who did not drop out in the first year. The admission option is significant at 90%, with the mean being lower in the group of non-dropouts. The PAU exam grade and access grade follow the same line and are higher in those who did not dropout, 6.75 and 8.50 compared to 6.47 and 8.00. On the other hand, the age is lower for those who did not drop out—19.22 years compared to 19.68 years on average for those who dropped out.
As for the differences between the areas, in the area of Social Sciences and Law and Arts and Humanities, no differences were found between the admission option and age, but in the latter, no differences were found in the access grade, either. In Sciences, there were greater differences in the admission option and, in Health Sciences, in the access grade. Engineering shows the biggest differences between the admission option, 1.27 on average, for those who dropped out compared to 1.1 for those who did not drop out, and also significant differences in the access grade of 9.33 compared to 8.7.
Finally, the continuous variables of the first semester mark, ECTS passed, and pass rate in the first semester are clearly significant for the analysis in general and for all areas, with significant differences between students who dropped out in the first year and those who did not.
3.2. Machine Learning Methods
Table 4 shows the chosen variables after the application of Correlation-based FS at two different moments of time: enrollment and the end of the first semester. The cut-off point for the value of 1-p (see Section 2.3.1) has been taken as the typical 0.95.
Variables that have not been selected are the number of ECTS enrolled, Time Commitment, Country of Birth, Family Township, Follow the Path, Type of Scholarship, Type of School, School Holder, Location of the School and Admission Reason.
The variable, Admission Option, which measures the level of preference of the students with regard to the studies they want to take, appears both at enrollment and at the end of the first semester.
Table 5 shows the predictive accuracy of the different Machine Learning methods, at both periods of time, globally or considering each area of knowledge apart. We have distinguished the success rates in the groups of dropouts and not dropouts. As a general remark, none of the methods seem to work well considering only the variables prior to university entrance, and the dropout success rates are very low apart from Engineering and Arts and Humanities. On the other hand, the results improve greatly when we introduce the variables describing academic performance over the first semester. Finally, Logistic Regression always takes values closest to the best results.
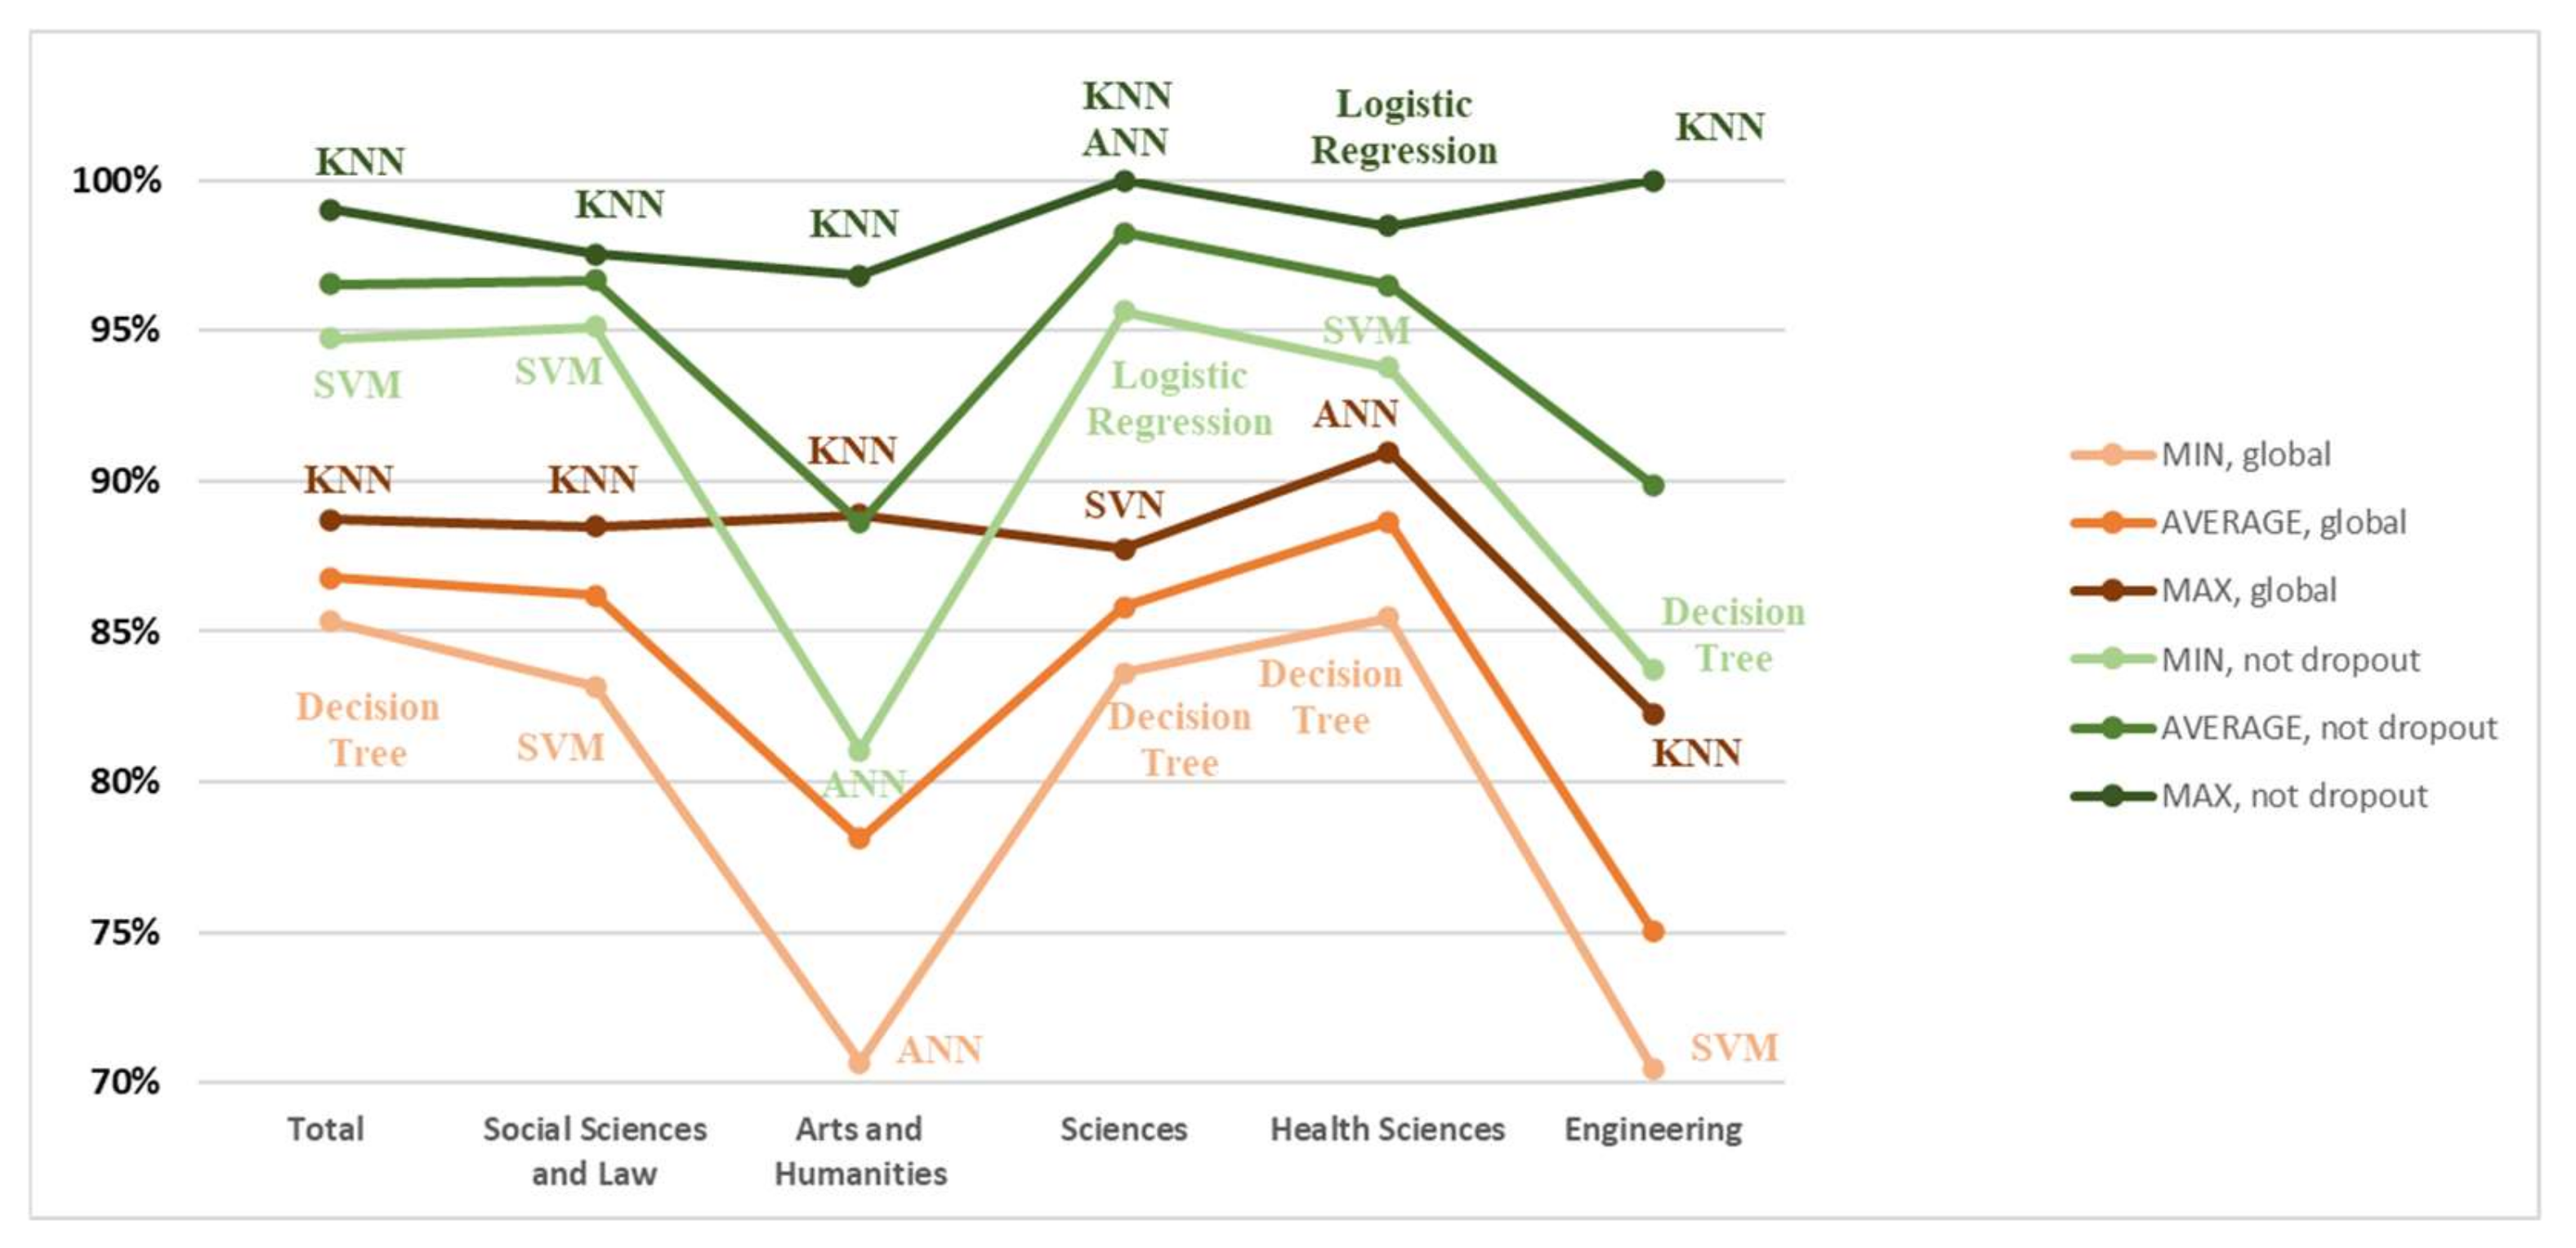
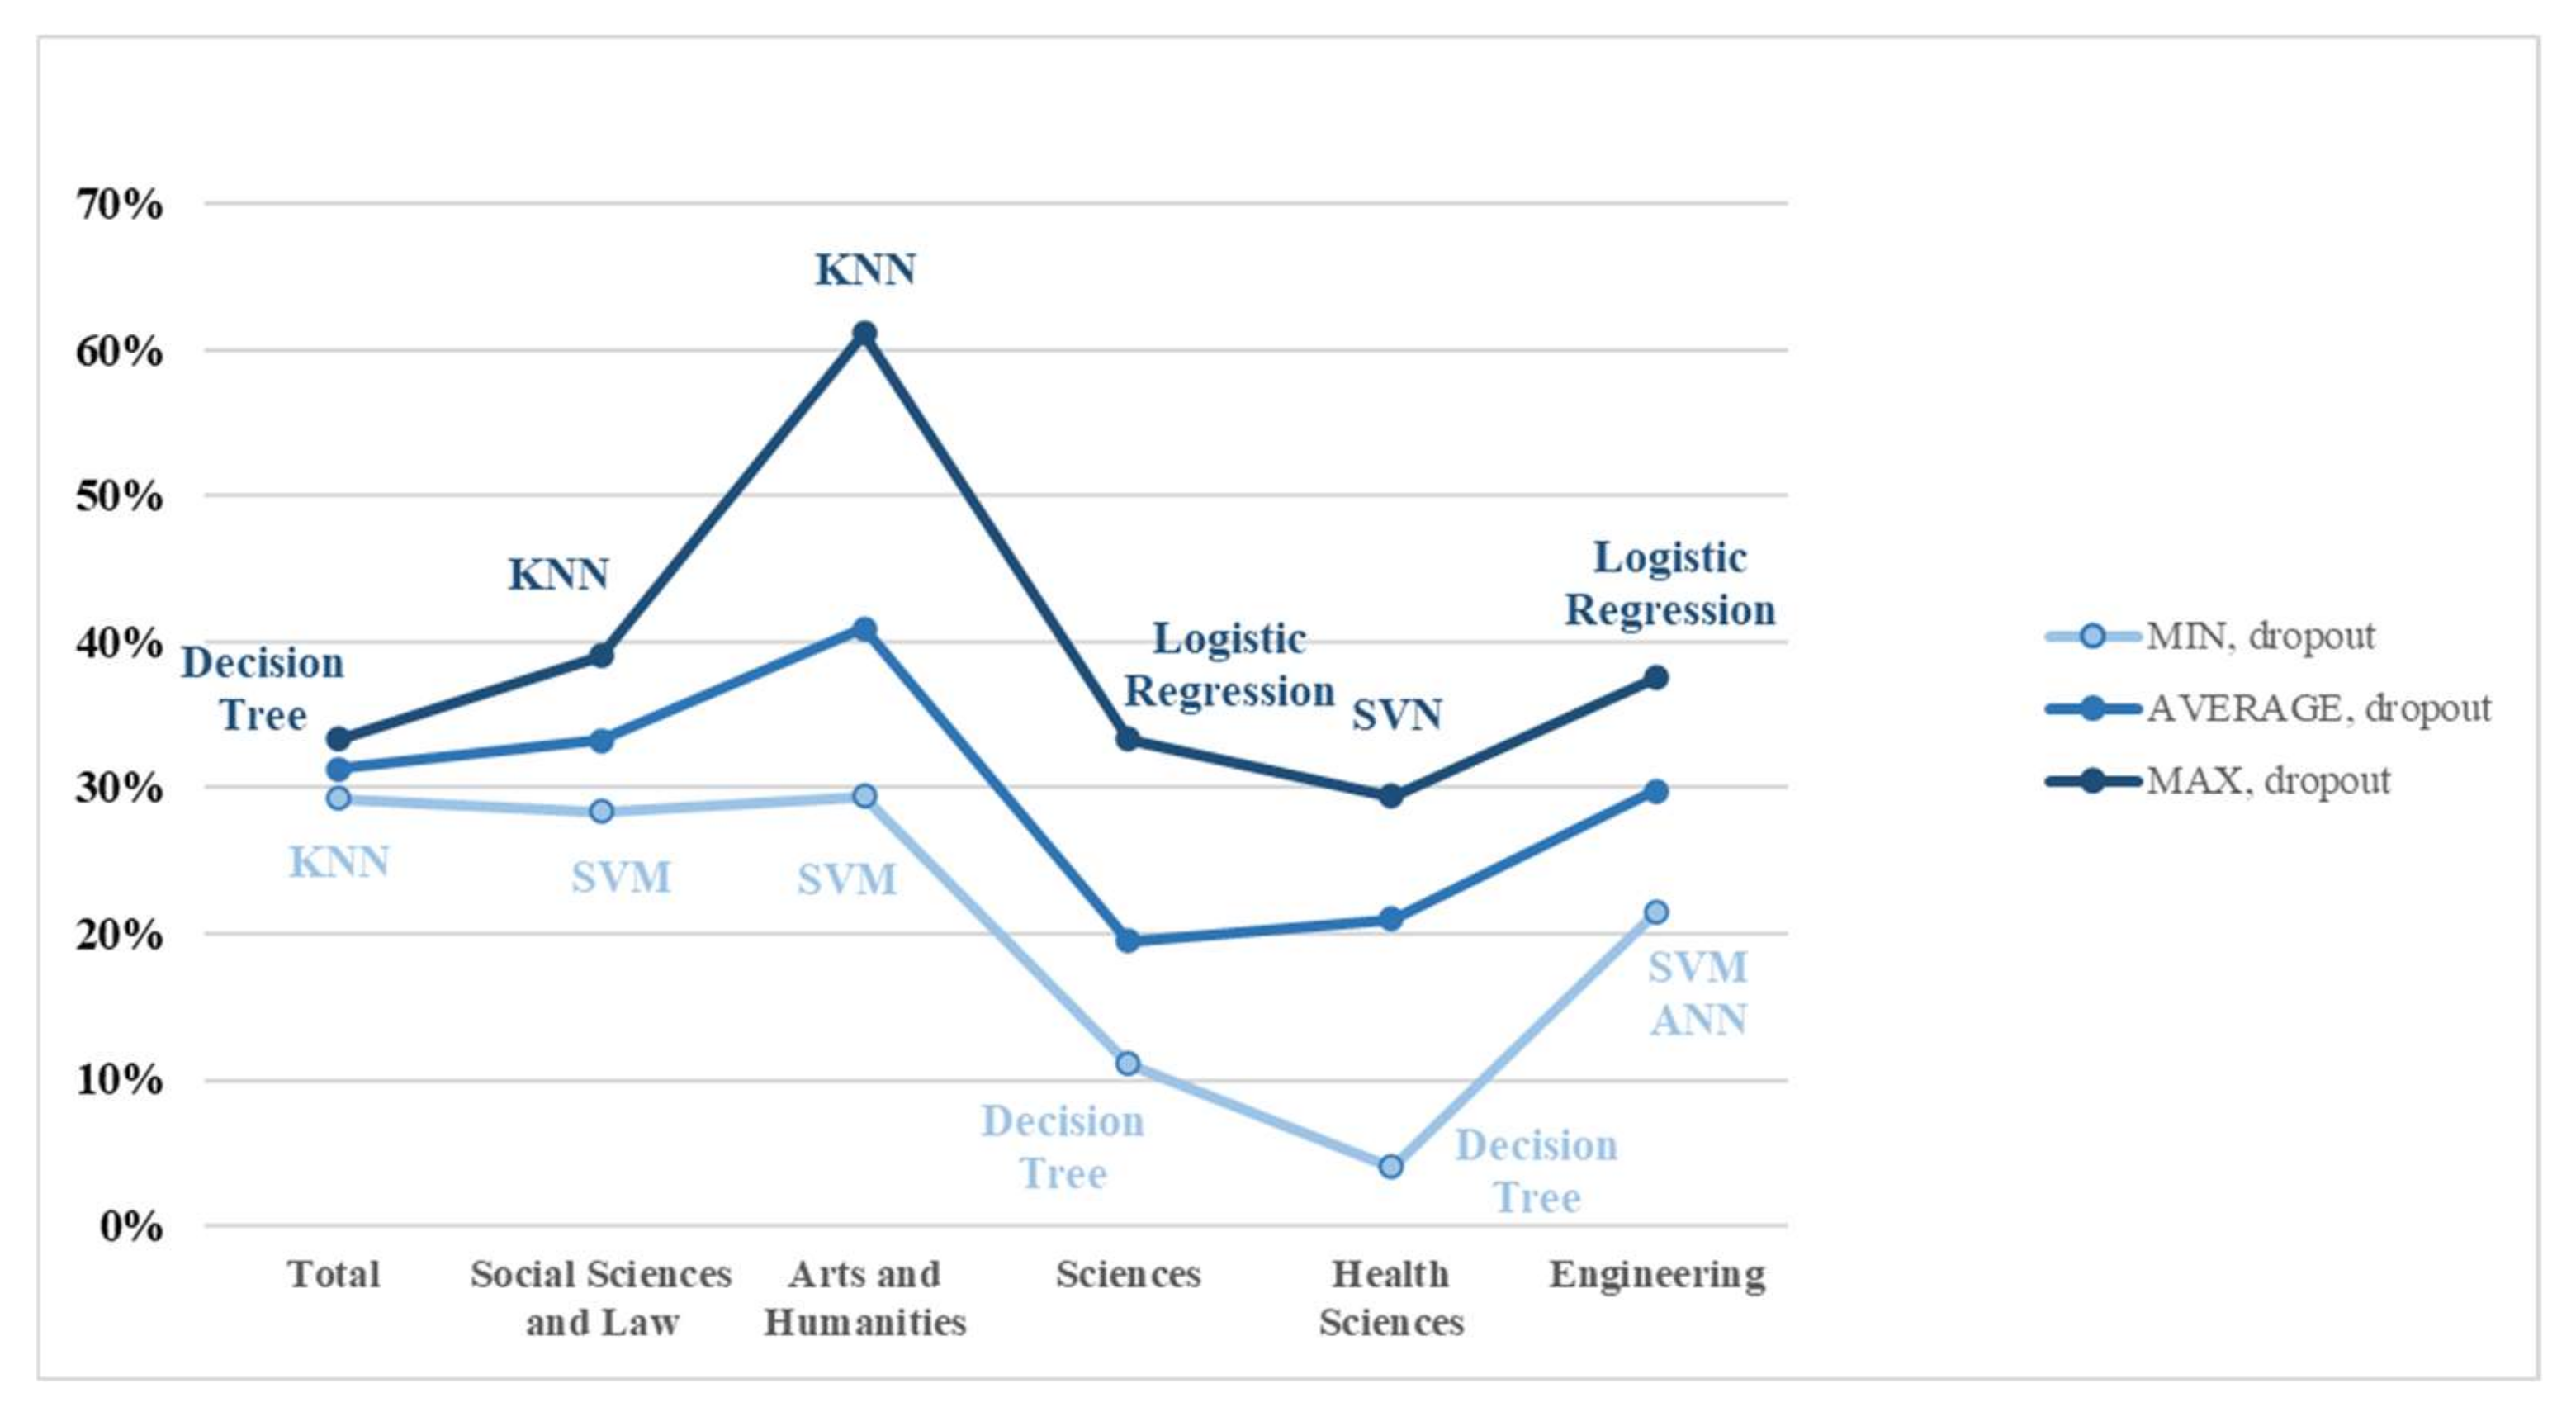
The information contained in Table 5 has been used to construct Figure 3 and Figure 4, which show the minimum, average and maximum predictive accuracy for all students (global) and those who did not drop out, and those who dropped out, respectively. In both figures, the methods that attained the minimum and maximum are highlighted.
As can be seen in Figure 3, on average, the worst results are obtained in Arts and Humanities and in Engineering, in both the global and non-dropout results. KNN has the best results. except for Health Sciences and Sciences in the global results.
Figure 4 illustrates how dropouts obtain the worst results in Sciences and Health Sciences. Similar prediction results were obtained in all areas, although with different techniques. KNN stands out for Arts and Humanities (61.1%).
With regard to the predictor importance in the different Machine Learning Models, as expected, the ratio of subject passes the first semester and first-semester grades are always the most important variables. The admission option, which expresses the preference of the student for the course they finally study, is always a relevant variable and, in Sciences, has the third highest value.
There are other rather important variables, but they depend on the area of knowledge. For instance, the mother or guardian’s level of studies has high importance, but mainly in Sciences and Arts and Humanities, while the PAU grade and Access Grade appear in Arts and Humanities, Social Sciences and Law. Table 6 shows the heat map of all variables for Logistic Regression; the heat maps of all variables in all other techniques are detailed in Appendix C.
4. Discussion and Conclusions
In this work, we addressed the problem of early detection of university dropouts. We have focused on the dropouts that occur at the end of the first year of studies because it is the one that takes the highest values and has the greatest negative impact. For example, at an economic level for universities, the expected income for the remaining study period (at least two more years) is lost.
We used data from the students of one of the largest face-to-face universities in Europe. One of the strengths of our study is that we considered the students who are studying in different program areas. To the best of our knowledge, this is the first time this has been done in the university dropout literature (see, for example, [38]). More specifically, we considered ten university degrees corresponding to the five major program areas. This allowed us to compare the different performance of the models in the different areas, and also to discuss which variables are more relevant in the prediction models depending on these fields of knowledge.
Another aspect to highlight is the very good quality of our data. Fortunately, we have been able to count on the collaboration of the academic authorities, and we have complete information. Specifically, we have been able to obtain information on a total of 28 variables. Some of them are academic, but others correspond to the socio-economic situation of the students or their environment.
With regard to the obtained results, the element of note is that an early detection model with good performance cannot be obtained only with the enrollment data. We are aware that this result goes against the results obtained in previous studies (see, for example, Fernández-García et al. [7]), but these studies worked with data corresponding only to engineering students, which is a very homogeneous group with a high entry grade, and led to a low dropout rate. As mentioned previously, our study covers the degrees corresponding to very different program areas, with dropout rates ranging between 15% and 40%.
When we introduce academic performance variables corresponding to the first semester of the studies, the predictions of the models improve remarkably. We believe that this is very timely because the academic authorities can implement retention policies for students who have been detected as being at risk of dropping out. We believe that the dropout rate could be drastically reduced with these policies, which would result in an improvement of the university system and would have positive repercussions on the social and economic situation of the country.
In general, all Machine Learning methods obtain similar predictions, as previously mentioned in the literature. However, there are some notable exceptions: for example, the well-behaved KNN methods in the area of Arts and Humanities. There are areas, such as Sciences and Health Sciences, where all the methods consistently give worse results in predicting early leaving.
In all cases, a Logistic Regression model has also been used. We understand that this model is much easier to use for non-specialized audiences. The results are that although this method is never the best compared to the other more sophisticated techniques, it is always among the top three or four. Our advice to university managers is not to stop using dropout prediction techniques due to the complexity of the algorithms. The recommendation is that in those universities where sufficient resources cannot be invested in the development of powerful Machine Learning techniques, Logistic Regression should at least be used as a good approximation to the dropout phenomenon.
Last but not least, our study has also considered the importance of the different variables when building the model that best predicts dropout. Specifically, we wanted to consider the relevance of the variable Admission Option. In the Spanish university system, as in many others at the international level, students must place their degree options in preference order. Based on their grades, a system assigns them the studies they can take. It can happen that students ends up studying their first choice (this happens when the student has a very good grade), but it can also happen that the student ends up taking studies that he or she had placed as a lower option. It is logical to consider whether this variable, which measures the student’s preference for the studies that he/she ends up taking, is relevant in the models. It is to be expected that the lower the preference for studies, the higher the probability of dropping out. First, we have used correlation-based Feature Selection methods for variable extraction. As expected, the variable Admission Option always appears as relevant both in the overall number of students and in each of the program areas. Next, we measured the importance of the variables in the different methods used. Again, the variable Admission Option is relevant, but it does not have the same importance in the different program areas. For example, the high importance of this variable in the area of Science should be highlighted. We know that university autonomy is subject to higher-ranking laws, but from the academic field, we dare to suggest, based on the results obtained, that the methods of assigning students to studies should take this variable into account and, perhaps students should not enroll in programs that were not among their first choices, especially when it comes to Science. As this is both difficult to apply and subject to political debate (it could violate the right of students to pursue university studies, even if they were not their first choices), we could at least recommend that special attention should be paid to this type of student.
This research presents some limitations. We only consider first-year dropouts, we used data corresponding to ten different degrees, and the Machine Learning techniques used are limited to those that the literature review has shown to be useful for predicting university dropouts. Thus, it would be interesting for future research to study university dropouts after the first year, assess more degrees in the different program areas, and compare the data obtained from other machine learning techniques, such as Random Forest or Gradient Boosting. In addition, although the results did not find that gender was a significant predictor of dropping out of university in the specific context of this study, it is likely necessary to deepen the analysis of the characteristics of the phenomenon from the perspective of gender.
Author Contributions
M.S., J.M. and A.H. conceptualization, literature review, methodology, writing and interpretation of the data and results. M.S. and A.H. carried out the data curation, and J.M. did the formal analysis. All authors have read and agreed to the published version of the manuscript.
Funding
This research was funded by Ministerio de Ciencia e Innovación de España [grant number ABANRED2020, PID2020-116293RB-I00)] and Santander—Universidad Complutense de Madrid 2020 [grant number PR108/20-10]. The APC was funded by Department of Financial and Actuarial Economics & Statistics, Universidad Complutense de Madrid.
Data Availability Statement
The data sets were obtained from the Integrated Institutional Data System (Sistema Integrado de Datos Institucionales-SIDI), which belongs to the Institutional Intelligence Center of the Complutense University of Madrid (http://www.ucm.es/cii (accessed on 1 April 2022)).
Acknowledgments
The data sets were obtained thanks to the Institutional Intelligence Center of the Complutense University of Madrid (http://www.ucm.es/cii (accessed on 1 April 2022)). We also thank the reviewers for their suggestions on improving the paper.
Conflicts of Interest
The authors declare no conflict of interest.
Appendix A

Table A1.
Variables and explanations.
| Variable | Explanation |
|---|---|
| Student ID | ID that identifies the student. |
| Academic Amount | Cost of the student’s enrollment. |
| Degree | The subject area the student is studying (Business Administration and Management, Economics, Commerce, Tourism, Law, Mathematics, Psychology, Computer Engineering, Computer Science Engineering, Art History). |
| Area | Area to which the student’s degree belongs (Social Sciences and Law, Sciences, Health Sciences, Engineering, Arts and Humanities). |
| Dropout | A dichotomous variable that identifies whether the student dropped out of the degree after the first year or not. |
| Family Township | A dichotomous variable that identifies whether the student has a family in the region of Madrid or not. |
| Admission Option | The Spanish public university access system is competitive on the basis of student performance. A student can choose up to 12 options between degree and university to access university studies. |
| Gender | Dichotomous variable identifying the sex of the student. |
| Country of Birth | A dichotomous variable that identifies whether the student is Spanish or foreign. |
| Admission Study | A dichotomous variable that identifies whether the student has entered university from high school or from a professional training degree. |
| Access Specialty | In the last years of school, the student must choose between subjects from different areas that will determine the specialty with which they mainly enter university (Social Sciences and Humanities, Arts, Technical Sciences, Health Sciences). However, this requirement is not compulsory; a science student can enter social science degrees and vice-versa. |
| Follow the path | A dichotomous variable that identifies whether the student who has taken subjects in a field in the last years of school has chosen a related university degree or not. |
| Time commitment | A dichotomous variable that identifies whether the student has enrolled in the first year of the full course or not. |
| PAU grade | University entrance exam grade (over 10). |
| Access grade | University entrance grade, an average between the mark of the last two years of high school and the entrance exam (over 14). |
| Mother’s or guardian’s level of studies | Mother or guardian’s level of studies (illiterate, no education, primary education, secondary education, higher education). |
| Father’s or guardian’s level of studies | Father or guardian’s level of studies (illiterate, no education, primary education, secondary education, higher education). |
| Scholarship holder | A dichotomous variable that identifies whether the student receives a scholarship or not. |
| Type of scholarship | A dichotomous variable that identifies whether the scholarship is from the Education Ministry or from the university. |
| Type of school | A variable that identifies whether the school is a comprehensive school, only an upper secondary school, or only a professional degree school. |
| School holder | A variable that identifies whether the school is public, private, or private with public subsidy. |
| Location of the school | A dichotomous variable that identifies whether the student has attended school in the region of Madrid or not. |
| PAU Call | The university entrance examination has two calls, ordinary and extraordinary. |
| Admission Reason | A student can be accepted under different quotas (general, disabled, elite athletes). |
| Age | Age of student in the first year of university. |
| First-semester grade | Average first-semester grade at university. |
| No. of ECTS Passed 1st semester | The number of ECTS passed in the first semester at university. |
| No. of ECTS enrolled 1st semester | The number of ECTS enrolled in the first semester at university. |
| Ratio of subject passes 1st semester | The ratio between ECTS passed and enrolled in the first semester. |
Appendix B
Table A2.
Significance level.
| Variables | Total | Social Sciences and Law | Arts and Humanities | Sciences | Health Sciences | Engineering |
|---|---|---|---|---|---|---|
| Academic Amount | 0.081 + | 0.052 + | 0.317 | 0.225 | 0.550 | 0.585 |
| Degree | <0.001 *** | 0.098 + | a | a | a | <0.001 *** |
| Area | <0.001 *** | a | a | a | a | a |
| Family Township | 0.462 | 0.842 | 0.626 | 0.848 | 0.746 | 0.255 |
| Admission Option | 0.061 + | 0.098 + | 0.352 | 0.107 | 0.240 | 0.03 * |
| Gender | <0.001 *** | 0.013 * | 0.038 * | 0.805 | 0.260 | 0.051 + |
| Country of Birth | 0.195 | 0.362 | 0.513 | 0.606 | 0.800 | 0.095 + |
| Admission Study | 0.636 | 0.676 | 0.530 | a | 0.101 | 0.002 ** |
| Access Specialty | <0.001 *** | 0.003 ** | 0.468 | a | 0.009 ** | 0.072 + |
| Follow the path | 0.562 | 0.408 | 0.751 | a | 0.087 + | 0.517 |
| Time commitment | 0.104 | 0.710 | 0.724 | 0.111 | 0.073 + | 0.212 |
| No. of ECTS credits enrolled | 0.002 ** | 0.052+ | 0.349 | 0.113 | 0.070+ | 0.781 |
| PAU grade | <0.001 *** | <0.001 *** | 0.022 * | 0.346 | 0.397 | 0.096 + |
| Access grade | <0.001 *** | <0.001 *** | 0.170 | 0.080 + | 0.016 * | 0.015 * |
| Mother’s or guardian’s level of studies | 0.012 * | 0.05 * | 0.016 * | <0.001 *** | 0.978 | 0.295 |
| Father’s or guardian’s level of studies | 0.054 + | 0.150 | 0.665 | 0.399 | 0.712 | 0.268 |
| Scholarship holder | 0.022 * | 0.188 | 0.386 | 0.126 | 0.948 | 0.988 |
| Type of scholarship | 0.044 * | 0.100+ | 0.257 | 0.652 | 0.651 | 0.264 |
| Type of school | 0.211 | 0.241 | 0.467 | 0.736 | 0.446 | 0.909 |
| School holder | 0.243 | 0.621 | 0.121 | 0.238 | 0.405 | 0.470 |
| Location of the school | 0.843 | 0.938 | 0.496 | 0.992 | 0.893 | 0.195 |
| PAU Call | <0.001 *** | 0.091 + | 0.007 ** | a | 0.145 | a |
| Admission Reason | 0.070 + | 0.590 | 0.414 | 0.277 | <0.001 *** | a |
| Age | 0.023 * | 0.381 | 0.661 | 0.289 | 0.159 | 0.295 |
| First-semester grade | <0.001 *** | <0.001 *** | <0.001 *** | <0.001 *** | <0.001 *** | <0.001 *** |
| First-year grade | <0.001 *** | <0.001 *** | <0.001 *** | 0.009 ** | <0.001 *** | <0.001 *** |
| No. of ECTS Passed 1st semester | <0.001 *** | <0.001 *** | <0.001 *** | <0.001 *** | <0.001 *** | <0.001 *** |
| No. of ECTS Enrolled 1st semester | 0.046 * | 0.032 * | 0.563 | 0.318 | 0.543 | 0.459 |
| Ratio of subject passes 1st semester | <0.001 *** | <0.001 *** | <0.001 *** | <0.001 *** | <0.001 *** | <0.001 *** |
Significance levels: + 10%, * 5%, ** 1%, *** 0.1%, a means that is a constant.
Appendix C
Table A3.
Predictors Importance after 1st semester (SVN).
| Variables | Total | Sciences | Engineering | Arts and Humanities | Health Sciences | Social Sciences and Law |
|---|---|---|---|---|---|---|
| Area | 0.059 | |||||
| Scholarship holder | 0.084 | 0.062 | 0.070 | 0.114 | ||
| PAU Call | 0.094 | 0.058 | 0.077 | 0.049 | 0.039 | |
| Age | 0.047 | 0.058 | 0.074 | 0.043 | 0.045 | |
| Access Specialty | 0.059 | 0.069 | 0.104 | 0.071 | 0.093 | |
| Degree | 0.104 | 0.055 | 0.042 | 0.075 | ||
| Academic Amount | 0.052 | 0.077 | 0.058 | 0.041 | ||
| Mother’s or guardian’s level of studies | 0.051 | 0.109 | 0.089 | 0.065 | 0.044 | 0.048 |
| Father’s or guardian’s level of studies | 0.092 | 0.087 | ||||
| First-semester grade | 0.193 | 0.081 | 0.109 | 0.086 | 0.139 | 0.175 |
| Access grade | 0.061 | 0.038 | ||||
| PAU grade | 0.040 | |||||
| Admission Option | 0.046 | 0.058 | 0.076 | 0.062 | 0.047 | |
| Ratio of subject passes 1st semester | 0.163 | 0.086 | 0.302 | 0.305 | 0.171 | |
| Gender | 0.065 | 0.072 |
Color increases in intensity as the importance of the predictor increases.
Table A4.
Predictors Importance after 1st semester (ANN).
| Variables | Total | Sciences | Engineering | Arts and Humanities | Health Sciences | Social Sciences and Law |
|---|---|---|---|---|---|---|
| Area | ||||||
| Scholarship holder | 0.018 | |||||
| PAU Call | ||||||
| Age | 0.084 | 0.013 | 0.133 | 0.036 | 0.134 | 0.130 |
| Access Specialty | 0.036 | 0.063 | 0.055 | 0.054 | ||
| Degree | 0.075 | 0.054 | 0.088 | |||
| Academic Amount | 0.078 | 0.315 | 0.073 | 0.135 | 0.111 | 0.070 |
| Mother’s or guardian’s level of studies | 0.043 | 0.065 | 0.104 | 0.045 | 0.036 | |
| Father’s or guardian’s level of studies | 0.039 | 0.017 | 0.137 | 0.058 | 0.042 | 0.037 |
| First-semester grade | 0.180 | 0.369 | 0.112 | 0.086 | 0.254 | 0.172 |
| Access grade | 0.049 | 0.017 | 0.072 | 0.106 | 0.090 | |
| PAU grade | 0.046 | 0.034 | 0.061 | 0.072 | 0.074 | |
| Admission Option | 0.088 | 0.145 | 0.071 | 0.073 | 0.040 | 0.073 |
| Ratio of subject passes 1st semester | 0.177 | 0.026 | 0.149 | 0.229 | 0.073 | 0.134 |
| Gender | 0.086 |
Color increases in intensity as the importance of the predictor increases.
Table A5.
Predictors Importance after 1st semester (KNN).
| Variables | Total | Sciences | Engineering | Arts and Humanities | Health Sciences | Social Sciences and Law |
|---|---|---|---|---|---|---|
| Area | 0.067 | |||||
| Scholarship holder | 0.071 | 0.074 | 0.073 | 0.072 | ||
| PAU Call | 0.068 | 0.073 | 0.069 | 0.071 | 0.072 | 0.072 |
| Age | 0.066 | 0.073 | 0.069 | 0.071 | 0.072 | |
| Access Specialty | 0.067 | 0.073 | 0.073 | 0.072 | 0.071 | |
| Degree | 0.068 | 0.073 | 0.080 | 0.070 | 0.071 | 0.071 |
| Academic Amount | 0.067 | 0.073 | 0.071 | 0.072 | ||
| Mother’s or guardian’s level of studies | 0.071 | 0.072 | 0.071 | 0.072 | 0.071 | |
| Father’s or guardian’s level of studies | 0.073 | 0.070 | 0.070 | 0.072 | 0.071 | |
| First-semester grade | 0.068 | 0.071 | 0.073 | 0.074 | ||
| Access grade | 0.067 | 0.073 | 0.076 | 0.073 | 0.072 | |
| PAU grade | 0.066 | 0.073 | 0.080 | |||
| Admission Option | 0.073 | 0.069 | 0.071 | |||
| Ratio of subject passes 1st semester | 0.068 | 0.071 | 0.074 | |||
| Gender | 0.077 |
Color increases in intensity as the importance of the predictor increases.
Table A6.
Predictors Importance after 1st semester (Decision Tree).
| Variables | Total | Sciences | Engineering | Arts and Humanities | Health Sciences | Social Sciences and Law |
|---|---|---|---|---|---|---|
| Area | ||||||
| Scholarship holder | 0.090 | |||||
| PAU Call | 0.055 | |||||
| Age | 0.120 | |||||
| Access Specialty | 0.144 | |||||
| Degree | 0.054 | |||||
| Academic Amount | 0.051 | 0.643 | ||||
| Mother’s or guardian’s level of studies | 0.054 | 0.243 | ||||
| Father’s or guardian’s level of studies | ||||||
| First-semester grade | 0.197 | 0.066 | 0.124 | |||
| Access grade | 0.019 | |||||
| PAU grade | 0.058 | 0.294 | ||||
| Admission Option | 0.235 | |||||
| Ratio of subject passes 1st semester | 0.442 | 0.357 | 1.000 | 0.618 | 0.260 | 0.876 |
| Gender |
Color increases in intensity as the importance of the predictor increases.
References
- Organisation for Economic Co-operation and Development (OECD). Education at a Glance 2019: OECD Indicators; OECD Publishing: Paris, France, 2019. [Google Scholar]
- Ortiz-Lozano, J.M.; Rua-Vieites, A.; Bilbao-Calabuig, P.; Casadesús-Fa, M. University student retention: Best time and data to identify undergraduate students at risk of dropout. Innov. Educ. Teach. Int. 2018, 57, 74–85. [Google Scholar] [CrossRef]
- Ortiz, E.A.; Dehon, C. Roads to Success in the Belgian French Community’s Higher Education System: Predictors of Dropout and Degree Completion at the Universite Libre de Bruxelles. Res. High. Educ. 2013, 54, 693–723. [Google Scholar] [CrossRef]
- Cabrera, L.; Bethencourt, J.T.; Alvarez Pérez, P.; González Afonso, M. El problema del abandono de los estudios universitarios. Rev. Electrónica Investig. Evaluación Educ. 2006, 12, 171–203. [Google Scholar] [CrossRef]
- Lassibille, G.; Navarro Gómez, M.L. Why do higher education students drop out? Evidence from Spain. Educ. Econ. 2008, 1, 89–106. [Google Scholar] [CrossRef]
- Behr, A.; Giese, M.; Teguim Kamdjou, H.D.; Theune, K. Dropping out of university: A literature review. Rev. Educ. 2020, 8, 614–652. [Google Scholar] [CrossRef]
- Fernandez-Garcia, A.J.; Preciado, J.C.; Melchor, F.; Rodriguez-Echeverria, R.; Conejero, J.M.; Sanchez-Figueroa, F. A Real-Life Machine Learning Experience for Predicting University Dropout at Different Stages Using Academic Data. IEEE Access 2021, 9, 133076–133090. [Google Scholar] [CrossRef]
- Nieto-Reyes, A.; Duque, R.; Francisci, G. A Method to Automate the Prediction of Student Academic Performance from Early Stages of the Course. Mathematics 2021, 9, 2677. [Google Scholar] [CrossRef]
- Liu, T.; Wang, C.; Chang, L.; Gu, T. Predicting High-Risk Students Using Learning Behavior. Mathematics 2022, 10, 2483. [Google Scholar] [CrossRef]
- Larsen, M.S.; Kornbeck, K.P.; Kristensen, R.; Larsen, M.R.; Sommersel, H.B. Dropout Phenomena at Universities: What Is DROPOUT? Why Does Dropout Occur? What Can Be Done by the Universities to Prevent or Reduce It? Danish Clearinghouse for Educational Research: Aarhus, Denmark, 2013. [Google Scholar]
- Fernández-Mellizo, M. Análisis del Abandono de Los Estudiantes de Grado en Las Universidades Presenciales en España; Ministerio de Universidades: Madrid, Spain, 2022. [Google Scholar]
- Constante-Amores, A.; Fernández-Mellizo, M.; Florenciano Martínez, E.; Navarro Asencio, E. Factores asociados al abandono universitario. Educ. XX1 2021, 24, 17–44. [Google Scholar]
- Rodriguez-Muniz, L.J.; Bernardo, A.B.; Esteban, M.; Diaz, I. Dropout and transfer paths: What are the risky profiles when analyzing university persistence with machine learning techniques? PLoS ONE 2019, 14, e0218796. [Google Scholar] [CrossRef]
- Romero, C.; Ventura, S. Educational Data Mining: A Review of the State of the Art. IEEE Trans. Syst. Man Cybern. Part C-Appl. Rev. 2010, 40, 601–618. [Google Scholar] [CrossRef]
- Frawley, W.J.; Piatetskyshapiro, G.; Matheus, C.J. Knowledge discovery in databases—An overview. Ai Mag. 1992, 13, 57–70. [Google Scholar]
- Grillo, S.A.; Roman, J.C.M.; Mello-Roman, J.D.; Noguera, J.L.V.; Garcia-Torres, M.; Divina, F.; Sotomayor, P.E.G. Adjacent Inputs With Different Labels and Hardness in Supervised Learning. IEEE Access 2021, 9, 162487–162498. [Google Scholar] [CrossRef]
- Lee, Y.W.; Choi, J.W.; Shin, E.H. Machine learning model for predicting malaria using clinical information. Comput. Biol. Med. 2021, 129, 104151. [Google Scholar] [CrossRef] [PubMed]
- Viloria, A.; Padilla, J.G.; Vargas-Mercado, C.; Hernandez-Palma, H.; Llinas, N.O.; David, M.A. Integration of Data Technology for Analyzing University Dropout. Procedia Comput. Sci. 2019, 155, 569–574. [Google Scholar] [CrossRef]
- Shahiri, A.M.; Husain, W.; Rashid, N.A. A Review on Predicting Student’s Performance using Data Mining Techniques. Procedia Comput. Sci. 2015, 72, 414–422. [Google Scholar] [CrossRef]
- Jovic, A.; Brkic, K.; Bogunovic, N. A review of feature selection methods with applications. In Proceedings of the 2015 38th International Convention on Information and Communication Technology, Electronics and Microelectronics (Mipro), Opatija, Croatia, 25–29 May 2015; IEEE: New York, NY, USA, 2015; pp. 1200–1205. [Google Scholar]
- Saeys, Y.; Inza, I.; Larranaga, P. A review of feature selection techniques in bioinformatics. Bioinformatics 2007, 23, 2507–2517. [Google Scholar] [CrossRef]
- Wah, Y.B.; Ibrahim, N.; Hamid, H.A.; Abdul-Rahman, S.; Fong, S. Feature Selection Methods: Case of Filter and Wrapper Approaches for Maximising Classification Accuracy. Pertanika J. Sci. Technol. 2018, 26, 329–339. [Google Scholar]
- Sandoval-Palis, I.; Naranjo, D.; Vidal, J.; Gilar-Corbi, R. Early Dropout Prediction Model: A Case Study of University Leveling Course Students. Sustainability 2020, 12, 9314. [Google Scholar] [CrossRef]
- Mello-Roman, J.D.; Mello-Roman, J.C.; Gomez-Guerrero, S.; Garcia-Torres, M. Predictive Models for the Medical Diagnosis of Dengue: A Case Study in Paraguay. Comput. Math. Methods Med. 2019, 2019, 7307803. [Google Scholar] [CrossRef]
- Ghorbani, M.A.; Zadeh, H.A.; Isazadeh, M.; Terzi, O. A comparative study of artificial neural network (MLP, RBF) and support vector machine models for river flow prediction. Environ. Earth Sci. 2016, 75, 1–14. [Google Scholar] [CrossRef]
- Haykin, S. Neural Networks: A Comprehensive Foundation; Prentice Hall PTR: Hoboken, NJ, USA, 1994; p. 842. [Google Scholar]
- Kayri, M. An Intelligent Approach to Educational Data: Performance Comparison of the Multilayer Perceptron and the Radial Basis Function Artificial Neural Networks. Educ. Sci.-Theory Pract. 2015, 15, 1247–1255. [Google Scholar]
- Shawe-Taylor, J.; Cristianini, N. Kernel Methods for Pattern Analysis; Cambridge University Press: Cambridge, UK, 2004; p. 460. [Google Scholar]
- Tan, P.N.; Steinbach, M.; Kumar, V. Introduction to Data Mining; Pearson Education India: Noida, India, 2016; p. 169. [Google Scholar]
- Yukselturk, E.; Ozekes, S.; Turel, Y.K. Predicting dropout student: An application of data mining methods in an online education program. Eur. J. Open Distance E-Learn. 2014, 17, 118–133. [Google Scholar] [CrossRef]
- Wendler, T.; Gröttrup, S. Data Mining with SPSS Modeler: Theory, Exercises and Solutions; Springer: Cham, Switzerland, 2016; p. 1059. [Google Scholar]
- Agrusti, F.; Mezzini, M.; Bonavolonta, G. Deep learning approach for predicting university dropout: A case study at Roma Tre University. J. E-Learn. Knowl. Soc. 2020, 16, 44–54. [Google Scholar] [CrossRef]
- Mello-Román, J.D.; Hernández, A. Un estudio sobre el rendimiento académico en Matemáticas. Rev. Electrónica Investig. Educ. 2019, 21, e29. [Google Scholar] [CrossRef]
- Tan, M.J.; Shao, P.J. Prediction of Student Dropout in E-Learning Program Through the Use of Machine Learning Method. Int. J. Emerg. Technol. Learn. 2015, 10, 11–17. [Google Scholar] [CrossRef]
- Kass, G.V. An exploratory technique for investigating large quantities of categorical data. Appl. Stat. 1980, 29, 119–127. [Google Scholar] [CrossRef]
- Ahuja, R.; Kankane, Y. Predicting the Probability of Student’s Degree Completion by Using Different Data Mining Techniques. In Proceedings of the 2017 Fourth International Conference on Image Information Processing (ICIIP), Near Shimla, India, 21–23 December 2017; IEEE: New York, NY, USA, 2017; pp. 474–477. [Google Scholar]
- Cunningham, P.; Delany, S.J. k-Nearest Neighbour Classifiers—A Tutorial. Acm Comput. Surv. 2021, 54, 1–25. [Google Scholar] [CrossRef]
- Opazo, D.; Moreno, S.; Alvarez-Miranda, E.; Pereira, J. Analysis of First-Year University Student Dropout through Machine Learning Models: A Comparison between Universities. Mathematics 2021, 9, 2599. [Google Scholar] [CrossRef]
Figure 1.
Areas and university degrees under study.

Figure 2.
Set of processes followed to obtain University Dropout Predictions.

Figure 3.
Predictive accuracy: minimum, average and maximum for global and who did not drop out.

Figure 4.
Predictive accuracy: minimum, average and maximum only for those that dropped out.

Table 1.
Number of enrolled students and dropouts per degree and its percentage.
| Degree | Enrollees | Dropouts | Percentage |
|---|---|---|---|
| Business Administration and Management | 564 | 86 | 15.25% |
| Economics | 275 | 78 | 28.36% |
| Commerce | 223 | 30 | 13.45% |
| Tourism | 217 | 32 | 14.75% |
| Law | 869 | 119 | 13.69% |
| Mathematics | 154 | 19 | 12.34% |
| Psychology | 705 | 75 | 10.64% |
| Computer Engineering | 70 | 27 | 38.57% |
| Computer Science Engineering | 116 | 16 | 13.79% |
| Art History | 235 | 59 | 25.11% |
| Total | 3428 | 541 | 15.78% |
Table 2.
Preliminary results of significant qualitative variables.
| Variables | Not Dropout | Dropout |
|---|---|---|
| Degree | Business Administration and Management (84.8%) | Business Administration and Management (15.2%) |
| Economics (71.6%) | Economics (28.4%) | |
| Commerce (86.5%) | Commerce (13.5%) | |
| Tourism (85.3%) | Tourism (14.7%) | |
| Law (86.3%) | Law (13.7%) | |
| Mathematics (87.7%) | Mathematics (12.3%) | |
| Psychology (89.4%) | Psychology (10.6%) | |
| Computer Engineering (61.4%) | Computer Engineering (38.6%) | |
| Computer Science Engineering (86.2%) | Computer Science Engineering (13.8%) | |
| Art History (74.9%) | Art History (25.1%) | |
| Area | Social Science and Law (83.9%) | Social Science and Law (16.1%) |
| Sciences (87.7%) | Sciences (12.3%) | |
| Health Sciences (89.4%) | Health Sciences (10.6%) | |
| Engineering (76.9%) | Engineering (23.1%) | |
| Arts and Humanities (74.9%) | Arts and Humanities (25.1%) | |
| Gender | Men (81.6%), Women (87.2%) | Men (18.4%), Women (12.8%) |
| Access Specialty | Social Science and Humanities (82.8%) | Social Science and Humanities (17.2%) |
| Technical Sciences (87.1%) | Technical Sciences (12.9%) | |
| Health Sciences (73.3%) | Health Sciences (26.7%) | |
| Arts (61.1%) | Arts (38.9%) | |
| Mother’s or guardian’s level of studies | Illiterate (100.0%) | Illiterate (0.0%) |
| No education (85.0%) | No education (15.0%) | |
| Primary education (81.9% | Primary education (18.1%) | |
| Secondary education (83.3%) | Secondary education (16.7%) | |
| Higher education (86.6%) | Higher education (13.4%) | |
| Father’s or guardian’s level of studies | Illiterate (96.6%) | Illiterate (3.4%) |
| No education (81.8%) | No education (18.2%) | |
| Primary education (83.7%) | Primary education (16.3%) | |
| Secondary education (82.7%) | Secondary education (17.3%) | |
| Higher education (86.3%) | Higher education (13.7%) | |
| Scholarship holder | Yes (85.8%), No (82.9%) | Yes (14.2%), No (17.1%) |
| Type of scholarship | Education Ministry (85.4%) | Education Ministry (14.6%) |
| University (94.8%) | University (5.2%) | |
| PAU Call | Ordinary (85.3%), Extraordinary (77.5%) | Ordinary (14.7%), Extraordinary (22.5%) |
| Admission Reason | General (84.5%) | General (15.5%) |
| Disabled (81.3%) | Disabled (18.8%) | |
| Elite athletes (61.5%) | Elite athletes (38.5%) |
Table 3.
Preliminary results of significant quantitative variables.
| Variables | Not Dropout | Dropout |
|---|---|---|
| Academic Amount | ||
| Admission Option | ||
| PAU grade | ||
| Access grade | ||
| Age | years | |
| First-semester grade | ||
| No. of ECTS Passed 1st semester | ||
| No. of ECTS Enrolled 1st semester | ||
| Ratio of subject passes 1st semester |
Values are the mean of each variable for each group.
Table 4.
Chosen Variables in Feature Selection.
| Variable | Type | Feature Importance Enrollment | Feature Importance after 1st Semester |
|---|---|---|---|
| Degree | Nominal | 1.000 | 1.000 |
| Access grade | Continuous | 1.000 | 1.000 |
| Area | Nominal | 1.000 | 1.000 |
| PAU grade | Continuous | 1.000 | 1.000 |
| Access Specialty | Nominal | 1.000 | 1.000 |
| Gender | Nominal | 1.000 | 1.000 |
| PAU Call | Nominal | 1.000 | 1.000 |
| Mother’s or guardian’s level of studies | Nominal | 0.998 | 0.998 |
| Age | Continuous | 0.994 | 0.994 |
| School holder | Nominal | 0.978 | 0.978 |
| Father’s or guardian’s level of studies | Nominal | 0.965 | 0.965 |
| Admission Option | Continuous | 0.962 | 0.962 |
| Academic Amount | Continuous | 0.955 | 0.955 |
| Ratio of subject passes 1st semester | Continuous | NA 1 | 1.000 |
| First-semester grade | Continuous | NA 1 | 1.000 |
1 Not applicable.
Table 5.
Predictive accuracy of Machine Learning methods.
| Technique | Groups | Enrollment Variables | After 1st Semester | ||||
|---|---|---|---|---|---|---|---|
| Global 1 | Not Dropouts | Dropouts | Global 1 | Not Dropouts | Dropouts | ||
| SVM | Total | 82.90% | 95.58% | 9.38% | 85.57% | 94.72% | 32.50%2 |
| Social Sciences and Law | 81.40% | 96.92% | 10.00% | 83.18% | 95.11% | 28.33% | |
| Arts and Humanities | 62.67% | 77.59% | 11.76% | 76.00% | 89.66% | 29.41% | |
| Sciences | 87.76% | 100.00% | 0.00% 3 | 87.76% | 97.67% | 16.67% 3 | |
| Health Sciences | 86.67% | 93.78% | 5.88% | 88.57% | 93.78% | 29.41% 5 | |
| Engineering | 75.41% | 89.36% | 28.57% 2 | 70.49% | 85.11% | 21.43% | |
| ANN | Total | 85.11% | 99.78% | 0.00% 3 | 87.13% | 96.88% | 30.63% |
| Social Sciences and Law | 81.99% | 99.46% | 1.67% | 84.97% | 97.10% | 29.17% | |
| Arts and Humanities | 74.67% | 96.55% | 0.00% 3 | 70.67% | 81.03% | 35.29% 2 | |
| Sciences | 86.00% | 93.33% | 20.00% 2,4 | 85.00% | 100.00% | 14.29% 3 | |
| Health Sciences | 90.95% | 97.93% | 11.76% | 90.95% | 96.37% | 29.41% 5 | |
| Engineering | 77.05% | 97.87% | 7.14% | 78.69% | 95.74% | 21.43% | |
| Decision Tree | Total | 82.05% | 98.58% | 0.58% 3 | 85.32% | 95.05% | 33.33% 5 |
| Social Sciences and Law | 81.33% | 98.68% | 1.72% | 86.71% | 96.15% | 35.24% | |
| Arts and Humanities | 71.43% | 82.14% | 28.57% 2 | 79.73% | 89.83% | 40.00% 2 | |
| Sciences | 80.77% | 89.13% | 16.67% | 83.64% | 97.83% | 11.11% | |
| Health Sciences | 86.22% | 98.82% | 3.85% | 85.45% | 95.90% | 4.00% 3 | |
| Engineering | 78.79% | 97.92% | 27.78% 4 | 71.19% | 83.72% | 37.50% 5 | |
| KNN | Total | 85.59% | 98.95% | 16.36% 2,4 | 88.72% | 99.01% | 29.30% |
| Social Sciences and Law | 86.47% | 99.46% | 14.85% 4 | 88.48% | 97.55% | 39.05% 5 | |
| Arts and Humanities | 74.07% | 98.31% | 9.09% | 88.89% | 96.83% | 61.11% 2,5 | |
| Sciences | 91.23% | 100.00% | 0.00% 3 | 87.27% | 100.00% | 22.22% | |
| Health Sciences | 87.83% | 98.02% | 14.29% 4 | 87.83% | 98.02% | 14.29% | |
| Engineering | 89.06% | 100.00% | 12.50% | 82.26% | 100.00% | 31.25% | |
| Logistic Regression | Total | 83.37% | 99.77% | 0.00% 3 | 87.22% | 97.02% | 30.57% |
| Social Sciences and Law | 83.74% | 98.74% | 0.99% | 87.59% | 97.38% | 34.29% | |
| Arts and Humanities | 76.47% | 86.96% | 31.25% 2,4 | 75.31% | 85.71% | 38.89% 2 | |
| Sciences | 91.23% | 100.00% | 0.00%3 | 85.45% | 95.65% | 33.33% 5 | |
| Health Sciences | 88.98% | 99.52% | 13.79% | 90.45% | 98.46% | 28.00% 3 | |
| Engineering | 75.00% | 84.75% | 11.11% | 72.58% | 84.78% | 37.50%5 | |
1 Global isthepredictive accuracy for the overall model, not-dropouts and dropouts. 2 Highest predictive accuracy for dropouts with only enrollment variables and after 1st semester variables for each technique. 3 Lowest predictive accuracy for dropouts with only enrollment variables and after 1st semester variables for each technique. 4 Highest predictive accuracy for dropouts with only enrollment variables for each group. 5 Highest predictive accuracy for dropouts with after 1st semester variables for each group.
Table 6.
Predictors Importance after 1st semester (Logistic Regression).
| Variables | Total | Sciences | Engineering | Arts and Humanities | Health Sciences | Social Sciences and Law |
|---|---|---|---|---|---|---|
| Area | 0.043 | |||||
| Scholarship holder | 0.045 | 0.087 | 0.046 | 0.068 | 0.036 | |
| PAU Call | 0.049 | 0.045 | 0.057 | |||
| Age | 0.043 | 0.062 | 0.034 | 0.039 | 0.043 | |
| Access Specialty | 0.044 | 0.049 | 0.061 | 0.056 | 0.082 | 0.048 |
| Degree | 0.100 | 0.074 | ||||
| Academic Amount | 0.158 | 0.084 | 0.039 | |||
| Mother’s or guardian’s level of studies | 0.175 | 0.069 | 0.126 | 0.040 | ||
| Father’s or guardian’s level of studies | 0.052 | 0.099 | ||||
| First-semester grade | 0.212 | 0.058 | 0.175 | 0.124 | 0.254 | |
| Access grade | 0.043 | 0.074 | 0.044 | 0.041 | 0.045 | |
| PAU grade | 0.049 | 0.043 | 0.038 | 0.061 | ||
| Admission Option | 0.045 | 0.051 | 0.050 | 0.058 | 0.042 | |
| Ratio of subject passes 1st semester | 0.285 | 0.186 | 0.260 | 0.263 | 0.244 | |
| Gender | 0.042 | 0.044 | 0.085 | 0.048 |
Color increases in intensity as the importance of the predictor increases.
Publisher’s Note: MDPI stays neutral with regard to jurisdictional claims in published maps and institutional affiliations. |
© 2022 by the authors. Licensee MDPI, Basel, Switzerland. This article is an open access article distributed under the terms and conditions of the Creative Commons Attribution (CC BY) license (https://creativecommons.org/licenses/by/4.0/).
Share and Cite
MDPI and ACS Style
Segura, M.; Mello, J.; Hernández, A. Machine Learning Prediction of University Student Dropout: Does Preference Play a Key Role? Mathematics 2022, 10, 3359. https://0-doi-org.brum.beds.ac.uk/10.3390/math10183359
AMA Style
Segura M, Mello J, Hernández A. Machine Learning Prediction of University Student Dropout: Does Preference Play a Key Role? Mathematics. 2022; 10(18):3359. https://0-doi-org.brum.beds.ac.uk/10.3390/math10183359
Chicago/Turabian StyleSegura, Marina, Jorge Mello, and Adolfo Hernández. 2022. "Machine Learning Prediction of University Student Dropout: Does Preference Play a Key Role?" Mathematics 10, no. 18: 3359. https://0-doi-org.brum.beds.ac.uk/10.3390/math10183359
Note that from the first issue of 2016, this journal uses article numbers instead of page numbers. See further details here.