
ECG Signal Features Classification for the Mental Fatigue Recognition

1
Department of Software Engineering, Kaunas University of Technology, Studentu Str. 50, 51368 Kaunas, Lithuania
2
Department of Applied Mathematics, Kaunas University of Technology, Studentu Str. 50, 51368 Kaunas, Lithuania
*
Author to whom correspondence should be addressed.
Mathematics 2022, 10(18), 3395; https://0-doi-org.brum.beds.ac.uk/10.3390/math10183395
Submission received: 29 July 2022
/
Revised: 9 September 2022
/
Accepted: 15 September 2022
/
Published: 19 September 2022
(This article belongs to the Special Issue Advances in Artificial Intelligence and Statistical Techniques with Applications to Health and Education)
Abstract
:Mental fatigue is a major public health issue worldwide that is common among both healthy and sick people. In the literature, various modern technologies, together with artificial intelligence techniques, have been proposed. Most techniques consider complex biosignals, such as electroencephalogram, electro-oculogram or classification of basic heart rate variability parameters. Additionally, most studies focus on a particular area, such as driving, surgery, etc. In this paper, a novel approach is presented that combines electrocardiogram (ECG) signal feature extraction, principal component analysis (PCA), and classification using machine learning algorithms. With the aim of daily mental fatigue recognition, an experiment was designed wherein ECG signals were recorded twice a day: in the morning, i.e., a state without fatigue, and in the evening, i.e., a fatigued state. PCA analysis results show that ECG signal parameters, such as Q and R wave amplitude values, as well as QT and T intervals, presented with the largest differences between states compared to other ECG signal parameters. Furthermore, the random forest classifier achieved more than 94.5% accuracy. This work demonstrates the feasibility of ECG signal feature extraction for automatic mental fatigue detection.
1. Introduction
Fatigue is a phenomenon that has not been conventionally defined and relates, in particular, to reactions to various loads and conditions, including experiences and states of mind. Fatigue is also defined as a subjective lack of physical and/or mental energy perceived by an individual to interfere with their usual or desired activities [1].
Usually, fatigue is a state associated with a weakening or depletion of an individual’s physical and/or mental resources, ranging from a general state of lethargy to a specific burning sensation in a particular muscle. Physical fatigue leads to an inability to continue functioning at a normal level of activity. Mental fatigue is a state of tiredness that sets in when brain energy levels are depleted. In the literature, fatigue is differentiated into six types: social, emotional, physical, pain, mental, and chronic illnesses; furthermore, these types are often distinguished in terms of physical and mental fatigue [2].
Many people experience mental fatigue (MF) in daily life or work activities that require sustained mental efficiency [3]. MF can be defined as a psychobiological state caused by prolonged episodes of cognitive exertion [4]. Overwork-related disorders, such as cerebrovascular/cardiovascular diseases, diabetes, and cancer, are major health issues worldwide [5,6]. However, fatigue is a common symptom in both sick and healthy people [7]. Fatigue is one of the most crucial factors contributing to decreased performance among aircraft pilots; car drivers [8]; individual athletes [9]; and team sport athletes, such as soccer players [10]; among other professions. Furthermore, mental fatigue may reduce cognitive resources and impair balance performance [11]. In some literature reports, cognitive fatigue (CF) is considered the main component of mental fatigue. CF is known to cause attention deficits, leading to poor situational awareness and impaired vigilance [12]. Various cognitive tests are used to detect mental fatigue, such as the psychomotor vigilance task, the Stroop task, the AX-continuous performance test, and the TloadDback test; however, such tasks takes time and require additional performance [13].
In the literature, electroencephalographic (EEG) signal features are studied and analyzed as a relevant tool for the detection of mental fatigue [14,15]. However, it is not always possible to record EEG signals and conduct measurements in real-life environments due to electric line noise or noise from electronic equipment [16]. In other research, electromyography (EMG) and electro-oculography (EOG) signals, as well as inertial measurement unit (IMU) sensors, 3D optical tracking techniques, infrared cameras, and accelerometer signals, have been analyzed [17,18]. Scientists have proposed artificial intelligence and expert system-based solutions that combine several sensors and devices [19]. EEG, together with ECG signal recordings, are very common in fatigue detection tasks for drivers, for whom exhaustion and distraction may lead to serious accidents [20]. In the literature, real-time monitoring systems are used to detect heart anomalies [21]. In such cases, ECG signals are classified for in an alert configuration to notify designated healthcare providers. However, most systems are designed to detect various heart anomalies and might not be applicable to fatigue recognition.
When the sympathetic nervous system is active to a heightened degree, the heart regularly beats at a faster pace, whereas the opposite occurs when the parasympathetic nervous system is active to a heightened degree. Therefore, during mental fatigue or stress, heart rate variability (HRV) is lower than normal. This parameter is a convenient tool to monitor personal health using simple smart devices, such as watches; however, the results are consistently inaccurate and depend on individual human characteristics. Furthermore, to acquire accurate results, the non-linear characteristics of heart rate (HR) must be investigated [22].
Usually, a classification algorithm consists of two main parts: primary signal transformation and classification. The primary transformation process is based on feature analysis to extract the raw signal and reduce its dimensions [23]. Classifying ECG signals into pathologies or health stages is a complicated task that requires recognition of the signal structure. Generally, a combination of several classification algorithms is used to solve this problem [24]. A similar classification problem is considered in the fatigue identification process. In this article, the research object is not a continuous ECG signal or its segments but separate signals that were recorded at different times of the day (in the morning and the evening). Usually, fatigue occurs after intensive physical or mental activity, mostly at the end of the working day. Instant physical fatigue detection after an intensive training session is a simple task because the heart is loaded and works faster. However, mental fatigue detection is a more complicated task because there is no clear difference in terms of ECG signal parameters.
Another technique used in medicine is principal component analysis (PCA). This method of analysis is used to detect early stages of diseases and to diagnose the cardiac health of patients [25,26,27,28,29,30]. This technique was used in the present study to evaluate the differences between ECG features in different states and to detect mental fatigue symptoms.
This research focuses on mental fatigue recognition in healthy individuals based on their health condition at different times of the day. All data are split into two datasets. Data gathered in the first subset corresponds to a normal state without fatigue, whereas the second subset consists of data recorded in the evening, representing a fatigued state. The main purpose of this paper is to determine whether ECG signal features reveal differences in mental states. However, the proposed framework is not designed for diagnostic purposes and should be tested on clinical patients for use as a specific criterion for mental fatigue diagnosis.
The structure of this article is as follows: Section 2 highlights the recent literature on mental fatigue detection using various biosignal classification methods and other techniques. The experimental design, data description, and applied methods are presented in Section 3. Section 4 consists of data analysis using the PCA method, and analysis of the performance of ML algorithms. Finally, a discussion and conclusions are presented in Section 5.
2. Related Work
Modern wearable devices, such as eye-tracking technologies, are becoming increasingly popular. Li et al. [31] demonstrated the feasibility of applying wearable eye-tracking technology to identify and classify mental fatigue in construction equipment operators. The Toeplitz inverse covariance-based clustering (TICC) method was used to determine multiple levels of mental fatigue, and the classification task was performed using support vector machine (SVM) methods. However, this study consisted of a narrow target group and might not be applicable in other fields.
In [32], EEG and HRV signals were observed and analyzed to detect the impacts of prolonged cognitive activity on the central nervous system and the autonomic nervous system. EEG signal wavelet packet parameters and HRV spectral indices were combined to measure changes in mental fatigue. Although 91% classification accuracy was achieved, two separate devices for EEG and HRV recordings are not efficient and barely usable in daily life activities. Furthermore, EEG signals are most likely contaminated by muscle artifacts, which may lead to incorrect interpretation. For this reason, various filtering and feature extraction methods have been proposed [33,34]. Preprocessed EEG signals can be used in multilevel fatigue recognition tasks. In [35], EEG signals were classified using a K-nearest neighbor (KNN) classifier, achieving 100% accuracy. These results demonstrate the feasibility of using EEG signals and extracted features to successfully detect mental fatigue. However, in this case, the data were collected using a driving simulator and a brain cap with 32 electrodes placed on the skin surface, which may not be applicable in real-world environments.
Portable single-channel electrocardiogram equipment (“LaPatch”) was used in [5] to record and analyze ECG signals. Eight heart rate variability (HRV) indicators were considered and classified using SVM, KNN, naïve Bayes (NB), and logistic regression (LR) models. Although the technique is promising, due to the small sample size, only 75.5% accuracy was achieved. In another study, researchers developed an automatic mental stress detection system based on ECG signals recorded from T-shirts and analyzed using machine learning (ML) classifiers: decision tree (DT), random forest (RF), NB, and LR [6]. The best-performing model achieved an accuracy of 94.1%. However, in this research only mental stress detection was considered, and the same technique may not be applicable to mental fatigue recognition.
Wearable devices for HRV recordings are usually user-friendly and convenient. Furthermore, they do not require electrodes to be attached directly to the skin surface. Many studies have focused on heart rate (HR) and time- or spectral-domain HRV analysis. For example, in [36], mental and physical fatigue detection methods were applied based on HR, HRV, skin temperature, and pulse. Causal convolutional neural networks (cCNN) and RF models were used to detect and distinguish between mental and physical fatigue. However, only 66.2% accuracy was achieved in the mental fatigue recognition task. Other similar research used a polar H10 chest strap and photoplethysmography (PPG) technology for HRV detection [37]. Results were compared with those obtained with a Bittium FarosTM 360 device, which records a single ECG lead. Furthermore, the study included several watches, such as the Actigraph wGT3X-BT, Garmin, and Polar Vantage V. Various time- and spectral-domain HRV parameters were estimated and compared. However, no decision-making or fatigue recognition techniques were applied.
Modern wearable electronics have been developed in recent years, such as epidermal electronics systems (EES) and electronic tattoos (E-tattoos), with which ECG signals, respiration rate, and galvanic skin responses (GSR) can be recorded [38]. Comparing three ML models (SVM, KNN, and DT) the obtained signals were classified with 89% accuracy. Although these technologies are promising, the equipment has not been fully tested and prepared for production. A transparent eye detection system can also be considered a modern wearable device [39]. Such a system can acquire movement in the pupil and detect blinking based on the light that is reflected from the eye. A summary of these and similar wearable devices and corresponding research in recent literature is presented in Table 1.
Because HRV analysis cannot achieve high accuracy in mental fatigue recognition and EEG signals are not reliable in daily life activities, in this paper, a novel framework is proposed for mental fatigue detection that involves analysis and classification of ECG signal features. Furthermore, principal component analysis (PCA) is applied to distinguish between ECG signal parameters in two different states (in the morning, i.e., a non-fatigued state, and in the evening, i.e., fatigue condition). The classification task is performed using several models: KNN, LDA, DT, and RF.
3. Materials and Methods
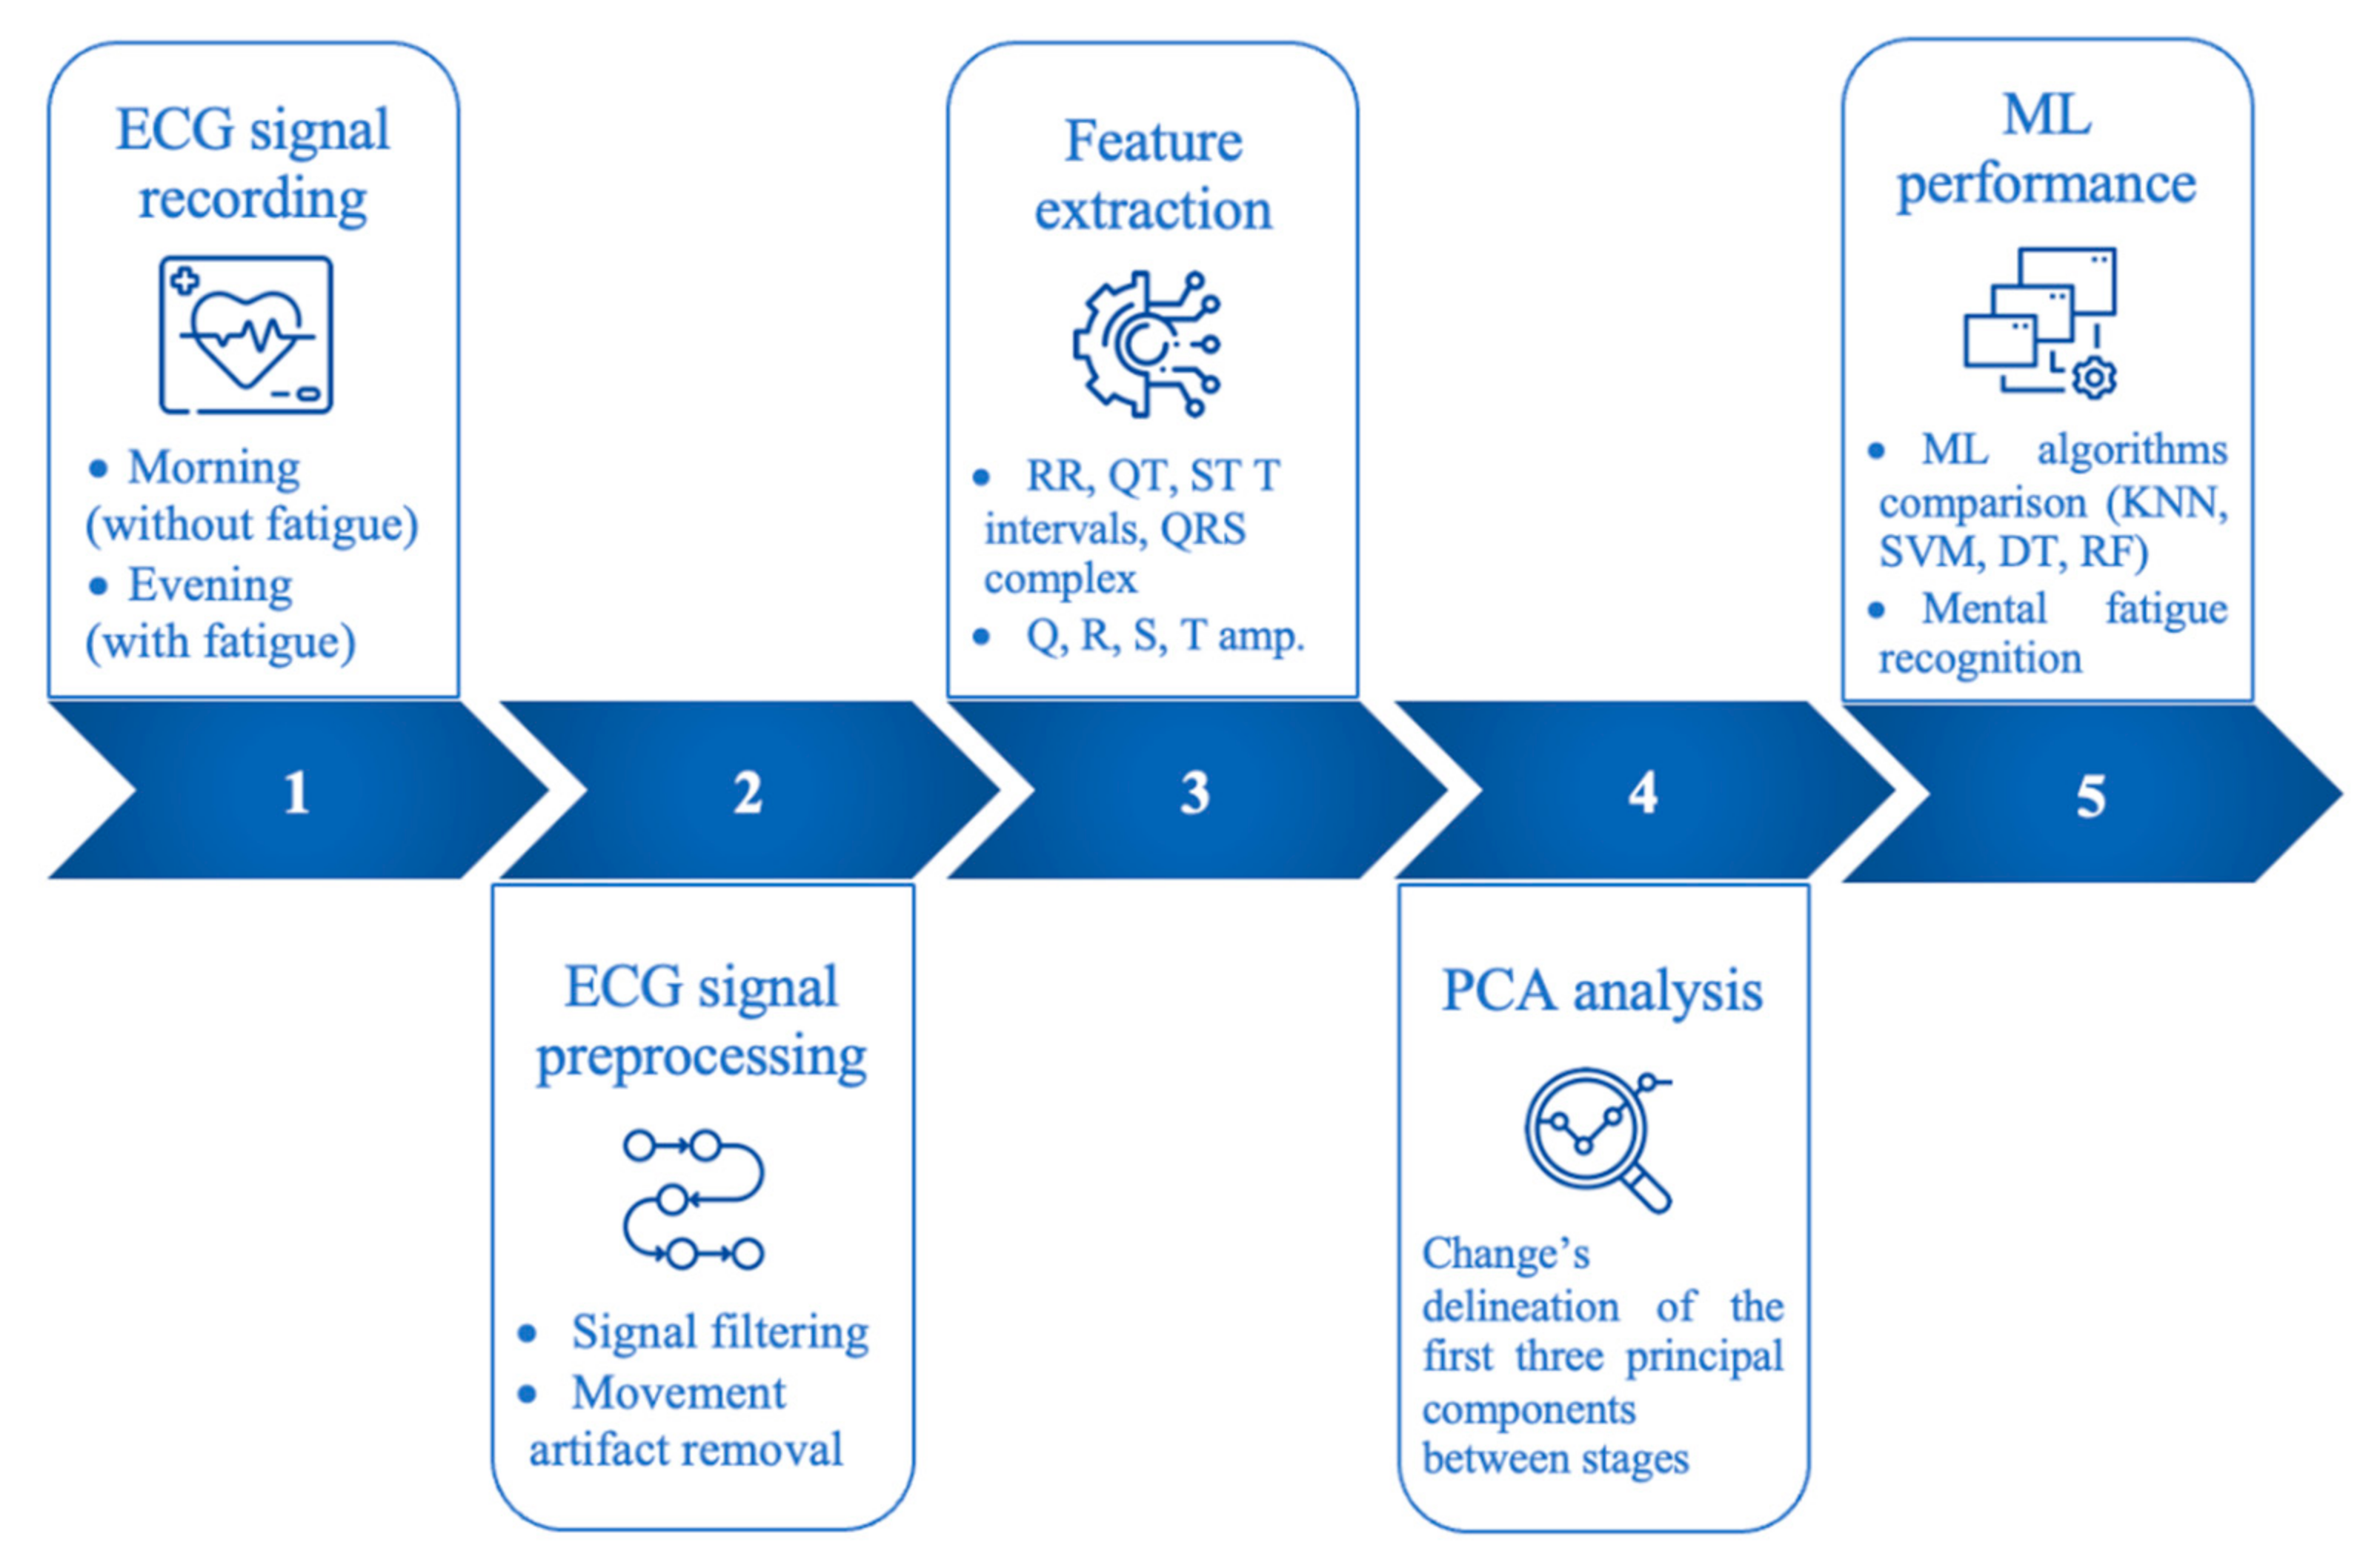
In this section, we describe the proposed data analysis and classification processes that are essential for mental fatigue recognition. The whole process flow consists of five main parts: ECG signal recording, ECG signal preprocessing, feature extraction, PCA analysis, and ML performance (see Figure 1). The experiment was designed with ECG signal registration twice a day (in the morning and in the evening). HRV analysis or whole ECG signal classification techniques failed on the mental fatigue recognition task, so we proposed the extraction of ECG signal features only when applying classification algorithms, such as KNN, DT, RF, etc. Before implementation of a machine learning technique, PCA analysis was applied to make sure that there were significant differences between ECG signal features in separate states. This research was conducted with the approval of the Kaunas Regional Research Ethics Committee of our institution under the project name, “Various directionalities on physical exercise effects that are based on differential learning methodology, and impact on heart and cardiovascular system” (biomedical ethics permission number BE-2–38, Lithuania).
3.1. ECG Signal Characteristics and Data Analysis
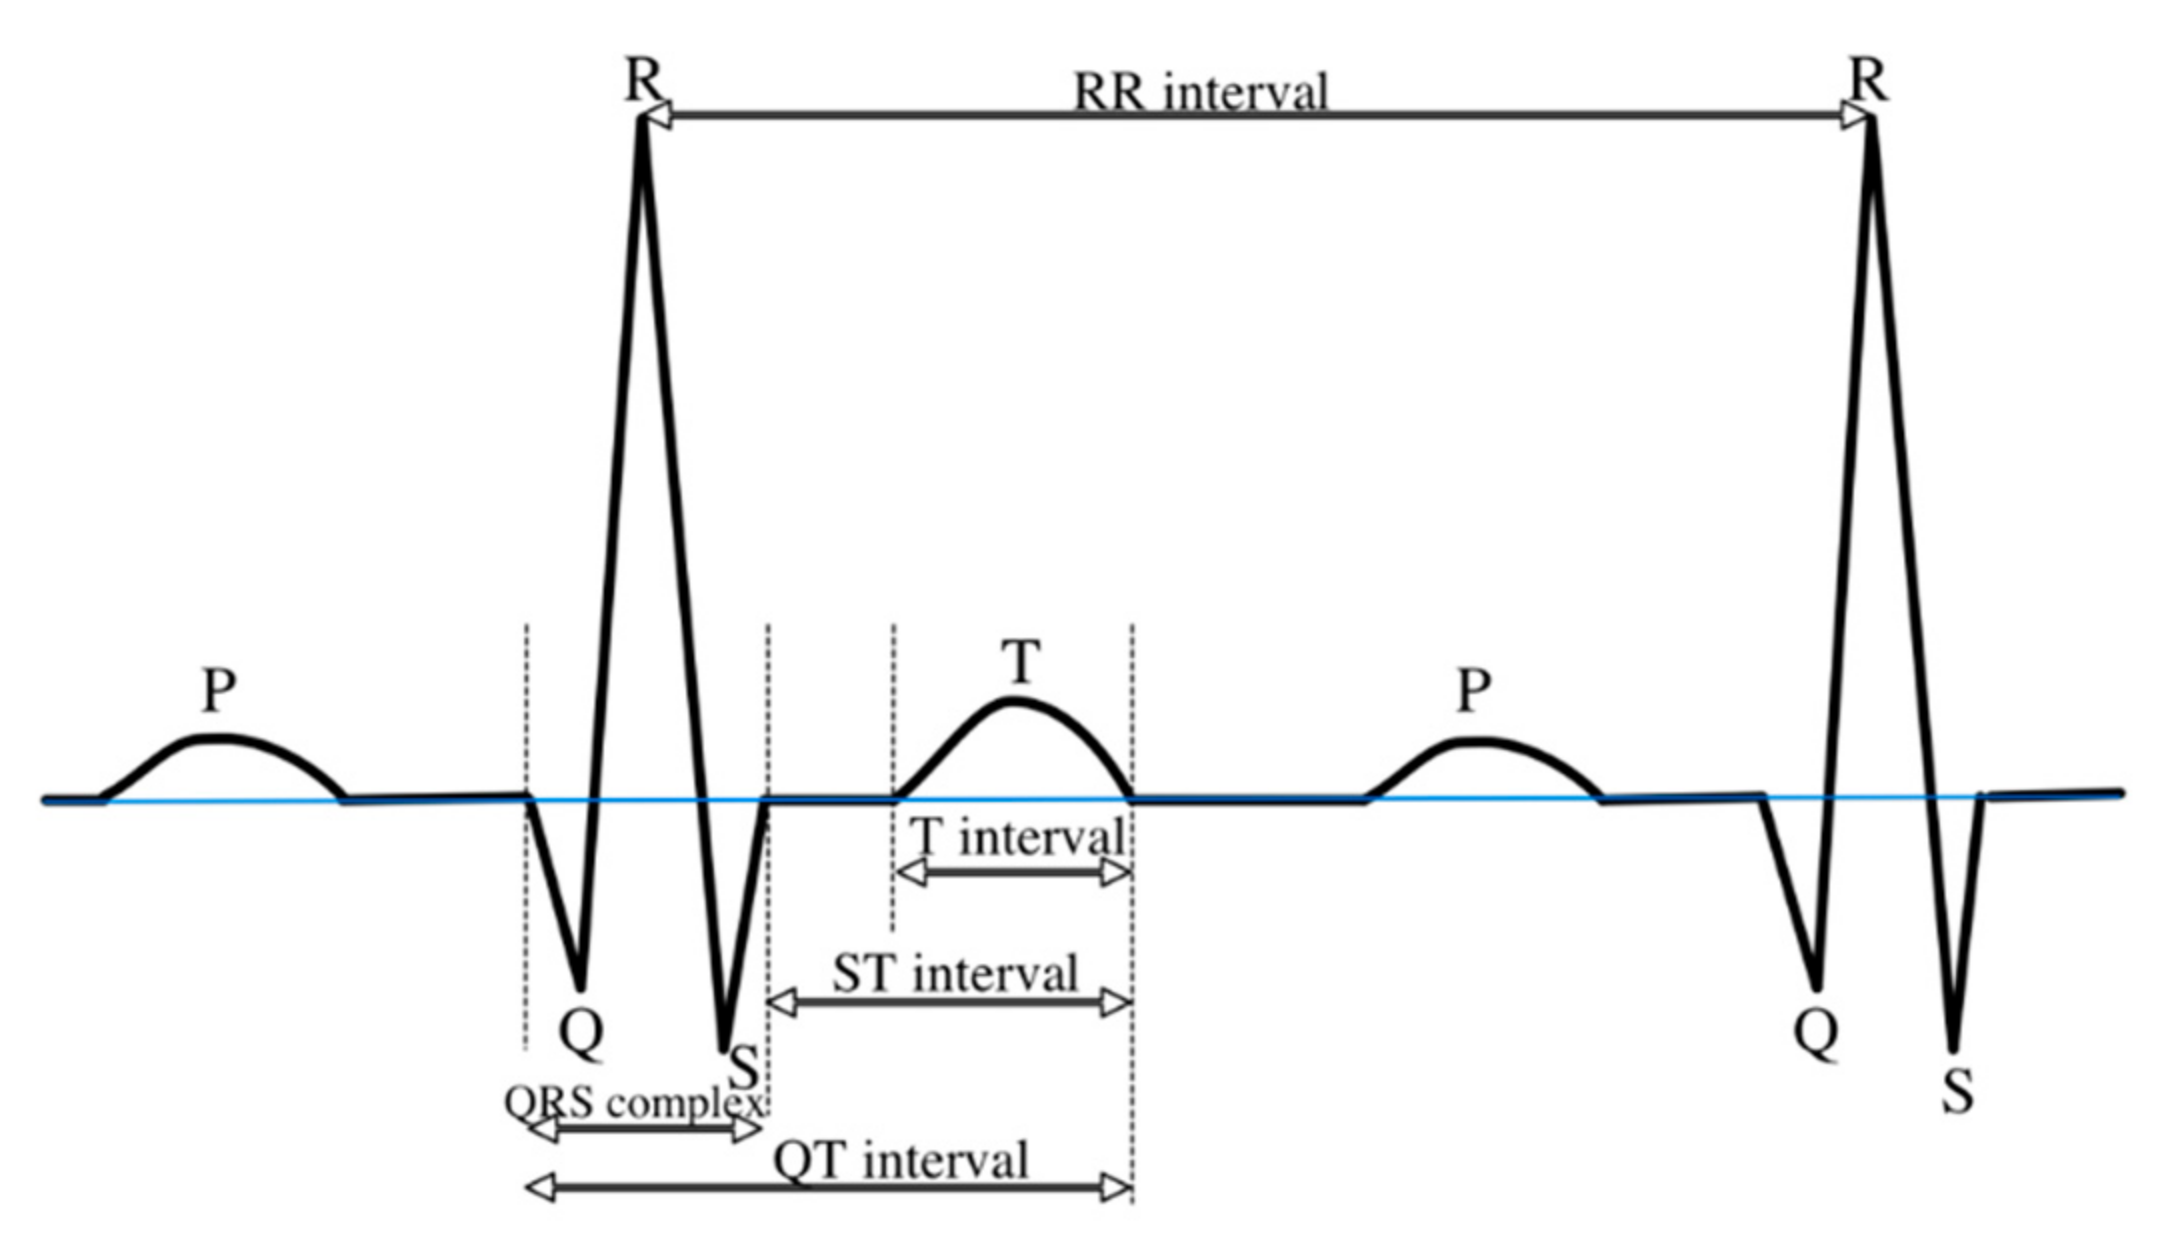
In this study, various ECG signal features were analyzed and classified. The protocol consisted of two 60 sec recordings of each participant. These recordings enabled the detection of differences in ECG signal parameters, which were estimated at the beginning of the day and in the evening. V5 lead was selected in this research (see an example in Figure 2), with each parameter representing a separate component of heart activity (see Table 2).
All ECG signal features are visible in the properly filtered data. Numerous methods can be applied to ECG signal preprocessing, such as moving average (MA), exponential smoothing, or linear Fourier transformation. Usually, biological signals are contaminated with various environmental disturbances. The main purpose of signal filtering algorithms is to divide separate components into informative parts and undesirable noise. Furthermore, biological signals that are recorded during movement are highly contaminated by various disturbances, and sometimes, noise overlaps the signal itself. The main problem associated with movement-contaminated signals is non-stationary, low-frequency noise (a trend resulting from movement artifacts). In such cases, ordinary filtering methods for signal processing are insufficient or unreliable. In this research, ECG signals were recorded while each participant was standing so that only small movement artifacts might affect the signal. Therefore, a Butterworth filter was used for noise reduction [40].
ECG signal preprocessing continues with feature extraction (ECG parameter estimation). ECG feature extraction starts with R peak detection and QRS complex identification. All other parameters, such as Q and S peaks, RR interval, and T wave, are based on R peaks or QRS complex positions. In this research, 9 ECG parameters were estimated: Q, R, S, and T amplitudes; QT, ST, RR, and QRS intervals; and T-wave intervals. All ECG features were estimated using the NeuroKit2 toolbox in Python programming language [42].
3.2. Research Design and Data Acquisition
In this research, a CardioScout Multi-device was used to record ECG signals and transmit them to mobile devices or tablets. The signal recording frequency was 500 Hz, and each segment was 60 s long. In this article, the analyzed experiments comprise data recorded twice a day (in the morning and in the evening) for signal parameter classification and fatigue recognition. In Table 3, two different states are defined: A1 in the morning and A2 in the evening.
In total, 60 healthy adults were recruited (aged between 24 and 34 years) without a diagnosis of health pathologies or overwork-related problems. In this research, 8271 measurements were estimated from 60 participants via ECG signal recordings: 4195 corresponding to state A1 and 4076 corresponding to state A2.
3.3. Data Description and Visualization
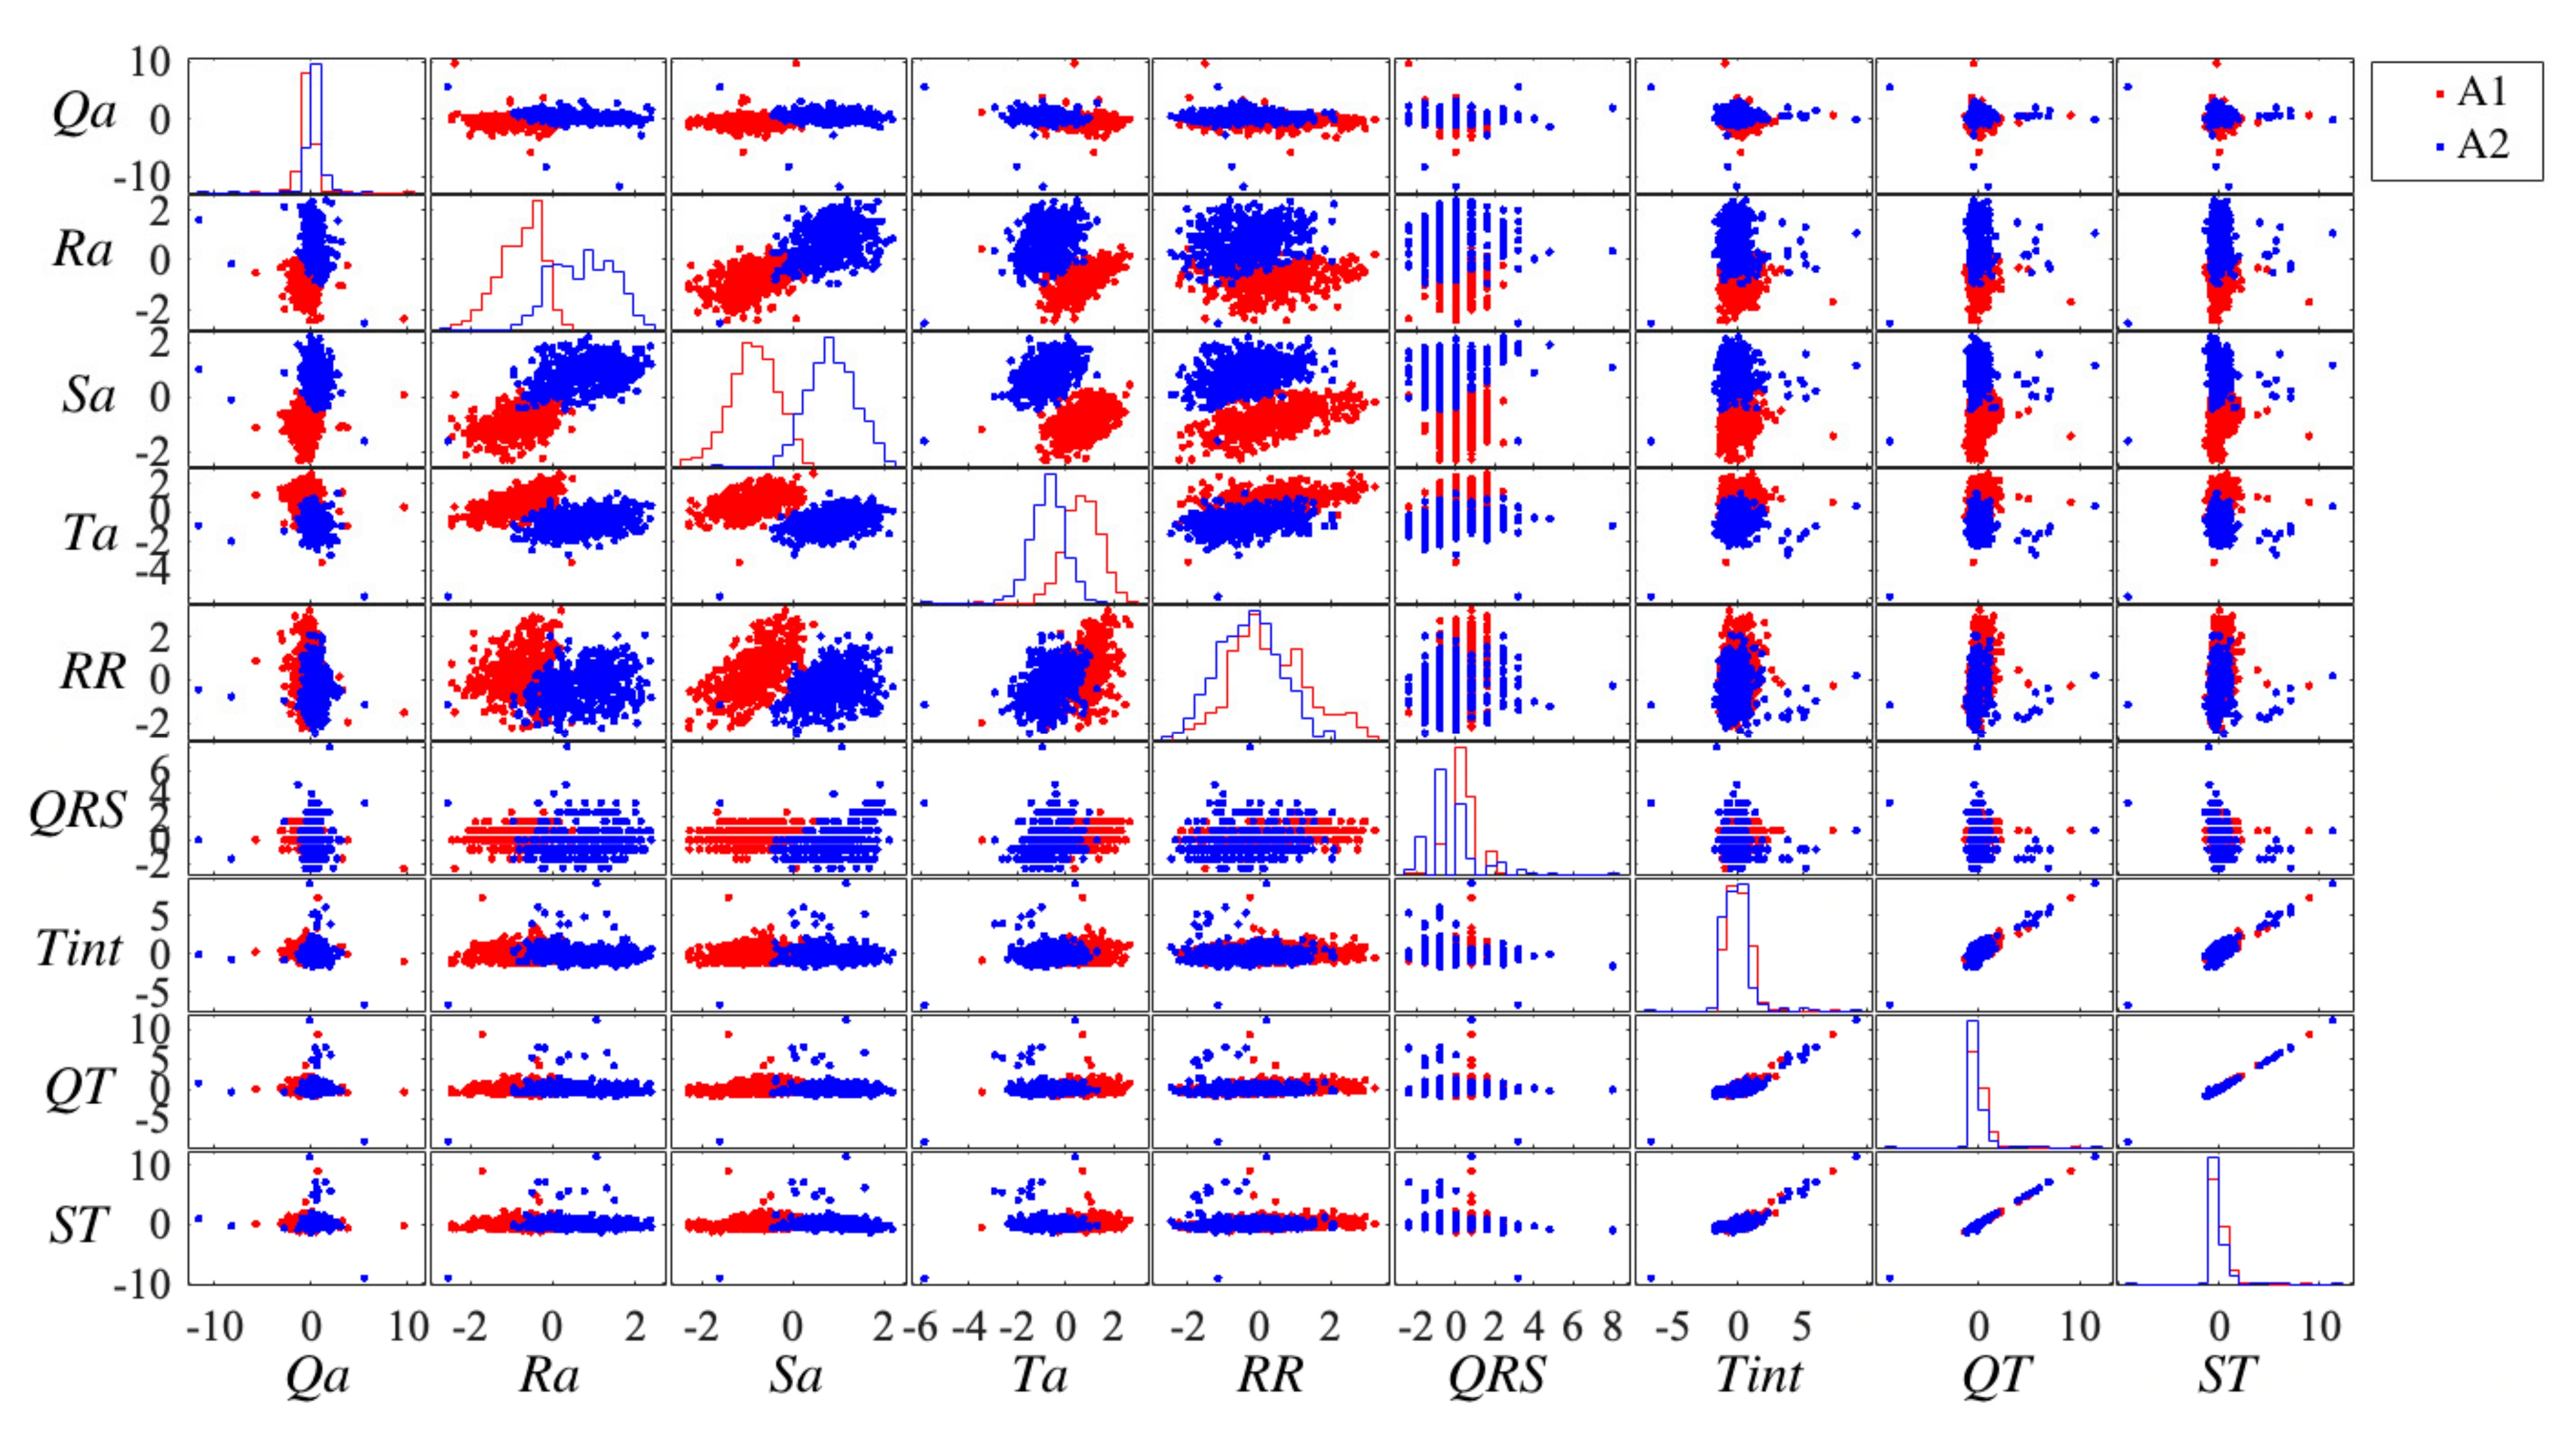
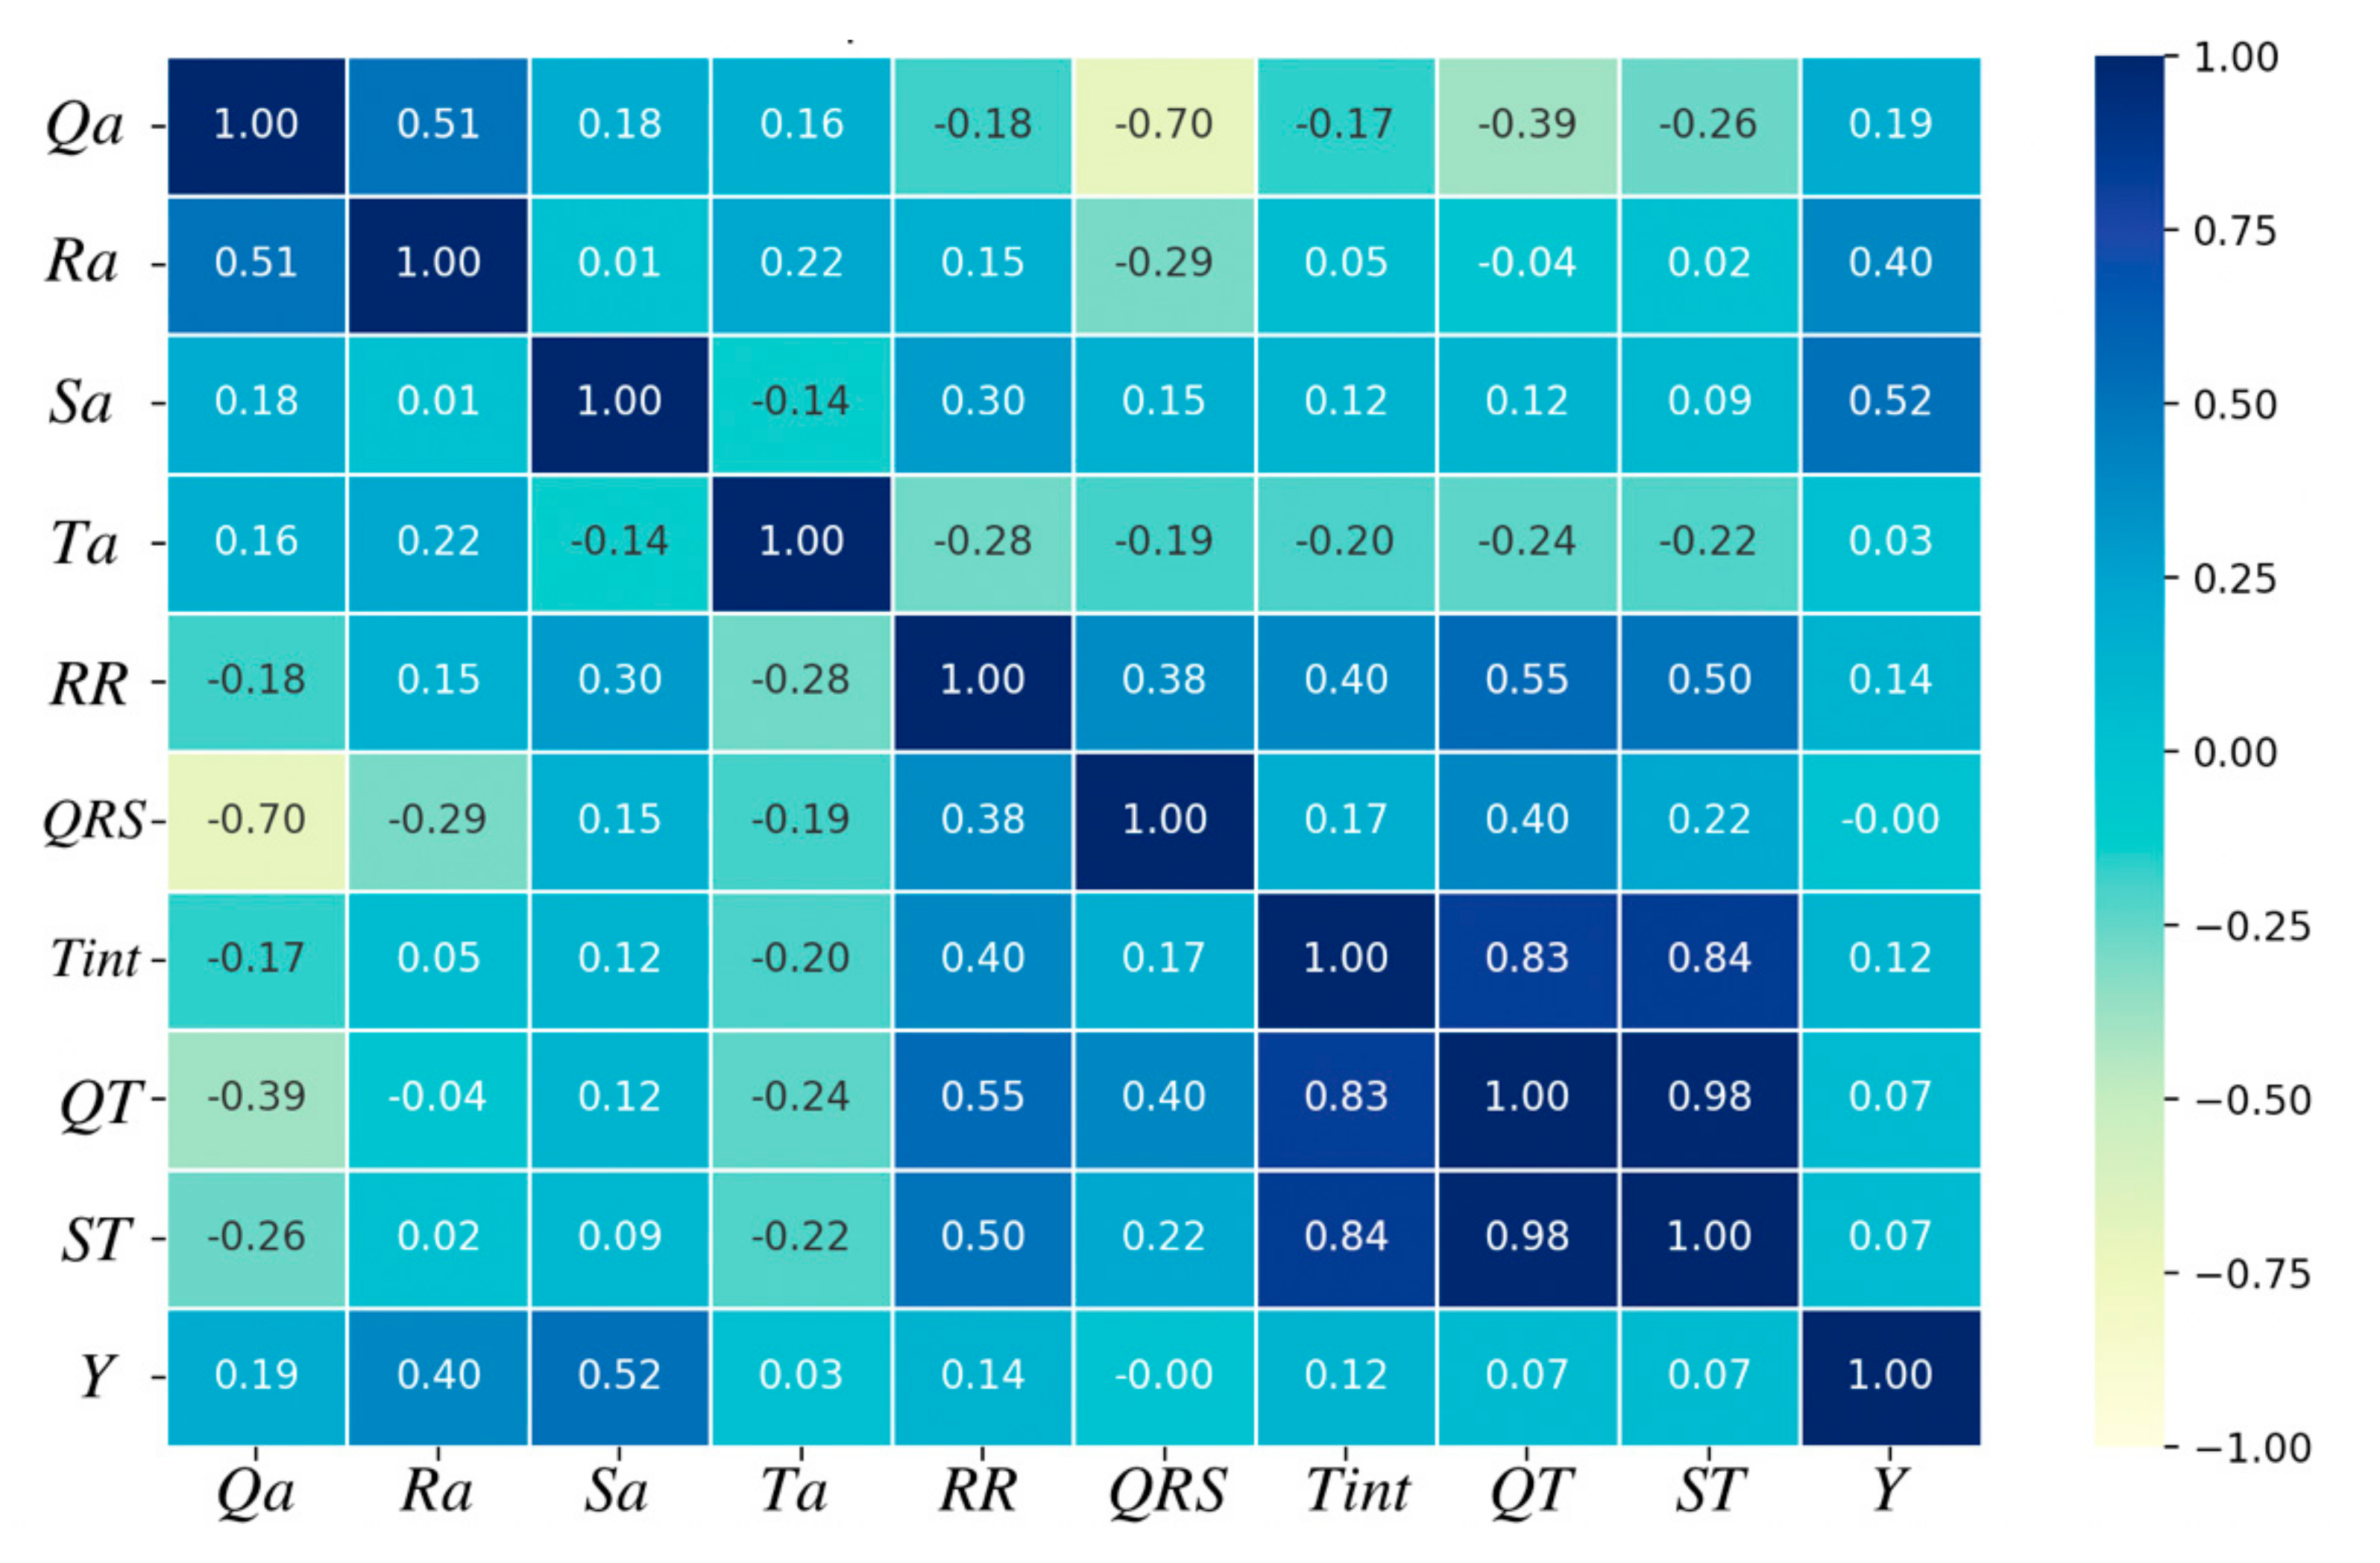
As mentioned in the previous section, two states were analyzed in this study (A1 in the morning and A2 in the evening). All parameter data were normalized by subtracting means and dividing by the standard deviation. This type of data normalization is needed to eliminate differences in individual heart rate characteristics of each person. For example, some participants may have higher (or lower) ECG signal amplitude values compared to others in both states (in the morning and in the evening), which may affect classification results, indicating fatigued state in both datasets. Furthermore, normalization increases data integrity without distorting differences in the ranges of values. The distribution and scatter plots are shown in Figure 3. Pearson correlation coefficients are presented in Figure 4 (Y represents the state: a value of 1 corresponds to the fatigued condition or state (A2), and a value of 0 corresponds to the fatigue-free condition of state (A1)). Comparing data from different states, clear differences could be noticed. For example, histograms of the Sa parameter look similar, but A2 data are shifted, with higher values compared to state A1 values (see Figure 3). Furthermore, some ECG signal parameter values overlap. For example, there is no significant difference between states A1 and A2 in terms of RR interval values. Therefore, typical HRV analysis fails in mental fatigue detection, with low classification accuracies.
Figure 3 shows linear dependences between several parameters (for example, between parameters QT and ST). Similar results are shown in Figure 4 (for example, the Pearson correlation coefficient for ST and QT reaches 0.98). Additionally, a strong dependence (Pearson correlation coefficient > 0.8) is evident between Tint and QT or ST. Although some parameters may be eliminated in the classification step, it is not clear which parameters have a greater impact on classification accuracy. In the initial stage of the classification process, all ECG signal features were included (all 9 ECG parameters).
3.4. Principal Component Analysis
Principal component analysis (PCA) was applied to distinguish between ECG features in the morning and in the evening. The general idea behind this technique is to obtain new latent variables based on the original data. The newly defined principal components reflect directions of maximal variance of the projected data and form a new orthonormal basis of the original vector space.
PCA is commonly used to reduce the dimensions of the collected data matrix by choosing k principal components (PC1, PC2, …, PCk) and evaluating the amount of information explained by the chosen components as follows:
where is the i-th eigenvalue of the covariance matrix (C), and Tr(C) is its trace, i.e., the sum of all entries on the main diagonal. Furthermore, the original data are projected to the low-dimension hyperplane spanned by components PC1, PC2, …, PCk, thus extracting the essential information from the initial data cloud. In this study, three principal components were considered, and the obtained results were visualized via 3D plots to emphasize the desired differences in mental states.
3.5. Machine Learning Technique
The use of social media, smartphones, smartwatches, computers, and even portable devices provides big data about various mental and physical health disorders. Effective algorithms for big data processing are usually based on machine learning (ML) techniques.
Various ML algorithms have been created for data classification and prognosis. There are three main categories: Supervised learning: examples of such methods include support vector machine (SVM), k-nearest neighbors (KNN), decision tree (DT), and random forest (RF); Unsupervised learning: these methods include neural networks (NN) and clustering; Semi-supervised learning: this category includes methods such as semi-supervised SVM, mixed models, etc. [43].
Supervised learning is used to analyze the labeled data and make predictions or classify data into different categories, whereas unsupervised learning methods can learn from unlabeled data and extract similar patterns. The third group is semi-supervised learning, which involves the analysis of data with and without labels; such methods are used when there is not enough labeled data for classification or prognosis.
One way to evaluate the potential accuracy of predictions is to use a confusion matrix [44]. The entries in this matrix indicate the correctness of the prediction or classification of distinct fault categories compared to actual observed values. To evaluate the quality of the selected predictions or data classifications, additional measurements can be considered. Two widely used standard statistics are accuracy (acc) and F1 score. These are estimated using Equation (2).
where TN corresponds to true-negative elements after prediction (correctly predicted as not correct), TP represents true-positive elements (correctly predicted as correct), FP represents false-positive elements, and FN represents false-negative elements. Although popular in ML analysis, both acc and F1 ignore the size of each category in the confusion matrix. Therefore, the additional statistic called Matthew’s correlation coefficient (MCC) was measured [45]. This coefficient is calculated as follows:
The value of this coefficient is in the range [−1; 1], where −1 is interpreted as the worst-case scenario, whereas 1 is the best possible value.
Additionally, in 1960 J. Cohen revealed that there is a level of algorithm precision when the algorithm is no longer capable of predicting correctly, i.e., the prediction becomes as accurate as a simple guess. This level is called Cohen’s Kappa () statistic and can be expressed as follows:
Three main intervals are considered: if , then the value is viewed as perfect; if is in the range of [0.4, 0.75] the value is sufficient; and if , it is considered weak [46].
In this research, we compared multiple ML methods, revealing that the RF algorithm classifies signal parameters with the highest accuracy. For RF algorithms in the feature extraction process, the Gini coefficient needs to be estimated. If is defined as the number of samples in node t and each node has c classes, then the number of samples belonging to class is . The ratio () is expressed as:
In this case, the Gini coefficient G for each node is defined as [47]:
Generally, the RF classifier is based on DT and consists of three main steps: input all data into root nodes for every DT; minimize the Gini coefficient by dividing data into separate nodes; recursively repeat all steps at each node that needs to be split until the root mean square error (RMSE) value for the node falls below a threshold value or the tree reaches a defined depth.
RF may consist of many separate decision trees that train each model concurrently using random data samples. This type of RF is also called a bagged tree algorithm. Consistent DT models that are trained consecutively are called boosted trees. In this case, every DT model learns from previous model errors. Usually, this type of RF has more nodes [48]. Like any other classifier, the random forest algorithm requires two datasets: one for training and one for testing. In ML techniques, the more data provided, the higher the classification accuracy. Additionally, in every ML technique, overfitting of training data should be considered, which may negatively affect algorithm performance, thereby reducing prediction accuracy. Cross validation can be applied to avoid overfitting. This method involves splitting data into different groups and estimating the classification accuracy for each group. In this case, the training dataset is divided into two groups: a training set and a validation set. If cross validation is performed several times, in each iteration, different data samples are assigned to the testing data subset [49].
4. Experimental Results
4.1. PCA Implementation
In this research, PCA was applied in two ways. First, all collected data were considered at once. Then, the data were factored into morning and evening subsets, and PCA was performed on each subset separately.
Considering all collected data, the main parameters of Tint, QT, and ST, which reflect the first principal component, have an interval, whereas the second principal component mainly covers amplitude parameters, i.e., Qa and Ra. These results are consequential, as during casual daytime activity, the amplitude of the heart rate changes less than the intervals between two waves. A summary of the PCA results for the whole dataset is presented in Table 4. A 3D plot of the obtained results was drawn using RStudio tools (see Figure 5). A significant difference was observed between the two groups: yellow dots represent the morning state, and e blue pyramids represent the evening state. The change in parameters is more noticeable in the evening subset. Moreover, the evening data can be further grouped into several clusters, whereas the morning data are mainly concentrated in the center.
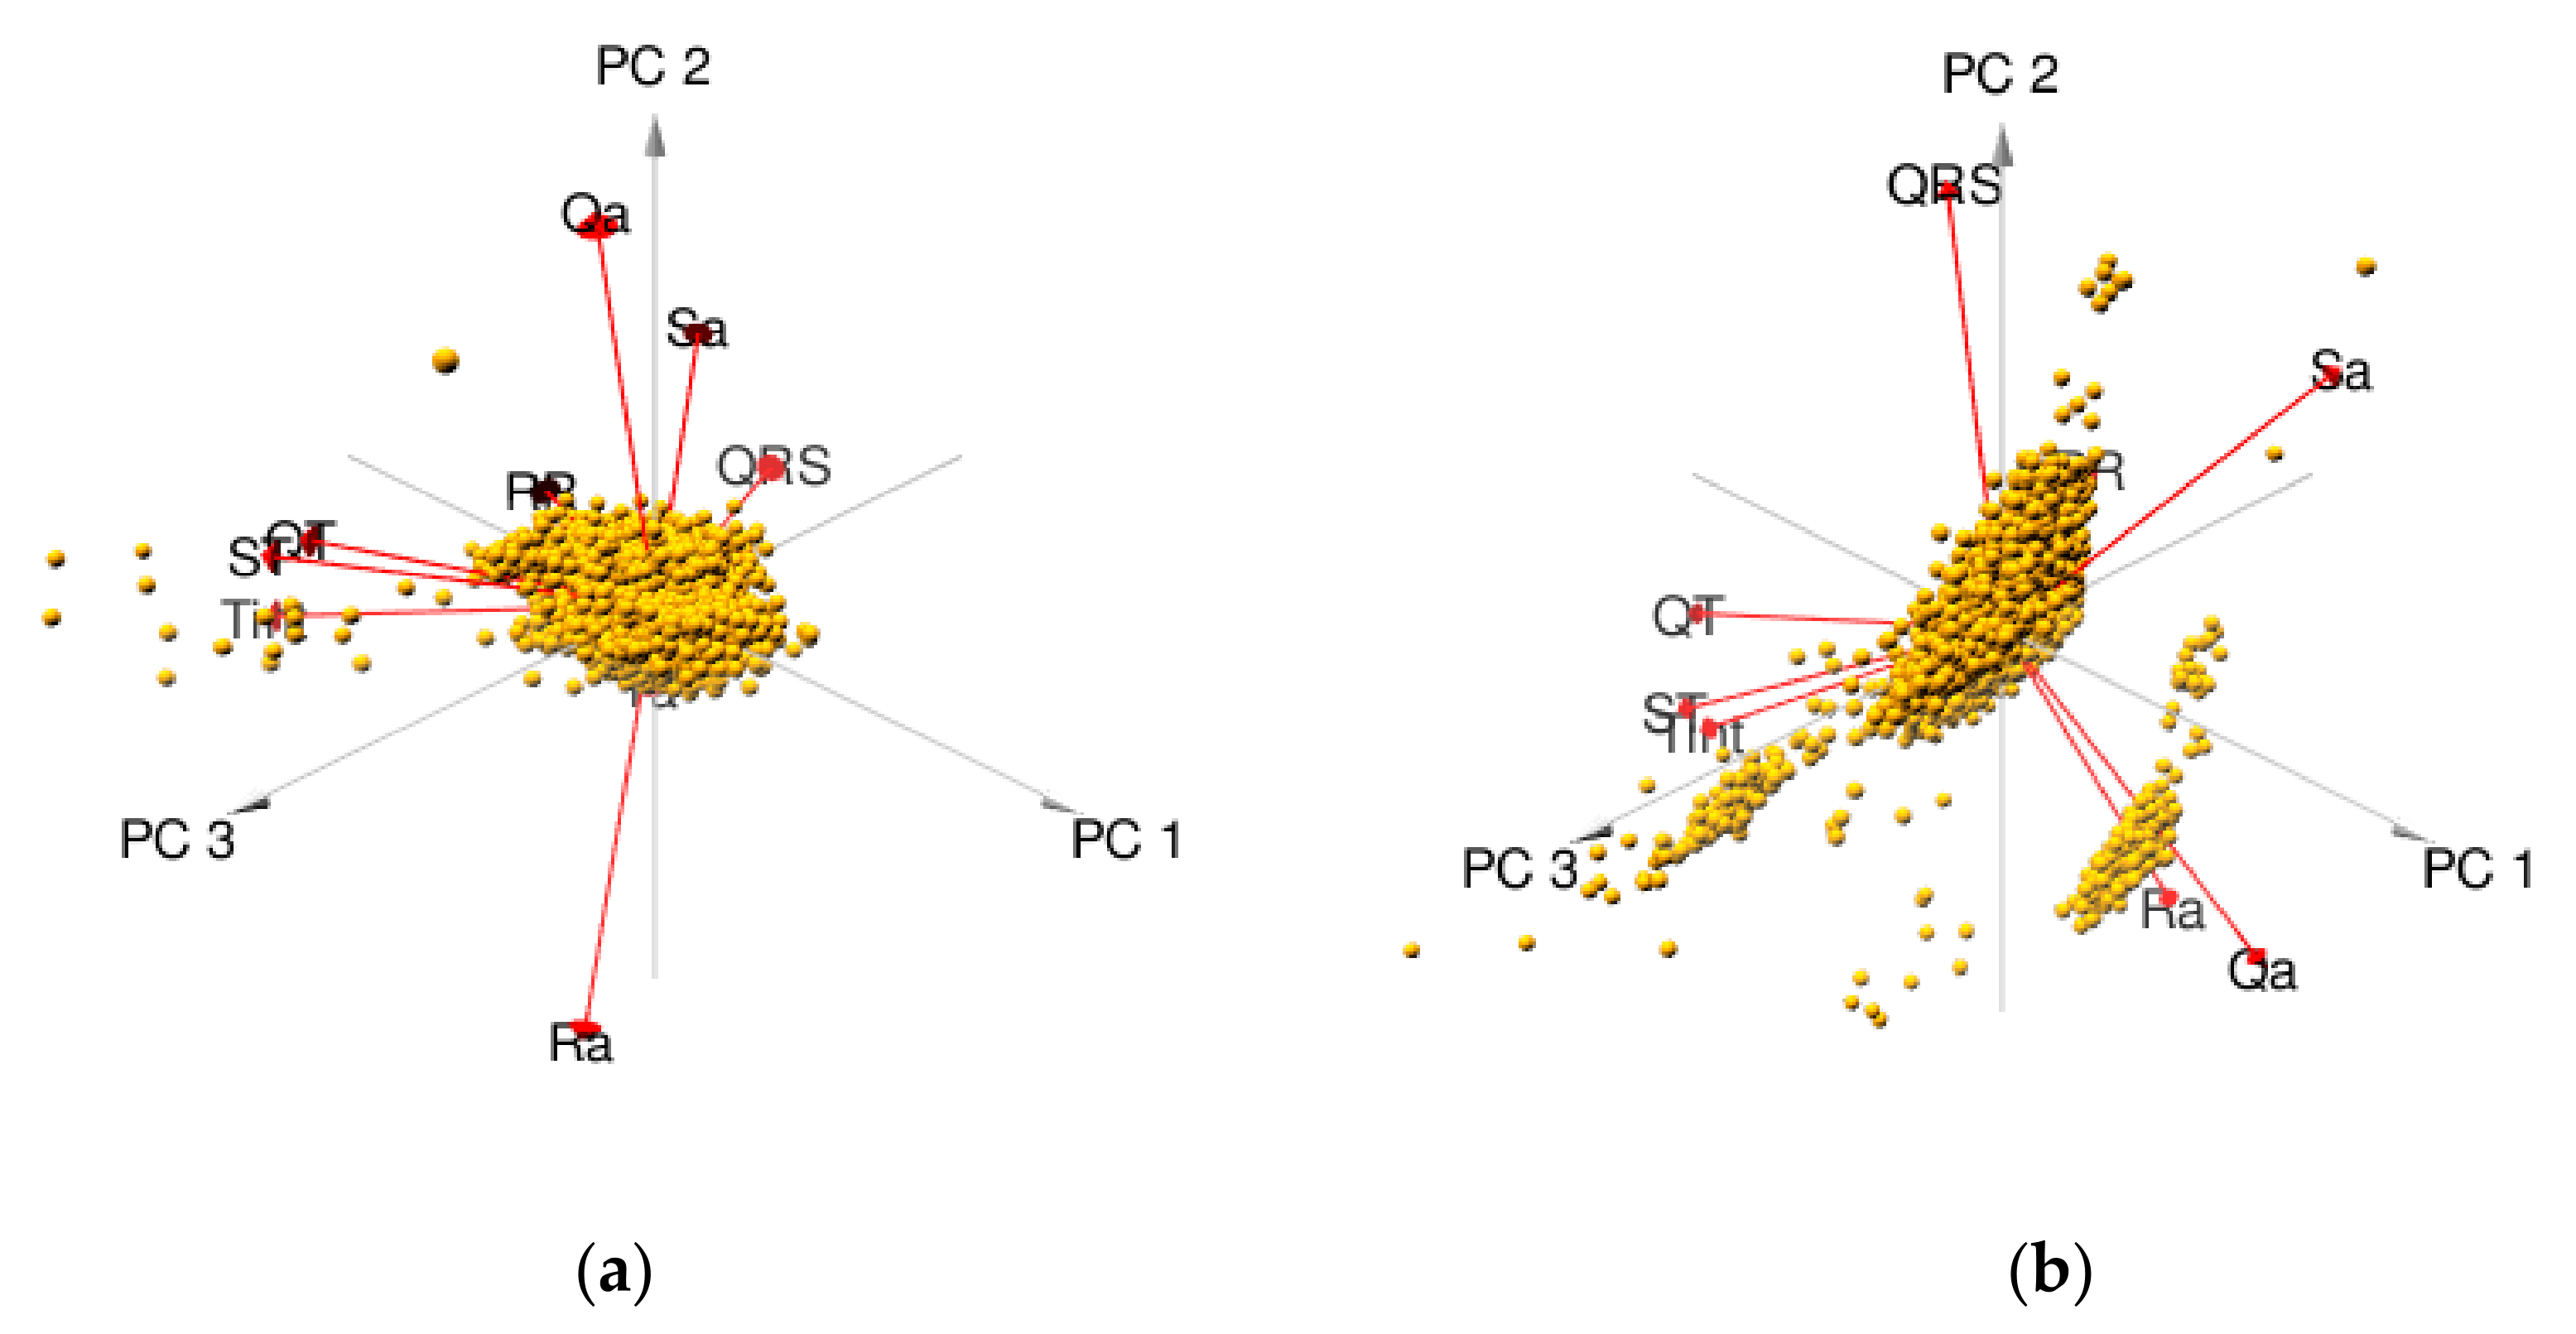
To explore the visible difference between the two investigated states, the data were split into two separate subsets. The obtained PCA results for each of the individual states show that the interval parameters are considerably represented in the first component. This influence remains consistent, regardless of the considered state. On the other hand, the influence of the amplitude parameters changed significantly. This difference is even more obvious in the second principal component, where these parameters outshine most other parameters in the case of the morning data subset. The explicit expressions of the first three principal components are presented for each of the states, along with the percentage of data explained by these components in parentheses (see Table 5).
Based on the PCA results for the two considered states, we assume that the fatigue factor is represented by the significant changes in the influence of the amplitude parameters on the first and second principal components. Moreover, substantial changes occurred in the distribution of points in 3D plots obtained for the first three principal components for each of the states (see Figure 6).
4.2. Machine Learning Performance
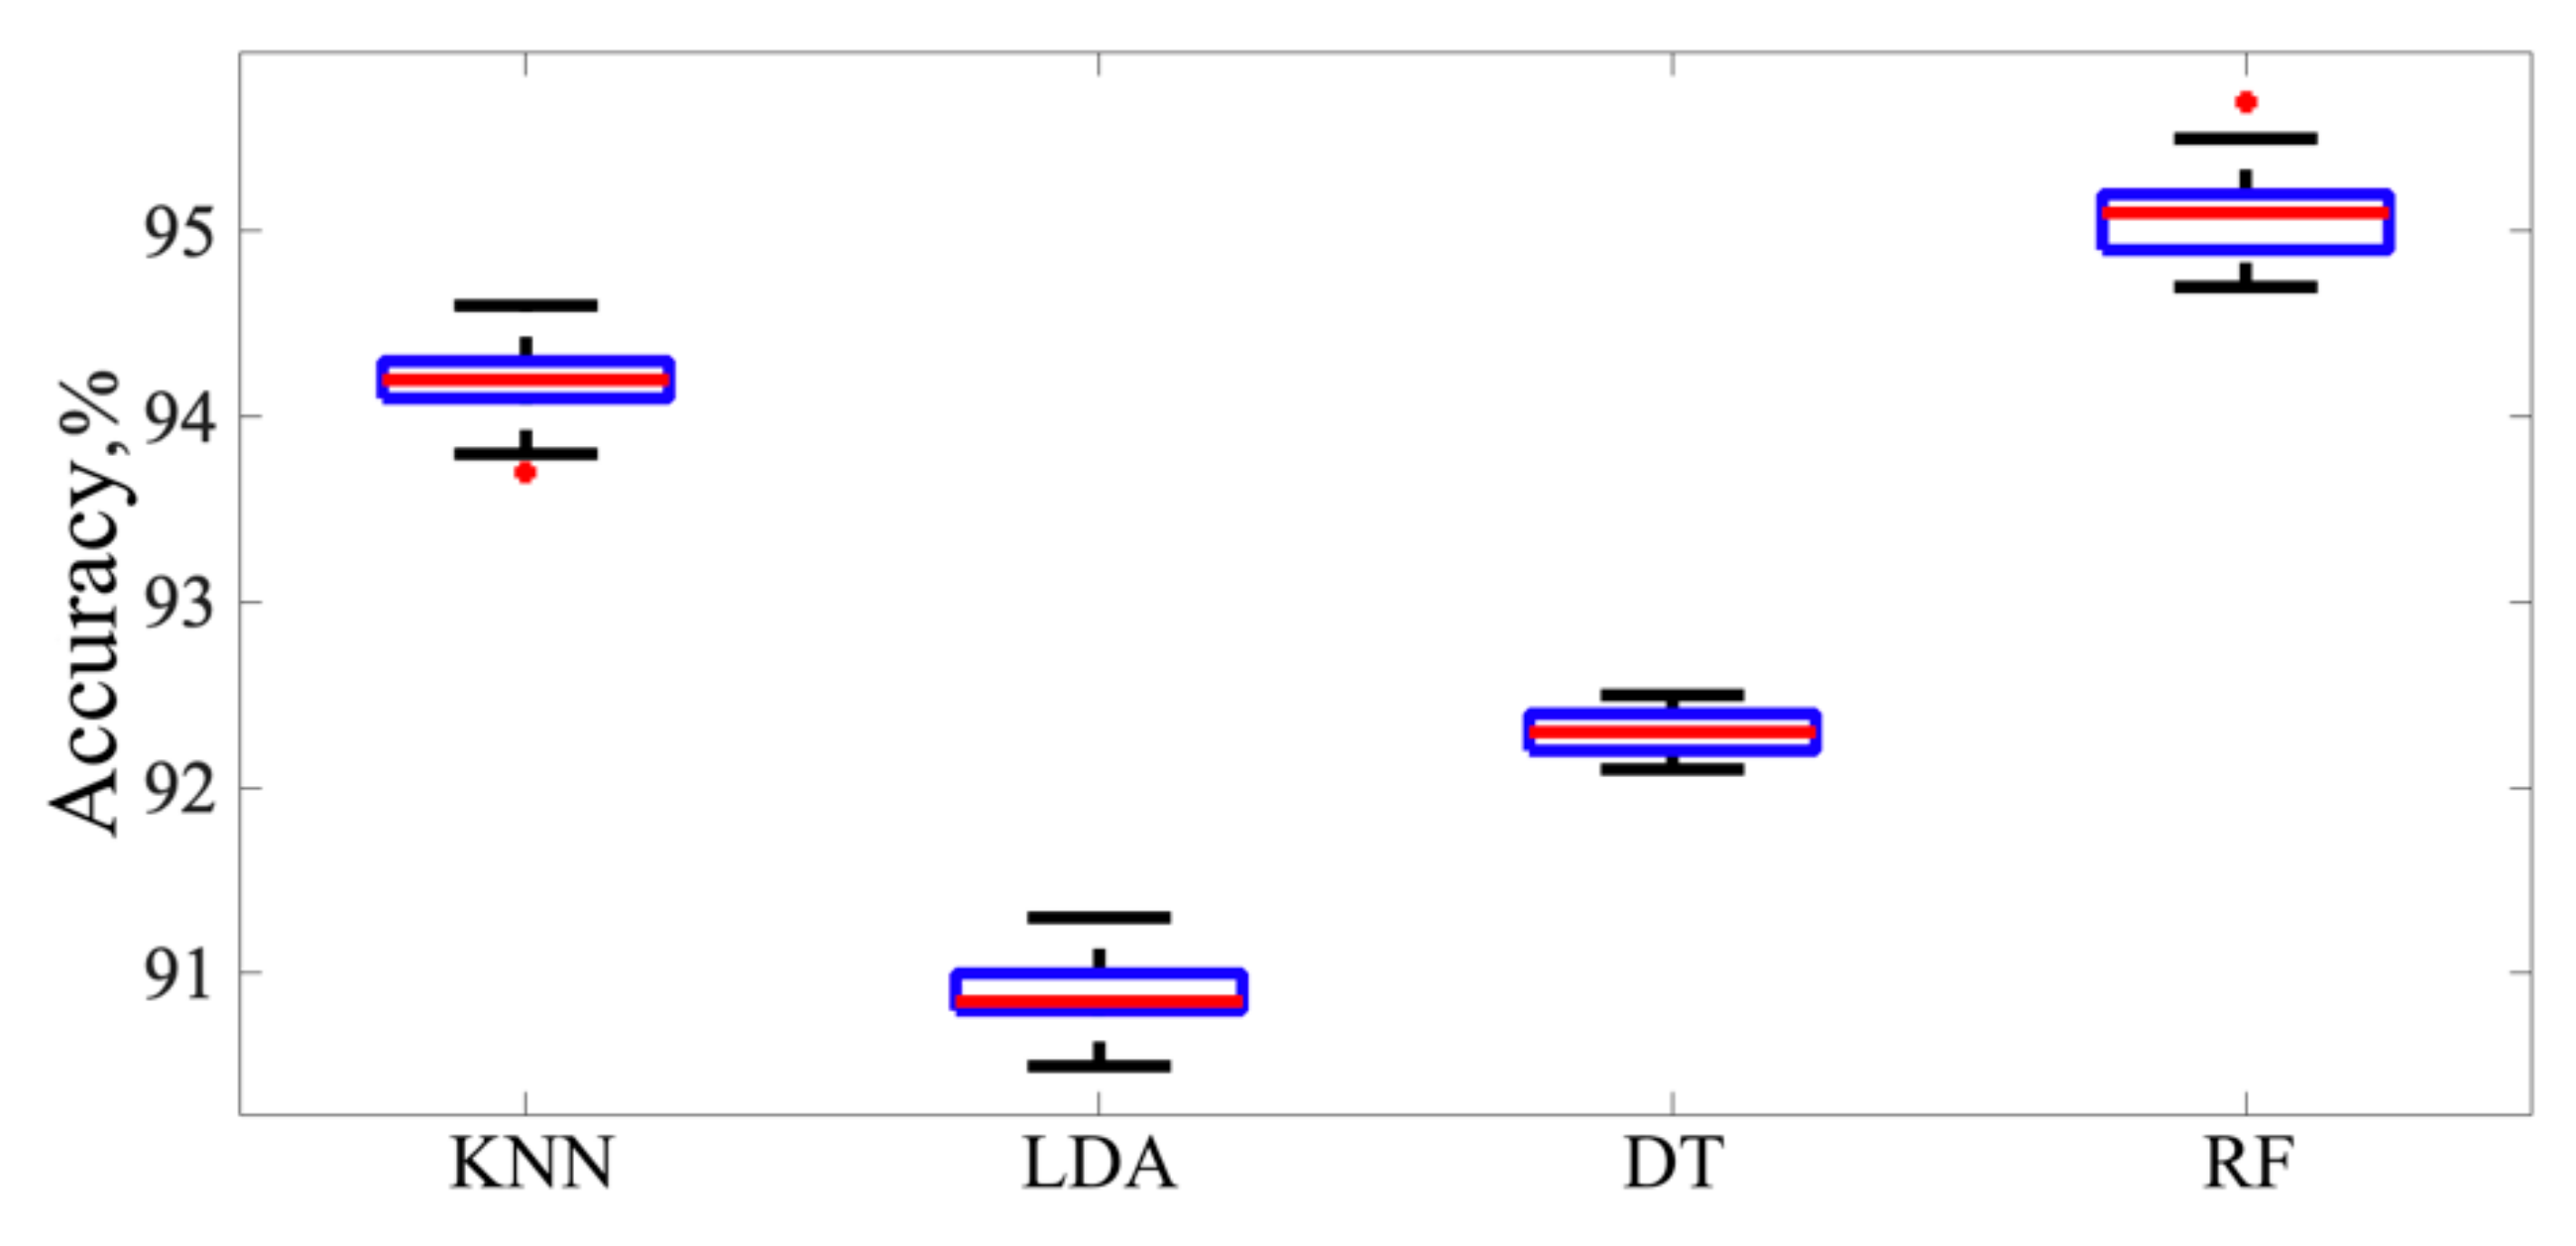
At the beginning of this research, multiple ML algorithms were compared (see Table 6 and Figure 7) using all 9 ECG parameters. In this case, the input dataset was split into training with validation (70%) and testing (30%) subsets. Analysis of data shows that a lower allocation of data to the testing subset slightly reduces the overall accuracy of the KNN, DT, and RF algorithms. For example, reducing the testing dataset to 20% of the total data for the RF model resulted in a reduction in accuracy of 2%. This may also result in lower quality and feasibility of selected classifiers. To ensure that the model did not overfit the training data, 10-fold cross validation was applied for all ML methods. In Figure 7 shows the validation accuracy results following 100 calculations. Table 6 shows averaged, F1, and MCC values for a better comparison of the analyzed ML algorithms.
According to the results presented in Table 6 and Figure 7, the best algorithm for physiological fatigue recognition is the random forest model, which classified states A1 and A2 with a validation accuracy of more than 95%. Multiple hyperparameter values were analyzed for all compared ML techniques. The best results were obtained when DT had 100 maximum splits and 9 maximum surrogates in each node. In this case, the selected RF algorithm consisted of 30 DTs, with a maximum of 20 splits for every tree. Based on these results (see Table 6), a random forest algorithm was selected for further analysis.
RF algorithms include multiple DTs, in which every node is a condition of a single feature and is designed to split the dataset into two subsets. Basically, similar response values end up in the same dataset. As previously mentioned, different ECG signal features may have varying impacts on the final classification result. Usually, the importance of a feature is estimated based on the degree to which it decreases the entropy in each tree.
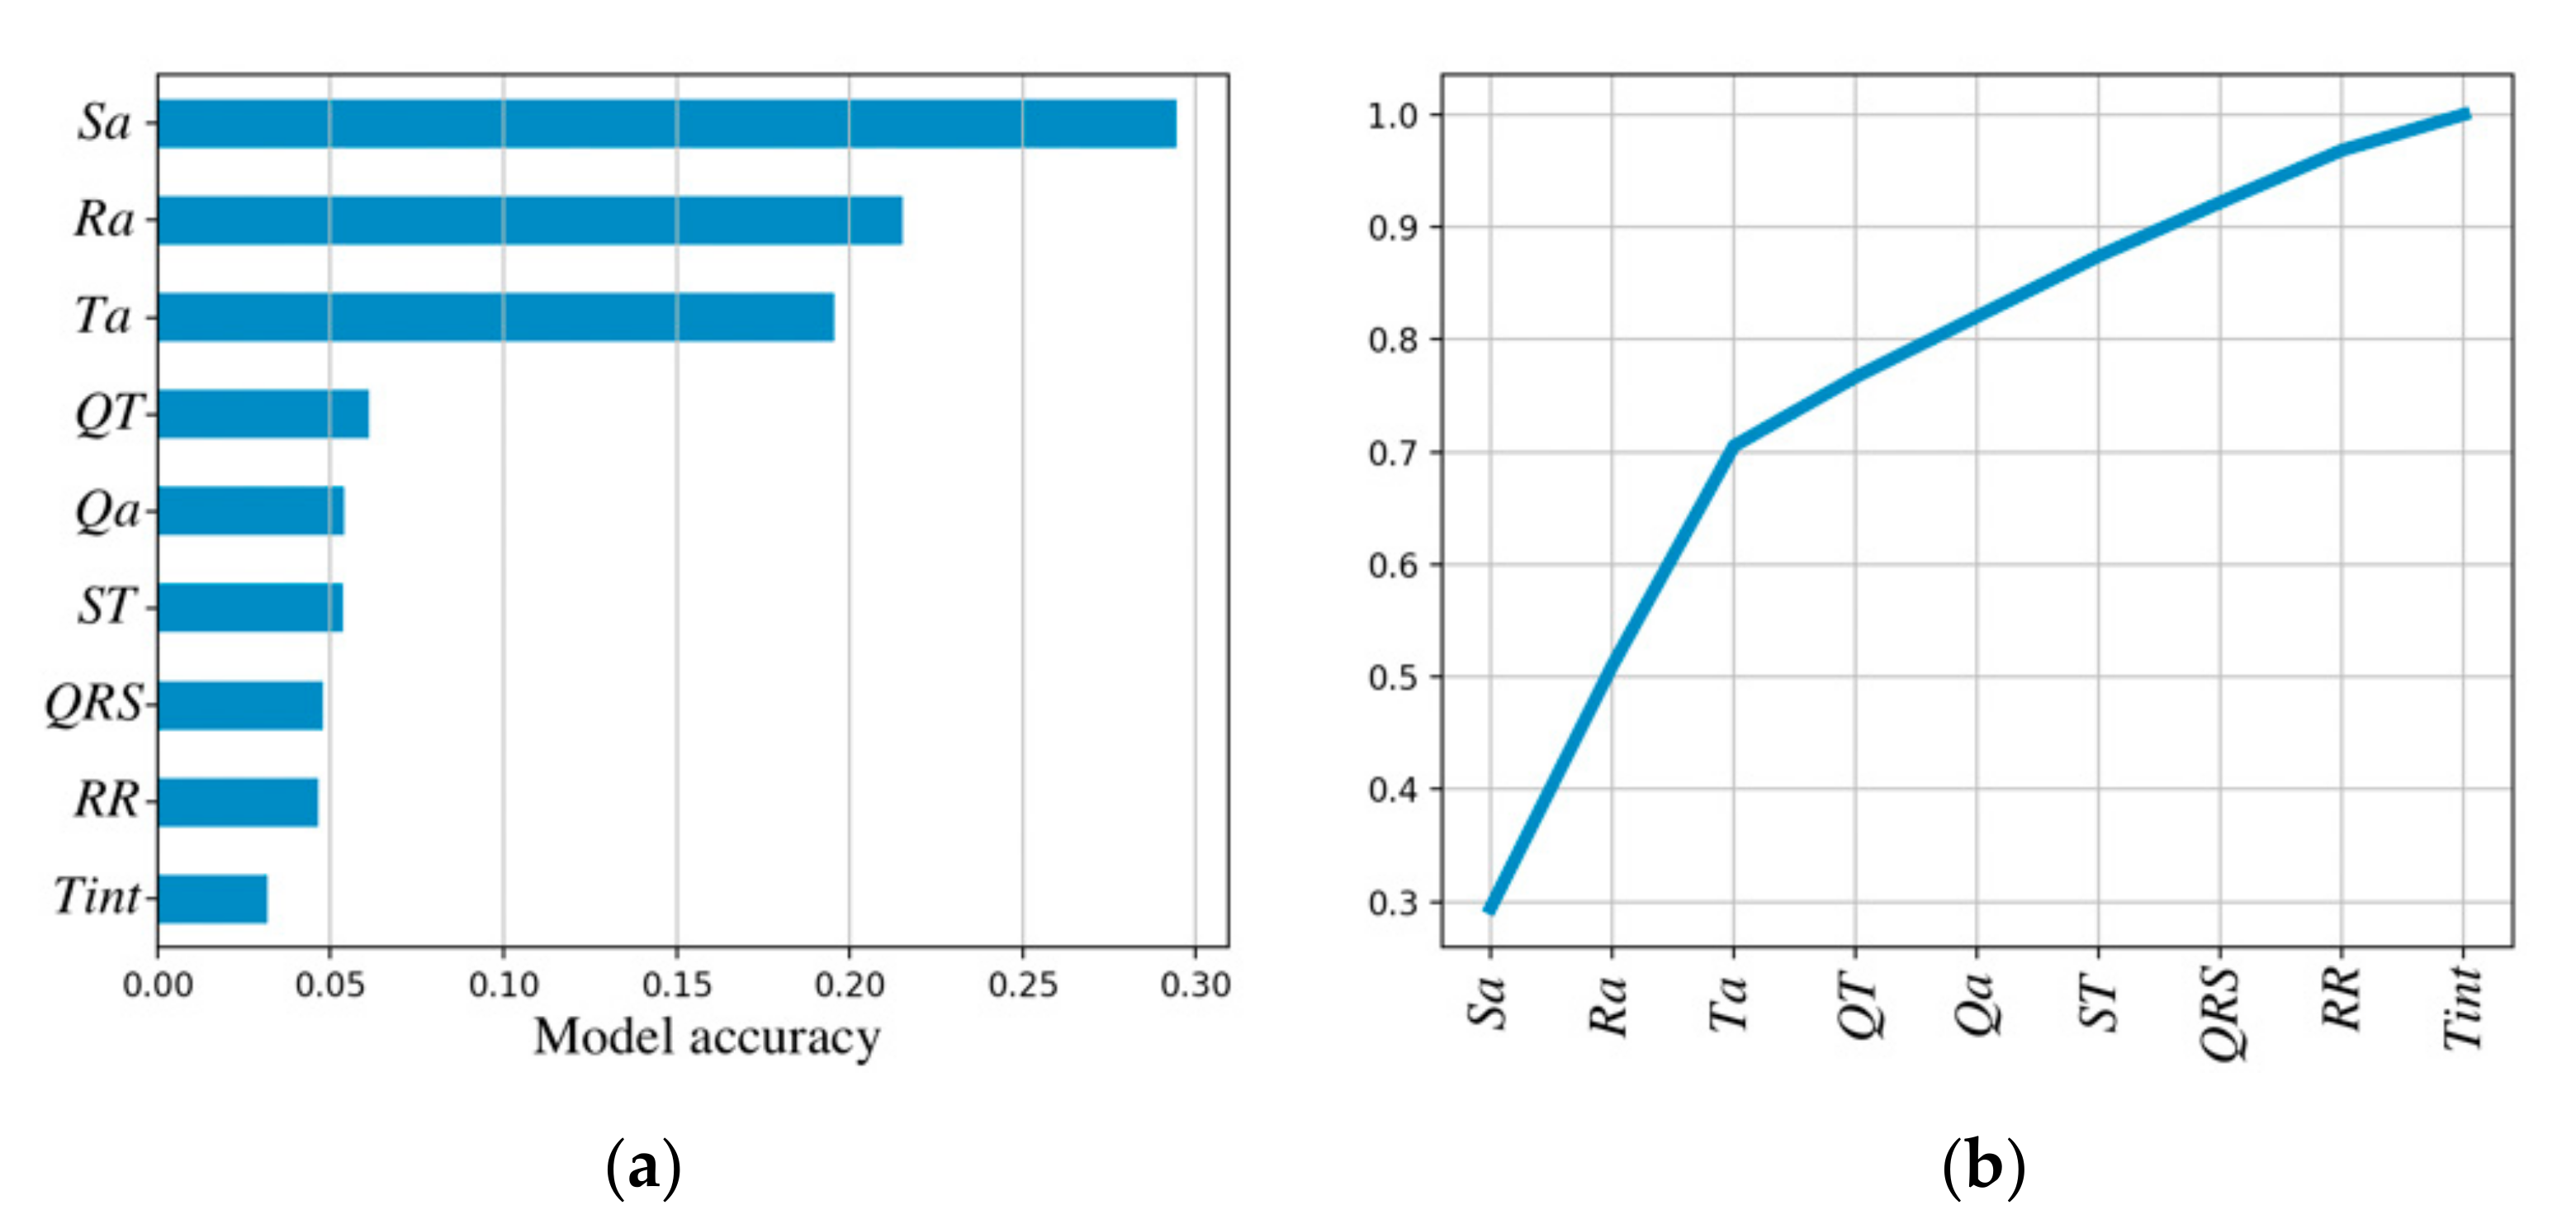
Only four ECG signal characteristics (Sa, Ra, Ta, and QT) are important for A1 and A2 state classification (mental fatigue recognition) if the selected threshold is equal to 0.8 (see Figure 8). Based on these results, the final RF model was designed using only those four ECG parameters.
A random forest is a complex algorithm with multiple hyperparameters, all of which should be optimized. In this research, a random search algorithm was selected based on a grid search technique; this algorithm attempts every possible combination. However, the number of iterations is limited, and possible randomly selected hyperparameter values are declared in advance. Only the best hyperparameter values are saved to maximize the FR validation accuracy. The optimal RF model identified in this research consists of 40 DTs with a maximum tree height of 7 and a minimum of 40 samples in a node for a split.
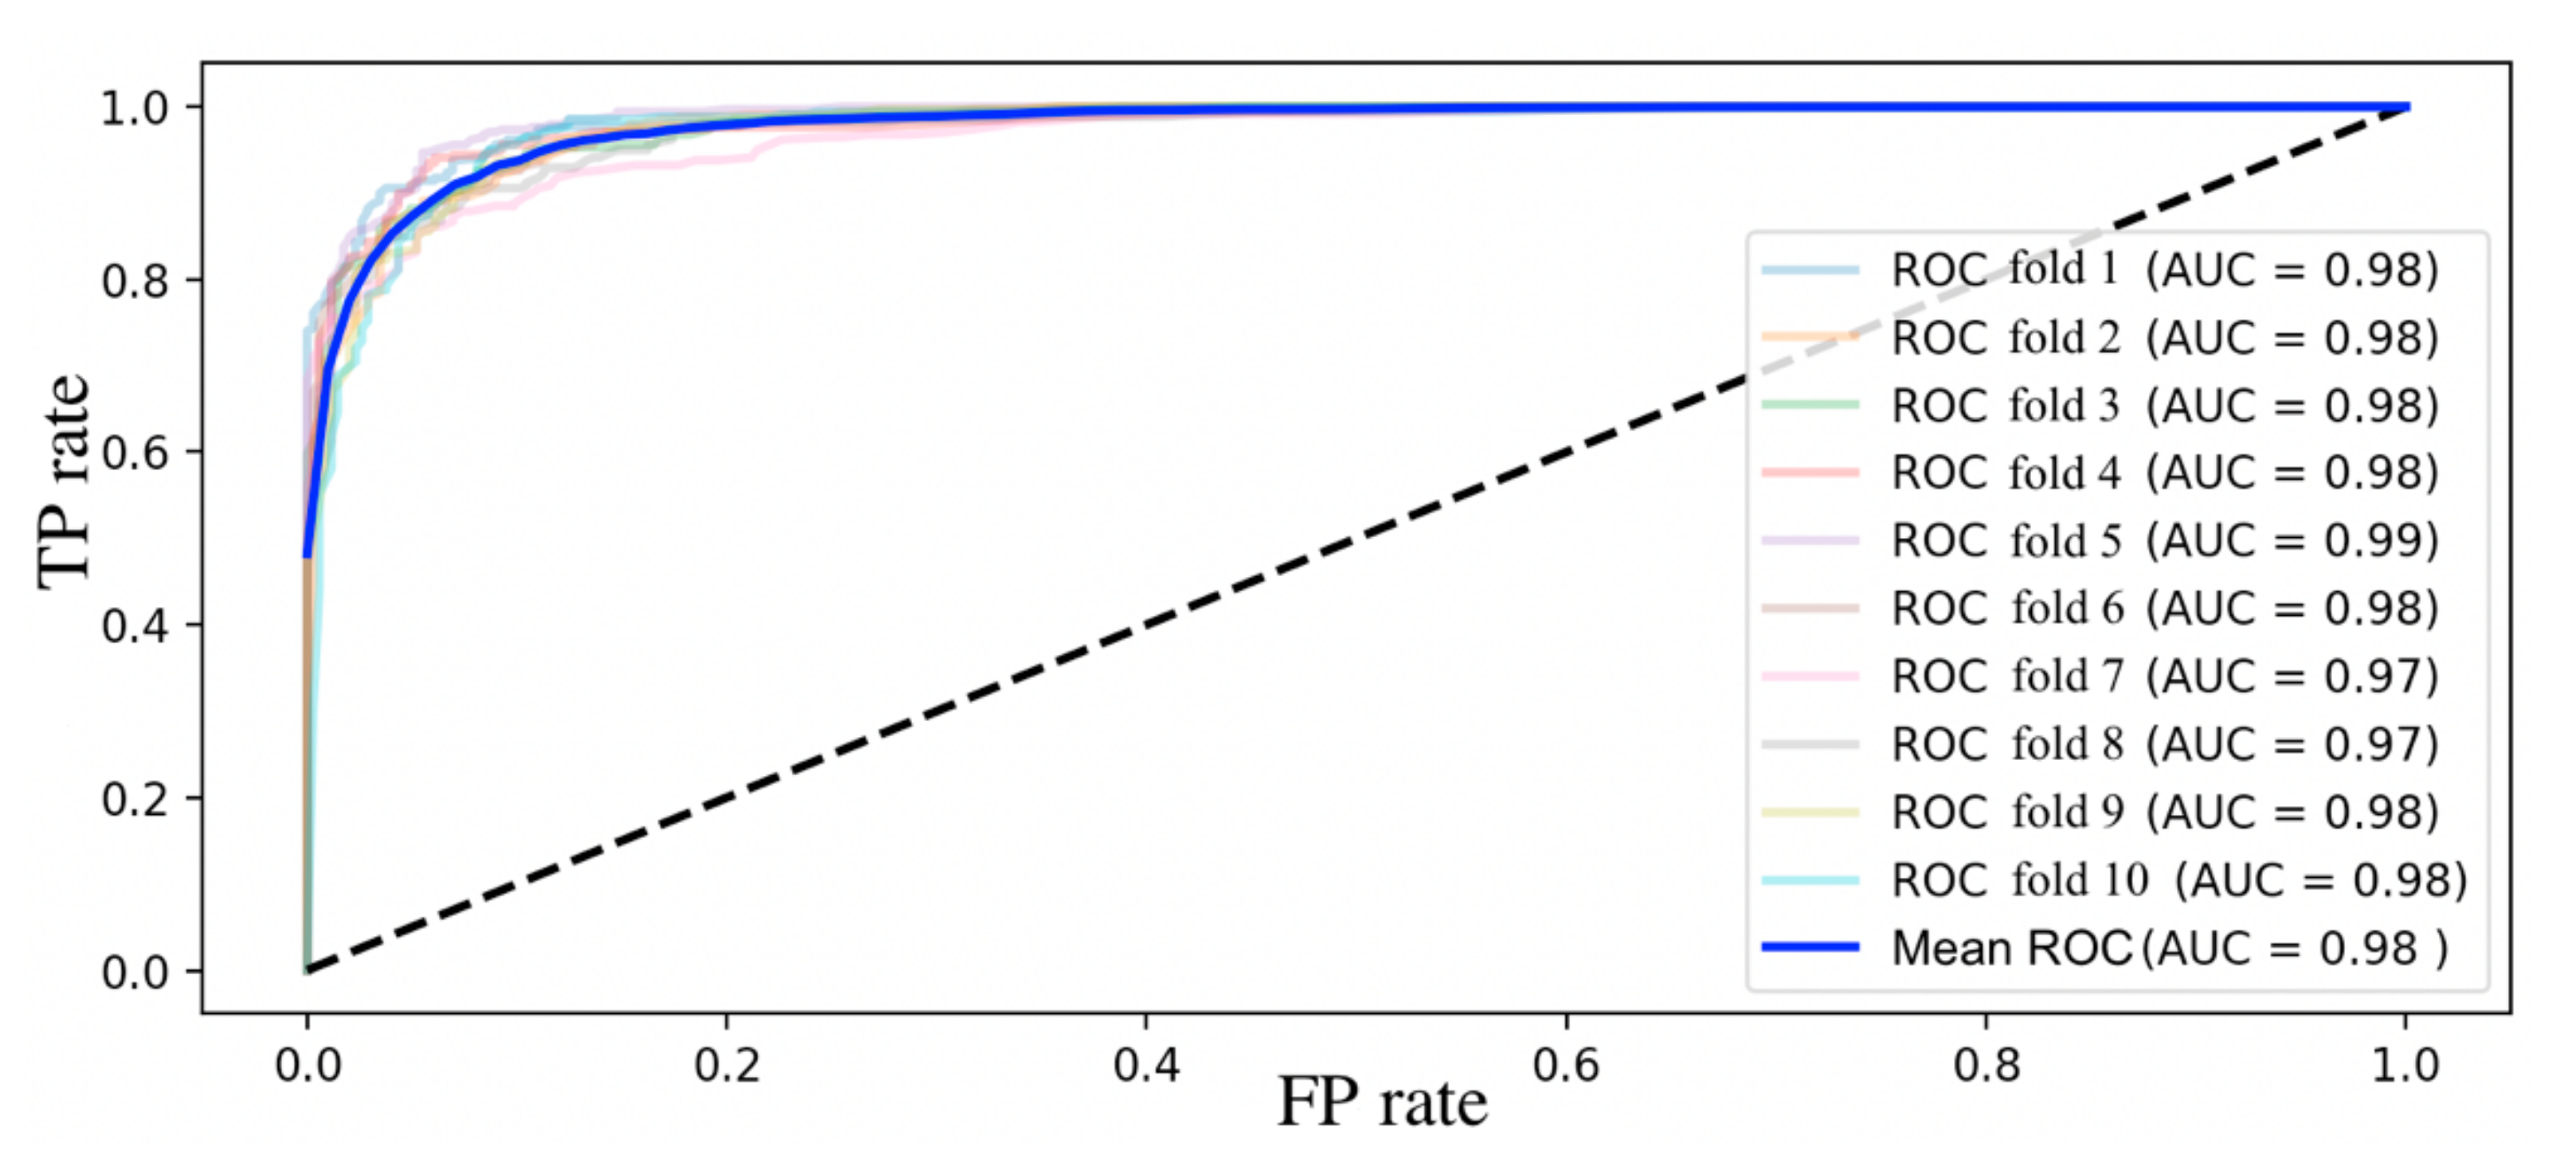
K-times cross validation was used in the RF model training process. The training dataset was split into two subsets: the training set and the testing set. In this case, the same steps were repeated 10 times, and averaged results were estimated. Receiver operating characteristic curves (ROCs) are commonly used to visually represent of k-fold cross validation. These curves help to plot and illustrate the true-positive (TP, correctly classified values of state A2 presented on the y-axis) and false-positive (FP, misclassified A1 state values presented on the x-axis) rates. The 10-fold cross validation and averaged curve for states A1 and A2 are illustrated in Figure 9. In this figure, the area under the ROC curve (AUC) provides an accumulated measure of performance across all possible classification thresholds. In this research, the AUC indicated the probability that the model ranks a random value from state A2 more highly than a random value from state A1. Analysis of multiple scenarios with various k values shows that in most cases, a lower number of k-folds may negatively affect recall or precision values. However, the AUC value remains similar, and further investigation is needed to determine the number of k-folds in the cross-validation process. Due to small changes in the results, we decided not to present all possible combinations and instead use only 10-fold cross validation as an example.
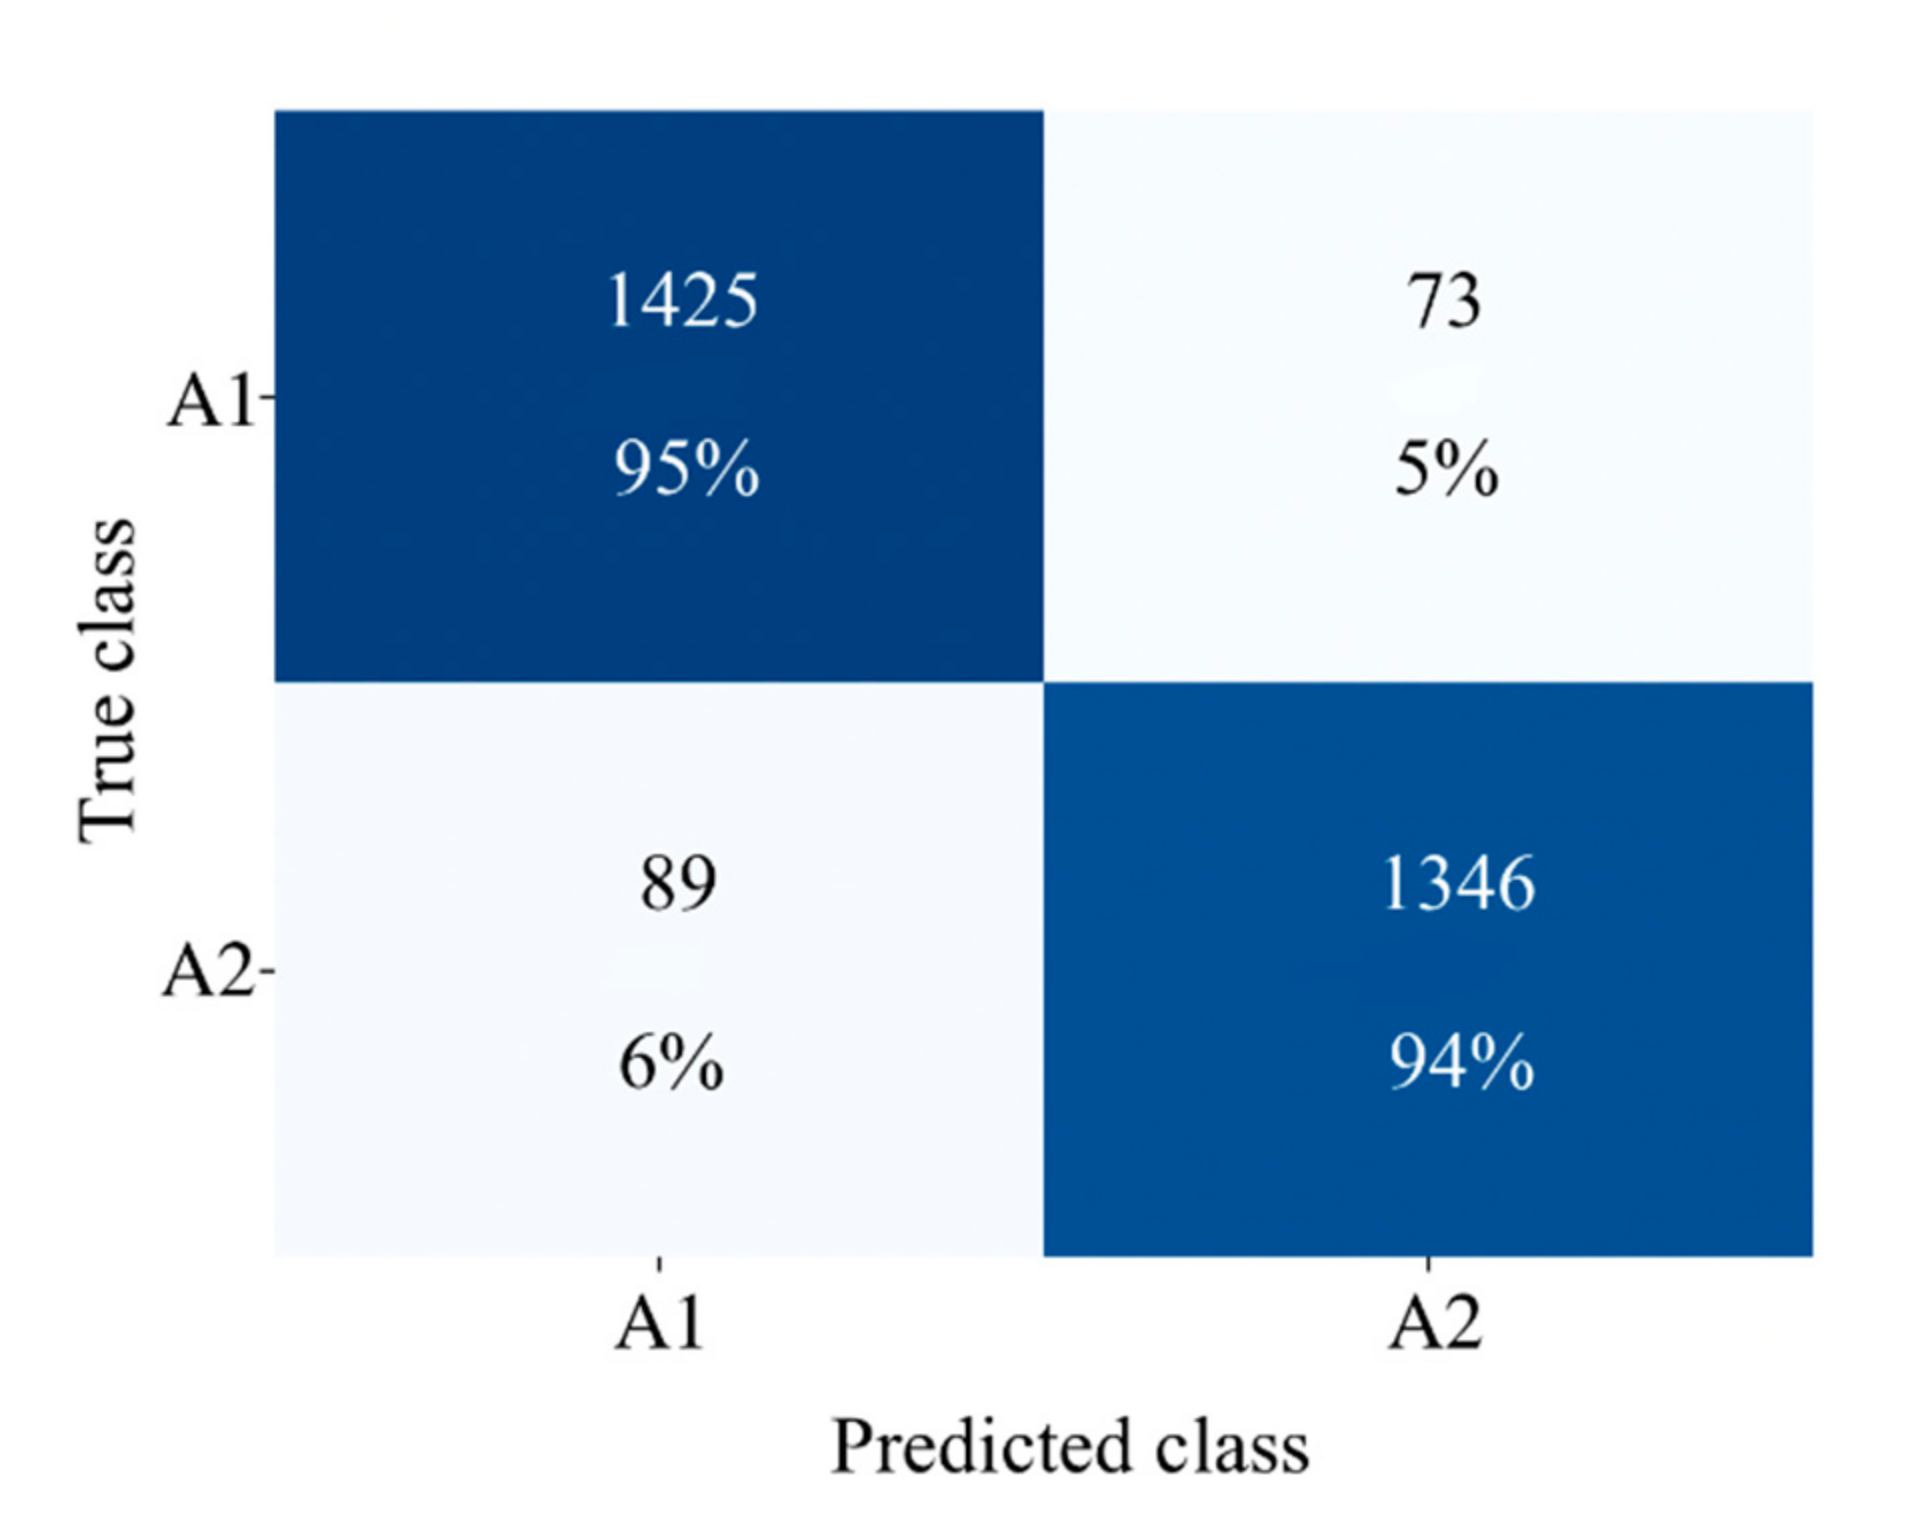
Based on cross-validation results (see Figure 9), and accuracy of 98% can be expected for A1 and A2 state classification. The next step is to test the final RF model using a separate dataset (30% of all input data). The testing accuracy of the constructed RF model is equal to 94.5%, which is lower than expected (validation accuracy, 98%). However, this model can sufficiently classify and correctly assign values to states A1 and A2. True-positive (state A2) and false-positive (state A1) values are predicted with similar accuracy (95% and 94%, respectively) (Figure 10).
Finally, Cohen’s Kappa coefficient was estimated as an essential measurement to evaluate a model’s suitability and reliance on random samples. This value was calculated as , indicating “perfect” model reliability. Therefore, the constructed RF classifier sufficiently classifies data into states A1 and A2, meaning that the model can identify fatigued conditions using ECG signal parameter values.
5. Discussion and Conclusions
5.1. Discussion and Future Work
In this paper, we proposed a framework for mental fatigue detection combining ECG signal recording twice a day corresponding to different mental states: fatigued and without mental fatigue. Extracted ECG signal features, such as R, S, and T wave amplitude values, as well as QT intervals, increased the classification accuracy compared to similar methods reported in the literature. For example, in [5], heart rate variability (HRV) indicators achieved an accuracy of 75.5%. Additionally, in [6], the proposed methods achieved an accuracy of 93.3%. However, this research considered mentally stressed participants (after 12 h of intense work), which may have resulted in an increased impact on HRV parameter values. This research enables the detection of smaller changes in mental health conditions compared to previously mentioned literature reports. Furthermore, statistical analysis of several ECG signal features showed that RR interval values (used in HRV analysis) overlap in between states, which is why HRV analysis and parameter estimation are not efficient and may reduce classification accuracies. PCA analysis showed that other ECG features present with larger differences between states. Due to the use of several ECG signal features, an accuracy of 94.5% was achieved.
Although the proposed technique shows promising results, it is also subject to some weaknesses. ECG signals should be recorded using professional devices, such as CardioScout Multi, which is expensive and inconvenient. User-friendly devices, such as a Polar v10 belt or Garmin watch, do not record full ECG signals, and data from such devices are not sufficiently reliable. Furthermore, in this research, the gathered data were not suitable for diagnostic purposes because we did not include patients with diagnosed mental illness. Future research should focus on gathering more data and improving classification accuracies. We suggest that 60 sec ECG signal recordings could be expanded and compared with HRV analysis results.
5.2. Conclusions
Considering gaps identified in recent literature, we presented a novel framework that combines ECG signal feature extraction, PCA analysis, and ML classification algorithms. The obtained results show that the proposed framework is feasible for automatic mental fatigue detection.
To ensure daily fatigue recognition, we designed an experiment involving separate recordings registered twice a day. Each recording represents a mental state, i.e., a state without fatigue recorded in the morning and a fatigued state recorded in the evening. A total of 60 healthy adults (ages 24 to 34) without a diagnosis of health pathologies or over-work-related problems were recruited for this experiment. All ECG signals were filtered using a Butterworth filter, and features were extracted using Python toolbox NeuroKit2. Using these methods, the following high-quality ECG parameters were obtained: Q, R, S, and T wave amplitude values; QRS complexes; and RR, ST, QT, and T intervals.
Data visualization processes and statistical analysis show that RR interval values overlap between states, which is why only RR interval analysis alone, such as HRV parameter estimation, is not an efficient way to detect mentally fatigued states. To overcome this issue, other ECG signal parameters were considered in this paper.
PCA analysis showed a significant difference between states (with and without fatigue). As the most representative ECG signal features Q and R wave amplitude values and QT and T intervals were observed. Changes in the first three principal components were evident, indicating the importance of ECG signal feature extraction for mental fatigue recognition.
Finally, machine learning algorithms were applied for automatic classification of ECG signal features into separate states. Four ECG signal parameters (Sa, Ra, Ta, and QT) were identified as the most important for the mental fatigue classification process. The final RF model was able to detect daily mental fatigue with an accuracy of more than 94.5%.
Although the proposed technique shows promising results, it is also subject to some weaknesses. Future work should focus on user-friendly devices for the ECG signal gathering process to ensure that a wide range of participants can be included in experiments.
Author Contributions
Conceptualization, E.B. and L.B.; methodology, E.B. and A.M.; software, E.B. and A.M.; validation, E.B., L.B. and A.M.; formal analysis, L.B.; investigation, E.B. and A.M.; resources and data curation, E.B.; writing—original draft preparation, E.B. and A.M.; writing—review and editing, L.B.; visualization, E.B. and A.M.; supervision, L.B. and A.M. All authors have read and agreed to the published version of the manuscript.
Funding
This research received no external funding.
Institutional Review Board Statement
The study was conducted in accordance with the Declaration of Helsinki, and approved by the Kaunas Regional Research Ethics Committee board (protocol code BE-2-38, 2016-09-07).
Informed Consent Statement
Informed consent was obtained from all subjects involved in the study.
Data Availability Statement
Not applicable.
Conflicts of Interest
The authors declare no conflict of interest.
Abbreviations
| ANOVA | Analysis of variance |
| AUC | Area under the ROC curve |
| cCNN | Causal convolutional neural network |
| CF | Cognitive fatigue |
| DT | Decision tree |
| ECG | Electrocardiogram |
| EEG | Electroencephalogram |
| EES | Epidermal electronic system |
| EMG | Electromyogram |
| EOG | Electrooculogram |
| E-tattoos | Electronic tattoos |
| G | Gini coefficient |
| GSR | Galvanic skin response |
| HR | Heart rate |
| HRV | Heart rate variability |
| IMU | Inertial measurement unit |
| KNN | K-nearest neighbor |
| LDA | Linear discriminant analysis |
| LR | Logistic regression |
| MA | Moving average |
| MCC | Matthew’s correlation coefficient |
| MF | Mental fatigue |
| ML | Machine learning |
| NB | Naïve Bayes |
| NN | Neural network |
| PCA | Principal component analysis |
| PPG | Photoplethysmography |
| RF | Random forest |
| ROC | Receiver operating characteristic curve |
| RPCA | Robust principal component analysis |
| SVM | Support vector machine |
| TICC | Toeplitz inverse covariance-based clustering |
References
- Eldadah, B.A. Fatigue and Fatigability in Older Adults. PMRJ 2010, 2, 406–413. [Google Scholar] [CrossRef] [PubMed]
- Ruvalcaba, N.M.M.; Humboldt, S.; Villavicencio, M.E.F.; García, I.F.D. Psychological Fatigue. In Encyclopedia of Gerontology and Population Aging; Springer: Cham, Switzerland, 2019; pp. 1–5. [Google Scholar] [CrossRef]
- Zhao, C.; Zhao, M.; Liu, J.; Zheng, C. Electroencephalogram and Electrocardiograph Assessment of Mental Fatigue in a Driving Simulator. Accid. Anal. Prev. 2012, 45, 83–90. [Google Scholar] [CrossRef] [PubMed]
- Proost, M.; Habay, J.; De Wachter, J.; De Pauw, K.; Rattray, B.; Meeusen, R.; Roelands, B.; Van Cutsem, J. How to Tackle Mental Fatigue: A Systematic Review of Potential Countermeasures and Their Underlying Mechanisms. Sport. Med. 2022, 52, 2129–2158. [Google Scholar] [CrossRef]
- Huang, S.; Li, J.; Zhang, P.; Zhang, W. International Journal of Medical Informatics Detection of Mental Fatigue State with Wearable ECG Devices. Int. J. Med. Inform. 2018, 119, 39–46. [Google Scholar] [CrossRef]
- Bin Heyat, M.B.; Akhtar, F.; Abbas, S.J.; Al-Sarem, M.; Alqarafi, A.; Stalin, A.; Abbasi, R.; Muaad, A.Y.; Lai, D.; Wu, K. Wearable Flexible Electronics Based Cardiac Electrode for Researcher Mental Stress Detection System Using Machine Learning Models on Single Lead Electrocardiogram Signal. Biosensors 2022, 12, 427. [Google Scholar] [CrossRef]
- Tanaka, M.; Mizuno, K.; Yamaguti, K.; Kuratsune, H.; Fujii, A.; Baba, H.; Matsuda, K.; Nishimae, A.; Takesaka, T.; Watanabe, Y. Autonomic Nervous Alterations Associated with Daily Level of Fatigue. Behav. Brain Funct. 2011, 7, 46. [Google Scholar] [CrossRef] [PubMed]
- Hu, X.; Lodewijks, G. Detecting Fatigue in Car Drivers and Aircraft Pilots by Using Non-Invasive Measures: The Value of Differentiation of Sleepiness and Mental Fatigue. J. Saf. Res. 2020, 72, 173–187. [Google Scholar] [CrossRef]
- Habay, J.; Van Cutsem, J.; Verschueren, J.; De Bock, S.; Proost, M.; De Wachter, J.; Tassignon, B.; Meeusen, R.; Roelands, B. Mental Fatigue and Sport-Specific Psychomotor Performance: A Systematic Review. Sport. Med. 2021, 51, 1527–1548. [Google Scholar] [CrossRef]
- Kunrath, C.A.; Cardoso, F.D.S.L.; Calvo, T.G.; Costa, I.T.D. Mental fatigue in soccer: A systematic review. Rev. Bras. Med. Esporte 2020, 26, 172–178. [Google Scholar] [CrossRef]
- Brahms, M.; Heinzel, S.; Rapp, M.; Mückstein, M.; Hortob, T.; Stelzel, C.; Granacher, U. The Acute Effects of Mental Fatigue on Balance Performance in Healthy Young and Older Adults—A Systematic Review and Meta-Analysis. Acta Psychol. 2022, 225, 103540. [Google Scholar] [CrossRef]
- Kodithuwakku, A.S.N.; Burch, R.F.V.; Chander, H.; Turner, A.J.; Knight, A.C. Theoretical Issues in Ergonomics Science The Use of Wearable Devices in Cognitive Fatigue: Current Trends and Future Intentions. Theor. Issues Ergon. Sci. 2022, 23, 374–386. [Google Scholar] [CrossRef]
- Keeffe, K.O.; Hodder, S.; Lloyd, A. A Comparison of Methods Used for Inducing Mental Fatigue in Performance Research: Individualised, Dual-Task and Short Duration Cognitive Tests Are Most Effective. Ergonomics 2020, 63, 1–12. [Google Scholar] [CrossRef]
- Tran, Y.; Craig, A.; Craig, R.; Chai, R.; Nguyen, H. The Influence of Mental Fatigue on Brain Activity: Evidence from a Systematic Review with Meta-Analyses. Psychophysiology 2020, 57, e13554. [Google Scholar] [CrossRef] [PubMed]
- Hu, J. Comparison of Different Features and Classifiers for Driver Fatigue Detection Based on a Single EEG Channel. Comput. Math. Methods Med. 2017, 2017, 5109530. [Google Scholar] [CrossRef]
- Shen, K.; Li, X.; Ong, C.; Shao, S.; Wilder-smith, E.P. V EEG-Based Mental Fatigue Measurement Using Multi-Class Support Vector Machines with Confidence Estimate. Clin. Neurophysiol. 2008, 119, 1524–1533. [Google Scholar] [CrossRef]
- Laurent, F.; Valderrama, M.; Besserve, M.; Guillard, M.; Lachaux, J.P.; Martinerie, J.; Florence, G. Biomedical Signal Processing and Control Multimodal Information Improves the Rapid Detection of Mental Fatigue. Biomed. Signal Process. Control 2013, 8, 400–408. [Google Scholar] [CrossRef]
- Maman, S.Z.; Chen, Y.; Baghdadi, A.; Lombardo, S.; Cavuoto, L.A.; Megahed, F.M. A Data Analytic Framework for Physical Fatigue Management Using Wearable Sensors. Expert Syst. Appl. 2020, 155, 113405. [Google Scholar] [CrossRef]
- Butkevičiūtė, E.; Eriņš, M.; Bikulčienė, L. An Adaptable Human Fatigue Evaluation System. Procedia Comput. Sci. 2021, 192, 1274–1284. [Google Scholar] [CrossRef]
- Fan, C.; Huang, S.; Lin, S.; Xu, D.; Peng, Y.; Yi, S. Types, Risk Factors, Consequences, and Detection Methods of Train Driver Fatigue and Distraction. Comput. Intell. Neurosci. 2022, 2022, 8328077. [Google Scholar] [CrossRef]
- Badr, A.; Badawi, A.; Rashwan, A.; Elgazzar, K. XBeats: A Real-Time Electrocardiogram Monitoring and Analysis System. Signals 2022, 3, 189–208. [Google Scholar] [CrossRef]
- Delliaux, S.; Delaforge, A.; Deharo, J.; Chaumet, G. Mental Workload Alters Heart Rate Variability, Lowering Non-Linear Dynamics. Front. Physiol. 2019, 10, 565. [Google Scholar] [CrossRef] [PubMed]
- Wei, J.X.; Wang, J.; Zhu, Y.X.; Sun, J.; Xu, H.M.; Li, M. Traditional Chinese Medicine Pharmacovigilance in Signal Detection: Decision Tree-Based Data Classification. BMC Med. Inform. Decis. Mak. 2018, 18, 19. [Google Scholar] [CrossRef] [PubMed]
- Shao, M.; Bin, G.; Wu, S.; Bin, G.; Huang, J.; Zhou, Z. Detection of Atrial Fibrillation from ECG Recordings Using Decision Tree Ensemble with Multi-Level Features. Physiol. Meas. 2018, 39, 094008. [Google Scholar] [CrossRef]
- Balagué, N.; González, J.; Javierre, C.; Hristovski, R.; Aragonés, D.; Álamo, J.; Niño, O.; Ventura, J.L. Cardiorespiratory Coordination after Training and Detraining. A Principal Component Analysis Approach. Front. Physiol. 2016, 7, 35. [Google Scholar] [CrossRef] [PubMed]
- Ye, W.; Lu, W.; Tang, Y.; Chen, G.; Li, X.; Ji, C.; Hou, M.; Zeng, G.; Lan, X.; Wang, Y.; et al. Identification of COVID-19 Clinical Phenotypes by Principal Component Analysis-Based Cluster Analysis. Front. Med. 2020, 7, 570614. [Google Scholar] [CrossRef]
- Wang, J.; Liao, X.; Zheng, P.; Xue, S.; Peng, R. Classification of Chinese Herbal Medicine by Laser- Induced Breakdown Spectroscopy with Principal Component Analysis and Artificial Neural Network. Anal. Lett. 2018, 51, 575–586. [Google Scholar] [CrossRef]
- Kara, S.; Dirgenali, F. A System to Diagnose Atherosclerosis via Wavelet Transforms, Principal Component Analysis and Artificial Neural Networks. Expert. Syst. Appl. 2007, 32, 632–640. [Google Scholar] [CrossRef]
- Papi, M.; Caracciolo, G. Principal Component Analysis of Personalized Biomolecular Corona Data for Early Disease Detection. Nano Today 2018, 21, 14–17. [Google Scholar] [CrossRef]
- Martis, J.R.; Acharya, U.R.; Mandana, K.M.; Ray, A.K.; Chakraborty, C. Application of Principal Component Analysis to ECG Signals for Automated Diagnosis of Cardiac Health. Expert. Syst. Appl. 2012, 39, 11792–11800. [Google Scholar] [CrossRef]
- Li, J.; Li, H.; Umer, W.; Wang, H.; Xing, X.; Zhao, S.; Hou, J. Identification and Classification of Construction Equipment Operators’ Mental Fatigue Using Wearable Eye-Tracking Technology. Autom. Constr. 2020, 109, 103000. [Google Scholar] [CrossRef]
- Zhang, C.; Yu, X. Estimating Mental Fatigue Based on Electroencephalogram and Heart Rate Variability. Pol. J. Med. Phys. Eng. 2010, 16, 67–84. [Google Scholar] [CrossRef]
- Phadikar, S.; Sinha, N.; Ghosh, R.; Ghaderpour, E. Automatic Muscle Artifacts Identification and Removal from Single-Channel EEG Using Wavelet Transform with Meta-Heuristically Optimized Non-Local Means Filter. Sensors 2022, 22, 2948. [Google Scholar] [CrossRef] [PubMed]
- Ahmed, M.Z.I.; Sinha, N.; Phadikar, S.; Ghaderpour, E. Automated Feature Extraction on AsMap for Emotion Classification Using EEG. Sensors 2022, 22, 2346. [Google Scholar] [CrossRef] [PubMed]
- Tuncer, T.; Dogan, S.; Subasi, A. EEG-Based Driving Fatigue Detection Using Multilevel Feature Extraction and Iterative Hybrid Feature Selection. Biomed. Signal Process. Control 2021, 68, 102591. [Google Scholar] [CrossRef]
- Luo, H.; Lee, P.-A.; Clay, I.; Jaggi, M.; De Luca, V. Assessment of Fatigue Using Wearable Sensors: A Pilot Study. Emerg. Appl. 2020, 4, 59–72. [Google Scholar] [CrossRef]
- Hinde, K.; White, G.; Armstrong, N. Wearable Devices Suitable for Monitoring Twenty Four Hour Heart Rate Variability in Military Populations. Sensors 2021, 21, 1061. [Google Scholar] [CrossRef]
- Zeng, Z.; Huang, Z.; Leng, K.; Han, W.; Niu, H.; Yu, Y.; Ling, Q.; Liu, J.; Wu, Z.; Zang, J. Nonintrusive Monitoring of Mental Fatigue Status Using Epidermal Electronic Systems and Machine-Learning Algorithms. ACS Sensors 2020, 5, 1305–1313. [Google Scholar] [CrossRef]
- Sampei, K.; Ogawa, M.; Cesar, C.; Torres, C.; Sato, M.; Miki, N. Mental Fatigue Monitoring Using a Wearable Transparent Eye Detection System. Micromachines 2016, 7, 20. [Google Scholar] [CrossRef]
- Liu, M.; Hao, H.Q.; Xiong, P.; Lin, F.; Hou, Z.G.; Liu, X. Constructing a Guided Filter by Exploiting the Butterworth Filter for ECG Signal Enhancement. J. Med. Biol. Eng. 2018, 38, 980–992. [Google Scholar] [CrossRef]
- Prasad, S.T.; Varadarajan, S. ECG Signal Analysis: Different Approaches. Int. J. Eng. Trends Technol. 2014, 7, 212–216. [Google Scholar] [CrossRef]
- Makowski, D.; Pham, T.; Lau, Z.J.; Brammer, J.C.; Lespinasse, F.; Pham, H.; Schölzel, C.; Chen, S.H.A. NeuroKit2: A Python Toolbox for Neurophysiological Signal Processing. Behav. Res. Methods 2021, 53, 1689–1696. [Google Scholar] [CrossRef] [PubMed]
- Bi, Q.; Goodman, K.E.; Kaminsky, J.; Lessler, J. What Is Machine Learning? A Primer for the Epidemiologist. Pract. Epidemiol. 2019, 188, 2222–2239. [Google Scholar] [CrossRef] [PubMed]
- Bowes, D.; Hall, T.; Gray, D. DConfusion: A Technique to Allow Cross Study Performance Evaluation of Fault Prediction Studies. Autom. Softw. Eng. 2014, 21, 287–313. [Google Scholar] [CrossRef]
- Halimu, C.; Kasem, A.; Newaz, S.H.S. Empirical Comparison of Area under ROC Curve (AUC) and Mathew Correlation Coefficient (MCC) for Evaluating Machine Learning Algorithms on Imbalanced Datasets for Binary Classification. In Proceedings of the 3rd International Conference on Machine Learning and Soft Computing (ICMLS 2019), Marakesh, Morocco, 28–30 October 2019; pp. 10–15. [Google Scholar] [CrossRef]
- McHugh, M.L. Lessons in Biostatistics Interrater Reliability: The Kappa Statistic. Biochem. Medica 2012, 22, 276–282. [Google Scholar] [CrossRef]
- Oeda, S.; Chieda, M. Visualization of Programming Skill Structure by Log-Data Analysis with Decision Tree. Procedia Comput. Sci. 2019, 159, 582–589. [Google Scholar] [CrossRef]
- Spanakis, G.; Weiss, G.; Roefs, A. Bagged Boosted Trees for Classification of Ecological Momentary Assessment Data. In Ebook: ECAI 2016; IOS Press: Amsterdam, The Netherlands, 2016; pp. 1612–1613. [Google Scholar] [CrossRef]
- Chicco, D. Ten Quick Tips for Machine Learning in Computational Biology. BioData Min. 2017, 10, 35. [Google Scholar] [CrossRef] [Green Version]
Figure 1.
Proposed framework for mental fatigue detection.

Figure 2.
ECG signal features in the V5 lead.

Figure 3.
Histograms and scatter plots of ECG signal parameters in different states.

Figure 4.
Pearson correlation coefficients between ECG signal parameters.

Figure 5.
3D plot of PCA results for both data subsets: yellow dots represent the morning state; blue pyramids—evening state.
Figure 5.
3D plot of PCA results for both data subsets: yellow dots represent the morning state; blue pyramids—evening state.

Figure 6.
3D plots of the PCA performed on factorial data: (a) morning; (b) evening.

Figure 7.
Boxplots of ML algorithm accuracies.

Figure 8.
The importance of ECG parameters for classification of states A1 and A2: (a) ECG parameters and FR accuracy; (b) cumulative accuracy curve for the RF model.
Figure 8.
The importance of ECG parameters for classification of states A1 and A2: (a) ECG parameters and FR accuracy; (b) cumulative accuracy curve for the RF model.

Figure 9.
10-fold cross validation of the RF model.

Figure 10.
Confusion matrix of classification results for states A1 and A2.


Table 1.
Wearable devices used to detect mental fatigue in recent literature.
| Wearable Device | Target Group | Sensor | Method |
|---|---|---|---|
| Neuroscan system Synamps Scan 4.3 [3] | Drivers | EEG, ECG, HRV | Spectral and statistical analysis, entropy |
| “LaPatch” [5] | Healthy adults | ECG, HRV | SVM, KNN, NB, LR |
| Wearable eye-tracking technology [31] | Construction equipment operators | TICC | SVM |
| T-shirt [6] | Healthy adults | ECG | DT, RF, NB, LR |
| 32-electrode ActiCapTM and BrainAmpTM systems [17] | - | EEG, EOG, ECG | SVM, ANOVA |
| Medtronic PL-Winsor 2.35 EEG system [16] | - | EEG | SVM |
| IMU sensors [18] | Young healthy adults | IMU, HRV | RF, SVM, LR |
| Neuroscan 32-channel system [32] | Healthy adults | EEG, ECG, HRV | Spectral analysis, SVM |
| Everion device [36] | Healthy adults | HRV, skin temperature | Statistical analysis, CNN, RF |
| Polar H10 chest strap [37] | Military members | HRV, ECG | Statistical analysis |
| Neuroscan Scan 4.3 [15] | Drivers (men) | EEG | SVM, DT, RF, KNN, and others |
| [20] | Train drivers | EOG, EEG, ECG | Correlation analysis, ANOVA, SVM, PCA |
| Driving simulator and brain cap [35] | Drivers | EEG | KNN |
| E-tattoos [38] | Healthy adults | ECG, respiration, GSR | SVM, KNN, DT |
| Transparent eye detection system [39] | National Aeronautics | Eye blinks | Statistical analysis |
Table 2.
ECG signal features and causes of electrical impulses in the heart (based on [41]).
Table 2.
ECG signal features and causes of electrical impulses in the heart (based on [41]).
| Wave Type and Parameter | Heart Activity |
|---|---|
| Q wave | The anteroseptal part of the myocardial ventricle is activated |
| R wave | Depolarization of myocardial ventricles |
| S wave | The posterior diaphragmatic part of the ventricles is activated |
| T wave | Rapid ventricular repolarization |
| QT interval | Time required for the electrical system to fire an impulse through the ventricles and then recharge |
| ST interval | The initial, slow phase of ventricular repolarization |
| RR interval | Time elapsed between two successive R waves of the QRS signal on an electrocardiogram (and its reciprocal, the HR); a function of intrinsic properties of the sinus node, as well as autonomic influence |
| QRS complex | A combination of the Q wave, R wave, and S wave; the “QRS complex” represents ventricular depolarization |
Table 3.
ECG signal recordings in different states.
| State | Description | Recording Duration |
|---|---|---|
| A1 | In the morning, i.e., a state without fatigue | 60 s |
| A2 | In the evening, i.e., fatigued condition | 60 s |
Table 4.
Summary of principal components using factored data.
| Data | PC1 | PC2 | PC3 | PC4 | PC5 | PC6 | PC7 | PC8 |
|---|---|---|---|---|---|---|---|---|
| Qa | 0.241 | −0.581 | 0.033 | −0.219 | 0.138 | −0.107 | 0.443 | −0.573 |
| Ra | 0.026 | −0.568 | 0.026 | 0.552 | 0.280 | 0.459 | −0.203 | 0.202 |
| Sa | −0.131 | −0.232 | −0.608 | −0.625 | 0.164 | 0.212 | −0.238 | 0.200 |
| Ta | −0.311 | −0.230 | −0.367 | 0.243 | −0.787 | 0.035 | 0.024 | −0.189 |
| RR | −0.365 | −0.150 | −0.295 | 0.280 | 0.341 | −0.722 | 0.104 | 0.173 |
| QRS | −0.279 | 0.421 | −0.355 | 0.217 | 0.333 | 0.414 | 0.387 | −0.345 |
| Tint | −0.417 | −0.153 | 0.326 | −0.211 | −0.099 | 0.185 | 0.606 | 0.489 |
| QT | −0.483 | −0.012 | 0.246 | −0.089 | 0.123 | 0.060 | −0.244 | −0.314 |
| ST | −0.456 | −0.102 | 0.337 | −0.141 | 0.061 | −0.023 | −0.342 | −0.261 |
Table 5.
Summary of the first three principal components using factored data (morning data (M): 73.6%; evening data (E): 79.5%).
Table 5.
Summary of the first three principal components using factored data (morning data (M): 73.6%; evening data (E): 79.5%).
| Data | PC1M | PC2M | PC3M | PC1E | PC2E | PC3E |
|---|---|---|---|---|---|---|
| Qa | 0.083 | 0.651 | 0.181 | 0.313 | −0.482 | −0.187 |
| Ra | 0.102 | −0.614 | 0.251 | 0.060 | −0.585 | −0.303 |
| Sa | −0.341 | 0.217 | −0.443 | 0.118 | 0.241 | −0.518 |
| Ta | −0.279 | −0.384 | −0.266 | −0.328 | −0.050 | −0.426 |
| RR | −0.371 | 0.019 | −0.121 | −0.341 | −0.069 | −0.537 |
| QRS | −0.245 | −0.034 | −0.529 | −0.287 | 0.480 | −0.185 |
| Tint | −0.402 | −0.024 | 0.388 | −0.402 | −0.253 | 0.194 |
| QT | −0.469 | 0.036 | 0.269 | −0.472 | −0.108 | 0.148 |
| ST | −0.458 | 0.041 | 0.346 | −0.440 | −0.232 | 0.204 |
Table 6.
Average accuracy of ML algorithms.
| Method | Accuracy | F1 | MCC |
|---|---|---|---|
| KNN | 94.19% | 0.94 | 0.87 |
| LDA | 76.82% | 0.75 | 0.46 |
| SVM | 90.89% | 0.91 | 0.82 |
| DT | 92.31% | 0.92 | 0.83 |
| RF | 95.08% | 0.95 | 0.90 |
Publisher’s Note: MDPI stays neutral with regard to jurisdictional claims in published maps and institutional affiliations. |
© 2022 by the authors. Licensee MDPI, Basel, Switzerland. This article is an open access article distributed under the terms and conditions of the Creative Commons Attribution (CC BY) license (https://creativecommons.org/licenses/by/4.0/).
Share and Cite
MDPI and ACS Style
Butkevičiūtė, E.; Michalkovič, A.; Bikulčienė, L. ECG Signal Features Classification for the Mental Fatigue Recognition. Mathematics 2022, 10, 3395. https://0-doi-org.brum.beds.ac.uk/10.3390/math10183395
AMA Style
Butkevičiūtė E, Michalkovič A, Bikulčienė L. ECG Signal Features Classification for the Mental Fatigue Recognition. Mathematics. 2022; 10(18):3395. https://0-doi-org.brum.beds.ac.uk/10.3390/math10183395
Chicago/Turabian StyleButkevičiūtė, Eglė, Aleksėjus Michalkovič, and Liepa Bikulčienė. 2022. "ECG Signal Features Classification for the Mental Fatigue Recognition" Mathematics 10, no. 18: 3395. https://0-doi-org.brum.beds.ac.uk/10.3390/math10183395
Note that from the first issue of 2016, this journal uses article numbers instead of page numbers. See further details here.