

Thyroid Nodule Segmentation in Ultrasound Image Based on Information Fusion of Suggestion and Enhancement Networks

Division of Electronics and Electrical Engineering, Dongguk University, 30 Pildong-ro, 1-gil, Jung-gu, Seoul 04620, Korea
*
Author to whom correspondence should be addressed.
Mathematics 2022, 10(19), 3484; https://0-doi-org.brum.beds.ac.uk/10.3390/math10193484
Submission received: 1 August 2022
/
Revised: 7 September 2022
/
Accepted: 20 September 2022
/
Published: 23 September 2022
(This article belongs to the Special Issue Computational Intelligent and Image Processing)
Abstract
:Computer-aided diagnosis/detection (CADx) systems have been used to help doctors in improving the quality of diagnosis and treatment processes in many serious diseases such as breast cancer, brain stroke, lung cancer, and bone fracture. However, the performance of such systems has not been completely accurate. The key factor in CADx systems is to localize positive disease lesions from the captured medical images. This step is important as it is used not only to localize lesions but also to reduce the effect of noise and normal regions on the overall CADx system. In this research, we proposed a method to enhance the segmentation performance of thyroid nodules in ultrasound images based on information fusion of suggestion and enhancement segmentation networks. Experimental results with two open databases of thyroid digital image databases and 3DThyroid databases showed that our method resulted in a higher performance compared to current up-to-date methods.
Keywords:
medical image processing; thyroid nodule segmentation; artificial intelligence; attention network; suggestion and enhancement networksMSC:
68T07; 68U101. Introduction
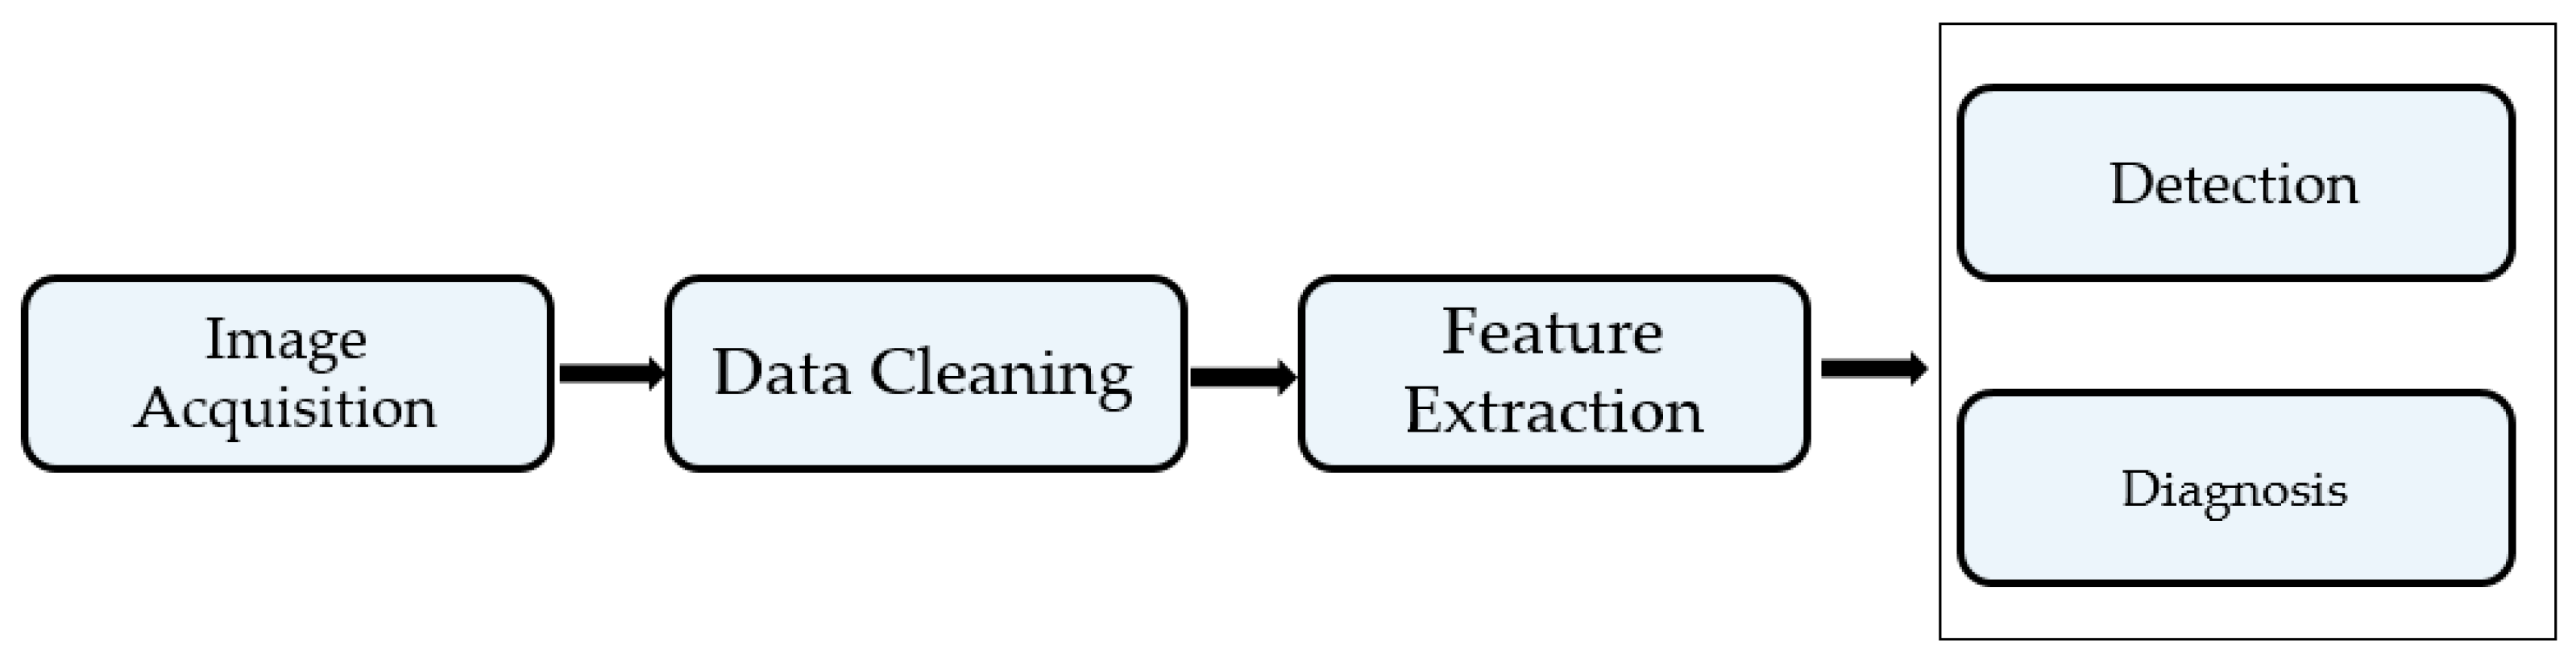
Computer-aided diagnosis and detection (CADx) systems have been used to support doctors in the diagnosis and treatment of many types of diseases such as cancer [1,2,3,4], stroke [5], bone fracture [6], COVID-19 [7], and other abnormalities. The technology uses an imaging system such as X-ray [6], computed tomography (CT) [5,7], and ultrasound (US) [2] to capture images of the human body to detect abnormalities. Conventionally, a CADx system comprises several parts, including image acquisition, data (image) cleaning, feature extraction, and detection/classification [8], as shown in Figure 1.
The image acquisition is the first step of every CADx system that provides data for the later processing steps. This step is performed by using some specialized camera sensors to capture images or video sequence of several organs of human body (X-ray for bone fracture, lung; CT or MRI for brain; US for breast, thyroid, etc.).
Data cleaning refers to methods that are applied on the captured images to prepare data for the main processing steps such as enhancing the image quality of captured images or reducing noise.
Feature extraction is the process of extracting features from input image to model the information contained in the input images. This step can be performed by using either handcrafted feature-based or learned feature-based methods.
Detection/diagnosis is the process of detecting the abnormal parts in the input images, or assigning a corresponding label to each input image, which best describes the type of disease represented in the image according to prior knowledge associated in the training data.
Although these systems have proven to be efficient in assisting doctors in the treatment process, they have a limitation in common; that is, the image capture devices are very expensive, which prevents the widespread installation of these systems. Ultrasound imaging techniques use sound waves to capture images of organs of the human body in vivo and offer an alternative imaging technique for some organs such as the breast or thyroid. Unlike X-ray or CT imaging techniques, the ultrasound imaging technique does not use radiation. Therefore, it is safe for patients. Because of its advantages, this type of CADx system has been studied and applied for the breast and thyroid diseases. In this work, we researched the enhancement of the segmentation performance of thyroid nodule in ultrasound thyroid images, which is key for thyroid disease diagnosis and treatment processes. We propose a method to enhance the segmentation performance of conventional medical image segmentation methods to provide a more accurate estimation of the thyroid nodule region in ultrasound thyroid images. Thus, doctors can enhance the quality of their diagnosis and treatment methods.
The remaining of our paper is structured as follows: we first present related works in Section 2. In Section 3, we describe in detail our approach for thyroid nodule segmentation. In Section 4, we conduct various experiments using our proposed method with two public datasets. On the basis of these experimental results, we further make comparison between our proposed approach and previous studies and provide a detailed discussion on these results. Lastly, we give our conclusions in Section 5.
2. Related Work
A medical image processing system has two main components: lesion detection/segmentation and classification. Of these, the lesion detection/segmentation step is an important part of the CADx system as it helps to not only locate the position of abnormal areas, but also reduces the effect of noise caused by non-lesion regions. Previous studies on medical image segmentation can be roughly categorized into two groups of segmentation methods: conventional-based and deep learning-based methods. We summarize previous studies of these two types in Table 1. Before the explosion of deep learning-based techniques, medical image lesions were normally segmented/detected using methods such as watershed segmentation [9], graph-based methods [10], and active contour models [11].
Recently, with the growing number of computational techniques, such as convolutional neural networks (CNN) and the appearance of hardware acceleration devices, deep learning-based techniques have been successfully used for various computer vision applications, including image detection/segmentation [12,13], image classification [14,15,16,17,18], and image generation [19]. For medical image segmentation, previous studies have used deep learning-based techniques for breast, brain stroke, and thyroid nodule segmentation. One of the most significant studies on medical image segmentation was carried out by Ronneberger et al. [12]. In that study, Ronneberger et al. proposed the use of an auto encoder–decoder neural network architecture for image segmentation problem, namely, the UNet network. This architecture first used a conventional fully convolution network (FCN) to learn useful information from an input image, i.e., an encoder. In their study, the encoder network is formed by stacking several convolution blocks (convolution layer with max pooling) together for the purpose of image feature extraction. As a result, the outputs of encoder are the image feature maps at various abstract levels, in which each abstract level represents the image information at a specific image scale. Subsequently, a decoder network was used to decode the output of the encoder and reconstruct the target image. For this purpose, the decoder network uses the transposed convolution layers to expand the size of feature maps and the convolution layers to learn the mapping function to reconstruct the target image. At every scale, the output feature maps of the encoder and corresponding feature maps of the decoder are combined to capture both low and high abstract level of image features, which can help to enhance the learning ability of the network. This neural network architecture was found to work well in many medical image segmentation applications. To simplify the training of the UNet network and increase its depth, Khanna et al. [20] used a residual UNet network architecture, i.e., a UNet network with a residual connection. They showed that the residual UNet outperformed state-of-the-art studies on the retinal vessel segmentation problem. Recently, Zhou et al. [21] proposed an enhancement to UNet for medical image segmentation, namely, the UNet++ network. The UNet++ network could be seen as a nesting of multiple UNet networks. Through experiments, the authors showed that their network architecture with the nesting methodology outperformed the conventional UNet network. However, the UNet++ does not explore the information from every feature scale. To address this limitation, Huang et al. [22] proposed a similar but more efficient network architecture, namely, UNet 3+, to explore the information of full-scale using full-scale skip connections and deep supervision. By using the full-scale skip connections, the UNet 3+ network can incorporate the information of both low-level and high-level features. As a result, the UNet 3+ network can enhance segmentation accuracy compared to the UNet++ network. Instead of using the nesting approach of UNet networks such as the UNet+++ or UNet 3+, Baccouche et al. [23] proposed an enhancement version of the UNet network by concatenating the two UNet networks together to form a so-called Connected-UNets network. In the connected-UNets network architecture, the output of the first UNet network is further enhanced by using a second UNet network. The authors proved the efficiency of the connected-UNets in their experiments with the breast nodule segmentation problem. However, the use of two deep networks makes the connected-UNets network too deep and possibly causes the gradient vanishing problem that hinders the network segmenting small objects. In a most recent study, Lin et al. [24] attached the transformer blocks to the encoder and decoder paths of the UNet network to model the long-range contextual information in input images. As a result, they obtained better segmentation accuracy than other Unet variants such as Unet or Unet++ networks. Lu et al. [25] simplified the Unet network by taking advantage of full-scale fusion, Ghosh modules, and the unification of channel numbers. They showed that their network, namely, Half-UNet, had similar segmentation performance compared with the UNet and its variants, but was simpler by reducing the network parameters and number of floating-point operations.
In a study by Vakanski et al. [26], the performance of the UNet network was enhanced by combining the input image with a salient map through an attention-based module. In contrast to other studies that segment objects using a single input image, Vakanski et al. [26] used an additional input, i.e., a salient map that is obtained from the input image using some handcrafted-based segmentation methods. This salient map, therefore, can be used as an approximation of the segmentation of target object. Although the salient map contains segmentation error, it can be used as a prior knowledge of experts about the object and its characteristics. With the salient map, they designed an attention module that enables to incorporate the information in the salient maps with feature maps in UNet network, to enhance the segmentation performance of a conventional UNet network. Through experiments, they showed that the use of salient map and attention mechanism are efficient for enhancing segmentation performance compared to conventional UNet network. However, this method is not clear with regard to obtaining the salient maps and it mainly depends on the knowledge of experts when designing the system.
Although these UNet-based network architectures have been successfully applied to various medical image segmentation problems, the segmentation performance is still limited. In addition, the most important requirement for a medical image processing system is for consistently high performance. Therefore, in this study, we propose an enhancement of the UNet network for the medical image segmentation problem. Our proposed method is applied to thyroid nodule segmentation to enhance the segmentation performance. Our proposed method has four novel elements compared to previous studies:
- -
- We propose the use of a sequential nested architecture of suggestion and enhancement networks to increase the performance of thyroid nodule segmentation.
- -
- Our proposed method uses an enhanced UNet-based network (suggestion network) to learn a rough salient map of thyroid nodules from the input ultrasound image.
- -
- An additional enhanced UNet-based network with an associated attention module (enhancement network) is proposed to increase the performance of the suggestion network.
- -
- We make our pretrained model for thyroid nodule segmentation public to allow other researchers to use it in their studies [27].

Table 1.
Summary of medical image segmentation method in previous studies and our approach.
| Categories | Segmentation Method | Strengths | Weaknesses |
|---|---|---|---|
| Conventional segmentation methods | Graph-based method [10]. |
| Low accuracy |
| Active contour method [11]. | |||
| Deep learning-based segmentation methods | UNet network [12]. |
| Optimal depth of network is unknown |
| Residual UNet-based network [20]. |
| ||
| UNet++ network [21]. |
| Longer training time due to the complexity of architecture | |
| UNet 3+ network [22] |
| ||
| Connected-UNets [23] |
| ||
| UNet with Transformer blocks [24] |
| ||
| Simplified UNet (Half-UNet network) [25] |
| Segmentation accuracy is not better than UNet and its variants | |
| Attention-based UNet network [26] |
| Salient map is learned using complex method | |
| Suggestion and enhancement networks (proposed method) |
| Takes long time to train and inference |
3. Proposed Segmentation Method
In this section, we present a detailed description of our proposed approach for thyroid nodule segmentation.
3.1. Overall Segmentation Netowork Architecture
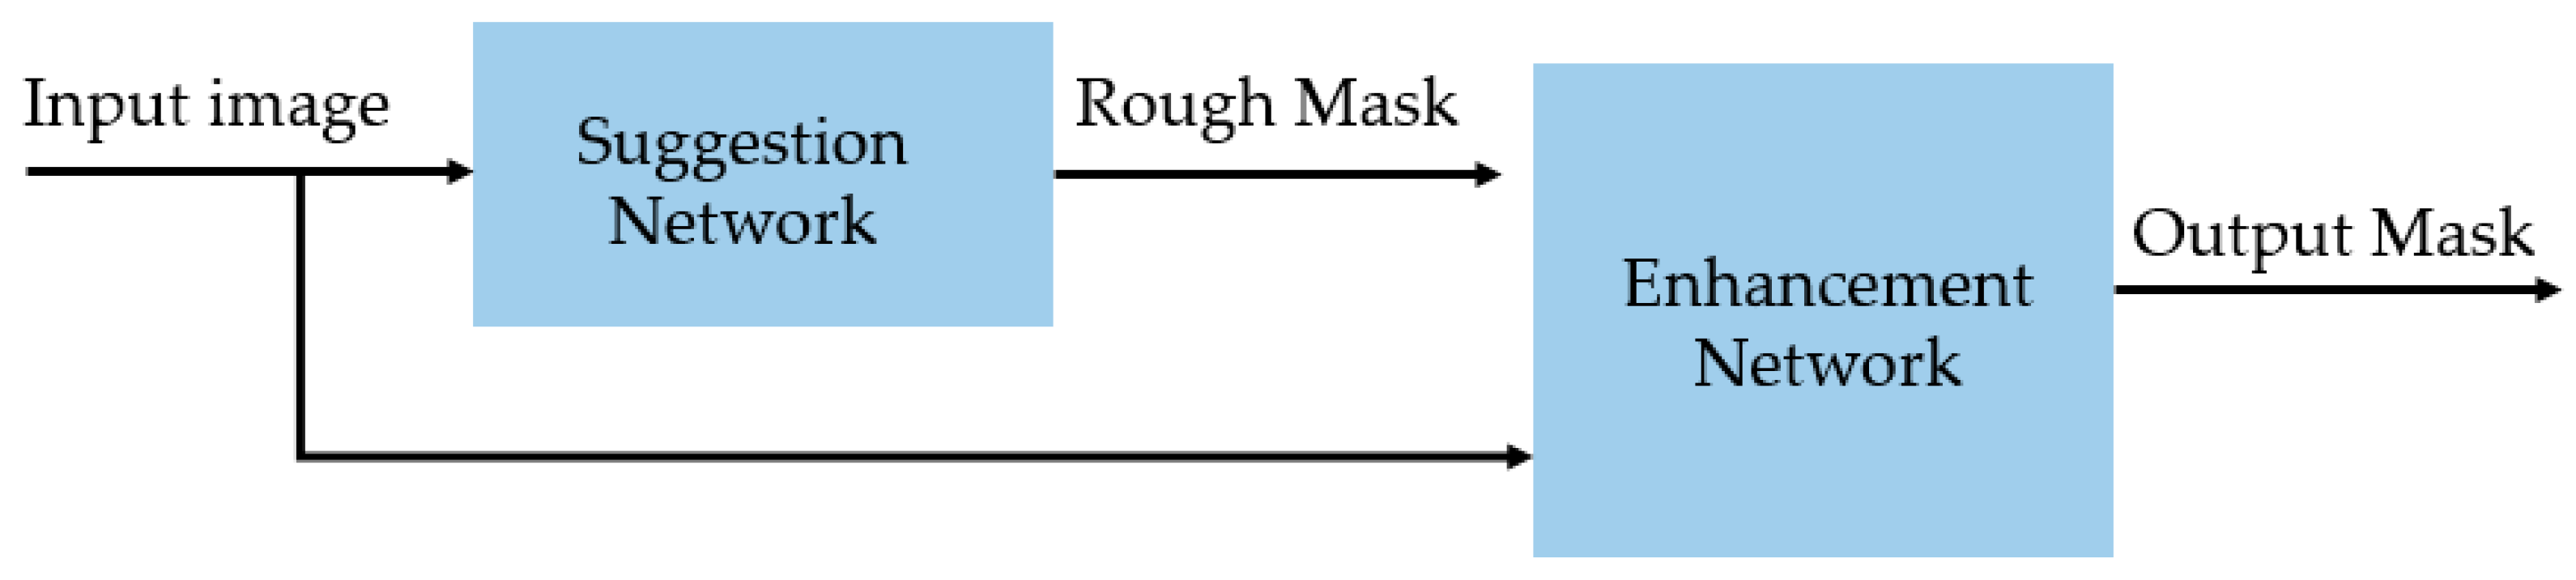
Our proposed method is depicted in Figure 2, which consists of two components. First, we used a suggestion network (SN) to learn a rough segmentation mask for the input image. We call this map a ‘salient map’ for convenience. We designed an SN as a UNet-based network architecture in our study. To enhance the performance of the SN, we used an additional network, i.e., an enhancement network (EN), as the postprocessing network after the SN. This EN was responsible for enhancing the segmentation performance of the SN by combining the output of the SN with the input image using another segmentation network. A description of the SN and EN is provided in Section 3.2 and Section 3.3, respectively.
3.2. Suggestion Network
Previous studies on segmentation networks were mainly based on an auto encoder–decoder architecture [12,20,21], whereby two neural networks are used: an encoder and a decoder network. The encoder network is designed in a manner similar to a CNN network that is responsible for learning the useful features of the input image. The decoder network performs the inverse operation to the encoder network to create the output image. The encoder and decoder are connected to form a concrete network termed a U-shaped network. In this study, the proposed network was also designed on the basis of the UNet network architecture, as outlined in Section 3.1.
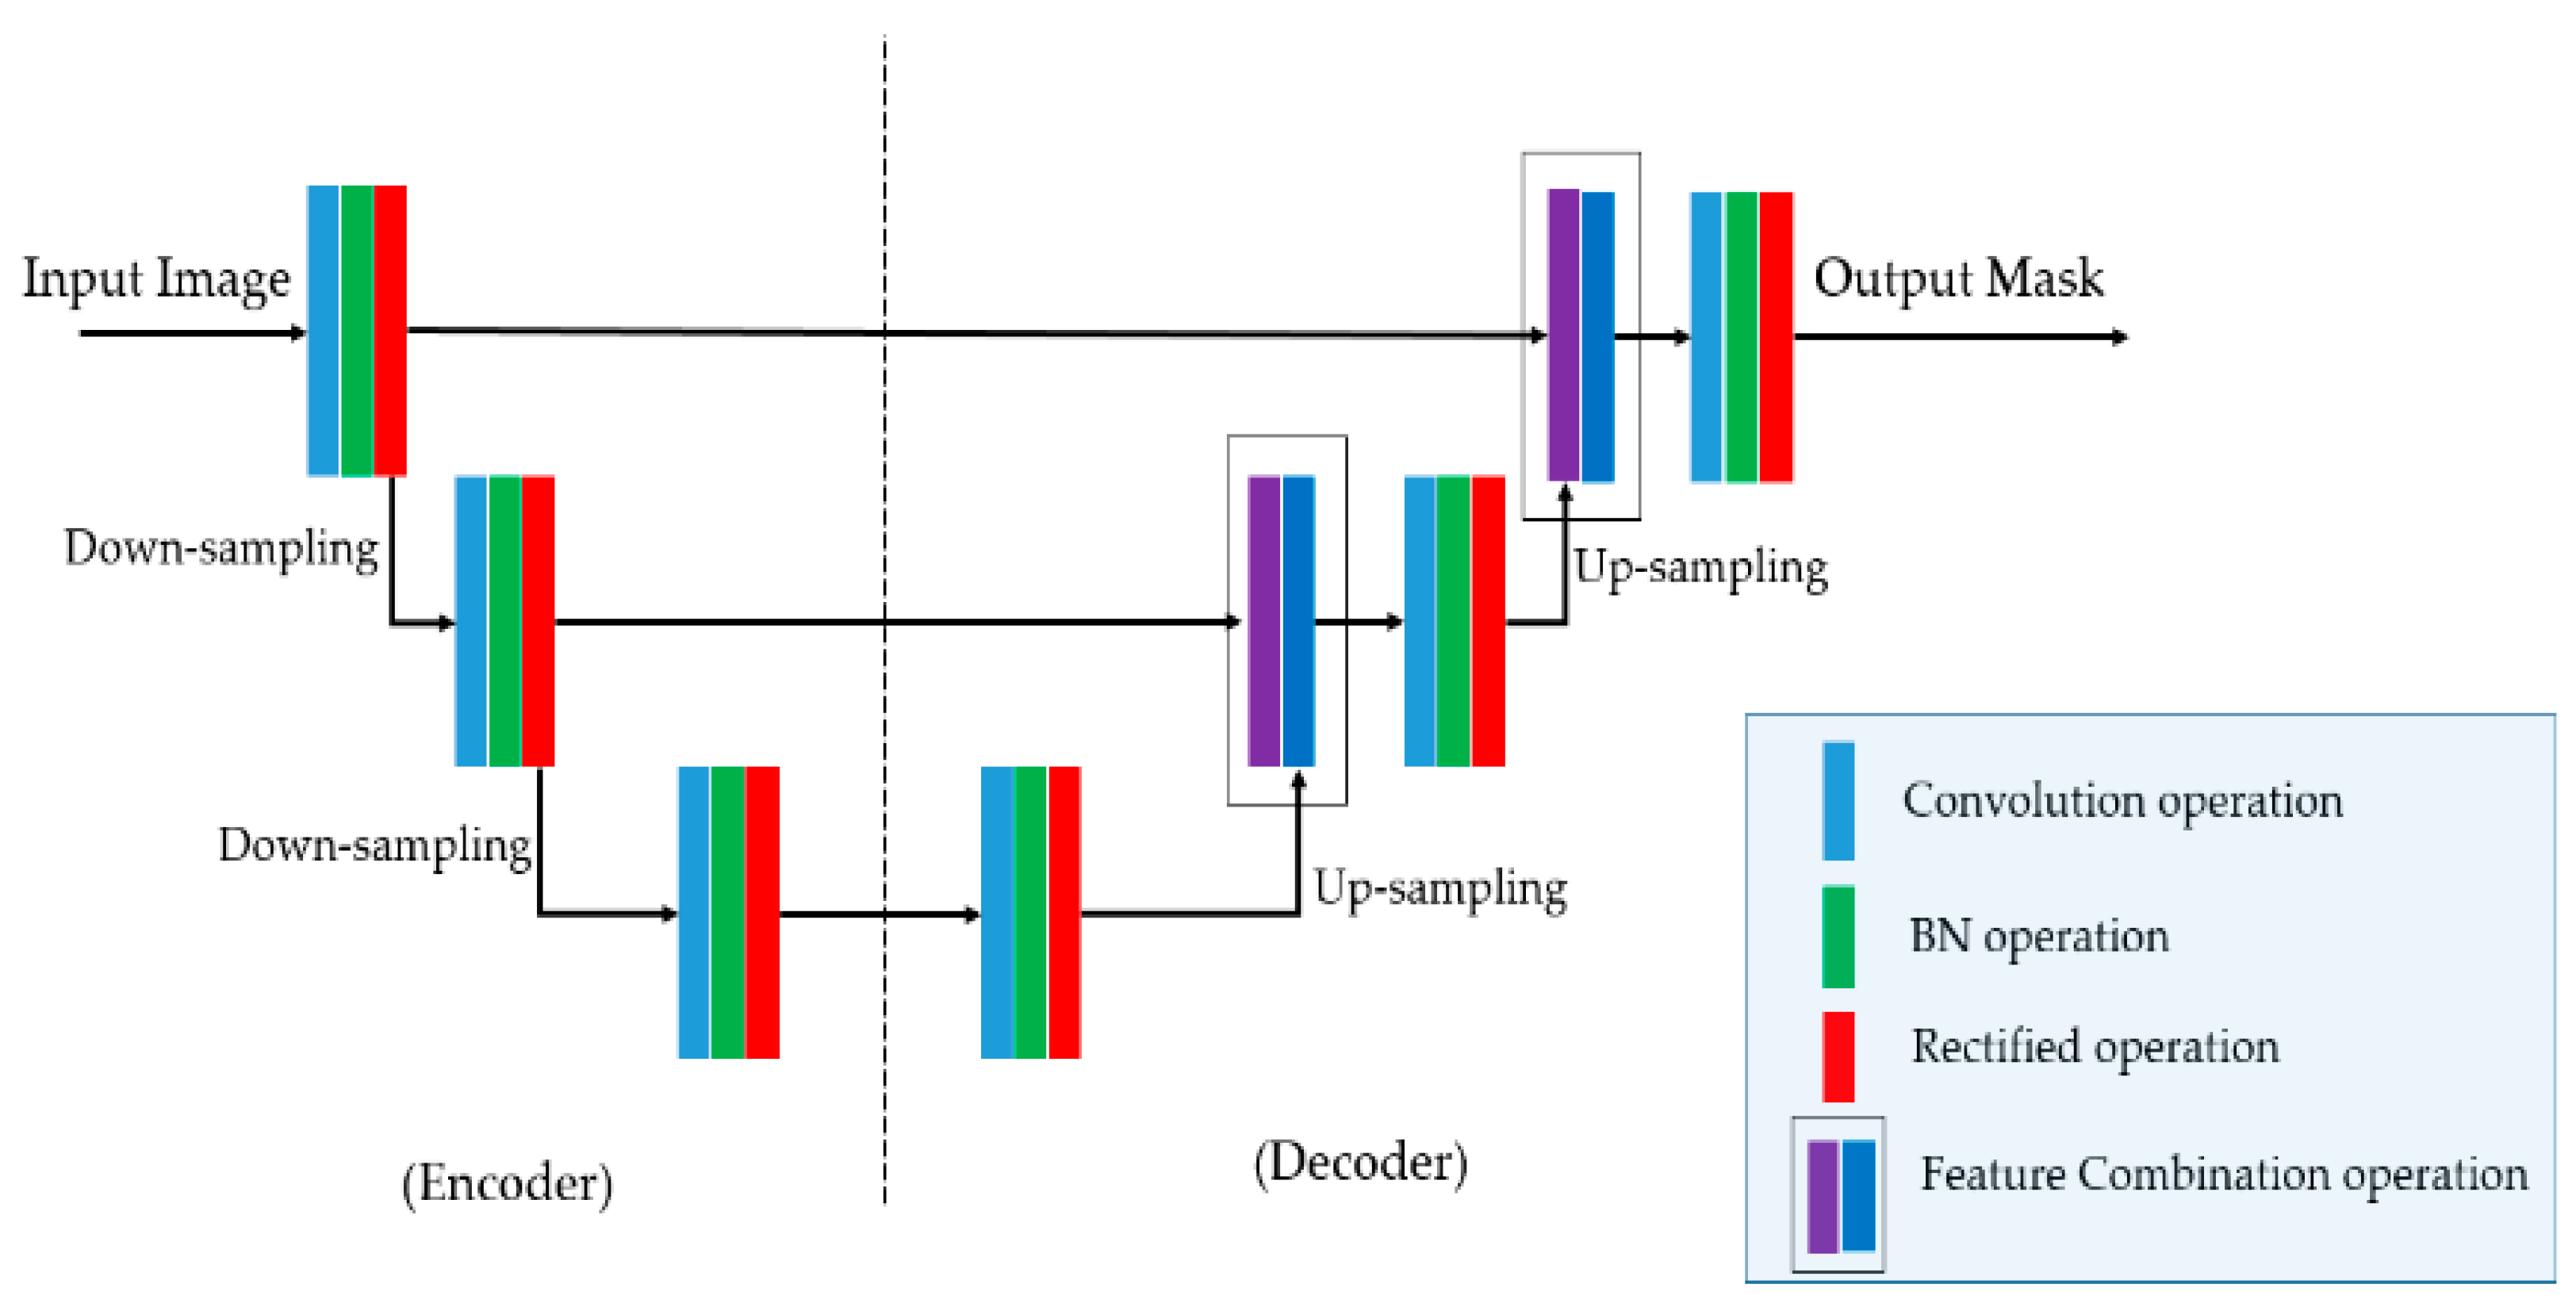
Although a deep Unet-shaped network is efficient for extracting deep features from the input image, it contains too many network parameters and a high abstract level of extracted features. As a result, it is difficult to train the network, especially for the segmentation of small objects/lesions. To enhance the segmentation performance of the conventional UNet network for the thyroid nodule segmentation, we propose an SN based on UNet architecture that uses a reduced number of filters and network depth, as shown in Figure 3. In this figure, BN indicates the batch normalization operation. In detail, we used three scales of feature maps in our SN, which is lower than that of the conventional UNet network (conventional UNet uses five scales of feature maps). With this modification, our SN was easier to train and more efficient for small object-segmentation problems.
3.3. Enhancement Network
The auto encoder–decoder has a significant drawback, i.e., the optimal depth of the network is unknown [21]. In addition, the use of multiscale features causes the underuse of information because the low- and high-level features are concatenated directly in the decoder [28]. To overcome these problems, nesting-based or attention-based segmentation networks have been proposed [21,26,28]. However, previous studies only focused on either nesting or attention approaches. In this study, we propose an enhancement of the conventional UNet network by utilizing both the nesting and the attention approaches in a single network.
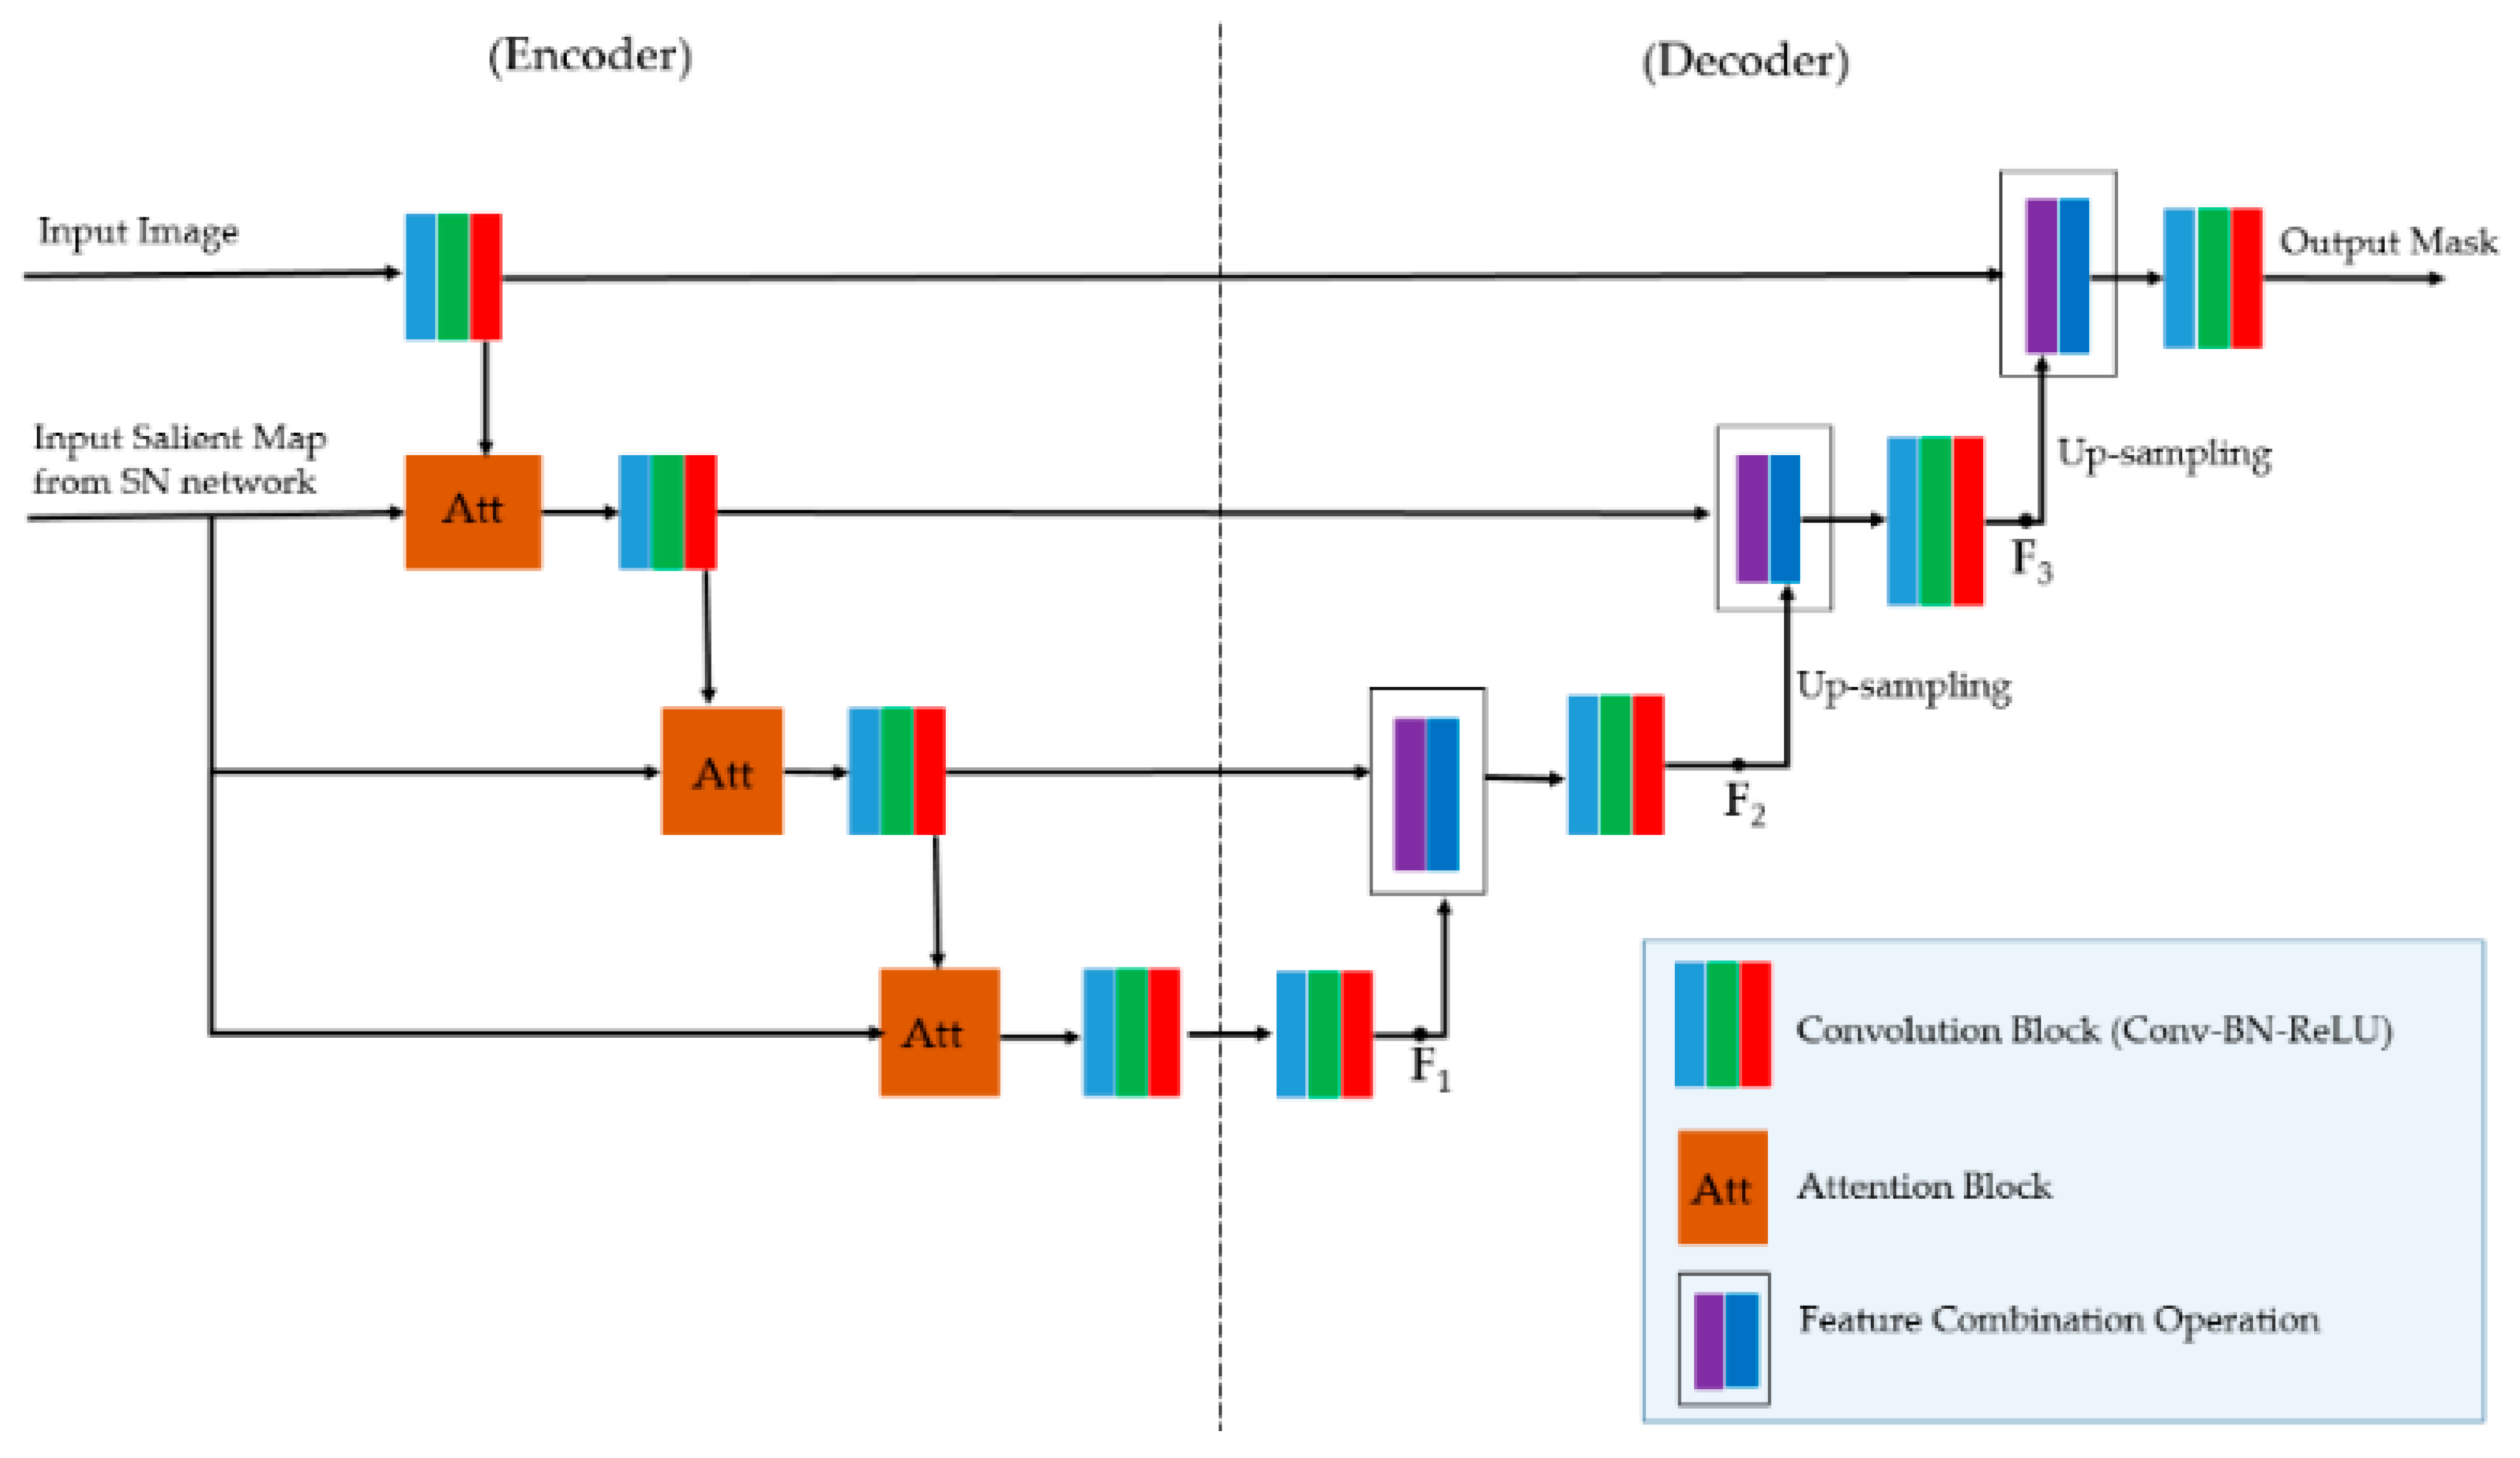
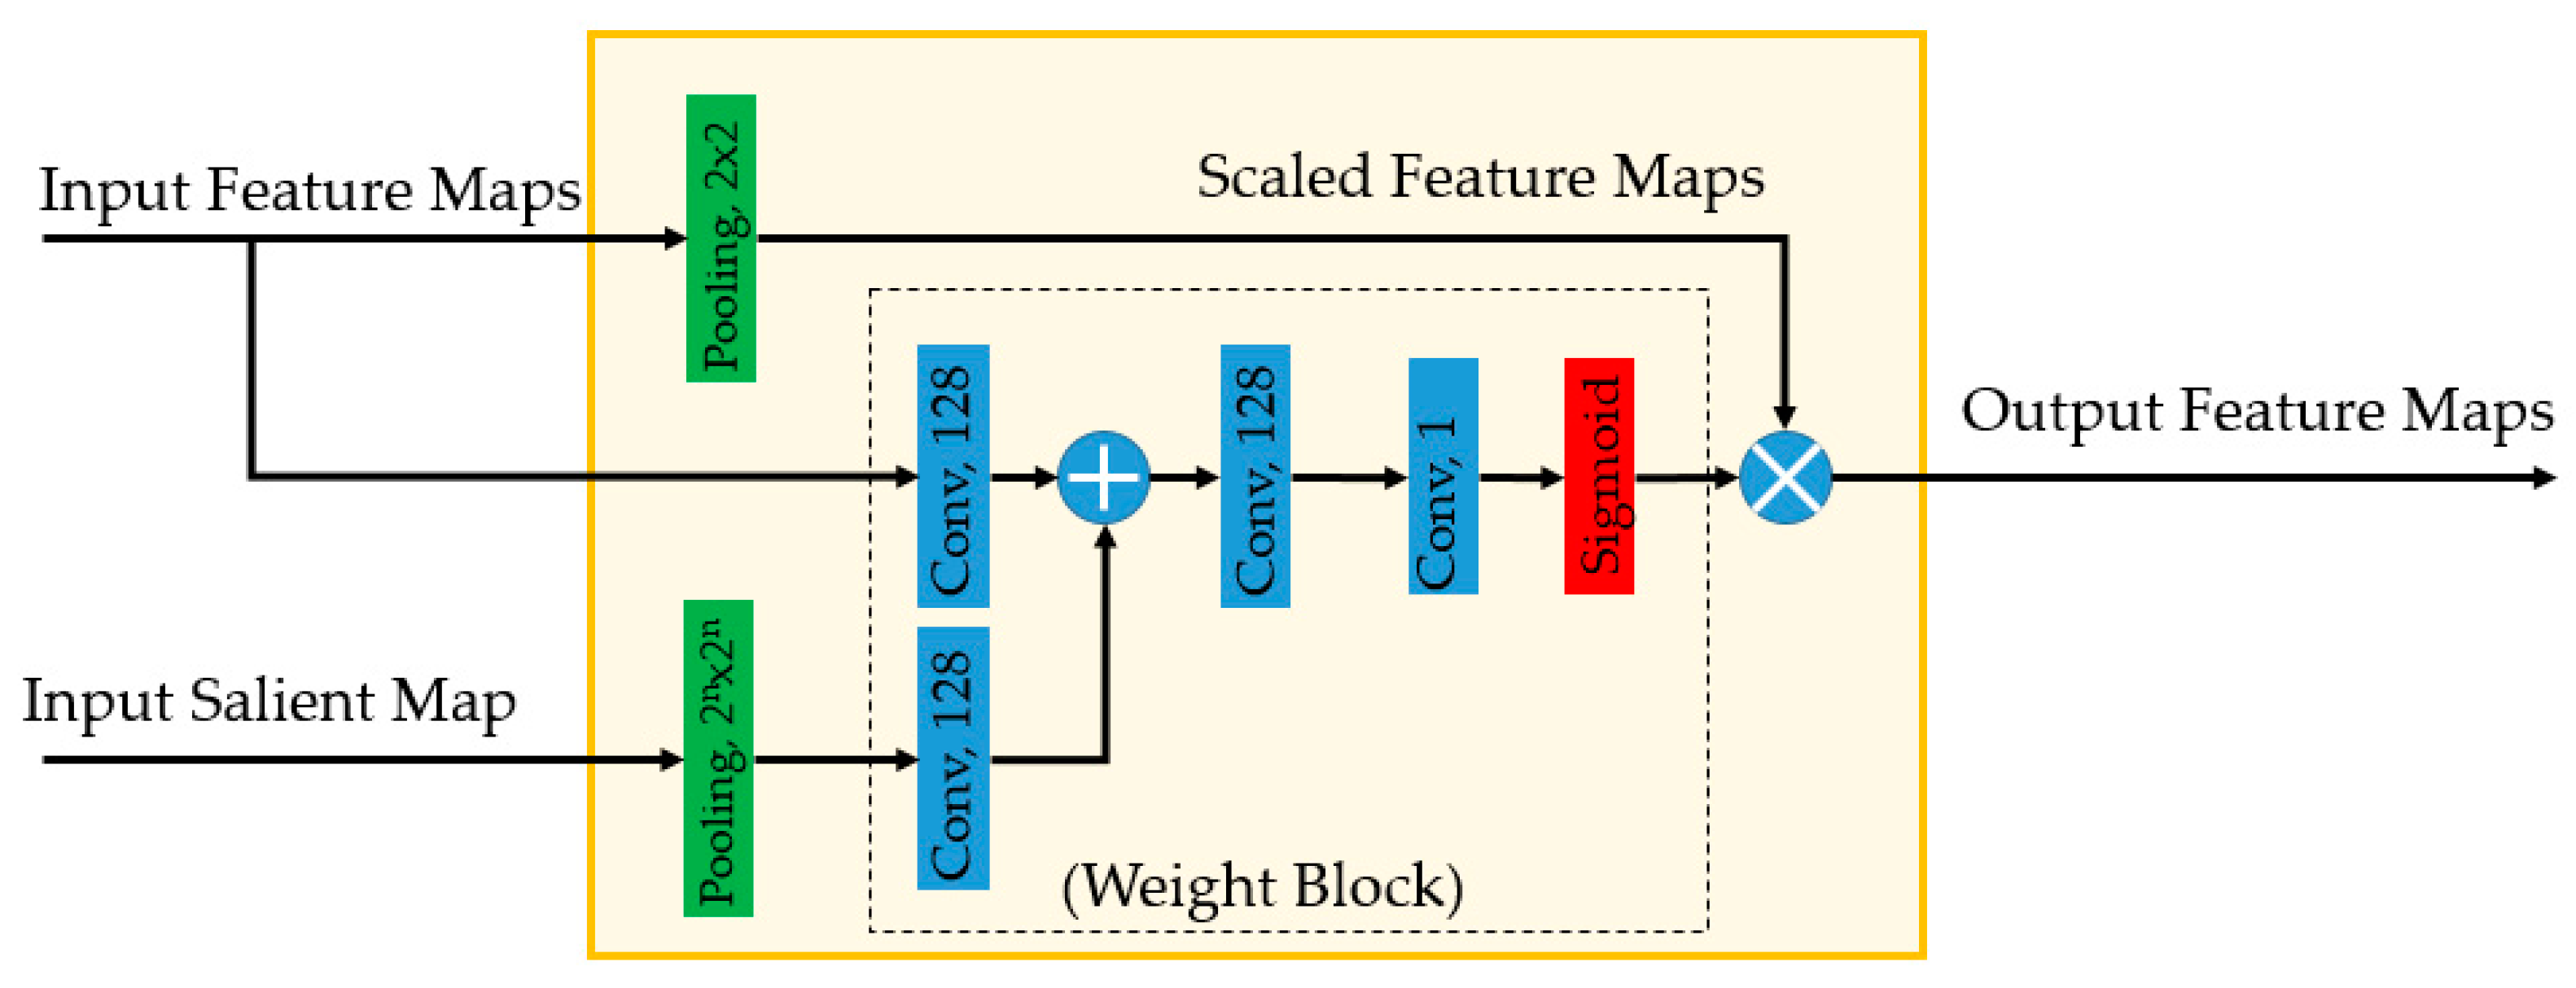
Using an SN, we obtained a ‘salient map’ appropriate for the target image. Because of the limitations of conventional UNet-based networks, this salient map was not optimum. We, therefore, used the approach proposed by Vakanski et al. [26] to combine the salient map with a UNet-based network to construct an EN. In Figure 4, we depict the conceptual architecture of an EN. Essentially, the EN is based on UNet network, but it contains additional modules, namely, attention blocks (‘Att’ in Figure 4) to fuse the information of the salient map with intermediate feature maps in a UNet-based network. The attention module is designed to make the segmentation network focus on particular areas of the input image using the input salient map, as shown in Figure 5.
As shown in Figure 4, we used attention model at three parts of the enhancement network to combine the information of the salient maps with internal feature maps of UNet-based network. The structure of the attention module is presented in Figure 5. All three attention models used in Figure 4 have the same architecture as shown in Figure 5, but the weights (attention module’s parameters) are different as they are used at different scale of enhancement network. As shown in Figure 5, the attention module has the responsibility of learning the important spatial information of the input feature maps by learning a weight matrix for every pixel in the input feature maps using the input salient map. In details, suppose we have an input feature maps with size of (2 m) × (2 n) × K and the salient map with the shape of (H × W × D). By using the attention model, we first obtain a reduced-size feature maps with shape of m × n × K using the pooling operator (scaled feature maps in Figure 5). In addition, we obtain a weight matrix of m × n × 1 using the weight block based on convolution operation, addition, and sigmoid activation function (the dashed box in Figure 5). Finally, the output of the attention model is obtained by weighting the scaled feature maps with the weight matrix to evaluate the importance of every pixel in the input feature maps. Therefore, the attention module is not a channel attention but a spatial attention. In this way, the attention module helps the segmentation network pay more attention (focuses) to some particular spatial regions than other regions in the input image, based on the input salient maps.
3.4. Loss Function
The dice loss function was shown to be more efficient for training a deep learning-based segmentation network than the cross-entropy loss [29,30]. Therefore, we used the dice loss function to train our proposed network in our study. The dice score (DSC) and dice loss (DSC_LOSS) functions are defined by Equations (1) and (2) [30] as follows:
where “” indicates the intersection between two binary sets, i.e., X is the label object mask and Y is the estimation (prediction) of X; and indicate the size of these two sets. The dice loss function is the complement of the dice score, which is the statistical measurement of the similarity degree of the X and Y sets. By using the dice loss function, we learned to maximize the intersection of two sets, which is also the purpose of the segmentation problem.
DSC_LOSS = 1.0 − DSC(X, Y),
4. Results and Analysis
4.1. Experimental Datasets
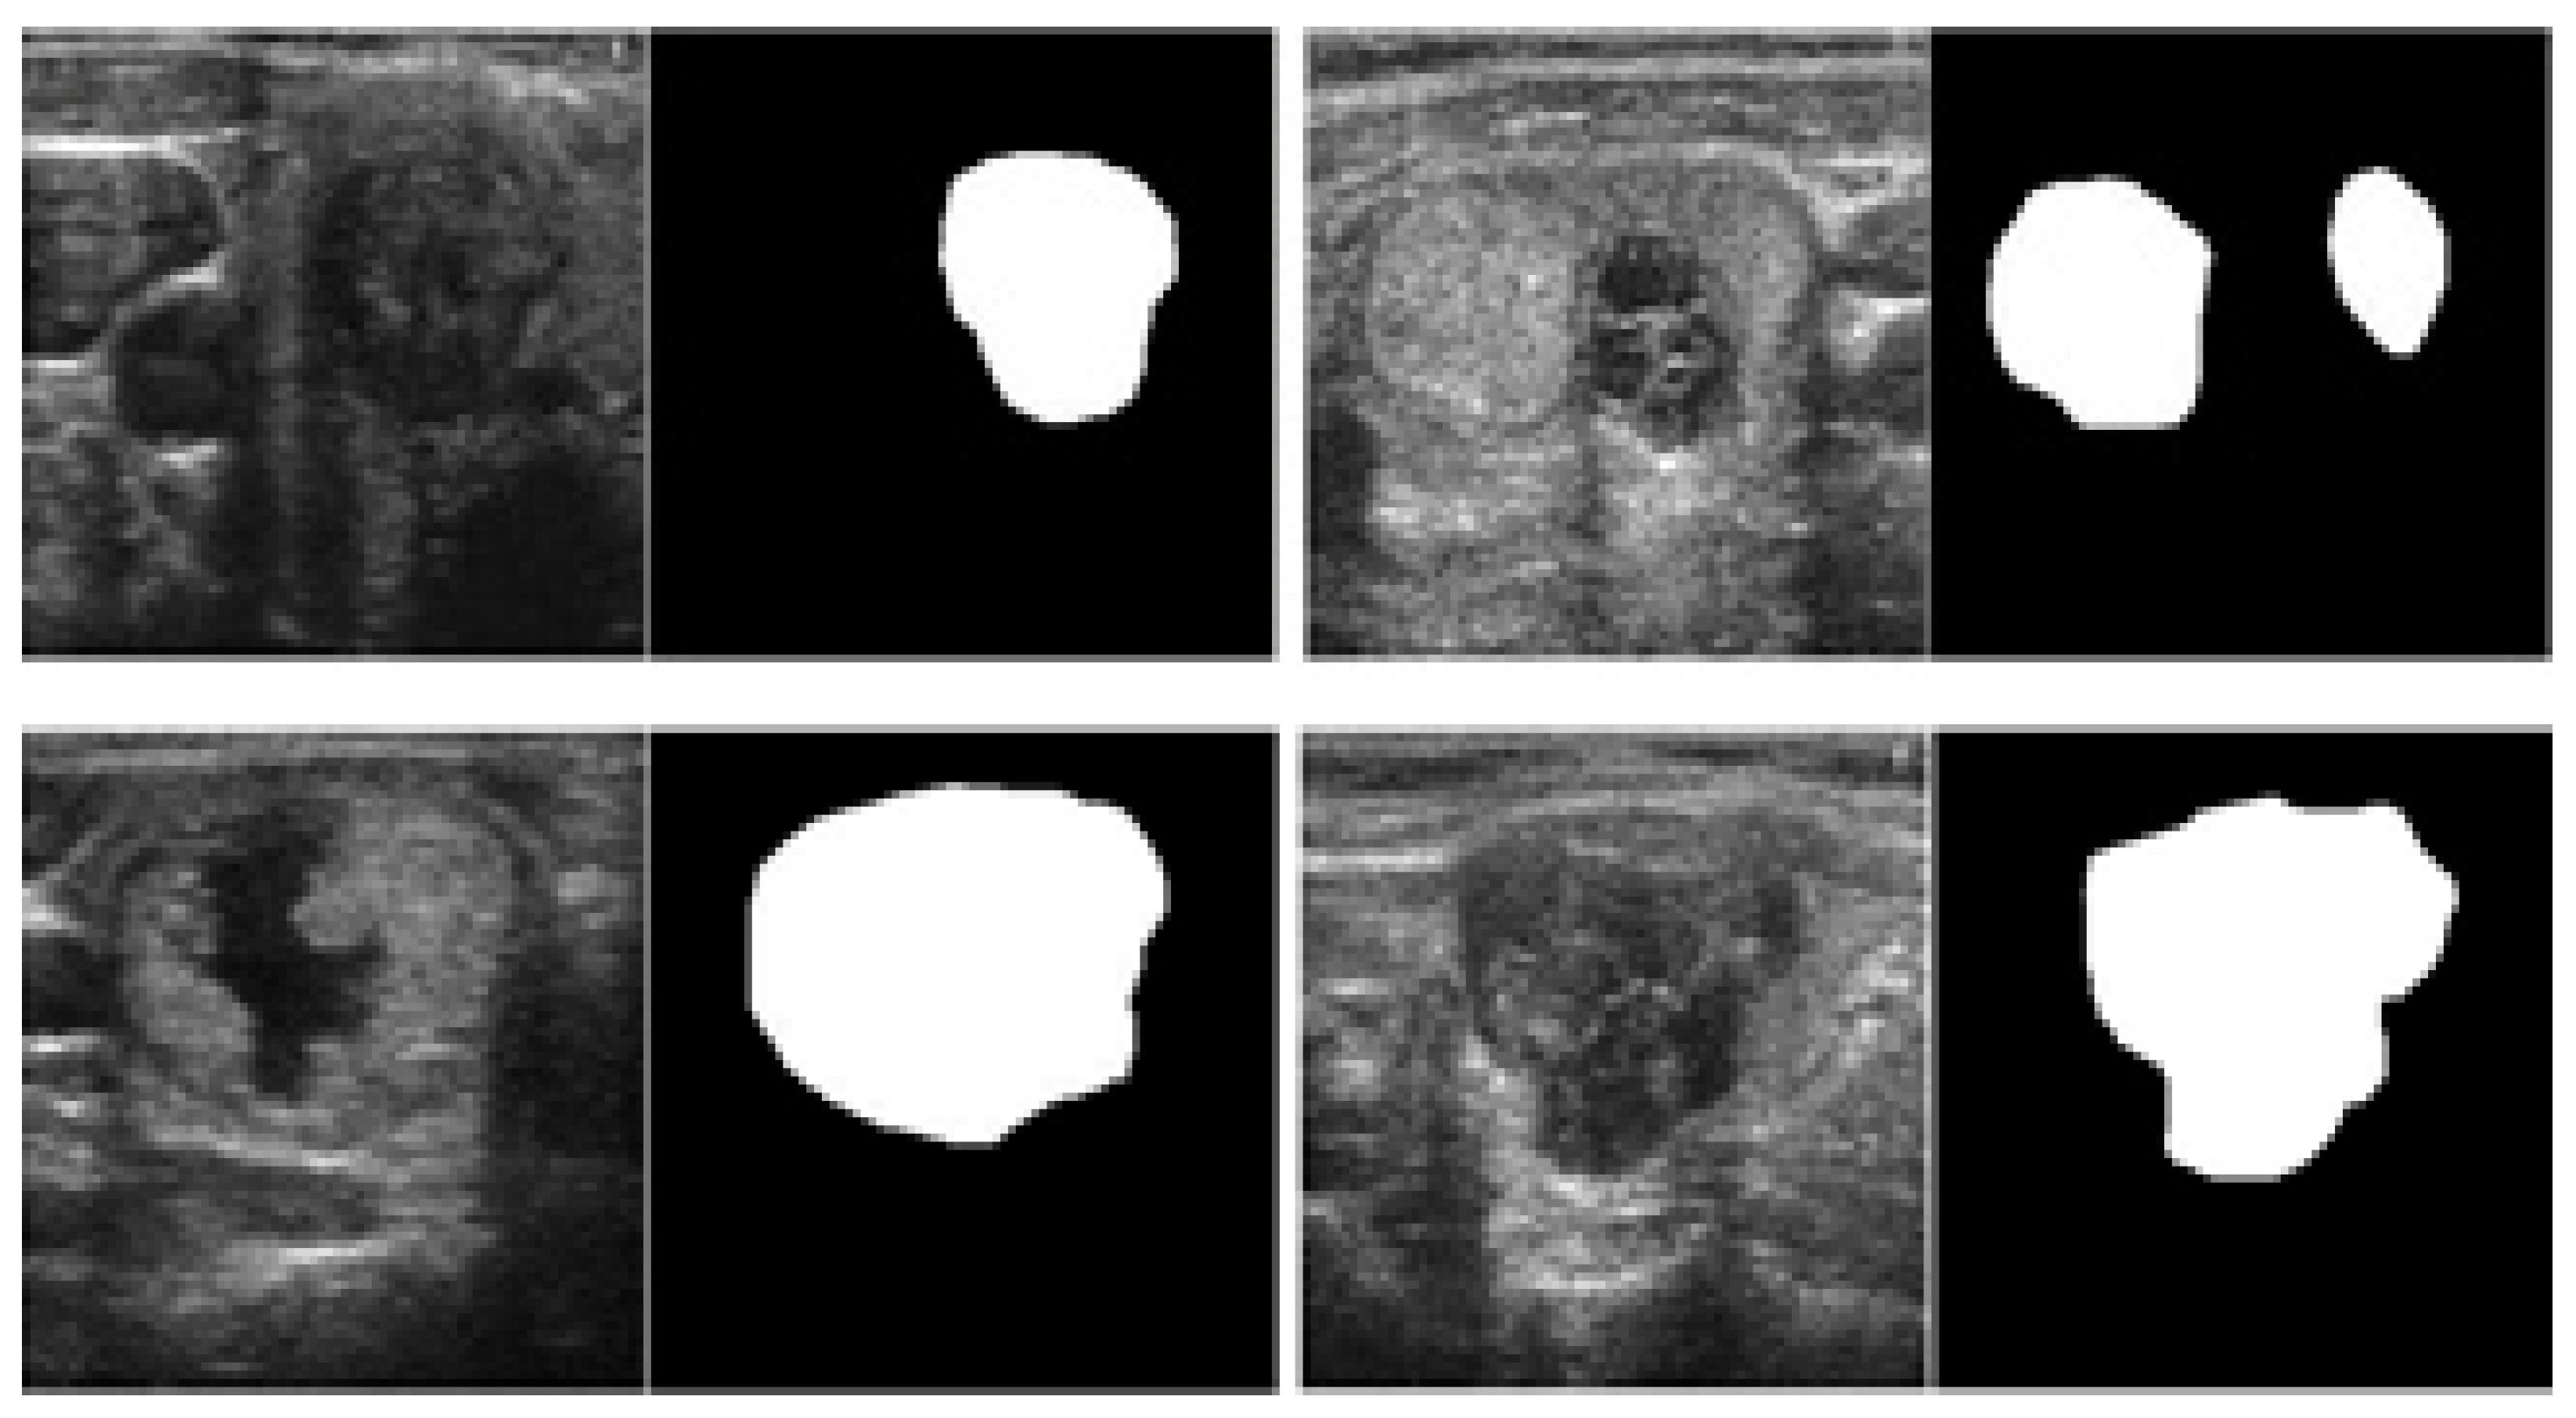
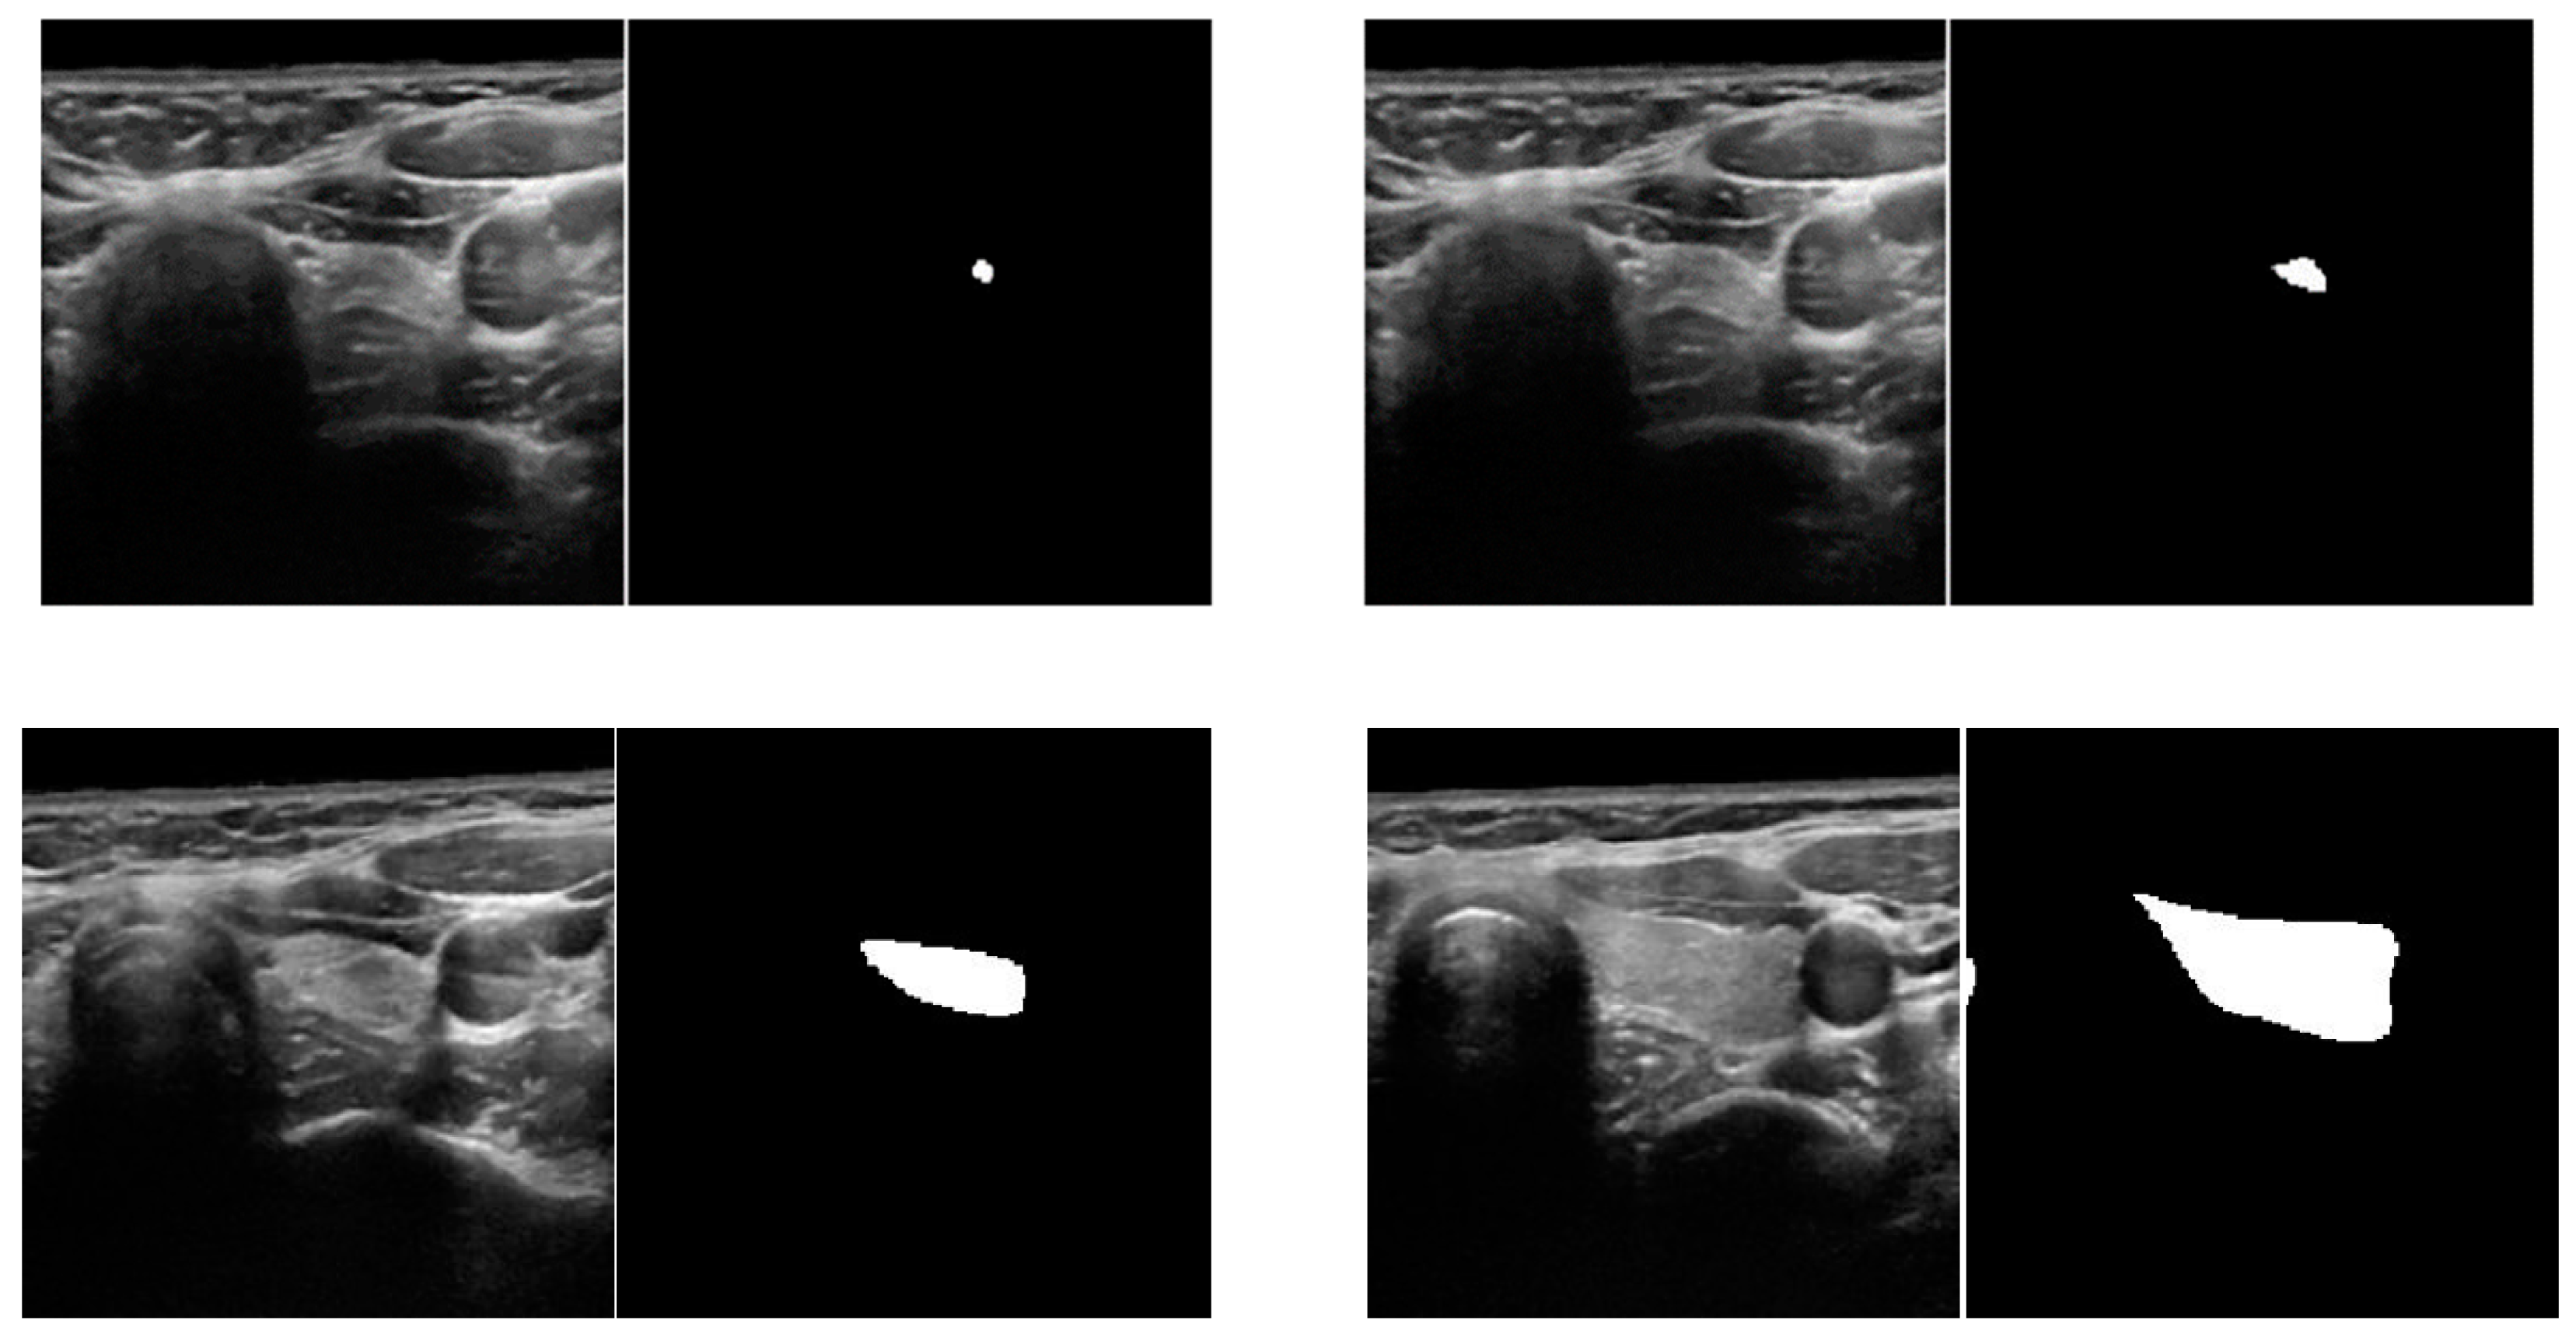
We used two open (public) datasets, the TDID [31] and 3DThyroid [32], to examine the thyroid lesion segmentation problem. The TDID dataset was released by Pedraza et al. [31] that is designed for the purpose of thyroid nodule classification. However, the authors also provided a rough segmentation of thyroid regions that can be used for segmentation purposes. In total, this dataset contains images from 298 persons, including both benign and malignant cases, with ground-truth identification of thyroid regions made by radiologists. Table 2 provides detailed information of the TDID dataset with some example images shown in Figure 6. The 3DThyroid dataset was released by Wunderling et al. [32] and designed for thyroid region segmentation with a total of 16 3D image volumes. Table 3 contains detailed information on the 3DThyroid dataset. Examples of 2D images extracted from this dataset are shown in Figure 7. The TDID and 3DThyroid can be freely used for academic purposes according to the instructions of dataset providers. Therefore, our research is exempt for the approvals from a review board for the experiments with human subjects.
We performed a fivefold cross-validation procedure to measure the segmentation performance of our proposed method with the TDID dataset. For the 3DThyroid dataset, we performed the leave-one-out cross-validation procedure that was also used by Wunderling et al. [32] in their experiment. In addition, because the study by Wunderling et al. [31] used semi-auto segmentation methods, i.e., their method requires the help of expert radiologists to initialize the thyroid region and adjust segmentation results, they only considered slices of 3D volume that contained thyroid regions for segmentation. For a fair comparison, we also only used these images in our experiments. In addition, we used the Tensorflow library [33] to code the neural network.
4.2. Training of Proposed Networks
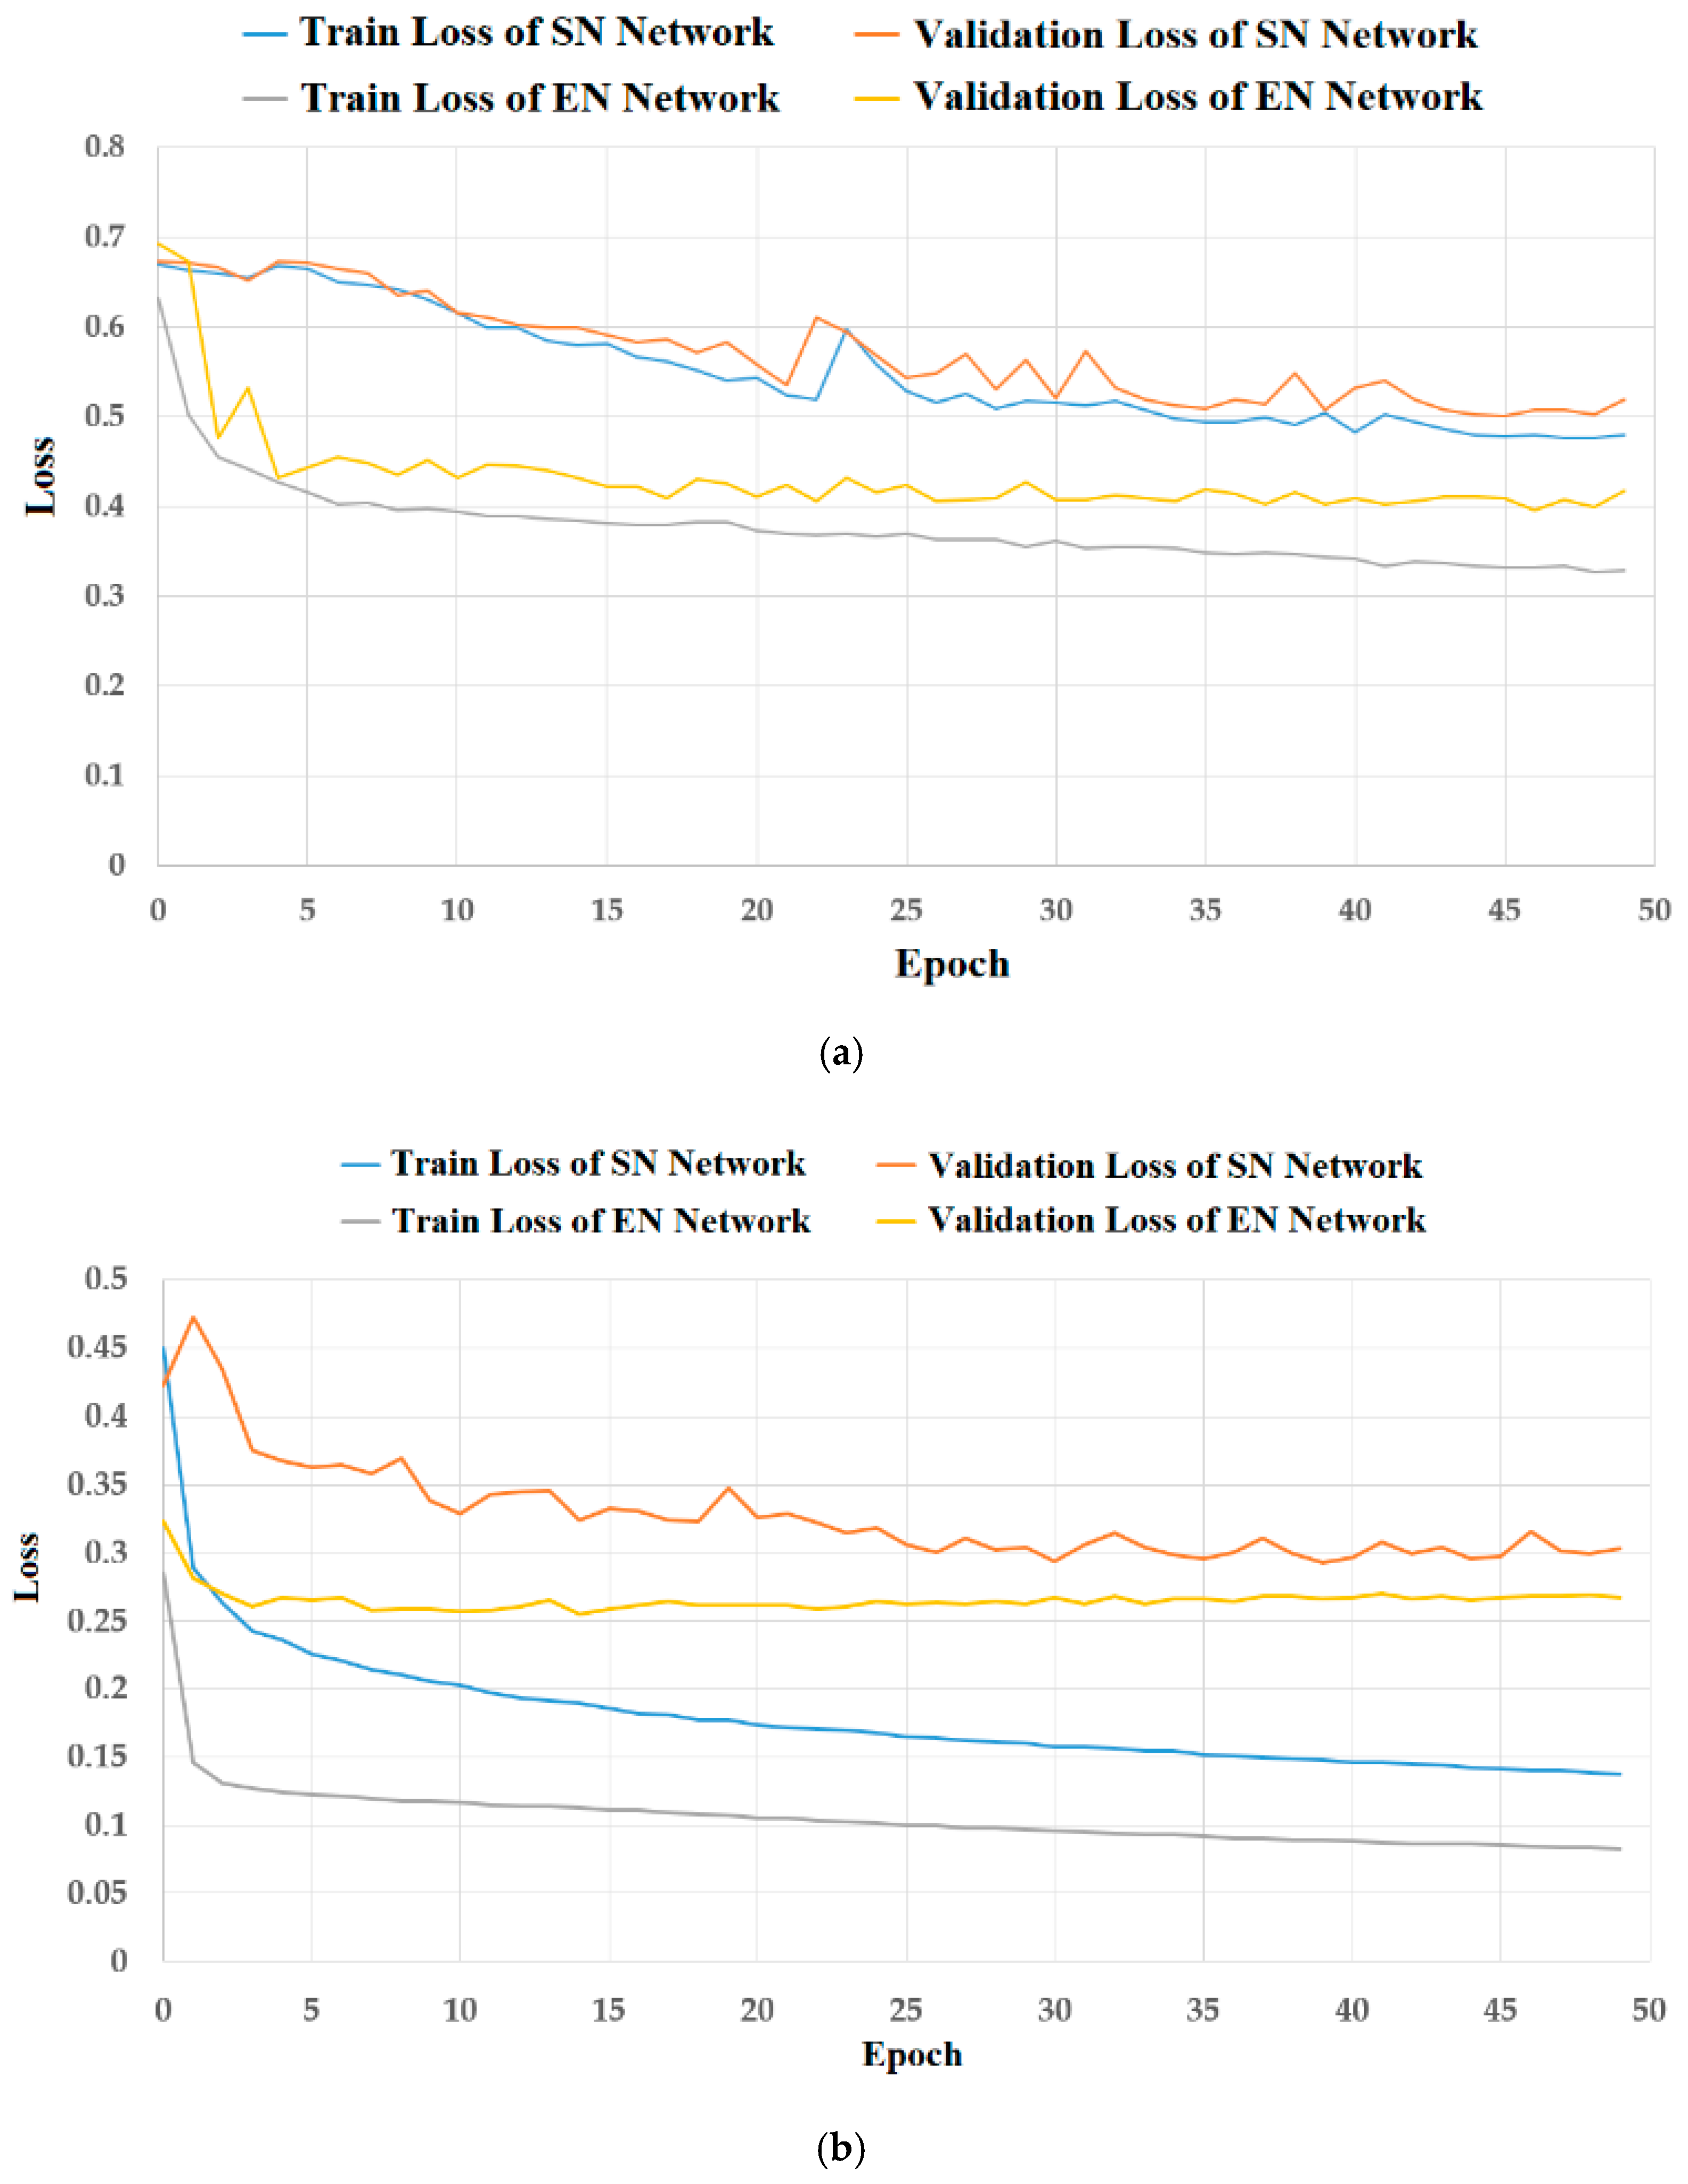
In our first experiment, we trained our segmentation network using the TDID and 3DThyroid datasets. We trained the SN and EN separately as we used an attention-based approach that requires a rough estimation of the lesion region on salient maps. The training parameters are listed in Table 4. We show the results of the training process in Figure 8. In this figure, four loss curves of the training and validation in two cases are shown: the cases of using a single SN (blue and orange curves) and the cases of using an EN (gray and yellow curves). We can see that the SN was difficult to train as the loss for both training and validation sets was still high with the TDID dataset (as shown in Figure 8a). This is because the TDID dataset contains thyroid regions with disease that cause a large variation of pixel brightness in the thyroid region. However, EN strongly helped to reduce the loss of both the training and validation sets. This indicates that our method is more effective than the SN in training the segmentation network.
Figure 8b shows that the SN was successfully trained by presenting a loss curve approaching zero in both the training and the validation sets of the 3DThyroid dataset. Subsequently, the results of the SN were even further enhanced using the EN. The training and validation loss curves produced using the EN were far below the training and validation loss curves of the SN. These results show that the EN was easier to train than the SN, which is a UNet-based network. It also helped to reduce errors in the validation set, which could later lead to a reduced error in the real-world testing phases using the testing dataset. Furthermore, the convergence of training losses shows that our segmentation networks were sufficiently trained using the training dataset, whereas that of the validation losses shows that the trained segmentation models were not overfitted.
4.2.1. Analyses of Model Overfitting
We used two public datasets to evaluate the performance of our proposed method. Between the two, the TDID is a smaller dataset with a total of 298 images, and the 3DThyroid is a larger dataset with a total of 15,254 images, as shown in Table 2 and Table 3. The weakness of the 3DThyroid dataset is that it contains 3D volumes instead of individual images. Therefore, the images in a 3D volume of the 3DThyroid dataset exhibit high similarity, and the size of nodule is varied according to the scanning position of the thyroid organ as shown in the Figure 7. The lack of data for training is a common problem with the deep learning method, especially the medical image processing systems. To solve this problem, we adopt the data augmentation, and detailed explanations of this are included in the next subsection. Although we tried to find other public datasets for evaluating our method, we only found the TDID and 3DThyroid datasets which are available for researchers. As shown in Figure 8, we can see that the difference between the training and validation loss of the SN was small (approximately 0.021 with the TDID dataset and 0.148 with the 3DThyroid dataset). With the EN, the difference is also small (approximately 0.057 with the TDID dataset and 0.159 with the 3DThyroid dataset). In addition, we can see from this figure that our proposed method helps to reduce the losses of both training and validation sets. Therefore, we think that our proposed network not only helps to increase the segmentation performance, but also reduces the overfitting problem.
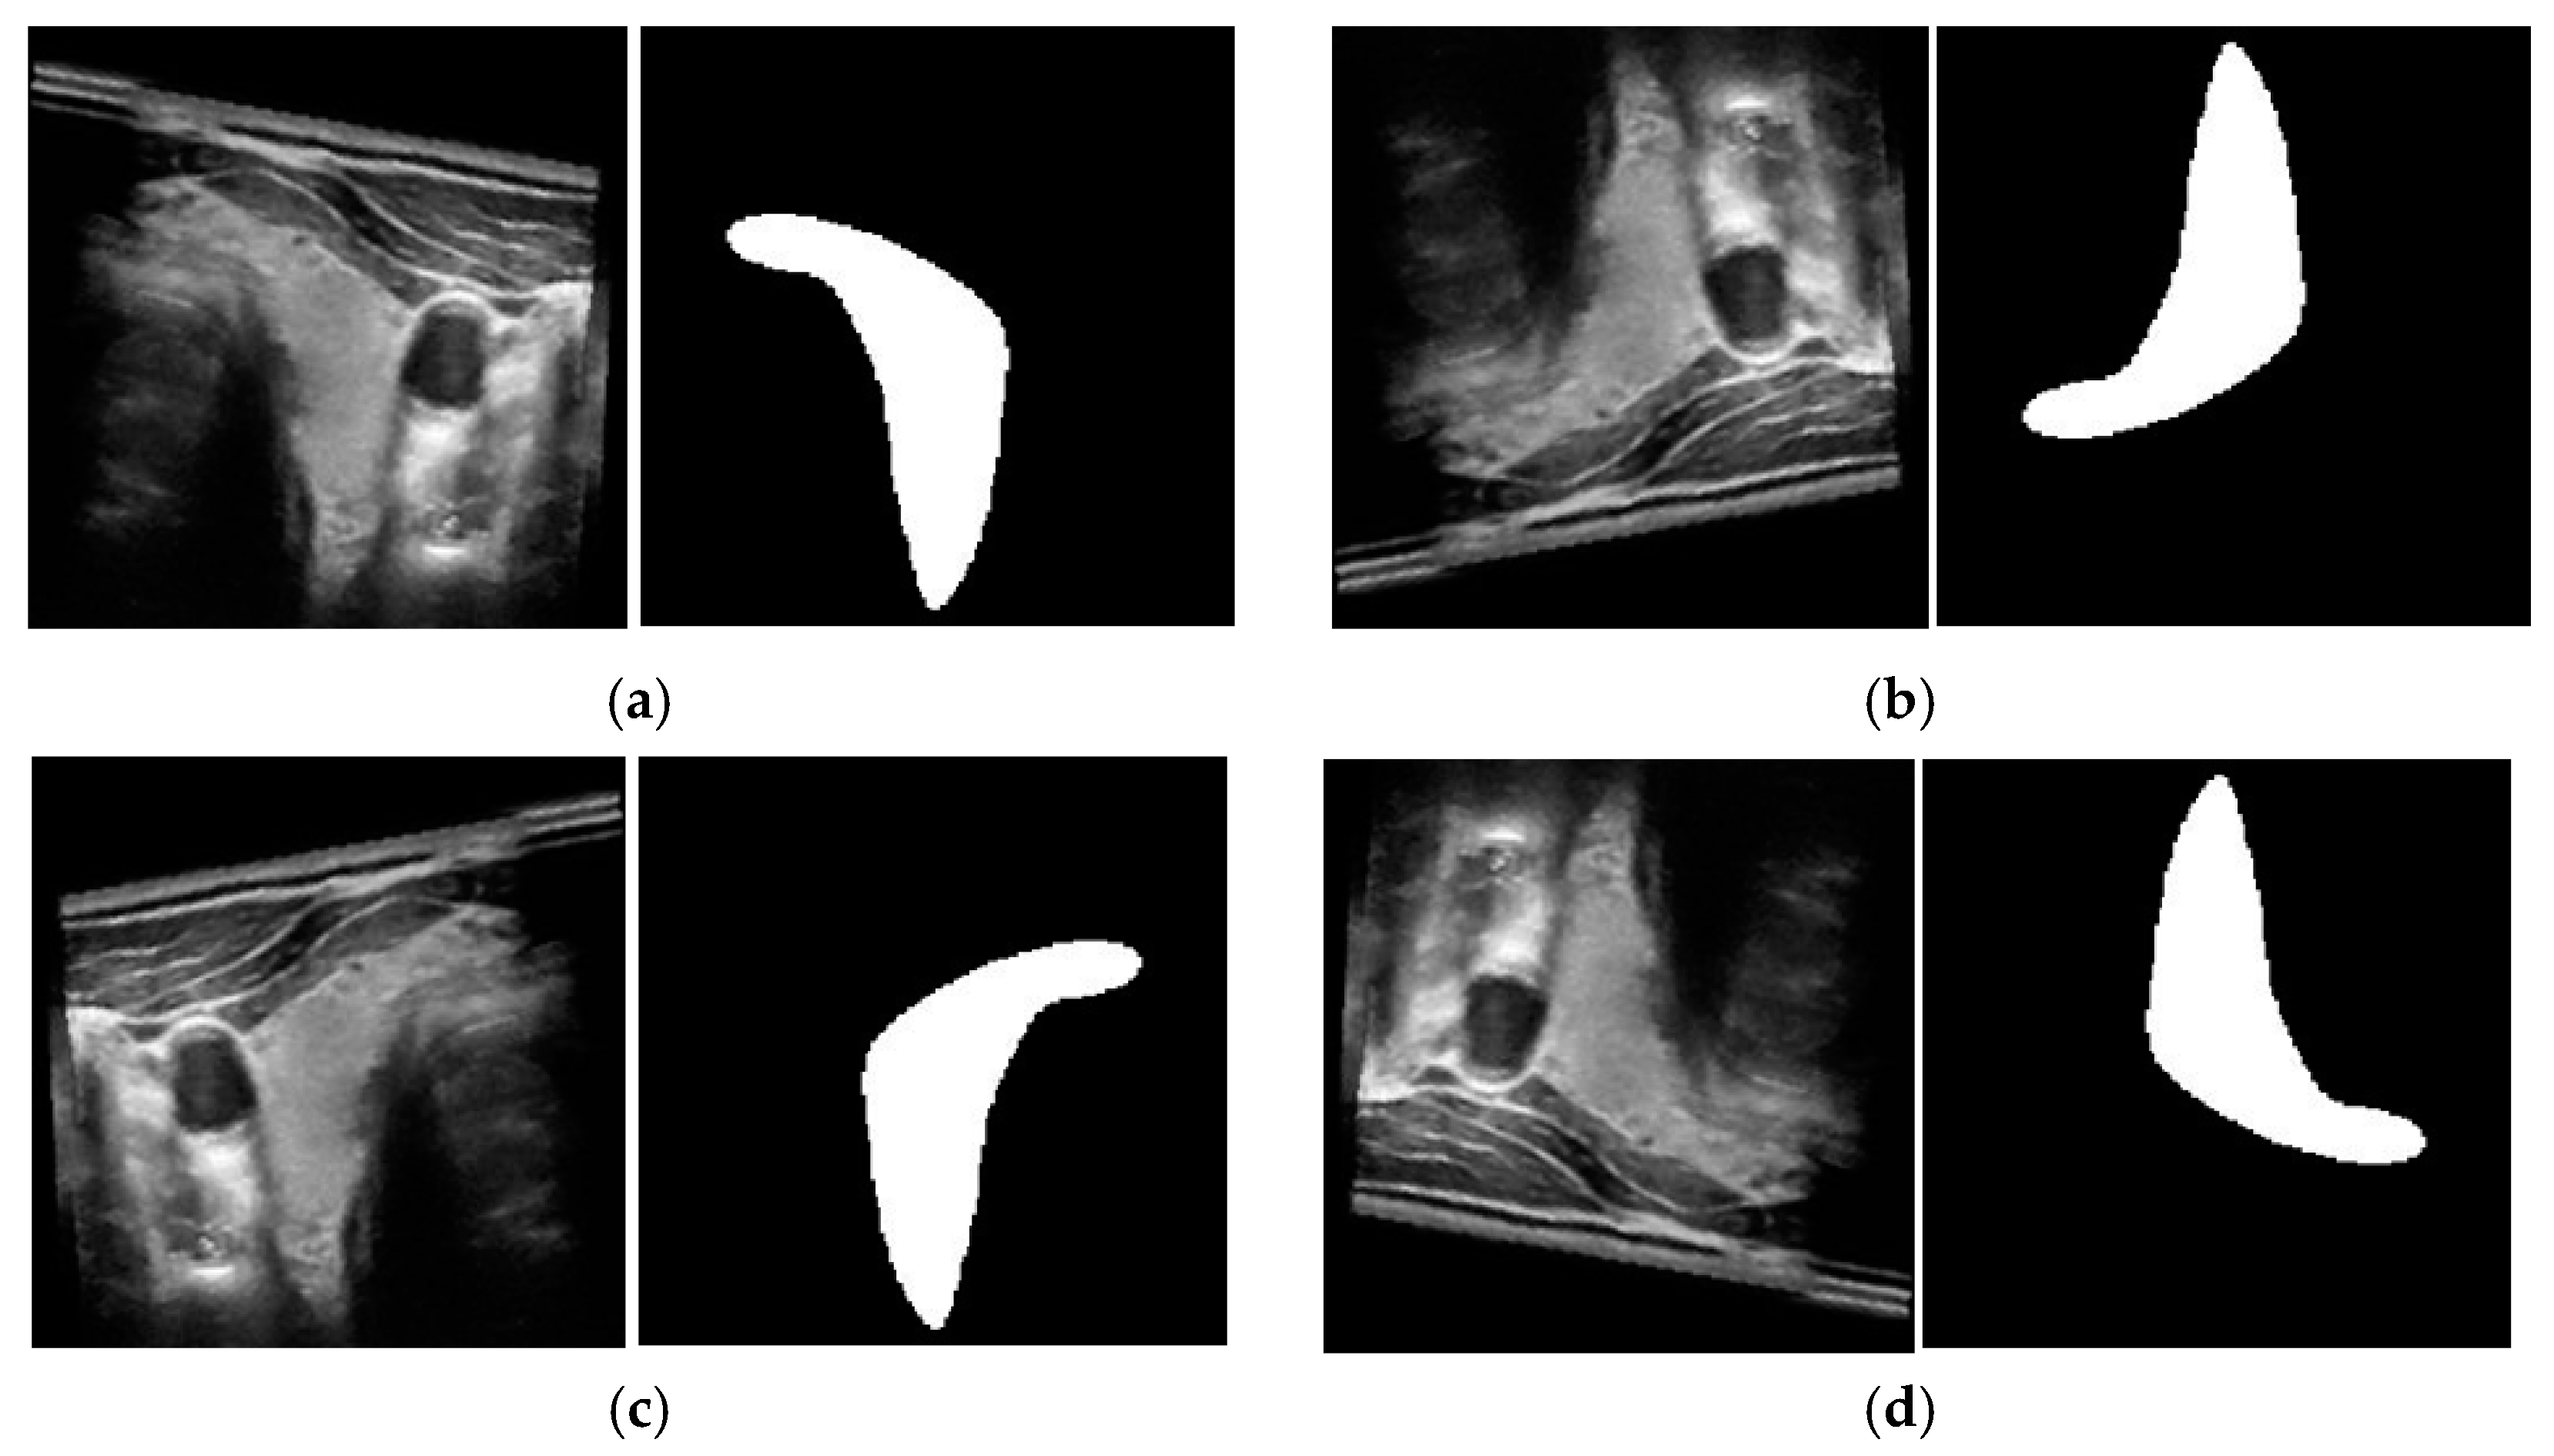
Figure 8 shows that our proposed method had seemingly better overfitting resistance on the TDID than the 3DThyroid dataset. In our study, we designed the SN and EN on the basis of the UNet network architecture, which is a well-known network for medical image segmentation. Therefore, we think that this phenomenon is not related to the network architecture that is more suitable for small datasets. This phenomenon is mainly caused by the characteristics of these datasets. The 3DThyroid dataset contains successive images with nodule sizes ranging from tiny (as shown in the first row of Figure 7) to large (as shown in the second row of Figure 7) nodules, whereas the TDID dataset mainly contains large-sized thyroid nodules as shown in Figure 6. Because it is usually more difficult to segment small-sized nodules than the larger ones, it causes a higher loss of the validation set than that of the training set in the experiments with the 3DThyroid dataset. This is a common problem with segmentation networks.
4.2.2. Data Augmentation
To reduce the effects of the overfitting problem, we also used the data augmentation method during the training process using the random mirroring method. This is a popular data augmentation method that was applied to generalize the training dataset in previous studies [14,15]. In detail, we randomly flipped the input image horizontally or vertically to obtain the flipped images of original one. Consequently, we can enlarge the training dataset fourfold compared to the original dataset. Examples of the resulting images after data augmentation based on the mirroring method are given in Figure 9.
4.3. Evaluation Metrics
We used two metrics, i.e., the Dice score (DSC) and pixel classification accuracy (Acc), to measure the segmentation performance in our study. The DSC is one of the most widely used similarity measurement methods used for object segmentation problems [26,30,32] as shown in Equation (1). A high value of DSC indicates a higher similarity level and, therefore, a better segmentation performance. The Acc is a widely used performance measurement for a conventional classification system [26,34,35]. A segmentation system is a classification system in which every pixel in a given input image is classified into either background or foreground classes. As a result, the pixel classification accuracy can be used to measure the overall performance of a segmentation system. By definition, the Acc is calculated using Equation (3) [26,34,35]. In this equation, TP, TN, FP, and FN denote true positive, true negative, false positive, and false negative, respectively. A higher value of Acc means that the segmentation system has good functionality.
4.4. Performance Evaluation on Testing Datasets
4.4.1. Ablation Studies
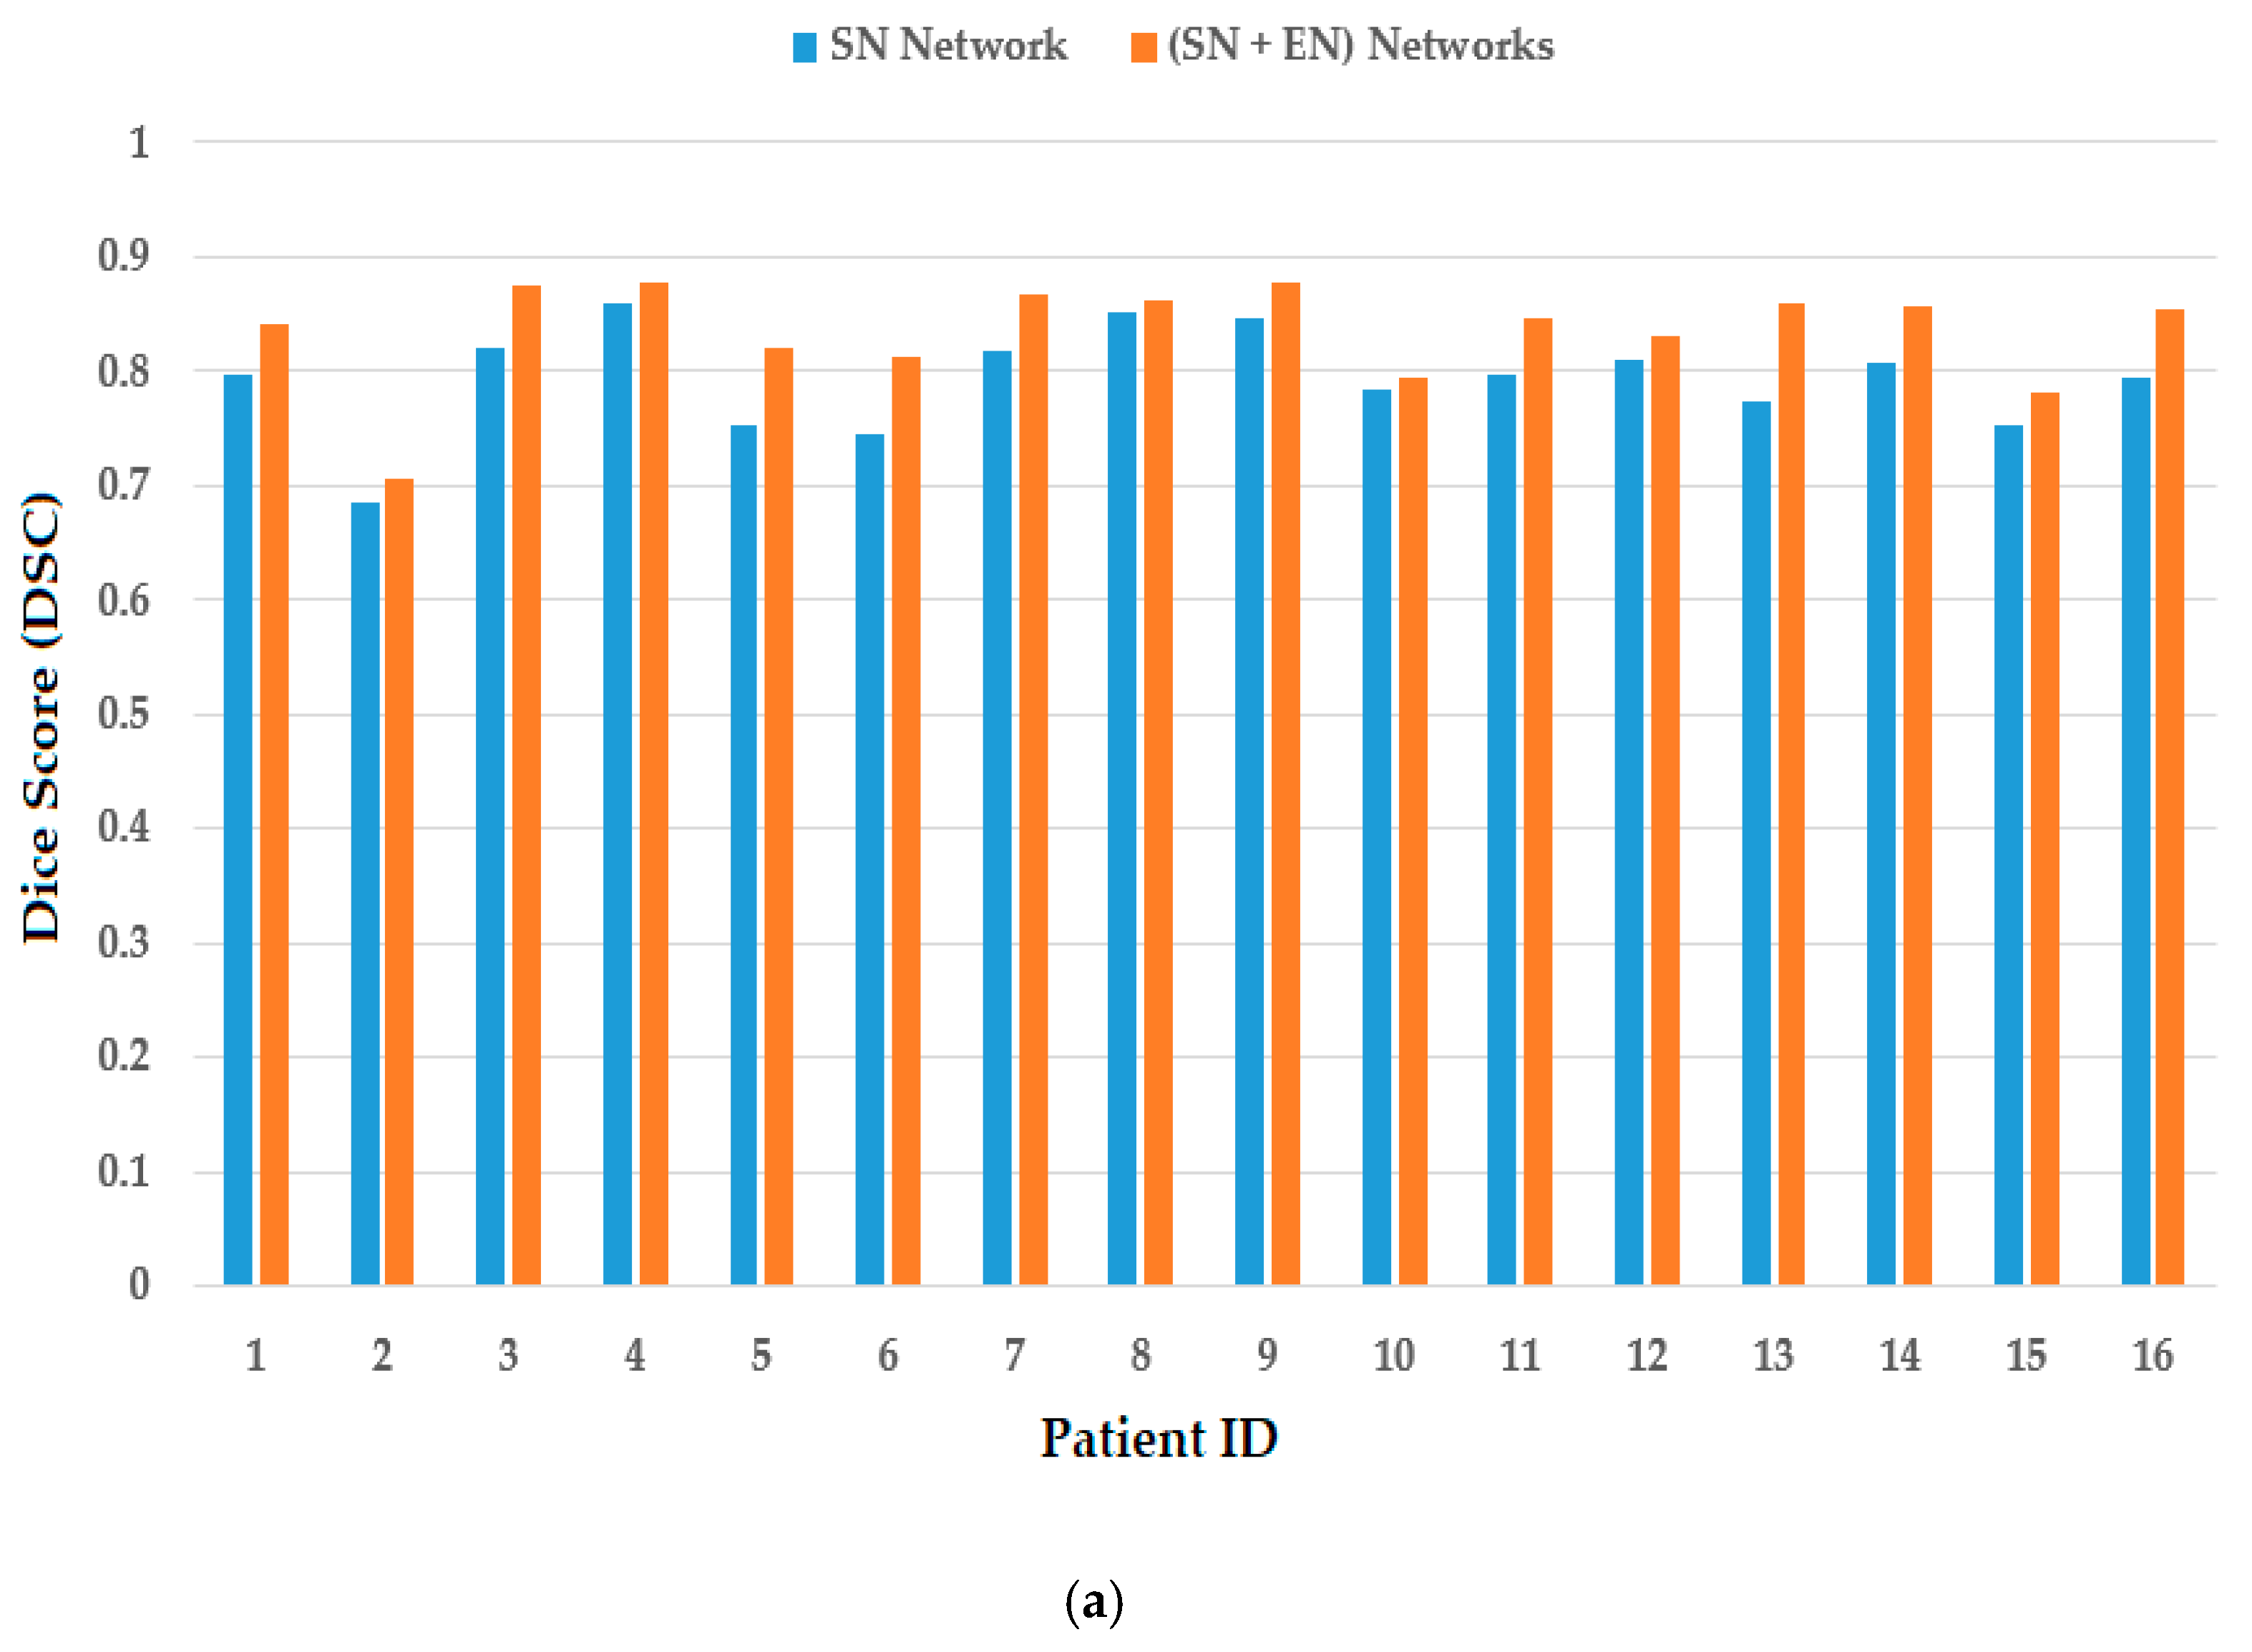
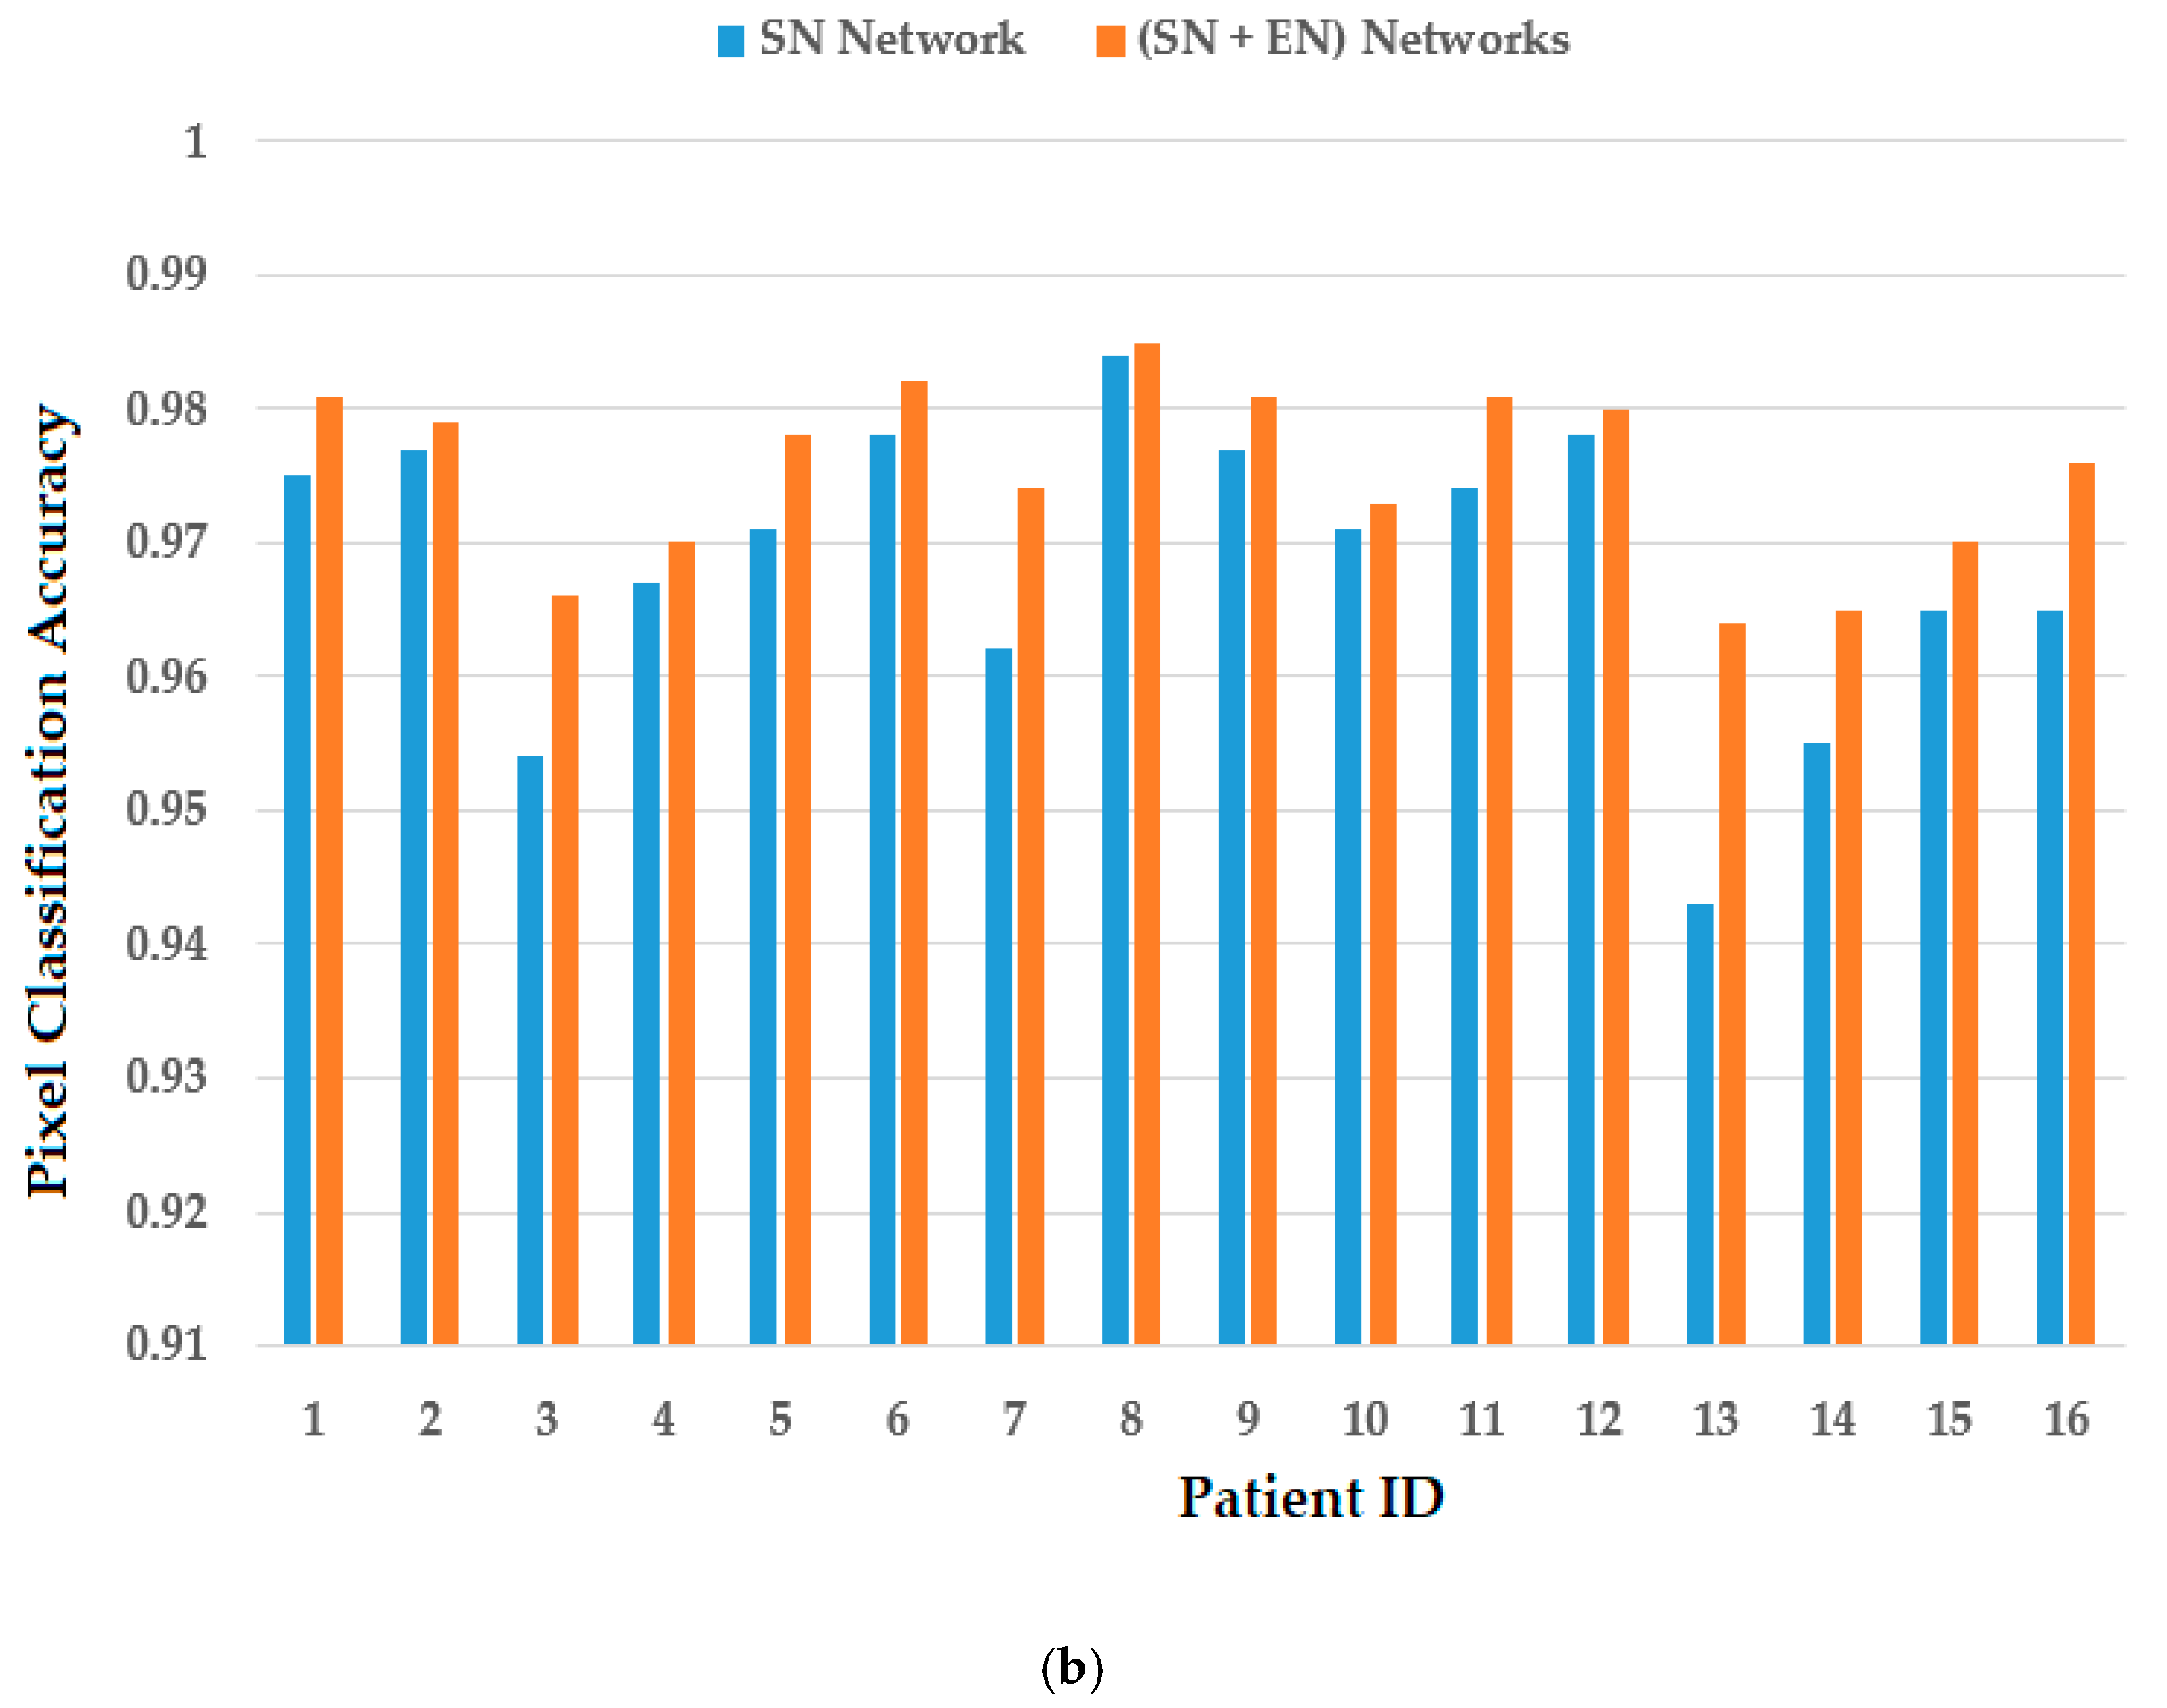
With the pretrained segmentation networks obtained in experiments in Section 4.2, we measured the segmentation performance of the SN and EN. The results are presented in Table 5 for the case of using TDID dataset, and Figure 10 for the case of using the 3DThyroid dataset. Figure 10a shows the measurement of DSC, whereas Figure 10b shows the measurement of pixel classification accuracy. As shown in Table 5, the SN yielded an DSC of 0.555 with a pixel classification accuracy of 0.824. Using our proposed (SN + EN) network, the DSC was increased to 0.596 with a pixel classification accuracy of 0.858. Figure 10 shows that our proposed (SN + EN) network outperformed the SN method by producing higher DSC and pixel classification accuracy than those produced by the SN using the 3DThyroid dataset.
We further performed experiments using our proposed EN with the SN based on the Residual UNet and UNet++ network. Similar to the SN mentioned in Section 3.2 with Figure 3, we modified the conventional Residual UNet and UNet++ networks by reducing the number of filters and network scales. Table 6 presents the summary of the segmentation performance of our experiments with all these network architectures. Our proposed (SN + EN) network architecture outperformed the various SN in both the TDID and the 3DThyroid datasets. We obtained the best DSC of 0.612 with a pixel classification accuracy of 0.850 using the proposed EN with the SN based on the UNet++ network architecture on the TDID dataset. This accuracy is higher than that of any of the SN. Using the 3DThyroid dataset, we obtained the best DSC of 0.837 with a pixel classification accuracy of 0.975 using our proposed EN with the SN based on the UNet++ network architecture. This segmentation accuracy is also higher than that produced by any of the SNs.
Our proposed method was designed to take advantage of a coarse-to-fine segmentation strategy. In our design, the purpose of suggestion network (SN) is to roughly segment objects from input images. It should output a map with both large and small objects and use this map as a suggestion for the enhancement network (EN). If we use a very deep network for the SN, it is difficult to be trained when the training dataset contains tiny and small objects. In addition, it can remove small objects in its prediction results. Therefore, we only used a shallow network with three-scale feature maps in our design and experiments. To validate our design, we performed additional experiments with the TDID and 3DThyroid datasets by using the SN with different scales, i.e., two-scale, three-scale, and four-scale. In addition, we performed the experiments with or without the SN to take into account the effect of salient maps. The detailed experimental results are presented in Table 7.
As shown in Table 7, we confirm that our proposed network obtained the best segmentation accuracy using the three-scale SN with a DSC of 0.596 using the TDID dataset. Without the use of SN, the EN produced a DSC of 0.490, which is much lower than the performance produced by the SN + EN. A similar situation also occurred in the experiments with the 3DThyroid dataset. In detail, we obtained DSCs of 0.808, 0.835, and 0.838 for the cases of using two-scale, three-scale, and four-scale SNs, respectively. We confirmed that the performances of our proposed method with the SN were similar for the three-scale and four-scale SNs, and much better than the case for the two-scale SB. Without the SN, the EN only produced a DSC of 0.737. These results confirm the importance of the salient map obtained by the SN in our proposed network. In addition, the three-scale SN was experimentally selected as it has a balance between the enhancement accuracy and the network complexity.
4.4.2. Comparison with Previous Methods and Discussion
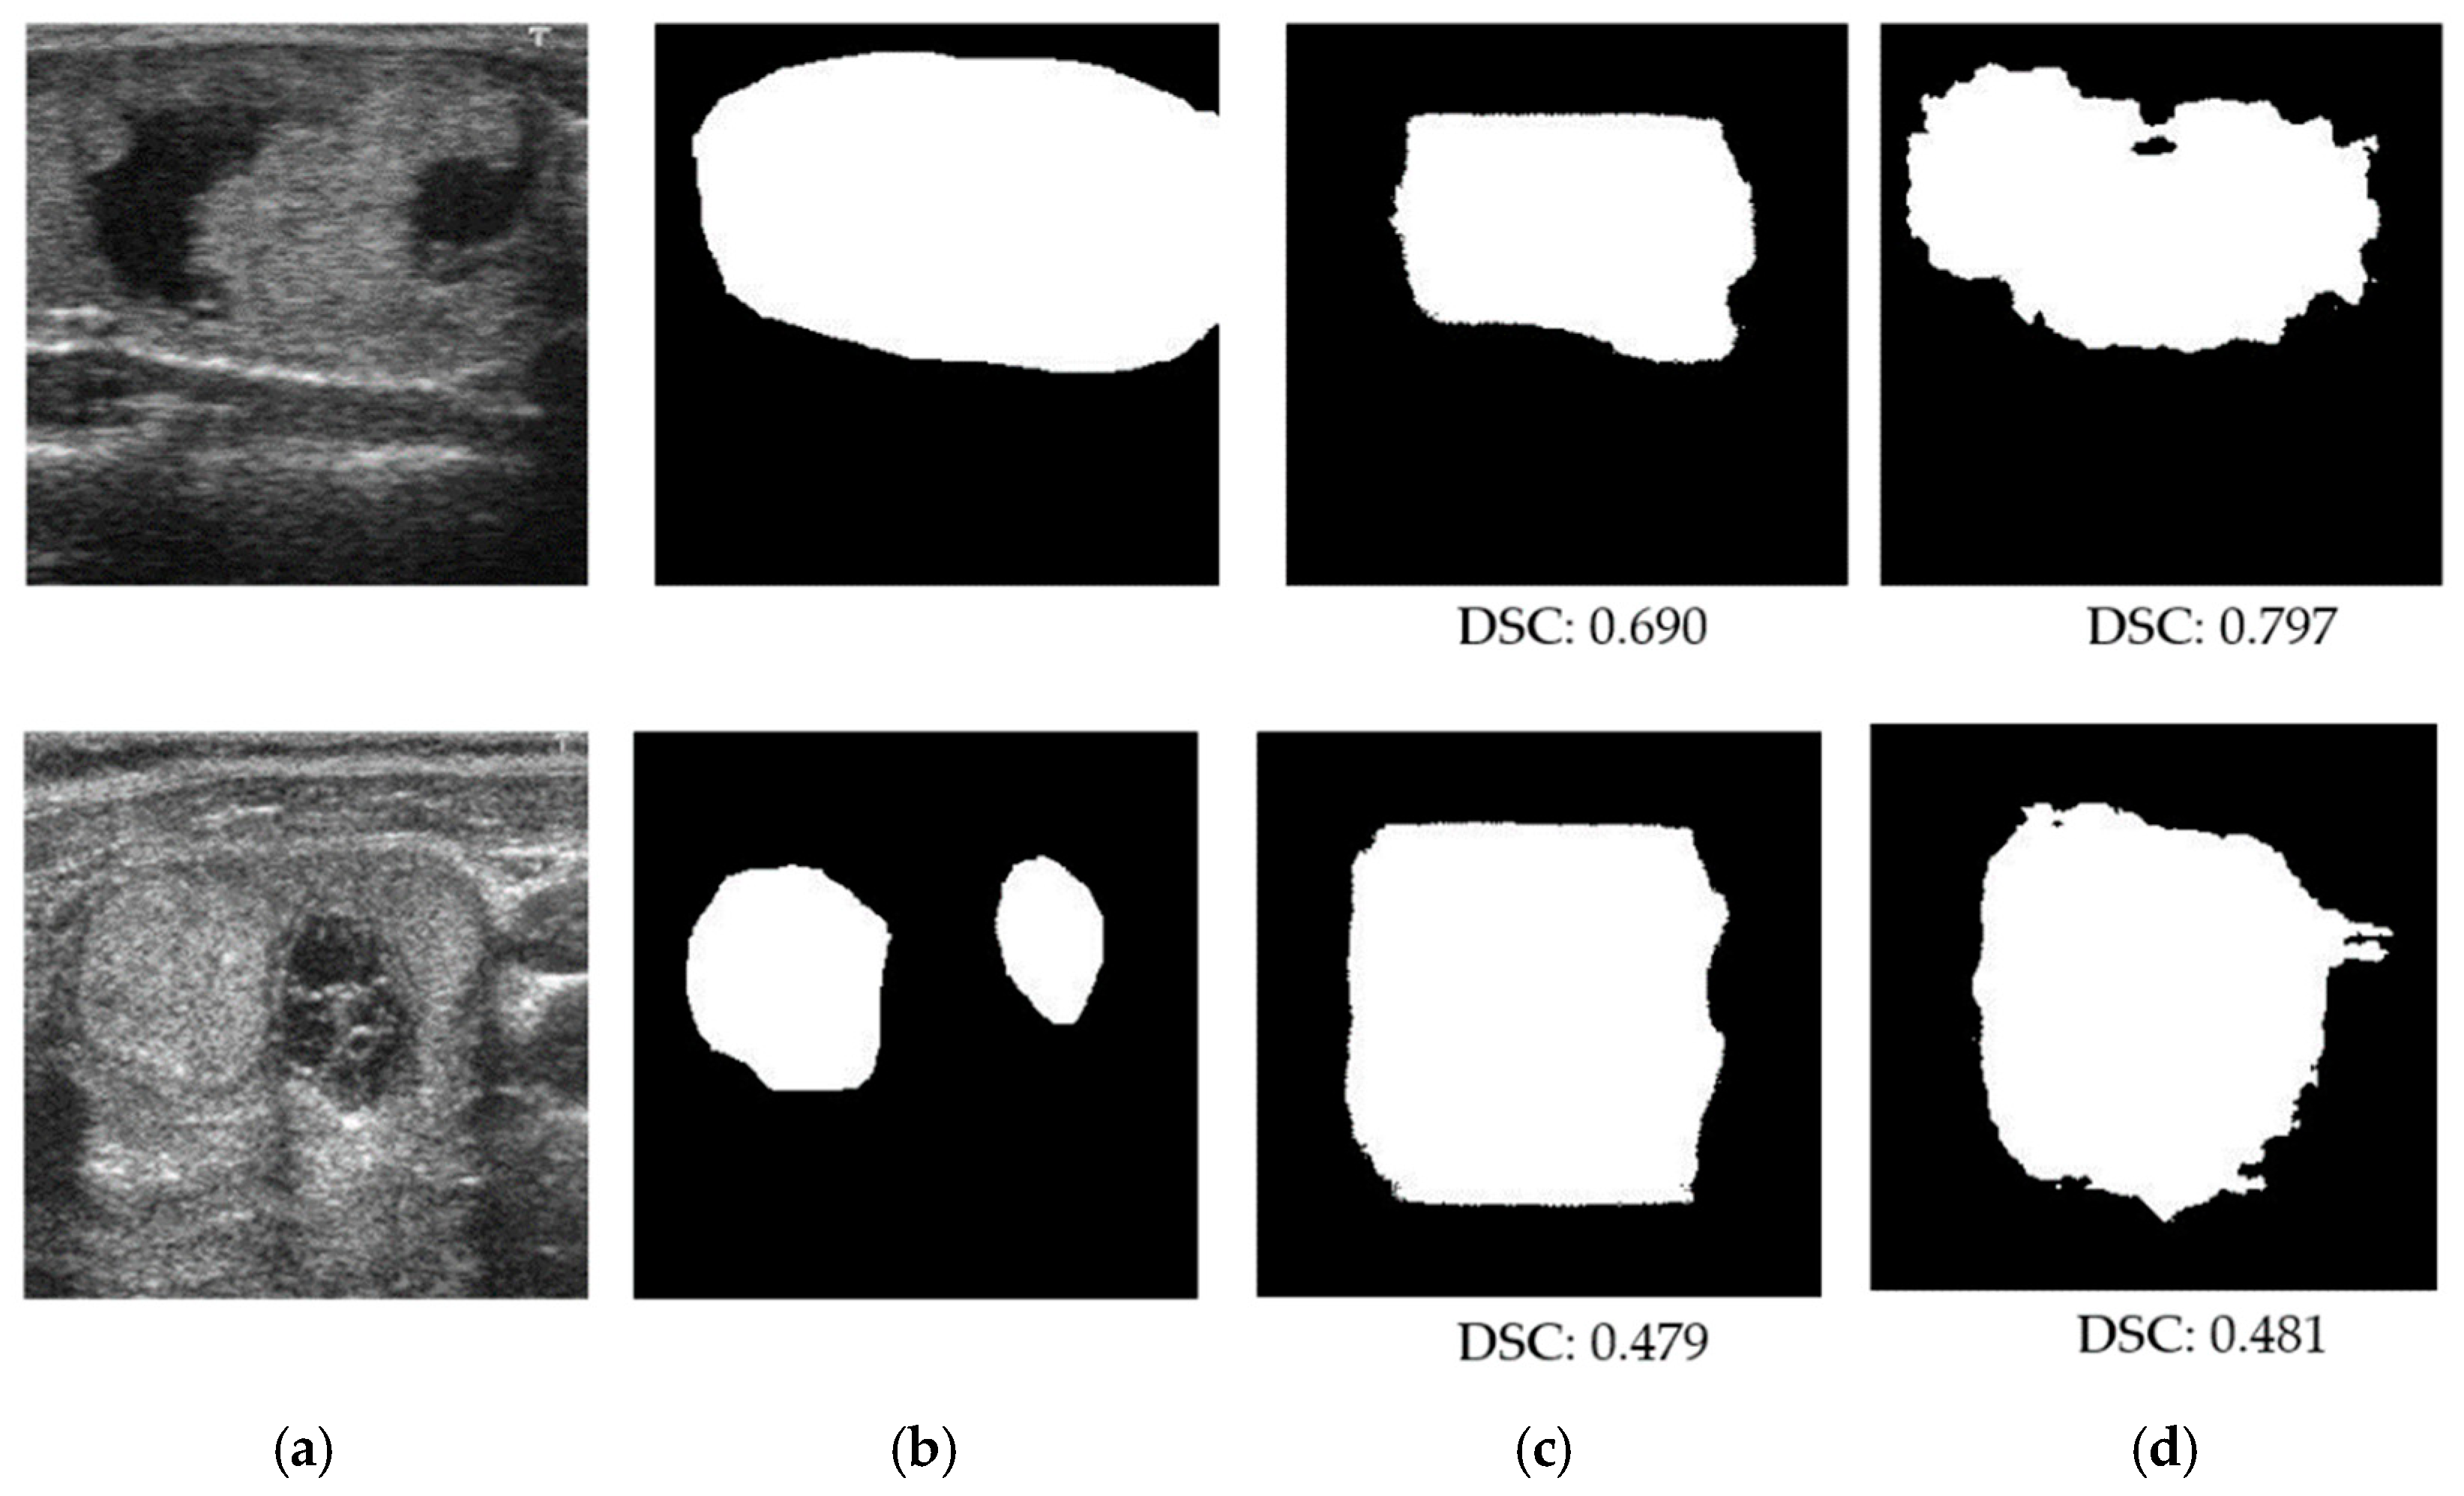
We compare our proposed method to three state-of-art segmentation networks: the UNet network [12], residual UNet [20] network, and UNet++ network [21]. Because there are no previous studies that conducted segmentation experiments with the TDID and 3DThyroid datasets using these three networks, we newly performed experiments for comparison purposes. Experimental results shown in Table 8 indicate that our proposed network was superior to all three segmentation networks, producing a DSC of 0.612, which is higher than the DSC of 0.540, 0.490, and 0.560 produced by the UNet, residual UNet, and UNet++ networks, respectively, with the TDID dataset. However, the segmentation performance of all networks with the TDID was not high, as the maximum DSC was only 0.612. This is because the TDID dataset contains both benign and malignant thyroid regions that results in large variation in captured images. Figure 11 shows examples of segmentation results obtained using our proposed method and UNet network with images in the TDID dataset. As shown in the upper row of Figure 11, the main region of the thyroid region was segmented with a DSC of 0.690 using the conventional UNet network, and a DSC of 0.797 using our proposed method. In the lower row of Figure 11, it was difficult to segment the thyroid region using both the UNet network and the proposed method because of the appearance of the calcification phenomenon inside the thyroid region.
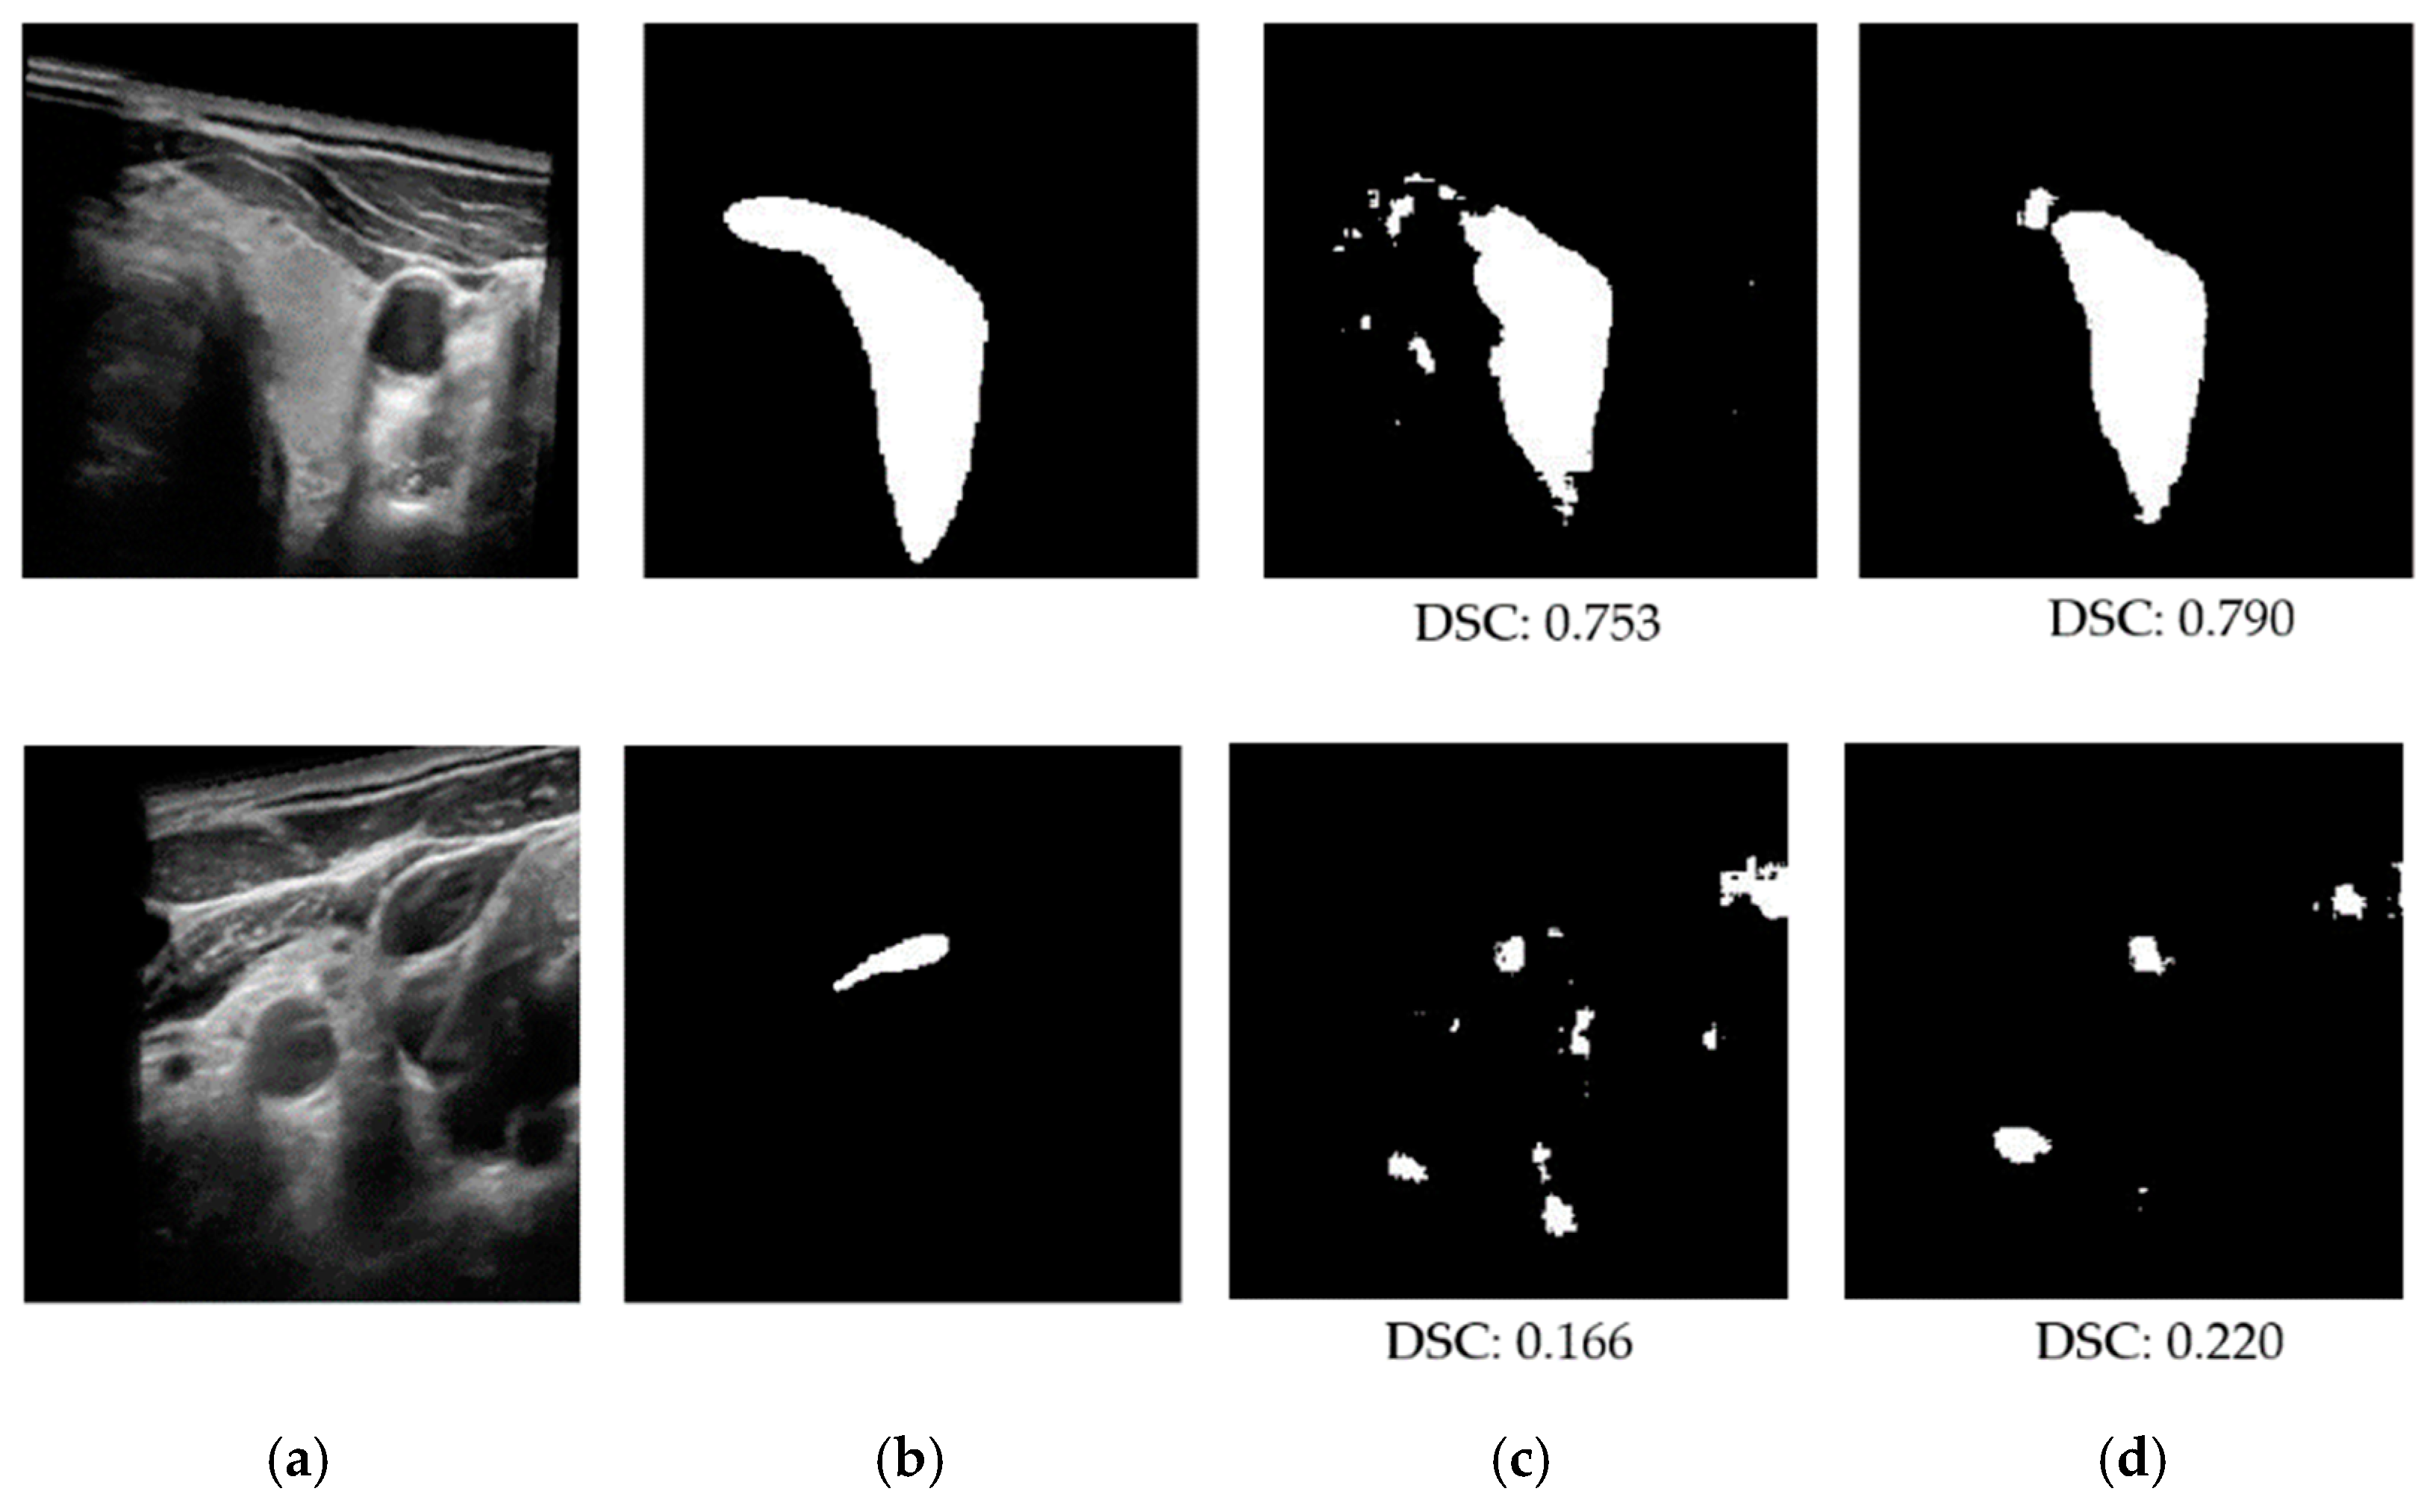
However, we were unable to train three segmentation networks using the 3DThyroid dataset. This is because the 3DThyroid dataset contains a series of images with various sizes of thyroid lesions (tiny, small, and large 2D thyroid images), as shown in Figure 7. In addition, slices in 3D volumes exhibit high similarity as they are captured from a single thyroid object. Therefore, it is difficult to train these deep networks with the 3DThyroid dataset. In Table 9, we present the detailed performance comparison between our proposed method and the shallow UNet-based networks, as well as a previously published study using the 3DThyroid dataset. In the study by Wunderling et al. [32], three different methods were used for segmenting thyroid nodules: the level set, graph-cut, and classifier methods. They obtained the best DSC of 0.748 using a graph-cut-based method. This result is similar to the segmentation performance produced using the shallow residual UNet network, which yielded an average DSC of 0.737. However, this result is lower than the DSC of 0.792 obtained using the shallow UNet++ network and 0.793 yielded using the shallow UNet network. Using our proposed method, we obtained the highest DSC of 0.837. This result indicates that our proposed method not only outperformed shallow UNet-based networks, but also previous studies. In Figure 12, we show some examples of the segmentation results obtained using a shallow UNet network and our proposed network using images in the 3DThyroid dataset. In the upper part of this figure, we obtained a DSC of 0.753 using the shallow UNet network, which was enhanced to 0.790 using our proposed method. However, the segmentation results were poor with the input image in the lower part of Figure 12 as the input image contained a very small size of thyroid region. We can see a big difference in segmentation accuracy between the TDID (DSC of 0.612) and 3DThyroid dataset (DSC of 0.837). This is because the TDID dataset contains a diseased thyroid with a large variation of pixel brightness in the thyroid region (as shown in Figure 6 and Figure 11). This problem does not occur with the 3DThyroid dataset that contains a normal thyroid region.
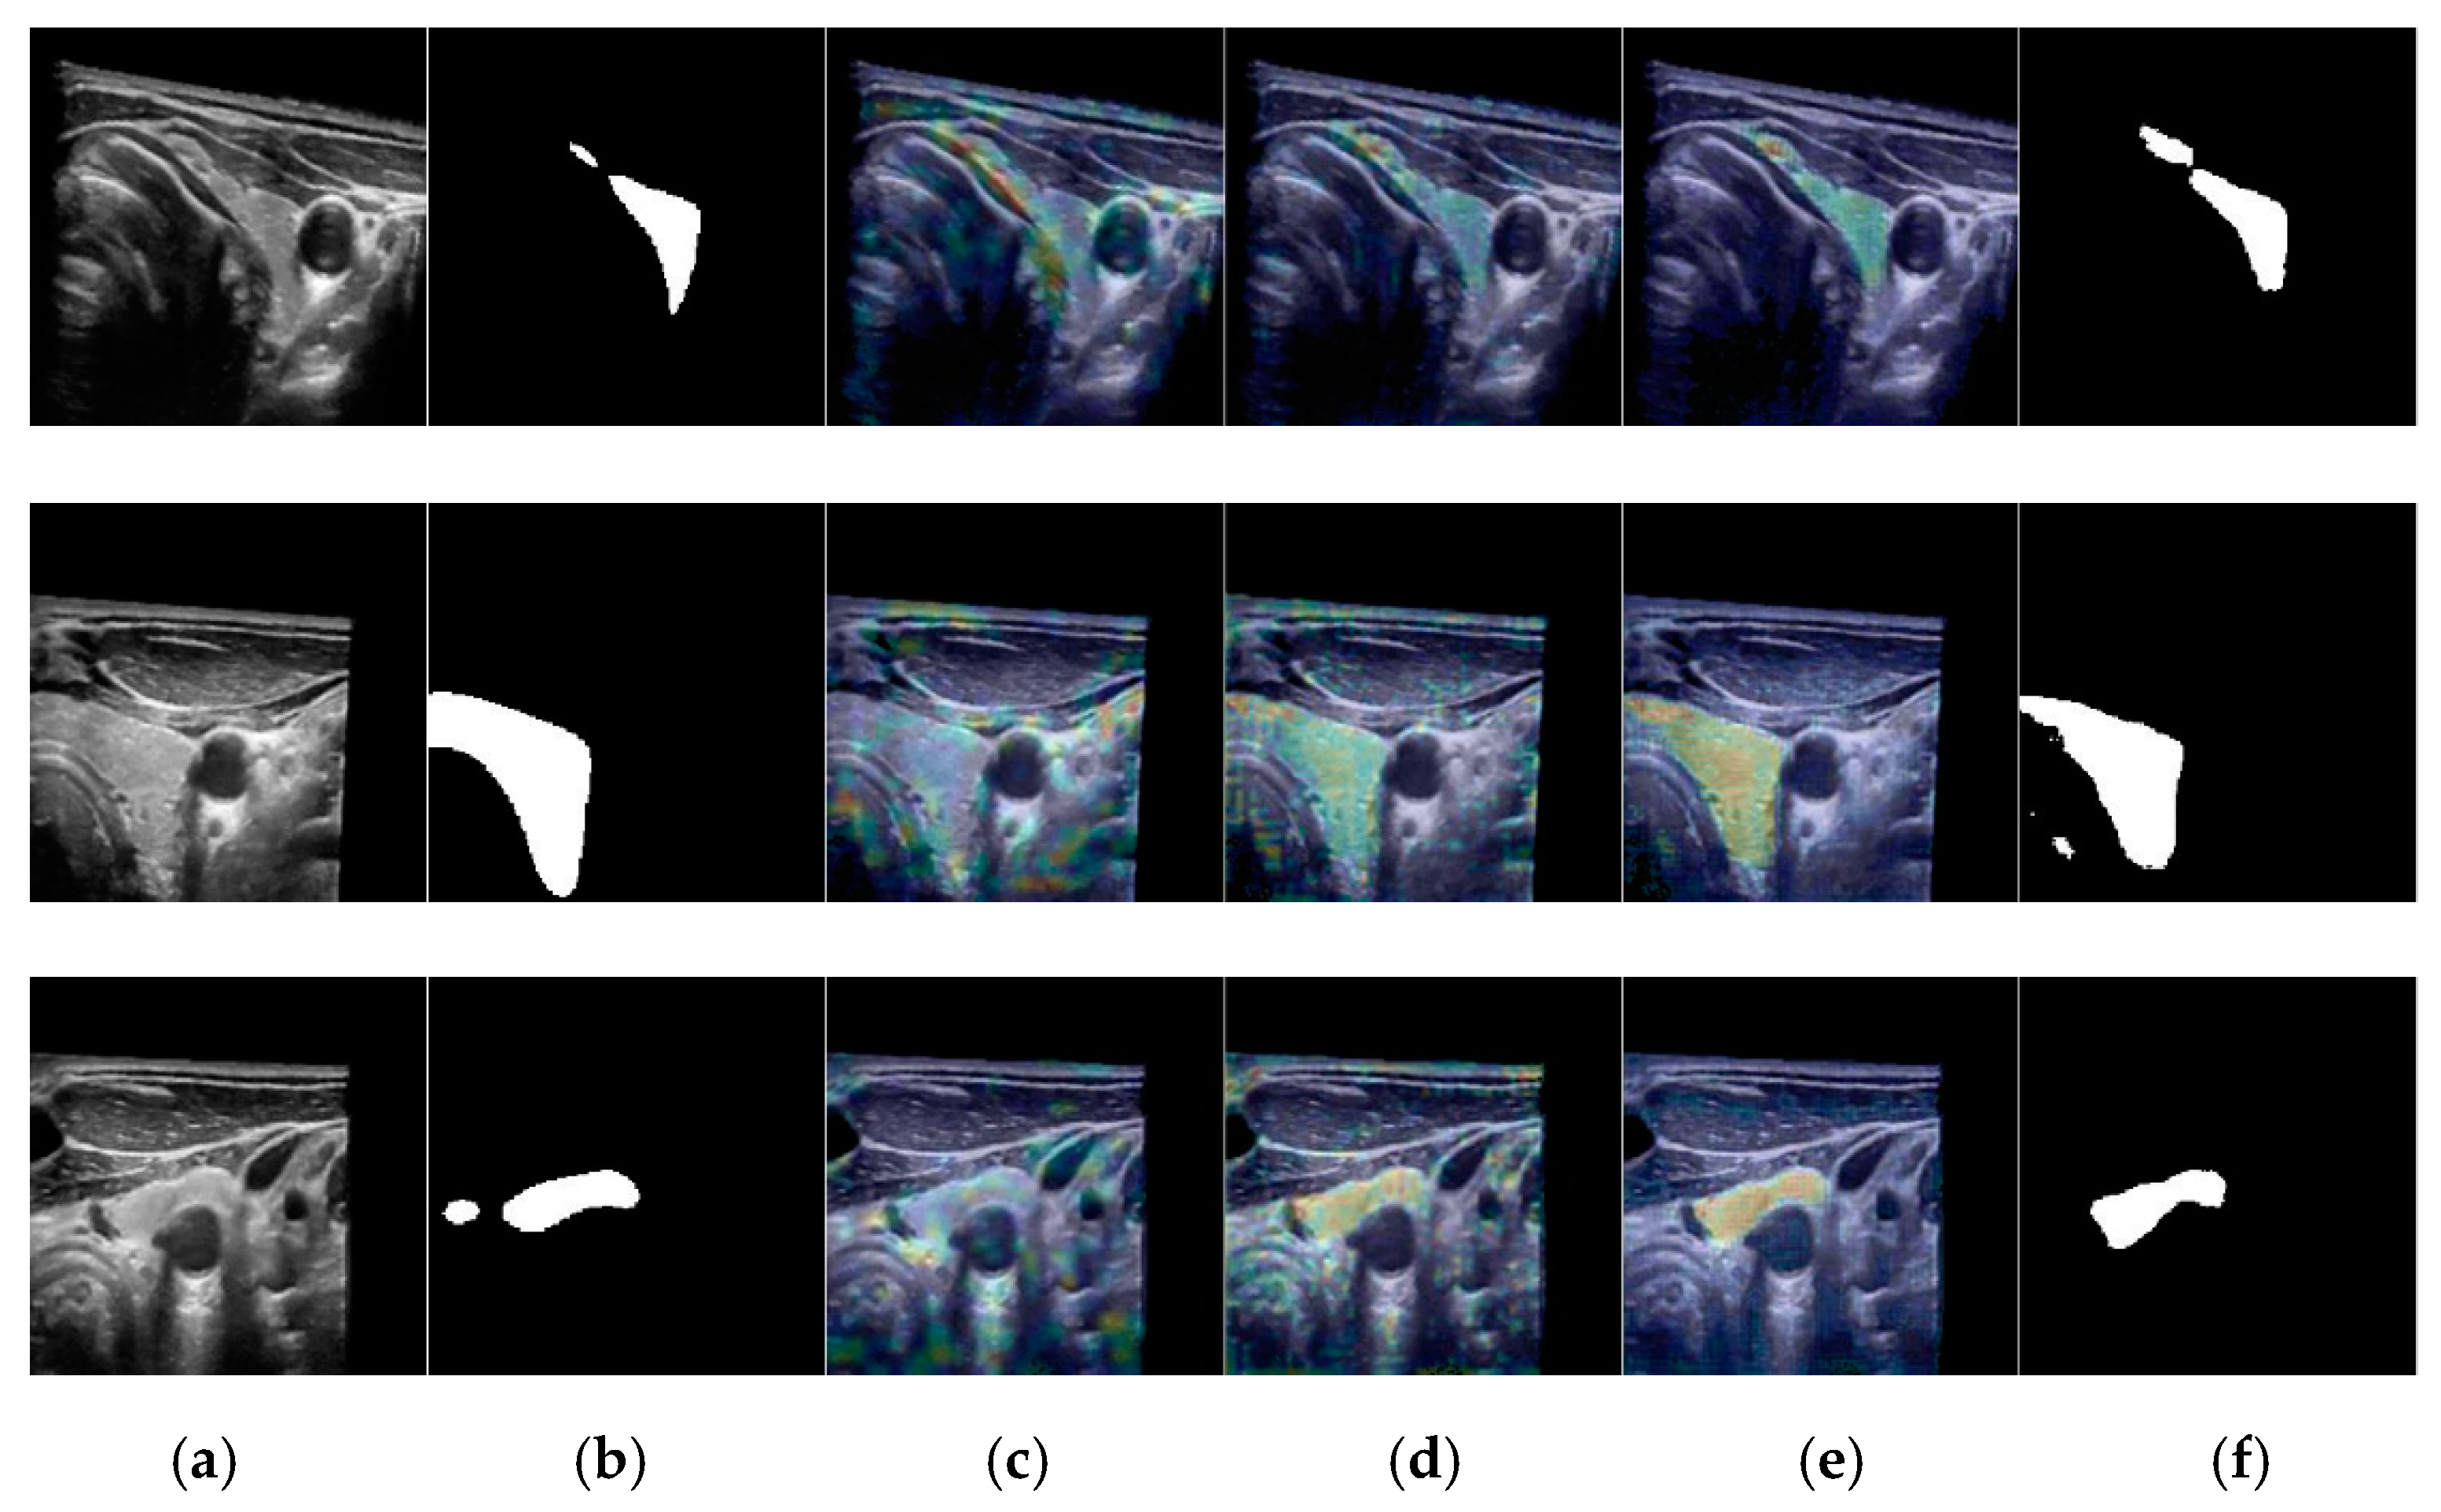
To explain the internal functioning of our network, Figure 13 shows the class activation maps (CAMs) [38] produced by our proposed method at various feature scales of input images. We obtained a rough suggestion of the lesion region in the input image using a high level of extracted image features. With a combination of low and high image features, the lesion regions in the input images were more distinctive and focused. As a result, the final segmented images were quite similar to the ground-truth label images.
Lastly, we measured the processing time of our proposed network in comparison with conventional segmentation networks. The experiment was performed using a desktop computer with a Core i7 processor working at 3.4 GHz with 64 GB of RAM. We programmed our network using the Python programming language and the TensorFlow library [33]. As presented in Table 10, our proposed method required a slightly longer processing time than other segmentation networks. In terms of processing speed, our proposed network could operate at a speed of 11.426 fps (1000/87.518). This is acceptable for medical image processing systems, where accuracy is more important than processing speed.
5. Conclusions
In this study, we proposed a nested attention-based segmentation network for image-based thyroid lesion segmentation. Our study was designed to take advantage of both nested-based and attention-based segmentation networks. In details, our proposed network was composed of two segmentation networks, i.e., SN and EN, to form a nested network. The output of the SN was used as a rough prediction map of objects (salient map). We used an attention block to incorporate the information of the salient map with the feature maps after the convolution layers of the EN. By using both nested and attention-based approaches, we enhanced the segmentation performance of the thyroid nodule segmentation problem compared to previous studies using two public thyroid datasets, the TDID and 3DThyroid datasets. In addition, we found that it was difficult to segment the thyroid region when it contains significant lesions or is small in size. This problem will be considered in future research to enhance both the performance and stability of the segmentation system. Our proposed method can not only be applied for medical image segmentation systems, but also be applied for the segmentation and modeling of 3D organs (brain, thyroid, kidney, etc.), which is useful in human anatomical or surgical planning. Although our proposed method was demonstrated to enhance the segmentation performance, it takes a longer time to segment an input image than the conventional segmentation method, as shown in Section 4. In addition, our proposed method also takes a longer time for the training segmentation model as we must train two networks separately.
In future work, we will research methods to reduce the processing time while maintaining the segmentation accuracy. In addition, we will research methods to reduce the training time of our networks based on shallower models.
Author Contributions
Methodology, D.T.N.; validation, J.C.; supervision, K.R.P.; writing—original draft, D.T.N.; writing—review and editing, K.R.P. All authors have read and agreed to the published version of the manuscript.
Funding
This research was supported in part by the National Research Foundation of Korea (NRF) funded by the Ministry of Science and ICT (MSIT) through the Basic Science Research Program (NRF-2020R1A2C1006179), in part by the NRF funded by the MSIT through the Basic Science Re-search Program (NRF-2021R1F1A1045587), and in part by the NRF funded by the MSIT through the Basic Science Research Program (NRF-2022R1F1A1064291).
Institutional Review Board Statement
Not applicable.
Informed Consent Statement
Not applicable.
Data Availability Statement
Not applicable.
Conflicts of Interest
The authors declare no conflict of interest.
References
- Masood, A.; Sheng, B.; Yang, P.; Li, P.; Li, H.; Kim, J.; Feng, D.D. Automated decision support system for lung cancer detection and classification via enhanced RFCN with multilayer fusion RPN. IEEE Trans. Ind. Inform. 2020, 16, 7791–7801. [Google Scholar] [CrossRef]
- Nguyen, D.T.; Pham, T.D.; Batchuluun, G.; Yoon, H.; Park, K.R. Artificial intelligence-based thyroid nodule classification using information from spatial and frequency domains. J. Clin. Med. 2019, 8, 1976. [Google Scholar] [CrossRef] [PubMed]
- Huang, C.; Zhang, G.; Chen, S.; Albuquerque, V. Healthcare industry 4.0: A novel intelligent multi-sampling tensor network for detection and classification of oral cancer. IEEE Trans. Ind. Inform. 2022, 18, 7853–7861. [Google Scholar] [CrossRef]
- Hu, H.; Li, Q.; Zhao, Y.; Zhang, Y. Parallel deep learning algorithms with hybrid attention mechanism for image segmentation of lung tumors. IEEE Trans. Ind. Inform. 2021, 17, 2880–2889. [Google Scholar] [CrossRef]
- Yahiaoui, A.F.Z.; Bessaid, A. Segmentation of ischemic stroke area from CT brain images. In Proceedings of the International Symposium on Signal, Image, Video and Communications (ISIVC), Tunis, Tunisia, 21–23 November 2016; pp. 13–17. [Google Scholar] [CrossRef]
- Vasilakakis, M.; Iosifidou, V.; Fragkaki, P.; Iakovidis, D. Bone fracture identification in X-ray images using fuzzy wavelet features. In Proceedings of the 19th IEEE International Conference on Bioinformatics and Bioengineering (BIBE), Athens, Greece, 28–30 October 2019; pp. 726–730. [Google Scholar] [CrossRef]
- Castiglione, A.; Vijayakumar, P.; Nappi, M.; Sadiq, S.; Umer, M. COVID-19: Automatic detection of the novel coronavirus disease from CT images using an optimized convolutional neural network. IEEE Trans. Ind. Inform. 2021, 17, 6480–6488. [Google Scholar] [CrossRef]
- Wang, Z.; Luo, Y.; Xin, J.; Zhang, H.; Qu, L.; Wang, Z.; Yao, Y.; Zhu, W.; Wang, X. Computer-aided diagnosis based on extreme learning machine: A review. IEEE Access 2020, 8, 141657–141673. [Google Scholar] [CrossRef]
- Jia-xin, C.; Sen, L. A medical image segmentation method based on watershed transform. In Proceedings of the 5th International Conference on Computer and Information Technology (CIT’05), Shanghai, China, 21–23 September 2005; pp. 634–638. [Google Scholar] [CrossRef]
- Huang, Q.-H.; Lee, S.-Y.; Liu, L.-Z.; Lu, M.-H.; Jin, L.-W.; Li, A.-H. A robust graph-based segmentation method for breast tumors in ultrasound images. Ultrasonics 2012, 52, 266–275. [Google Scholar] [CrossRef]
- Chen, X.; Williams, B.M.; Vallabhaneni, S.R.; Czanner, G.; Williams, R.; Zheng, Y. Learning active contour models for medical image segmentation. In Proceedings of the Conference on Computer Vision and Pattern Recognition (CVPR), Long Beach, CA, USA, 15–20 June 2019; pp. 11624–11632. [Google Scholar] [CrossRef]
- Ronneberger, O.; Fischer, P.; Brox, T. U-Net: Convolutional networks for biomedical image segmentation. arXiv 2015, arXiv:1505.04597. [Google Scholar]
- Li, X.; Jiang, Y.; Li, M.; Yin, S. Lightweight attention convolutional neural network for retinal vessel image segmentation. IEEE Trans. Ind. Inform. 2021, 17, 1958–1967. [Google Scholar] [CrossRef]
- Krizhevsky, A.; Sutskever, I.; Hinton, G.E. ImageNet classification with deep convolutional neural networks. NIPS 2012, 60, 84–90. [Google Scholar] [CrossRef]
- He, K.; Zhang, Z.; Ren, S.; Sun, J. Deep residual learning for image recognition. arXiv 2015, arXiv:1512.03385. [Google Scholar]
- Szegedy, C.; Liu, W.; Jia, Y.; Sermanet, P.; Reed, S.; Anguelov, D.; Erhan, E.; Vanhoucke, V.; Rabinovich, A. Going deeper with convolutions. arXiv 2014, arXiv:1409.4842v1. [Google Scholar]
- Li, J.; Chen, J.; Sheng, B.; Li, P.; Yang, P.; Feng, D.D.; Qi, J. Automatic detection and classification system of domestic waste via multimodel cascaded convolutional neural network. IEEE Trans. Ind. Inform. 2022, 18, 163–173. [Google Scholar] [CrossRef]
- Nguyen, D.T.; Yoon, H.S.; Pham, D.T.; Park, K.R. Spoof detection for finger-vein recognition system using NIR camera. Sensors 2017, 17, 2261. [Google Scholar] [CrossRef]
- Zhu, J.-Y.; Park, T.; Isola, P.; Efros, A.A. Unpaired image-to-image translation using cycle-consistent adversarial networks. arXiv 2017, arXiv:1703.10593v7. [Google Scholar]
- Khanna, A.; Londhe, N.D.; Gupta, S.; Semwal, A. A deep residual U-Net convolutional neural network for automated lung segmentation in computed tomography images. Biocybern. Biomed. Eng. 2020, 40, 1314–1327. [Google Scholar] [CrossRef]
- Zhou, Z.; Siddiquee, M.-M.R.; Tajbakhsh, N.; Liang, J. UNet++: A nested U-Net architecture for medical image segmentation. arXiv 2018, arXiv:1807.10165v1. [Google Scholar]
- Huang, H.; Lin, L.; Tong, R.; Hu, H.; Zhang, Q.; Iwamoto, Y.; Han, X.; Chen, Y.-W.; Wu, J. UNet 3+: A full-scale connected UNet for medical image segmentation. arXiv 2020, arXiv:2004.08790v1. [Google Scholar]
- Baccouche, A.; Garcia-Zapirain, B.; Olea, C.C.; Elmaghraby, A.S. Connected-UNets: A deep learning architecture for breast mass segmentation. NPJ Breast Cancer 2021, 7, 151. [Google Scholar] [CrossRef]
- Lin, A.; Chen, B.; Xu, J.; Zhang, Z.; Lu, G. DS-TransUNet: Dual swin transformer U-Net for medical image segmentation. arXiv 2021, arXiv:2106.06716v1. [Google Scholar] [CrossRef]
- Lu, H.; She, Y.; Tie, J.; Xu, S. Half-UNet: A simplified U-Net architecture for medical image segmentation. Front. Neuroinform. 2022, 16, 911679. [Google Scholar] [CrossRef] [PubMed]
- Vakanski, A.; Xian, M.; Freer, P. Attention enriched deep learning model for breast tumor segmentation in ultrasound images. arXiv 2019, arXiv:1910.08978v2. [Google Scholar] [CrossRef] [PubMed]
- Dongguk NANets. 2021. Available online: https://github.com/idahousa/NANets (accessed on 10 July 2022).
- Li, R.; Zheng, S.; Duan, C.; Zhang, C.; Su, J.; Atkinson, P.M. Multi-Attention-Network for sematic segmentation of fine resolution remote sensing images. arXiv 2020, arXiv:2009.02130v4. [Google Scholar]
- Sudre, C.H.; Li, W.; Vercauteren, T.; Ourselin, S.; Cardoso, M.J. Generalised Dice overlap as a deep learning loss function for highly unbalanced segmentations. arXiv 2017, arXiv:1707.03237v3. [Google Scholar]
- Jadon, S. A survey of loss functions for semantic segmentation. arXiv 2020, arXiv:2006.14822. [Google Scholar]
- Pedraza, L.; Vargas, C.; Narvaez, F.; Duran, O.; Munoz, E.; Romero, E. An open access thyroid ultrasound-image database. In Proceedings of the 10th International Symposium on Medical Information Processing and Analysis, Cartagena de Indias, Colombia, 28 January 2015; Volume 9287, pp. 1–6. [Google Scholar]
- Wunderling, T.; Golla, B.; Poudel, P.; Arens, C.; Friebe, M.; Hansen, C. Comparison of thyroid segmentation techniques for 3D ultrasound. In Proceedings of the SPIE Medical Imaging, Orlando, FL, USA, 24 February 2017. [Google Scholar] [CrossRef]
- Tensorflow. 2021. Available online: https://www.tensorflow.org/ (accessed on 10 July 2022).
- Nguyen, D.T.; Lee, M.B.; Pham, T.D.; Batchuluun, G.; Arsalan, M.; Park, K.R. Enhanced image-based endoscopic pathological site classification using an ensemble of deep learning models. Sensors 2020, 20, 5982. [Google Scholar] [CrossRef]
- Nguyen, D.T.; Kang, J.K.; Pham, T.D.; Batchuluun, G.; Park, K.R. Ultrasound image-based diagnosis of malignant thyroid nodule using artificial intelligence. Sensors 2020, 20, 1822. [Google Scholar] [CrossRef]
- Gurrola-Ramos, J.; Dalmau, O.; Alarcon, T. U-Net based neural network for fringe pattern denoising. Opt. Lasers Eng. 2022, 149, 106829. [Google Scholar] [CrossRef]
- Li, D.; Dharmawan, D.A.; Ng, B.P.; Rahardja, S. Residual U-Net for retinal vessel segmentation. In Proceedings of the IEEE International Conference on Image Processing (ICIP), Taipei, Taiwan, 22–25 September 2019; pp. 1425–1429. [Google Scholar] [CrossRef]
- Selvaraju, R.R.; Cogswell, M.; Das, A.; Vedantam, R.; Parikh, D.; Batra, D. Grad-CAM: Visual explanations from deep networks via gradient-based localization. arXiv 2016, arXiv:1610.02391v1. [Google Scholar]
Figure 1.
Workflow of a CADx system.

Figure 2.
Overall network architecture.

Figure 3.
Conceptual diagram of proposed suggestion network (SN).

Figure 4.
Conceptual diagram of proposed enhancement network (EN).

Figure 5.
Structure of the attention module.

Figure 6.
Examples of thyroid images with corresponding ground-truth thyroid region in TDID dataset.
Figure 6.
Examples of thyroid images with corresponding ground-truth thyroid region in TDID dataset.

Figure 7.
Examples of images with corresponding ground-truth thyroid region in 3DThyroid dataset.

Figure 8.
Training results (loss curves) of the SNs and ENs on the (a) TDID dataset, and (b) 3DThyroid dataset.
Figure 8.
Training results (loss curves) of the SNs and ENs on the (a) TDID dataset, and (b) 3DThyroid dataset.

Figure 9.
Examples of resulting images after data augmentation method used in our experiments: (a) original image pair (image and ground-truth mask); (b) vertically flipped images of (a); (c) horizontally flipped images of (a); (d) horizontally and vertically flipped images of (a).
Figure 9.
Examples of resulting images after data augmentation method used in our experiments: (a) original image pair (image and ground-truth mask); (b) vertically flipped images of (a); (c) horizontally flipped images of (a); (d) horizontally and vertically flipped images of (a).

Figure 10.
Performance comparisons with or without EN on 3DThyroid dataset: (a) graph for DSC; (b) graph for pixel classification accuracy (Acc).
Figure 10.
Performance comparisons with or without EN on 3DThyroid dataset: (a) graph for DSC; (b) graph for pixel classification accuracy (Acc).


Figure 11.
Examples of segmentation result with the TDID dataset: (a) input images; (b) label images; (c) results obtained by UNet network; (d) results obtained by the proposed method.
Figure 11.
Examples of segmentation result with the TDID dataset: (a) input images; (b) label images; (c) results obtained by UNet network; (d) results obtained by the proposed method.

Figure 12.
Examples of segmentation result with the 3DThyroid dataset: (a) input image; (b) label image; (c) results obtained by shallow UNet network; (d) results obtained by the proposed method.
Figure 12.
Examples of segmentation result with the 3DThyroid dataset: (a) input image; (b) label image; (c) results obtained by shallow UNet network; (d) results obtained by the proposed method.

Figure 13.
Examples of CAM images using our proposed network: (a) input image; (b) label images; (c) CAM image at F1 layer of Figure 4; (d) CAM image at F2 layer of Figure 4; (e) CAM image at F3 layer of Figure 4; (f) final result.

Table 2.
Details of the TDID dataset.
| Benign Cases | Malignant Cases | Total |
|---|---|---|
| 52 | 246 | 298 |
Table 3.
Detailed descriptions of the 3DThyroid dataset.
| Patient ID | 1 | 2 | 3 | 4 | 5 | 6 | 7 | 8 |
| Number of 2D Images | 932 | 942 | 1058 | 1020 | 958 | 1064 | 1134 | 1060 |
| Patient ID | 9 | 10 | 11 | 12 | 13 | 14 | 15 | 16 |
| Number of 2D Images | 928 | 892 | 1004 | 968 | 812 | 756 | 794 | 932 |
| Total | 15,254 | |||||||
Table 4.
Parameters for training of suggest and enhancement networks.
| Loss Function | Optimizer | Mini-Batch Size | Learning Rate | Number of Epochs |
|---|---|---|---|---|
| Dice | Adam | 8 | 0.0001 | 50 |
Table 5.
Performance comparisons with or without enhancement network on the TDID dataset.
| Method | Testing Part 1 | Testing Part 2 | Testing Part 3 | Testing Part 4 | Testing Part 5 | Average | ||||||
|---|---|---|---|---|---|---|---|---|---|---|---|---|
| DSC | Acc | DSC | Acc | DSC | Acc | DSC | Acc | DSC | Acc | DSC | Acc | |
| SN | 0.574 | 0.825 | 0.540 | 0.806 | 0.572 | 0.824 | 0.533 | 0.844 | 0.554 | 0.822 | 0.555 | 0.824 |
| SN + EN | 0.609 | 0.856 | 0.529 | 0.860 | 0.652 | 0.861 | 0.566 | 0.856 | 0.626 | 0.859 | 0.596 | 0.858 |
Table 6.
Summary of segmentation performance with or without enhancement network on the TDID and 3DThyroid datasets.
Table 6.
Summary of segmentation performance with or without enhancement network on the TDID and 3DThyroid datasets.
| Method | UNet-Based Network | Residual UNet-Based Network | UNet++-Based Network | |||||||||
|---|---|---|---|---|---|---|---|---|---|---|---|---|
| SN | SN + EN | SN | SN + EN | SN | SN + EN | |||||||
| DSC | Acc | DSC | Acc | DSC | Acc | DSC | Acc | DSC | Acc | DSC | Acc | |
| TDID dataset | 0.555 | 0.824 | 0.596 | 0.858 | 0.464 | 0.825 | 0.517 | 0.851 | 0.573 | 0.822 | 0.612 | 0.850 |
| 3DThyroid dataset | 0.793 | 0.969 | 0.835 | 0.975 | 0.737 | 0.961 | 0.831 | 0.975 | 0.792 | 0.968 | 0.837 | 0.975 |
Table 7.
Segmentation results (DSC) of the TDID dataset according to the depth of the EN.
| Dataset | Network Configuration | Depth of SN | Only EN | ||
|---|---|---|---|---|---|
| Two-Scale | Three-Scale | Four-Scale | |||
| TDID | SN | 0.434 | 0.555 | 0.513 | 0.490 |
| SN + EN | 0.564 | 0.596 | 0.571 | ||
| 3DThyroid | SN | 0.654 | 0.793 | 0.828 | 0.737 |
| SN + EN | 0.808 | 0.835 | 0.838 | ||
Table 8.
Comparison of segmentation performance (DSC) between our proposed method and previous study on TDID dataset.
Table 8.
Comparison of segmentation performance (DSC) between our proposed method and previous study on TDID dataset.
| UNet Network [12] | Residual UNet Network [20] | UNet++ Network [21] | Proposed Network |
|---|---|---|---|
| 0.540 | 0.490 | 0.560 | 0.612 |
Table 9.
Comparison of segmentation performance (DSC) between our proposed method and previous study on 3DThyroid dataset.
Table 9.
Comparison of segmentation performance (DSC) between our proposed method and previous study on 3DThyroid dataset.
| Shallow UNet Network [36] | Shallow Residual UNet Network [37] | Shallow UNet++ Network (UNet++L2) [21] | Semi-Auto Segmentation Method [32] | Proposed Network | ||
|---|---|---|---|---|---|---|
| Level Set-Based Method | Graph Cut-Based Method | Classifier-Based Method | ||||
| 0.793 | 0.737 | 0.792 | 0.713 | 0.748 | 0.672 | 0.837 |
Publisher’s Note: MDPI stays neutral with regard to jurisdictional claims in published maps and institutional affiliations. |
© 2022 by the authors. Licensee MDPI, Basel, Switzerland. This article is an open access article distributed under the terms and conditions of the Creative Commons Attribution (CC BY) license (https://creativecommons.org/licenses/by/4.0/).
Share and Cite
MDPI and ACS Style
Nguyen, D.T.; Choi, J.; Park, K.R. Thyroid Nodule Segmentation in Ultrasound Image Based on Information Fusion of Suggestion and Enhancement Networks. Mathematics 2022, 10, 3484. https://0-doi-org.brum.beds.ac.uk/10.3390/math10193484
AMA Style
Nguyen DT, Choi J, Park KR. Thyroid Nodule Segmentation in Ultrasound Image Based on Information Fusion of Suggestion and Enhancement Networks. Mathematics. 2022; 10(19):3484. https://0-doi-org.brum.beds.ac.uk/10.3390/math10193484
Chicago/Turabian StyleNguyen, Dat Tien, Jiho Choi, and Kang Ryoung Park. 2022. "Thyroid Nodule Segmentation in Ultrasound Image Based on Information Fusion of Suggestion and Enhancement Networks" Mathematics 10, no. 19: 3484. https://0-doi-org.brum.beds.ac.uk/10.3390/math10193484
Note that from the first issue of 2016, this journal uses article numbers instead of page numbers. See further details here.