1. Introduction
The palm oil industry is of significant importance to the Malaysian economy. It contributes around 2.7% of Malaysian GDP and constituted 34.3% of total global palm oil exports in 2020. Malaysia, together with Indonesia, contributes to more than 80% of global palm oil production. As of 2021, Malaysia is the second-largest palm oil exporter, behind Indonesia. Around 2.26 million Malaysians earn a living from the palm oil industry as estimated in 2010 by Palm Oil World [
1]. Palm oil and its by-products have found applications in various downstream industries such as food and beverages, cosmetics, pharmaceutical, oleochemical, biodiesel, renewable energy, and advanced materials such as carbon nanotubes. Palm oil is the cheapest and most affordable edible oil. Thus, when there is a hike in the commodity’s price, it will undoubtedly raise food prices in general and contribute to inflation. The correlation between inflation and CPO price was found to be significant and positive in a study by Isa et al. [
2]. Palm oil price is highly sensitive to supply and demand shocks, as well as competition from producing countries and alternative edible oils.
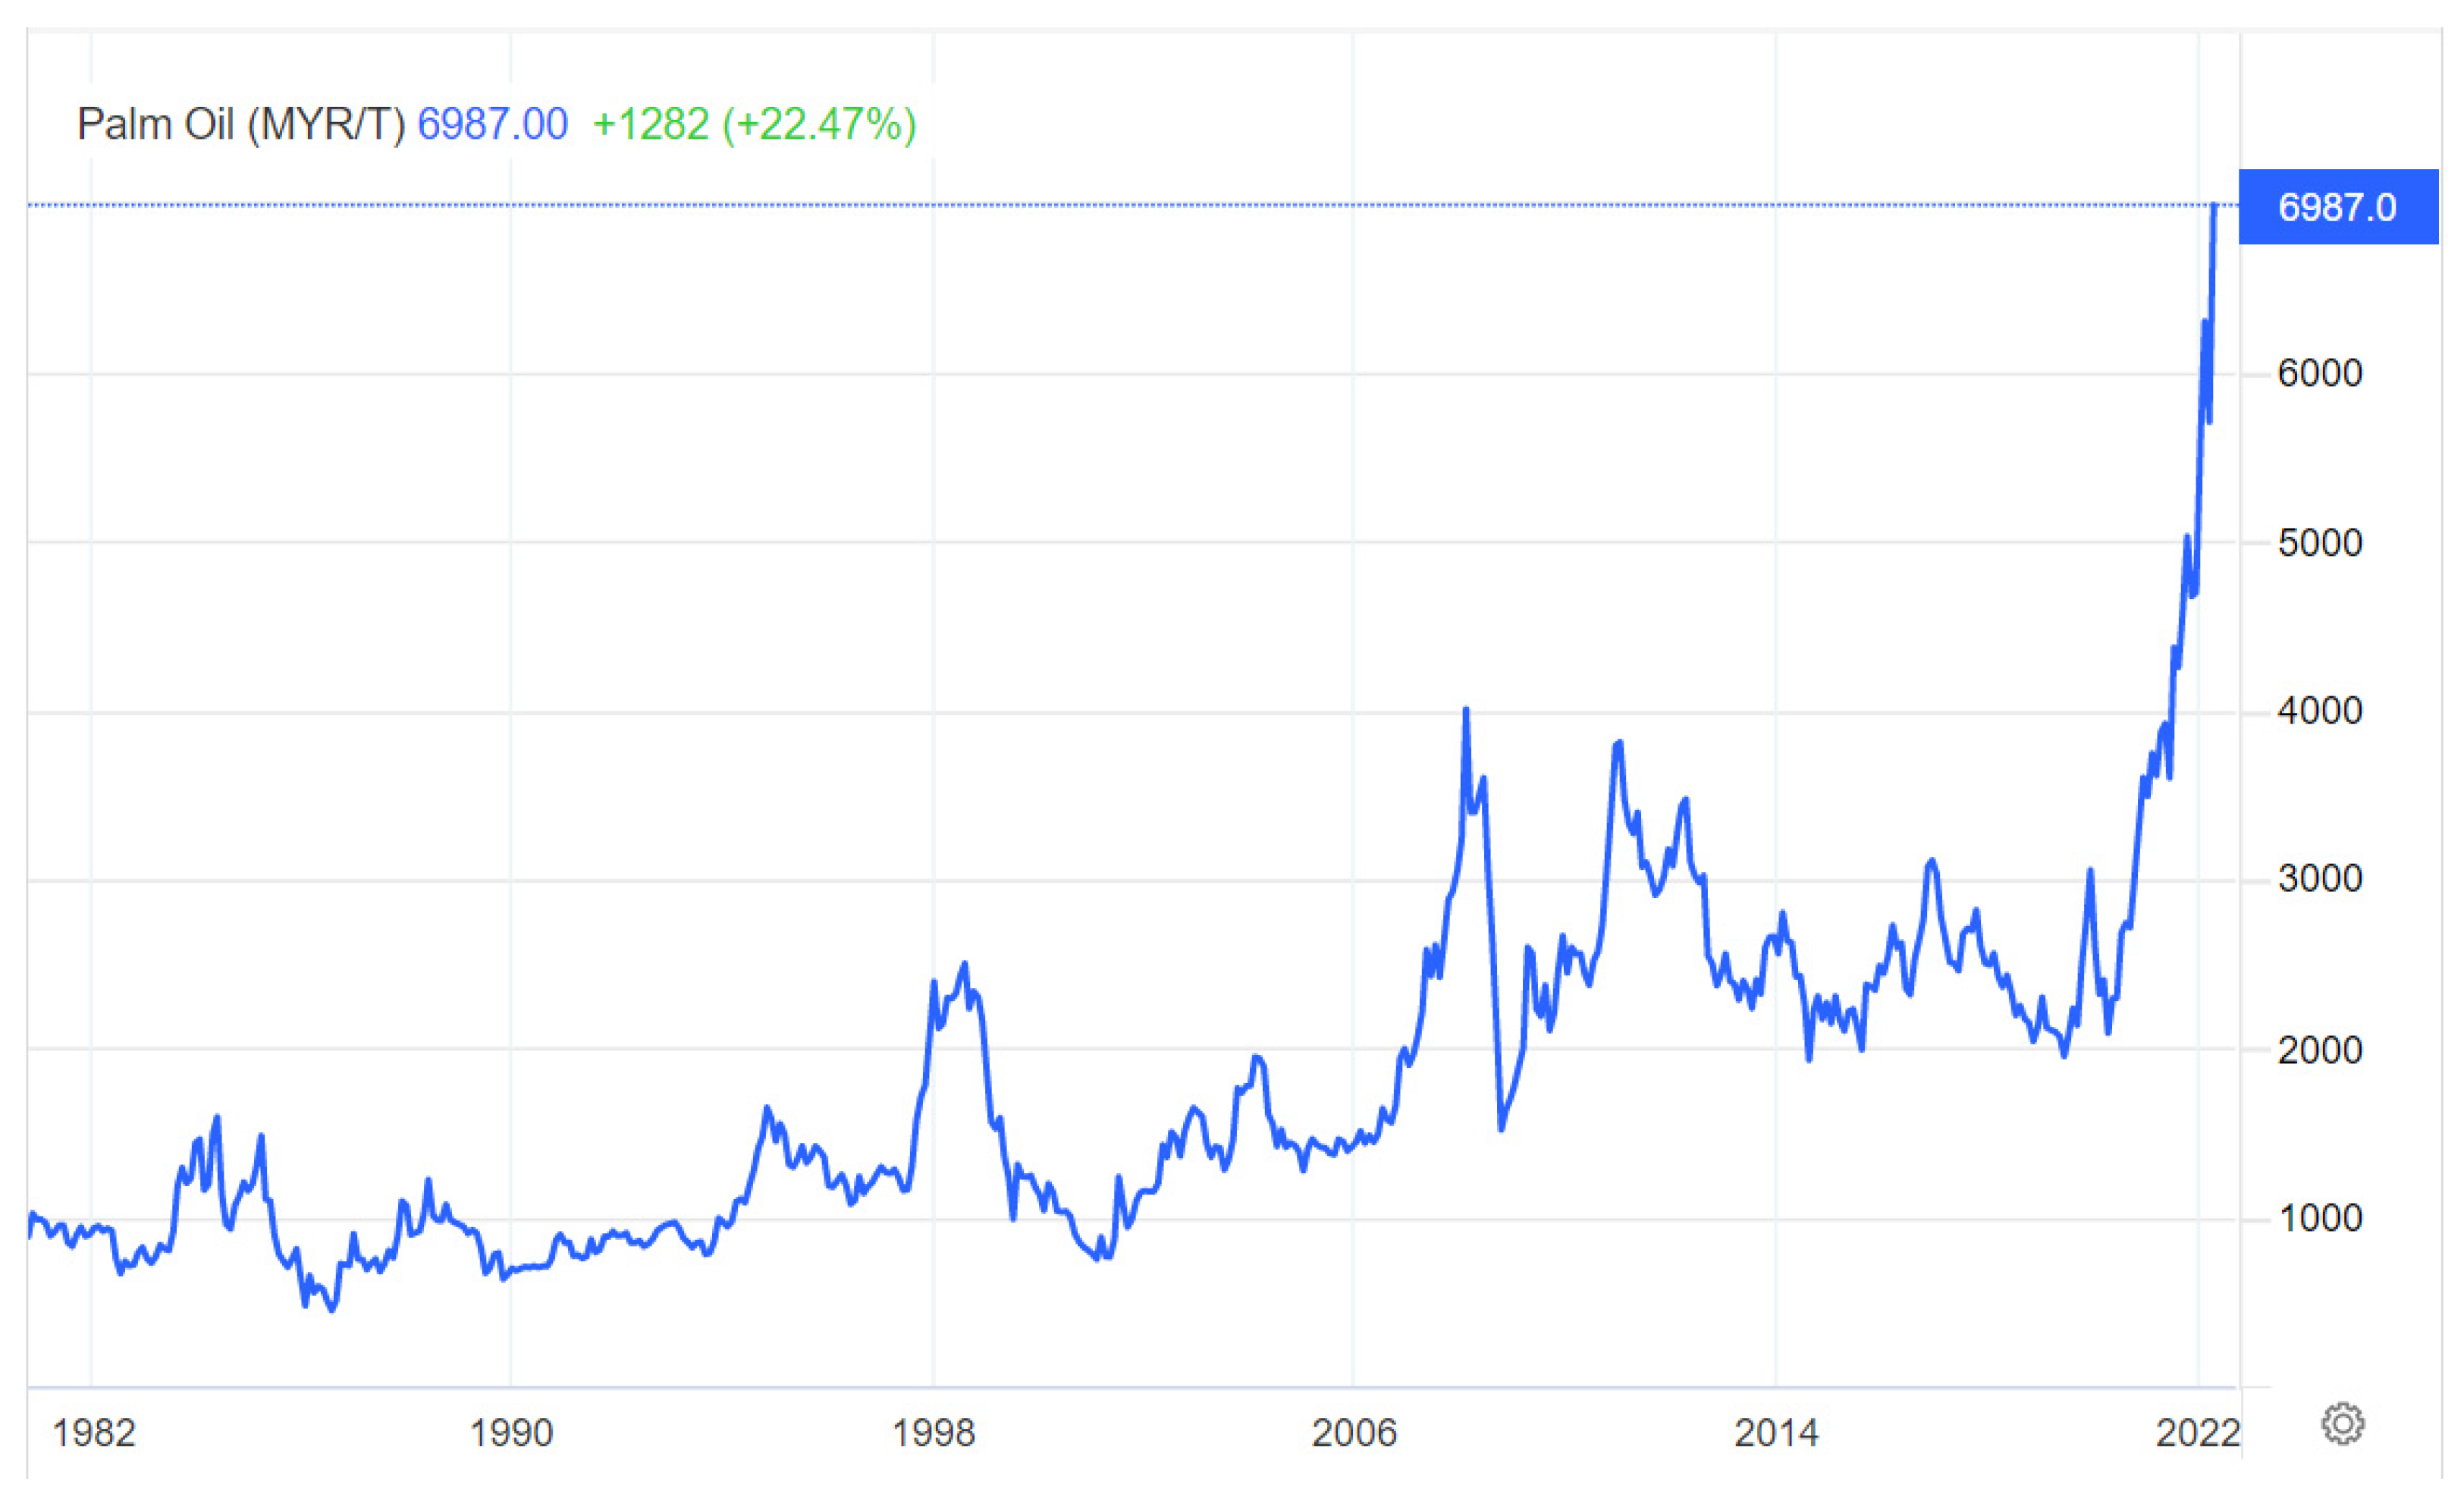
Figure 1 shows the movement of crude palm oil’s monthly average prices from 1980 to 2022.
It is obvious from
Figure 1 that the prices have not been stationary due to occasional clusters of high and low volatility periods together with time and seasonal trends. Various factors affecting supply and demand are responsible for these volatility clusters. The prices dropped significantly in 2008 due to the global financial crisis [
3]. El Nino induced-supply shortage sent the prices above RM 3000/MT at the end of 2016. During the low price-period, farmers are disincentivised from investing more in fertilisers, causing supply shortages and a consequent price hike, during which period the farmers are incentivised to invest more in fertilisers. Zaidi et al. [
4] found that amongst the endogenous shocks tested, the production shock affects the price most significantly, compared with other internal shocks. The Palm oil industry is also labour-intensive, and the COVID-19 pandemic-induced labour shortage sent the prices to levels above historical highs. The recent Ukraine–Russia conflict-induced shortage may be another key contributor adding to this price surge. As these two countries are the main suppliers of sunflower and rapeseed oils to the global market, shortages in these soft oils have forced consumers to shift to cheaper alternatives such as palm and soybean oils. Zaidi et al. [
4] concurred that external shock events such as soft oil prices and income shocks for significant trade partners have significant effects on palm oil prices.
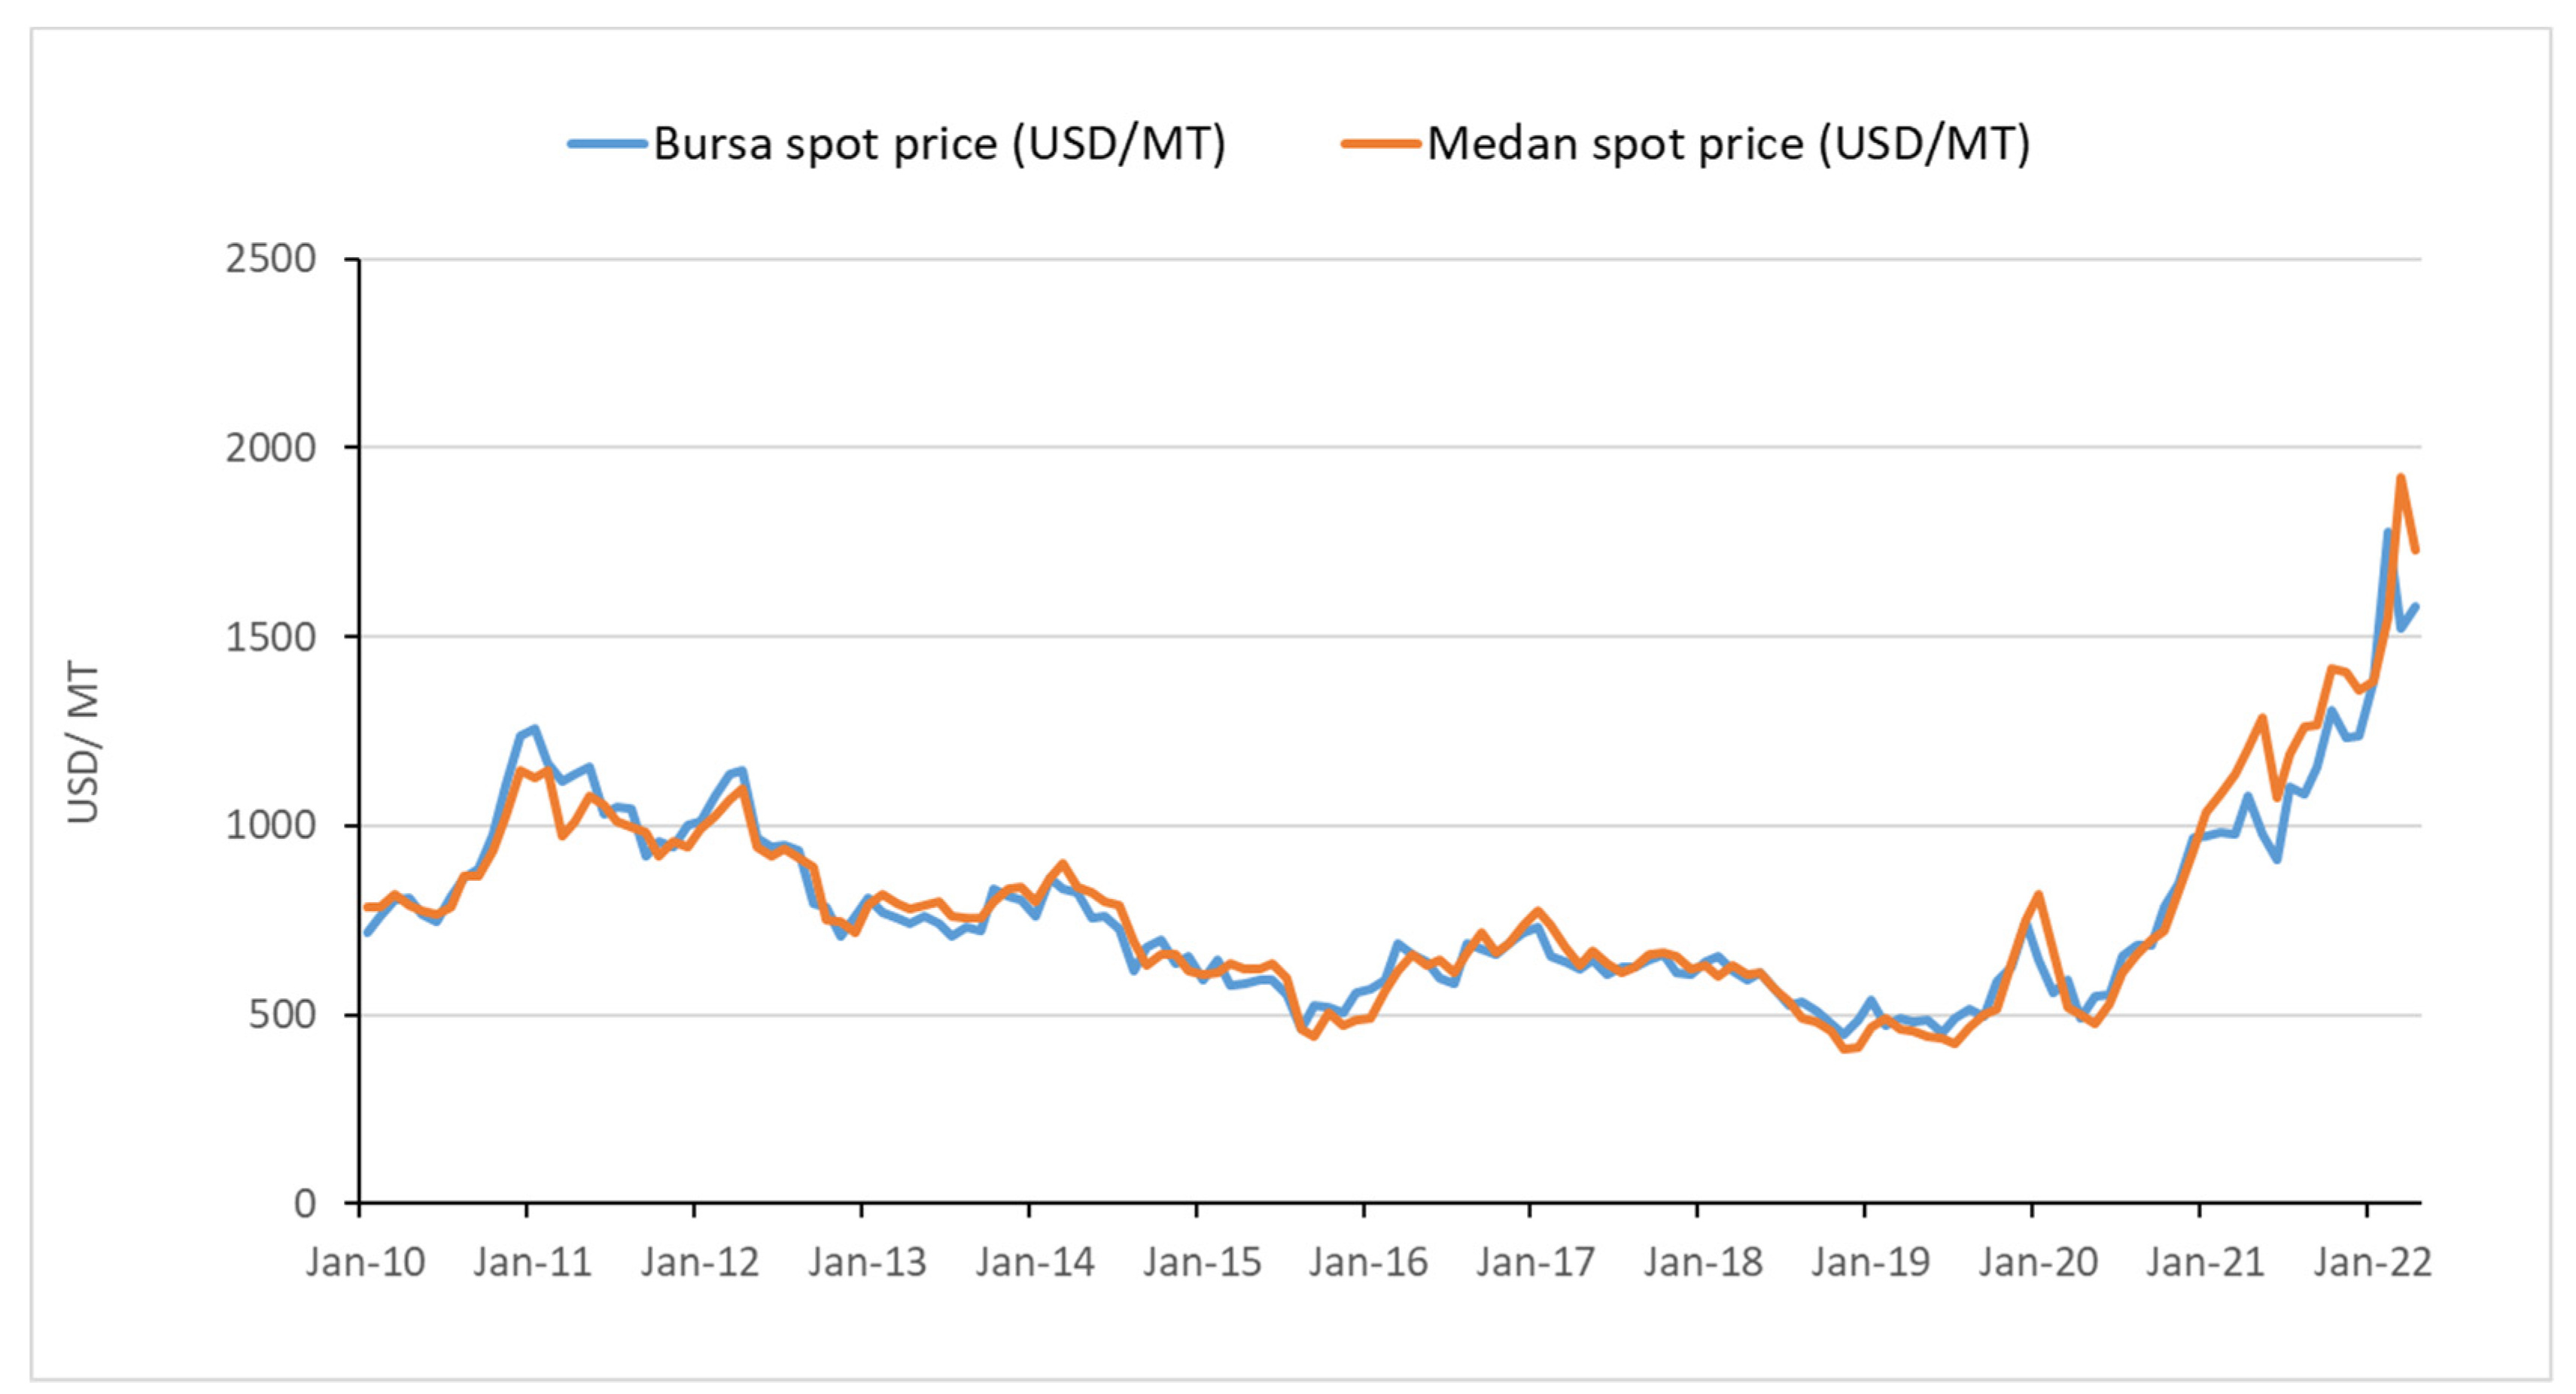
Figure 2 above shows a comparison between Indonesian and Malaysian palm oil prices. As the two largest palm oil producers, Malaysia and Indonesia are competing for the world market and hence the prices from these two countries trace each other. The policy made by each country, therefore, affects its competitiveness in the world market. For example, Indonesian palm oil export duty makes it less competitive than Malaysia and also less attractive to buyers such as India. Foreign exchange could also affect the buyers, for example, when the Malaysian Ringgit strengthens, Malaysian palm oil prices skyrocket, hence it becomes less attractive to buyers.
So far, there are few studies that have been specifically conducted to investigate the link between the COVID-19 pandemic or the recent Ukraine–Russia war on global palm oil prices. In comparison, there are ample studies on the impact of COVID-19 on general commodities reported in the literature, such as on crude oil and metal commodities. However, there is no direct causal relationship that can be discerned between the pandemic and the movement of these commodity prices since it is very difficult to disentangle or single out the pandemic effect from the plethora of many other impactful events (policy changes, political conflicts, weather anomalies, etc.) underlying the price movements. Hence the outcomes from those studies are mostly confined to comparisons between pre- and post-2020 price movements to gauge the impact of the pandemic, and in providing indications of whether there are significant differences between the two periods. For example, Gandhy et al. [
5] found that the market inefficiency between Indonesian spot market palm oil prices with the future markets in Malaysia and Indonesia existed before and during the COVID-19 pandemic but no causal linkage was identified. Thus, the question remains as to whether there has been any significant impact from the health crisis on palm oil prices. Owing to the difficulty in establishing this causal relationship, this study therefore focuses on rather more general health crisis indicators which not only include COVID-19 but also other epidemics that have stricken the world population in the past and elucidate the impact of innovations to palm oil prices.
There is abundant coverage in the literature on the impact of shocks on palm oil. Zaidon et al. [
6] investigated the relative importance of external and internal shocks on palm oil price using SVAR and found that external shocks influence palm oil price more than internal shocks. Zaidi et al. [
4] constructed a SVAR model to capture internal and external shock impacts on palm oil prices as well. The study pointed out that the income shocks in a major palm oil trading partner, i.e., India and the Netherlands, affect palm oil prices. They also concluded that soybean oil affects palm oil more than other edible oils. However, the study does not relate to the event of outbreaks, which sometimes do not cause macroeconomic shocks but rather a short but painful stock market panic. As palm oil is traded at bourses in real-time, it may well be affected by investors’ panic. This raises the question; namely, to what extent does a health-crisis-related shock impact Malaysian palm oil prices, and are these shocks more important and significant than other types of external and internal shocks?
The study linking macroeconomic shocks, specifically to Malaysian palm oil prices, is wanting at present. While some studies have utilised variables such as GDP and exchange rate as proxies to represent macroeconomic shocks (such as Zaidi et al. [
4]), they are however lagging and can only inform on the condition of an economy after the shock materialises. More foresight variables are therefore required. In this case, indices developed from news surveys are oftentimes regarded as more prescient since economic agents such as investors make future decisions based on current news. Baker et al. [
7] found that a policy on uncertainty-related shock foreshadows a decline in investment, employment, and output in the US and major economies. The indices are therefore reflective of what kind of future economic condition is foreseen by the economic agents. They are also tailored to consider many other interlinking factors defining a macroeconomic condition in general rather than limiting the definition of economic crisis to a single or few macroeconomic variables such as exchange rate, GDP, trade balance, or trade-weighted GDP based on the trade of a particular commodity. Due to the indices being the products of recent news surveys, they are more representative of what the public feel or perceive about the current economic condition rather than based on rational or lagged empirical findings. This is due to the fact that our access to fresh information is limited despite the advent of the internet and the ease and speed of sourcing information. The public often tends to act based on recent news in reaching investment and spending decisions rather than detailed empirical studies, as explained by Herbert Simon in his ‘bounded rationality’ theory [
8]. Jarociński and Maćkowiak [
9] found that a survey-based indicator of economic sentiment and activity is one of the variables involved in a VAR model with real GDP, price level, and the short-term interest rate reflecting US and Eurozone economies. It most likely implies interlinking Granger-causality, if not the real causality. Further, choosing indices based on news eliminates difficulties in finding suitable proxies for the economic shocks. This raises a query as to whether this perception-based indicator derived from news aggregator comprises a significant variable affecting the movement of a commodity price, especially that of the Malaysian palm oil.
This study will investigate the impact of the internal and external shocks on Malaysian palm oil prices using SVAR methodology. The study extends a similar SVAR impact analysis accomplished in the past on palm oil prices through employing relevant indicators or trackers that included various other determinants, namely the Infectious Disease Volatility Tracker (IDVT) and the Economic Policy Uncertainty Index (EPUI), to represent external shocks. By using these data taken from online sources (Federal Reserve Bank of St. Louis and International Financial Statistics databases) as well as offline sources (Malaysian Palm Oil Board), a SVAR model will be estimated using a software package (EViews 12) and the impulse response function plots will be generated using the same software to capture the impact on Malaysian palm oil prices. Details on the reasons for choosing IDVT and EPUI as the variables and the advantage of SVAR methodology over other methods are explained further below in 3: Data and Methodology.
This research extends the work completed by Zaidi et al. [
4] by incorporating the news-based indices. News-based indices can potentially uncover essential proxies for economic and policy conditions, as well as portend the investment decision-making and in turn the commodity prices. The observations highlighted at the beginning of this section indicate that palm oil prices, similar to any other commodities, are highly influenced by supply and demand factors, as well as the external events that affect them such as financial, economic, and policy shocks and the outbreak of war. This makes forecasting difficult and complicated, with time-varying volatility features often having to be included into the forecast model. The analysis of palm oil prices, therefore, requires taking into account the effect of externalities that influence its supply and demand as well as ensuring accuracy in the forecast. This study may further contribute to the subject matter and its related literature, in particular the role of health crisis-induced shocks represented by perception-based indicators on Malaysian palm oil prices whose coverage in the literature is still wanting. The contribution may induce awareness and appreciation in policymaking regarding the role of perception-based and news-influenced decision-making in the economy and specifically, in the movement of commodity prices.
The following section provides a literature review on previous findings and consequent conclusions made on palm oil price forecasting, as well as the methodologies employed, and comparisons made between them.
Section 3 entails the methodology employed, together with the data collected and how the research will be conducted.
Section 4 reports the empirical results together with a discussion on the findings. Finally,
Section 5 concludes the study and suggests some policy implications.
2. Literature Review
Researchers have essentially focused on finding the most suitable forecast model in terms of accuracy and efficiency, and the quest for the major determinants, external and internal, of the price movement. The external events hitherto considered in their models are the movement of substitute edible oil prices such as soybean, sunflower, rapeseed, coconut, olive, palm oil, and crude petroleum oil [
4,
10,
11,
12], foreign income [
4], and exchange rate [
2,
11]. Khalid et al. [
10] stated that the palm oil spot price is highly influenced by crude oil price, soybean oil price, and the palm oil stock. According to Zaidi et al. [
4], the impact on palm oil price is mainly due to increasing competitive edible oil prices such as soybean, rapeseed, sunflower, world palm oil, and also crude oil price. They concluded that income shocks in the Netherlands and India greatly impacted palm oil prices compared to income shocks from other Malaysian main trading partners in the commodity.
On the other hand, internal factors affecting palm oil prices such as GDP, palm oil stock, money supply, and inflation have also been investigated. Isa et al. [
2] investigated the effect of the exchange rate (EXC), money supply (M3), GDP, and inflation (INF) on Malaysian CPO price. They found that EXC had a negative correlation with CPO price, while INF, M3, and GDP showed positive correlations. The multiple regressions tests revealed that EXC and M3 were not significant determinants for the CPO prices whilst INF and GDP were significant. Zaidi et al. [
4] found through SVAR and impulse response technique that the internal production shock was the most impactful amongst endogenous variables on the Malaysian palm oil price movement. The relationship between palm oil price and its current production, stock, and sales (export, import, local sales) was investigated by AB Rahman [
13]. Another study that linked palm oil prices to these parameters was conducted by Alzaeemi and Sathasivam [
14] who employed a neural network technique called Radial Basis Function Neural Network (RBFNN). Khin et al. [
12] also included total palm oil demand and stock in their MARMA and VECM models.
Time series models utilized by researchers for palm oil price forecasting are Autoregressive Integrated Moving Average (ARIMA), ARIMA with exogenous variables (ARIMAX), Autoregressive Distributed Lag (ARDL), Vector Error Correction Method (VECM), Multivariate Autoregressive Moving Average (MARMA), Structural Vector Autoregressive (SVAR), Support Vector Regression (SVR), and correlation and multiple regression as well as the more sophisticated, artificial intelligence methods such as logic mining, Long Short-Term Memory (LSTM), and Radial Basis Function Neural Network (RBFNN). Khin et al. [
12] found that the MARMA model is more accurate and efficient than ARIMA and VECM (an improved type of Vector Autoregressive (VAR)) in terms of its statistical criteria for forecasting the spot palm oil price. Khalid et al. [
10] found that ARIMAX is the most accurate and efficient in forecasting palm oil price movement compared with ARDL and ARIMA. Zaidi et al. [
4] employed the SVAR technique to assess the impact of external shocks on Malaysian palm oil prices.
On modern methodology, Kanchymalay et al. [
11] found that while using machine learning to study the correlation between CPO prices and selected vegetable oil prices and monthly exchange rate, SVR provides better results compared with multi-layer perception. Kanchymalay et al. [
15] discovered that via a neural network technique called the Long Short-Term Memory Network (LSTM) the model that employed the technique predicted monthly price fluctuations with an average accuracy of 90%. Kee and Humaida [
3] found that the artificial neural network model gave a more accurate forecast than the ARIMA model for palm oil price movement between January 2008 and December 2018. Alzaeemi and Sathasivam [
14] employed RBFNN with different algorithms to forecast palm oil price movement. There is also an emerging modern methodology that has increasingly been applied by researchers to forecast time series, called the ‘fuzzy time series’ methodology, or FTS. Wulandari et al. [
16] for example discovered that a fuzzy time series-based forecasting model on palm oil production, based on palm oil planted hectarage provided an acceptable forecast over the 2000–2019 period when compared with the actual production figures.
Volatility clustering has been detected in palm oil price movement in some studies. For example, Maizah et al. [
17] while using ARMA and ARIMA to find the best fit for palm oil prices time series, found that the ARCH effect was present which led to non-normal residual, as well as volatility clustering. Hence, the team proceeded to utilise a hybrid ARIMA-GARCH model to capture the volatility effect and they discovered it to be the most appropriate for forecasting Malaysian CPO price. The same ARIMA-GARCH hybrid model is also a suitable forecasting method as shown by Ichlasul Amal et al. [
18].
The analysis of external shocks on palm oil price movement is almost unreported in the literature. Only Zaidi et al. [
4] covered extensively the effect of external shocks as well as internal factors, such as production and export, on the palm oil price. The study employed palm oil trade-weighted GDP as one of the variables in their model. However, the repercussion of using trade-weighted GDP is that it may ignore the fast-growing trading partners [
19], since it considers the top trading partners of particular goods of interest only in the weighted figure. Palm oil prices can be affected more than just via palm oil trade or via trade with partners not deeply involved in Malaysia trade relations, albeit indirectly via contagion of other prices volatility or even crises in some other countries that do not have significant palm oil trade footprints with Malaysia.
The aforementioned researchers employed numerous methodologies by either utilising GDP or its variants to represent exogenous macroeconomic variables in their models. Some models included additional variables such as crude oil price, exchange rate, and alternative edible oil prices. A few studies have employed indices that holistically represent the state of public perception of current economic condition. This study is unique and differs from past studies in that it employed perception-based indices to represent macroeconomic shocks rather than utilising GDP or modified GDPs. GDP is a lagging indicator and is seldom used by investors to gauge investment in the short-term. Investors are largely reliant on news, which is the rationale behind choosing the perception-based indices.
4. Results and Discussion
Hereinafter, all series of the dependent variables considered in this study, regardless of whether they were removed from the model later, are referred to by their acronyms in the brackets as follows: Malaysia’s domestic palm oil price (MPO), world or Rotterdam palm oil price (PO), world soybean oil price (SBO), world sunflower oil price (SFO), world rapeseed oil price (RPO), infectious disease movement tracker index (IDVT), economic policy uncertainty index (EPUI), world crude oil price (CO), Malaysia’s ringgit exchange rate (EXR), Malaysia’s palm oil production (PROD), Malaysia’s palm oil stock (STOC), and Malaysia’s palm oil export (EXP or EXP01 (EXP01 is the name assigned automatically by Eviews 12 to distinguish it from other function called ‘exp’)).
4.1. Stationarity Test
All series were examined for stationarity. Based on the Augmented Dickey–Fuller unit root test, almost all the time series were non-stationary at their level series at all significant levels (1%, 5%, and 10%) except for EPUI (stationary at 5%) and SFO (stationary at 10%) and hence needed to be differenced at least at the first difference. However, for SVAR modelling, this was not an obligation as the purpose of this model was to examine the cross-relation between the dependent variables and differencing which will lead to a loss of trend or co-movements of the variables. Moreover, there is always a trade-off between loss of efficiency when VAR estimation is performed at a level without cointegration and differencing and loss of information when the estimation of VAR is conducted at differenced series [
25]. Therefore, this study proceeded with using level series without any differencing employed for our SVAR modelling. All the outcomes from stationarity testing are summarized in
Table 1. The outcomes show that most of the series were not stationary at level but stationary at first difference. Only EPUI was stationary at level and was significant at 5%.
4.2. Setting of Restrictions and Lag Length
Table 2 below shows the contemporaneous causality relationship between variables as extracted from the literature. If a cell mentioned YES, it means that the variable in the column header of the cell contemporaneously affected the variable in the row header of the cell, while NO meant otherwise. No dynamics were assumed between CO and EXR. This aligns with the findings from Abdul Hadi et al. [
26] who investigated the relationship between crude oil price and Malaysian ringgit per US dollar. Nordin et al. [
27] found unidirectional causality that the exchange rate affected crude oil at a 10% significant level, but the finding was not significant at the 5% level. CO was assumed to affect PO and MPO but not SBO. This is based on the fact that the petroleum price affects fertiliser cost which in turn influences the production cost of edible oils [
28]. Hence, when the CO is hiked, so is the cost of producing edible oils and hence the prices. Hameed and Arshad [
29] showed that there is a long-run co-movement between crude petroleum prices and edible oils studied which includes palm oil, rapeseed oil, sunflower, and soybean oil, since palm oil initiated the information spillover to the other vegetable oil, and SBO is less affected by energy price at its input side. As per Brümmer et al. [
28], this study only assumed that CO will affect PO and MPO.
Although SBO is not affected by CO, it affected by IDVT, and it also affected PROD and EXP01 which are related to Malaysian palm oil production and export, respectively. For example, when SBO is high, PO and MPO follow suit, as purchasers demand lower-priced palm oil, hence boosting production and export from Malaysia and also from other suppliers. As SBO is the next best alternative edible oil in the main importing countries, such as India, any hikes in SBO will induce them to shift to cheaper palm oil. PROD and EXP01 are also impacted by CO, since it is part of the cost in the production of palm oil (to power the mill, transport the oil, and competition in local and international biodiesel markets).
This study also assumed that none of the other variables affected EXR. This was based on the fact that palm oil trading accounts for less than 5% of the total goods traded between Malaysia and the other countries (COMTRADE). This is in contrast to Zaidi et al. [
4] who assumed that EXR is affected by all of the other variables. EXR was also assumed not to affect other variables as Malaysia is a small and open economy. Malaysia’s palm oil production (PROD) undoubtedly affects Malaysian palm oil prices (MPO), although it does not affect the world palm oil prices (PO) directly, but it determines the amount to be exported (EXP01). EXP01 is also affected by PO rather than affecting PO. PO on the other hand is affected by CO and IDVT. Palm oil, despite being the cheapest of edible oils, is least attractive in Europe due to vehement European propaganda against it, and it is mostly used as feedstock for biodiesel production; hence, it is affected by CO. PO, in turn, affects the export of palm oil (EXP01) as mentioned below. Malaysia’s palm oil export (EXP01) was assumed not to affect all variables; however, it is affected by both MPO and PO, SBO and also PROD. This is due to the fact that Malaysia’s palm oil is an alternative edible oil to SBO and PO, and the exported amount is subject to availability which is determined via PROD. EXP01 is also affected by CO as palm oil is a feedstock for biodiesel production.
The study assumed that EPUI affects IDVT but not vice versa, as economic uncertainty is a subset of the many determinants of IDVT [
23]. Thus, it can be said that both EPUI and IDVT are exogenous shocks from EPUI and may cause contagion into IDVT. IDVT in turn affects all edible oil prices (PO, MPO, SBO, and substituents such as RPO and SFO). Bear in mind that variable exogeneity in SVAR modelling is not pure exogeneity since in the model, the purely exogenous variables are the ones that do not appear in lag of other variables (such as the constants). The SVAR modelling in this study utilized either EPUI or IDVT at a time to inject the effect of macroeconomic shock into the models and compare findings from both cases. For each of the cases, the study also tested the robustness of the model by changing SBO with RPO and SFO. Thus, there were six variants of the model to be compared. The relationships outlined in
Table 2 are utilised later for the setup of structural matrix A restrictions.
A try-and-error methodology was employed to find the optimal lag length. The number of lags need not be too high to prevent overconsumption of degree of freedom and introduction of multicollinearity or not too small to prevent specification error [
30]. The trial was commenced with four lags (
k = 4) for each of the variables, followed by
k = 2. Summary results comparing the Schwarz Bayesian Criteria (SBC) value of each of the models at different lags are given in
Table 3.
Based on the above table, the lowest value of SBC was achieved when lag 2 was implemented rather than lag 4 for each of the palm oil substitutes. Together with the concept of parsimony, we chose the two−lag model for our further analysis. This was also to reduce the number of lagged variables and lower the risk of multicollinearity. Previous SVAR models for palm oil time series also adopted a two−period lag model [
4,
6].
4.3. Structural Factorisation and Impulses Response Findings
Now the structural matrix A was recovered from the specified model, whereby the matrix indicates the contemporaneous dynamics amongst the variables. To enable the estimation of this matrix, additional restrictions were applied to the model. For a purely recursive model, all coefficients above the principal diagonal were set to zeros. For this exercise, two approaches were used; first, the restrictions by Zaidi et al. [
4] for variables other than IDVT (whereby restriction for IDVT were set by the author) and the second approach utilized the restrictions set in
Table 2. As the data period was quarterly, the contemporaneous relationship between the variables was defined as the relationship that occurred within a quarter.
The first restriction matrix based on
Table 2 is shown in
Table 4. Variables in the column header contemporaneously affect variables in the row header by the value of the coefficient in the box at the intersecting column and row contemporaneously. The second restriction matrix is shown in
Table 5.
In the second restriction matrix, the same restrictions imposed by Zaidi et al. [
4] were adopted except for IDVT where a new set of restrictions were imposed. These restrictions assumed that IDVT affected only the Malaysian ringgit exchange rate (EXR) due to EXR being the only domestic variable directly linked to macroeconomic shock via trade channels. As Malaysia is a small and open economy, EXR does not affect or cause macroeconomic shock and hence does not influence IDVT. The world crude oil price or CO is exogenous and is not affected by any other variables as it is the one affecting supply and demand factors [
4].
Zaidi et al. [
4] imposed a single relaxation of restriction above the main diagonal (at the intersection of column PROD and row PO) reflecting the effect of Malaysia’s CPO production on the world’s crude palm oil price, owing to Malaysia’s status as one of the major palm oil producers globally. As Malaysia is a small and open economy, its domestic variables do not have a contemporaneous effect on the foreign variables, but conversely the foreign variables can have an exogenous effect on the former. Hence, for the second restriction, this study assumed EXR did not affect the other variables but instead was affected by other variables. They did not incorporate IDVT in their study; hence, this study assumed the general economic shock did not affect commodity prices but it was the reverse which implied that IDVT’s contemporaneous effect on SBO, PO, PROD and MPO would be zero.
For both sets of restriction matrices, CO was assumed exogenous as it was the principal factor behind the shocks in supply and demand. In an SVAR model, any exogenous variables act as a pure input (at which impulse or shock is generated for impulse response analysis) without the ability to generate output or the impulse response from the shocks in other variables, in contrast to a semi−exogenous or purely endogenous variable that is affected to some degrees by other variables and hence is able to produce impulse responses. The purpose of utilising two different restriction sets, one being freshly set by this author, while the other set by Zaidi et al. [
4], was to ensure the robustness of the model being discussed here.
The recovered structural matrix A for both set of restrictions of the chosen two−period lagged model are shown in
Table 6 and
Table 7. The matrix (
Table 6) was revised further to exclude coefficients with very low values and not significant at the 5% level.
Table 8 below shows the removed/zeroised coefficient (shaded blue). The contemporaneous effects that were no longer applicable according to these revised restrictions were CO on EXP01, SBO on PROD and EXP01, PO on EXP01, and MPO on EXP01.
Table 9 depicts the recovered structural matrix A under the restrictions outlined in
Table 8.
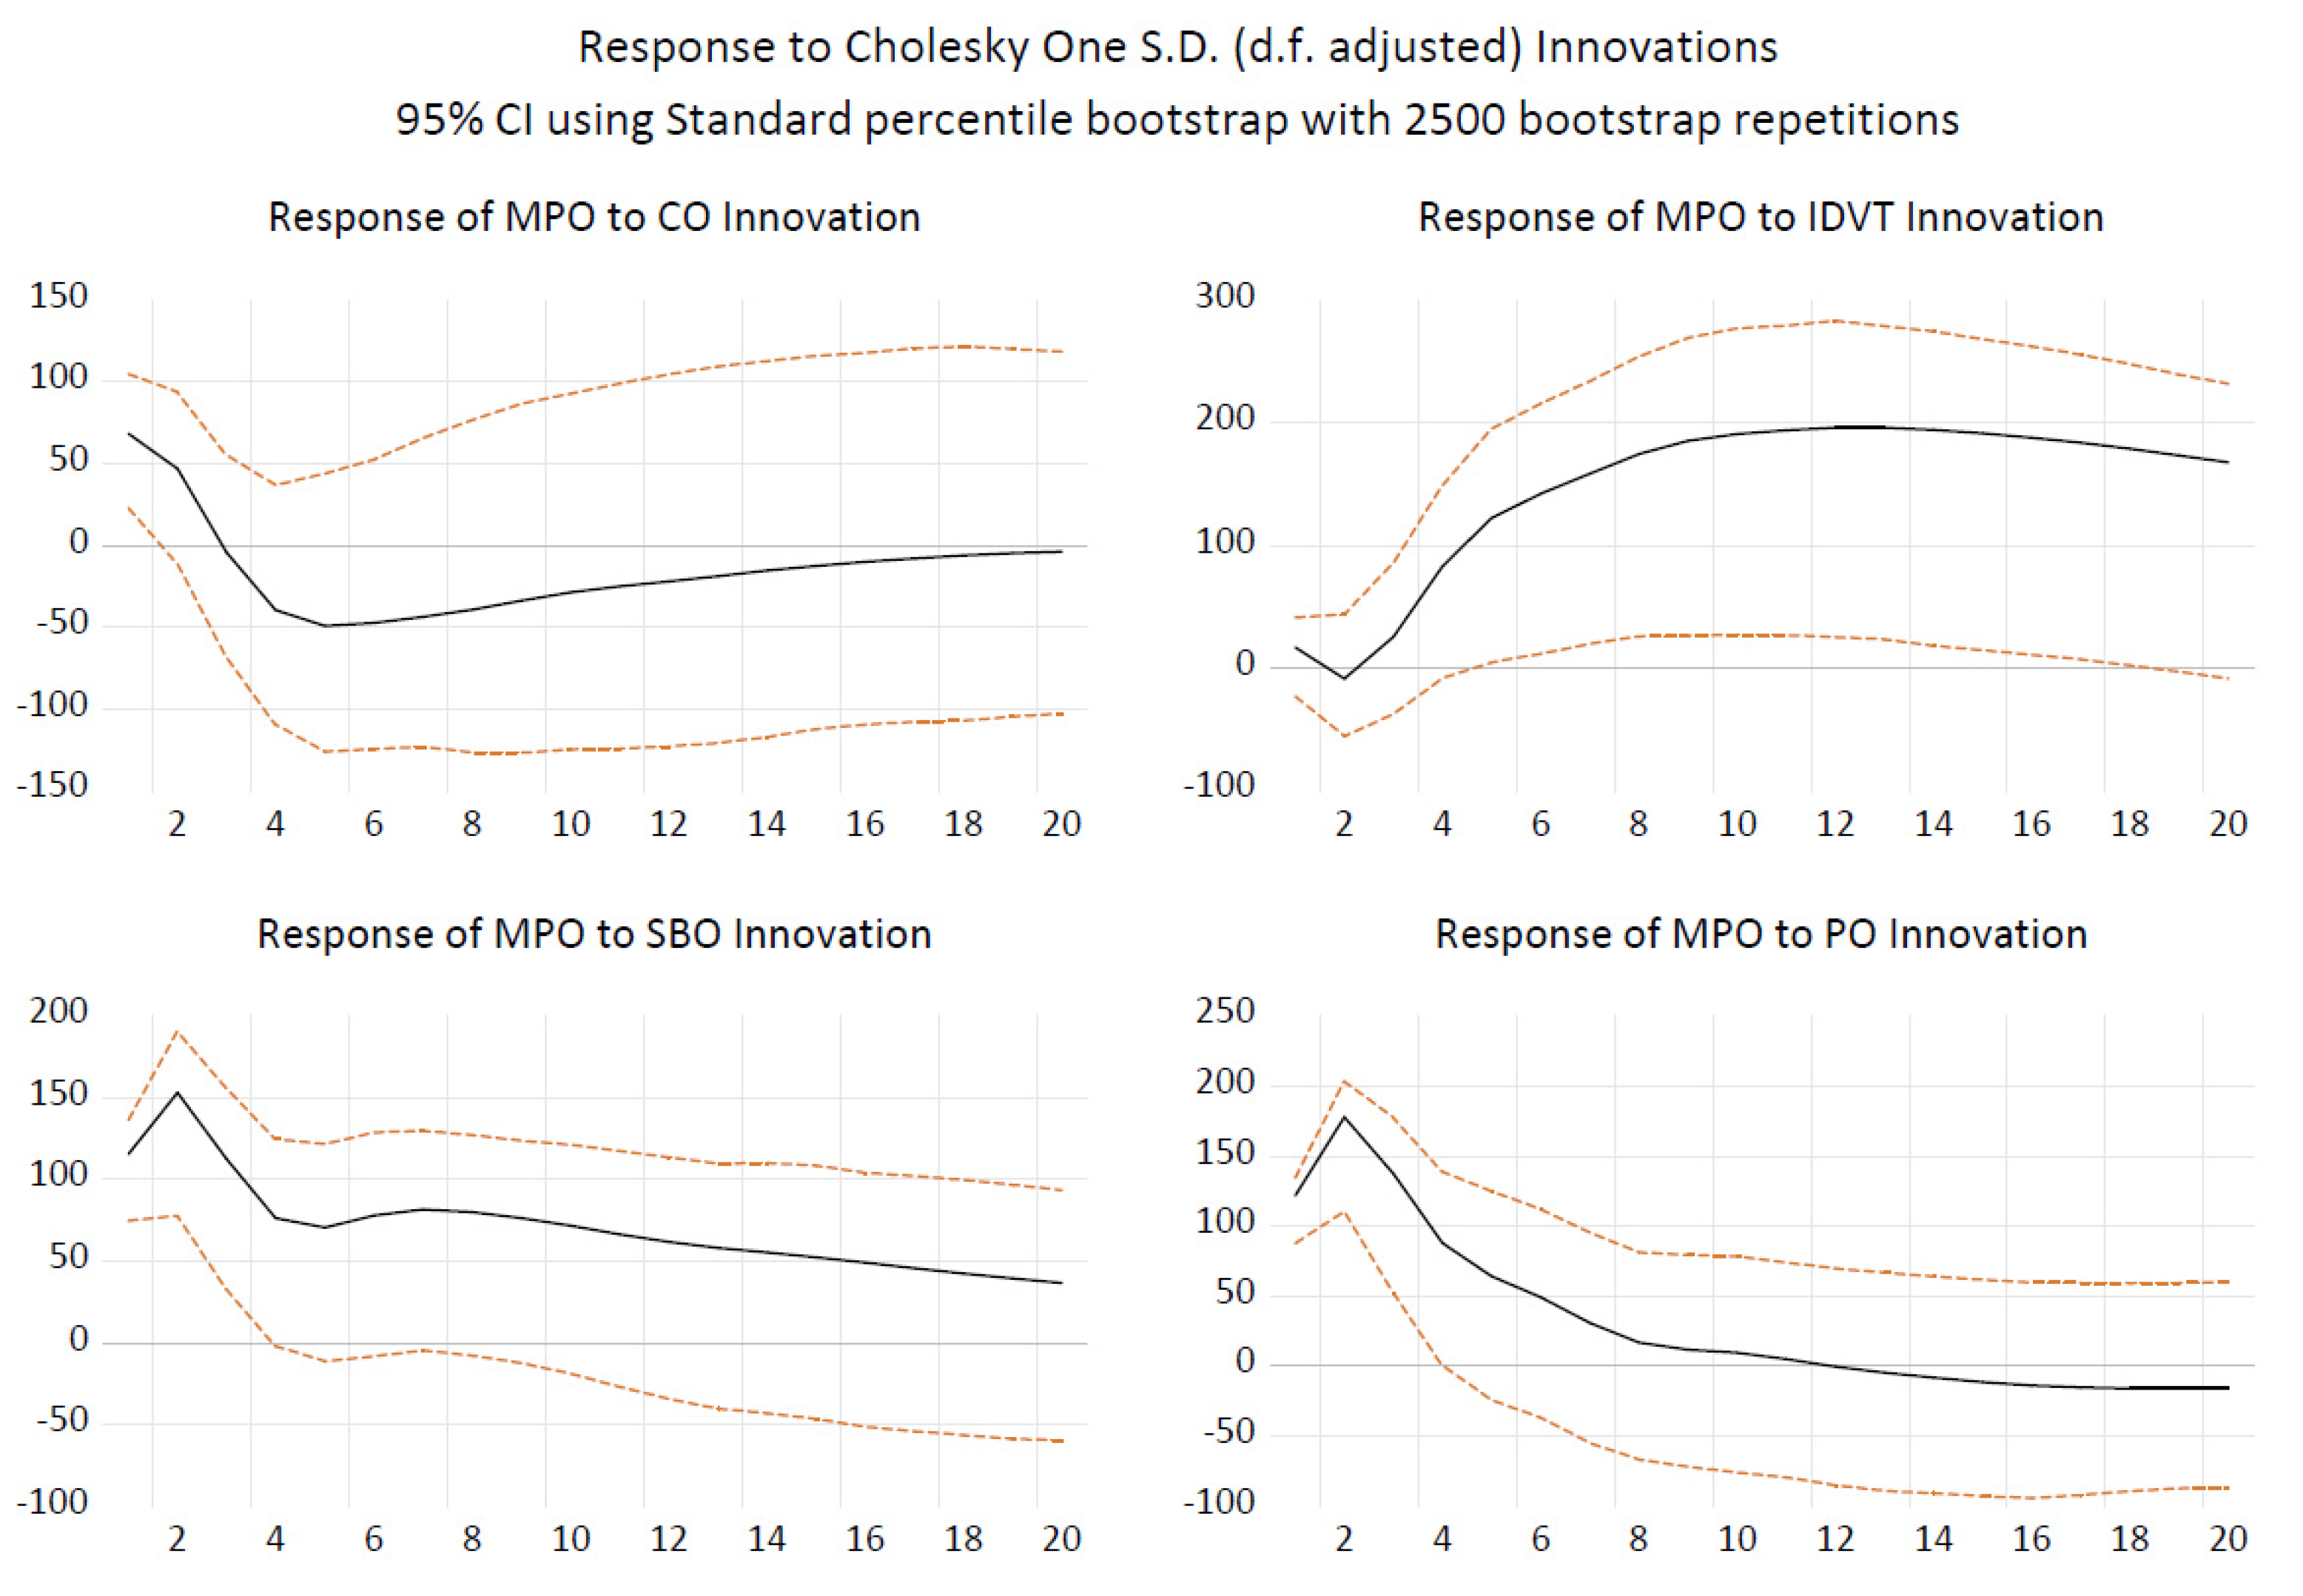
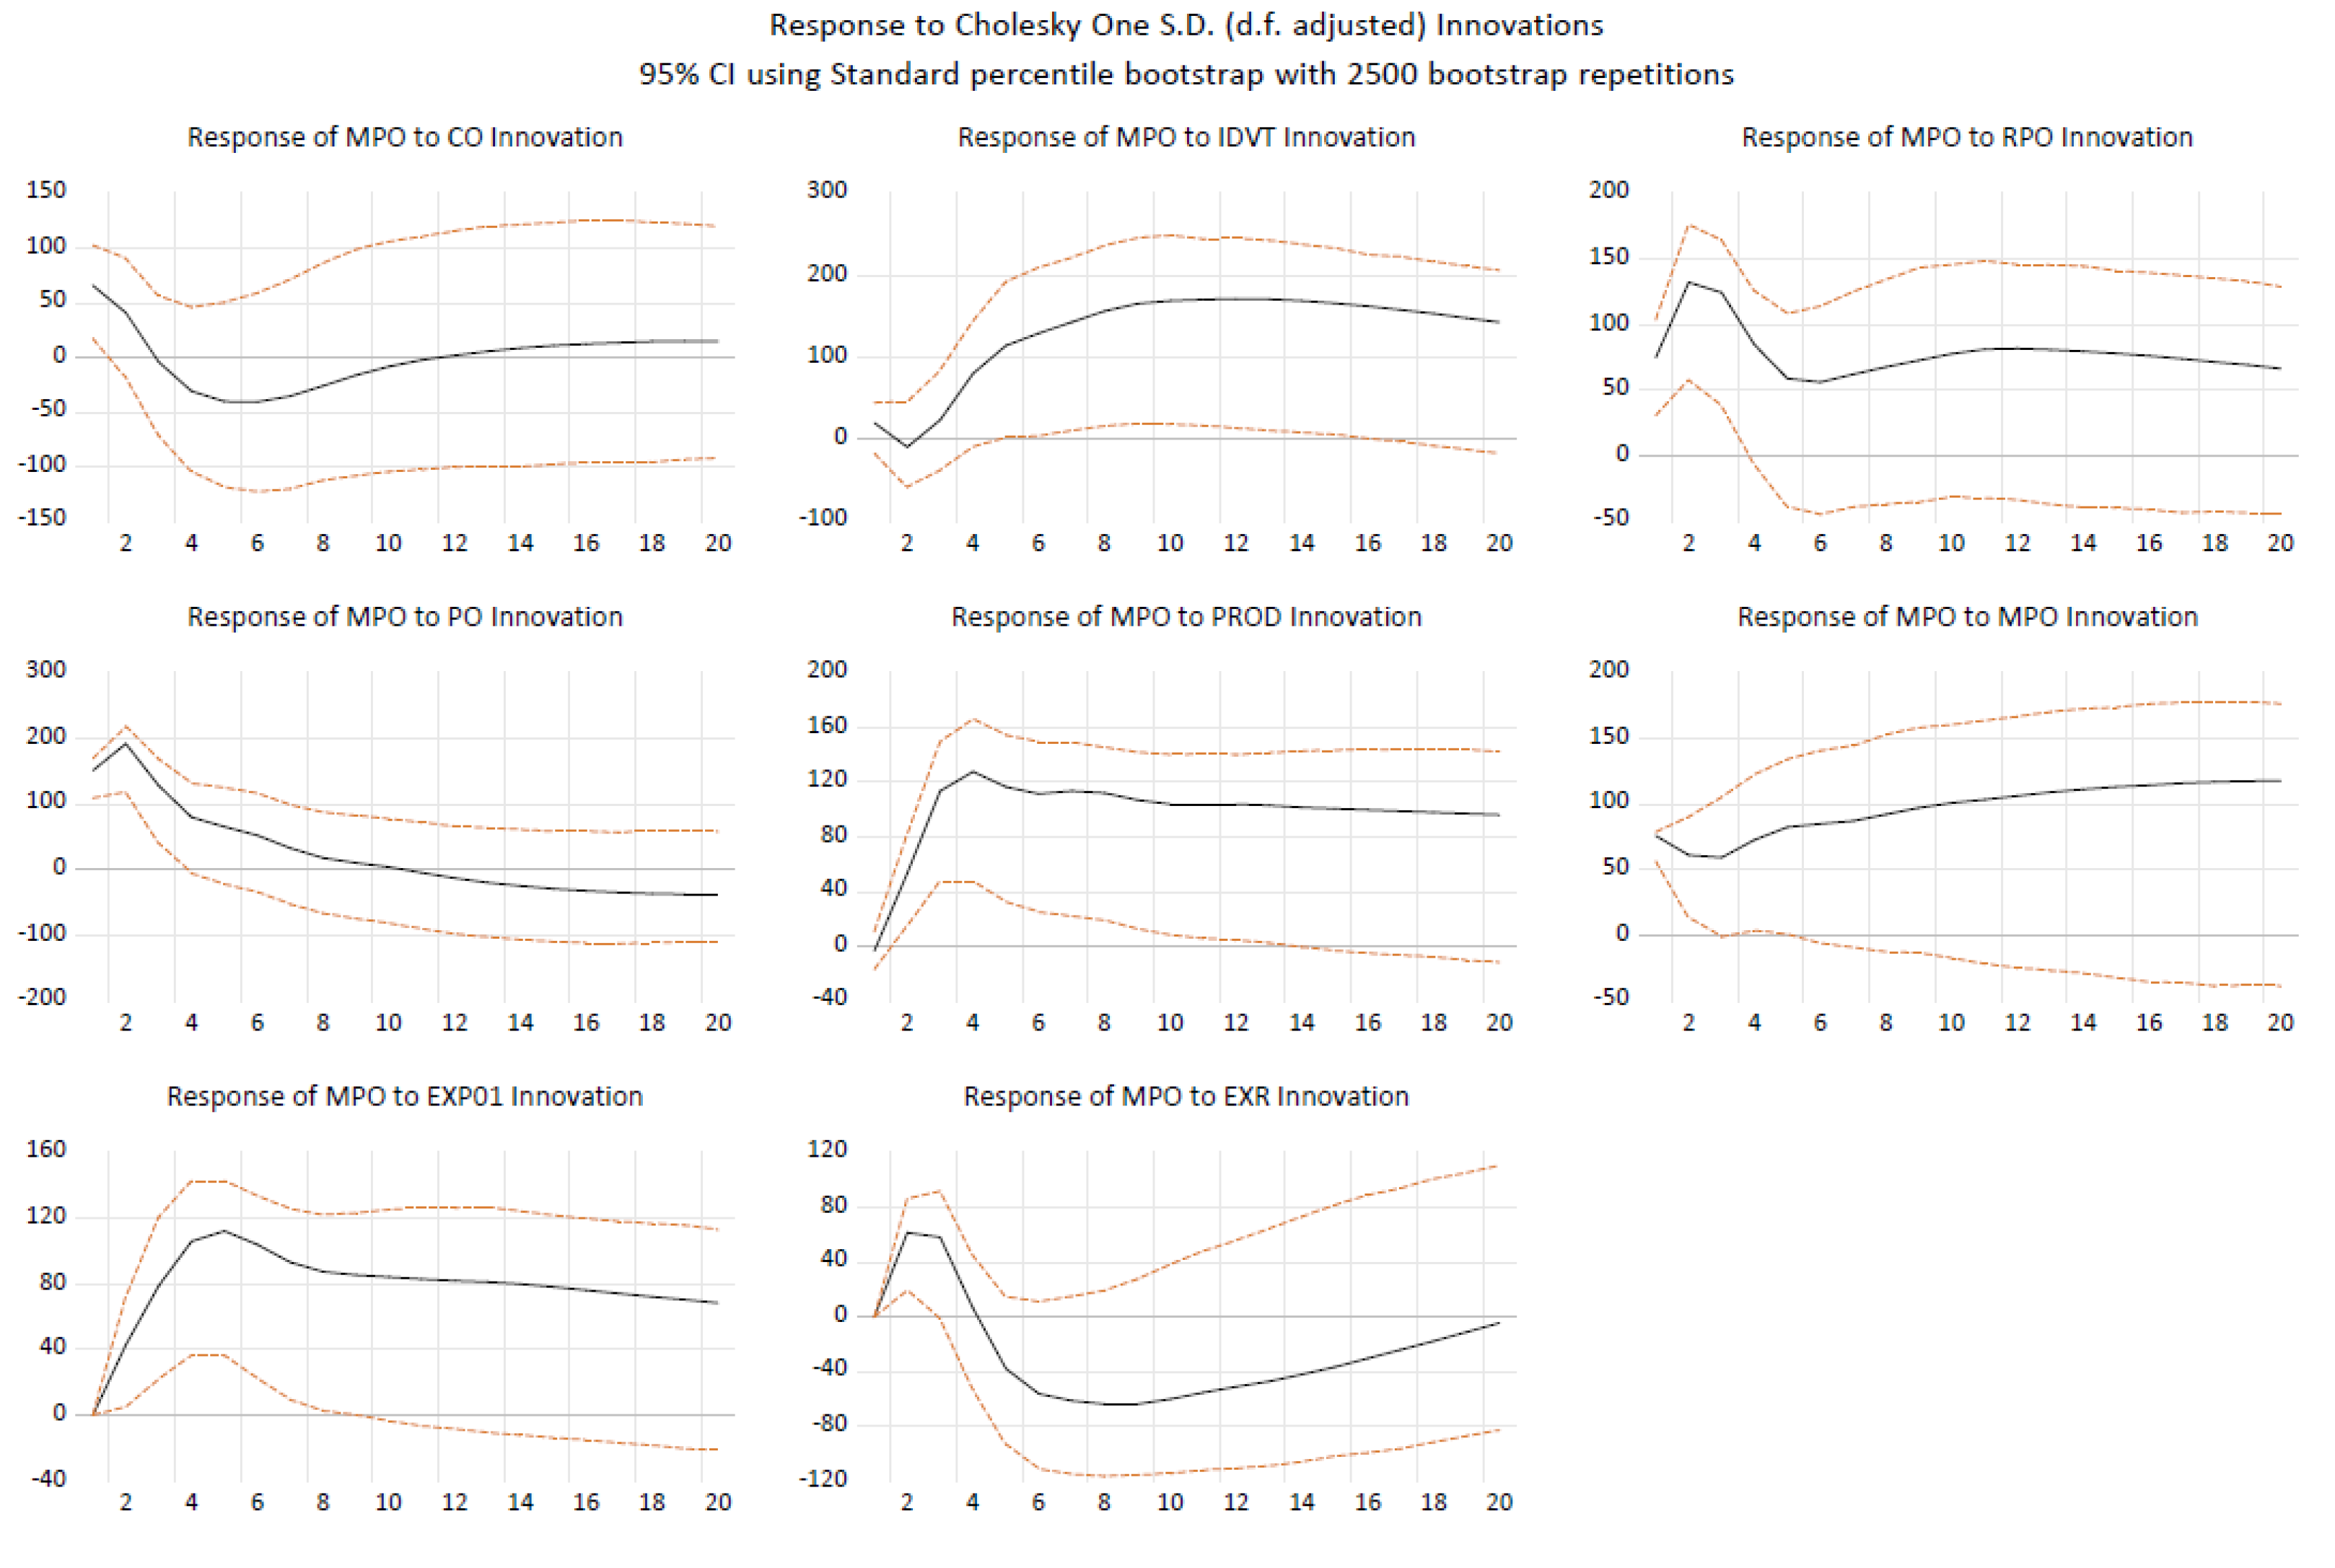
An impulse response via the bootstrapping method with 2500 bootstrap repetitions was carried out to obtain the response of Malaysian palm oil prices (MPO) to the innovations or shocks in the exogenous variables, comprising PO, CO, SBO, and IDVT. The outcomes are depicted in
Figure 3, showing responses of MPO in RM/MT. Based on the outcomes, it is obvious that the CO shock affected MPO movement positively (around RM60/MT in the first quarter) but temporarily over the span of about two quarters. The positive impact was, however, not significant in the long run. CO shock imparted the highest negative impact on MPO (around RM50/MT in the fifth quarter) compared with the MPO impacts from shocks in other exogenous variables (PO, SBO, IDVT), before slowly subsiding within 20 quarters thereafter. However, the negative impact from CO to MPO was not significant. Shocks from IDVT created the most long-lasting and highest positive impact. During the first two quarters of the innovation, MPO declined marginally; however, it rebounded from the third quarter onwards to a peak of around RM200/MT before slowly drifting into the horizon, suggesting that MPO may have entered a new price regime as it declines very slowly. Shock in the world soybean oil price (SBO) imparted a much longer-lasting positive change in MPO (lasting for around eight quarters) than the shock in the world palm oil price (PO) which lasted for only four quarters.
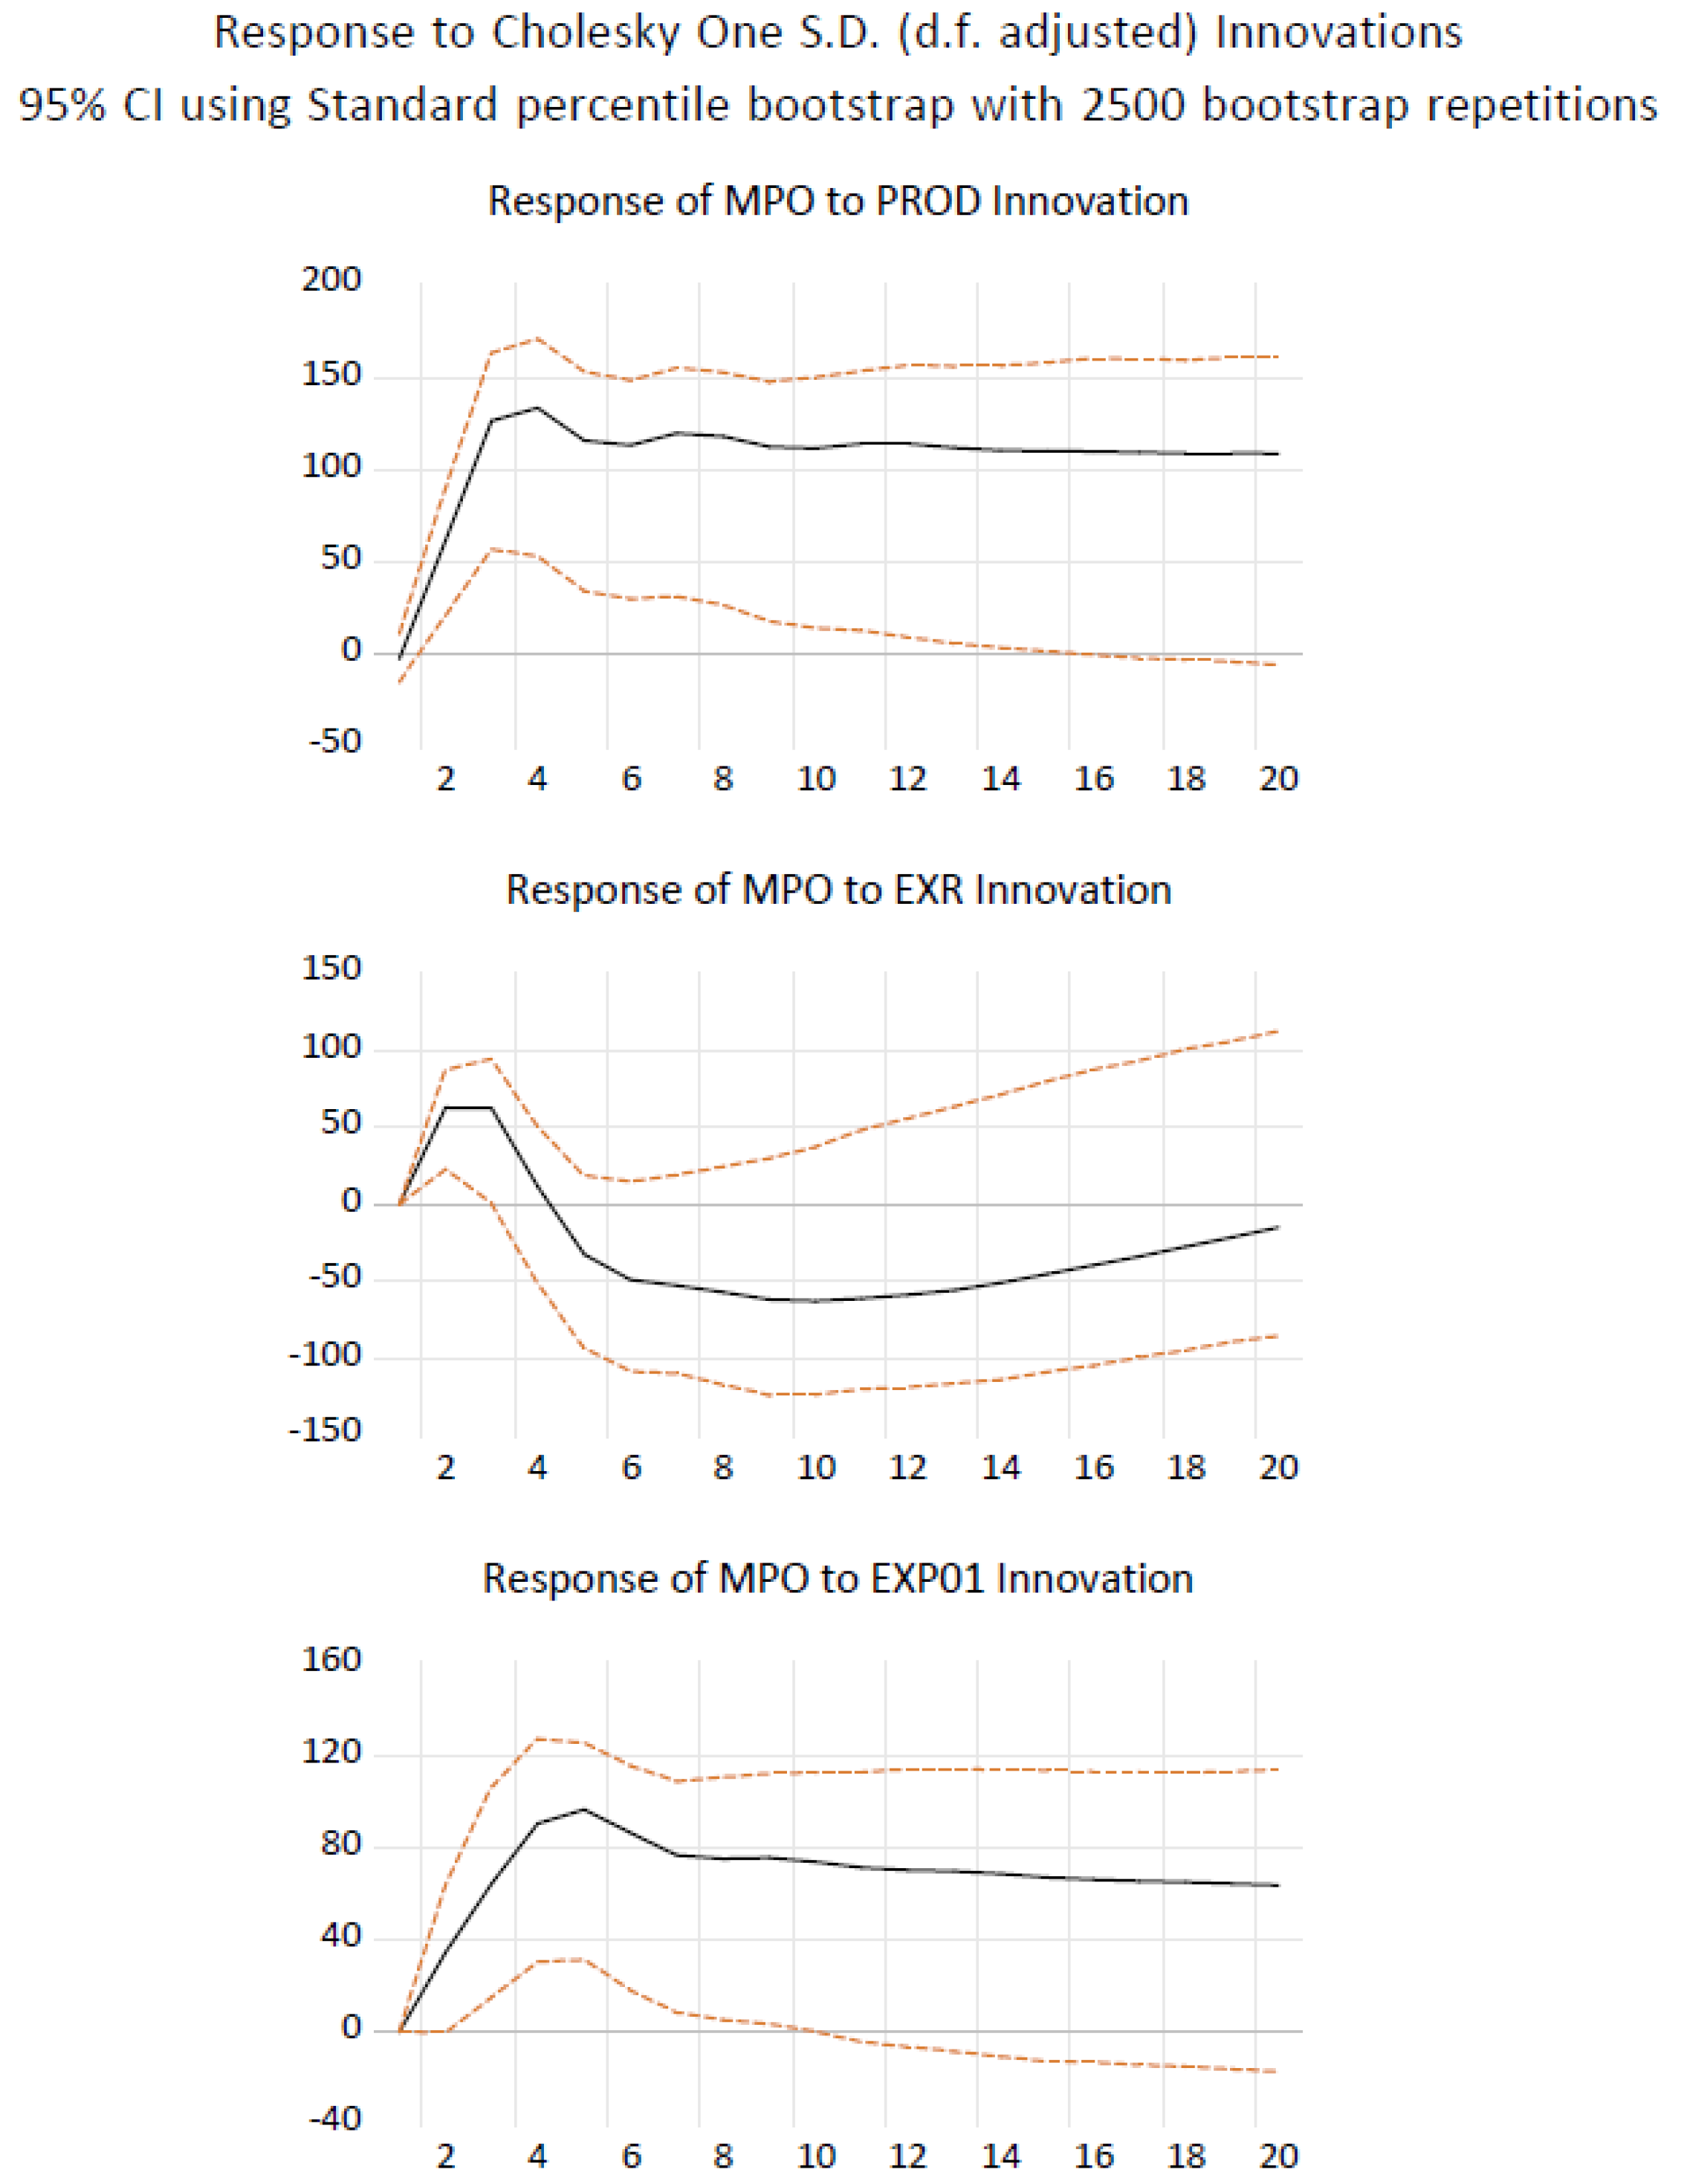
The impulse response was repeated with endogenous variables namely PROD, EXP, and EXR. PROD affected MPO more significantly than the other endogenous variables, which is aligned with previous finding [
4]. The outcomes are depicted in
Figure 4. PROD shock resulted in MPO’s impulse peaking at RM140/MT in the fifth quarter before it levelled off to around RM100/MT into the horizon. It is worth noting that the shock in Malaysia’s exchange rate (weakening shock) resulted in an increase in MPO of up to RM50/MT during the first three quarters before sharply reducing to a peak decline of RM60/MT in the tenth quarter, and subsiding thereafter. EXR weakening, therefore, had a delayed negative impact on the palm oil prices in Malaysia.
Table 10 above shows the outcomes of the forecast error variance decomposition conducted on the MPO series, with 20 steps ahead considered for the projection. The Exogenous column depicts the total contribution of all exogenous variables, while the Endogenous column depicts the same for all the endogenous variables. All figures are in percentages except those for Step and S.E. Based on the outcomes above, the exogenous variables (PO, CO, IDVT, SBO) accounted for a larger portion comprising 57.9% of the MPO variance at Step 20 of the forecast. From Step 1 to Step 20, it remained the larger contributor than the endogenous block. IDVT comprised the highest portion of exogenous variables’ contribution to MPO variance, at 40.6% at Step 20. The Endogenous block, consisting of PROD, EXP, and EXR accounted for another 30% at Step 20. This finding aligns with Zaidi et al. [
4] and emphasizes the impact of external shocks on Malaysian palm oil prices. In contrast, with other exogenous variables, the IDVT portion of the variance grew over time, starting small at 0.71% at Step 1 to 40.6% at Step 20.
4.4. Stability and Robustness Check
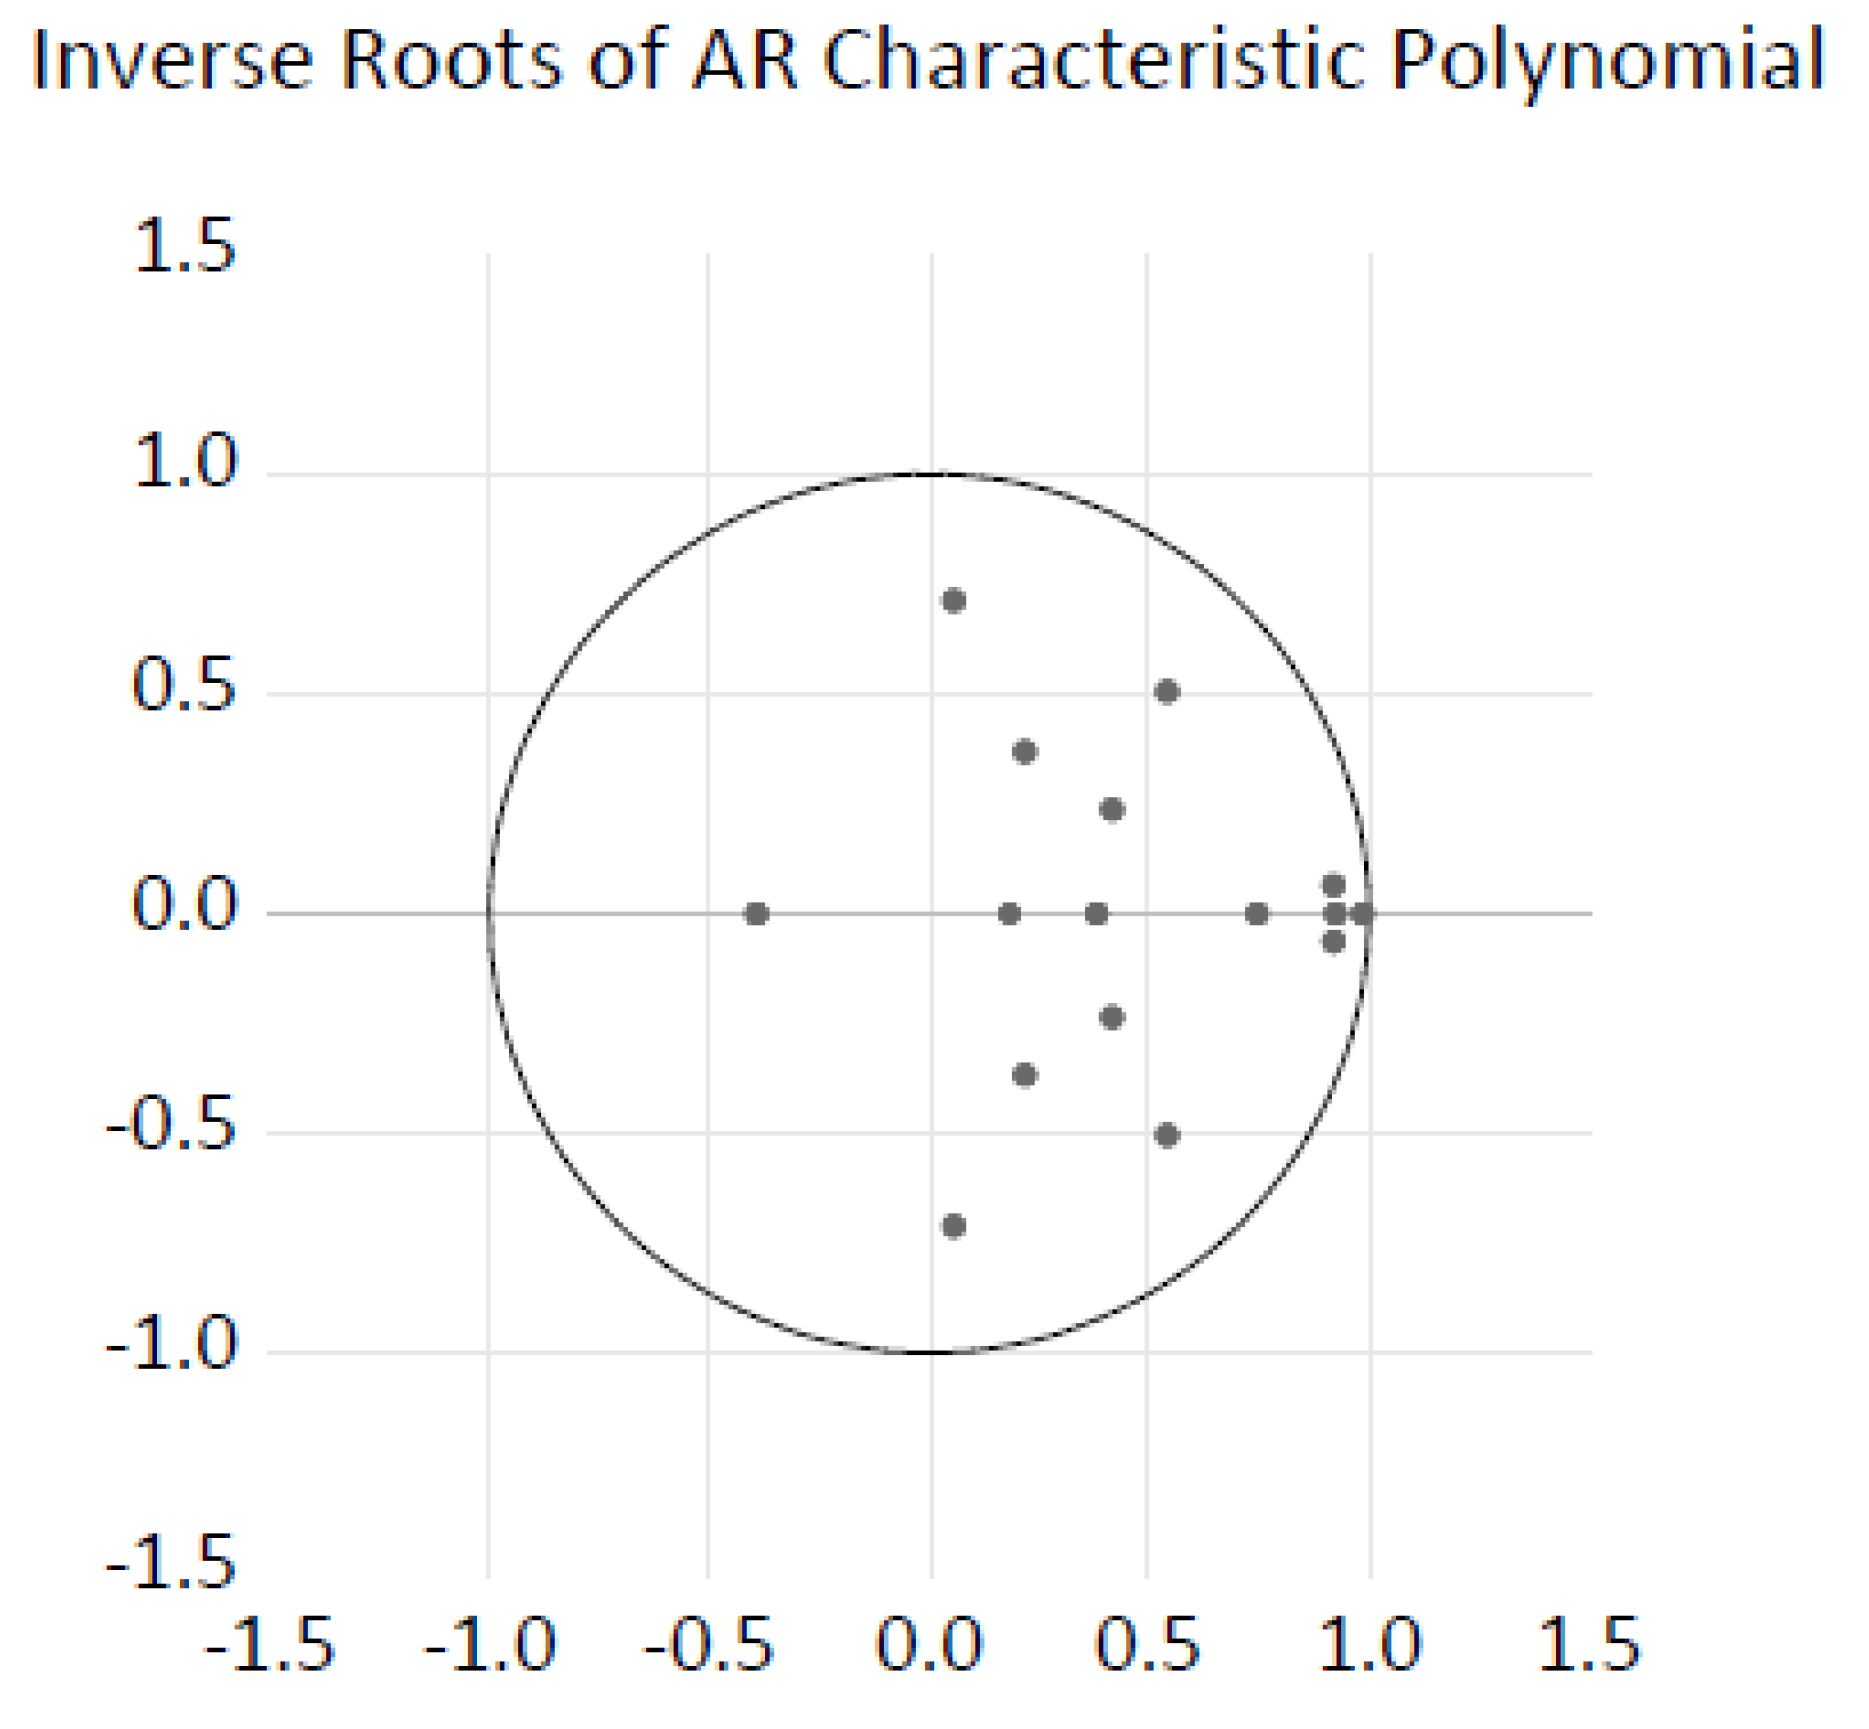
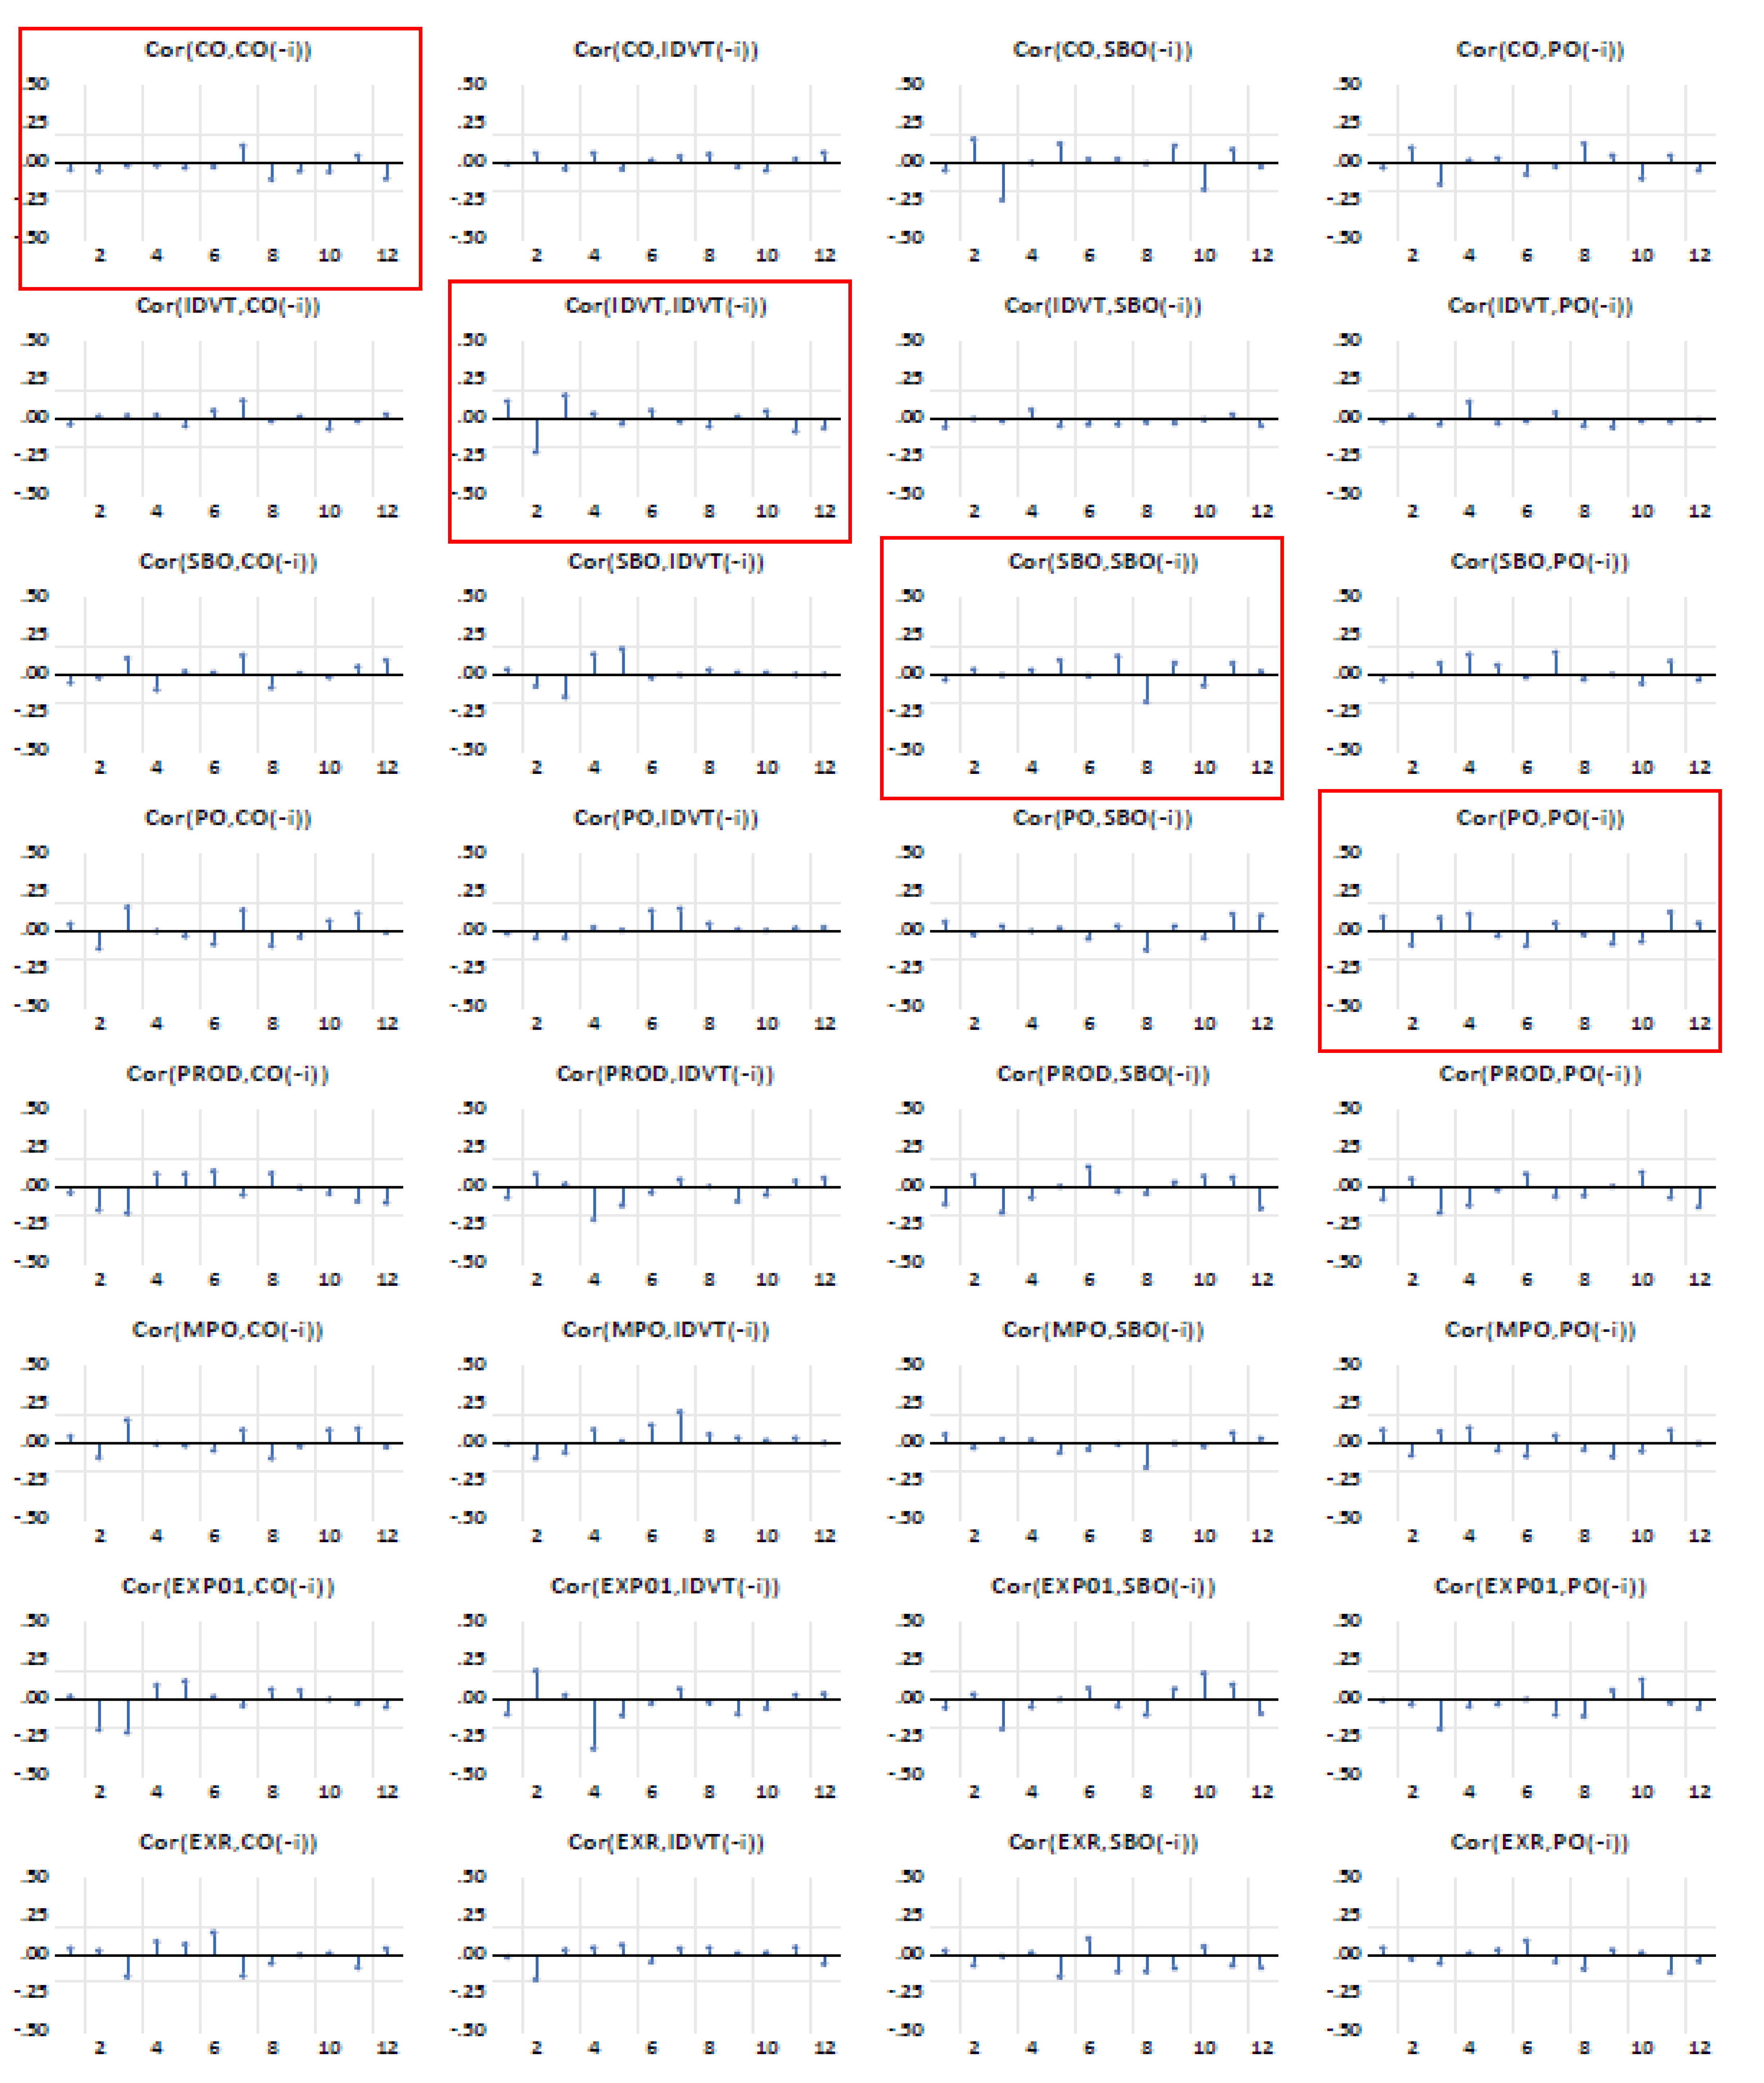
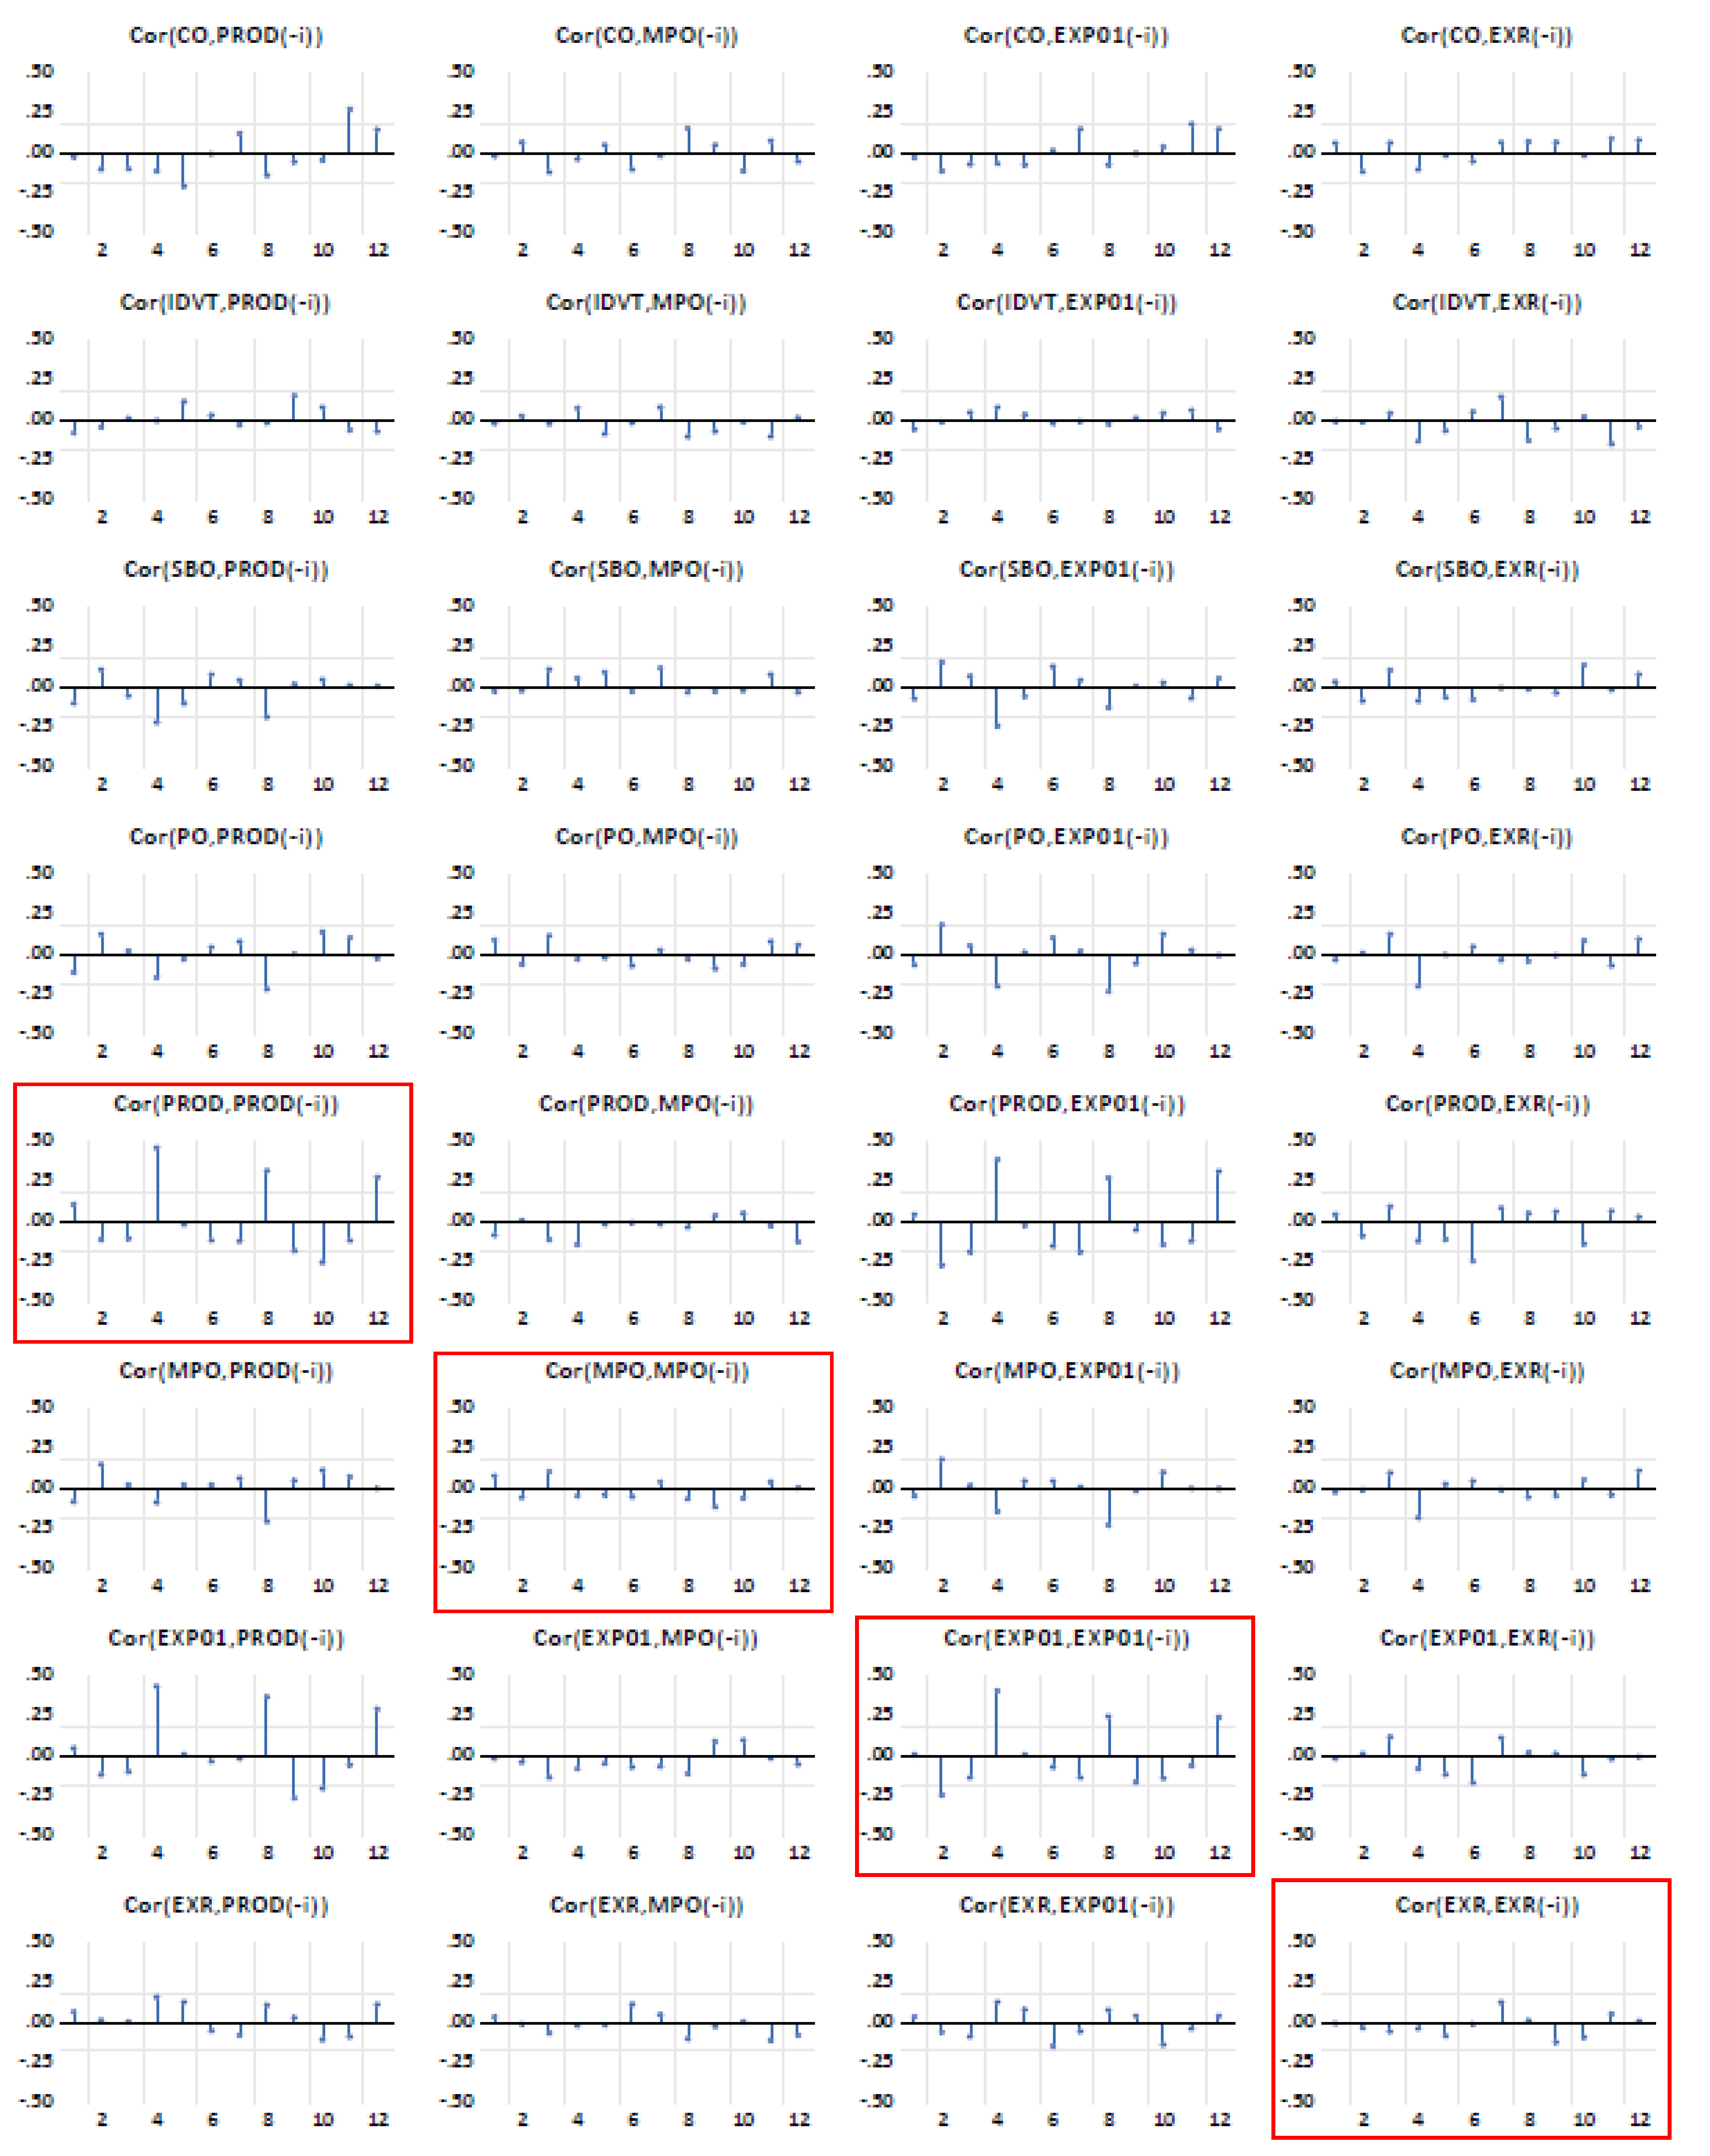
A stability check was carried out on the model, by utilising the inverse–roots–of–AR–characteristic–polynomial plotter suite available in Eviews. The plot of the roots is depicted in
Figure 5. All the moduli of the inverse roots of AR characteristic polynomial of the estimated VAR model must be less than one or located within a unit circle in the plot for the model to be deemed stable, according to Lütkepohl [
31]. Based on this, all inverse roots were within the unit circle and the model therefore was deemed stable. One of the inverse roots lay very close to unity. This could however be ignored as long as most of the other inverse roots were within the unity circle. The Breusch–Godfrey autocorrelation test was conducted in the error terms of the model to examine whether the model was suffering from an autocorrelation problem. Focusing only on the plots along the diagonal (i.e., of a particular time series with its own lagged errors), the time series lag is deemed sufficient if autocorrelation coefficients are within the two–standard–error bound, and autocorrelation was thus not considered a major issue for the time series. The outcomes of the test completed up to 12 lags are shown in
Figure A1 and
Figure A2 in the
Appendix A.
All the plots along the principal diagonal in
Figure A1 and
Figure A2 in the
Appendix A show that the coefficients were within the two−standard−error bound; hence, the autocorrelation was not a major issue in the model and hence the model was sufficiently specified.
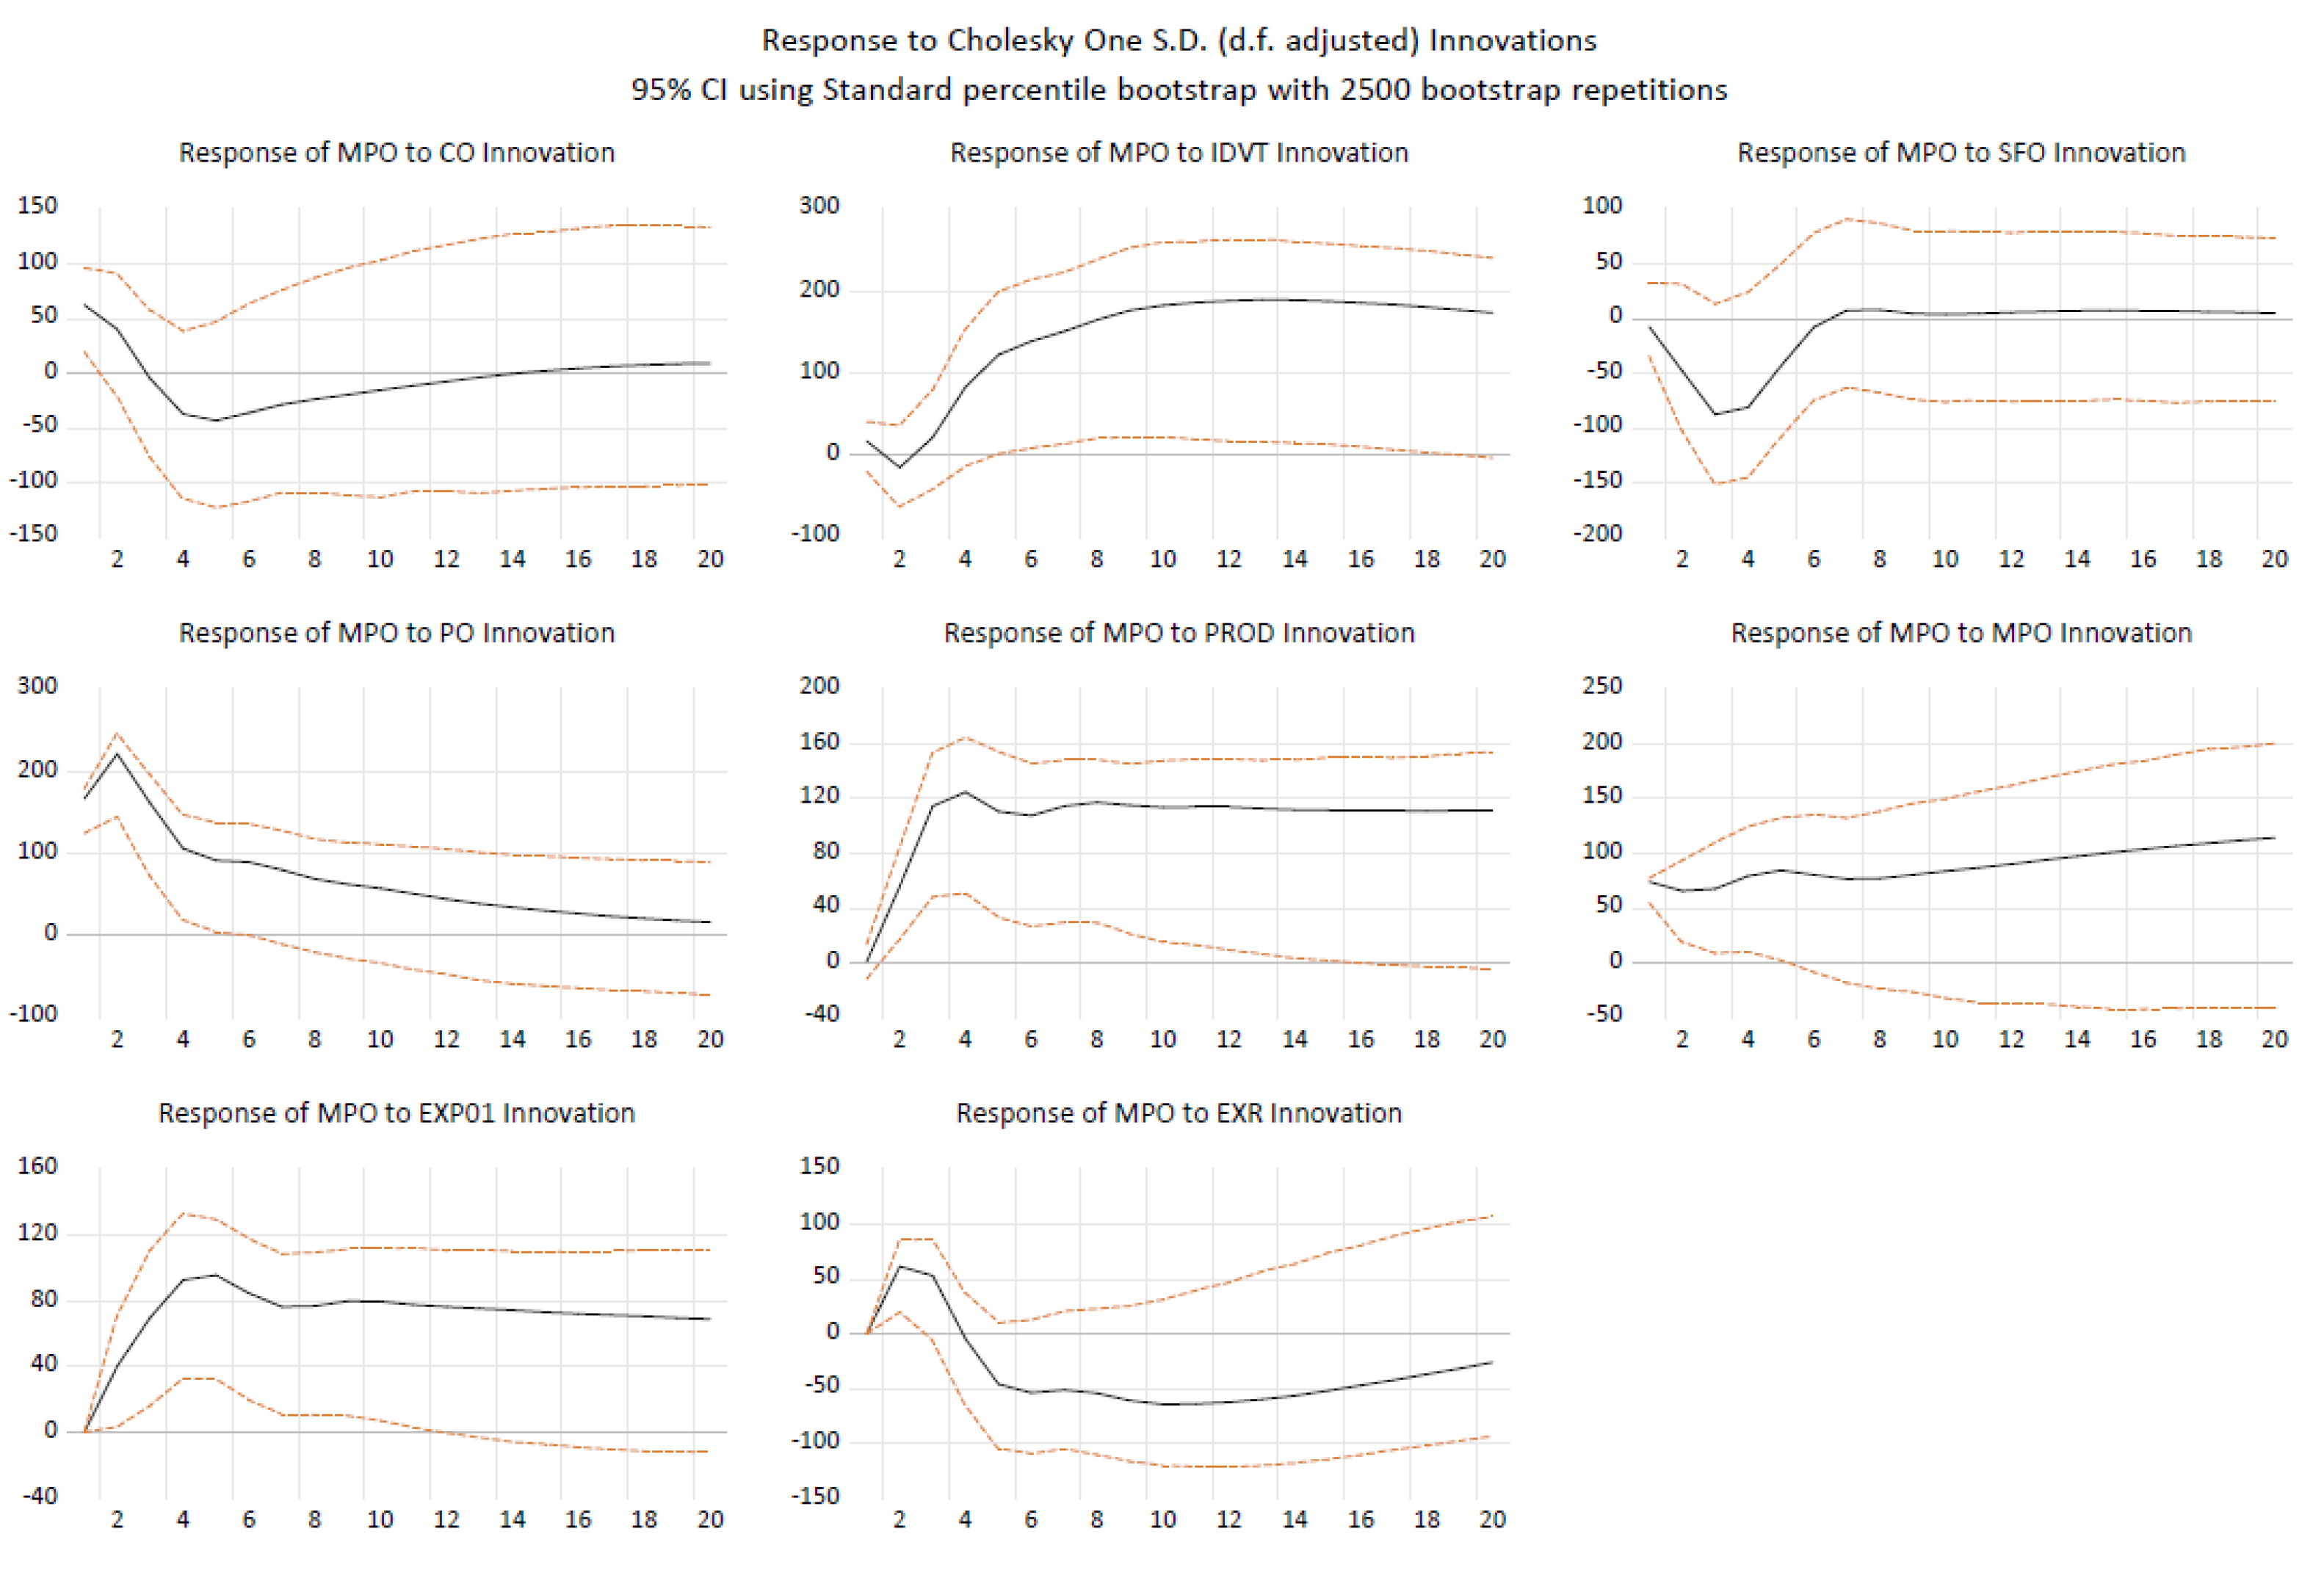
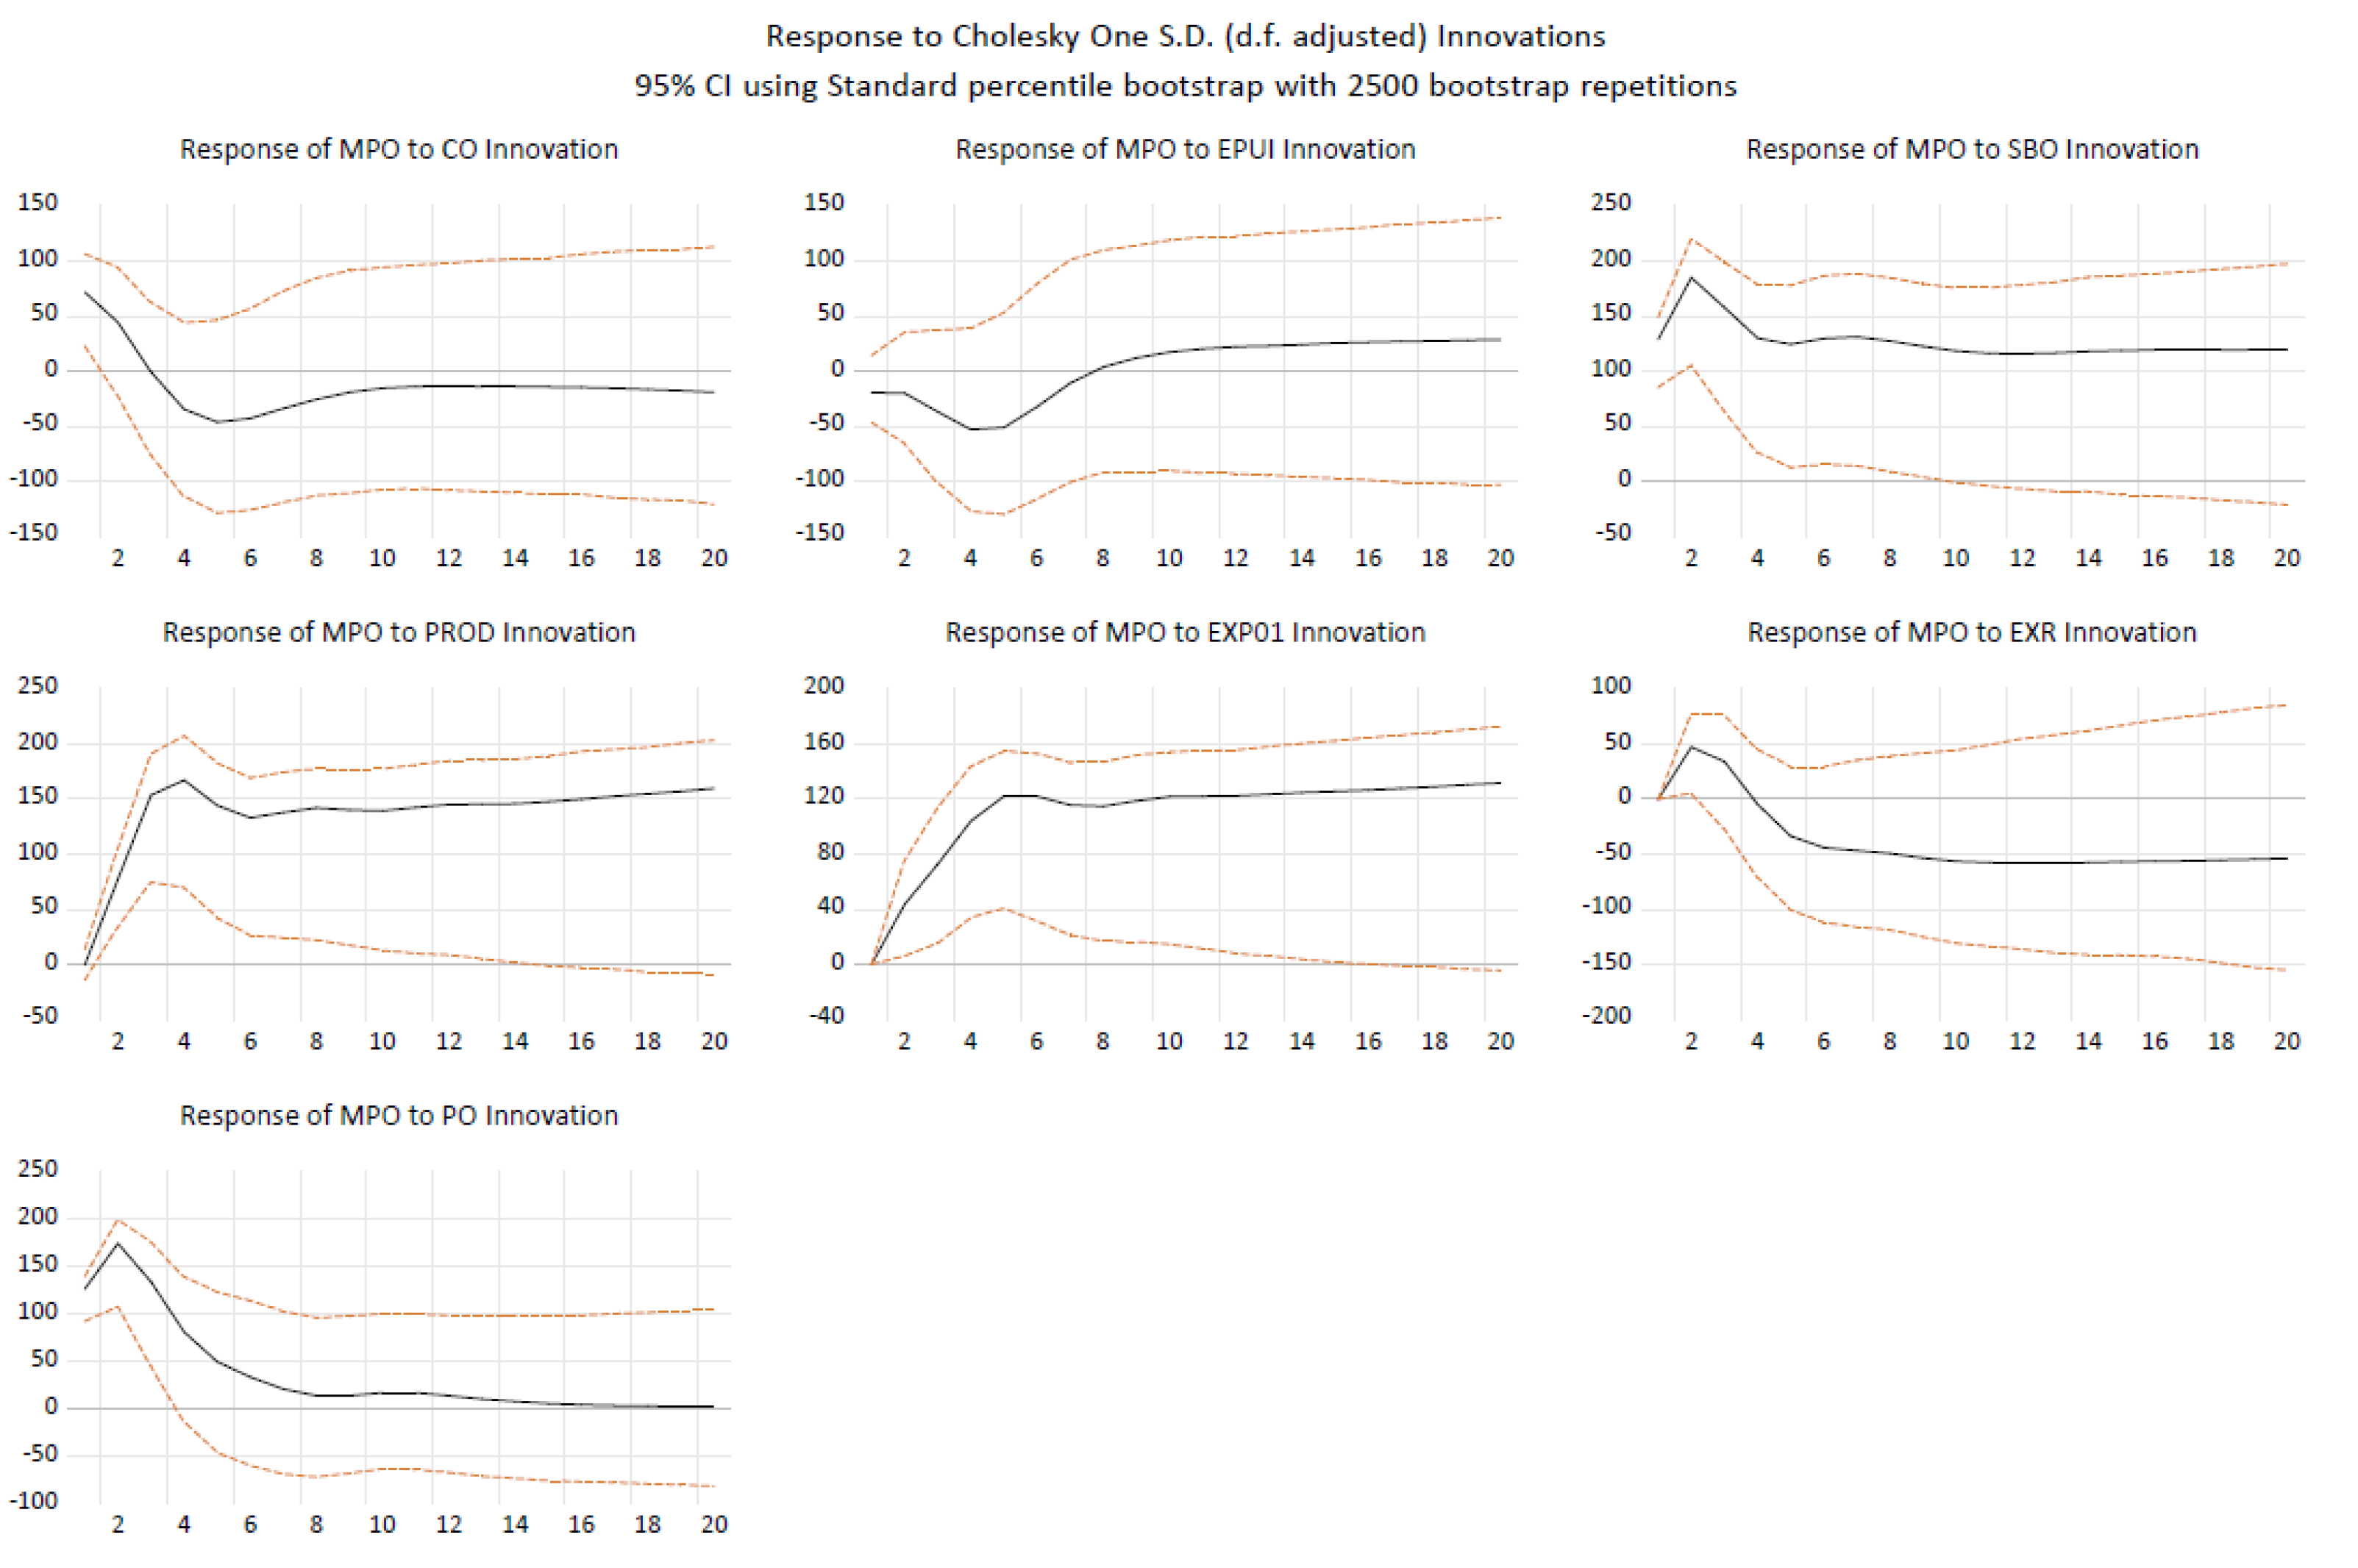
A robustness check was accomplished by replacing SBO with RPO and SFO, and by replacing IDVT with EPUI (completed only for SBO case) and the structural matrix recovered, using restrictions in
Table 4. The impulse responses of MPO were also generated for each of the cases. The responses did not vary much from the original SBO−IDVT case and this shows that the model was robust. All the results of SVAR estimations and the impulse response plots are available in the tables (
Table 11,
Table 12 and
Table 13) and figures (
Figure 6,
Figure 7 and
Figure 8) below.
5. Conclusions
This study aimed at extending past studies on the impact of shocks on palm oil price movement. For this purpose, it employed news−based indicators to represent economic shocks. The study covered the most recent period to evaluate the impact on Malaysian palm oil price and assess the stability and robustness of the forecast model adopted. The model was able to provide a meaningful impact analysis on Malaysian palm oil prices from external shocks and the findings are aligned with those of previous studies.
Via forecast error variance decomposition, it was found that the external shocks were more influential in Malaysian palm oil price volatility than the internal shocks. However, due to data limitations, the structural break and the impact on mean and variance cannot be assessed for the most recent Russia−Ukraine war−related commodity shocks and this may become one of the future topics of research. In addition, the linear nature of SVAR model could be further improved by using a regime-dependent model that allows for the different impact of IRF and VDC according to different levels of IDVT such as high and low IDVT to be assessed.
This study is probably one of the first to uncover the link between a news-derived index and palm oil price movement, and the manner in which the index can represent the macroeconomic condition as perceived by the public. The study has proven that the index measuring the macroeconomic uncertainty and related to infectious diseases derived from news search by the public indeed has a significant effect on commodity price movement, specifically palm oil. It is also shown that palm oil prices can be affected by the general macroeconomic shocks affecting the entire globe and not only specific to the palm oil trade. This research contributes to a plethora of literature on forecasting of palm oil prices movement that can assist policymakers in being prepared and vigilant to ensure the nation can weather the uncertain times, particularly the hike in palm oil prices. For example, policymakers may incentivize the sector significantly impacted by COVID−19 pandemic with reference to renewable energy [
32] by reallocating the windfall from the palm oil industry during the pandemic.


