
Classification Comparison of Machine Learning Algorithms Using Two Independent CAD Datasets


1
Department of Biostatistics, Faculty of Medicine, Near East University, Nicosia 99138, Cyprus
2
Department of Cardiology, Ankara Şehir Hastanesi, Ankara 06800, Turkey
*
Author to whom correspondence should be addressed.
Mathematics 2022, 10(3), 311; https://0-doi-org.brum.beds.ac.uk/10.3390/math10030311
Submission received: 12 December 2021
/
Revised: 14 January 2022
/
Accepted: 18 January 2022
/
Published: 20 January 2022
(This article belongs to the Special Issue Statistical Methods in Data Mining)
Abstract
:In the last few decades, statistical methods and machine learning (ML) algorithms have become efficient in medical decision-making. Coronary artery disease (CAD) is a common type of cardiovascular disease that causes many deaths each year. In this study, two CAD datasets from different countries (TRNC and Iran) are tested to understand the classification efficiency of different supervised machine learning algorithms. The Z-Alizadeh Sani dataset contained 303 individuals (216 patient, 87 control), while the Near East University (NEU) Hospital dataset contained 475 individuals (305 patients, 170 control). This study was conducted in three stages: (1) Each dataset, as well as their merged version, was subject to review separately with a random sampling method to obtain train-test subsets. (2) The NEU Hospital dataset was assigned as the training data, while the Z-Alizadeh Sani dataset was the test data. (3) The Z-Alizadeh Sani dataset was assigned as the training data, while the NEU hospital dataset was the test data. Among all ML algorithms, the Random Forest showed successful results for its classification performance at each stage. The least successful ML method was kNN which underperformed at all pitches. Other methods, including logistic regression, have varying classification performances at every step.
1. Introduction
In the past few decades, the incidence and mortality of cardiovascular diseases in developing countries have increased year by year [1]. The WHO 2020 report underlines that the number of people who die from heart diseases continues to rise in the coming years. CAD is a common disease of the heart and blood vessels and is one of the most frequent causes of death [2,3]. In CAD, fat layers accumulate in the coronary arteries; this causes them to narrow the blood flow through the coronary arteries, resulting in hypoxia of the heart muscle. In extreme cases, this condition can lead to a heart attack due to the lack of oxygen to the heart, which can be fatal [4].
Machine learning (ML) is a relatively new and efficient data analysis approach for scientific studies. Evaluating the performance of various ML techniques to classify individuals with and without certain health conditions is of great interest to scientific studies. As many researchers have suggested, ML techniques are likely to provide better accuracy in data classification. It is vital to achieving noticeable accuracy in the predicted result, as it is associated with high classification performance.
As of late, many studies are perseverative using ML algorithms on different health problems, including CAD. In 2016 Dwivedi et al. applied six ML techniques in their research: artificial neural network (ANN), support vector machine (SVM), LR, k-nearest neighbor (kNN), classification tree and naïve Bayes on CAD data. The result of the techniques gets cross-checked with receiver operating characteristic (ROC) curves. The highest accuracy for classification performance is LR and ANN [5].
In a different study, Ayatollahi et al. [6] used a dataset of 1324 individuals from AJA University. For the normalization of the data, they applied SVM and ANN algorithms. Abdar et al. (2019) tested Linear SVM (Lin SVM), SVC, and nuSVM methods and indicated that the N2 Genetic nuSVM algorithm acquired the best possible accuracy and the F-1 score of the Z-Alizadeh Sani dataset [7].
The study of Akella et al. (2021) applied six different ML algorithms to predict whether the patients included in the Cleveland Dataset have CAD. The study pointed out that all six ML algorithms had high accuracy, while the “neural network” had the highest among all [8]. In 2018 Cuvitoglu et al. got the data testing for feature selection off the ground, followed by principal component analysis (PCA) to reduce the dimensionality of small sample sizes. The 10-fold cross-validation conforms to the ML methods achieving success for classification. ANN succeed an area-under-the-ROC curve (AUC) that emphasizes the best performance among six methods [9]. Kutrani et al. tested several ML techniques using the Benghazi Heart Center dataset with a sample size of 1.770 and contained 11 attributes. The SVM and kNN algorithms had higher percentages of correct classification [10]. Tougui et al. used the heart disease data with 13 features and 303 cases in their study and employed six data mining software along with six ML algorithms [11]. Shaik Mohammad Naushad et al. conducted a study with a dataset of 648 subjects where they applied algorithms to detect the risk factors associated with CAD. The AUC scores of each algorithm were reported, as well as the sensitivity and specificity of findings [12]. The variety of ML algorithm work conducted thus far has drawn upon the UCI Heart Disease datasets [2,5,6,7,8,9,11]. With this study, ML algorithms, which the researchers suggested to be better in classification, were tested in two different datasets to particular stages.
The current study compares the classification performance of several ML algorithms by using two independent CAD datasets obtained from two countries; thereby the data from Near East University Hospital, Cardiology Clinic in TRNC were obtained. The open-access Z-Alizadeh Sani CAD dataset is from the UCI Machine Learning Repository web page. These two datasets run in a multi-stage analysis approach, including the novel cross-validation of the discovered classification rules.
2. Materials and Methods
2.1. Database
In this study, there are two independent CAD datasets: the dataset of 475 individuals (305 CAD patients, 170 healthy control) from the Department of Cardiology, NEU Hospital, Nicosia, TRNC and the dataset of 303 individuals (216 CAD patients, 87 healthy control) from the Z-Alizadeh Sani dataset of UCI (“UCI Machine Learning Repository: Z-Alizadeh Sani Data Set”, 2020) [13]. The NEU Hospital dataset was gathered from the hospital information management system and contained patient data from 2016 to 2020. Data collection was carried out between November 2019 and April 2020.
The number of variables in the two datasets were not equal. Hence, the study included 29 mutual variables from both datasets to ensure the study’s integrity while the rest remained idle.
Descriptive analysis of the data is in Table 1 and Table 2. The average age of the NEU Hospital dataset was 60.98 ± 10.95, while it was 58.89 ± 10.39 in the Z-Alizadeh Sani’s dataset. In total, 148 out of 475 patients were female in the NEU dataset, while in Z-Alizadeh Sani’s dataset 127 out of 303 people were female. In the NEU Hospital data, the LDL test result had an average of 117.75 ± 39.32 mg/dL, and 45.5% of the patients experienced chest pain. The average LDL test result of the Z-Alizadeh Sani dataset was 104.64 ± 35.40 mg/dL, and 54.1% of the individuals had chest pain.
2.2. Classification Methods
Artificial intelligence methods facilitated the classification and the determination of the validity of the results. There were six different ML (supervised learning) methods in this study. These methods are k-nearest neighbors (kNN), support vector machine (SVM), random forest (RF), artificial neural network (ANN), naïve Bayes (NB), and logistic regression (LR).
2.2.1. k-Nearest Neighbors (kNN)
2.2.2. Support Vector Machine (SVM)
2.2.3. Random Forest (RF)
2.2.4. Artificial Neural Network (ANN)
The challenges of using ANN are the time required to train networks on complex data, as this model carries the functional characteristics of the structural biological system, and that they are like black boxes. The model can change, but the user cannot interfere with the final decision-making process [22,23].
2.2.5. Naïve Bayes (NB)
The naïve Bayes re-scans the entire dataset for each new classification operation which might cause it to operate relatively slowly [24].
2.2.6. Logistic Regression (LR)
LR is the iterative presentation of the powerful linear combination of variables most likely to determine the observed outcome [25].
2.3. Statistical Analysis
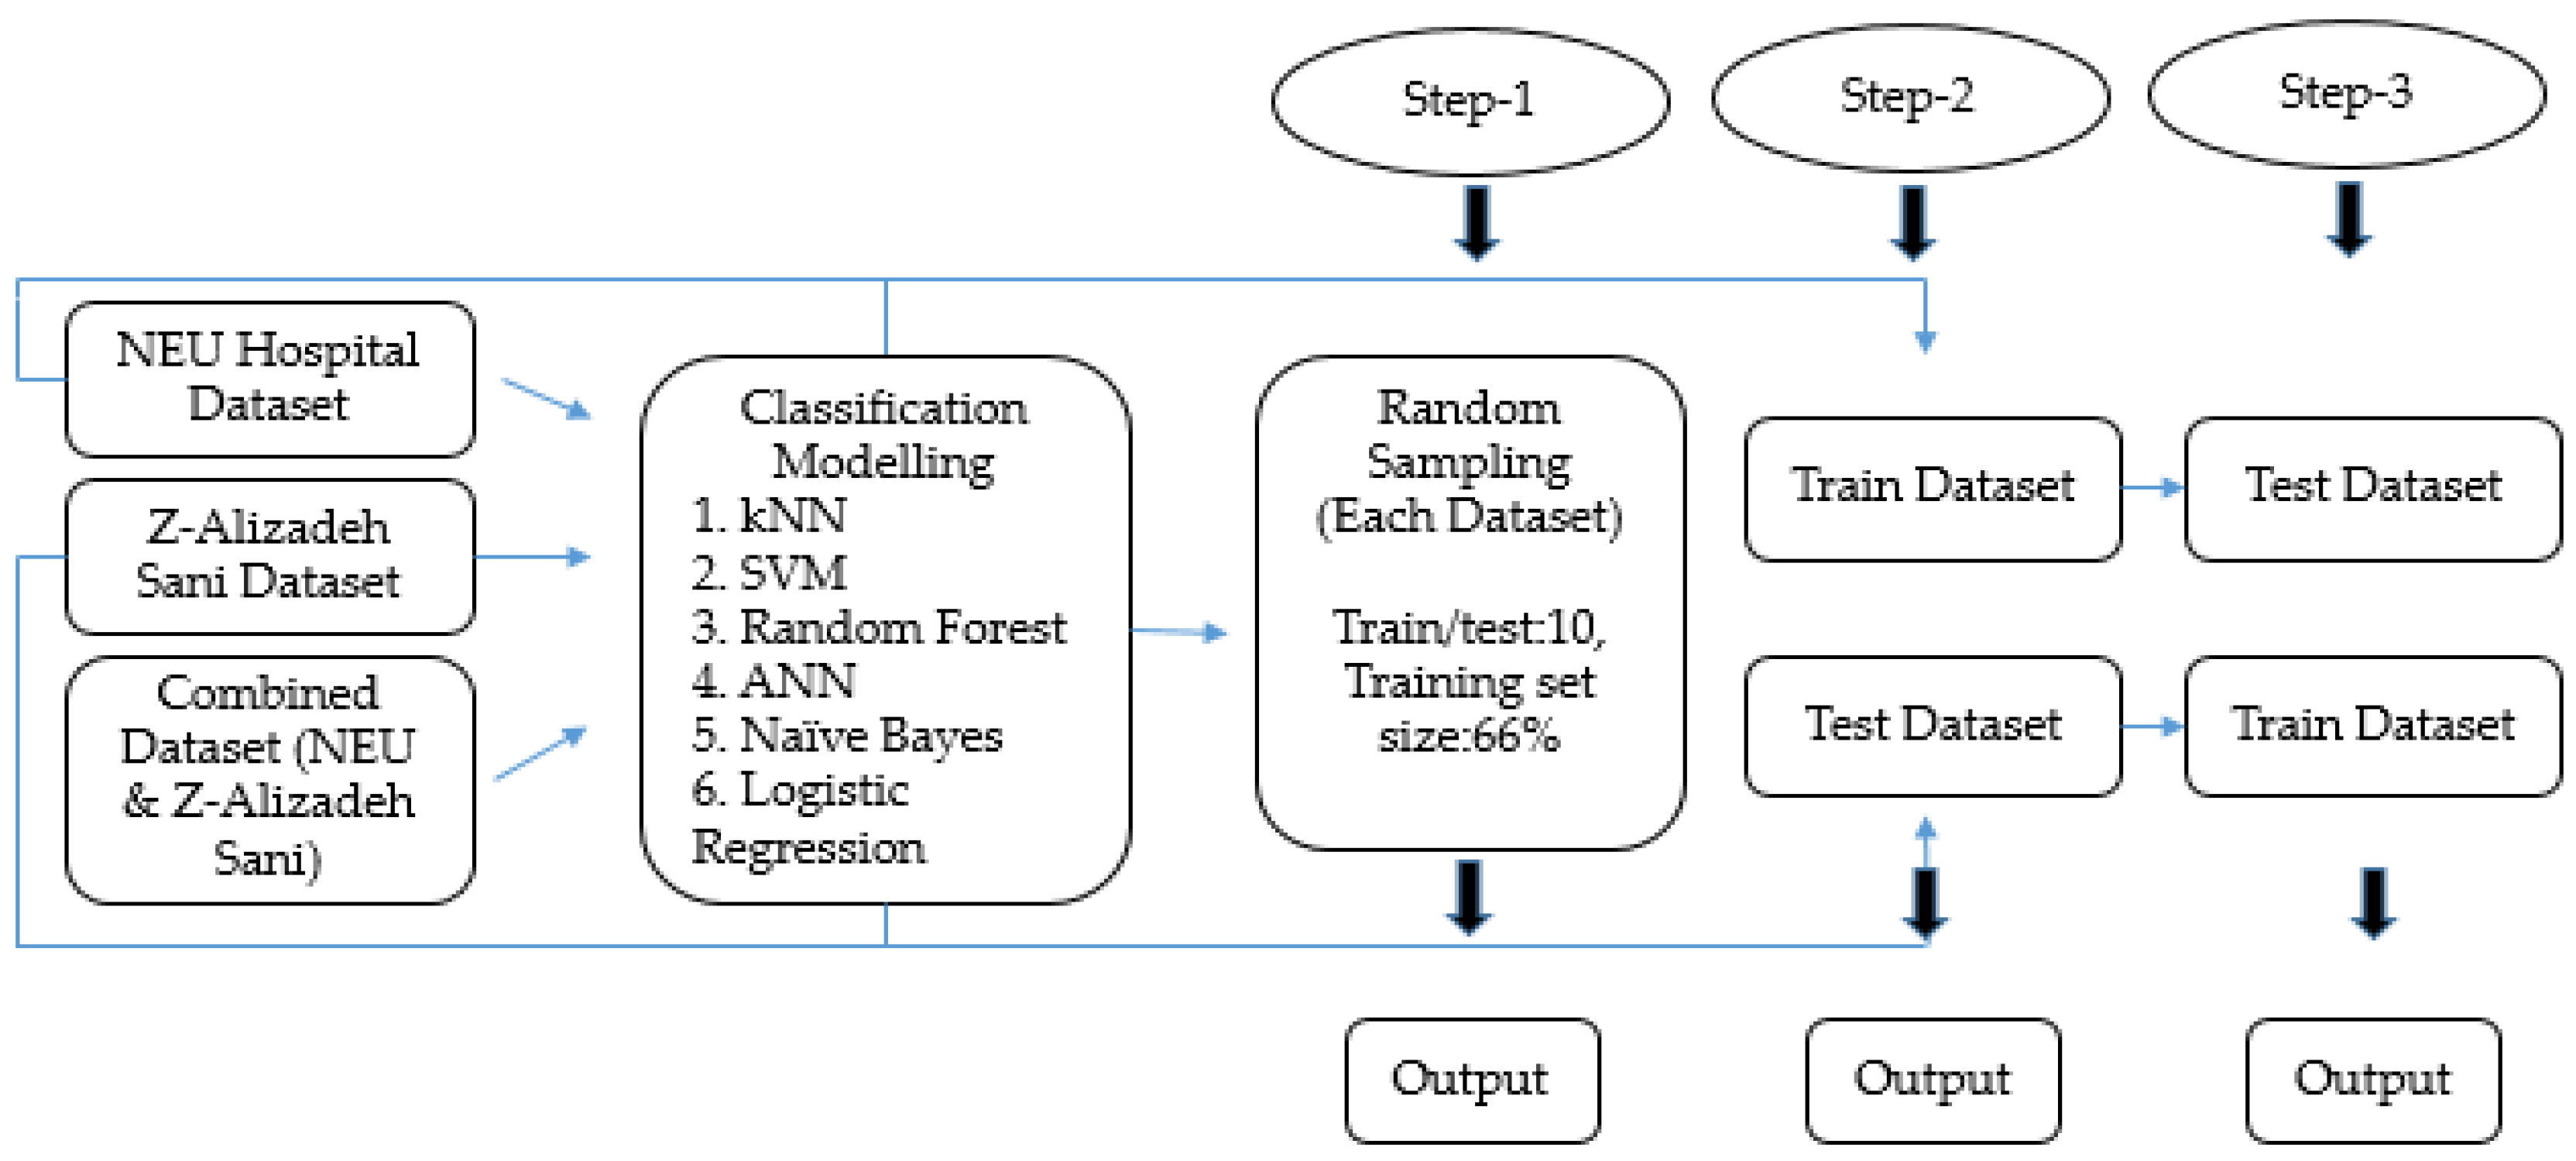
Descriptive statistical analysis was applied and mean, standard deviation, minimum and maximum values were given for quantitative variables. Frequency and percentages are given in qualitative variables (Table 1 and Table 2). The datasets were tested for normality with Kolmogorov-Smirnov and Shapiro–Wilk tests, where applicable. Since the datasets did not fulfil the parametric assumptions, a Mann–Whitney U test was applied for quantitative variables and a Chi-square test was applied to qualitative variables (Table 3 and Table 4). IBM SPSS software (Demo Version 21.0 for Windows) was used for statistical analysis. To classify the data, 6 different ML algorithms were applied with the Orange (Version 3-3.29.3) program. All analyses were performed on a laptop with Intel(R) Core(TM) i5-7200U CPU @2.50 GHz, installed RAM 4.00 GB, and 64-bit operating system. Figure 1 provides a schematic description of the analysis performed at each step. All variables were included to find out how accurately the ML methods performed the classification. Each step of the study contained a different output and was evaluated separately.
In Step 1, ML algorithms were applied to both separated and combined datasets within sampling settings (train/test 10, training set size 66%) (Table 5, Figure 2).
In Step 2, the NEU Hospital dataset was assigned as the training dataset and Z-Alizadeh Sani as the test dataset (Table 6, Figure 3).
In Step 3, NEU Hospital data were assigned as the test data, while Z-Alizadeh Sani data were the training data and ML algorithms were applied accordingly (Table 7, Figure 4). The aim was to apply the newly obtained rule from the training dataset to the test dataset to see which ML algorithms perform better for classification.
The Orange software provided the average classification success measures for the classification result of the target class. The performances of the applied algorithms are summarized with five measurement results: AUC, accuracy classification score (CA), weighting depending on the average parameter (F1), precision, and recall. AUC results are shown with ROC curves (Figure 2, Figure 3 and Figure 4).
3. Results
Table 3 shows the bivariate statistical hypothesis testing the results for each dataset to highlight the differed variables between CAD patients and the control group. PR (p = 0.002) and EF-TTE (p = 0.001) variables were statistically important in the NEU Hospital data. The variables showing statistically significant differences in the Z-Alizadeh Sani data are age, systolic BP, PR, FBS, TG, K, lymph, Neut, and EF-TTE (p < 0.05). The age range of people with CAD was 32–89 in the NEU Hospital data and 36–86 in the Z-Alizadeh Sani data. The average BP of people with the disease was 124.65 mm/Hg in NEU Hospital data and 132.41 mm/Hg in Z-Alizadeh Sani data. Considering the mean values of PR and EF-TTE variables, which were statistically significant in both datasets, in people with CAD the mean PR variable was 75.90 ppm in NEU Hospital data and 76.09 ppm in Z-Alizadeh Sani data. The mean EF-TTE variable was 56.81 in NEU Hospital data and 45.91 in Z-Alizadeh Sani data.
Table 4 shows the Chi-Square test results in each of the two datasets. There are 148 women and 327 men in the NEU Hospital dataset; 68.2% of women and 62.4% of men have CAD. There are 127 women and 176 men in the Z-Alizadeh Sani’s dataset; 67.7% of women and 73.9% of men have CAD. The variables statistically associated with the presence of CAD in the NEU Hospital dataset were current smoker (p = 0.004), systolic murmur (p = 0.019), chest pain (p < 0.001), dyspnea (p < 0.001) and region RWMA (p < 0.001). In the Z-Alizadeh Sani dataset, significantly associated variables were DM (p < 0.001), HT (p < 0.001), chest pain (p < 0.001), dyspnea (p = 0.029), region RWMA (p < 0.001). In the NEU dataset, 139 people smoked, while only 63 people actively smoked in the Z-Alizadeh Sani data. Out of 139 active smokers in the NEU Hospital dataset, 103 had CAD, and 187 CAD patients out of 206 people had chest pain problems in the NEU Hospital data. In the Z-Alizadeh Sani data, 154 out of 164 people with chest pain problems were CAD patients. The dyspnea variable showed a statistically significant association with CAD in both datasets: 63 out of 75 people in the NEU Hospital dataset had CAD, while 87 out of 134 people had CAD in the Z-Alizadeh Sani dataset. Region RWMA variable was statistically significant in both datasets: 61 out of 70 people in the NEU Hospital dataset were CAD patients, and in the Z-Alizadeh Sani dataset 82 out of 86 people were CAD patients.
At the first step of the analysis, ML algorithms were applied to each dataset and the combined dataset one by one. Then in Step 2 and 3, the rule obtained in one dataset was tested in the other dataset for cross-validation.
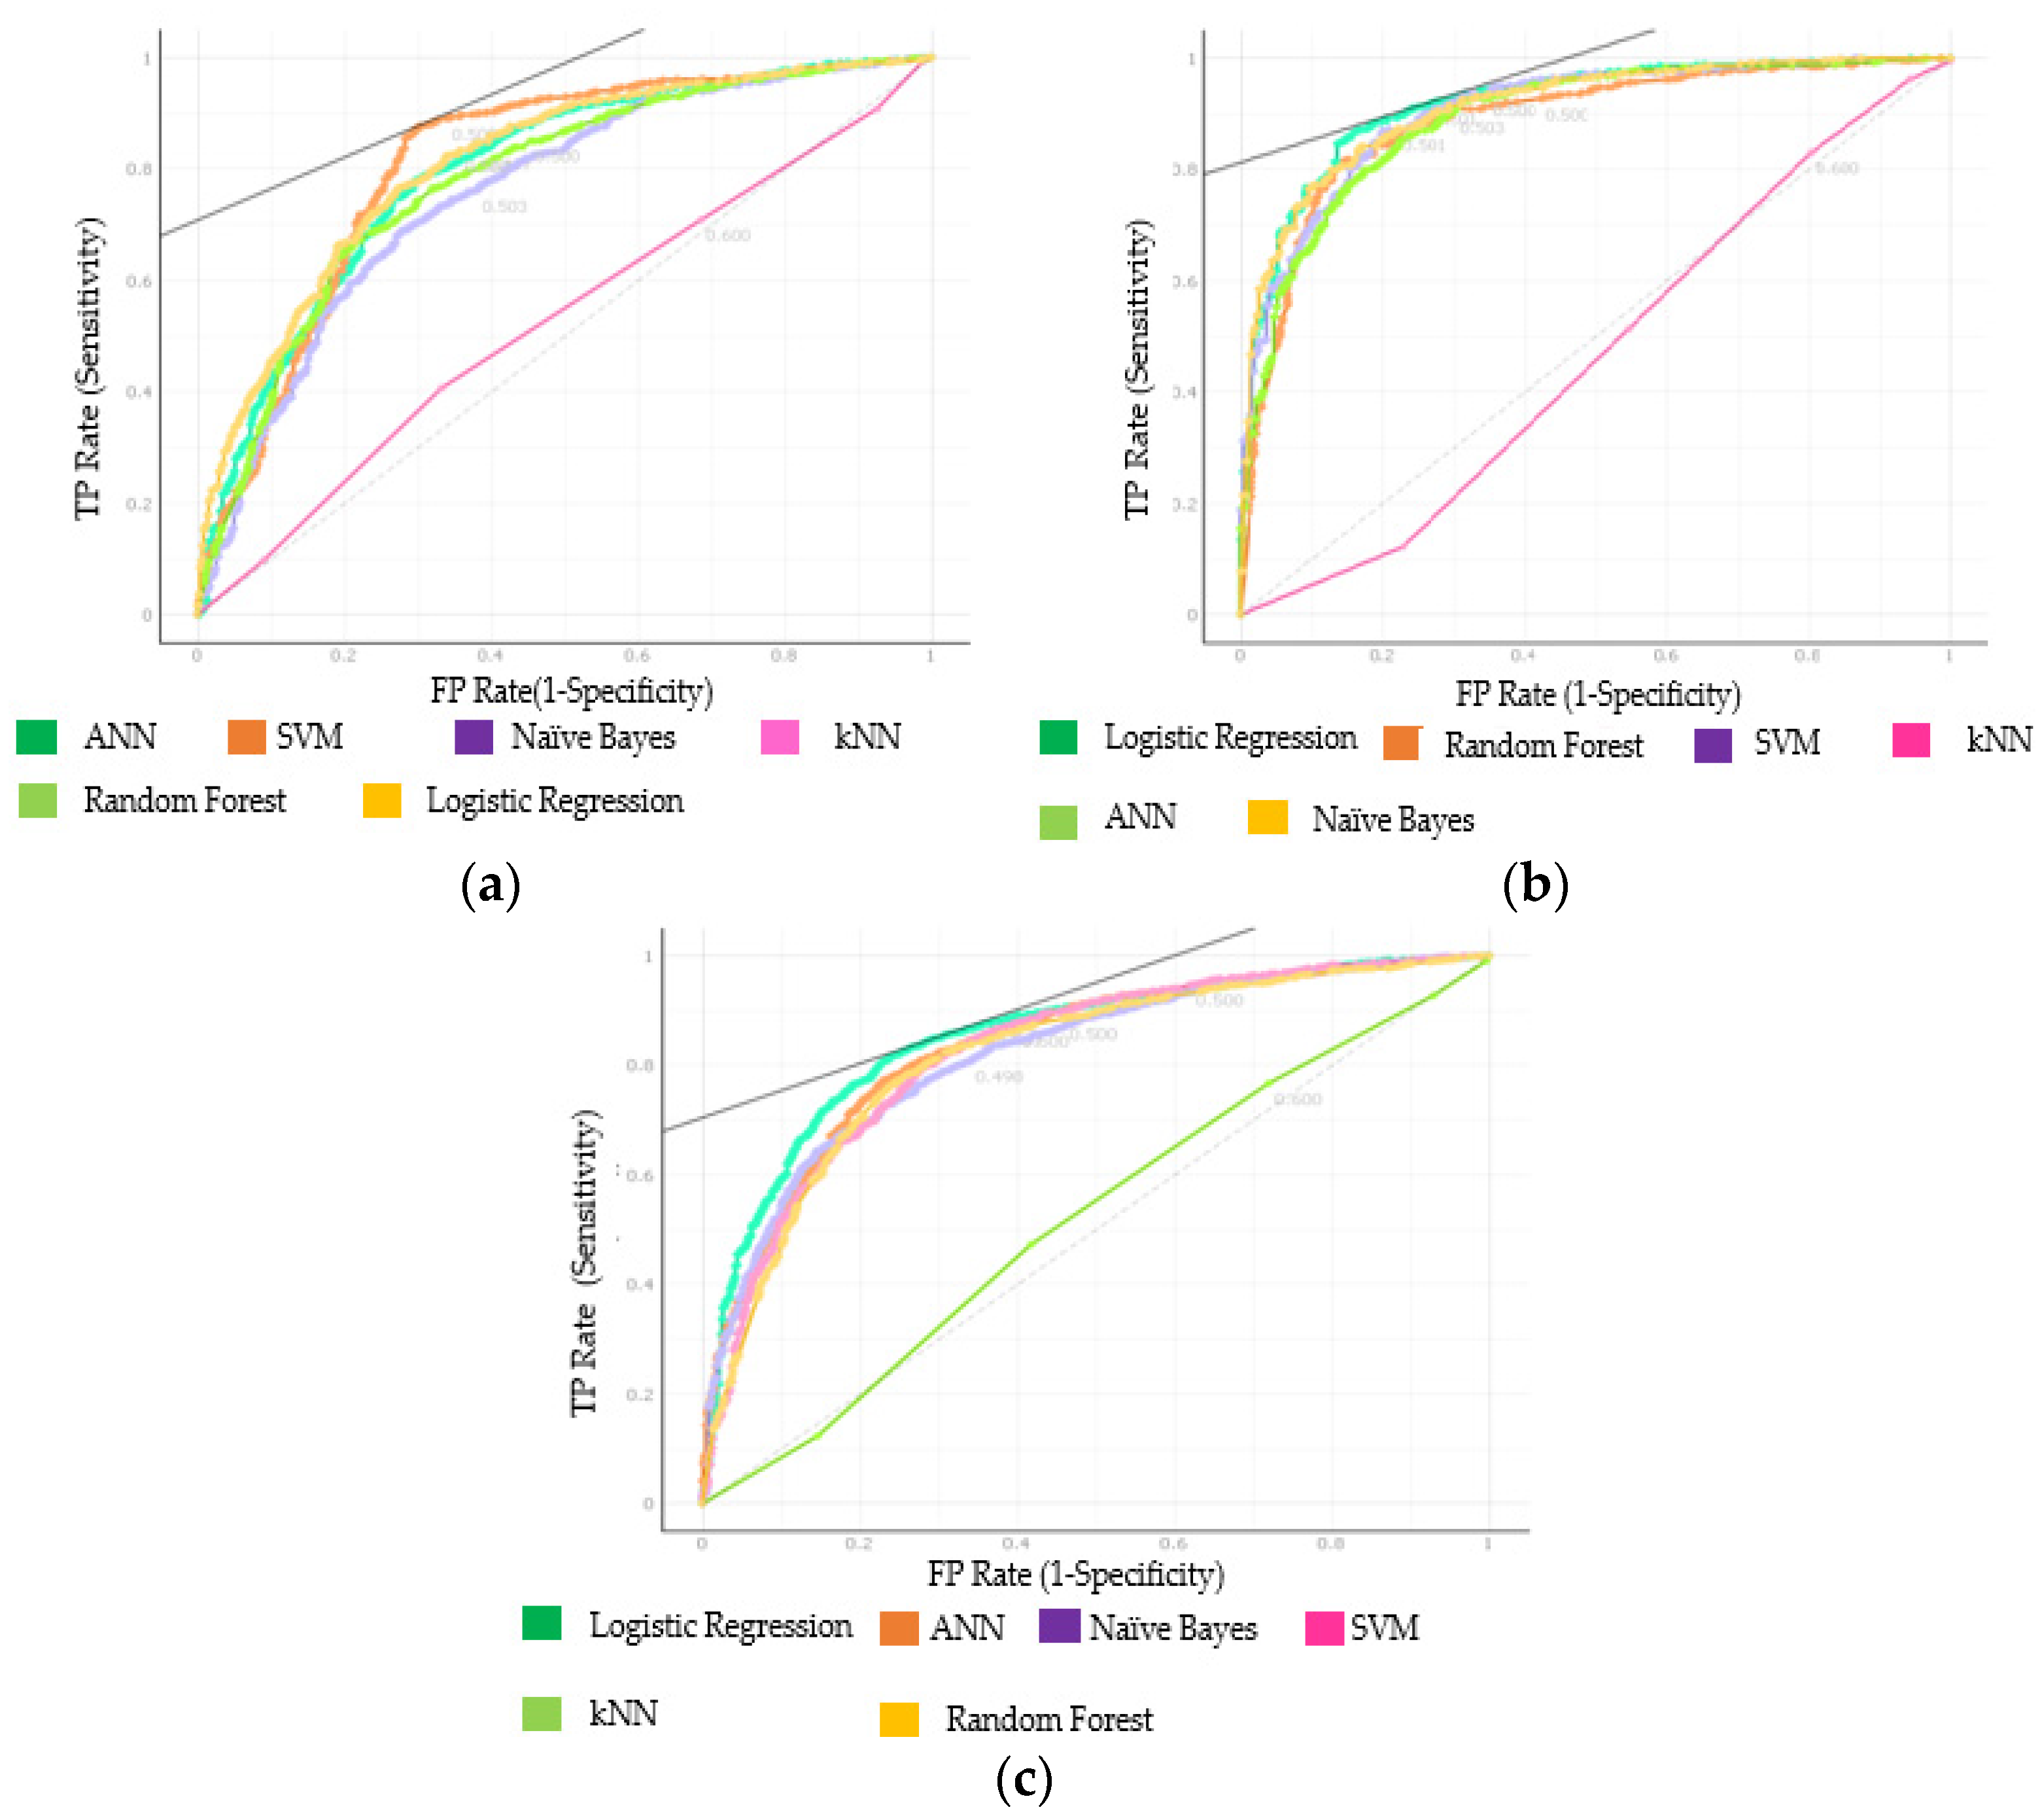
In Step 1, the training and testing settings were applied to each dataset analysis aside from the combined dataset (Figure 1). All the tables and figures given below contain the classification results of the target variable (CAD). Six ML classification techniques were implemented to each dataset and the combined dataset separately. Firstly, each dataset was separated into a train and test size, and ML algorithms application progressed. According to AUC results, in Step 1, SVM was 81.1%, ANN was 79.8%, and LR was 81.3% in the classification in NEU data. In the Z-Alizadeh Sani data, SVM was 90.8%, naïve Bayes classified as 91.4%, and LR as 92.4% (Figure 2). When both datasets were combined and ML algorithms were repeated, the SVM showed a classification success of 82.6%, ANN showed 83.4%, and LR showed 85.1%. Moreover, for the CA results, in the NEU Hospital dataset SVM was 81.1%, ANN was 75.4%, and LR was 76.5%. In accordance with CA classification results of the second dataset, the Z-Alizadeh Sani dataset came out with 83.2% for RF, 84.4% for ANN, and 86.5% for LR. In combined dataset results, SVM was 78.6%, ANN was 78.2%, and LR was 79.5% (Table 5).
The results of the first step are shown in Table 5. The AUC results of each dataset and the combined dataset are shown in Figure 2 with the ROC graphics. According to the ROC graph results in the NEU Hospital dataset, SVM (81.1%) and LR (81.3%) algorithms cover the most area, and the ML algorithm that covers the smallest area is kNN (52.7%). The ML algorithms that occupy the majority in the Z-Alizadeh Sani dataset are naïve Bayes (91.4%) and LR (92.4%) algorithms, and the ML algorithm that covers the smallest area is kNN (46.8%). In the combined dataset, the ANN (83.4%) and LR (85.1%) algorithms covered the most area, while the kNN (52.2%) algorithm covered an insignificant area (Figure 2).
In the second and third steps, observation shows the successes of ML algorithms classification comparatively.
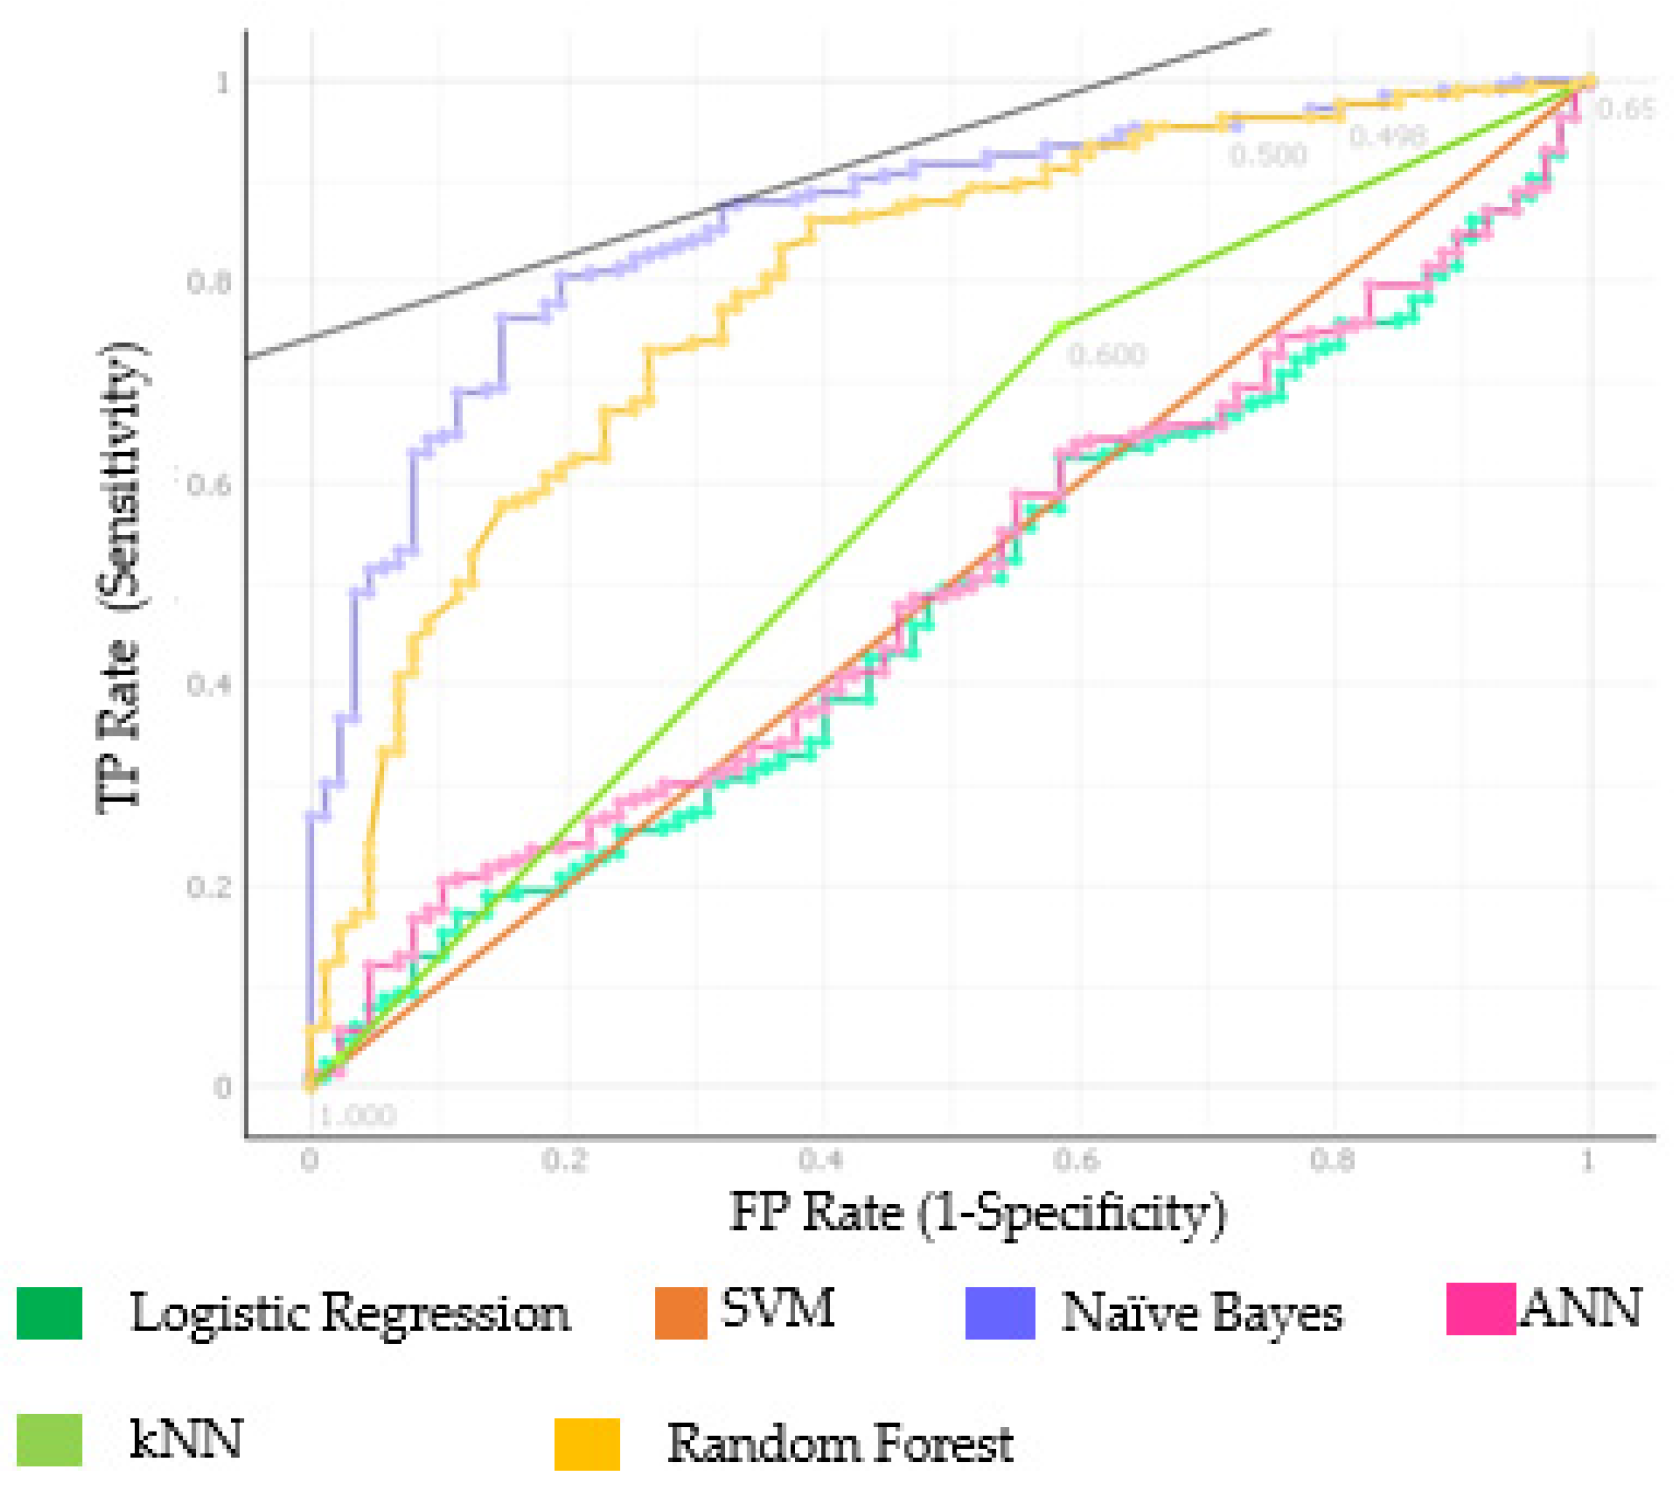
In the second step (Figure 1, Table 6), the program used in this study provides convenience to the classification by applying the learned rule in the training dataset to the test data. As stated in the second step of Figure 1, the rule gleaned from the NEU dataset was under test in the Z-Alizadeh Sani dataset. The CA results were kNN 65.7%, SVM 71.3%, RF 77.6%, ANN 28.7%, naïve Bayes 75.6%, and LR 28.7%.
At this step, the AUC results were RF 79.5% and naïve Bayes 86.1% (Table 6, Figure 3). ROC graphs of AUC results in Figure 3 show the success of each ML algorithms of classification. The LR algorithm covered the smallest area with 47.9%.
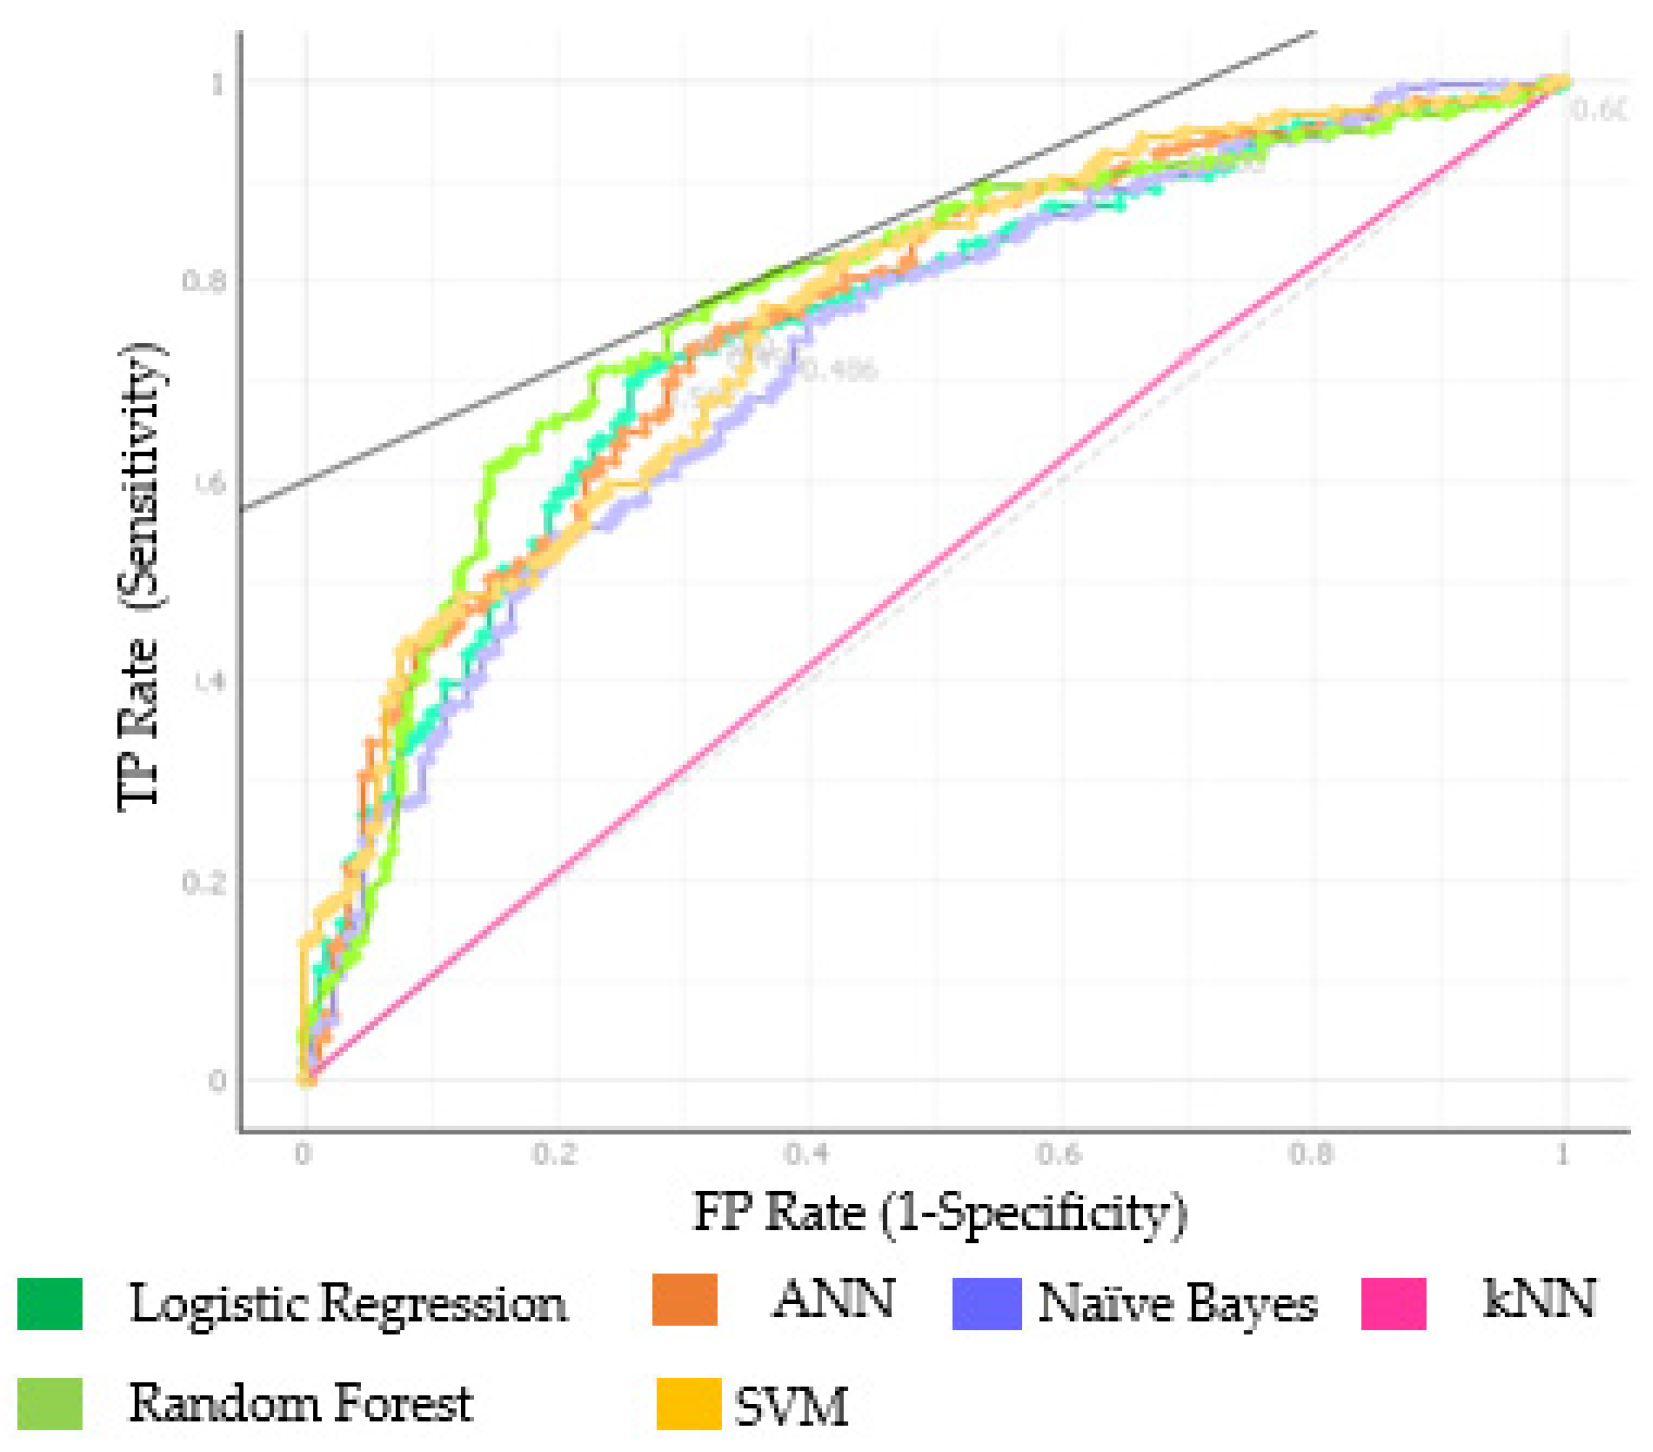
In the third and final stage, the Z-Alizadeh Sani dataset was the training data and the NEU Hospital dataset was the test data. The AUC results of the applied ML algorithms were SVM 76.3%, RF 77.7%, and ANN 76.1% (Table 7). When the learned rule was applied to NEU data, the CA results were SVM and LR 71.6%, RF 73.7%, and ANN 71.8% (Table 7, Figure 4).
In this study, SVM in NEU data, LR in Z-Alizadeh Sani data, and combined dataset showed the highest success according to CA results of ML algorithms applied to each dataset separately in the first stage. Considering the CA results in this study, SVM classification is the algorithm that showed the most success. The AUC results and ROC curves in the second and third stages, which were the stages of testing the learned rule in one dataset in another dataset, the two ML algorithms with the highest AUC result for the second stage (Table 6, Figure 3) were naïve Bayes (86.1%) and RF (79.5%). The two ML algorithms that were successful in the third stage were RF (77.7%) and SVM (76.3%). Following the completion of the analysis, LR provided good results in one application but did not perform relatively well in practice as a rule.
4. Discussion
The study aims to contribute to the studies done so far and to develop a new approach by considering CAD disease, which causes a great deal of death in the world. It examined whether statistically significant variables determine the disease between the variables in two separate datasets. After the statistically significant variables were determined, the classification stage was started. It is desired to observe the results to be obtained by applying the classification methods made so far to two different datasets. Unlike the majority of the current studies, two independent datasets were used as training and testing data for each other, and the classification success of ML algorithms was evaluated in a cross-classification manner. This approach provided a better insight for ML classification performance for detecting CAD patients through the justification of the discovered rules in one dataset over testing in another independent dataset. A low call (high incidence of false negatives) in disease prediction would misdiagnose individuals with CAD as healthy, which could have disastrous repercussions.
Similar studies conducted in 2021 are given in Table 8. As a contribution to the listed studies, the current study showed how successful ML algorithms are in the problem of CAD classification.
The studies in Table 8 mostly used one or, on rare occasions, two datasets and the classification performances were measured by applying ML algorithms within the single datasets rather than cross-validating over different independent data, as was done in our current study.
In Table 9, the results of the research are classified in general and the algorithms that made the best classification in the three stages of the research are shown. Our findings highlight that the RF algorithm is the most successful in classification, as it scored an AUC more than 75% at each step of our study (Table 9). In the first stage of this research when ML algorithms were applied to each dataset separately, it was seen that the most successful algorithm was the LR algorithm, although the RF algorithm showed similar performance. In the first stage, the LR (92.4%) algorithm showed the highest success in Z-Alizadeh Sani data. In the same dataset, the RF algorithm showed 89.6% success.
The kNN algorithm failed to successfully classify individuals at each stage of the research. The LR algorithm, which was successful in the first stage (AUC of 0.813 to 0.924), failed in the second step calculations (AUC = 0.479). Considering the overall success, the RF algorithm achieved a successful classification result at every step. In other studies conducted in 2021, it has also been shown that the RF algorithm achieves high performance for classification of individuals.
In a study held in 2016 by Z-Alizadeh Sani et al., artificial intelligence classification algorithms were applied to detect CAD disturbance on a single dataset. They applied training and test analysis on a single dataset as a rule, and they defined the data as 90% training and 10% test data. Thus, the obtained rule was tested on the same data. Therefore, a high classification performance might be expected [32].
In Steps 2 and 3, one dataset is training while the other dataset is test data to observe the cross-classification results. In step 2, this research defined the NEU Hospital dataset as the training data and the Z-Alizadeh Sani dataset as the test data. The aim here was to test the rule learned in the NEU Hospital dataset on the other dataset, as the LR and neural network failed to do. LR was not successful in this analysis. If the number of observations is more or less than the number of features, LR should not be used. Otherwise, it may lead to overfitting. Since the neural network works like the human brain, it may not yield results when there are not enough samples. Naïve Bayes and RF classification methods were observed as giving the best results [33,34].
In Step 3, Z-Alizadeh Sani training data and NEU Hospital data were analyzed as test data. Classification methods other than kNN gave very close results. The results of correct classification RF method were better than other methods. The rule learned in the Z-Alizadeh Sani dataset was tested in the NEU Hospital dataset. It gave a successful classification result. In a different study conducted in 2016, seven ML methods were used with the TOPSIS method on comparing a single dataset and ML methods, and naïve Bayes (79.1%) gave the best result [1]. The same classification method, naïve Bayes, showed similar success in testing the rule learned in the test dataset, and the significant feature in this study is that the two datasets used included people from two different countries and different genetic features, which increases the value of the results. In a similar study conducted in 2013, ML techniques were used for classification. In that study, two datasets were used and the interpretation about the classification was made over the AUC of ROC curve. This shows how accurate it is to evaluate the AUC in classification. The LR gave the best results. Although the number of patients used in this study was considerably higher than our data, the study achieved better results in classification [35].
In the study of Chen et al. (2020) [36], as in this study, ML classification techniques were used for CAD detection, and as a result, ML classification techniques proved to be very useful and practical in the field of health with alternative techniques. The results of which are given in Table 6 and Table 7. It is seen that testing the rule learned in the Z-Alizadeh Sani data on the NEU Hospital data gave a very successful result. It is significant to make a classification with the ML techniques and not to interfere with the program while making this classification. In many studies, it is shown that ML techniques are tested on a single dataset, or a separate classification is made even if two different datasets are used. The AUC results in the classification made with a single dataset showed the most successful result in the combined dataset was the LR with 85.1%, in Z-Alizadeh Sani dataset was LR 92.4%, and naïve Bayes was 91.4%. Finally, it was observed that the NEU hospital dataset made a successful classification with SVM 81.1% and LR 81.3%.
In this study, it was observed that the learned rule in Alizadeh Sani data gave more successful results. In testing the rule learned in the NEU data on the other dataset, only two ML algorithms’ results are above 70%. In testing the rule learned in the Z-Alizadeh Sani data on the other dataset, five of the six algorithms showed a success of over 70%. The success of ML techniques in the determination of diseases has been tested and it has been proven that ML techniques in disease detection are improving day by day.
In particular, the cross-classification approach utilized in the current study underlines that it is beneficial to use independent datasets from different geographies to ensure the performance evaluation of techniques in a better way. In this study, besides the success of ML techniques in classification, their contribution to health problems is quite significant. The adapted ML techniques for diagnostic purposes predicate relevant variables for any disease and their performance can be comparatively done. In this paper, it has been shown that the application of ML techniques for predictive analysis can provide advantages in diagnosing diseases earlier, which will help children, young adults, and the elderly with treatment and decision-making.
5. Conclusions
Today, especially in health, data mining is a necessity, and data needs to be transformed into information with the help of ML algorithms. These ML algorithm classifiers prove their performance in the best results in terms of accuracy. All ML algorithm results applied in three steps show the classification success of CAD patients, which is the target variable.
This is a great challenge in the medical field which pushes efforts to develop ML methods, to take advantage of information intelligently, and to extract the best knowledge. The assumption is that the outputs of the standard models will be simple to comprehend and explainable to non-machine-learning readers.
This study desires to help researchers to make the right choices in the future. Despite the progress made in recent years, there are significant shortcomings in ML-based detection of CAD that need to be addressed in the coming years. In the future, this study will extend deep learning by focusing on what happens if the training dataset becomes ambiguous.
Author Contributions
Conceptualization, M.Y. and Ö.T.; methodology, M.Y. and Ö.T.; software, M.Y.; validation, M.Y., Ö.T. and B.Y.; formal analysis, M.Y.; investigation, M.Y.; resources, M.Y.; B.Y.; data curation, M.Y.; writing—original draft preparation, M.Y.; writing—review and editing, M.Y. and Ö.T.; visualization, M.Y.; supervision, Ö.T.; project administration, Ö.T. and B.Y. All authors have read and agreed to the published version of the manuscript.
Funding
This research received no external funding.
Institutional Review Board Statement
The study was conducted according to the guidelines of the Declaration of Helsinki and approved by the Institutional Ethics Committee of NEAR EAST UNIVERSITY (protocol code NEU/2019/74/931 and date 21 November 2019).
Data Availability Statement
The Z-Alizadeh Sani dataset, one of the datasets supporting this article, is available at https://archive.ics.uci.edu/ml/datasets/Z-Alizadeh+Sani.
Conflicts of Interest
The authors declare no conflict of interest.
Abbreviations
| PR | Pulse Rate | WBC | White Blood Cell |
| FBS | Fasting Blood Sugar | PLT | Platelet |
| CR | Creatinine | EF-TTE | Ejection Fraction |
| TG | Triglyceride | DM | Diabetes Mellitus |
| LDL | Low Density Lipoprotein | HT | Hypertension |
| HDL | High Density Lipoprotein | FH | Family History |
| Bun | Blood Urea Nitrogen | LVH | Left Ventricular Hypertrophy |
| Hb | Hemoglobin | Region RWMA | Regional Wall Motion Abnormality |
| K | Potassium | VHD | Valvular Heart Disease |
| Na | Sodium |
References
- Lo, Y.; Fujita, H.; Pai, T. Prediction of Coronary Artery Disease Based on Ensemble Learning Approaches and Co-Expressed Observations. J. Mech. Med. Biol. 2016, 16, 1640010. [Google Scholar] [CrossRef]
- Amin, M.; Chiam, Y.; Varathan, K. Identification of significant features and data mining techniques in predicting heart disease. Telemat. Inform. 2019, 36, 82–93. [Google Scholar] [CrossRef]
- Cardiovascular Diseases. 2021. Available online: https://www.who.int/health-topics/cardiovascular-diseases#tab=tab_1 (accessed on 10 September 2021).
- Shaima, C.; Moorthi, P.; Shaheen, N. Cardiovascular diseases: Traditional and non-traditional risk factors. J. Med. Allied Sci. 2016, 6, 46. [Google Scholar] [CrossRef]
- Dwivedi, A. Performance evaluation of different machine learning techniques for prediction of heart disease. Neural Comput. Appl. 2016, 29, 685–693. [Google Scholar] [CrossRef]
- Ayatollahi, H.; Gholamhosseini, L.; Salehi, M. Predicting coronary artery disease: A comparison between two data mining algorithms. BMC Public Health 2019, 19, 448. [Google Scholar] [CrossRef]
- Abdar, M.; Książek, W.; Acharya, U.; Tan, R.; Makarenkov, V.; Pławiak, P. A new machine learning technique for an accurate diagnosis of coronary artery disease. Comput. Methods Programs Biomed. 2019, 179, 104992. [Google Scholar] [CrossRef]
- Akella, A.; Akella, S. Machine learning algorithms for predicting coronary artery disease: Efforts toward an open-source solution. Future Sci. OA 2021, 7, FSO698. [Google Scholar] [CrossRef]
- Cuvitoglu, A.; Isik, Z. Classification of CAD dataset by using principal component analysis and machine learning approaches. In Proceedings of the 2018 5th International Conference on Electrical and Electronic Engineering (ICEEE), Istanbul, Turkey, 3–5 May 2018. [Google Scholar] [CrossRef]
- Kutrani, H.; Eltalhi, S. Cardiac Catheterization Procedure Predicyion Using Machine Learning and Data Mining Techniques. 2019. Available online: https://www.semanticscholar.org/paper/Cardiac-Catheterization-Procedure-Prediction-Using-Kutrani-Eltalhi/763ac488da8a97c19170ecff36a2e8dbdffe64c6 (accessed on 22 August 2021).
- Tougui, I.; Jilbab, A.; El Mhamdi, J. Heart disease classification using data mining tools and machine learning techniques. Health Technol. 2020, 10, 1137–1144. [Google Scholar] [CrossRef]
- Naushad, S.; Hussain, T.; Indumathi, B.; Samreen, K.; Alrokayan, S.; Kutala, V. Machine learning algorithm-based risk prediction model of coronary artery disease. Mol. Biol. Rep. 2018, 45, 901–910. [Google Scholar] [CrossRef]
- UCI Machine Learning Repository: Z-Alizadeh Sani Data Set. 2020. Available online: https://archive.ics.uci.edu/ml/datasets/Z-Alizadeh+Sani (accessed on 28 November 2020).
- Sharma, T.; Sharma, A.; Mansotra, V. Performance Analysis of Data Mining Classification Techniques on Public Health Care Data. 2016. Available online: https://www.researchgate.net/publication/313571291_Performance_Analysis_of_Data_Mining_Classification_Techniques_on_Public_Health_Care_Data (accessed on 22 August 2021).
- Abdulqader, D.M.; Abdulazeez, A.M.; Zeebaree, D.Q. Machine Learning Supervised Algorithms of Gene Selection: A Review. Technol. Rep. Kansai Univ. 2020, 62. [Google Scholar]
- Ahmed, F.S.; Ali, L.; Mustafa, R.U.; Khattak, H.A.; Hameed, T.; Wajahat, I.; Kadry, S.; Bukhari, S.A. Correction to: A hybrid machine learning framework to predict mortality in paralytic ileus patients using electronic health records (EHRs). J. Ambient. Intell. Humaniz. Comput. 2021, 12, 3283–3293. [Google Scholar] [CrossRef]
- Yahyaoui, A.; Jamil, A.; Rasheed, J.; Yesiltepe, M. A Decision Support System for Diabetes Prediction Using Machine Learning and Deep Learning Techniques. In Proceedings of the 2019 1st International Informatics and Software Engineering Conference (UBMYK), Ankara, Turkey, 6–7 November 2019. [Google Scholar] [CrossRef]
- Lodha, P.; Talele, A.; Degaonkar, K. Diagnosis of Alzheimer’s Disease Using Machine Learning. In Proceedings of the 2018 Fourth International Conference on Computing Communication Control and Automation (ICCUBEA), Pune, India, 16–18 August 2018. [Google Scholar] [CrossRef]
- Kuncheva, L.I. Combining Pattern Classifiers: Methods and Algorithms; John Wiley & Sons: Hoboken, NJ, USA, 2014. [Google Scholar]
- Iwendi, C.; Bashir, A.K.; Peshkar, A.; Sujatha, R.; Chatterjee, J.M.; Pasupuleti, S.; Mishra, R.; Pillai, S.; Jo, O. COVID-19 Patient Health Prediction Using Boosted Random Forest Algorithm. Front. Public Health 2020, 8, 357. [Google Scholar] [CrossRef]
- Naghibi, S.; Pourghasemi, H.; Dixon, B. GIS-based groundwater potential mapping using boosted regression tree, classification and regression tree, and random forest machine learning models in Iran. Environ. Monit. Assess. 2015, 188, 44. [Google Scholar] [CrossRef] [PubMed]
- Ashraf, S.; Saleem, S.; Ahmed, T.; Aslam, Z.; Muhammad, D. Conversion of adverse data corpus to shrewd output using sampling metrics. Vis. Comput. Ind. Biomed. Art 2020, 3, 19. [Google Scholar] [CrossRef]
- Wuest, T.; Weimer, D.; Irgens, C.; Thoben, K. Machine learning in manufacturing: Advantages, challenges, and applications. Prod. Manuf. Res. 2016, 4, 23–45. [Google Scholar] [CrossRef] [Green Version]
- Guo, C. Enhancing Face Identification Using Local Binary Patterns and K-Nearest Neighbors. J. Imaging 2017, 3, 37. [Google Scholar] [CrossRef] [Green Version]
- Thabtah, F.; Abdelhamid, N.; Peebles, D. A machine learning autism classification based on analysis. Health Inf. Sci. Syst. 2019, 7, 12. [Google Scholar] [CrossRef]
- Hsu, Y.C.; Tsai, I.; Hsu, H.; Hsu, P.W.; Cheng, M.H.; Huang, Y.L.; Chen, J.H.; Lei, M.H.; Ling, C.Y. Using Anti-Malondialdehyde Modified Peptide Autoantibodies to Import Machine Learning for Predicting Coronary Artery Stenosis in Taiwanese Patients with Coronary Artery Disease. Diagnostics 2021, 11, 961. [Google Scholar] [CrossRef]
- Megna, R.; Petretta, M.; Assante, R.; Zampella, E.; Nappi, C.; Gaudieri, V.; Mannarino, T.; D’Antonio, A.; Green, R.; Cantoni, V.; et al. A Comparison among Different Machine Learning Pretest Approaches to Predict Stress-Induced Ischemia at PET/CT Myocardial Perfusion Imaging. Comput. Math. Methods Med. 2021, 2021, 3551756. [Google Scholar] [CrossRef]
- Muhammad, L.; Al-Shourbaji, I.; Haruna, A.; Mohammed, I.; Ahmad, A.; Jibrin, M. Machine Learning Predictive Models for Coronary Artery Disease. SN Comput. Sci. 2021, 2, 350. [Google Scholar] [CrossRef]
- Sharma, D.; Gotlieb, N.; Farkouh, M.; Patel, K.; Xu, W.; Bhat, M. Machine Learning Approach to Classify Cardiovascular Disease in Patients With Nonalcoholic Fatty Liver Disease in the UK Biobank Cohort. J. Am. Heart Assoc. 2022, 11, e022576. [Google Scholar] [CrossRef]
- Jiang, Y.; Zhang, X.; Ma, R.; Wang, X.; Liu, J.; Keerman, M.; Yan, Y.; Ma, J.; Song, Y.; Zhang, J.; et al. Cardiovascular Disease Prediction by Machine Learning Algorithms Based on Cytokines in Kazakhs of China. Clin. Epidemiol. 2021, 13, 417–428. [Google Scholar] [CrossRef] [PubMed]
- Patro, S.; Padhy, N.; Chiranjevi, D. Ambient assisted living predictive model for cardiovascular disease prediction using supervised learning. Evol. Intell. 2020, 14, 941–969. [Google Scholar] [CrossRef]
- Alizadehsani, R.; Zangooei, M.H.; Hosseini, M.J.; Habibi, J.; Khosravi, A.; Roshanzamir, M.; Khozeimeh, F.; Sarrafzadegan, N.; Nahavandi, S. Coronary artery disease detection using computational intelligence methods. Knowl.-Based Syst. 2016, 109, 187–197. [Google Scholar] [CrossRef]
- Couronné, R.; Probst, P.; Boulesteix, A. Random forest versus logistic regression: A large-scale benchmark experiment. BMC Bioinform. 2018, 19, 270. [Google Scholar] [CrossRef]
- Jurafsky, D.; Martin, H.J. Speech and Language Processing. 2021. Available online: https://web.stanford.edu/~jurafsky/slp3/5.pdf (accessed on 28 November 2021).
- Austin, P.; Tu, J.; Ho, J.; Levy, D.; Lee, D. Using methods from the data mining and machine-learning literature for disease classification and prediction: A case study examining classification of heart failure subtypes. J. Clin. Epidemiol. 2013, 66, 398–407. [Google Scholar] [CrossRef] [Green Version]
- Chen, X.; Fu, Y.; Lin, J.; Ji, Y.; Fang, Y.; Wu, J. Coronary Artery Disease Detection by Machine Learning with Coronary Bifurcation Features. Appl. Sci. 2020, 10, 7656. [Google Scholar] [CrossRef]
Figure 1.
Classification Workflow.

Figure 2.
ROC for Table 5. (a) NEU Hospital dataset; (b) Z-Alizadeh Sani dataset; (c) combined dataset.
Figure 2.
ROC for Table 5. (a) NEU Hospital dataset; (b) Z-Alizadeh Sani dataset; (c) combined dataset.

Figure 3.
ROC for Table 6.
Figure 3.
ROC for Table 6.

Figure 4.
ROC for Table 7.
Figure 4.
ROC for Table 7.


Table 1.
Descriptive statistics for quantitative variables.
| Variables | NEU Hospital | Z-Alizadeh Sani | ||
|---|---|---|---|---|
| Mean ± SD | Median (Min–Max) | Mean ± SD | Median (Min–Max) | |
| Age | 60.98 ± 10.95 | 62 (32–89) | 58.89 ± 10.39 | 58 (30–86) |
| BP (mm/Hg) | 124.33 ± 17.03 | 120 (80–220) | 129.55 ± 18.94 | 130 (90–190) |
| PR (ppm) | 74.92 ± 12.50 | 74 (45–171) | 75.14 ± 8.91 | 70 (50–110) |
| FBS (mg/dL) | 120.02 ± 42.68 | 107 (69–362) | 119.18 ± 52.08 | 98 (62–400) |
| CR (mg/dL) | 0.90 ± 0.45 | 0.82 (0.5–7.6) | 1.05 ± 0.26 | 1 (0.5–2.2) |
| TG (mg/dL) | 148.96 ± 82.30 | 131 (7–686) | 150.34 ± 97.96 | 122 (37–1050) |
| LDL (mg/dL) | 117.75± 39.32 | 114 (40–337) | 104.64 ± 35.40 | 100 (18–232) |
| HDL (mg/dL) | 45.77 ± 13.76 | 44 (13–169) | 40.23 ± 10.56 | 39 (15.9–111) |
| Bun (mg/dL) | 36.76 ± 15.22 | 34 (13–182) | 17.50 ± 6.96 | 16 (6–52) |
| Hb (g/dL) | 13.70 ± 1.68 | 13.90 (8.2–17.5) | 13.53 ± 1.61 | 13.2 (8.9–17.60) |
| K (mEq/lit) | 4.39 ± 0.44 | 4.4 (3–5.7) | 4.23 ± 0.46 | 4.2 (3–6.60) |
| Na (mEq/lit) | 139.87 ± 2.70 | 140 (129–147) | 140.1 ± 3.81 | 141 (128–156) |
| WBC (cells/mL) | 7.85 ± 5.36 | 7280 (2300–11240) | 7562.06 ± 2413.74 | 7100 (3700–18000) |
| Lymph (%) | 30.73 ± 9.30 | 30.3 (1.58–86.4) | 32.4 ± 9.97 | 32 (7–60) |
| Neut (%) | 59.74 ± 9.67 | 60.16 (3.27–90.1) | 60.15 ± 10.18 | 60 (32–89) |
| PLT (1000/mL) | 241.95 ± 77.12 | 232 (66–778) | 221.49 ± 60.79 | 210 (25–742) |
| EFTTE (%) | 57.75 ± 7.35 | 60 (30–72) | 47.23 ± 8.93 | 50 (15–60) |
Table 2.
Descriptive statistics for qualitative variables.
| Variables | n (%) | ||
|---|---|---|---|
| NEU Hospital | Z-Alizadeh Sani | ||
| Gender | Female | 148 (31.2%) | 127 (41.9%) |
| DM | Present | 114 (24.0%) | 90 (29.7%) |
| HT | Present | 216 (45.5%) | 179 (59.1%) |
| Smoking | Present | 139 (29.3%) | 63 (20.8%) |
| FH | Present | 65 (13.7%) | 48 (15.8%) |
| Edema | Present | 15 (3.2%) | 12 (4.0%) |
| Murmur | Present | 19 (4.0%) | 41 (13.5%) |
| Chest Pain | Present | 216 (45.5%) | 164 (54.1%) |
| Dyspnea | Present | 75 (15.8%) | 134 (44.2%) |
| LVH | Present | 73 (15.4%) | 20 (6.6%) |
| Region RWMA | Present | 70 (14.7%) | 86 (28.4%) |
| VHD | Present | 180 (37.9%) | 187 (61.7%) |
Table 3.
Comparison of quantitative variable distributions between patients and controls in both datasets.
Table 3.
Comparison of quantitative variable distributions between patients and controls in both datasets.
| Variable | Groups | NEU Hospital | Z-Alizadeh Sani | ||||||
|---|---|---|---|---|---|---|---|---|---|
| Mean ± SD | Median (Min–Max) | Z | p | Mean ± SD | Median (Min–Max) | Z | p | ||
| Age | Absent | 60.41 ± 10.57 | 61.00 (34.00–89.00) | −1.086 | 0.277 | 53.06 ± 9.32 | 52.00 (30.00–79.00) | −6.102 | <0.001 |
| Present | 61.30 ± 11.15 | 62.00 (32.00–89.00) | 61.25 ± 9.88 | 61.50 (36.00–86.00) | |||||
| Systolic BP | Absent | 123.76 ± 16.07 | 120.00 (95.00–200.00) | −0.694 | 0.488 | 122.47 ± 18.30 | 120.00 (90.00–180.00) | −4.455 | <0.001 |
| Present | 124.65 ± 17.56 | 120.00 (80.00–220.00) | 132.41 ± 18.48 | 130.00 (90.00–190.00) | |||||
| PR | Absent | 73.15 ± 13.23 | 72.00 (52.00–168.00) | −3.073 | 0.002 | 72.78 ± 8.08 | 70.00 (50.00–100.00) | −2.944 | 0.003 |
| Present | 75.90 ± 11.98 | 75.00 (45.00–171.00) | 76.09 ± 9.07 | 74.00 (50.00–110.00) | |||||
| FBS | Absent | 117.16 ± 40.75 | 105 (78.00–362.00) | −1.367 | 0.172 | 102.34 ± 34.79 | 92.00 (65.00–300.00) | −4.121 | <0.001 |
| Present | 121.61 ± 43.70 | 107.00 (69.00–338.00) | 125.97 ± 56.26 | 103.00 (62.00–400.00) | |||||
| CR | Absent | 0.92 ± 0.57 | 0.830 (0.560–7.590) | −0.552 | 0.581 | 1.02 ± 0.19 | 1.00 (0.60–1.60) | −0.985 | 0.325 |
| Present | 0.89 ± 0.37 | 0.810 (0.53–5.60) | 1.07± 0.29 | 1.00 (0.50–2.20) | |||||
| TG | Absent | 140.31 ± 70.06 | 130.00 (7.00–388.00) | −1.265 | 0.206 | 128.68 ± 75.54 | 110.00 (37.00–450.00) | −3.214 | 0.001 |
| Present | 153.78 ± 88.13 | 131.00 (24.00–686.00) | 159.07 ± 104.55 | 130.00 (50.00–1050.00) | |||||
| LDL | Absent | 113.19 ± 32.34 | 109.50 (42.00–200.00) | −1.425 | 0.154 | 105.95 ± 35.41 | 101 (18.00–232.00) | −0.512 | 0.608 |
| Present | 120.29 ± 42.55 | 118.00 (40.00–337.00) | 104.12 ± 35.46 | 100.00 (30.00–213.00) | |||||
| HDL | Absent | 45.65 ± 11.76 | 44.50 (13.00–82.00) | −1.031 | 0.303 | 40.94 ± 11.59 | 42.00 (15.90–83.00) | −0.669 | 0.503 |
| Present | 45.84 ± 14.77 | 43.00 (23.00–169.00) | 39.95 ± 10.13 | 39.00 (18.00–111.00) | |||||
| BUN | Absent | 37.02 ± 15.63 | 34.00 (17.00–182.00) | −0.551 | 0.582 | 16.53 ± 6.15 | 15.00 (6.00–41.00) | −1.518 | 0.129 |
| Present | 36.61 ± 15.02 | 34.00 (13.00–141.00) | 17.89 ± 7.23 | 16.00 (8.00–52.00) | |||||
| Hb | Absent | 13.84 ± 1.55 | 13.90 (10.30–17.30) | −0.920 | 0.358 | 13.26 ± 1.51 | 13.40 (9.00–17.50) | −0.802 | 0.423 |
| Present | 13.63 ± 1.74 | 13.80 (8.20–17.50) | 13.11 ± 1.65 | 13.10 (8.90–17.60) | |||||
| K | Absent | 4.38 ± 0.42 | 4.35 (3.30–5.50) | −0.572 | 0.567 | 4.10 ± 0.38 | 4.10 (3.00–5.20) | −3.133 | 0.002 |
| Present | 4.39 ± 0.44 | 4.40 (3.00–5.70) | 4.28 ± 0.48 | 4.30 (3.10–6.60) | |||||
| Na | Absent | 139.86 ± 2.72 | 140.00 (129.00–146.00) | −0.086 | 0.931 | 141.51 ± 3.35 | 141.00 (131.00–153.00) | −1.686 | 0.092 |
| Present | 139.88 ± 2.70 | 140.00 (130.00–147.00) | 140.79 ± 3.97 | 141.00 (128.00–156.00) | |||||
| WBC | Absent | 8.01 ± 8.35 | 7.05 (3.87–112.40) | −1.689 | 0.091 | 7.30 ± 2.11 | 7.10 (3.80–178.00) | −0.902 | 0.367 |
| Present | 7.77 ± 2.47 | 7.43 (2.30–27.71) | 7.67± 2.52 | 7.15 (3.70–18.00) | |||||
| Lymph | Absent | 31.03 ± 10.104 | 30.71 (3.37–86.38) | −0.474 | 0.636 | 34.39 ± 9.533 | 34.00 (9.00–60.00) | −2.171 | 0.030 |
| Present | 30.56 ± 8.84 | 30.29 (1.58–73.87) | 31.60 ± 10.06 | 31.50 (7.00–60.00) | |||||
| Neut | Absent | 59.58 ± 10.15 | 59.28 (9.06–90.08) | −0.623 | 0.533 | 58.16 ± 9.817 | 58 (32.00–89.00) | −2.156 | 0.031 |
| Present | 59.83 ± 9.41 | 60.28 (3.27–87.78) | 60.95 ± 10.24 | 60 (33.00–86.00) | |||||
| PLT | Absent | 234.33 ± 65.65 | 227.50 (60.00–492.00) | −1.401 | 0.161 | 230.56 ± 76.02 | 217.00 (129.00–742.00) | −1.203 | 0.229 |
| Present | 246.19 ± 82.62 | 235.00 (79.00–778.00) | 217.83 ± 53.23 | 208.00 (25.00–410.00) | |||||
| EF-TTE | Absent | 59.42 ± 5.51 | 60.00 (30.00–68.00) | −3.450 | 0.001 | 50.52 ± 8.04 | 55.00 (15.00–60.00) | −5.238 | <0.001 |
| Present | 56.81 ± 8.05 | 60.00 (30.00–72.00) | 45.91 ± 8.94 | 45.50 (15.00–60.00) | |||||
Table 4.
Comparison of qualitative variable distributions between patients and controls in both datasets.
Table 4.
Comparison of qualitative variable distributions between patients and controls in both datasets.
| Variables | NEU Hospital | Z-Alizadeh Sani | |||||||||||
|---|---|---|---|---|---|---|---|---|---|---|---|---|---|
| Absent | Present | Χ2 | p | Absent | Present | Χ2 | p | ||||||
| n | % | n | % | n | % | n | % | ||||||
| Sex | Female | 47 | 31.8 | 101 | 68.2 | 1.521 | 0.217 | 41 | 32.30% | 86 | 67.7 | 1.362 | 0.243 |
| Male | 123 | 37.6 | 204 | 62.4 | 46 | 26.10% | 130 | 73.9 | |||||
| DM | No | 137 | 38.0 | 224 | 62.0 | 3.056 | 0.080 | 77 | 36.20% | 136 | 63.8 | 19.379 | <0.001 |
| Yes | 33 | 28.9 | 81 | 71.1 | 10 | 11.10% | 80 | 88.9 | |||||
| HT | No | 97 | 37.5 | 162 | 62.5 | 0.685 | 0.408 | 55 | 44.40% | 69 | 55.6 | 25.090 | <0.001 |
| Yes | 73 | 33.8 | 143 | 66.2 | 32 | 17.90% | 147 | 82.1 | |||||
| Current Smoker | No | 134 | 39.9 | 202 | 60.1 | 8.364 | 0.004 | 73 | 30.40% | 167 | 69.6 | 1.637 | 0.201 |
| Yes | 36 | 25.9 | 103 | 74.1 | 14 | 22.20% | 49 | 77.8 | |||||
| FH | No | 151 | 36.8 | 259 | 63.2 | 1.410 | 0.235 | 75 | 29.40% | 180 | 70.6 | 0.384 | 0.535 |
| Yes | 19 | 29.2 | 46 | 70.8 | 12 | 25.00% | 36 | 75.0 | |||||
| Edema | No | 168 | 36.5 | 292 | 63.5 | 3.399 | 0.065 | 85 | 29.20% | 206 | 70.8 | 0.886 | 0.519 |
| Yes | 2 | 13.3 | 13 | 86.7 | 2 | 16.70% | 10 | 83.3 | |||||
| Systolic Murmur | No | 168 | 36.8 | 288 | 63.2 | 5.497 | 0.019 | 75 | 28.60% | 187 | 71.4 | 0.007 | 0.933 |
| Yes | 2 | 10.5 | 17 | 89.5 | 12 | 29.30% | 29 | 70.7 | |||||
| Chest Pain | No | 141 | 54.4 | 118 | 45.6 | 86.212 | <0.001 | 77 | 55.40% | 62 | 44.6 | 89.328 | <0.001 |
| Yes | 29 | 13.4 | 187 | 86.6 | 10 | 6.10% | 154 | 93.9 | |||||
| Dyspnea | No | 158 | 39.5 | 242 | 60.5 | 15.178 | <0.001 | 40 | 23.70% | 129 | 76.3 | 4.750 | 0.029 |
| Yes | 12 | 16.0 | 63 | 84.0 | 47 | 35.10% | 87 | 64.9 | |||||
| LVH | No | 150 | 37.3 | 252 | 62.7 | 2.644 | 0.104 | 83 | 29.30% | 200 | 70.7 | 0.794 | 0.373 |
| Yes | 20 | 27.4 | 53 | 72.6 | 4 | 20.00% | 16 | 80.0 | |||||
| Region RWMA | No | 161 | 39.8 | 244 | 60.2 | 18.788 | <0.001 | 83 | 38.20% | 134 | 61.8 | 33.966 | <0.001 |
| Yes | 9 | 12.9 | 61 | 87.1 | 4 | 4.70% | 82 | 95.3 | |||||
| VHD | No | 107 | 36.3 | 188 | 63.7 | 0.079 | 0.779 | 40 | 34.5% | 76 | 65.5 | 3.057 | 0.080 |
| Yes | 63 | 35.0 | 117 | 65.0 | 47 | 25.1% | 140 | 74.9 | |||||
Table 5.
Random Sampling results for Step 1.
| Classifier | AUC | CA | F1 | Precision | Recall | |
|---|---|---|---|---|---|---|
| NEU Hospital Dataset (475) | kNN | 0.527 | 0.567 | 0.678 | 0.649 | 0.709 |
| SVM | 0.811 | 0.811 | 0.857 | 0.834 | 0.882 | |
| RF | 0.780 | 0.738 | 0.805 | 0.773 | 0.839 | |
| ANN | 0.798 | 0.754 | 0.813 | 0.794 | 0.834 | |
| Naïve Bayes | 0.758 | 0.710 | 0.772 | 0.782 | 0.762 | |
| LR | 0.813 | 0.765 | 0.820 | 0.807 | 0.834 | |
| Z-Alizadeh Sani Dataset (303) | kNN | 0.468 | 0.647 | 0.770 | 0.718 | 0.830 |
| SVM | 0.908 | 0.856 | 0.903 | 0.869 | 0.939 | |
| RF | 0.890 | 0.832 | 0.886 | 0.854 | 0.922 | |
| ANN | 0.896 | 0.844 | 0.892 | 0.880 | 0.904 | |
| Naïve Bayes | 0.914 | 0.845 | 0.889 | 0.906 | 0.873 | |
| LR | 0.924 | 0.865 | 0.907 | 0.895 | 0.919 | |
| Combined Dataset (778) | kNN | 0.522 | 0.605 | 0.722 | 0.682 | 0.767 |
| SVM | 0.826 | 0.786 | 0.847 | 0.813 | 0.833 | |
| RF | 0.815 | 0.776 | 0.839 | 0.807 | 0.875 | |
| ANN | 0.834 | 0.782 | 0.842 | 0.814 | 0.872 | |
| Naïve Bayes | 0.821 | 0.758 | 0.816 | 0.827 | 0.806 | |
| LR | 0.851 | 0.795 | 0.851 | 0.828 | 0.876 |
Table 6.
Classification results for Step 2.
| Classifier | AUC | CA | F1 | Precision | Recall |
|---|---|---|---|---|---|
| kNN | 0.584 | 0.657 | 0.758 | 0.762 | 0.755 |
| SVM | 0.500 | 0.713 | 0.832 | 0.713 | 1.000 |
| RF | 0.795 | 0.776 | 0.858 | 0.780 | 0.954 |
| ANN | 0.498 | 0.287 | - | - | - |
| Naïve Bayes | 0.861 | 0.756 | 0.850 | 0.755 | 0.972 |
| LR | 0.479 | 0.287 | - | - | - |
Table 7.
Classification results for Step 3.
| Classifier | AUC | CA | F1 | Precision | Recall |
|---|---|---|---|---|---|
| kNN | 0.512 | 0.642 | 0.782 | 0.642 | 1.000 |
| SVM | 0.763 | 0.716 | 0.810 | 0.709 | 0.944 |
| RF | 0.777 | 0.737 | 0.786 | 0.824 | 0.751 |
| ANN | 0.761 | 0.718 | 0.772 | 0.802 | 0.744 |
| Naïve Bayes | 0.729 | 0.686 | 0.749 | 0.771 | 0.728 |
| LR | 0.752 | 0.716 | 0.763 | 0.822 | 0.711 |
Table 8.
Literature review table.
| Year | Disease | Dataset | Algorithms | Best Classifier (AUC) |
|---|---|---|---|---|
| 2021 [26] | CAD | NTPC, Taiwan and ILH, Taiwan | Decision tree, RF, SVM | RF (94%) |
| 2021 [27] | Cardiovascular Disease | University Federico II | ADA, AdaBoost, LR, Naïve Bayes, RF, Rpart, SVM, XGBoost | LR (75%) |
| 2021 [28] | CAD | General Hospitals in Kano | LR, SVM, kNN, RF, Naïve Bayes, Gradient Booting | RF (92.04%) |
| 2021 [29] | Cardiovascular Disease | UK Biobank | Naïve Bayes, RF, Lasso, Ridge, SVM, LR, Neural Network | RF (79.9%) |
| 2021 [30] | Cardiovascular Disease | Kazakh population in Xinjiang | DT, kNN, LR, Naïve Bayes, RF, SVM, XGB | LR (87.2%) |
| 2020 [31] | Cardiovascular Disease | Cleveland database of UCI repository, Statlog heart disease dataset. | Linear Regression, Multiple Linear Regression, Ridge Regression, Decision Tree, SVM, kNN, Naive Bayes | Naïve Bayes (83%) |
Table 9.
Classification success of the research.
| AUC | Step 1 | Step 2 | Step 3 |
|---|---|---|---|
| Lower than 60% | kNN | kNN, SVM, ANN, LR | kNN |
| Higher than 75% | SVM, RF, ANN, Naïve Bayes, LR | RF, Naïve Bayes | SVM, RF, ANN, LR |
Publisher’s Note: MDPI stays neutral with regard to jurisdictional claims in published maps and institutional affiliations. |
© 2022 by the authors. Licensee MDPI, Basel, Switzerland. This article is an open access article distributed under the terms and conditions of the Creative Commons Attribution (CC BY) license (https://creativecommons.org/licenses/by/4.0/).
Share and Cite
MDPI and ACS Style
Yuvalı, M.; Yaman, B.; Tosun, Ö. Classification Comparison of Machine Learning Algorithms Using Two Independent CAD Datasets. Mathematics 2022, 10, 311. https://0-doi-org.brum.beds.ac.uk/10.3390/math10030311
AMA Style
Yuvalı M, Yaman B, Tosun Ö. Classification Comparison of Machine Learning Algorithms Using Two Independent CAD Datasets. Mathematics. 2022; 10(3):311. https://0-doi-org.brum.beds.ac.uk/10.3390/math10030311
Chicago/Turabian StyleYuvalı, Meliz, Belma Yaman, and Özgür Tosun. 2022. "Classification Comparison of Machine Learning Algorithms Using Two Independent CAD Datasets" Mathematics 10, no. 3: 311. https://0-doi-org.brum.beds.ac.uk/10.3390/math10030311
Note that from the first issue of 2016, this journal uses article numbers instead of page numbers. See further details here.