
Factors Influencing Physicians Migration—A Case Study from Romania


1
Departament of Statistics and Eonometrics, Faculty of Statistics, Cybernetics and Economic Informatics, Bucharest University of Economic Studies, 010552 Bucharest, Romania
2
Institute of National Economy, 050771 Bucharest, Romania
3
Faculty of Economics and Law, George Emil Palade University of Medicine, Pharmacy, Science and Technology of Targu Mures, 540142 Targu Mures, Romania
*
Author to whom correspondence should be addressed.
Mathematics 2022, 10(3), 505; https://0-doi-org.brum.beds.ac.uk/10.3390/math10030505
Submission received: 25 January 2022
/
Revised: 2 February 2022
/
Accepted: 4 February 2022
/
Published: 5 February 2022
(This article belongs to the Special Issue Time Series Analysis and Econometrics with Applications)
Abstract
:Brain drain is a phenomenon that, over time, has followed an upward trend. It is an important component represented by physicians’ migration. For the country of destination, the migration of physicians offers several advantages, whereas the country of origin loses skilled and sometimes highly trained individuals. This process will be reflected both in the efficiency of the health system (severe employment shortage) and in the quality of the health system services. After Romania’s accession to the EU, the migration of doctors intensified, significantly increasing the shortage of physicians. The purpose of this article is to identify the push factors that influence the physicians’ decision to migrate from Romania. For this, a panel regression analysis was applied, highlighting that physicians’ migration is influenced by several factors, such as the number of beds in hospitals, the number of emigrants, unemployment rate, and income. At the same time, we analyzed the extent to which public policy measures addressed to the remuneration of medical staff influenced the propensity towards external mobility of the practicing doctors, already employed and/or graduates. The results confirm that public policies can be a tool for redistributing the labor force allocation on the labor market. Moreover, the results of our analysis highlight that specific measures do not solve the system crises facing the health sector. Systemic, multidimensional changes are needed, adapted to the needs of medical services specific to the geographical area and adequate to the health status of the population.
1. Introduction
The migration of doctors and nurses can be considered as a phenomenon with multiple determinations, subject to opposite confrontations—on the one hand, the professional vocation to help others and the improve their community’s health, and, on the other part, the natural expectations of individuals for financial comfort and well-being, as a result of the work performed. From the profession’s perspective, the quality of the medical act is associated with modern treatment technologies and the adequate endowment of jobs. From a social perspective, public policies aim at efficient allocation of production factors and human capital, as a guarantee of ensuring a healthy workforce for the national business environment. However, the shortage of qualified personnel in more developed countries and the comparative advantages clearly superior to those offered in emerging, less developed countries have the effect of deploying a significant number of specialists from home countries (both from the health care sector’s labor market and from new graduates) to destination countries [1]. From a policy perspective, the countries of origin of qualified personnel in the health sector face a major challenge: (a) on the one hand, to ensure the right of free movement of persons, including doctors, by granting the right to practice in any market of work (professional practice permits), and (b) on the other hand, to attract the necessary medical staff for their own health sector. Starting from this permanent challenge, we analyzed the influencing factors of external mobility and the impact of public policies on the mobility of doctors, on the example of Romania.
According to Ahmad [2], the “migration of health workers from poorer to richer nations is unlikely to stop, but we can and must put policies in place to minimize the damage it causes”. Therefore, the potential for redistribution through appropriate public policies should optimize interventions in order to counteract the forces of attractiveness and promote the comparative advantages from destination countries.
The EU enlargement creates new opportunities for healthcare specialists from new member states to migrate for better jobs ’positions in higher developed EU members. Physicians’ migration factors may differ between countries, but the motivation and decision to migrate is determined by a complex of dynamic factors. Push and pull factors influenced the final decision for working abroad, including special licensing requirements, professional work permits, registration procedures for foreign physicians, or study equivalence. The factors that influence doctors’ decision to migrate are multiple; they can be grouped into five motivational pillars: economic context, demographic factors, remuneration policy, political instability, and working conditions [3,4,5].
Moreover, although the main flow is from low- and middle-income countries to high-income countries [6,7], an interconnected global employment market, especially in the last two decades, has highlighted the fact that recruitment and retention of a competent health care workforce is also a major problem in “traditionally receiving countries”. Public support policies for attracting and retaining experts, especially doctors, have become the “strong currency” for the redistribution of medical staff on the globalized labor market [8], i.e., multiannual work visas [9] and fixed-term employment.
The mobility of medical staff from Romania has increased with the process of EU integration [10] and the development of the graduate recognition system. The liberalization of the movement of persons in the EU space after 2007—by contingent on professions and countries and, since 2014, free movement—has determined the increase in the number of requests for work premises and the increase in the stock of medical personnel practicing abroad. Workflows abroad were fed simultaneously on two channels: (a) experienced staff, already employed in the health system, dissatisfied with the conditions in Romania, and (b) graduates who have not found a job in the health system according to their own expectations.
Romania is among the main providers of specialists worldwide, holding the fifth place for doctors and eighth for nurses, according to the latest statistics [11]. The share of immigrant health personnel from Romania is significant in many OECD countries, thus consolidating emigration routes. As a profound reform of the health sector is delaying, Romania is facing a widespread health crisis, chromicised with the current pandemic. Besides the acute need to cover the shortage of medical staff in the current structures, there is a higher demand for preventive medicine services, palliative services, for recovery services, etc. These components of the health sector, properly equipped with well-developed logistics, including digitizing operations/procedures/services can attract graduates and relocate existing staff in the system, including by increasing professional training and/or double specialization.
In this context, the aim of this paper is to identify factors influencing the physicians’ decision to migrate from Romania. An important aspect is the territorial one, determining the areas from where physicians decide to leave, but also the favorite destinations.
Therefore, our objective is twofold: (1) highlight the variables that influence the physicians’ decision to migrate from Romania and (2) identify the geographical distribution. For this, we analyzed variables that reflect living standards and working conditions (income, unemployment rates, the number of late fetal deaths, the number of beds, and the number of emigrants), as well as the number of applications for Current Professional Certificates. The Current Professional Certificates are certificates issued by the Romanian College of Physicians and are necessary for physicians who want to work abroad, representing a recognition of the medical profession.
In order to address these research questions, we organized the rest of the article as follows. Section 2 contains the literature review, Section 3 is dedicated to describing the data and methods used, Section 4 presents the results, and Section 5 examines the public policy measures addressed to the health sector in general and the medical staff in particular. Critical observations are presented as a result of the association of the analysis with the potential/expected impact of the implemented policy measures. The last section focuses on highlighting the main conclusions and some recommendations of public policy measures needed to alter the preference of doctors for jobs abroad in favor of employment on the national labor market.
2. Literature Review
Healthcare systems around the world are facing deficiencies regarding physicians migrating from low- to high-income countries. According to the presentation of the International Epidemiological Association scientific meeting, in Dublin [12], the physicians who migrated to the US increased over time, with the source being the developing countries and the pull factors being mainly economic.
The main factors influencing physicians’ migration are represented by higher incomes and better economic context in the destination country. The demand for physicians was influenced by population density and standard of living [13].
Mejia [14] studied the international migration of physicians and nurses in 137 countries, highlighting the characteristics of migrants, dimensions, directions, possible determinants and consequences of migration, and actions taken to regulate migration. The results showed that countries that produce more physicians and nurses than they can afford become donors of such labor, while those that produce fewer than they can afford become recipients. The other factors derive or are secondary to the economic factor.
Hagopian et al. [15] analyzed the physicians’ migration from sub-Saharan Africa to the United States, using the American Medical Association 2002 Masterfile. The results showed that 23% of physicians from America are emigrants, and 64% of them migrated from low- or middle-income countries. The physician’s migration to rich countries unbalances the workforce around the world, affecting the health systems of the origin countries, having a significant negative effect on the ratio between physicians and population.
Akl et al. [16] studied the international migration of physicians from Lebanon to the USA. The results identified that about 40% of Lebanese physicians migrated to the United States. High-income countries should consider the consequences of their human resources policies on both low-income countries and their own healthcare systems.
Hussey [17] analyzed the dynamics of international migration of physicians to the United States between 1994 and 2000. The results of the study indicated that the physicians’ migration was significantly influenced by GDP per capita. Other factors that have influenced physicians’ migration include the absence of medical schools and the existence of immigrant networks in the United States, medical instructions in English, proximity to the United States, and lack of political and civil liberties in countries of origin.
Another important factor influencing physicians’ migration is represented by working conditions. Ronaghy et al. [18] studied the migration of doctors from Iran to the United States in 1973. In total, 2270 Iranian doctors were questioned, looking at the intention to return to Iran and the reasons. The factors that mainly influenced the decision not to return to the country of origin were professional-related, especially given the lack of medical facilities and equipment in Iran.
Astor et al. [19] designed and distributed a questionnaire that addressed the reasons why physicians migrate to developed countries, how migration is related to the structure of health education, the effect that migration has on the healthcare infrastructure of developing countries, and various policy options to address physician migration. This questionnaire targeted physicians based on expertise or experience in India, Nigeria, Pakistan, Colombia, and the Philippines. The results indicated the main factors that influenced the decision to migration: increased income, access to improved technology, atmosphere of general security and stability, and improved perspectives for children. Most respondents considered that physicians in developing areas register highly specialized skills that they can more effectively use in developed countries, with physician migration exacerbating deficiencies in rural and public areas.
In Europe, the accession to the European Union of new member states brought similar challenges. For example, after the accession of the Czech Republic to the EU, the migration of physicians increased. Hnilicová et al. [20] conducted an empirical study on migration trends in the Czech Republic, using a survey of 462 physicians. The results showed that the most popular destination countries were the United Kingdom, Ireland, and Germany. The factors that influenced the migration of physicians were better income, improved language skills, and a desire to experience more professional conditions. Regarding age, young physicians migrated more than the elderly.
Vanasse et al. [21] studied physicians’ intentions to migrate using regression trees and logistic analysis. The results showed that dissatisfaction with professional life were highly influential to the migration of physicians. Other factors that influenced the migration decision were age, sex, and marital status.
Ramboarison-Lalao et al. [22] analyzed the migration from Malagasy Republic qualified people to France, using life stories of 17 Malagasy migrant physicians and interviewing a Malagasy director who recruited Malagasy physicians to work in France. The results highlighted two career profiles: those who worked as physicians and those who worked as nurses. For those who worked as nurses, migration was a waste of talent, leading to downward career mobility.
Ricketts [23] studied the migration of physicians practicing in 50 U.S. states between 2006 and 2011, using data from the American Medical Association’s master and logistic regression method. The variables considered in the analysis were age, sex, practice location, activity status, and specialization. For the analyzed period, the relocation rate of physicians from one county to another was 19.8%, with older male physicians from urban areas migrating less. Regarding specialization, surgeons and primary care physicians migrated less, while osteopathic physicians migrated more.
Hossain et al. [24] studied the perception of medical students on Pakistani migration. In total, 240 medical students were interviewed, of which 75% were women. Most wanted to migrate abroad, 66% of their favorite destination being the United States. The pull factors were represented by a better quality of postgraduate education abroad (48.2%) and economic prospects (35.2%), while the push factors were a poor health care system (94.3%), an inadequate wage structure (88.3%), insecurity (93.9%), and increasing religious intolerance in Pakistan (78.5%). The conclusion of the study showed that most medical students wanted to migrate, mainly due to low wages, poor working conditions, work structure, and insecurity. Furthermore, 54% of those who migrate are specialists in internal medicine.
Demographic factors influence the physician’s decision to migrate. Regarding the gender of the migrant physician, studies indicated that women migrate more than men. The explanation is that women are more social and supportive than men, and are much easier to integrate into a foreign society, making them prone to permanent migration [25].
Shuval [26] studied the migration of physicians from the former Soviet Union in the early 1990s to three different destinations: Canada, Israel, and the United States. The results showed that female and elderly physicians who migrated were relatively disadvantaged in the destination country. Migrant physicians who have decided not to apply for medical licenses have often redefined their professional identity in areas related to health.
Basu and Rajbhandary [27] studied the factors that influence the migration of physicians in the provinces of Canada. They analyzed the migration of physicians according to specializations, time, interactions between the province of residence and the province of destination, and spoken language. The results suggested that the physicians’ age, specialization, and province of residence had significantly influenced the migration of physicians to Canada.
Vanasse et al. [28] studied the long-term regional migration patterns of physicians over the course of their active practice careers, using logistic regression as well as regression tree analyses. The results showed that 13.2% of physicians migrated from one region to another between 1981 and 2003. Of these, females and young people around 30 years were more likely to migrate during their careers.
Political instability is another important factor influencing physicians’ migration. Kronfol et al. [29] examined how the war influenced the migration of physicians from Lebanon. Data on two cohorts of medical graduates from the American University of Beirut were analyzed: graduates before the start of the civil war and graduates during the war. The results showed an association between civil instability and migration. Other factors influencing physicians’ migration were nationality, training, and certification abroad.
Since 2007, Romania has faced the migration of physicians, who choose to work in Western European countries, especially in France. Romanian physicians worked in France, both as specialists in hospitals or in isolated rural areas. Séchet and Vasilcu [10] conducted a study on physicians’ migration in France, analyzing the results of a survey conducted on 182 Romanian physicians from three areas in France. The results showed that the motivations for the migrant physicians are professional and family-related, and that women migrate more and consider long-term or permanent migration.
3. Data and Methodology
In order to determine the push factors in the case of physicians’ migration and the regional distribution, we analysed the following variables: the number of emigrants, the number of beds, unemployment rate, income, the number of late fetal deaths, and the number of Current Professional Certificate for the 42 counties of Romania and the period 2016–2018. The processing and analysis were performed using the statistical software SAS (version 9.2), SPSS (version 13), Tableau, and Excel. The data sources include The Romanian College of Physicians and the Romanian National Institute of Statistics.
Current Professional Certificates represent the number of certificates required by Romanian physicians for their recognition outside Romania, so we can affirm that this number represents the number of physicians who consider to migrate from the country. The Current Professional Certificate is the document requested by the physician or the homologous competent authority of another state, containing relevant personal data on honourability, morality, and competence. This certificate is necessary for physicians, both past or current members of the Romanian College of Physicians, to exercise their profession. The data are provided by the Romanian College of Physicians, following the request no. 8585/30.08.2019- DA- 3303/02.09.2019. The definitions of the variables used in the model are according to the above mentioned statiscal data sources and are detailed below.
The number of beds represents the number of hospital beds available for the Romanian counties (EUROSTAT NUTS 3 code). There are registered hospital beds, beds in preventive and health centres, beds in medical and social units, beds in TBC sanatorium, neurosis or neuropsychiatric sanatorium, spas, and nurseries. The number of hospital beds includes beds for new-borns in hospitals or obstetrics and gynaecology departments, while companion beds are not included.
Late fetal deaths represent the number of late fetal deaths residing in that county, expressed as the number of persons.
Emigrants represents the number of emigrants, expressed as the number of persons. Temporary emigrants are people who emigrate abroad for a period of at least 12 months. Here, emigration means the action by which a person who previously had his residence in Romania changes his residence to another country for a period which is, or is expected to be, greater than 12 months.
Unemployment rate is the ratio between the number of unemployed (registered at the employment agencies) and the active population (unemployed + employed civilian population), defined according to the workforce balance methodology.
Income represents the net income. The average monthly net income represents the ratio between the net amounts paid to employees by the economic agents in the reference month, regardless of the period for which they are due and the number of employees.
The methods used in the analysis are correlations, panel data regression, and cluster analysis.
For analysing the physician’s migration from a transversal and longitudinal perspective, it is proposed to use the panel data analysis. Spatial dimension refers to a set of transverse observation units and the temporal dimension refers to periodic observations of a set of variables that characterize these cross-sectional units over a given period of time [30]. Panel data represent a set of cross-section data ( şi ) resulted from statistical observations of the variables characteristic of a group of n regions periodically, for a defined time interval, T [31].
In case of a spatial interaction effect in the analysis process, we can use the spatial econometrics model which is used as a spatial weighted matrix on the model [32]. Spatial panel data use the maximum likelihood estimation (MLE) approach, presenting the smallest variant of consistent group estimators. According to Baltagi [33], the weakness of MLE is raising problems in the computational process for large samples (N).
The variation of a dependent variable according to the determinant factors in panel data analysis is estimated using the following model:
Notations:
—cross section which are considered constant over the time;
—the values of the dependent variable;
—the values of the independent variable, , where:
— represents cross-sections;
— represents the periods of time, respectively the years;
is the error term over the time .
The number of coefficients () is greater than the number of observations (). It is necessary to use different coefficients; therefore, four canonical models are defined: fixed effects (individual and transversal), compound errors (random effects), compound coefficients, and random coefficients [32].
The panel data model presents three methods: common constant, fixed effects, and random effects.
- (a)
- The common constant method of estimation presents the results considering no differences among the data matrices of the cross-sectional dimension (N). This method uses the ordinary least square (OLS) approach or the least squares technique to estimate the panel data parameters [34].
- (b)
- The fixed effects (FE) method treats the constant as group-specific, allowing different constants for each group:
The fixed effect model differs from the common effect, but still uses the ordinary least square principle [35].
- (c)
- The random effects method estimates the leading constants for each section as random parameters rather than fixed. This model is also called the error component model (ECM) or the generalized least square (GLS) technique, which is advatageous for eliminating heteroskedasticity [35].
The equality ai = a + vi implies the variability of the constant for each section and vi has a zero mean for the random variable.
The random effects (RE) model can be written as follows:
In case of the fixed effects model, we consider different intercepts for each region. For the random effects model, we consider a different error term for each region [34]. Mundalk [36] indicated that the RE model assumes exogeneity of all the regressors and the random individual effects, and the FE model allows for endogeneity of all the regressors and the individual effects. Thus, Hausman and Taylor [37] proposed a model where some of the regressors are correlated with the individual effects.
In order to choose between the fixed effect (FE) and random effect (RE) estimators, the standard Hausman test is used [38]. According to it, when the null hypothesis is rejected, the conditional mean of the disturbances given the regressors is zero, and the FE estimators are used. Otherwise, RE estimators are considered.
These two models are considered under a one-way error component structure and could present either only cross-sectional dependence with no time dependence or both cross-sectional and time series dependence. Cross-sectional dependence influences the estimation, depending on a several factors, such as the magnitude of the correlations across cross-sections and the nature of cross-sectional dependence itself. The cross-sectional dependence is the result of the presence of common factors that are unobserved and not correlated with the included regressors. The fixed effect and random effect estimators are consistent, although not efficient, while the estimated standard errors are biased [39]. In this case, according to Driskoll and Kraay [40], it is necessary to correct the standard errors or to obtain an efficient estimator using the methods implemented by Robertson and Symons [41], as well as Coakley, Fuertes, and Smith [42].
In this case, the interdependencies across cross-sections are generated by unobserved components and correlated with the included regressors. Furthermore, when the estimators in for the two models are biased and inconsistent, the Pesaran approach [43] can be used. If sufficient cross-sectional dependence is ignored, the decrease in estimation efficiency can become so large that the pooled least squares estimator may provide little gain over the single OLS equation [44].
If the time dimension of the panel is bigger than the cross-sectional dimension, the LM test can be used, developed by Breusch and Pagan [45]. In addition, in the rest of the cases, the Pesaran’s test [46], Friedman’s statistic [47], or the test statistic proposed by Frees [48] can be used.
In the study, we considered the model with fixed effects, assuming the same influence of the factorial variables () on the variable explained () in case of all counties, for all periods of time (bkit = bk, using also the Hausman test results). The constant . can be decomposed as follows:
where = the regression model constant;
= a constant;
= unobservable differences between counties, individual fixed effects, or individual specificity of the county in terms of physicians’ migration; and
= the temporal differences existing in a county, i.e., the fixed-time effects or the existence of a temporal specificity for the counties regarding the Current Professional Certificates.
So, for estimating the impact of socio and economic variables on the physicians’ migration from Romanian counties for the 2016–2018 period, the following model is proposed:
Fixed effect estimates are not affected by county-specific unobserved effects because they are constant in time and are eliminated from the equation. Thus, these models do not require any assumption about the correlations between the unobserved and observed variables, as required by a random effects models [49].
Robustness checks (heteroskedasticity of residues, autocorrelation of residues, and dependence of residues between the panels) can be conducted by the Wooldridge autocorrelation test [50], the Wald test (heteroskedasticity of residues), the Pesaran test (dependence of residues between the panels), the Greene heteroskedasticity test [51], and the LM test (autocorrelation of residues). One of the strengths of panel regression analysis is the use of information regarding change between each pair of time points, not just between the start and end points of a panel survey [52].
For classifying the counties according to CPC, hierarchical cluster analysis is used. Cluster analysis classifies data vectors into homogeneous groups. We used the method of similarity matrices or the distance between individual vectors and vector groups [53].
Cluster analysis assumes similar observations in homogeneous subsets, highlighting the specific characteristics. In order to indicate the objects’ similarity, a remote function and grouping algorithms are used [54].
There are four types of grouping methods: hierarchical, partitioning, overlaying, and ordering algorithms, which determine the validation of algorithms. Validating the algorithms implies determining the ability of the methods to recover cluster configurations existing in the data through mathematical derivations, analysis of empirical datasets, and Monte Carlo simulations [55].
The hierarchical grouping algorithm is based on group correlation matrices [56], represented by dendrogram, i.e., a tree which groups all the elements [57].
The main aim of this method is to identify the underlying structure of objects through an iterative process that associates (agglomerative methods) or dissociates (divisive methods) objects [58].
Thus, all variables are included in small groups, which must be homogeneous [59], and the final result is included in the analyzed variables. According to distance, the side objects will be included to the same group, and the variables with large distances will be included in different clusters [60].
In order to identify similarities between groups is used:
- 1.
- Single linkage or the similarity of the closest pair:
dSL(A, B) = mini ∈ A, j ∈ Bdi, j
- 2.
- Complete linkage or the similarity of the furthest pair:
dCL(A, B) = maxi ∈ A, j ∈ Bdi, j
- 3.
- Group average or the average similarity between groups:
dGA = 1NANB∑I ∈ A∑j ∈ Bdi, j
4. Results
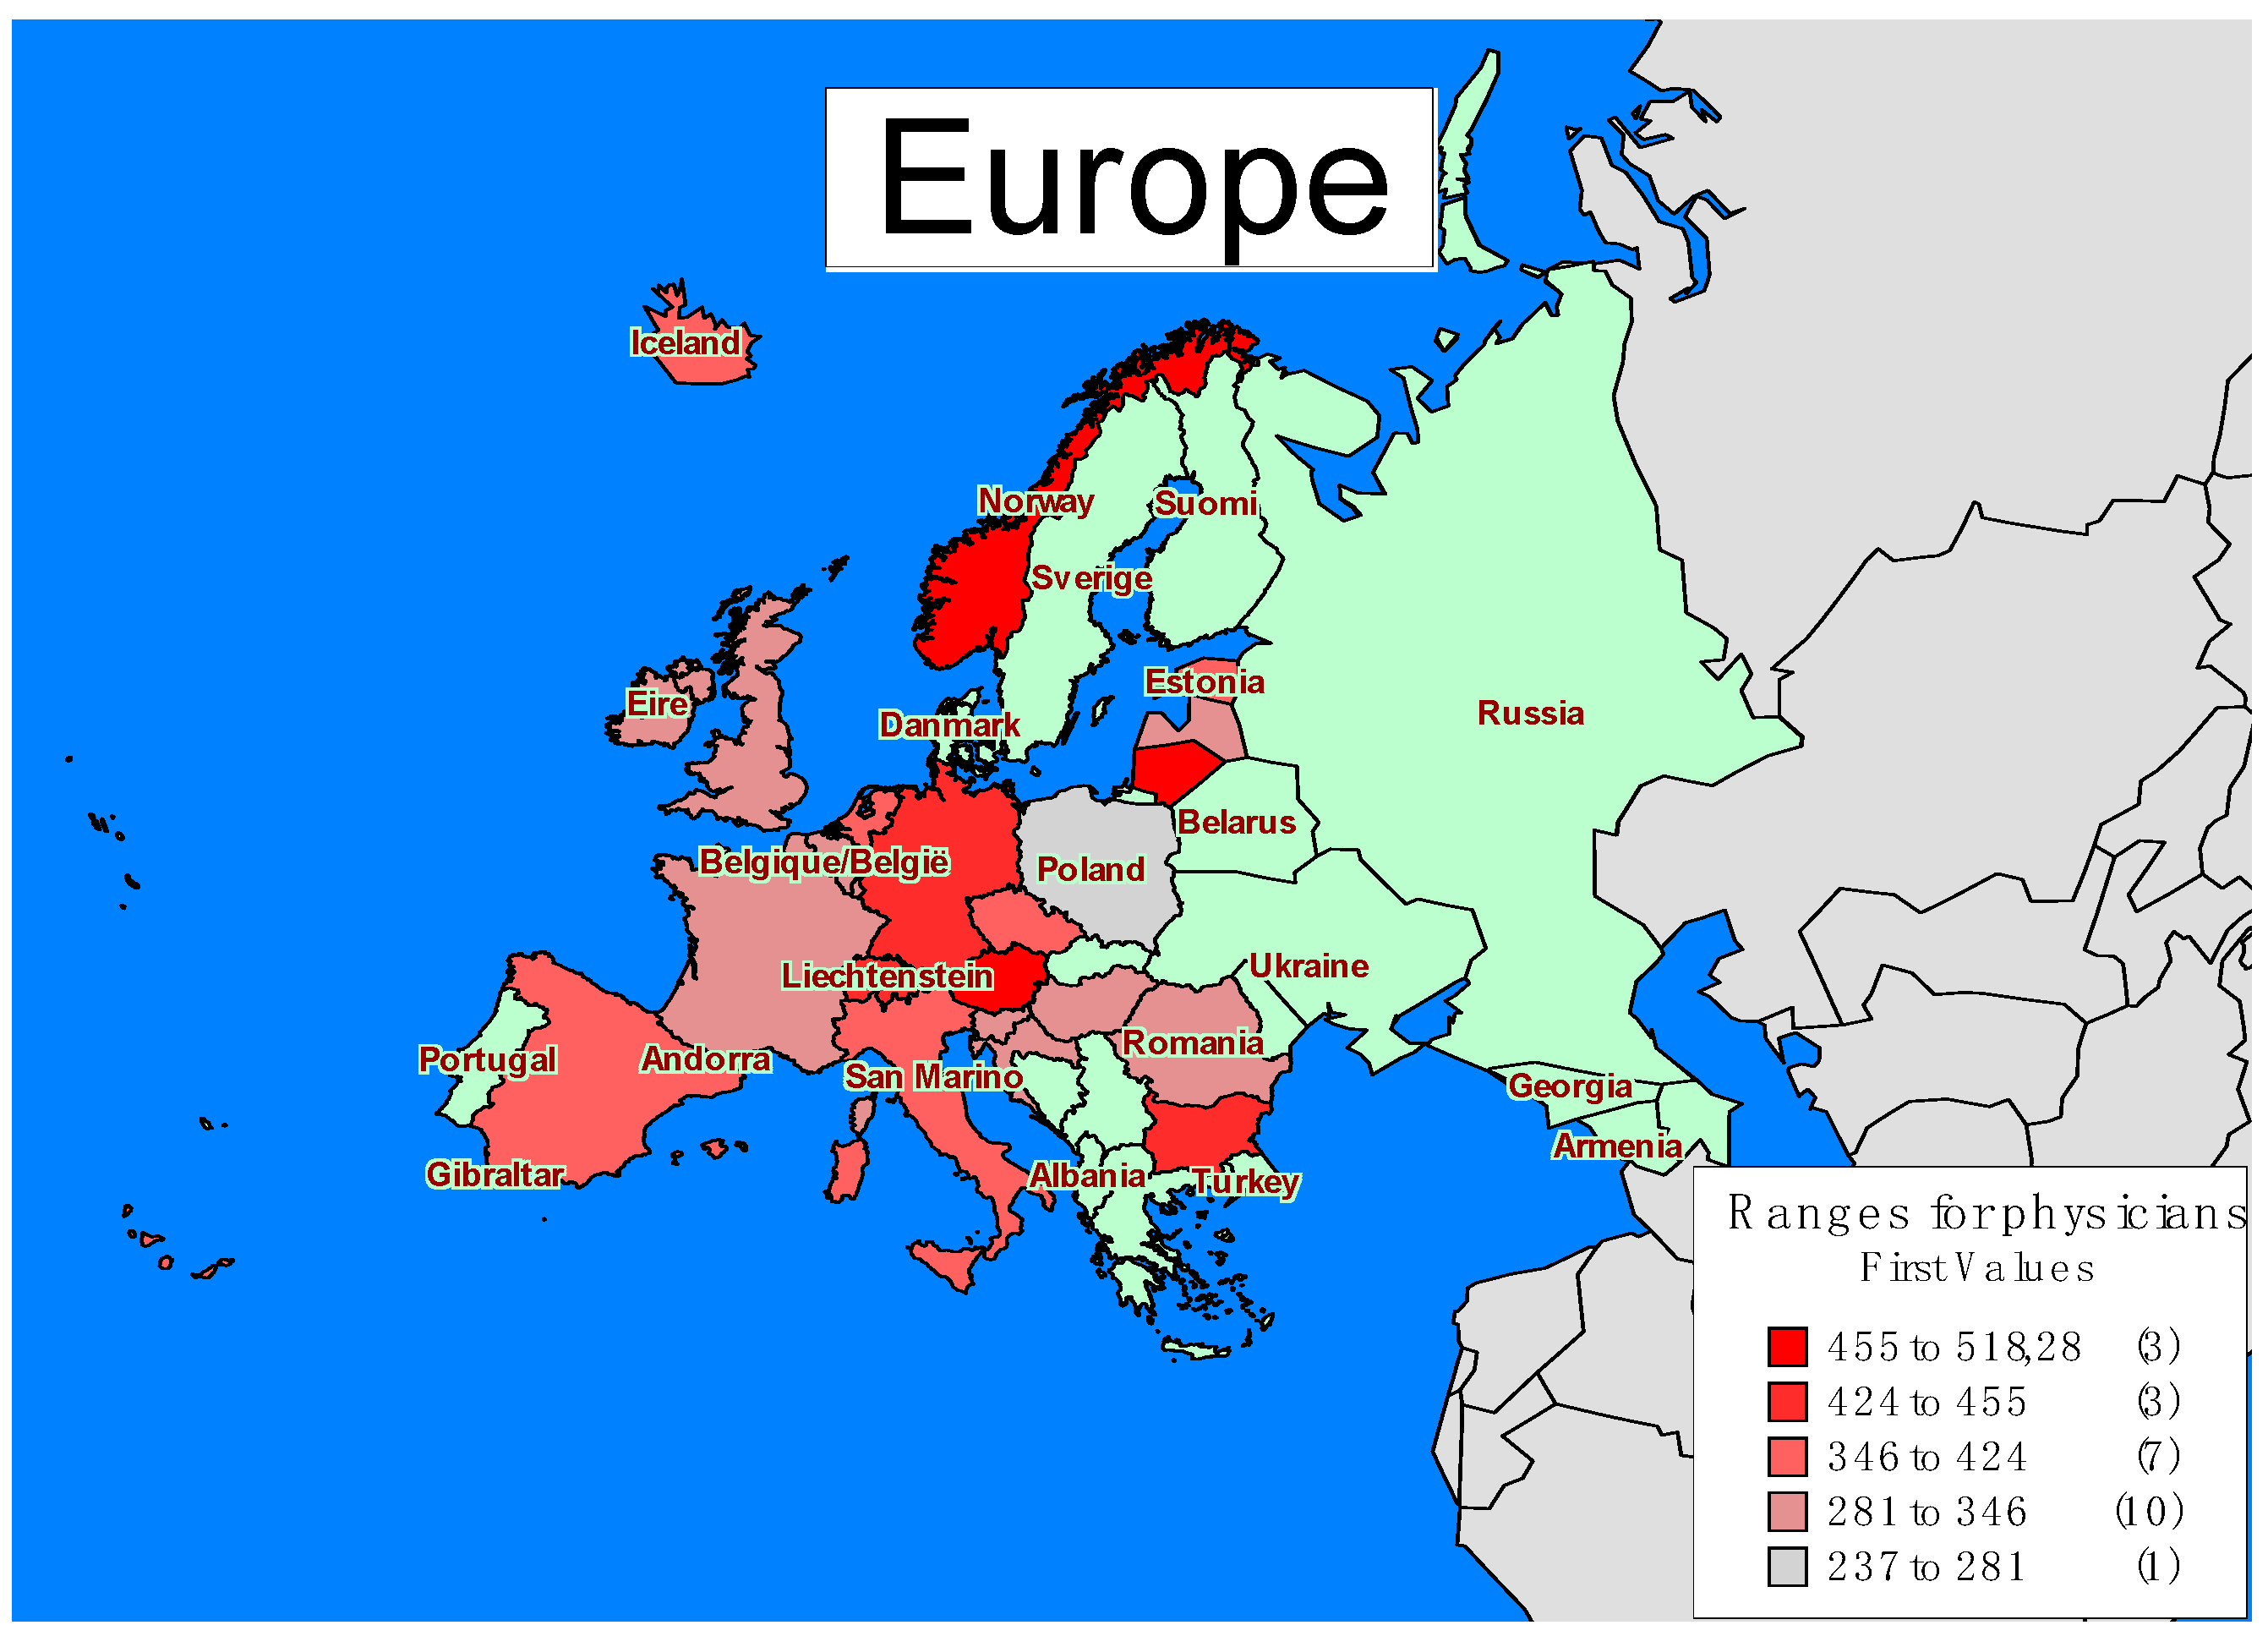
The territorial distribution of physicians is not uniform, and the EU is no exception. Some countries register a sufficient number of physicians, as poorly developed or developing countries face a shortage of physicians. Countries registering a deficit of trained physicians can afford to attract specialists from lower-income countries. In contrast, developing and underdeveloped countries cannot afford to attract physicians from other countries, so the deficit they face will deepen and the consequences will be reflected in the population health.
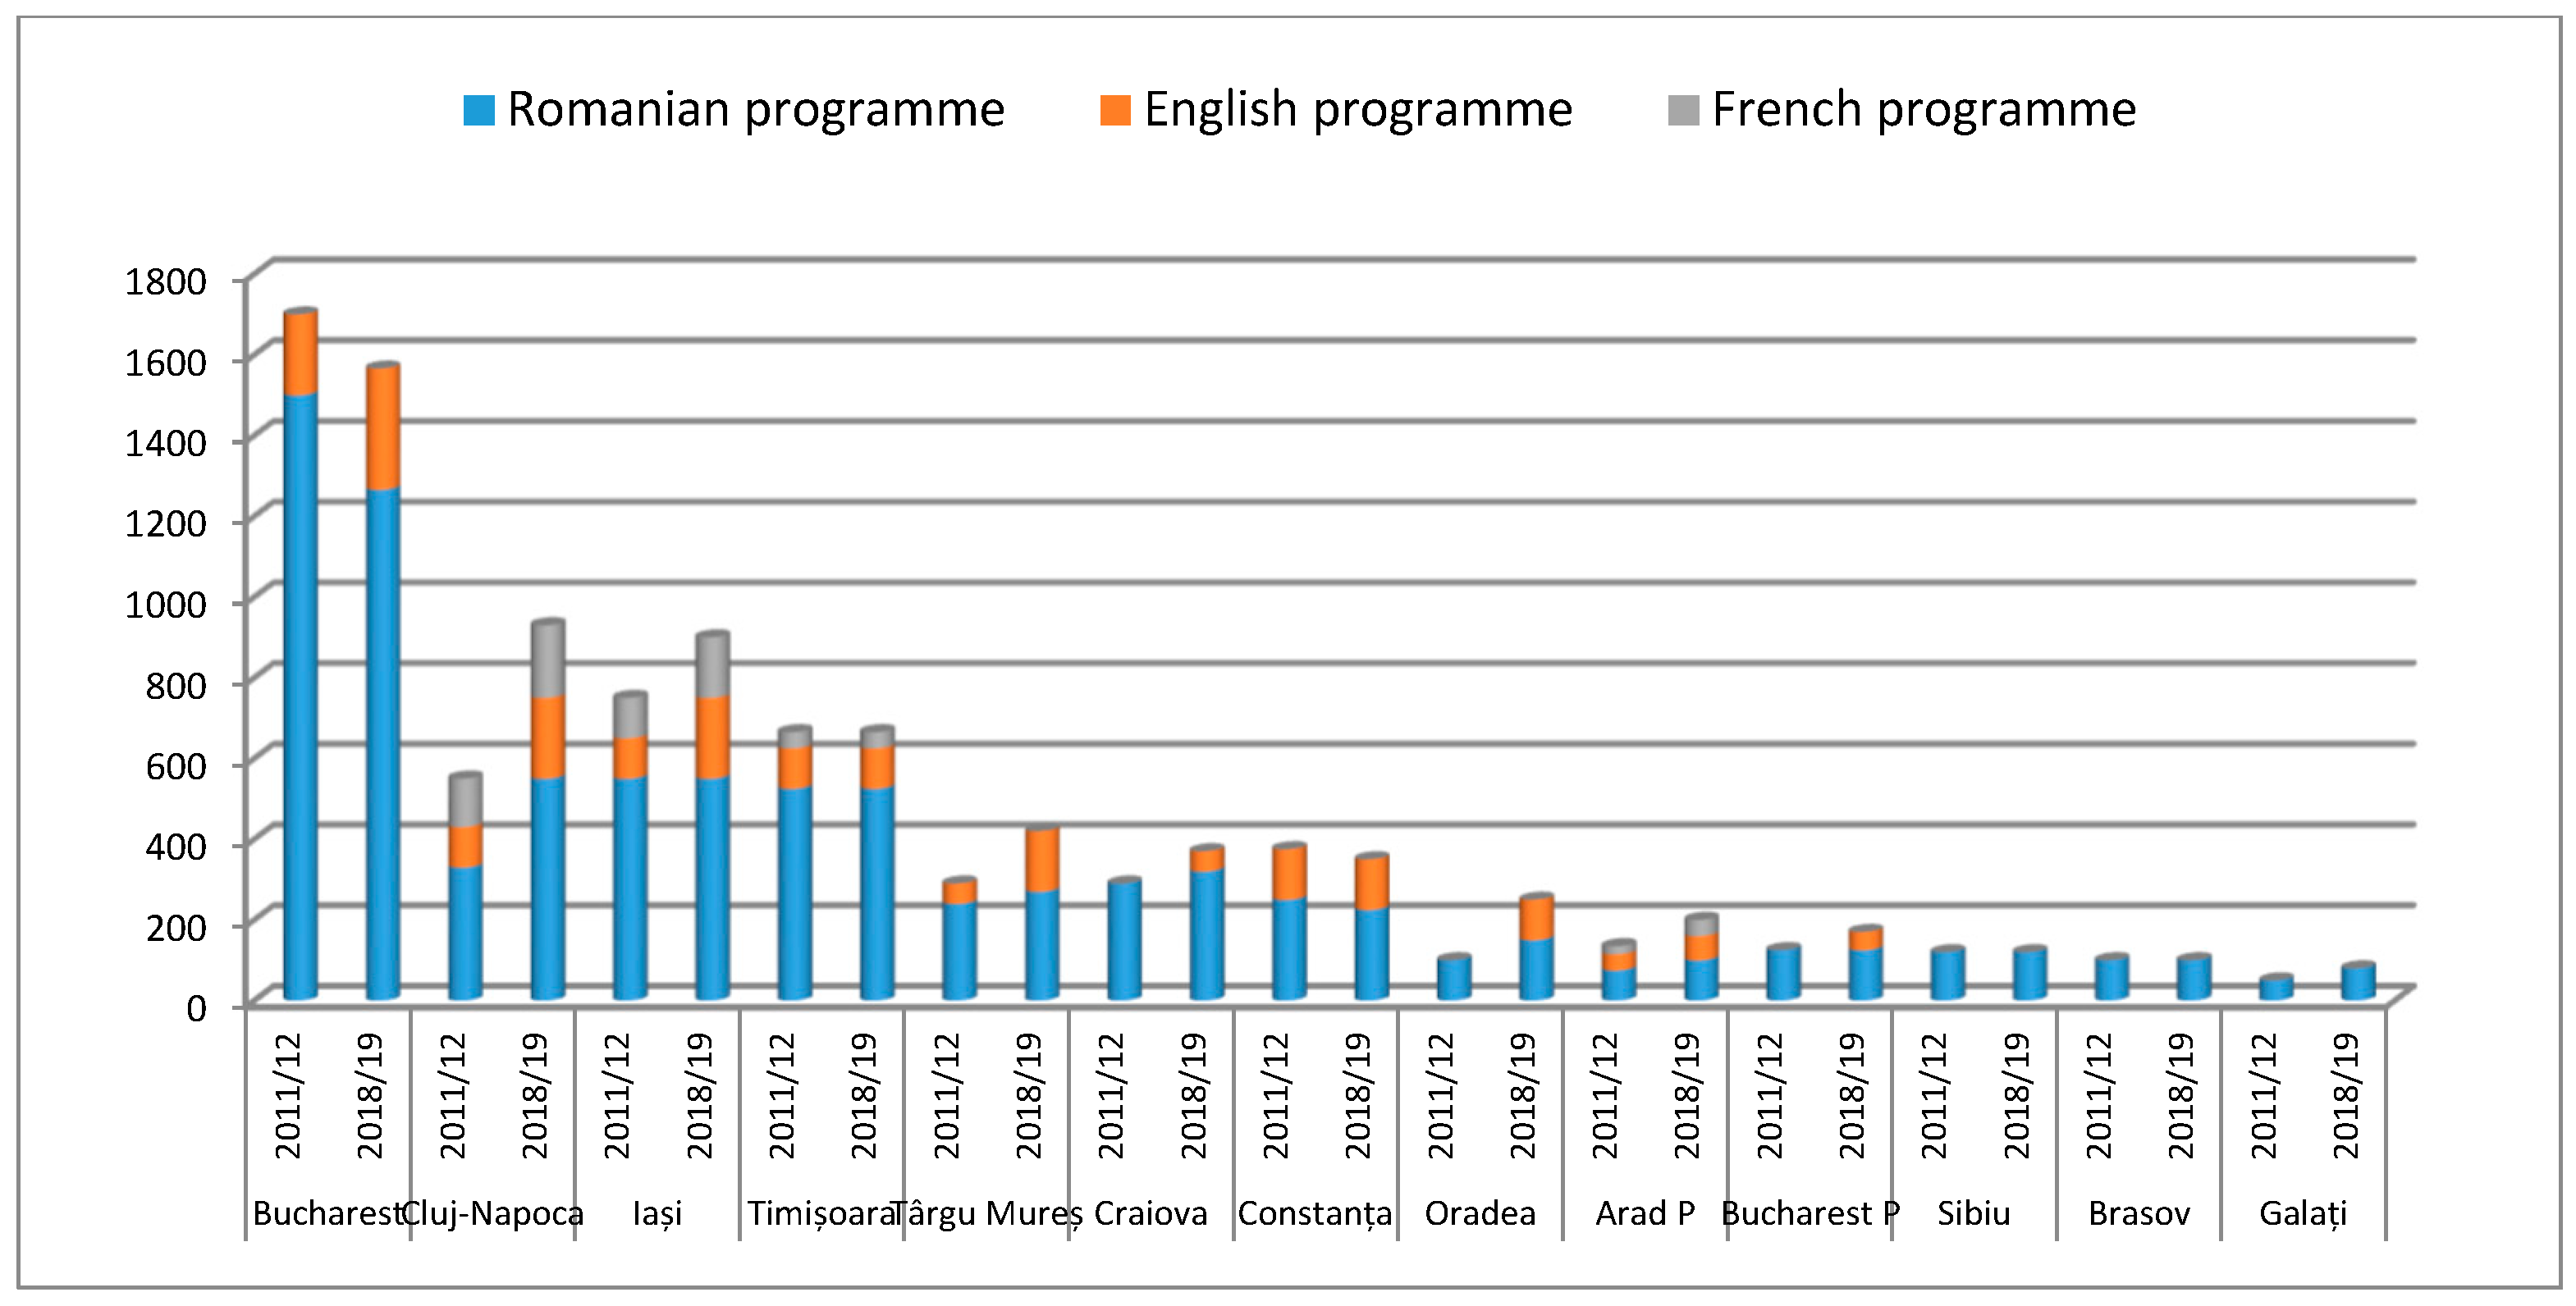
According to the map of Europe regarding the number of physicians available per hundred thousand inhabitants (Figure 1), it can be seen that the countries registering most physicians are Norway, Lithuania, and Austria, followed by Bulgaria, Germany, and Switzerland. The places with the fewest number of physicians per 100,000 inhabitants are Poland, Romania, Serbia, UK, and Montenegro. These countries register the largest shortage of physicians, but developed countries, such as the UK, cover this shortage by attracting physicians from other countries. Instead, for less developed or developing countries, it is almost impossible to cover this deficit, because the conditions offered to physicians are not attractive. In the case of Romania, a cause for physicians’ shortage is represented by physician’s migration, and this should be balanced, either by attracting physicians from other countries or by increasing the number of graduate physicians in the country. Attracting physicians from other countries is difficult to achieve because, in Romania, wages and working conditions are not attractive for physicians from other countries. If we analyze the number of new entries to medical schools for the period 2011–2012 and 2018–2019, there is not an increase or a very small increase if any. For Bucharest, there is even a decrease. An increase in students for English and French programs was observed; thus, we can consider these students are either foreign students who came to Romania to continue their studies, or Romanian students who consider migrating after graduation (Figure 2).
For Romania, physicians’ migration followed an ascending trend until 2016 and, after, started to decrease slightly, perhaps due to salary increases. In 2016, wages increased at the fastest annual rate in history, over 18%. In 2018, physicians’ wages increased by 27% compared to the previous year.
The data provided by the Romanian College of Physicians reflects the number of Current Professional Certificates required by Romanian physicians; therefore, we can reflect upon the number of physicians who consider migrating from Romania.
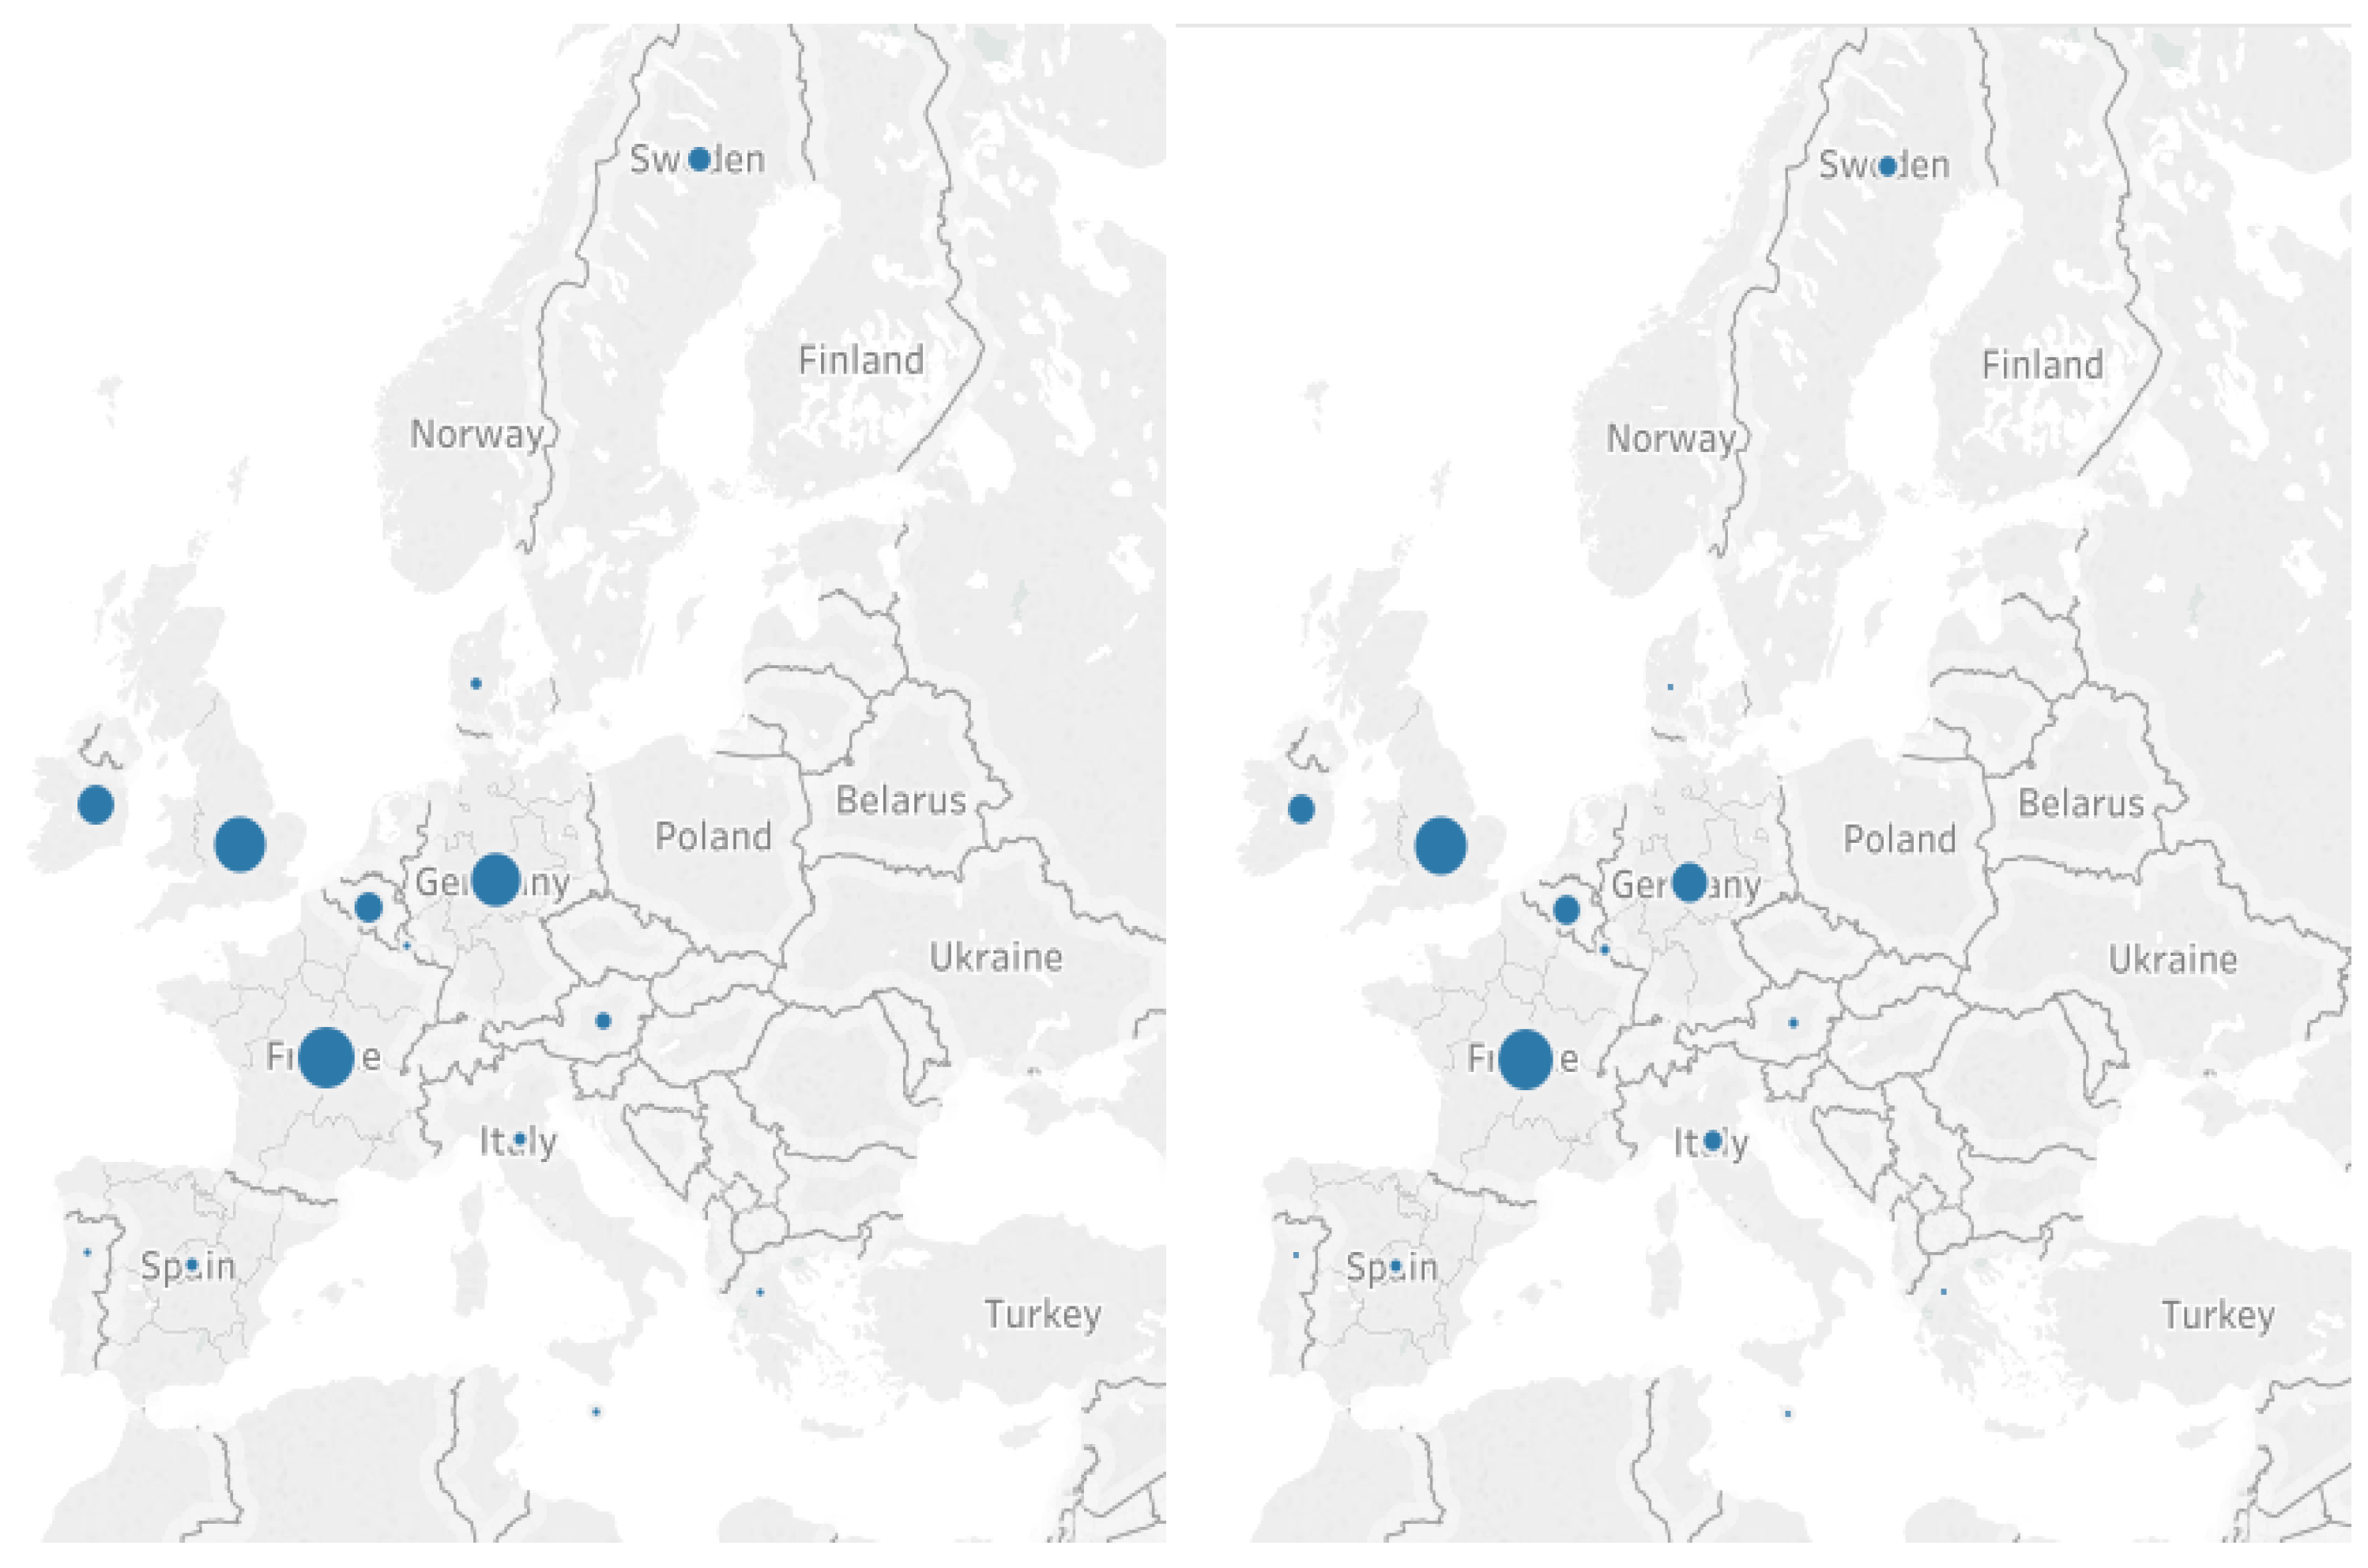
Using cluster analysis, we obtained the favorite destinations for physicians who consider migrating in 2016 and 2018. The countries preferred by Romanian physicians as a migration destination include France, the UK, and Germany. These are countries registering high incomes, whether physicians’ wages are higher than in Romania and where expenditures on the health sector are among the highest in Europe. In addition, as French, English, and German are studied languages in Romanian schools, many physicians know at least one of these three languages. In 2016, the first cluster includes France, Germany, and the UK; however, in 2018, Germany leaves this cluster, as the number of Current Professional Certificates decreased with the destination as Germany. In Romania, there are medical schools with programs in French and English but not in German, which explains the decrease in the number of migrant physicians from Romania to Germany (Figure 3).
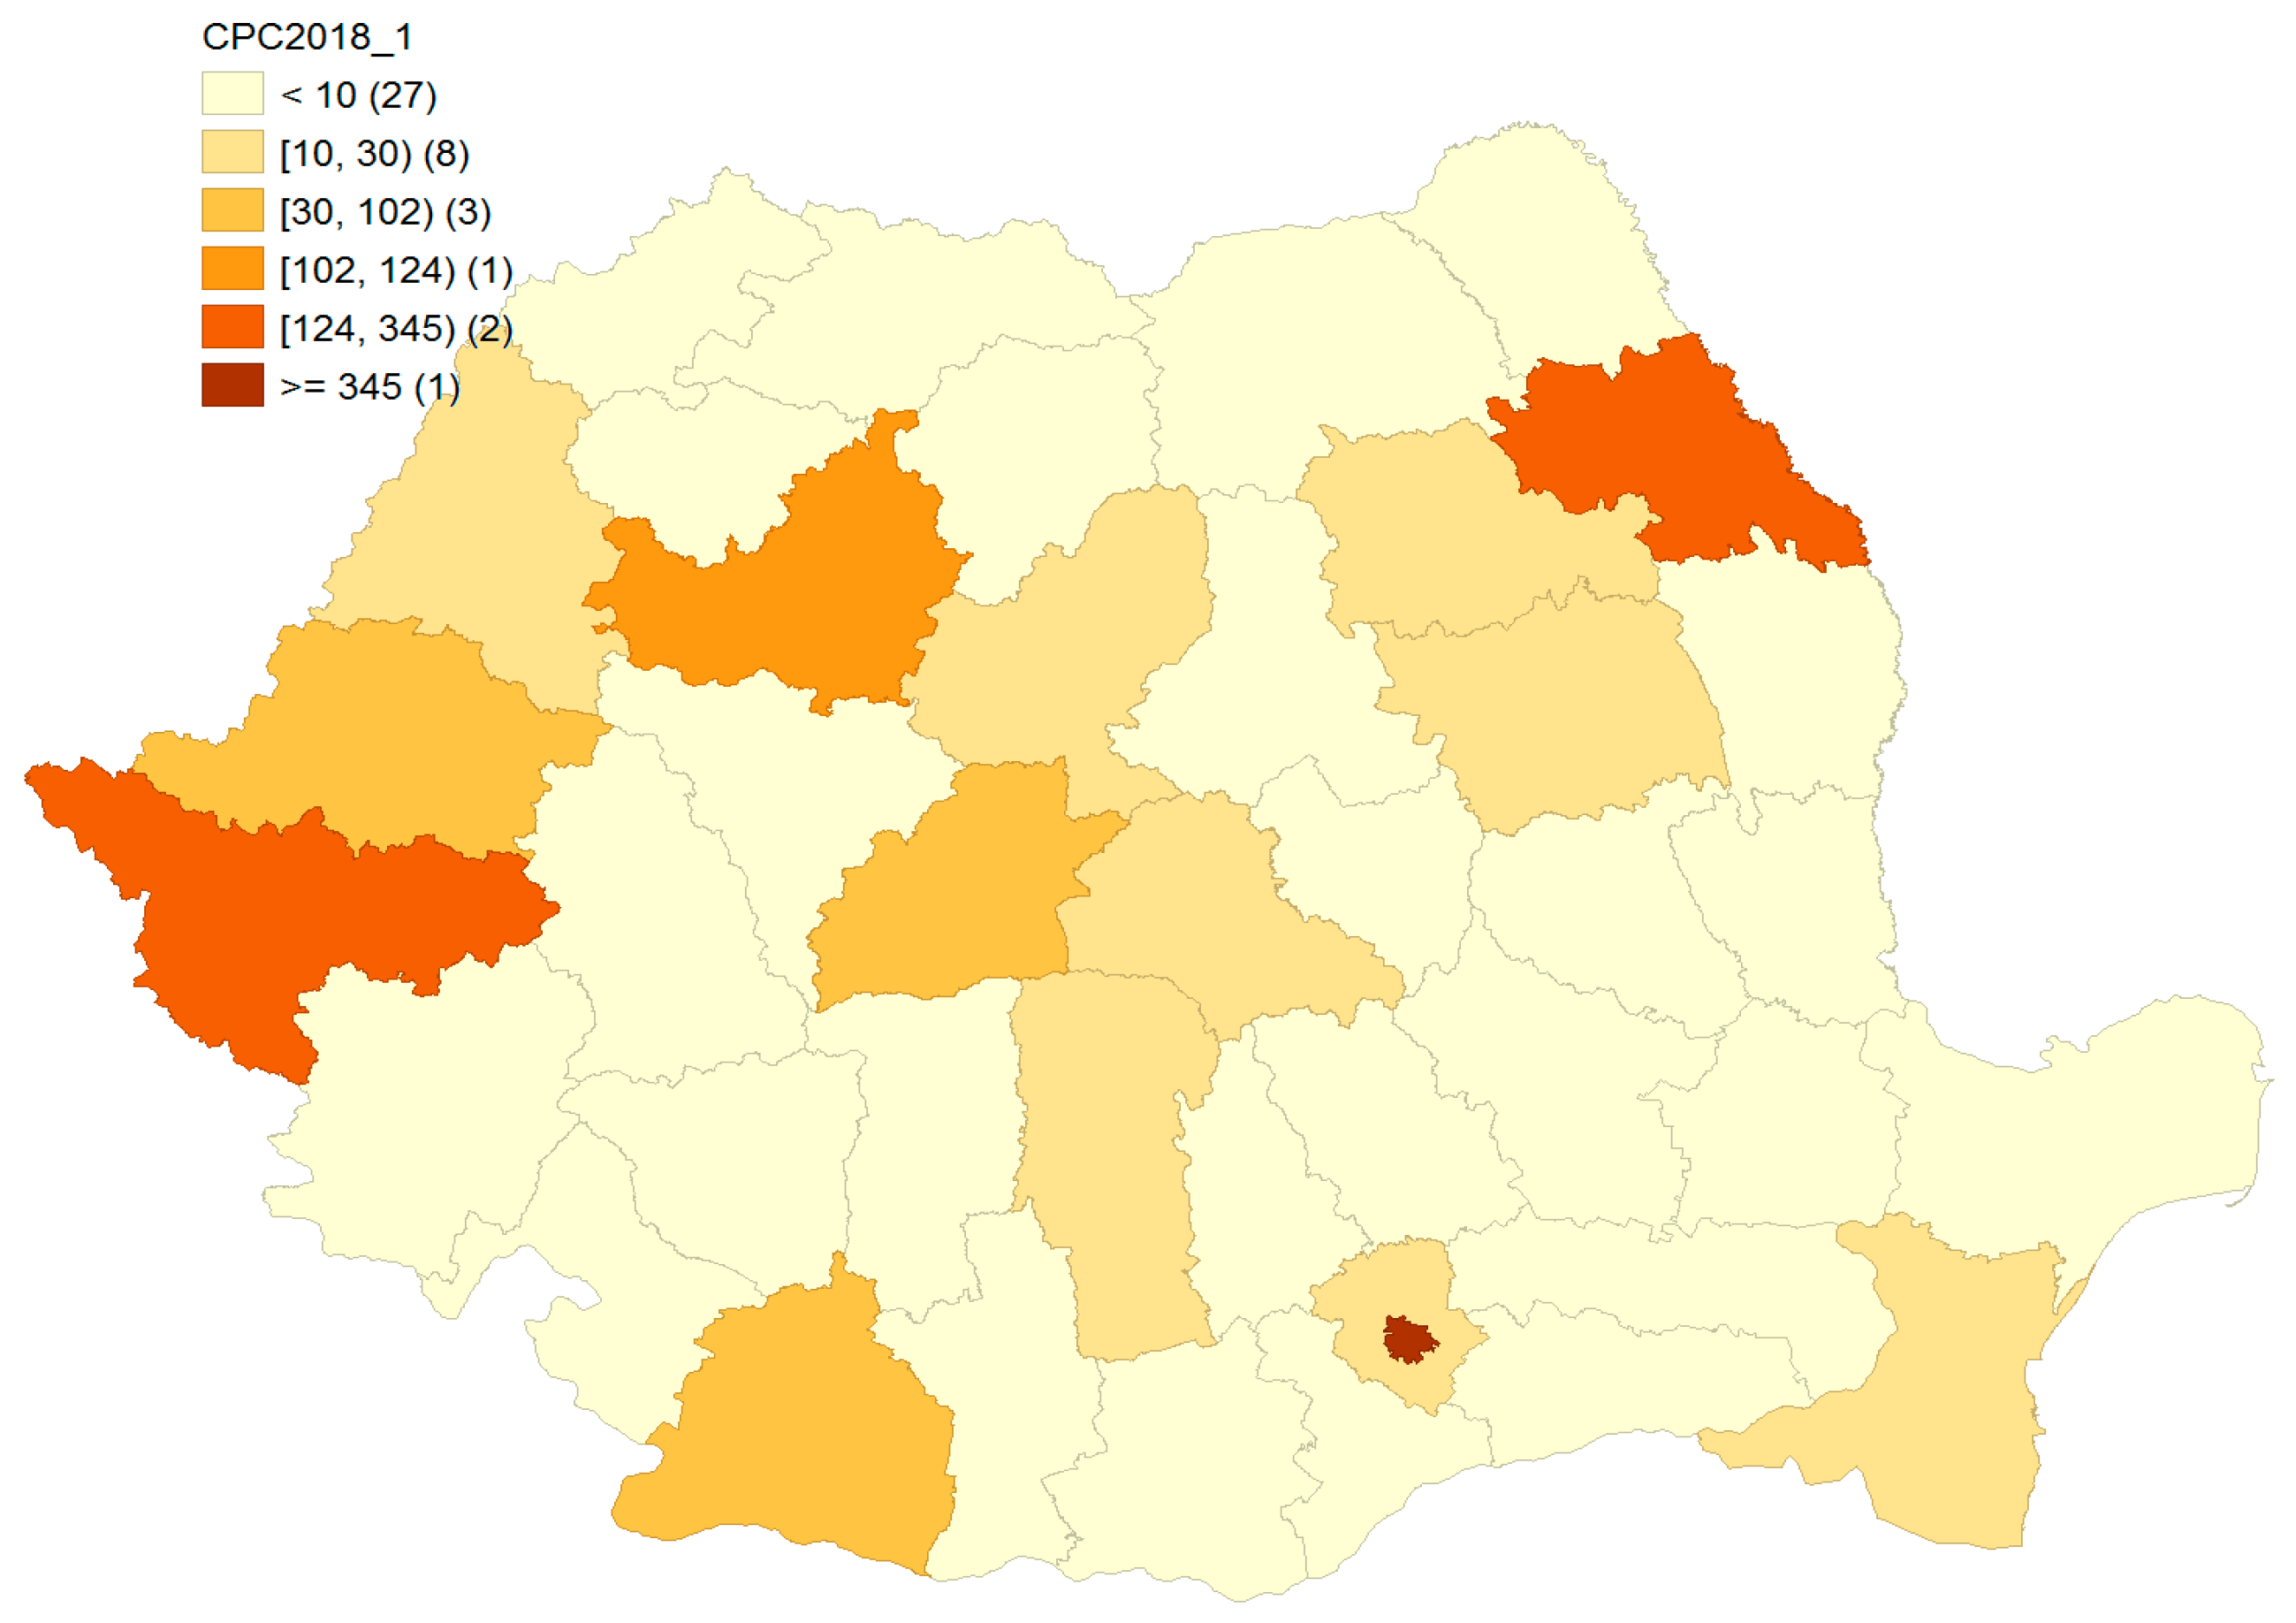
The territorial distribution of physicians is not uniform in Romania. The biggest discrepancies are noticed between rural and urban areas. The migration of physicians can deepen these discrepancies. It would be useful to identify the areas where physicians migrate from in order to take measures to reduce these gaps.
The map of Current Professional Certificates (Figure 4) shows that Iasi, Bucharest, Cluj, and Timis register the highest number of registered applications to obtain these certificates. This situation can be explained by the fact that Iasi, Cluj, Timis and Bucharest have the large university centers with medical schools and see a higher demand of graduates. According to the literature, migrating physicians are very good physicians and graduates of the best schools, as these four counties have the best medical schools.
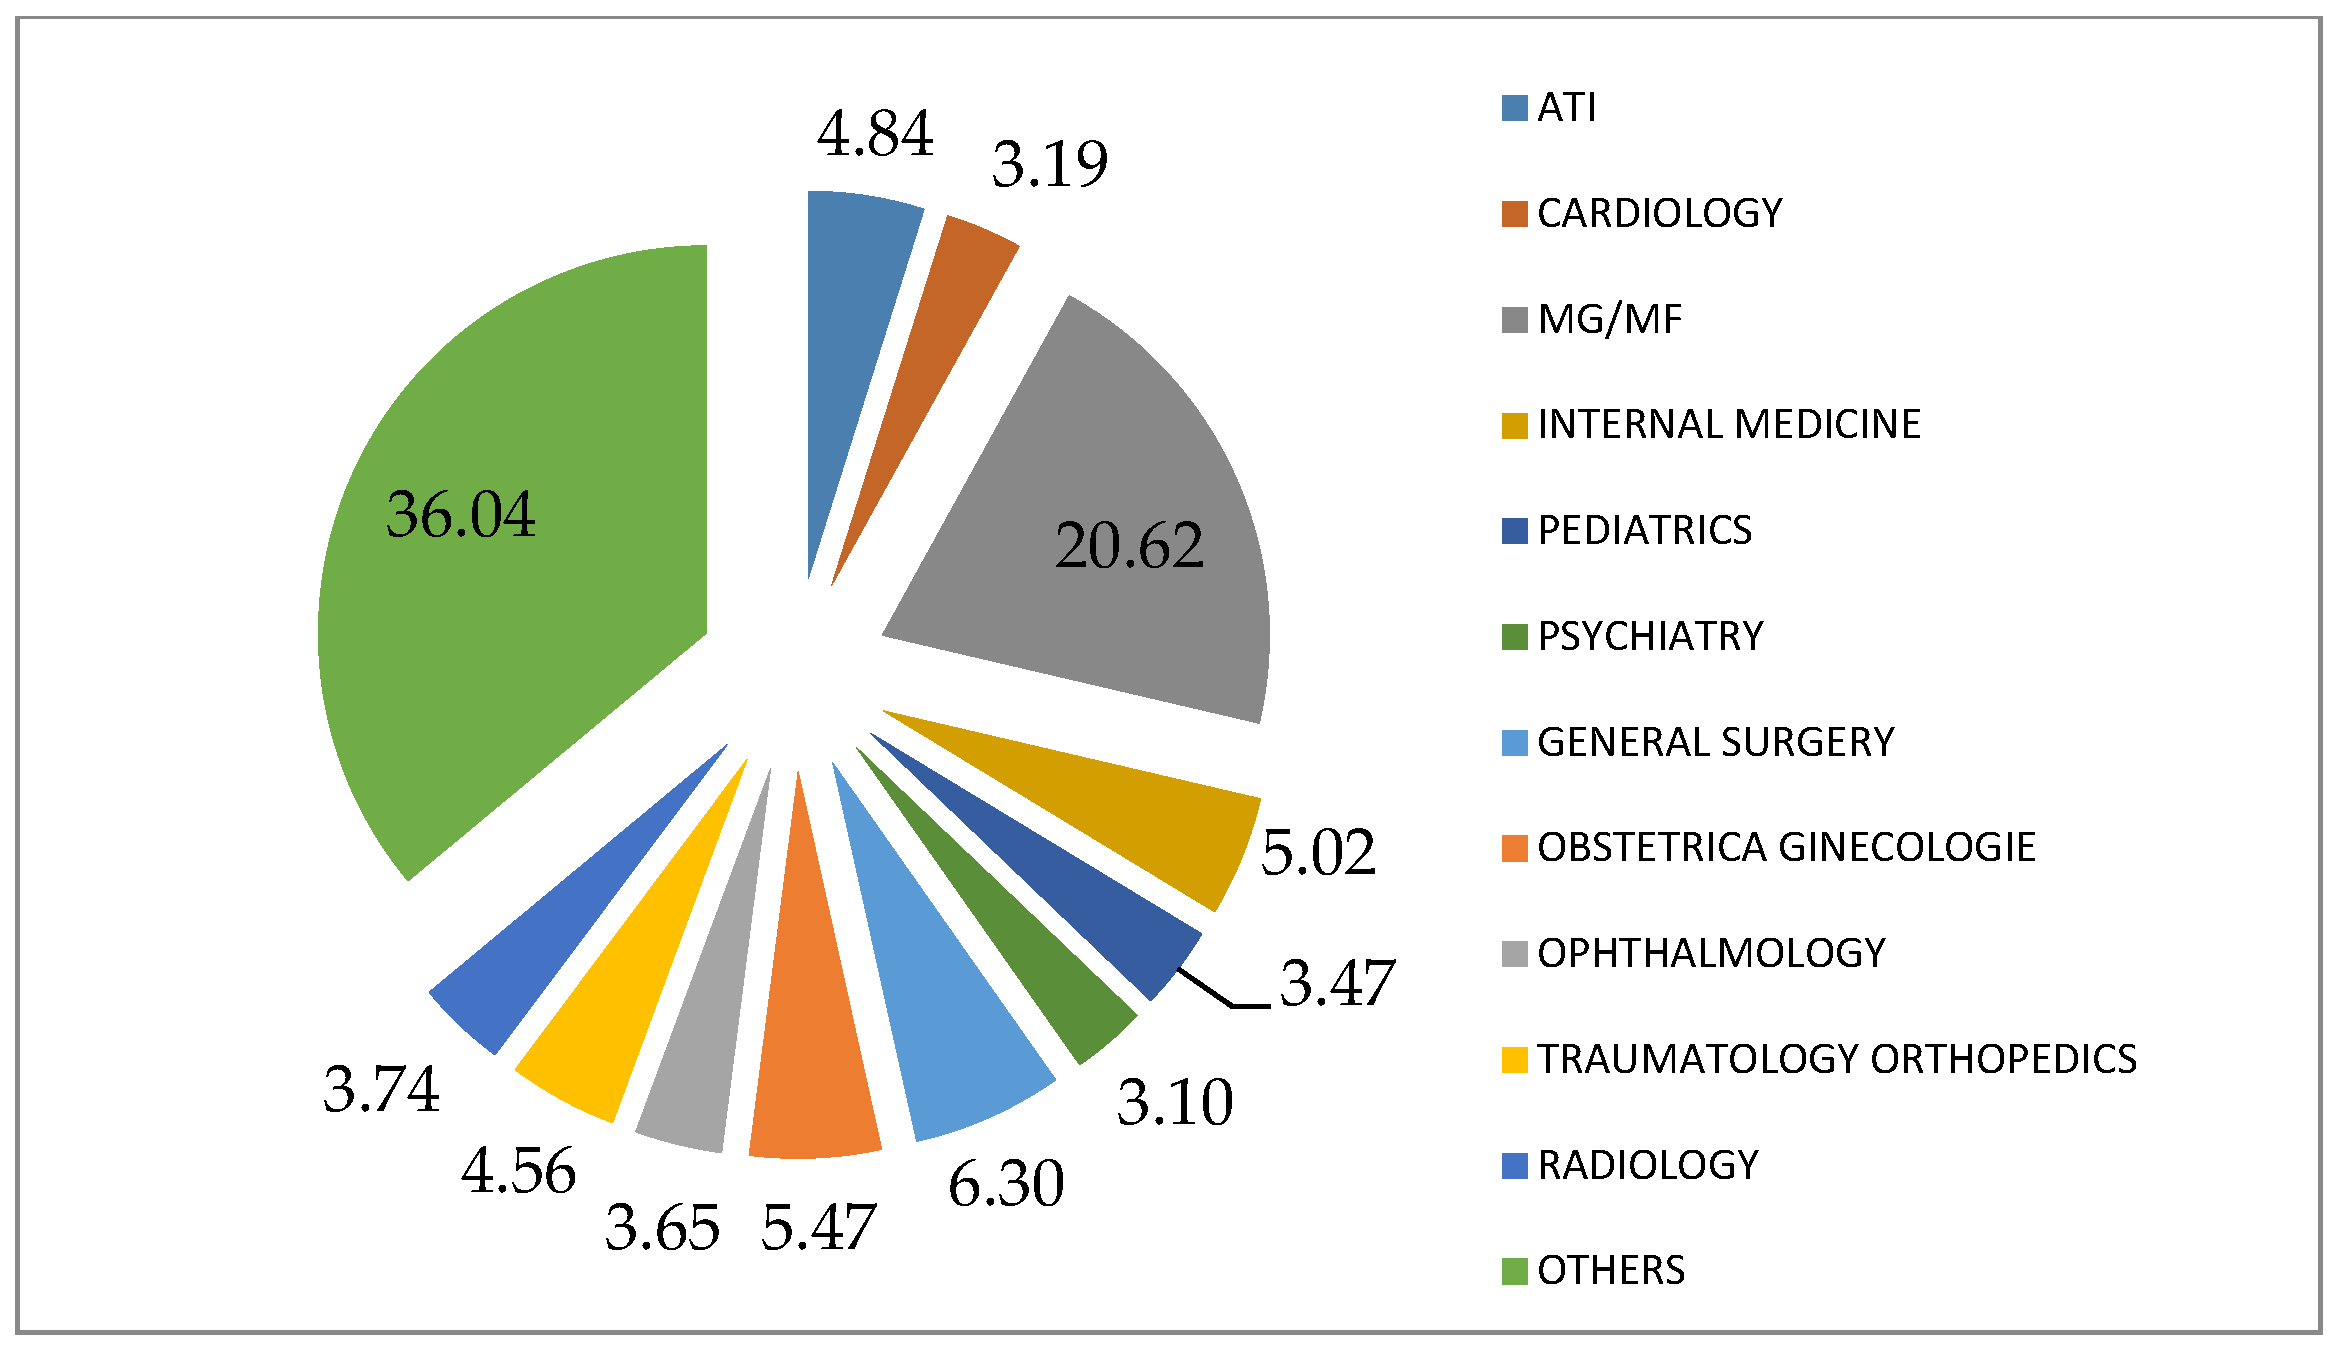
Referring to the specialization of physicians who consider migration, around one in five (20.62%) are specialized in family or general medicine, followed by pediatrics (6.30%) and obstetrics and gynecology (5.47%) (Figure 5).
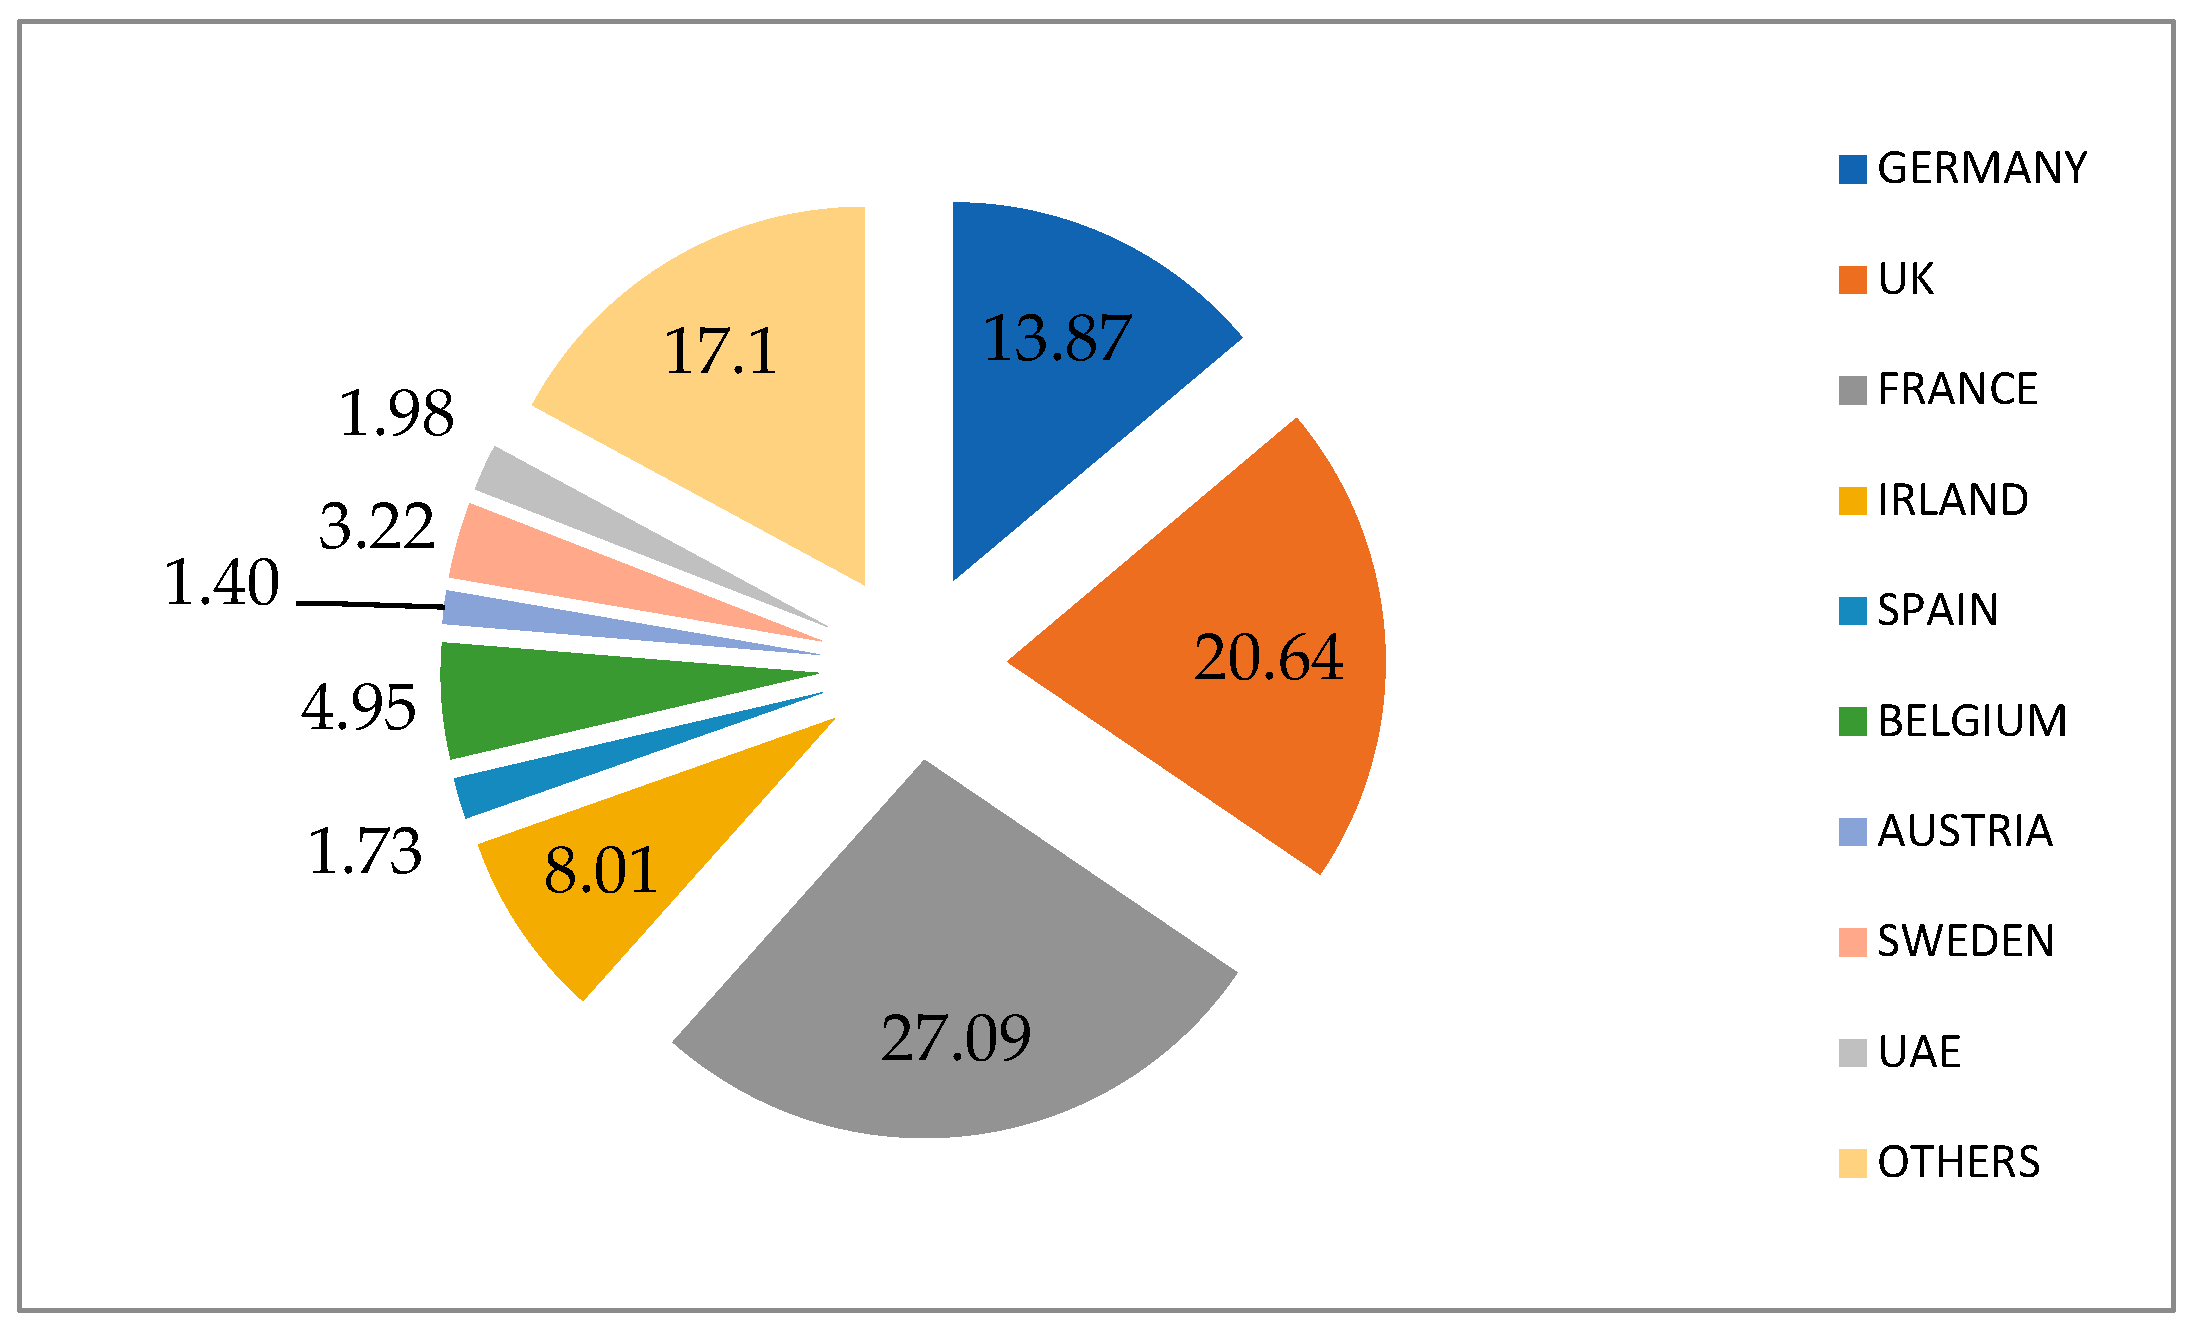
In terms of preferred country destinations, 27.09% of physicians considering to migrate would like to migrate to France, 20.64% to the UK, and 13.87% to Germany (Figure 6).
The share of physicians who migrate from Romania decreased from 4.14% in 2016 to 2.71% in 2018. These destination countries represent less than 1%. These figures, once again, highlight the shortage of physicians faced by Romania (Figure 7). The largest share of Romanian physicians in the total number of physicians in the destination country is in Ireland, followed by Luxembourg, France, and the UK.
The factors that influence the physicians’ migration, if observed from the country of origin, are push factors and, if observed from the country of destination, are pull factors. Referring to the county of origin, we considered the following potential push factors: average income, the number of emigrants, the number of beds, unemployment rate, and the number of late fetal deaths in 2016 and 2018, before and after salary increases.
Both in 2016 and 2018, the number of physicians who consider migration from Romania is directly correlated with average income, the number of emigrants, the number of beds, and the number of late fetal deaths, inversely correlated with unemployment rate (Table 1). Even if physicians’ wages increased in 2018, the gap between salaries in Romania and other countries is large. Moreover, the principal factor determining physicians to migrate from Romania remained the same: living standards and working conditions.
The existence of cross-sectional dependence was investigated using the following tests: Pesaran CD LM [46], Breusch–Pagan LM [45], and Pesaran scaled LM [43]. The results from these are presented in Table 2. The null hypothesis considering there is cross-sectional independence was rejected at the 5% significance level, revealing the existence of cross-sectional dependency among the cross-section units.
The existence of a unit root in the variables was investigated using the Pesaran panel unit root test [61], but the findings reveal no stationarity problems.
Using the panel analysis for 2016–2018, the influence of average income, the number of emigrants, the number of beds, the number of late fetal deaths, and unemployment rate is estimated on the number of Current Professional Certificates (CPCit) from a cross-sectional and longitudinal perspective, based on the model with fixed effects.
The sum of the squares of errors (SSE) is 19061.41 and the mean of the squares of errors (MSE) is 247.55, obtained by dividing the SSE by 77 (the number of degrees of freedom associated: 42 counties × 3 years—49 parameters of the model with fixed effects). Based on the coefficient of determination (R-square), it can be observed that the fixed effects model obtained explains 97.13% of the CPC variation defined by average income, the number of emigrants, the number of beds, the number of late fetal deaths, and unemployment rate (Table 3).
The study also tested the hypothesis of homogeneity.
The obtained results (Table 4) pertinently support the estimation of the CPC based on average income, the number of emigrants, the number of beds, the number of late fetal deaths, and unemployment rate, in the case of using models with fixed effects. Moreover, the variables have a constant influence over time on the number of Current Professional Certificates. Since, for the Romanian counties, the probability of having a calculated value of the test statistic F (Fisher) is higher than its theoretical value which is lower than the theoretical threshold of 0.0001, the null hypothesis of homogeneity is accepted. This attests that the CPC evaluation model is unique and representative for the Romanian counties.
The results obtained from the CPCit estimation using the fixed effects model are presented in Table 5. The values of the regression model estimates indicate that the variables, i.e., the number of beds, emigrants, unemployment rate, and income, have a significant influence on the number of Current Professional Certificates (for a probability of 10%). It is noted that the number of late fetal deaths does not have a significant influence on the number of Current Professional Certificates. Therefore, the regression equation is:
where ai represents the fixed effects determined by the individual size of the counties (differences between counties regarding the number of CPC) and dt represents the fixed effects determined by the temporal dimension (differences between years regarding the number of CPC for Romanian counties). In Table 4, CS represents the 41 transversal fixed effects ai, determined by the individual dimension of the county, and TS represents the two longitudinal fixed effects dt, determined by the temporal dimension.
CPCit = 380.91 + ai + dt + 0.036Bedsit − 0.027Emigrantsit − 6.588URit − 0.141Incomeit,
In order to ensure robustness of the estimated results, two widely used panel regression methods, fixed effects and random effects [62], use the Hausman test to choose an appropriate model. The probability is 0.0002; thus, we accept the alternative hypothesis, i.e., the model with fixed effects.
Since the use of the fixed effects model was validated, in the case of panel analysis, it is considered that the influence of the variables (beds, emigrants, unemployment rate, and income) on the number of CPCit is similar for all counties, regardless of the period (2016–2018).
Panel data regressions were used to verify the hypotheses, while fixed effects were considered [63]. The following assumptions were verified:
- Heteroskedasticity of residues (Wald test);
- Dependence of residues between the panels (Pesaran test);
- Autocorrelation of residues (LM test) [64].
For the obtained model, it is observed that, out of the 41 (=42 − 1) transversal-fixed effects, individual differences between the analyzed counties (ai), 28 are insignificant. This fact indicates a homogeneity of the counties from the individual (transversal) perspective: in all Romanian counties who register requests for Current Professional Certificates, physicians consider migrating to another country.
5. Critical Considerations Regarding the Impact of Public Policies on the External Migration of Medical Specialists in Romania
Since the 1990s, migration has become a crucial issue for Romania, following an increasing trend, similar to other former socialist countries. At the beginning, less qualified people migrated, working mainly in agriculture, construction, and services. However, after Romania’s accession to the EU, more qualified people migrated, and the brain drain phenomenon intensified. Among the specialists who migrated, the large share was represented by physicians, IT specialists, architects, and engineers. Migrants with secondary education or less temporarily left the origin country, with the intention to remit for several years and then return [65]. Instead, the specialists who mostly considered permanent migration cited the labor environment and career development as main reasons for external mobility.
The effect of public policies for health personnel is highlighted by the size and dynamics of the gap between necessary and existing. External migration of health personnel is a policy problem for origin countries and a policy solution for destination countries. Personnel allocations, in total and by specializations, depend on the profile of the country/area from the perspective of the degree of health and the predominant diseases. Although Romania is one of the EU countries with the largest shortage of physicians and nurses, physicians choose to migrate from Romania, leading to low efficiency of the health system, underlying a reduced capacity to face a health crisis. It is among the main providers of skilled labor for the health sector in developed countries in Europe and beyond which proves that the promoted public policies fail to mitigate the annual flows of experts who decide to work abroad.
To identify the impact of public policies on the migration of health experts, we assess the dynamics of the stockpile of staff working abroad and the significant public policy measures after 2017, including during the pandemic. These can be associated with the number of permits granted, conducted in detail in the previous section.
The annual flows of migrant doctors, with the relatively rapid permanence of jobs abroad, have accumulated significant stocks in more developed countries. Romania has some of the largest stocks of emigrated medical doctors in Europe over the last few decades, despite controlled migration flows between 2007 and 2014 (by quota by category of professions), as specializations in the medical field are annually requested by bilateral agreements. The motivation of the interest of developed countries to attract doctors from Romania is supported by a number of factors, namely the quality of initial education, individual work performance, specialization, and the permissible legal framework of professional permits to work abroad.
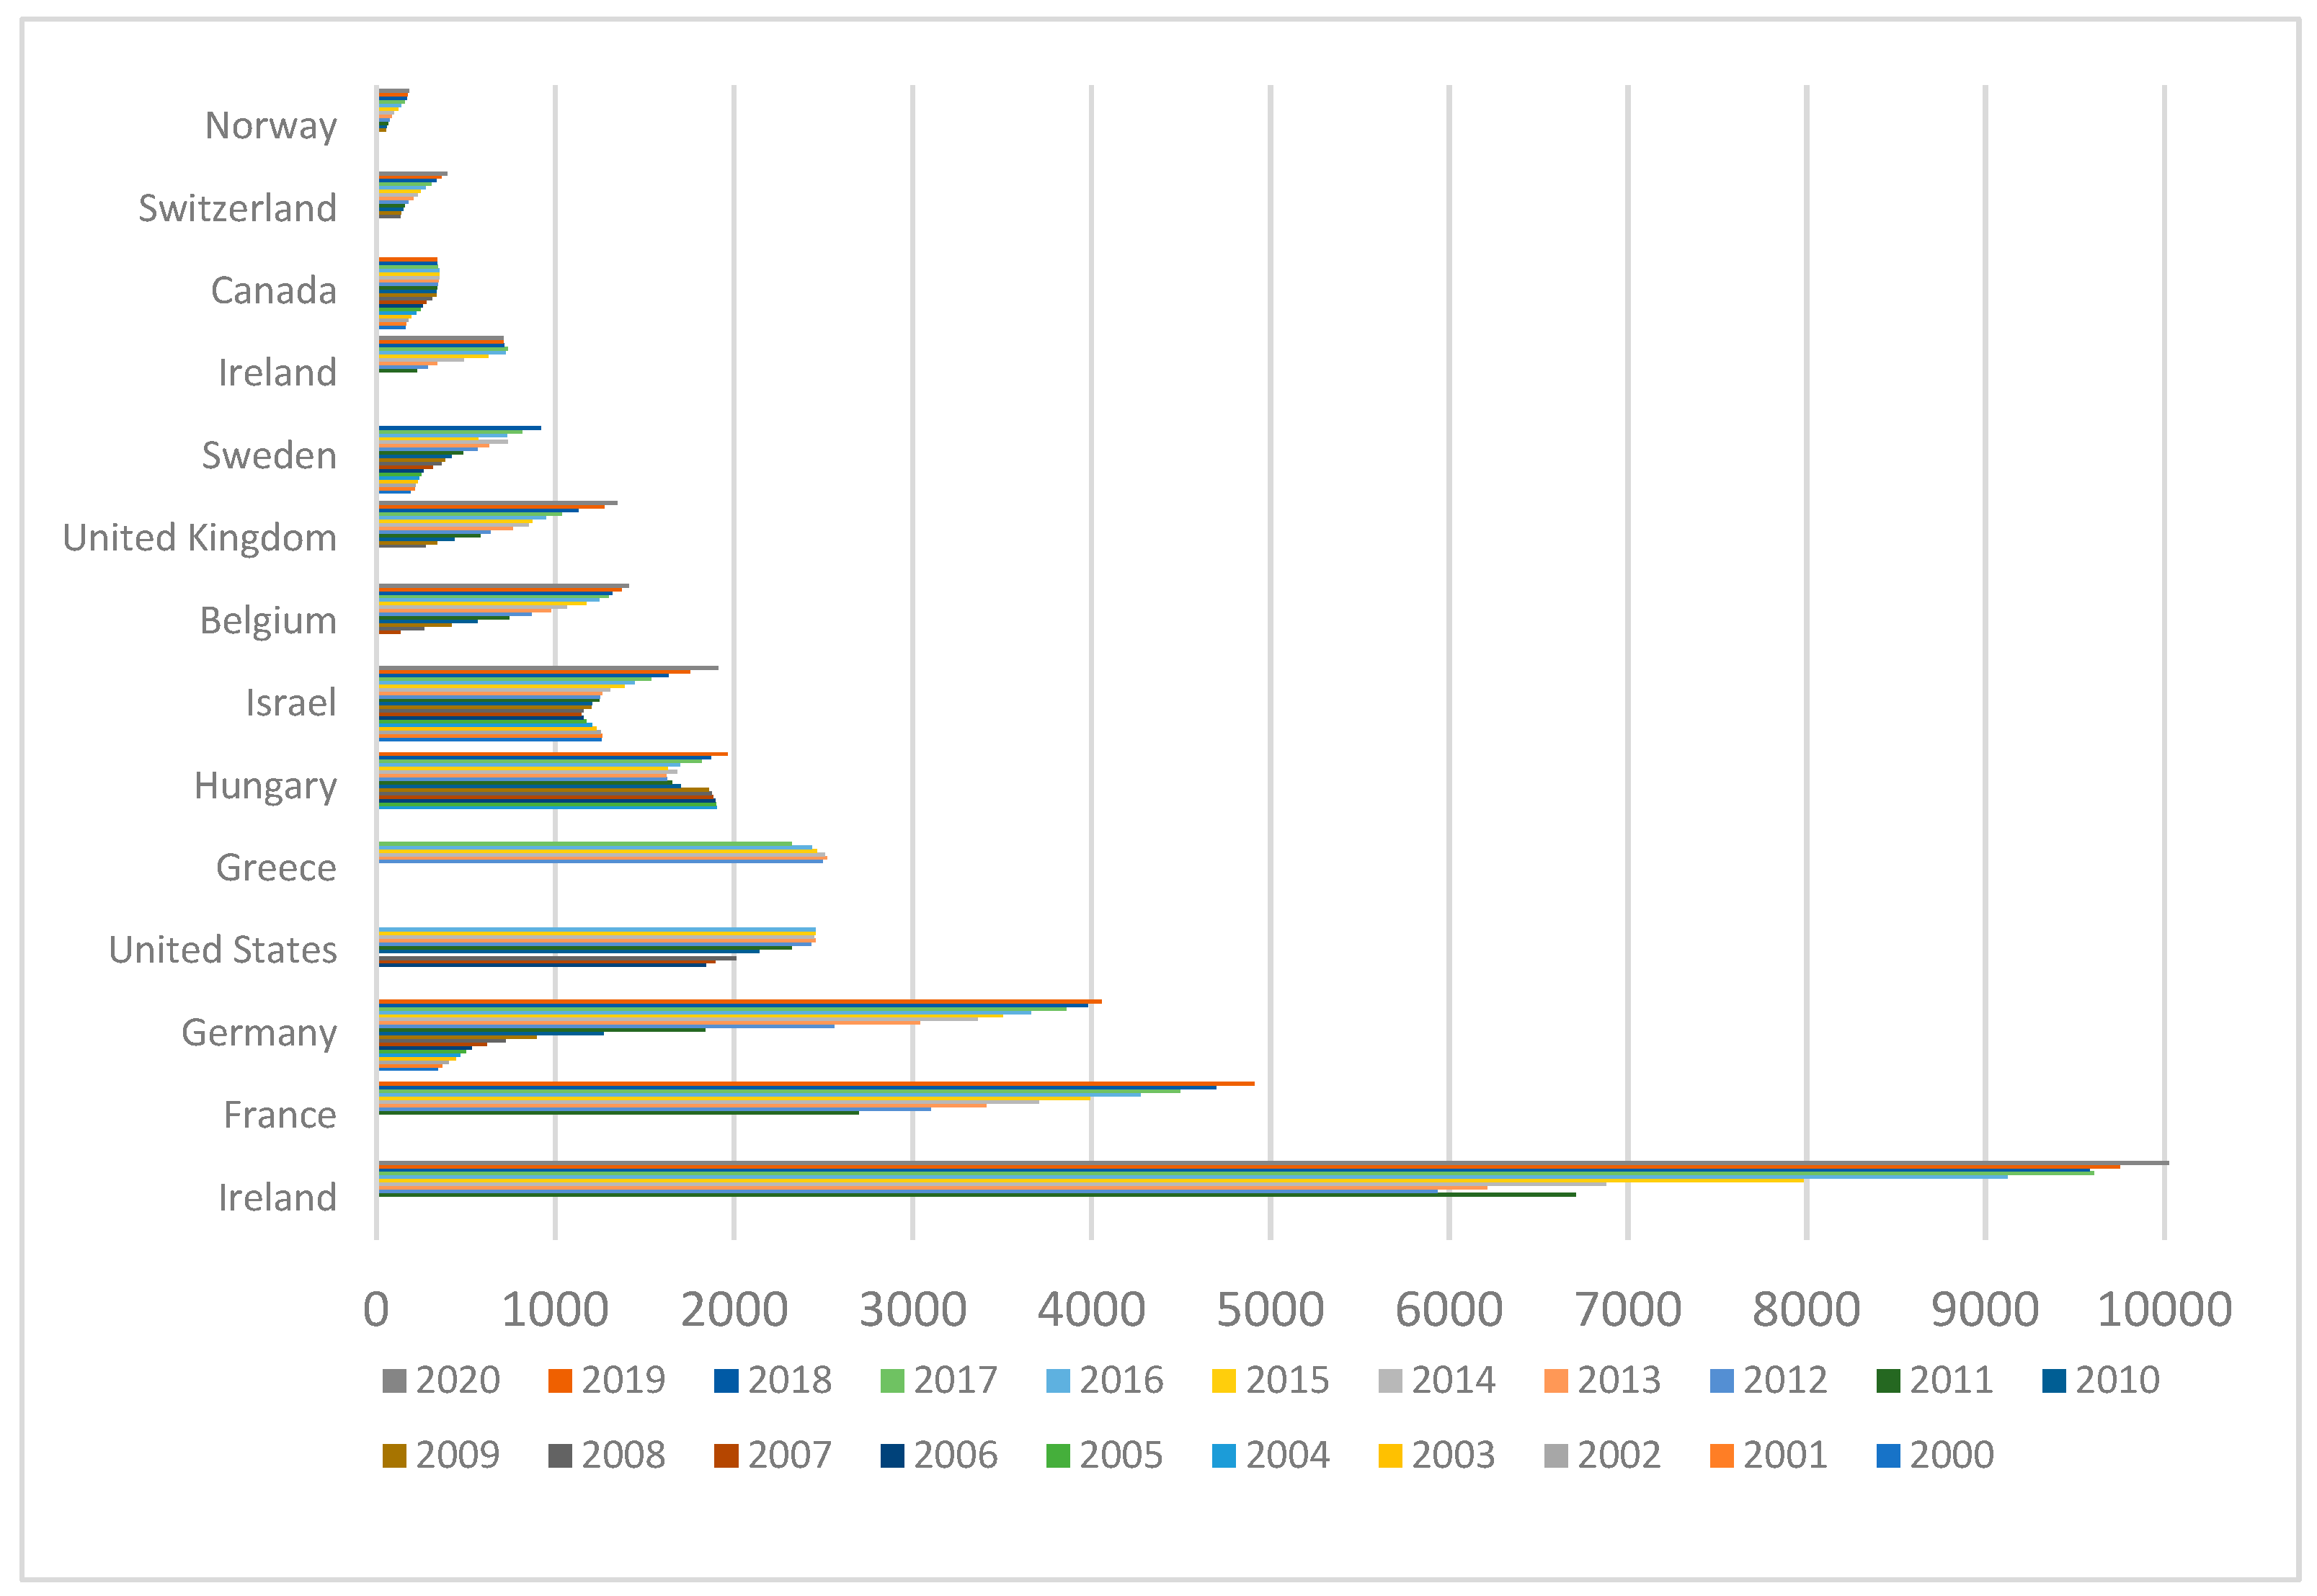
Romania is among the first countries to provide labor for the health sector in receiving OECD countries. In 2000, for example, 1260 doctors from Romania worked in Israel and 342 in Germany or 188 in Sweden and 163 in Canada, meaning that the flows intensified and diversified by country. In 2007, the year of Romania’s accession to EU, the number of Romanian doctors declared on the labor market was around 1900 in the USA and Hungary, over 1140 in Israel, and over 600 in Germany. The inflows increased yearly and the stock in 2017 was significantly higher, i.e., over 9600 in Ireland, around 4500 in France, around 3900 in Germany, over 1300 in Belgium, and over 1000 in UK (Figure 8).
The latest available OECD data [66] show that the highest annual flows were after 2009 in Romania when the salaries of all employees in public institutions, including doctors, decreased by 25% as a measure of austerity after the financial crisis of 2009.
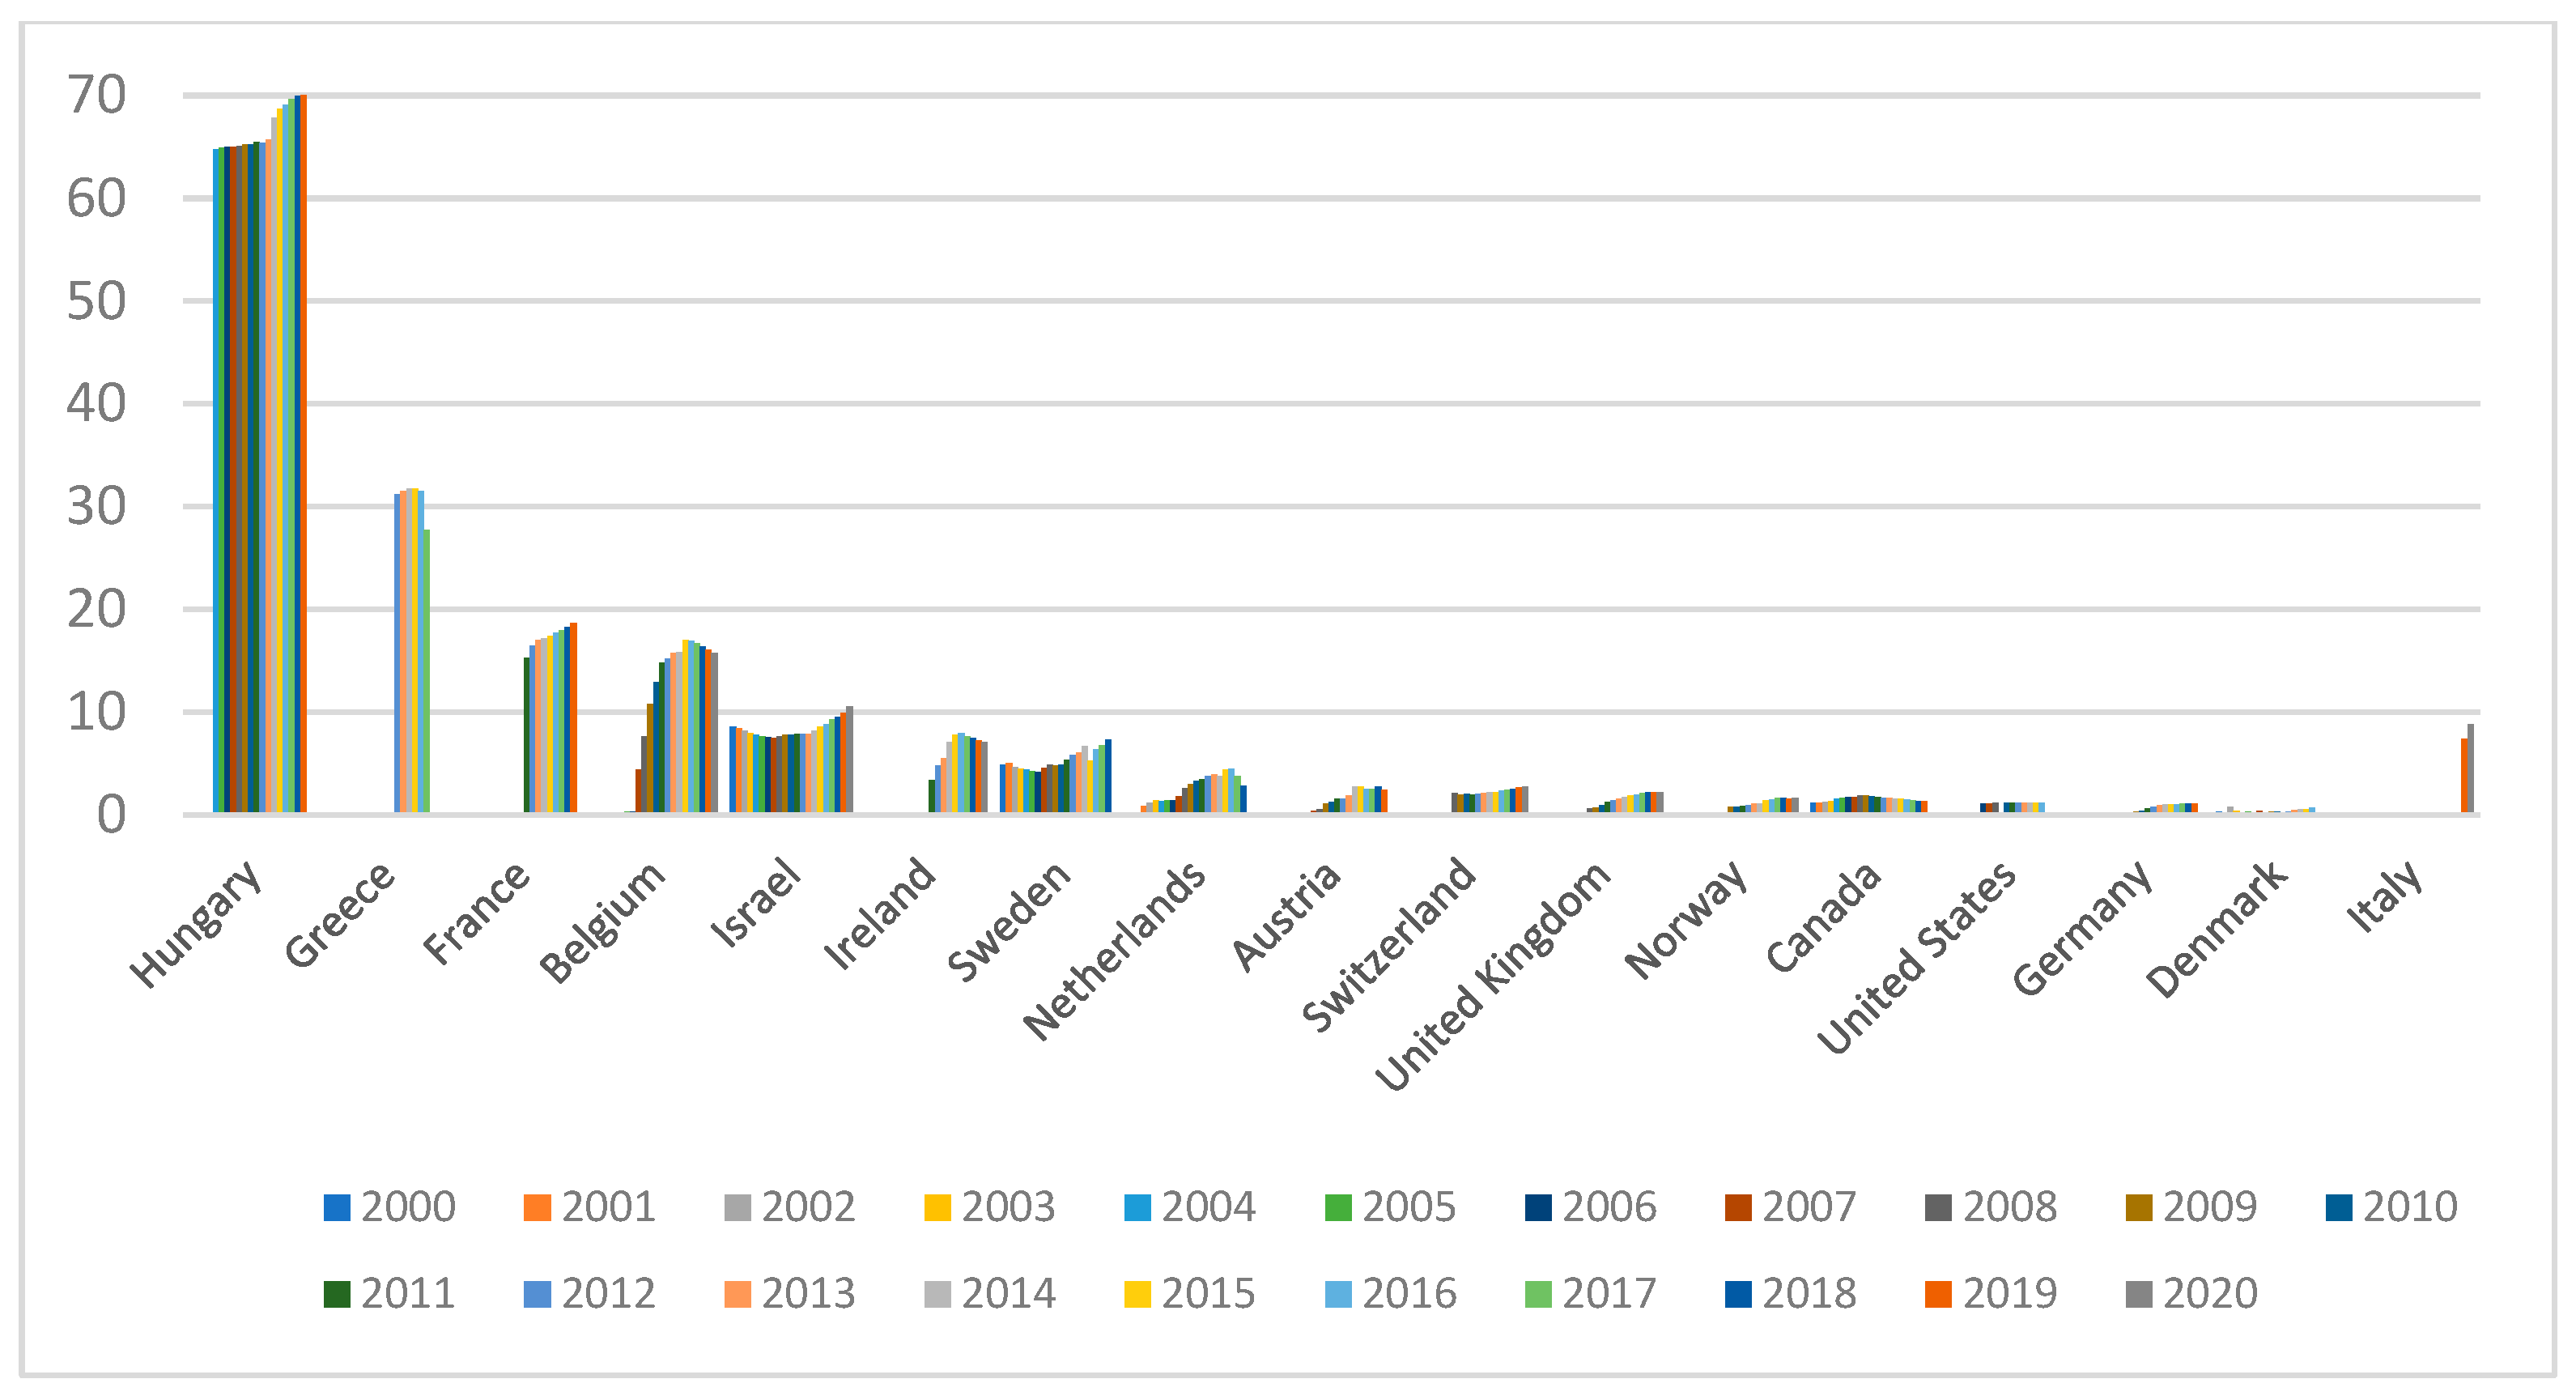
In Romania, the emigration rate was about one third of all home-trained and native-born doctors. Moreover, there are other European countries with substantial emigration rates of around 20% to 30% for home-trained doctors, such as Iceland, Ireland, the Slovak Republic, and Estonia. Higher emigration rates of doctors either born or trained in a country were between one third and one half for Malta and Albania from Europe, respectively, but the high rate is more specific for migration from Africa and Latin America [66] (OECD Health Statistics 2019, DIOC 2015/16 and LFS 2015/16 for numbers of foreign-trained and foreign-born doctors; OECD Health Statistics 2019 and WHO Global Health Observatory 2019 for number of doctors working in countries of origin. https://www.oecd.org/coronavirus/policy-responses/contribution-of-migrant-doctors-and-nurses-to-tackling-covid-19-crisis-in-oecd-countries-2f7bace2/#figure-d1e1894 (accessed on 18 October 2021)) (Figure 9).
The main cause of external labor migration was determined by the clearly superior comparative advantages offered by other states, but we must not omit the fact that the lack of adequate public policies of retention on the national labor market—through working conditions, professional career, and earnings—has largely discouraged the search for a job closer to individual expectations.
If we were to make a hierarchy of push factors, starting from the literature [67,68,69,70,71,72,73,74,75], but also based on the evolution of employment and flows of medical migrants in Romania [3,74,75,76,77], we find that the first places are held by unattractive employment opportunities, a lack of professional career development, a poor work environment, low wages, and inappropriate public policies relating to health sector performance.
We can, thus, appreciate that Romania’s health strategy and the employment policy of the medical staff did not have the capacity to reduce the definitive migration of doctors from the beginning of the transition to the market economy and/or from the first years after joining the EU space. The endowment with equipment at a level comparable to the endowments of hospitals in developed countries was not ensured, nor were policy measures promoted to increase the attractiveness of jobs from the perspective of professional practice and/or the comfort of decent incomes. The annual migration flows increase in the stocks of Romanian migrant doctors and the constant high demand for certificates are direct effects of the inefficiency of the national public policies, highlighting the need for reform, development, and modernization in the health sector.
In order to reduce the external flows of specialist doctors, in recent years, after 2017, a series of measures were promoted meant to improve the situation of doctors in Romania and to stimulate the quality and ethics in the health system.
- -
- The increase in salaries (Legal act no. 153/2017, regarding the salary of medical staff from public funds) by about 1/4, on average, with more accentuated increases for young people. Some categories also benefit from the doubling of salaries (i.e., for nurses, the increases were also 1.72 times; for resident doctors, depending on specializations, they were between 1.5 and 2.87 times; and for a primary doctors, they were more than 2.3 times the salary increases in 2018) [78].
- -
- Unlocking health jobs for temporary employment of staff, without competition, for the pandemic period (Legal act no. 55/2020, art. 11). Even in these conditions, the lack of associated measures, such as modernizing the infrastructure and/or reducing the shortage of medical staff, facilitated the continued external mobility of doctors, especially young people. Here, the advantages of working abroad were significantly higher in relation to salaries and salary packages which were 1.5–7 times higher than those in Romania [79]. A BestJob analysis shows that “the most sought-after medical specializations for which employers offer between 6000 and 10,000 euros are family medicine, gynecology, dermatology, gastroenterology, oncology, dentistry and surgery”, and among the countries actively seeking medical staff in Romania are France, Sweden, the Netherlands, and Belgium which have seen added hospital facilities, working conditions, and opportunities for specializations and professional careers. In relation to Romanian doctors, a recent analysis indicates that “three leave, one returns to the country”. Moreover, the measures to increase salaries, not being associated with other measures, have had a much lower impact than expected, so that “most choose to practice abroad... and are no longer pushed there by lack of money, but by non-existent facilities in hospitals” [11].
Therefore, the lack of articulated public policy measures to support modernization and performance in the health system will determine the continuation of the exodus of doctors from Romania. Furthermore, the net stocks of doctors working abroad will increase annually. Those who return, as a general rule, enter the private health sector, and are accessible to a small proportion of patients, due to the high tariffs compared to the average purchasing power of the population. There is, thus, an inadequate redistribution of health labor resources, with major adverse effects on the health of the population, access to services, and their quality. Thus, the public sector still has a high shortage of personnel, and the current pandemic crisis has highlighted the inefficiency of the medical service in the absence of adequacy and articulation of the allocation of human, financial, and organizational resources.
Moreover, during the pandemic, developed countries “have recognized migrant health workers as key assets and introduced policies to help their arrival and the recognition of their qualifications” [66], which means continuing the loss of doctors through external migration for work in more attractive jobs.
6. Conclusions
Brain drain is a phenomenon that mainly affects less developed or developing countries. An important component of brain drain is represented by physicians’ migration. According to the literature, the main factors influencing the migration of physicians are economic context, demographic factors, remuneration, political instability, and working conditions. The mobility of medical staff in recent years has reconfirmed the gap and led to inequality of forces between less developed and high-performing countries in attracting and retaining medical staff for their own health sector. Therefore, we analyzed the physicians’ migration from Romania for all the counties for the period 2016–2018. The variables used were economic and social indicators (the number of beds, the number of late fetal deaths, unemployment rate, average income, and the number of emigrants), as well as the number of Current Professional Certificates. Current Professional Certificates are documents issued by Romanian College of Physicians to certify the quality of physician abroad. Therefore, we considered that the number of physicians who consider migration is reflected by the number of Current Professional Certificates.
The results indicated that physicians who want to migrate are not evenly distributed, there are areas where this phenomenon is more pronounced. The most certificates were issued in Iasi, Bucharest, Cluj, and Timis, indicating the bigger number of physicians who want to migrate. These counties hold the biggest university centers in the country, according to studies, and migrant physicians are very well trained and graduated from the best schools, as confirmed in the case of Romania.
As a favorite destination for migration, Romanian physicians choose to migrate to Germany, France, and the UK. These three countries invest a lot in the health sector, thus registering high salaries and good working conditions. Another factor of attraction to these three destinations for Romanian physicians is the knowledge of official languages, as Romanian schools teach French, English, and German. In addition, there are medical schools with English and French programs, and their graduates can migrate to destinations where these languages are spoken.
Regarding specializations, most physicians are specialized in general or family medicine (20.62%), pediatrics (6.30), and obstetrics and gynecology (5.47%). For Romania, the physicians’ migration represents a great loss reflected in the efficiency of the health system and the population health, for the share of Romanian physicians in the destination countries is below 1% and the highest percentage is registered in Ireland.
The number of Current Professional Certificates is correlated with the analyzed variable and shows a direct relationship with average income, the number of emigrants, the number of beds, and late fetal deaths, as well as an inverse relationship with unemployment rates.
Using panel analysis between 2016 and 2018, the influence of the variables average income, number of emigrants, number of beds, number of late fetal deaths and unemployment rate on the number of Current Professional Certificates was estimated using the model with fixed effects. The results indicated an estimation of Current Professional Certificates (based on average income, the number of emigrants, the number of beds, the number of late fetal deaths, and unemployment rates) is relevant in the case of fixed effects models. Moreover, the variables have a constant influence over time regarding the number of Current Professional Certificates. The variables, including beds, emigrants, unemployment rates, and income, have a significant influence on the number of Current Professional Certificates, and the number of late fetal deaths does not have a significant influence on the number of Current Professional Certificates.
The results support a pertinent estimation of the CPC based on average income, the number of emigrants, the number of beds, the number of late fetal deaths, and unemployment rates using the models with fixed effects. The hypothesis of homogeneity is accepted, attesting the fact that the Current Professional Certificates evaluation model is unique for the counties from Romania.
Therefore, the number of requests for Current Professional Certificates is influenced by the number of beds in hospitals, the number of emigrants, unemployment rates, and income. Unemployment rates and income reflect the standard of living, the number of beds reflects working conditions, and the number of emigrants reflects the ethnic and social affiliation of the Romanian physician. Romanian physicians will decide to migrate where other Romanians are, establishing links with the country of origin.
A consequence of physicians migrating is the low efficiency of the health system, especially given that Romania occupies the penultimate place in the European Union regarding the number of physicians per inhabitants. As the health system efficiency is low, Romania may register low resistance or vulnerability in the case of health crisis. The results identify Romania as a vulnerable country with a low resistance to a health crisis, making it necessary to take measures to reduce the physicians’ migration, thus increasing the efficiency of the health system and resilience and resistance to health crises.
Both the policies of attracting young graduates through incomes and those associated with managing medical crisis situations, such as the pandemic (short-term employment), have failed to stop the loss of qualified human capital from health, from less developed countries. The case study for Romania highlighted the poor efficiency of specific, one-off policy measures and the need for an articulated vision to reform the health sector, supported by public policies, based on a mix of measures to meet the multidimensional requirements of service quality in health. The structure of a country’s health sector largely depends on the “inventory and incidence of predominant diseases in the analyzed geographical area” and the vision of developing specializations, depending on the future needs of the population. The reallocation of medical personnel on specializations required by the national health sector cannot be achieved only through episodic and punctual measures. An integrated vision is needed, based on a national strategy focused on increasing the performance of the health sector, through a new conceptual approach. The pillars of public policy follow the logic of society’s development, i.e., prevention and intervention, through medical education for all and correct information of patients, increasing the average state of health at a national level through health inclusion, quality medical services through technology, as well as competent staff and working conditions. It also implies a permanent correlation between the demand of the health labor market and the supply of the education system, as well as the initial and continuous training of personnel in the health sector.
The migration of health specialists will continue; the migration routes will follow the locations where the professional performance is facilitated or where the comparative advantages of employment prevail. Public policies in less developed countries, without being flexible and focused on the specific area of the need for health services, will not be able to perform. A major constraint in the less developed countries from the perspective of access to health is the level of economic development as well as the purchasing power of patients, which is why public policies still have the role of ensuring the balance between needs and resources. If we only analyzed the redistribution of medical staff and the factors that determine the external mobility of doctors in this article, we intend to continue research with the aim of funding sources in the health sector, in relation to the role of public vs. private policies and increasing accessibility and quality of medical services.
Author Contributions
Conceptualization, S.A.A., V.V., E.M. and E.B.; methodology, S.A.A., V.V., E.M. and E.B.; software, S.A.A., V.V., E.M. and E.B.; formal analysis, S.A.A., V.V., E.M. and E.B.; investigation, S.A.A., V.V., E.M. and E.B.; data curation, S.A.A., V.V., E.M. and E.B.; writing—original draft preparation, S.A.A., V.V., E.M. and E.B.—review and editing, S.A.A., V.V., E.M. and E.B.; visualization, S.A.A., V.V., E.M. and E.B.; supervision, S.A.A., V.V., E.M. and E.B.; project administration, S.A.A., V.V., E.M. and E.B.; funding acquisition, S.A.A., V.V., E.M. and E.B. All authors have read and agreed to the published version of the manuscript.
Funding
This research received no external funding.
Informed Consent Statement
Not applicable.
Conflicts of Interest
The authors declare no conflict of interest.
References
- Boboc, C.; Vasile, V.; Ghiţă, S. Migration of physicians: Causes and effects in CEE countries. In International Conference on Advances in Education and Management; Springer: Berlin/Heidelberg, Germany, 2011; pp. 514–520. [Google Scholar]
- Ahmad, O.B. Managing medical migration from poor countries. BMJ 2005, 331, 43–45. [Google Scholar] [CrossRef] [PubMed] [Green Version]
- Botezat, A.; Moraru, A. Brain drain from Romania: What do we know so far about the Romanian medical diaspora? East. J. Eur. Stud. 2020, 11, 309–334. [Google Scholar]
- Goštautaitė, B.; Bučiūnienė, I.; Milašauskienė, Z.; Bareikis, K.; Bertašiūtė, E.; Mikelionienė, G. Migration intentions of Lithuanian physicians, nurses, residents and medical students. Health Policy 2018, 122, 1126–1131. [Google Scholar] [CrossRef]
- Schumann, M.; Maaz, A.; Peters, H. Doctors on the move: A qualitative study on the driving factors in a group of Egyptian physicians migrating to Germany. Glob. Health 2019, 5, 2. [Google Scholar] [CrossRef] [PubMed]
- Garcia-Perez, M.A.; Amaya, C.; Otero, A. Physicians’ migration in Europe: An overview of the current situation. BMC Health Serv. Res. 2007, 7, 201. [Google Scholar] [CrossRef] [Green Version]
- Boboc, C.; Titan, E. Migration of Medical Doctors, Health, Medical Education, and Employment in Eastern and Central Europe, in Driouchi. In A Labor and Health Economics in the Mediterranean Region: Migration and Mobility of Medical Doctors; Advances in Finance Accounting and Economics; IGI Global: Hershey, PA, USA, 2014; pp. 158–191. [Google Scholar]
- Jourdain, A.; Pham, T. Mobility of physicians in Europe: Health policies and health care provision. Sante Publique 2017, 29, 81–87. [Google Scholar] [CrossRef]
- Ibrahim, H.; Al Sharif, F.Z.; Satish, K.P.; Hassen, L.; Nair, S.C. Should I stay or should I go now? The impact of “pull” factors on physician decisions to remain in a destination country. Int. J. Health Plan. Manag. 2019, 34, 1909–1920. [Google Scholar] [CrossRef]
- Sechet, R.; Vasilcu, D. Physicians’ migration from Romania to France: A brain drain into Europe? Cybergeo-Eur. J. Geogr. 2015, 743. [Google Scholar] [CrossRef]
- OCDE 2020. Contribution of Migrant Doctors and Nurses to Tackling COVID-19 Crisis in OECD Countries. Available online: https://0-read-oecd--ilibrary-org.brum.beds.ac.uk/view/?ref=132_132856-kmg6jh3kvd&title=Contribution-of-migrant-doctors-and-nurses-to-tackling-COVID-19-crisis-in-OECD-countries&_ga=2.244147525.1102133281.1634596682-1334905185.1620494752 (accessed on 15 July 2021).
- Dublin, T.D. The Migration of Physicians to the United States. N. Engl. J. Med. 1972, 286, 870–877. [Google Scholar] [CrossRef]
- Benham, L.M.; Reder, M.W. Migration, Location and Remuneration of Medical Personnel: Physicians and Dentists. Rev. Econ. Stat. 1968, 50, 332–347. [Google Scholar] [CrossRef]
- Mejia, A. Migration of Physicians and Nurses: A World Wide Picture. Int. J. Epidemiol. 1978, 7, 207–215. [Google Scholar] [CrossRef] [PubMed] [Green Version]
- Hagopian, A.; Thompson, M.J.; Fordyce, M. The migration of physicians from sub-Saharan Africa to the United States of America: Measures of the African brain drain. Hum. Resour. Health 2004, 2, 17. [Google Scholar] [CrossRef] [PubMed] [Green Version]
- Akl, E.A.; Maroun, N.; Major, S.; Chahoud, B.; Schunemann, H.J. Graduates of Lebanese medical schools in the United States: An observational study of international migration of physicians. BMC Health Serv. Res. 2007, 7, 49. [Google Scholar] [CrossRef] [PubMed] [Green Version]
- Hussey, P. International migration patterns of physicians to the United States: A cross-national panel analysis. Health Policy 2007, 84, 298–307. [Google Scholar] [CrossRef]
- Ronaghy, H.A.; Zeighami, E.; Farahmand, N.; Zeighami, B. Causes of physician migration: Responses of Iranian physicians in the United States. J. Med. Educ. 1976, 51, 305–310. [Google Scholar] [CrossRef]
- Astor, A.; Akhtar, T.; Matallana, M.A.; Muthuswamy, V.; Olowu, F.A.; Tallo, R.K. Physician migration: Views from professionals in Colombia, Nigeria, India, Pakistan and the Philippines. Soc. Sci. Med. 2005, 61, 2492–2500. [Google Scholar] [CrossRef] [PubMed]
- Hnilicová, H.; Vavrecková, J.; Dobiásová, K. Migration trends of Czech physicians. J. Czech Physicians 2008, 147, 49–54. [Google Scholar]
- Vanasse, A.; Scott, S.; Courteau, J.; Orzanco, M.G. Canadian family physicians’ intentions to migrate. Can. Fam. Physician 2009, 55, 396–397. [Google Scholar] [PubMed]
- Ramboarison-Lalao, L.; Ariss, A.A.; Barth, I. Careers of skilled migrants: Understanding the experiences of Malagasy physicians in France. J. Manag. Dev. 2012, 31, 116–129. [Google Scholar] [CrossRef]
- Ricketts, T.C. The Migration of Physicians and the Local Supply of Practitioners A Five-Year Comparison. Acad. Med. 2013, 88, 1913–1918. [Google Scholar]
- Hossain, N.; Shah, N.; Shah, T.; Lateef, S.B. Physicians’ Migration: Perceptions of Pakistani Medical Students. J. Coll. Physicians Surg. Pak. 2016, 26, 696–701. [Google Scholar] [PubMed]
- Saghin, D.; Lucheș, D.; Marici, M. The Influence of Personal and Professional Variables Upon the Nature of Immigration of Romanian Doctors to France: The Moderating Effect of Gender. Transylv. Rev. Adm. Sci. 2016, 12, 132–149. [Google Scholar]
- Shuval, J.T. The Reconstruction of Professional Identity Among Immigrant Physicians in Three Societies. J. Immigr. Health 2000, 2, 191–202. [Google Scholar] [CrossRef] [PubMed]
- Basu, K.; Rajbhandary, S. Interprovincial migration of physicians in Canada: What are the determinants? Health Policy 2006, 76, 186–193. [Google Scholar] [CrossRef]
- Vanasse, A.; Ricketts, T.C.; Courteau, J.; Orzanco, M.; Randolph, R.; Asghari, S. Long term regional migration patterns of physicians over the course of their active practice careers. Rural Remote Health 2007, 7, 812. [Google Scholar] [CrossRef]
- Kronfol, N.M.; Sibai, A.M.; Rafeh, N. The Impact of Civil Disturbances on the Migration of Physicians: The Case of Lebanon. Med. Care 1992, 30, 208–215. [Google Scholar] [CrossRef]
- Yaffee, R. A Primer for Panel Data Analysis. Connect: Information Technology at NYU, 2003, 8, 1–11. Available online: https://citeseerx.ist.psu.edu/viewdoc/download?doi=10.1.1.595.1905&rep=rep1&type=pdf (accessed on 12 July 2021).
- Astuti, A.M.; Zain, I.; Purnomo, J.D.T. A Review of Panel Data on Spatial Econometrics Models. In Journal of Physics: Conference Series; IOP Publishing: Bristol, UK, 2020; Volume 1490, p. 012032. [Google Scholar]
- Jaba, E.; Robu, I.B.; Balan, C.B.; Robu, M.A. The Panel Data Analysis of Fraud Risk. Financ. Audit. 2013, 5, 25–36. [Google Scholar]
- Baltagi, B. Econometric Analysis of Panel Data, 3rd ed.; JohnWiley & Sons: Chichester, UK, 2005. [Google Scholar]
- Vijayakumar, N.; Sridharan, P.; Rao, K.C.S. Determinants of FDI in BRICS Countries: A panel analysis. Int. J. Bus. Sci. Appl. Manag. (IJBSAM) 2010, 5, 1–13. [Google Scholar]
- Zulfikar, R.; STp, M.M. Estimation Model and Selection Method of Panel Data Regression: An Overview of Common Effect, Fixed Effect, and Random Effect Model. 2019. Available online: https://0-doi-org.brum.beds.ac.uk/10.31227/osf.io/9qe2b (accessed on 12 July 2021).
- Mundalk, Y. On the pooling of time series and cross-section data. Econometrica 1978, 46, 69–85. [Google Scholar] [CrossRef]
- Hausman, J.A.; Taylor, W.E. Panel data and unobservable individual effects. Econometrica 1981, 49, 1377–1398. [Google Scholar] [CrossRef] [Green Version]
- Hausman, J.A. Specification tests in econometrics. Econometrica 1978, 46, 1251–1271. [Google Scholar] [CrossRef] [Green Version]
- De Hoyos, R.E.; Sarafidis, V. Testing for cross-sectional dependence in panel-data models. Stata J. 2006, 6, 482–496. [Google Scholar] [CrossRef] [Green Version]
- Driscoll, J.C.; Kraay, A.C. Consistent covariance matrix estimation with spatially dependent panel data. Rev. Econ. Stat. 1998, 80, 549–560. [Google Scholar] [CrossRef]
- Robertson, D.; Symons, J. Factor Residuals in SUR Regressions: Estimating Panels Allowing for Cross Sectional Correlation (No. 473); Centre for Economic Performance, London School of Economics and Political Science: London, UK, 2000. [Google Scholar]
- Coakley, J.; Fuertes, A.M.; Smith, R. A Principal Components Approach to Cross-Section Dependence in Panels. 2002. Available online: https://citeseerx.ist.psu.edu/viewdoc/citations;jsessionid=EC7C65254C122B48E8ACCEBB82A70843?doi=10.1.1.196.546 (accessed on 12 July 2021).
- Pesaran, M.H. General diagnostic tests for cross-sectional dependence in panels. Empir. Econ. 2021, 60, 13–50. [Google Scholar] [CrossRef]
- Phillips, P.C.; Sul, D. Dynamic panel estimation and homogeneity testing under cross section dependence. Econom. J. 2003, 6, 217–259. [Google Scholar] [CrossRef] [Green Version]
- Breusch, T.S.; Pagan, A.R. The Lagrange multiplier test and its applications to model specification in econometrics. Rev. Econ. Stud. 1980, 47, 239–253. [Google Scholar] [CrossRef]
- Pesaran, M.H. Estimation and Inference in Large Heterogenous Panels with Cross Section Dependence, SSRN 385123. 2003. Available online: https://ssrn.com/abstract=385123 (accessed on 10 July 2021).
- Friedman, M. The use of ranks to avoid the assumption of normality implicit in the analysis of variance. J. Am. Stat. Assoc. 1937, 32, 675–701. [Google Scholar] [CrossRef]
- Frees, E.W. Assessing cross-sectional correlation in panel data. J. Econom. 1995, 69, 393–414. [Google Scholar] [CrossRef]
- Perales, F. Modeling the consequences of the transition to parenthood: Applications of panel regression methods. J. Soc. Pers. Relatsh. 2019, 36, 4005–4026. [Google Scholar] [CrossRef]
- Wooldridge, J.M. Econometric Analysis of Cross Section and Panel Data; MIT Press: Cambridge, MA, USA, 2002. [Google Scholar]
- Greene, W.H. Econometric Analysis, 5th ed.; Prentice Hall: Upper Saddle River, NJ, USA, 2003. [Google Scholar]
- Headey, D.D. Developmental drivers of nutritional change: A cross-country analysis. World Dev. 2003, 42, 76–88. [Google Scholar] [CrossRef]
- Wilks, D.S. Statistical Methods in the Atmospheric Sciences. Volume 100 (International Geophysics), 3rd ed.; Academic Press: Cambridge, MA, USA, 2011. [Google Scholar]
- Boccard, J.; Rudaz, S. Proteomic and Metabolomic Approaches to Biomarker Discovery; Academic Press: Cambridge, MA, USA, 2013. [Google Scholar]
- Milligan, G.W.; Cooper, M.C. Methodology Review: Clustering Applied. Appl. Psychol. Meas. 1987, 11, 329–354. [Google Scholar] [CrossRef] [Green Version]
- Sokal, R.R.; Michener, C.C. A statistical method for evaluating systematic relationships. Univ. Kans. Sci. Bull. 1985, 38, 1409–1438. [Google Scholar]
- Eisen, M.B.; Spellman, P.T.; Brown, P.O.; Botstein, D. Cluster analysis and display of genome-wide expression patterns. Proc. Natl. Acad. Sci. USA 1998, 95, 14863–14868. [Google Scholar] [CrossRef] [Green Version]
- Steinbach, M.L.; Ertoz, V.K. Challenges of clustering in high dimensional data. In New Directions Statistical Physics; Springer: Berlin/Heidelberg, Germany, 2014; pp. 273–309. [Google Scholar]
- Almeida, J.; Barbosa, L.M.S.; Pais, A.; Formosinho, S. Improving hierarchical cluster analysis: A new method with outlier detection and automatic clustering. Chemom. Intell. Lab. Syst. 2007, 87, 208–217. [Google Scholar] [CrossRef] [Green Version]
- Nguyen, T.A.D.; Jones, Z.R.; Leto, D.F.; Wu, G.; Scott, S.L.; Hayton, T.W. Ligand-exchange-induced growth of an atomically precise Cu29 nanocluster from a smaller cluster. Chem. Mater. 2016, 28, 8385–8390. [Google Scholar] [CrossRef] [Green Version]
- Quazi, R.M. Foreign direct investment in Latin America: A panel regression study. Int. J. Bus. Financ. Res. 2007, 1, 59–67. [Google Scholar]
- Pesaran, M.H. On the interpretation of panel unit root tests. Econ. Lett. 2012, 116, 545–546. [Google Scholar] [CrossRef]
- De Wachter, S.; Harris, R.D.; Tzavalis, E. Panel data unit roots tests: The role of serial correlation and the time dimension. J. Stat. Plan. Inference 2007, 137, 230–244. [Google Scholar] [CrossRef] [Green Version]
- Mura, L.; Marchevska, M.; Dubravska, M. Slovak retail business across panel regression model. Mapкeтинг I Мeнeджмeнт Iннoвaцiй 2018, 4, 203–211. [Google Scholar] [CrossRef]
- Bunduchi, R.; Tursunbayeva, A.; Pagliari, C. Coping with institutional complexity: Intersecting logics and dissonant visions in a nation-wide healthcare IT implementation project. Inf. Technol. People 2019, 33, 311–339. [Google Scholar] [CrossRef]
- OECD.stat. Health Workforce Migration. Available online: https://stats.oecd.org/Index.aspx?QueryId=68336# (accessed on 18 October 2021).
- Mullan, F. The metrics of the physician brain drain. N. Engl. J. Med. 2005, 353, 1810–1818. [Google Scholar] [CrossRef] [PubMed] [Green Version]
- Carr, S.C.; Inkson, K.; Thorn, K. From global careers to talent flow: Reinterpreting ‘brain drain. J. World Bus. 2005, 40, 386–398. [Google Scholar] [CrossRef]
- Nullis-Kapp, C. Efforts under way to stem ‘brain drain’ of doctors and nurses. Bull. World Health Organ. 2005, 83, 84–85. [Google Scholar] [PubMed]
- Grignon, M.; Owusu, Y.; Sweetman, A. The international migration of health professionals. In International Handbook on the Economics of Migration; Edward Elgar Publishing: Cheltenham, UK, 2013; pp. 75–97. [Google Scholar]
- Manisha, N.M.; Webster, P. Health professionals’ migration in emerging market economies: Patterns, causes and possible solutions. J. Public Health 2013, 35, 157–163. [Google Scholar]
- Kniess, J. Health, migration and human rights. Crit. Rev. Int. Soc. Political Philos. 2020, 25, 1–19. [Google Scholar] [CrossRef]
- Bunduchi, E.; Vasile, V.; Comes, C.A.; Stefan, D. Macroeconomic determinants of remittances: Evidence from Romania. Appl. Econ. 2019, 51, 3876–3889. [Google Scholar] [CrossRef]
- Apostu, S.A.; Vasile, V. The Characteristics of Migrant Physicians from Romania. J. Soc. Econ. Stat. 2020, 9, 84–104. [Google Scholar] [CrossRef]
- Boboc, C.; Boncea, I.; Manea, D. The international migration of Romanian physicians. Econ. Comput. Econ. Cybern. Stud. Res. 2015, 4, 85–102. [Google Scholar]
- Păunică, M.; Pitulice, I.C.; Ștefănescu, A. International Migration from Public Health Systems. Case of Romania. Amfiteatru Econ. 2017, 19, 742–756. [Google Scholar]
- Apostu, S.A.; Vasile, V.; Chivu, R. The Analysis of Push Factors in Case of Physicians Migration from Romania. LUMEN Proc. 2020, 14, 467–482. [Google Scholar]
- Pintea, S.; Ministry of Health. 2018- in Digi24. Available online: https://www.digi24.ro/stiri/actualitate/sanatate/ce-se-intampla-cu-salariile (accessed on 10 July 2021).
- Bellu, C. Ziarul 2021 Digi 24, 150 Doctors Returned to the Country Last Year Three Times as Many Have Announced Their Departure. 2021. Available online: https://www.digi24.ro/stiri/actualitate/sanatate/150-de-medici-s-au-intors-anul-trecut-in-tara-de-trei-ori-mai-multi-au-anuntat-ca-pleaca-1137204 (accessed on 15 July 2021).
Figure 1.
Physicians available to 100,000 inhabitants, Europe, 2017.

Figure 2.
Trends regarding the number of new-entrant places in medicine by medical school in 2011–2012 and 2018–2019 according to OECD.
Figure 2.
Trends regarding the number of new-entrant places in medicine by medical school in 2011–2012 and 2018–2019 according to OECD.

Figure 3.
Cluster analysis of Current Professional Certificates in 2016/2018.

Figure 4.
The map of CPC, 2018.

Figure 5.
Current Professional Certificates according to specialization, 2017.

Figure 6.
The share of migrant physicians from Romania, according to the country of destination, 2017.
Figure 6.
The share of migrant physicians from Romania, according to the country of destination, 2017.

Figure 7.
The share of migrant physicians from Romania in the total number of physicians from the destination country.
Figure 7.
The share of migrant physicians from Romania in the total number of physicians from the destination country.

Figure 8.
Stock of Romanian doctors in OECD countries, selected countries with more than 100 employed doctors, in the period 2000–2020.
Figure 8.
Stock of Romanian doctors in OECD countries, selected countries with more than 100 employed doctors, in the period 2000–2020.

Figure 9.
The share of doctors from Romania in total foreign-trade doctors (%).


Table 1.
Correlations, 2018.
| CPC | Beds | Late Fetal Deaths | Emigrants | Unemployment Rate | Income | ||
|---|---|---|---|---|---|---|---|
| CPC | Pearson Correlation | 1 | 0.955 | 0.468 | 0.861 | −0.345 | 0.843 |
| Sig. (2-tailed) | 0.00 | 0.002 | 0.00 | 0.025 | 0.00 | ||
| Beds | Pearson Correlation | 0.955 | 1 | 0.536 | 0.939 | −0.288 | 0.784 |
| Sig. (2-tailed) | 0.00 | 0.00 | 0.00 | 0.064 | 0.00 | ||
| Late Fetal Deaths | Pearson Correlation | 0.468 | 0.536 | 1 | 0.556 | −0.336 | 0.322 |
| Sig. (2-tailed) | 0.02 | 0.00 | 0.00 | 0.03 | 0.038 | ||
| Emigrants | Pearson Correlation | 0.861 | 0.939 | 0.556 | 1 | −0.253 | 0.755 |
| Sig. (2-tailed) | 0.00 | 0.00 | 0.00 | 0.106 | 0.00 | ||
| Unemployment Rate | Pearson Correlation | −0.345 | −0.288 | −0.336 | −0.235 | 1 | 0.486 |
| Sig. (2-tailed) | 0.025 | 0.064 | 0.03 | 0.106 | 0.001 | ||
| Income | Pearson Correlation | 0.843 | 0.784 | 0.322 | 0.755 | −0.486 | 1 |
| Sig. (2-tailed) | 0.00 | 0.00 | 0.038 | 0.00 | 0.001 | ||
Source: Authors’ computation using SPSS.
Table 2.
Results of cross-sectional dependence tests.
| Variables | Test Statistics | Pesaran CD | Breusch–Pagan LM | Pesaran Scaled LM |
|---|---|---|---|---|
| Beds | t statistic | 50.686 | 2569.117 | 41.162 |
| p value | 0.00 ** | 0.00 ** | 0.00 ** | |
| Emigrants | t statistic | 49.645 | 2569.376 | 38.759 |
| p value | 0.00 ** | 0.00 ** | 0.00 ** | |
| Unemployment Rate | t statistic | 43.047 | 2225.118 | 32.873 |
| p value | 0.00 ** | 0.00 ** | 0.00 ** | |
| Income | t statistic | 50.686 | 2569.117 | 41.162 |
| p value | 0.00 ** | 0.00 ** | 0.00 ** | |
| CPC | t statistic | 0.579 | 2035.842 | 28.312 |
| p value | 0.00 ** | 0.00 ** | 0.00 ** | |
| Late fetal deaths | t statistic | 1.009 | 1884.133 | 24.656 |
| p value | 0.00 ** | 0.00** | 0.00 ** |
** It is significant at 5% significance level.
Table 3.
Statistics on the fixed effects model evaluation.
| Regression Model Statistics | |||
|---|---|---|---|
| Sum of squares of errors | 19,061.4054 | Degrees of freedom | 77 |
| Mean of squares of errors | 247.5507 | Root mean square error | 15.7337 |
| Coefficient of determination (R2) | 0.9713 | ||
Source: Authors’ computation using SAS.
Table 4.
Testing the homogeneity hypothesis based on the F test.
| F Test for No Fixed Effects | |||
|---|---|---|---|
| Number of Fixed Effects | Degrees of Freedom | F Value | Pr ˃ F |
| 43 | 77 | 4.31 | <0.0001 |
Source: Authors’ computation using SAS.
Table 5.
Estimation of the regression model parameter.
| Variable | Estimate | Standard Error | Pr > |t| | Variable | Estimate | Standard Error | Pr > |t| |
|---|---|---|---|---|---|---|---|
| TS1 | −72.2966 | 28.9489 | 0.0146 | CS18 | 106.0364 | 45.7357 | 0.0231 |
| TS2 | −30.7422 | 14.6971 | 0.0398 | CS19 | 49.35526 | 27.0063 | 0.0715 |
| Intercept | 380.9089 | 108.9 | 0.0008 | CS20 | 20.93723 | 17.7128 | 0.2408 |
| Beds | 0.036145 | 0.0204 | 0.0810 | CS21 | 13.99434 | 32.7409 | 0.6703 |
| Late fetal deaths | 0.193681 | 0.3673 | 0.5995 | CS22 | −37.1466 | 20.0595 | 0.0679 |
| Emigrants | −0.02673 | 0.0120 | 0.0292 | CS23 | −42.5213 | 35.4010 | 0.2334 |
| UR | −6.58752 | 3.0692 | 0.0350 | CS24 | 16.21463 | 15.1139 | 0.2867 |
| Income | −0.14092 | 0.0515 | 0.0077 | CS25 | 114.9766 | 84.5168 | 0.1777 |
| CS1 | 6.943535 | 25.7926 | 0.7885 | CS26 | 102.9476 | 44.7593 | 0.0242 |
| CS2 | 33.1142 | 24.2863 | 0.1767 | CS27 | −16.4175 | 22.1276 | 0.4604 |
| CS3 | 71.68276 | 38.0379 | 0.0633 | CS28 | 10.03428 | 23.2483 | 0.6672 |
| CS4 | 69.32228 | 25.8894 | 0.0091 | CS29 | 24.31213 | 40.5187 | 0.5503 |
| CS5 | −26.0512 | 34.7167 | 0.4553 | CS30 | 17.76834 | 16.7607 | 0.2924 |
| CS6 | −36.6411 | 16.8760 | 0.0330 | CS31 | 58.86819 | 21.0271 | 0.0065 |
| CS7 | −12.1491 | 18.4863 | 0.5130 | CS32 | 80.91721 | 39.5792 | 0.0443 |
| CS8 | −21.5639 | 20.3027 | 0.2915 | CS33 | −25.2235 | 20.4516 | 0.2212 |
| CS9 | 64.42392 | 39.1388 | 0.1038 | CS34 | −9.78709 | 17.9250 | 0.5866 |
| CS10 | 320.3415 | 278.9 | 0.2543 | CS35 | 58.95529 | 40.5843 | 0.1504 |
| CS11 | 28.35142 | 22.3983 | 0.2094 | CS36 | 33.4635 | 25.3971 | 0.1915 |
| CS12 | 13.68061 | 14.4567 | 0.3469 | CS37 | 26.15762 | 21.1624 | 0.2202 |
| CS13 | −33.1417 | 20.9701 | 0.1181 | CS38 | 199.8839 | 71.4385 | 0.0065 |
| CS14 | 137.9871 | 92.2840 | 0.1389 | CS39 | 2.910336 | 19.7408 | 0.8832 |
| CS15 | 68.02829 | 38.1167 | 0.0782 | CS40 | −19.0884 | 20.2813 | 0.3496 |
| CS16 | −60.877 | 30.1827 | 0.0472 | CS41 | 36.14958 | 23.4640 | 0.1275 |
| CS17 | 45.24891 | 20.0172 | 0.0266 |
Source: Authors’ computation using SAS.
Publisher’s Note: MDPI stays neutral with regard to jurisdictional claims in published maps and institutional affiliations. |
© 2022 by the authors. Licensee MDPI, Basel, Switzerland. This article is an open access article distributed under the terms and conditions of the Creative Commons Attribution (CC BY) license (https://creativecommons.org/licenses/by/4.0/).
Share and Cite
MDPI and ACS Style
Apostu, S.A.; Vasile, V.; Marin, E.; Bunduchi, E. Factors Influencing Physicians Migration—A Case Study from Romania. Mathematics 2022, 10, 505. https://0-doi-org.brum.beds.ac.uk/10.3390/math10030505
AMA Style
Apostu SA, Vasile V, Marin E, Bunduchi E. Factors Influencing Physicians Migration—A Case Study from Romania. Mathematics. 2022; 10(3):505. https://0-doi-org.brum.beds.ac.uk/10.3390/math10030505
Chicago/Turabian StyleApostu, Simona Andreea, Valentina Vasile, Erika Marin, and Elena Bunduchi. 2022. "Factors Influencing Physicians Migration—A Case Study from Romania" Mathematics 10, no. 3: 505. https://0-doi-org.brum.beds.ac.uk/10.3390/math10030505
Note that from the first issue of 2016, this journal uses article numbers instead of page numbers. See further details here.