
Segmenting Retinal Vessels Using a Shallow Segmentation Network to Aid Ophthalmic Analysis


Division of Electronics and Electrical Engineering, Dongguk University, 30 Pildong-ro 1-gil, Seoul 04620, Korea
*
Author to whom correspondence should be addressed.
Mathematics 2022, 10(9), 1536; https://0-doi-org.brum.beds.ac.uk/10.3390/math10091536
Submission received: 22 March 2022
/
Revised: 26 April 2022
/
Accepted: 29 April 2022
/
Published: 3 May 2022
(This article belongs to the Special Issue Advances in Artificial Intelligence and Statistical Techniques with Applications to Health and Education)
Abstract
:Retinal blood vessels possess a complex structure in the retina and are considered an important biomarker for several retinal diseases. Ophthalmic diseases result in specific changes in the retinal vasculature; for example, diabetic retinopathy causes the retinal vessels to swell, and depending upon disease severity, fluid or blood can leak. Similarly, hypertensive retinopathy causes a change in the retinal vasculature due to the thinning of these vessels. Central retinal vein occlusion (CRVO) is a phenomenon in which the main vein causes drainage of the blood from the retina and this main vein can close completely or partially with symptoms of blurred vision and similar eye problems. Considering the importance of the retinal vasculature as an ophthalmic disease biomarker, ophthalmologists manually analyze retinal vascular changes. Manual analysis is a tedious task that requires constant observation to detect changes. The deep learning-based methods can ease the problem by learning from the annotations provided by an expert ophthalmologist. However, current deep learning-based methods are relatively inaccurate, computationally expensive, complex, and require image preprocessing for final detection. Moreover, existing methods are unable to provide a better true positive rate (sensitivity), which shows that the model can predict most of the vessel pixels. Therefore, this study presents the so-called vessel segmentation ultra-lite network (VSUL-Net) to accurately extract the retinal vasculature from the background. The proposed VSUL-Net comprises only 0.37 million trainable parameters and uses an original image as input without preprocessing. The VSUL-Net uses a retention block that specifically maintains the larger feature map size and low-level spatial information transfer. This retention block results in better sensitivity of the proposed VSUL-Net without using expensive preprocessing schemes. The proposed method was tested on three publicly available datasets: digital retinal images for vessel extraction (DRIVE), structured analysis of retina (STARE), and children’s heart health study in England database (CHASE-DB1) for retinal vasculature segmentation. The experimental results demonstrated that VSUL-Net provides robust segmentation of retinal vasculature with sensitivity (Sen), specificity (Spe), accuracy (Acc), and area under the curve (AUC) values of 83.80%, 98.21%, 96.95%, and 98.54%, respectively, for DRIVE, 81.73%, 98.35%, 97.17%, and 98.69%, respectively, for CHASE-DB1, and 86.64%, 98.13%, 97.27%, and 99.01%, respectively, for STARE datasets. The proposed method provides an accurate segmentation mask for deep ophthalmic analysis.
MSC:
68T07; 68U101. Introduction
Retinal vessel morphology is a clear biomarker for many retinal diseases and can be used to determine disease severity. The retinal disease causes changes in the retinal vasculature, which can be detected by tracking these changes. Such diseases include macular degeneration, macular edema, Alzheimer’s disease (AD), diabetic retinopathy, hypertensive retinopathy, sickle cell retinopathy, and glaucoma, which involve retinal vascular changes and can lead to vision loss [1]. Diabetic retinopathy is a retinal disease that results in the swelling or leakage of retinal vessels due to high blood sugar [2]. Hypertensive retinopathy is a retinal disorder that results in narrowed retinal vessels due to high blood pressure, which can be particularly noticed in the microvasculature [3]. Central retinal vein occlusion (CRVO) and branch retinal vein occlusion (BRVO) is a common retinal disorder after diabetic retinopathy and a major cause of visual detachment. CRVO includes vascular changes [4]. Sickle cell retinopathy (SCR) is a vision loss-related disease that is characterized by vaso-occlusion caused by retinal ischemia. In SCR disease, the vasculature morphology changes with a reduction in vessel density. Retinal vessels are important biomarkers for early SCR detection [5]. Parkinson’s disease (PD) is a neurodegenerative disorder that causes neuronal loss in the nervous system. Cell degeneration in PD causes symptoms that include impairment of the olfactory, visual, and nervous systems. The retinal vessel changes that occur during the progression of PD and subsequent vascular changes can be analyzed [6]. Retinal vascular changes, mainly observed in larger vessels, can be used to identify the area of retinal vascular occlusion. The morphologies of retinal vessels and other vascular pathologies are closely related to these retinal vascular diseases [7]. Table 1 enlists the abbreviations that are used in the paper.
Retinopathy of prematurity (ROP) proliferative retinal disorder affects premature infants, and most of these mild cases can be automatically resolved within a few months after birth. However, 5–10% of cases with severe ROP can lead to retinal detachment if not treated in time. Major ROP disease analyses were performed using manual morphological analysis of the retinal vessels of the patient. Ophthalmologists carefully analyze the arterial tortuosity and dilation of the posterior retinal vessels for disease diagnosis [8]. Glaucoma disease is a serious retinal disorder that has a huge impact on blindness globally [9]. Vascular factors play a vital role in the progression of glaucoma. Studies have shown that glaucoma is associated with blood pressure, perfusion pressure, and cardiovascular diseases. The retinal vasculature is the only visible biomarker that can be utilized for quantitative analysis of tortuosity, fractal dimensions, branching, etc., in glaucoma analysis [10]. AD is a common disease in the elderly that involves heterogeneous cognitive and functional impairments. Studies have shown that AD is coupled with retinal and neurovascular disorders, with which retinal morphological changes are also associated including changes in the retinal vasculature [11]. The retinal vessel-associated diseases are further discussed in [12].
Early ophthalmic diagnosis requires keen retinal image analysis. However, detecting minor changes is challenging. Many ophthalmic disorders are associated with retinal vessel morphology including position, thickness, tortuosity, creation, and elimination [13]. Ophthalmologists manually analyze the retinal vasculature and mark the changes. With the emergence of deep learning, automatic disease analysis is growing to help medical practitioners achieve faster and more reliable diagnoses [14,15,16,17,18].
Semantic segmentation is a method that can automatically detect retinal vessels for ophthalmic disease analysis in previous researches [19,20]. However, they are relatively inaccurate, expensive, and complex in architecture. They use more layers to accomplish the segmentation task, which increases the requirement of graphic processing unit memory. They also lack effective design, therefore, expensive preprocessing schemes are required to enhance the image before feeding it to a deep learning network. Moreover, most of the existing schemes cannot effectively provide a disease diagnosis solution. To address these issues, this study presents a deep-learning-based vessel segmentation ultra-lite-network (VSUL-Net) that can extract the retinal vasculature accurately from fundus images. VSUL-Net is a very shallow network that comprises only 0.37 million trainable parameters. It consists of very few layers and does not require conventional image-enhancement methods for preprocessing. This study showcases an ultra-lite semantic segmentation architecture specifically designed to detect retinal vessels to aid ophthalmic diagnosis and has the following advantageous novel contributions:
- This study presents a novel semantic segmentation architecture (VSUL-Net) that detects retinal vessels directly from original fundus images without preprocessing for image enhancement.
- VSUL-Net is a shallow architecture that comprises only 0.37 million trainable parameters with 10 convolutional layers with few filters.
- The feature retention block provides rich spatial features that help with better segmentation accuracy and true-positive rate.
- The proposed VSUL-Net trained models are made publicly available in [21].
The remainder of this paper is organized as follows. Section 2 presents a literature review on previous studies of retinal vessel segmentation. Section 3 describes the proposed method in detail. Section 4 presents the experimental results, evaluation of the proposed method, and discussion. Finally, conclusions are presented in Section 5.
2. Literature Review
Detection of retinal vessels can be useful for the early diagnosis of numerous retinal and non-retinal diseases, where automated methods are useful for reducing the diagnostic burden of medical specialists. Retinal vessel segmentation is performed using two main approaches: conventional image processing and machine/deep feature-based methods. Numerous research has been conducted based on conventional methods that use general image processing schemes. In Section 2.1, conventional image processing methods that have been researched recently are discussed. Learning-based methods have evolved with high stability and performance; recent deep-feature-based methods are discussed in detail in Section 2.2. Table 2 provides the pros and cons of the methods given in Section 2.1 and Section 2.2.
2.1. Conventional Image Processing-Based Methods for Vessel Segmentation
2.1.1. Contrast Limited Adaptive Histogram Equalization (CLAHE) Based Methods
Conventional image processing-based schemes for vessel segmentation typically use various image-enhancement schemes before thresholding. Alhussein et al. presented a Wiener and morphological filtering-based method for segmentation and CLAHE to improve the contrast of fundus images [22]. Similarly, Ahamed et al. presented an automatic vessel segmentation method based on multiscale line detection. They used CLAHE on the green channel for contrast enhancement and integrated hysteresis and morphological thresholding for the final segmentation [23]. An unsupervised method was proposed by Naveed et al., who used an ensemble block-matching 3-D speckle filter for image enhancement after the CLAHE operation. In their model, a segmentation task was performed using a multiscale detector and a Frangi detector [24]. The above-listed methods are based on a conventional image processing scheme, which can suffer from minor image changes and lack segmentation performance.
2.1.2. Line Detection and Tube Based Methods
A line detector-based vessel detection method was proposed by Zhou et al., which was used to identify the major vessel area to which a Markov model was applied to detect retinal vessels after noise removal [25]. Shah et al. used a multiscale line-detection method for retinal vessel segmentation. Gabor wavelet superposition was used on the green channel, and a multiscale line detection method was used to enhance images for vessel extraction [26]. Another image-processing-based method used curvelet transform and line operation for vessel segmentation, where a combination of adaptive histogram equalization, anisotropic diffusion filtering, and color space transformation was employed for preprocessing [27]. Li et al. presented an unsupervised method in which image enhancement schemes were used for image preprocessing and a connected-tube marked point process was employed for the extraction of the vessel network. The final segmentation was performed using the detected tube width expansion [28]. Most of these listed methods include image processing schemes for image enhancement, which increase the overall cost of the system.
2.1.3. Thresholding, Morphology Based, and Other Methods
A three-stage method was proposed by Soto et al. using top-hat and homomorphic filtering. In the first stage, image smoothing was applied for image enhancement; then, the thin and thick vessels were segmented separately using two phases. In the final stage, morphological postprocessing was applied to improve segmentation results obtained in the second stage [29]. To detect retinal vessels, Aswini et al. presented an unsupervised method based on two-fold hysteresis thresholding. In their model, before thresholding, the fundus image was enhanced using morphological smoothing and background suppression [30]. A hybrid approach based on multiscale image enhancement combined with a bottom-hat transform was proposed by Sundaram et al., where the segmentation task was performed based on morphological operations [31]. Khawaja et al. proposed a probabilistic patch-based denoiser to alleviate the aggravated noise that obstructs vessel segmentation, in which a modified Frangi filter was used combined with a denoiser [32]. Similar to the methods listed in Section 2.1.2, most of these methods include image processing schemes for image enhancement and work on the specific threshold that suffers from changes in the image colors and contrasts.
2.2. Learned Feature-Based Methods for Vessel Segmentation
Learning-based methods are more widely recognized because they can mimic the knowledge of medical specialists through feature learning. In addition, image augmentation methods help accomplish the task with fewer training examples.
2.2.1. Encoder–Decoder Based Methods
The encoder–decoder-based methods are the methods in which the decoder is the same as the encoder. Jin et al. presented a deformable structure-based modified U-Net for improved performance, where they used an upsampling operator to enhance the resolution for better segmentation performance [33]. Khan et al. presented a fully convolutional network with a residual information transfer path. They used an encoder–decoder architecture, where the decoder structure was the same as that of the encoder. The final pixel-wise prediction was performed using a pixel classification layer [34]. Yan et al. suggested a deep learning-based scheme where they combined segmentation level loss with pixel-wise loss to associate these losses with a thin and thick vessel via a U-Net architecture in two branches at the segment and pixel levels [35]. A coarse-to-fine deep learning strategy was presented by Wang et al., who used two U-shaped SegNet architectures for coarse and fine segmentation. In their method, the coarse SegNet provided the probability maps of the patches, and the fine SegNet refined the patches [36]. Li et al. proposed an iterative U-Net (IterNet) to segment the cloaked information of retinal vessels. They iterated the mini-U-Net with weight sharing using skip paths for improved segmentation [37]. Zhao et al. presented an end-to-end matting algorithm to retrieve vessels existing in unknown areas, where an encoder–decoder deep-learning method was used to create the matte. Then, the final segmentation was performed by incorporating both local matting loss and global pixel loss [38]. Zhang et al. proposed a pyramid U-Net approach for retinal vessel segmentation. They used pyramid-scale aggregation, which is based on the residual block to create different scales [39]. Similarly, another U-Net-based approach was presented by Gengundez-Arias et al. In detail, they modified the U-Net architecture to allow for a reduced structure and the use of a low number of parameters [40]. Most of these listed methods are based on an encoder–decoder, and decoders are the same as an encoder, which increases the overall depth of the network with a substantial increase in the number of trainable parameters. Moreover, these methods lack segmentation performance.
2.2.2. Generative Adversarial Networks-Based Methods
He et al. presented an end-to-end generative adversarial network (GAN) to distinguish the vessel area from the background. They used patches to feed the model along with the patches predicted by the network. Then, they merged all of these patches again to obtain the final result [41]. Guo et al. presented a combined GAN and dense U-Net-based approach to distinguish retinal vessels from the background. Specifically, they used a dense U-Net with an inception module implementation, where the short skip connections of the U-Net were replaced by dense blocks to benefit from the fusing of spatial information obtained from the initial layers. Dense inception was used as a generator, and a multilayered CNN was used as a discriminator with a loss function tuned for segmentation and GAN losses [42]. Lal et al. discussed the adversarial attacks for diabetic retinopathy recognition and used adversarial training in the defense of adversarial speckle-noise attacks [43]. Chudzik et al. presented a two-stage framework. In the first phase, a codebook was generated by a CNN with correlated features extracted from expert annotation. In the second phase, the generative features of the codebook were utilized for retinal vessel prediction and detection [44]. The generative adversarial approaches are relatively complex and require more computational power.
2.2.3. Machine Learning-Based Methods
Palanivel et al. proposed a novel Gaussian mixture model (GMM) for retinal vessel detection. They used multi-fractional characterization for noise removal and vessel enhancement and a holder component based on Gabor wavelet responses to approximate the regularity of the retinal vessels. In the final stage, a GMM classifier was applied to classify the pixels between the vessel and background classes [45]. A coarse-to-fine strategy for vessel segmentation was presented by Tchinda et al., who used conventional edge detection methods to extract the feature vector. These feature vectors were then sent to the artificial neural network to find pixel-wise labels in the image-to-vessel and non-vessel classes [46]. These methods are complex and have a lower true positive rate.
2.2.4. Multiscale/Multi Networks-Based Methods
A fully convolutional deep learning scheme for supervised vessel segmentation was proposed by Oliveira et al. They utilized a multiscale fully convolutional neural network analyzed by a stationary wavelet transform in a patch-based scenario [47]. Guo et al. presented a deeply supervised short-connection-based fully convolutional method for retinal vessel segmentation. They utilized two widely known networks, VGG-Net and ResNet-101, with short connections to transfer low-level detail information with short connections [48]. Feng et al. used a green channel-based 1-D image to feed the cross-connected deep learning architecture in a multiscale scenario, where the final segmentation was performed with fusion [49]. An accurate three-stage deep-learning-based vessel segmentation method was presented by Yang et al., where separate deep-learning models were used to segment the thick and narrow vessels separately. Finally, another deep-learning model was used to fuse both results for the final segmentation [50]. These methods perform segmentation with deep networks and keep the size of the final feature maps small, which results in lower sensitivity.
2.2.5. Other CNN-Based Methods
Hu et al. presented a CNN method to detect retinal vessels. They utilized a cross-entropy loss function for vessel segmentation, in which a conditional random field-based scheme was employed to boost the segmentation mask using a neural network [51]. A CNN-based scheme was proposed by Kromm et al. to detect vessels and their centerlines. They used Capsule-Net integrated with an inception network to tackle the segmentation task [52]. Considering the most recent learning-based methods, Samuel et al. proposed a supervised VGG-16 network with two-vessel extraction layers. These extraction layers were responsible for localizing the blood vessels; they used skip chain convolutional layers for rich feature flow between the network layers for superior segmentation [53]. Wu et al. presented a novel deep learning scheme in which a front network was used to generate a retinal vessel probabilistic map and a subsequent network to refine the map. They also employed an inner-network skip connection to unite identical features, where probabilistic maps were averaged for the final segmentation [54]. Similar to the methods listed in Section 2.2.5, these methods provide lower accuracy and sensitivity.

Table 2.
Pros and cons of the literature.
| Type | Method | Pros | Cons |
|---|---|---|---|
| Local feature-based methods | CLAHE [22,23,24] | Relatively simpler hardware is required | Suffer from the changes in contrast and quality of images |
| Line detection [25,26,27] | Simple image processing-based approach | Multiple preprocessing is required | |
| Tubular approach [28] | Tube Marked Point Process model approximation for vessel | Low sensitivity | |
| Morphology and Thresholding [29,30,31] | Thresholding is the simplest segmentation approach | The threshold may change with each image | |
| Patch-based denoiser [32] | Frangi filter is good for a vessel like structure | Low sensitivity | |
| Learned feature-based methods | Encoder-decoder [33,34,35,36,37,38,39,40] | U-Net and SegNet are famous for pixel-wise segmentation | The decoder is the same as the encoder increase the number of trainable parameters |
| GAN [41,42,43] | Adversarial approaches are good for a small amount of data | Complex structure with a large number of trainable parameters | |
| Machine Learning [45,46] | Relatively simpler compared to deep learning approaches | Pre and postprocessing are required | |
| Multiscale CNN [47] | Multiscale CNN is famous to deal with multiple resolutions | Patch-based scheme | |
| VGG and ResNet [48] | Skip connection overcomes the vanishing gradient problem | Two networks are combined for the task | |
| Cross-connected CNN [49] | Cross connected multiscale CNN share the spatial information of different scales | Only the Green channel is used | |
| Three-stage CNN [50] | Multiple network benefits are achieved | Three networks make the overall system complex | |
| Cross Entropy-based CNN [51] | Multiscale CNN performs better | A conditional random field is required to boost segmentation performance | |
| Capsule-Net [52] | CapsuleNet in combination with Inception is used for better performance | Overall complex | |
| VGG-16 [53] | Skip connection improves segmentation performance | Preprocessing is required | |
| NFN+ [54] | The network is followed by another network for better performance | Patch-based approach with preprocessing |
3. Proposed Method
3.1. Summary of Retinal Vessels Detection Using Deep Learning
The deep networks that deal with pixel-wise segmentation are called semantic segmentation networks. Unlike classification networks, which predict the image level label, semantic segmentation networks provide pixel-level predicted labels. A semantic segmentation network takes an image as input and applies many trained filters according to the learning from the training examples in an encoder–decoder manner, and at the end of the network, the pixel classification layers provide a binary output mask for each class in one go. Similarly, the morphological properties of retinal vessels are important for various ophthalmic disease assessments and semantic segmentation can help to find each vessel pixel in the image for analysis. The VSUL-Net is a deep learning-based segmentation network that learns from the example training images and utilizes that learned knowledge for pixel-wise retinal vessel prediction. The overview of the proposed network is provided in Section 3.2.
3.2. Overview of the Proposed Method
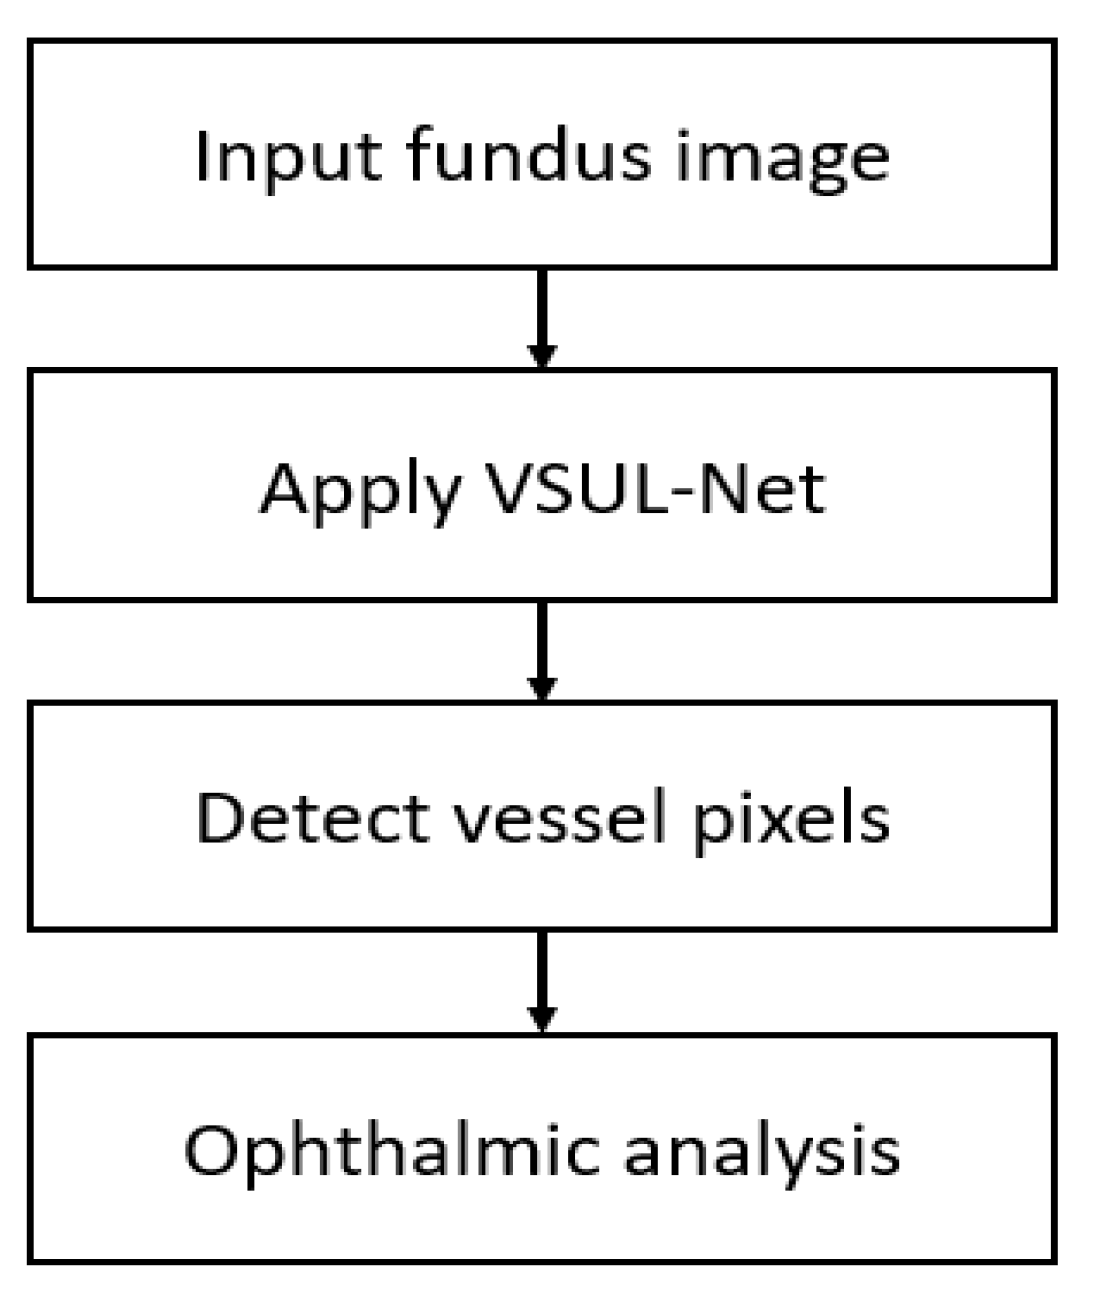
This study proposes a vessel segmentation ultra-lite network that can be used to aid ophthalmic analysis applications. Figure 1 presents the overall working procedure of the proposed method, which is based on the concatenation of features obtained from the backbone and retention blocks. This feature aggregation allows the network to learn powerful features to segment the retinal vasculature without a preprocessing stage. The proposed VSUL-Net takes the original image and applies a convolutional operation to extract meaningful features to detect retinal vessels. The final pixel classification block provides a binary segmentation mask that represents vessel and background pixels, and can be used for ophthalmic analysis.
3.3. Structure of Proposed VSUL-Net
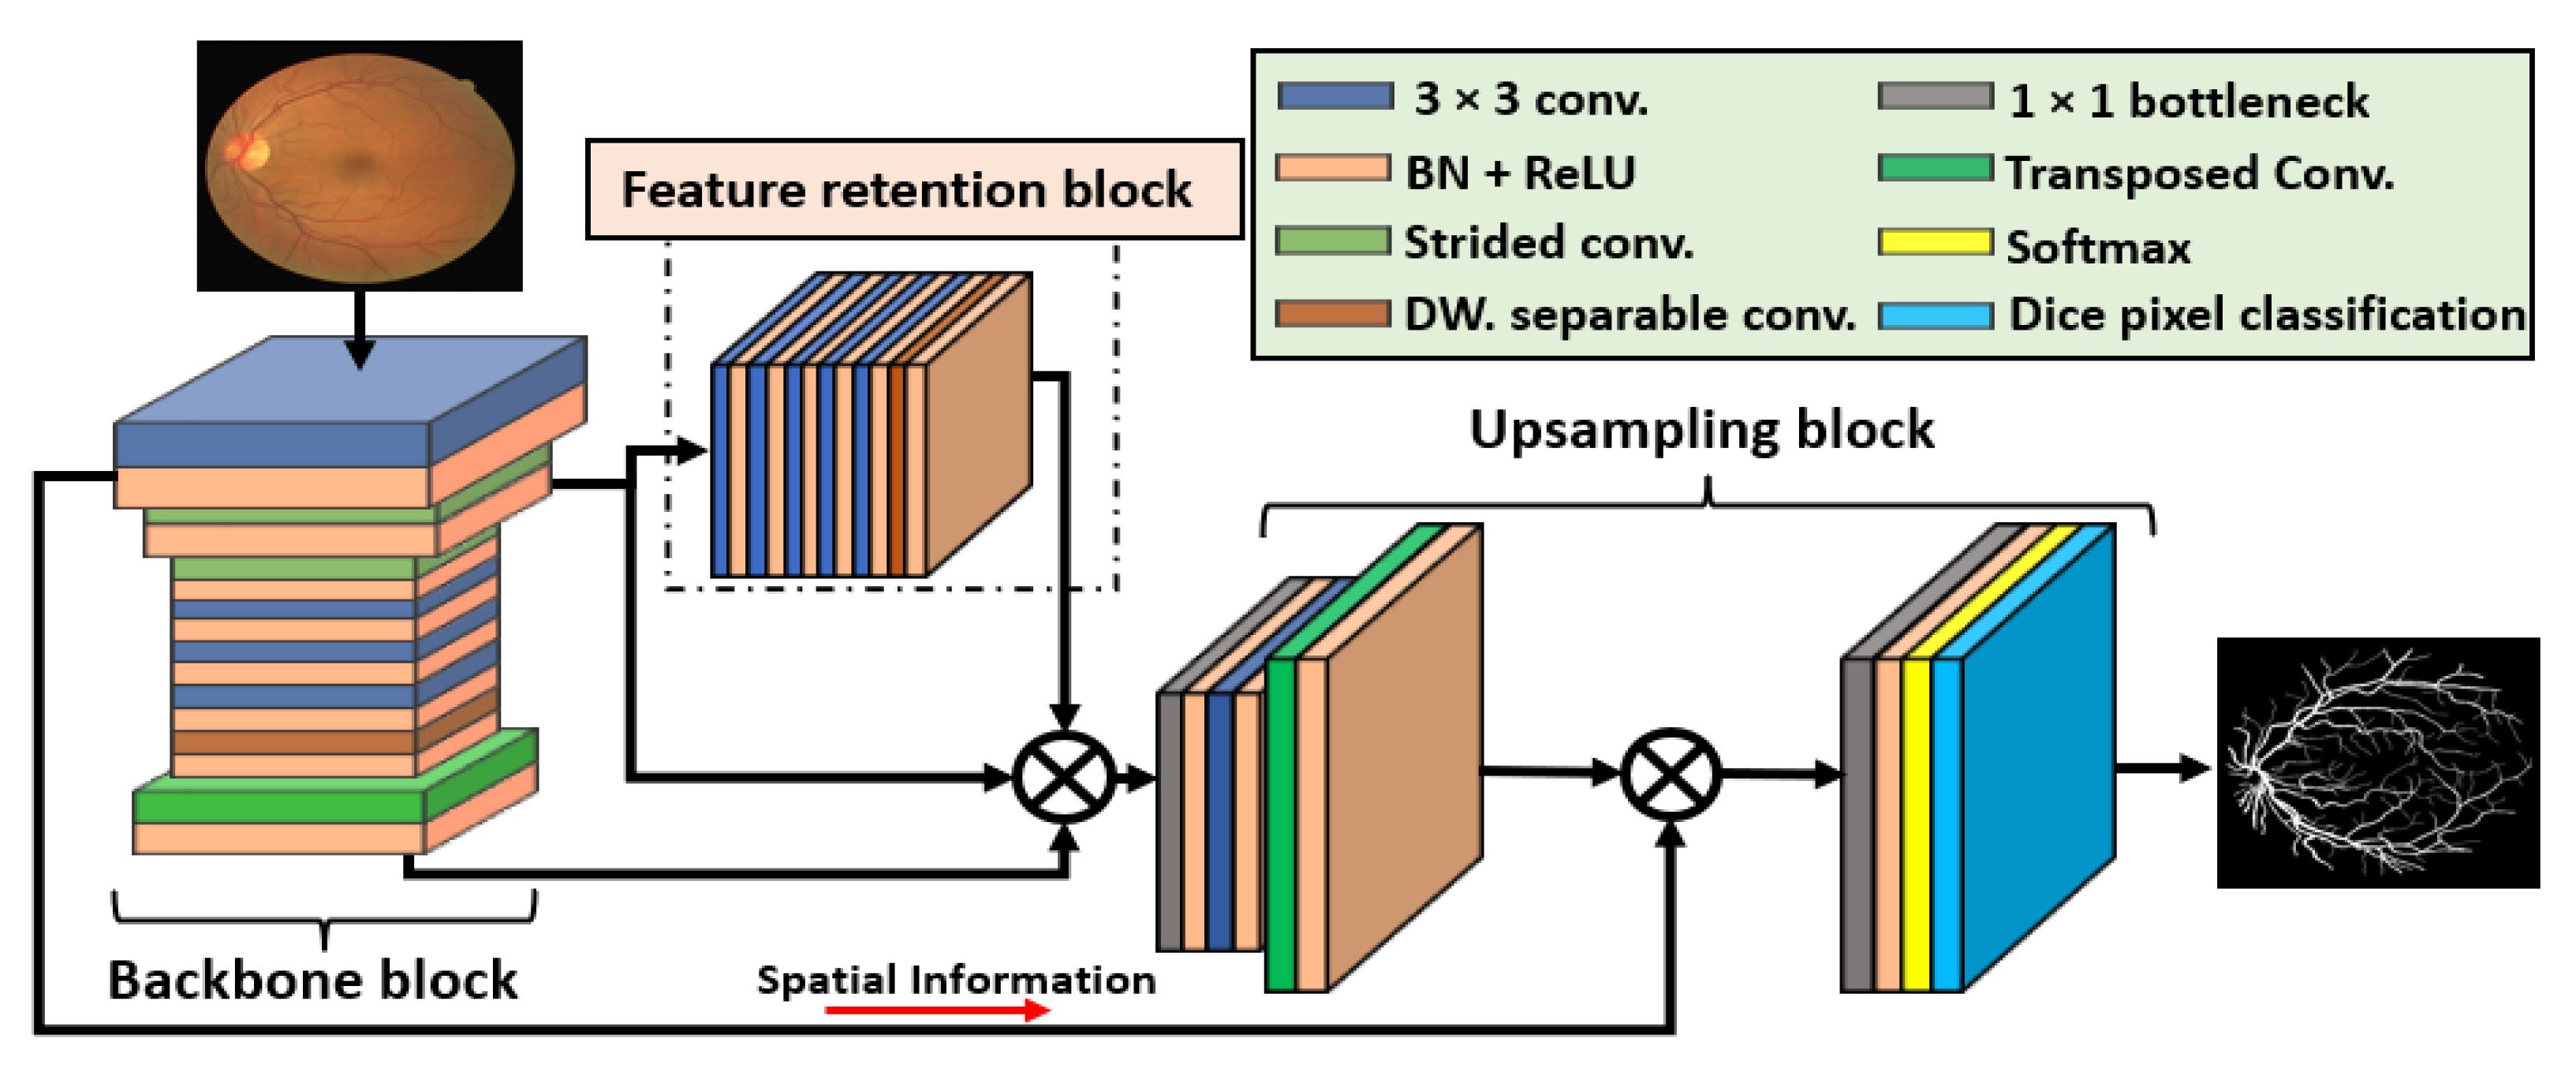
Generally, segmentation tasks are based on deep learning using a fully convolutional network in which the fully connected layers are removed and an upsampling procedure is adopted. Conventional semantic segmentation networks [55,56] are designed for other applications, and they use the same number of convolutions for the encoder and decoder while maintaining the same architectural design. This principle increases the overall depth of the network and the number of trainable parameters. Moreover, the conventional networks [56] use multiple pooling layers to reduce the size of the feature map, and the final feature map size becomes too small, which cannot represent the minor objects in the image. That small final feature map vanishes the small object in the image, which results in lower performance for the smaller classes. Hypothetically considering the vessel segmentation applications, the retinal vessel has a very complex structure. In addition, the smaller size of vessels makes segmentation tasks challenging. The accurate detection of these vessels is very important for ophthalmic disease analysis, and keeping the final feature map larger can save the important spatial information. VSUL-Net is a custom-designed vessel segmentation network that is specifically designed to detect retinal vessels with better sensitivity. Figure 2 illustrates the structure of the proposed VSUL-Net. Observe (Figure 2) that VSUL-Net is composed of three main blocks, namely, the backbone block (shown on the left of Figure 2), feature retention block (shown in the middle of Figure 2), and upsampling block (shown on the right side of Figure 2). Considering the importance of the true positive rate (sensitivity), which represents how effectively our model detects the true vessel pixels, the retention block keeps the feature map size larger and provides the low-level spatial information to the later layers.
The backbone block consists of four 3 × 3 general convolutions and two strided convolutions with stride = 2. The strided convolution is used to reduce the feature map size by half, replacing the max-pooling layers used in conventional architectures. Overall, the feature map is reduced twice in the backbone block. Convolutional layers with many channels require more trainable parameters; therefore, the convolution on the deeper side of the backbone block is replaced by depth-wise separable convolutions to reduce the complexity of the network. Keeping in mind that these vessels are small compared to the background, these vessels can be eliminated if the feature map size is reduced significantly inside the network. Observe from Table 3 that the smallest feature map size in the backbone block was 163 × 163, which is sufficient to represent most of the vessels available in the image. Moreover, with this 163 × 163 feature map, minor vessels can be eliminated; therefore, the feature retention block is used to apply continuous convolutions without resizing the feature map size. The retention block retains the future map size for a flat feature map size of 325 × 325 (as shown in Table 3), which can contain most of the valuable features that can represent most of the vessels. The upsampling block is mainly based on two transposed convolutions that are used along with a few general convolutions and batch normalizations. Two transposed convolutions are used to resize the feature map to its original size. Softmax and pixel classification layers are used at the end of the upsampling block. A further description of the pixel classification layer is provided in Section 3.3.
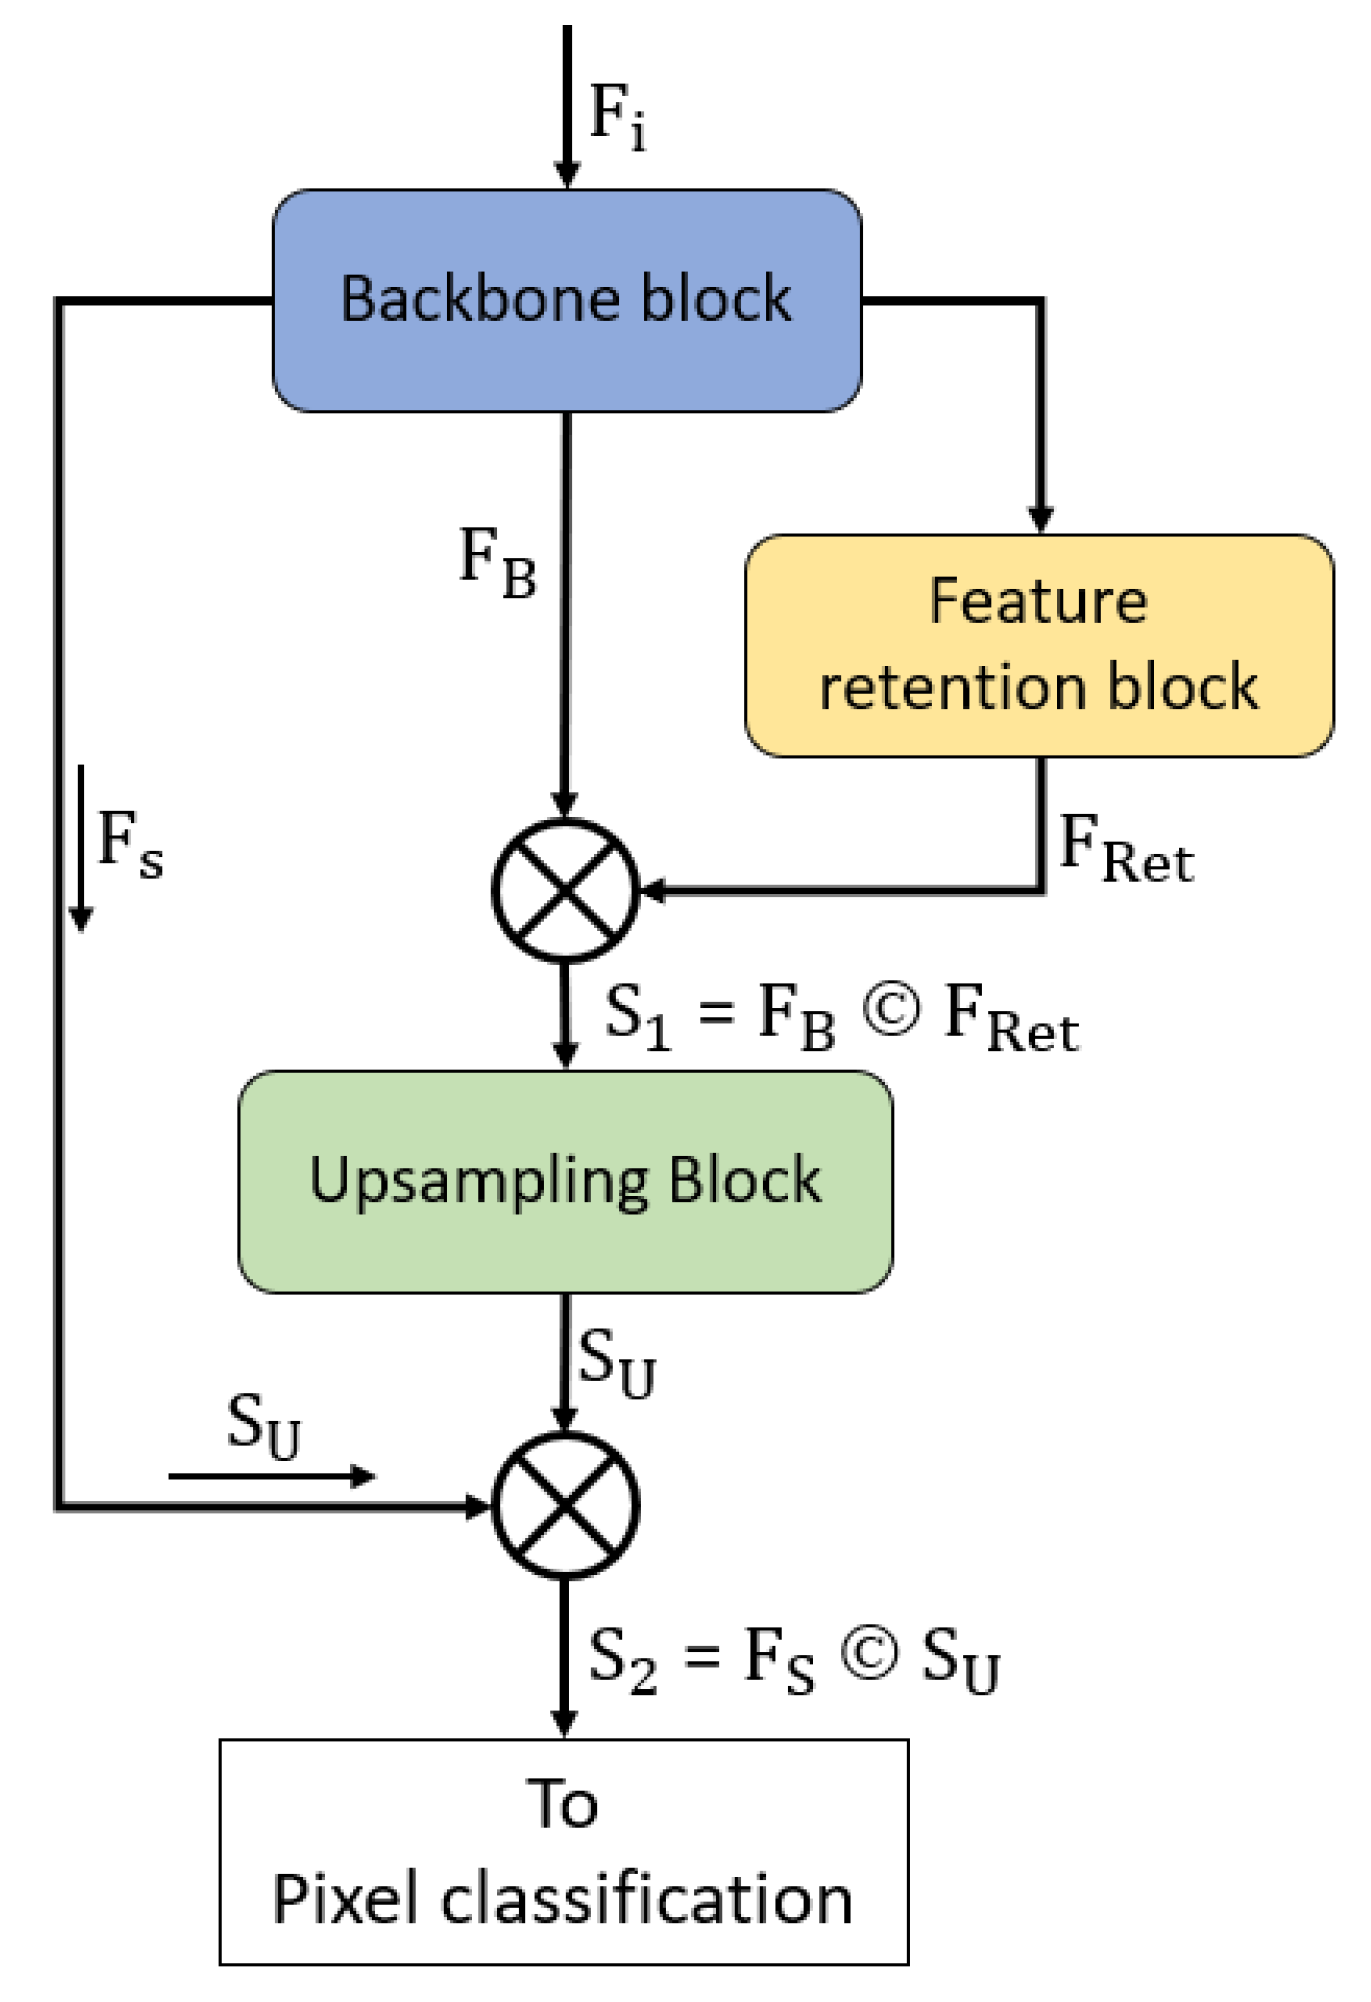
Figure 3 illustrates the VSUL-Net connectivity and dense feature aggregation principle. The backbone block takes the input feature , passes it through several convolutional layers to extract meaningful features for the retinal vessel analysis and provides the feature. This is densely aggregated with the rich feature coming from the retention block. The retention block features are without extensive pooling operations; therefore, they contain features that represent most of the vessels in the image. Both and are aggregated by depth-wise concatenation to create the feature that is expressed by Equation (1).
Here, is the densely aggregated feature created by the depth-wise concatenation of (feature coming from the backbone block) and (coming from the retention block), where © represents the depth-wise concatenation.
The upsampling block uses the feature and upsamples it so that it is equal to the input size of the network. The upsampling block outputs an feature that can be used for the final pixel-wise classification. However, to compensate for the spatial loss created by the continuous convolution operation, another dense concatenation is required. The low-level spatial information is imported from the initial layers of the network to be aggregated with the feature to build the rich compensated feature , which is expressed by Equation (2).
Here, the feature is the combined aggregated powerful feature created by the depth-wise concatenation of (coming from the initial layers of the network) and (coming from the upsampling block), where © represents the depth-wise concatenation.
3.4. Dealing with Class Imbalance Using Dice Loss
The pixel classification layer is responsible for providing pixel-wise markings according to the predicted class. Feature , taken from the upsampling block, is sent to a Softmax block. The number of vessel pixels in the image is less than that of the background pixels; therefore, the class imbalance deteriorates the final segmentation performance. The generalized dice loss (GDL) is an effective method for addressing class imbalances [57]. In VSUL-Net, the pixel classification layer is used with the GDL. The GDL is expressed by Equation (3)
where K belongs to all pixels available in the image; i is the pixel under consideration; and P and G are the predicted labels and actual ground truth labels, respectively. is the predicted probability of pixel i belonging to a specific class and is the actual ground truth label.
4. Experimental Results
4.1. Datasets
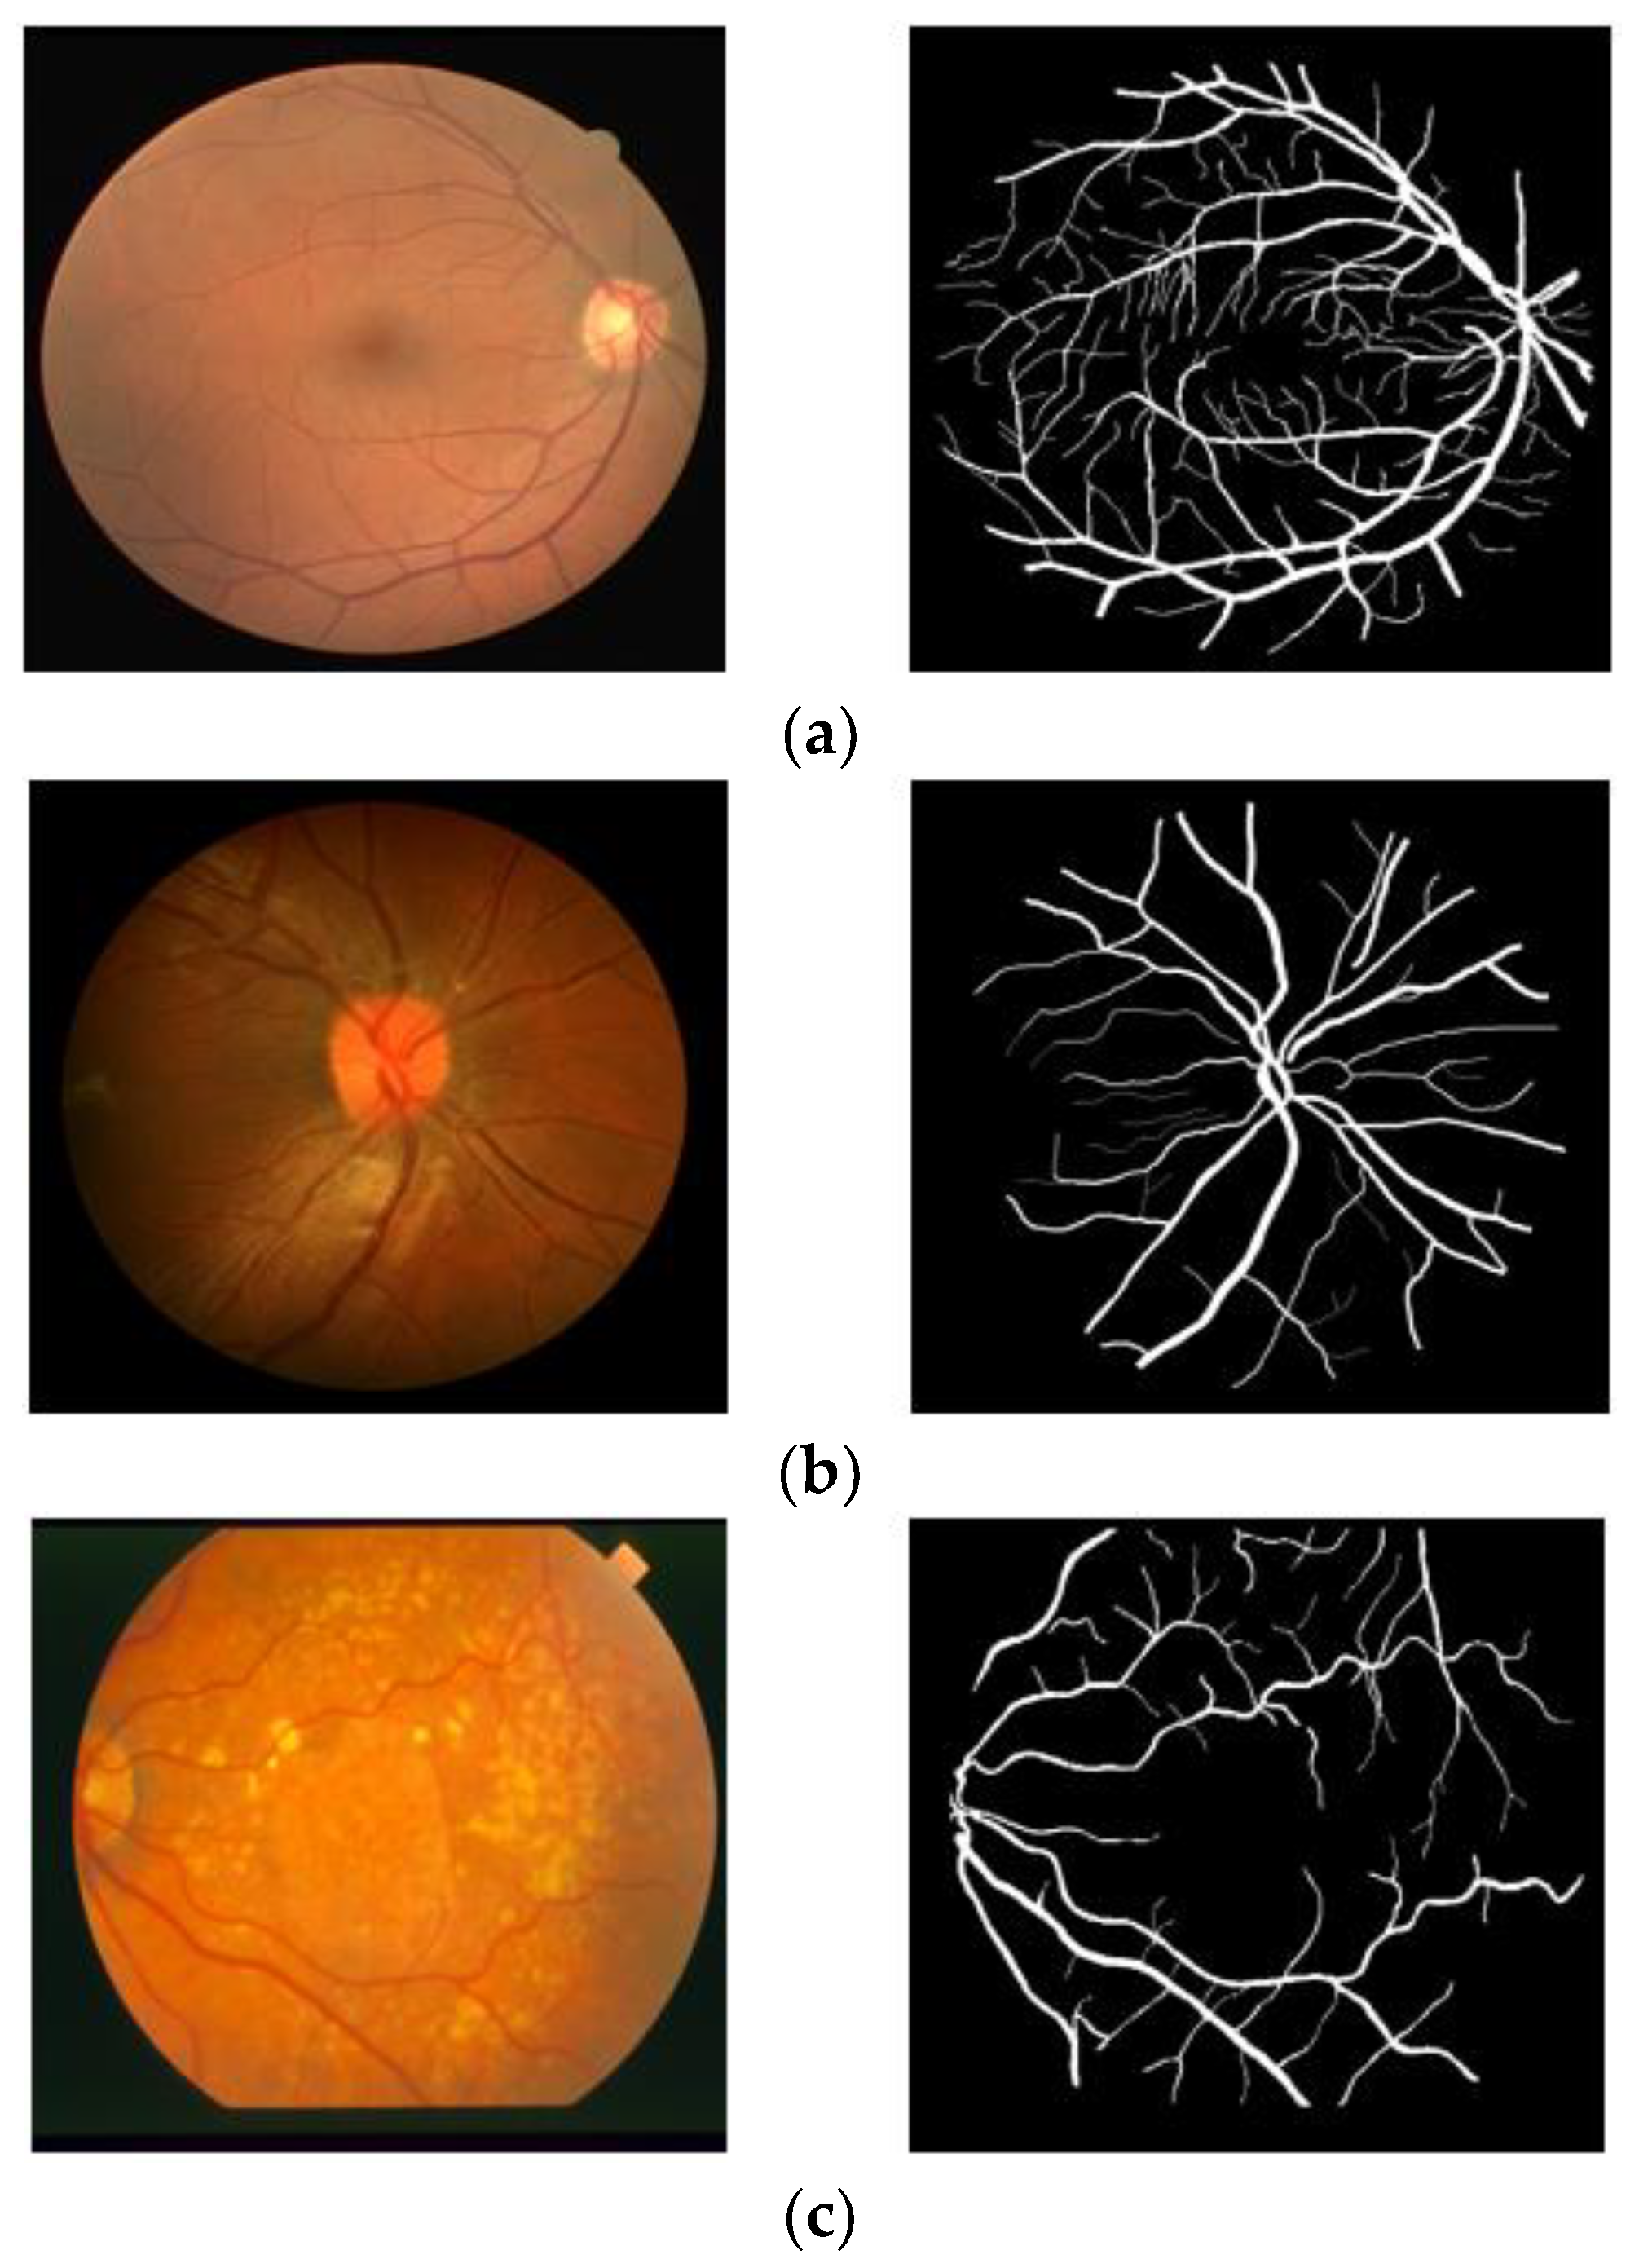
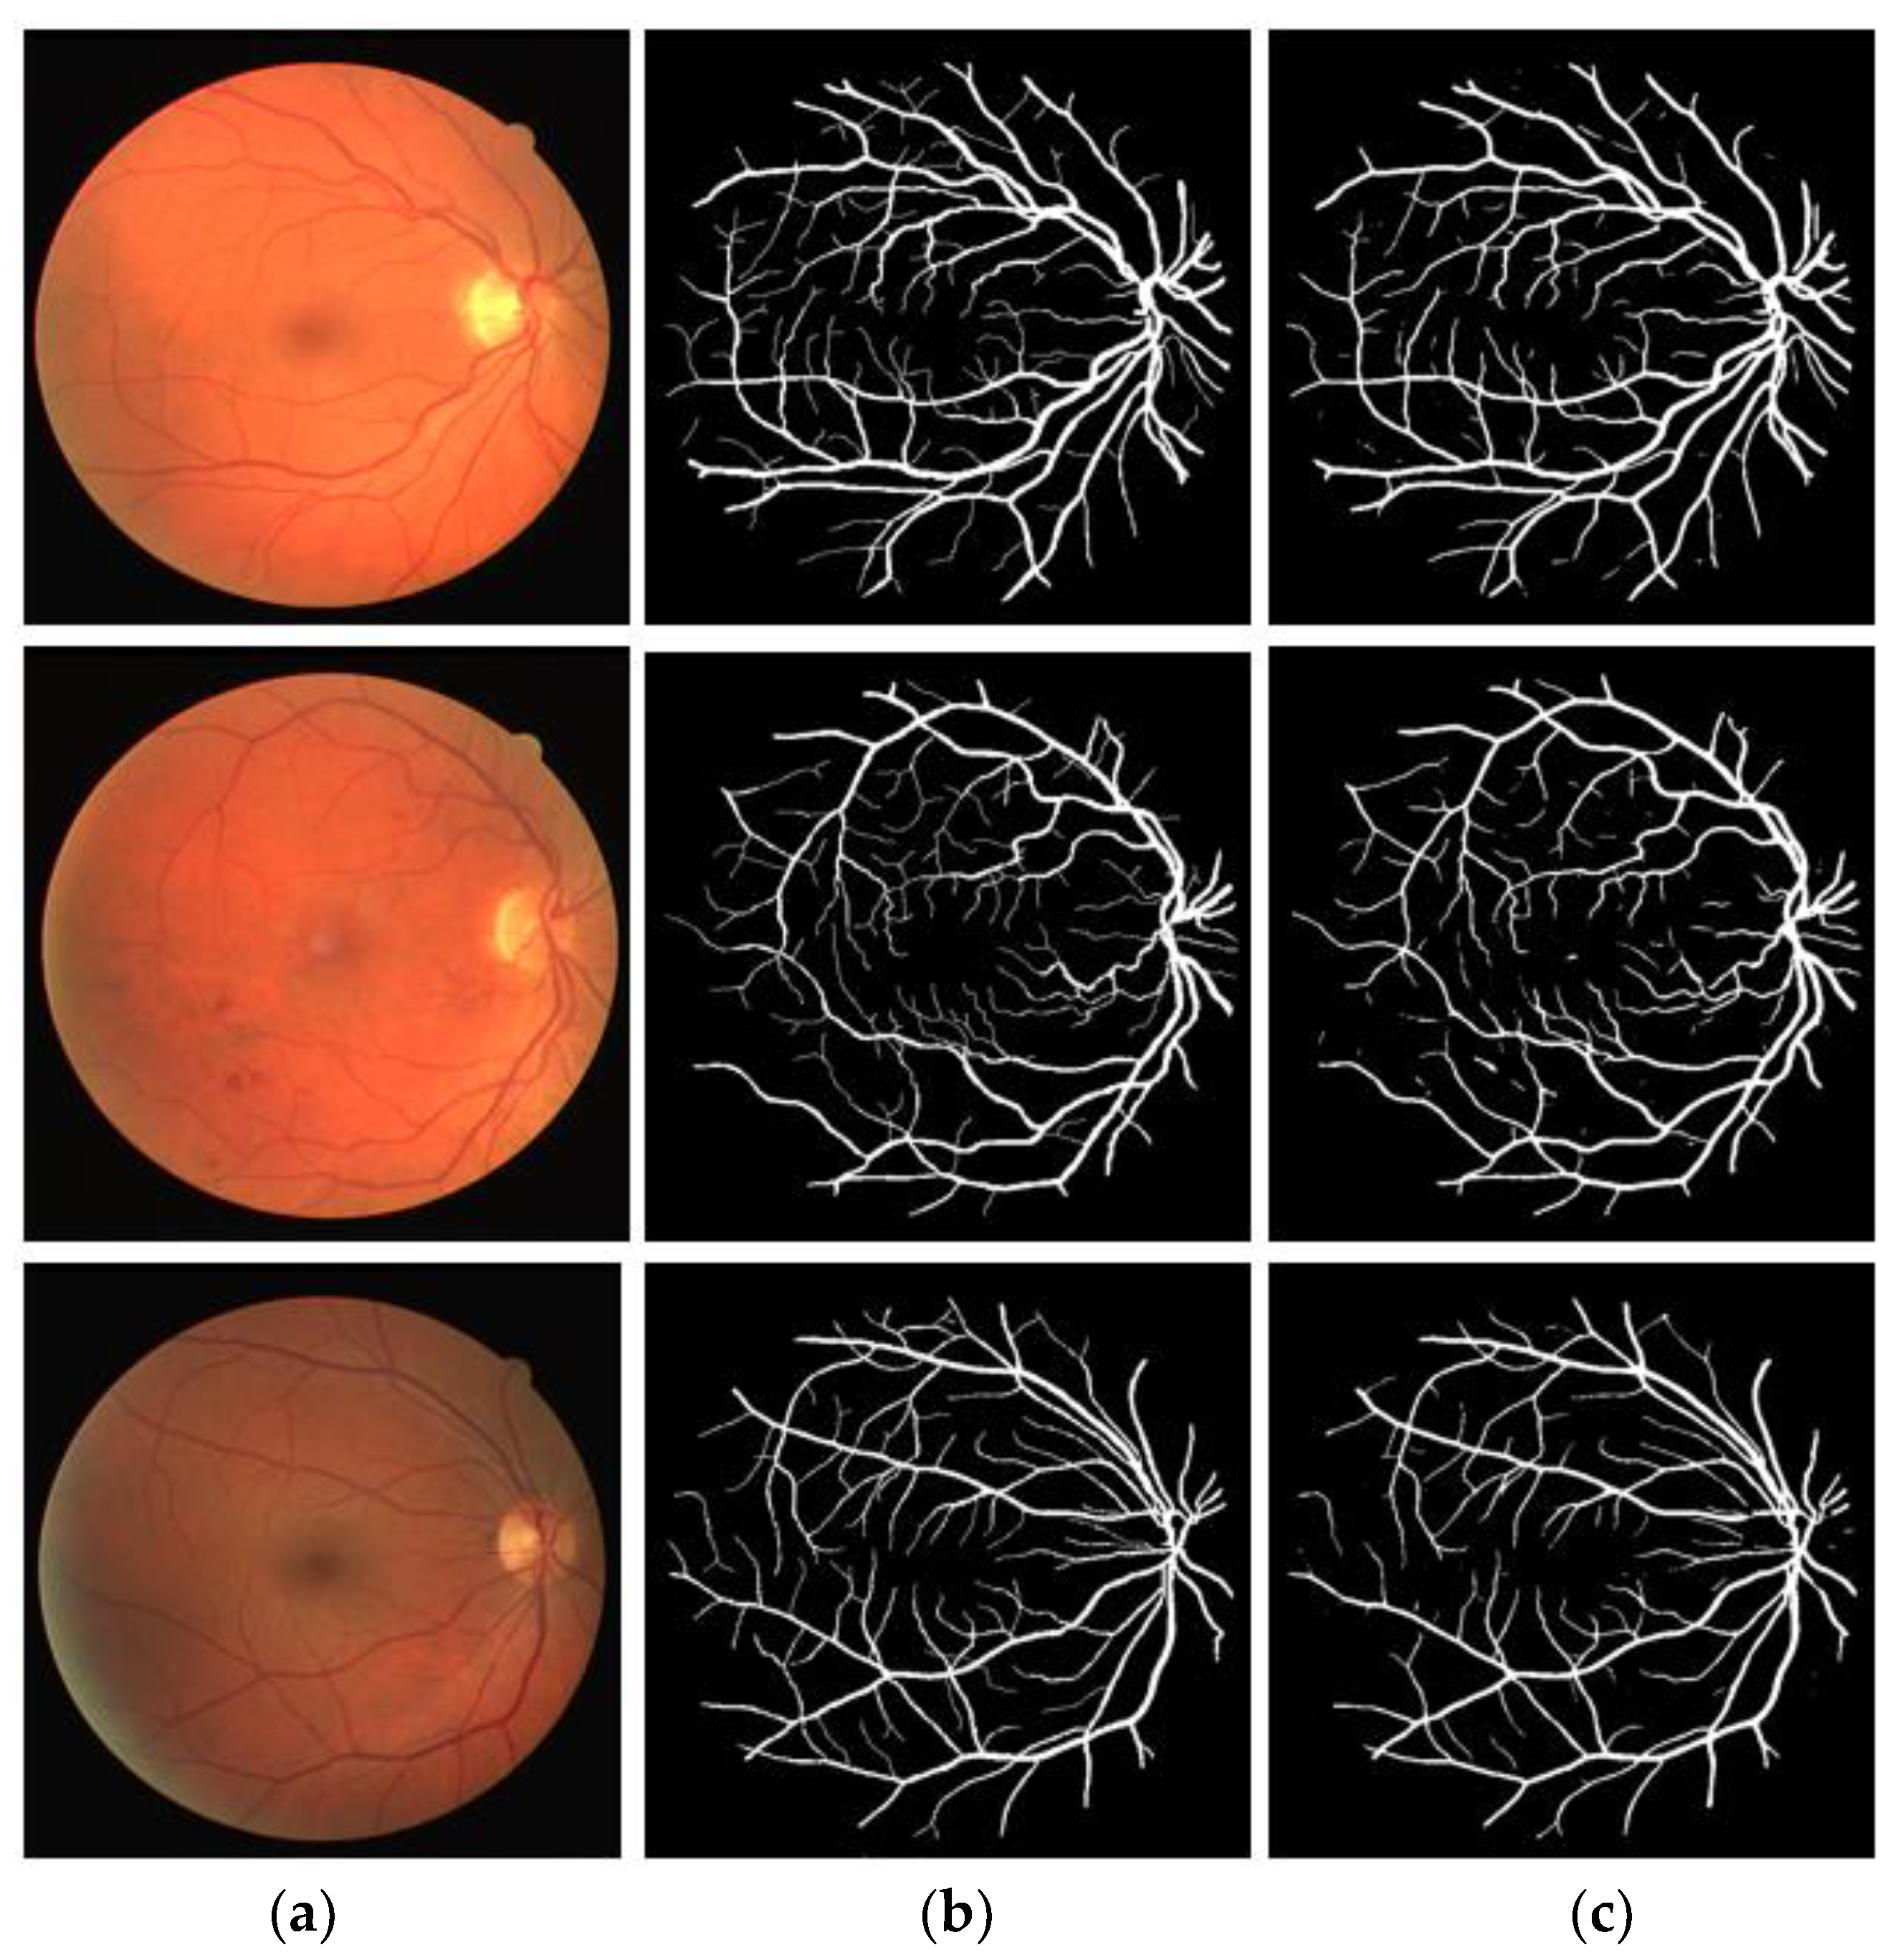
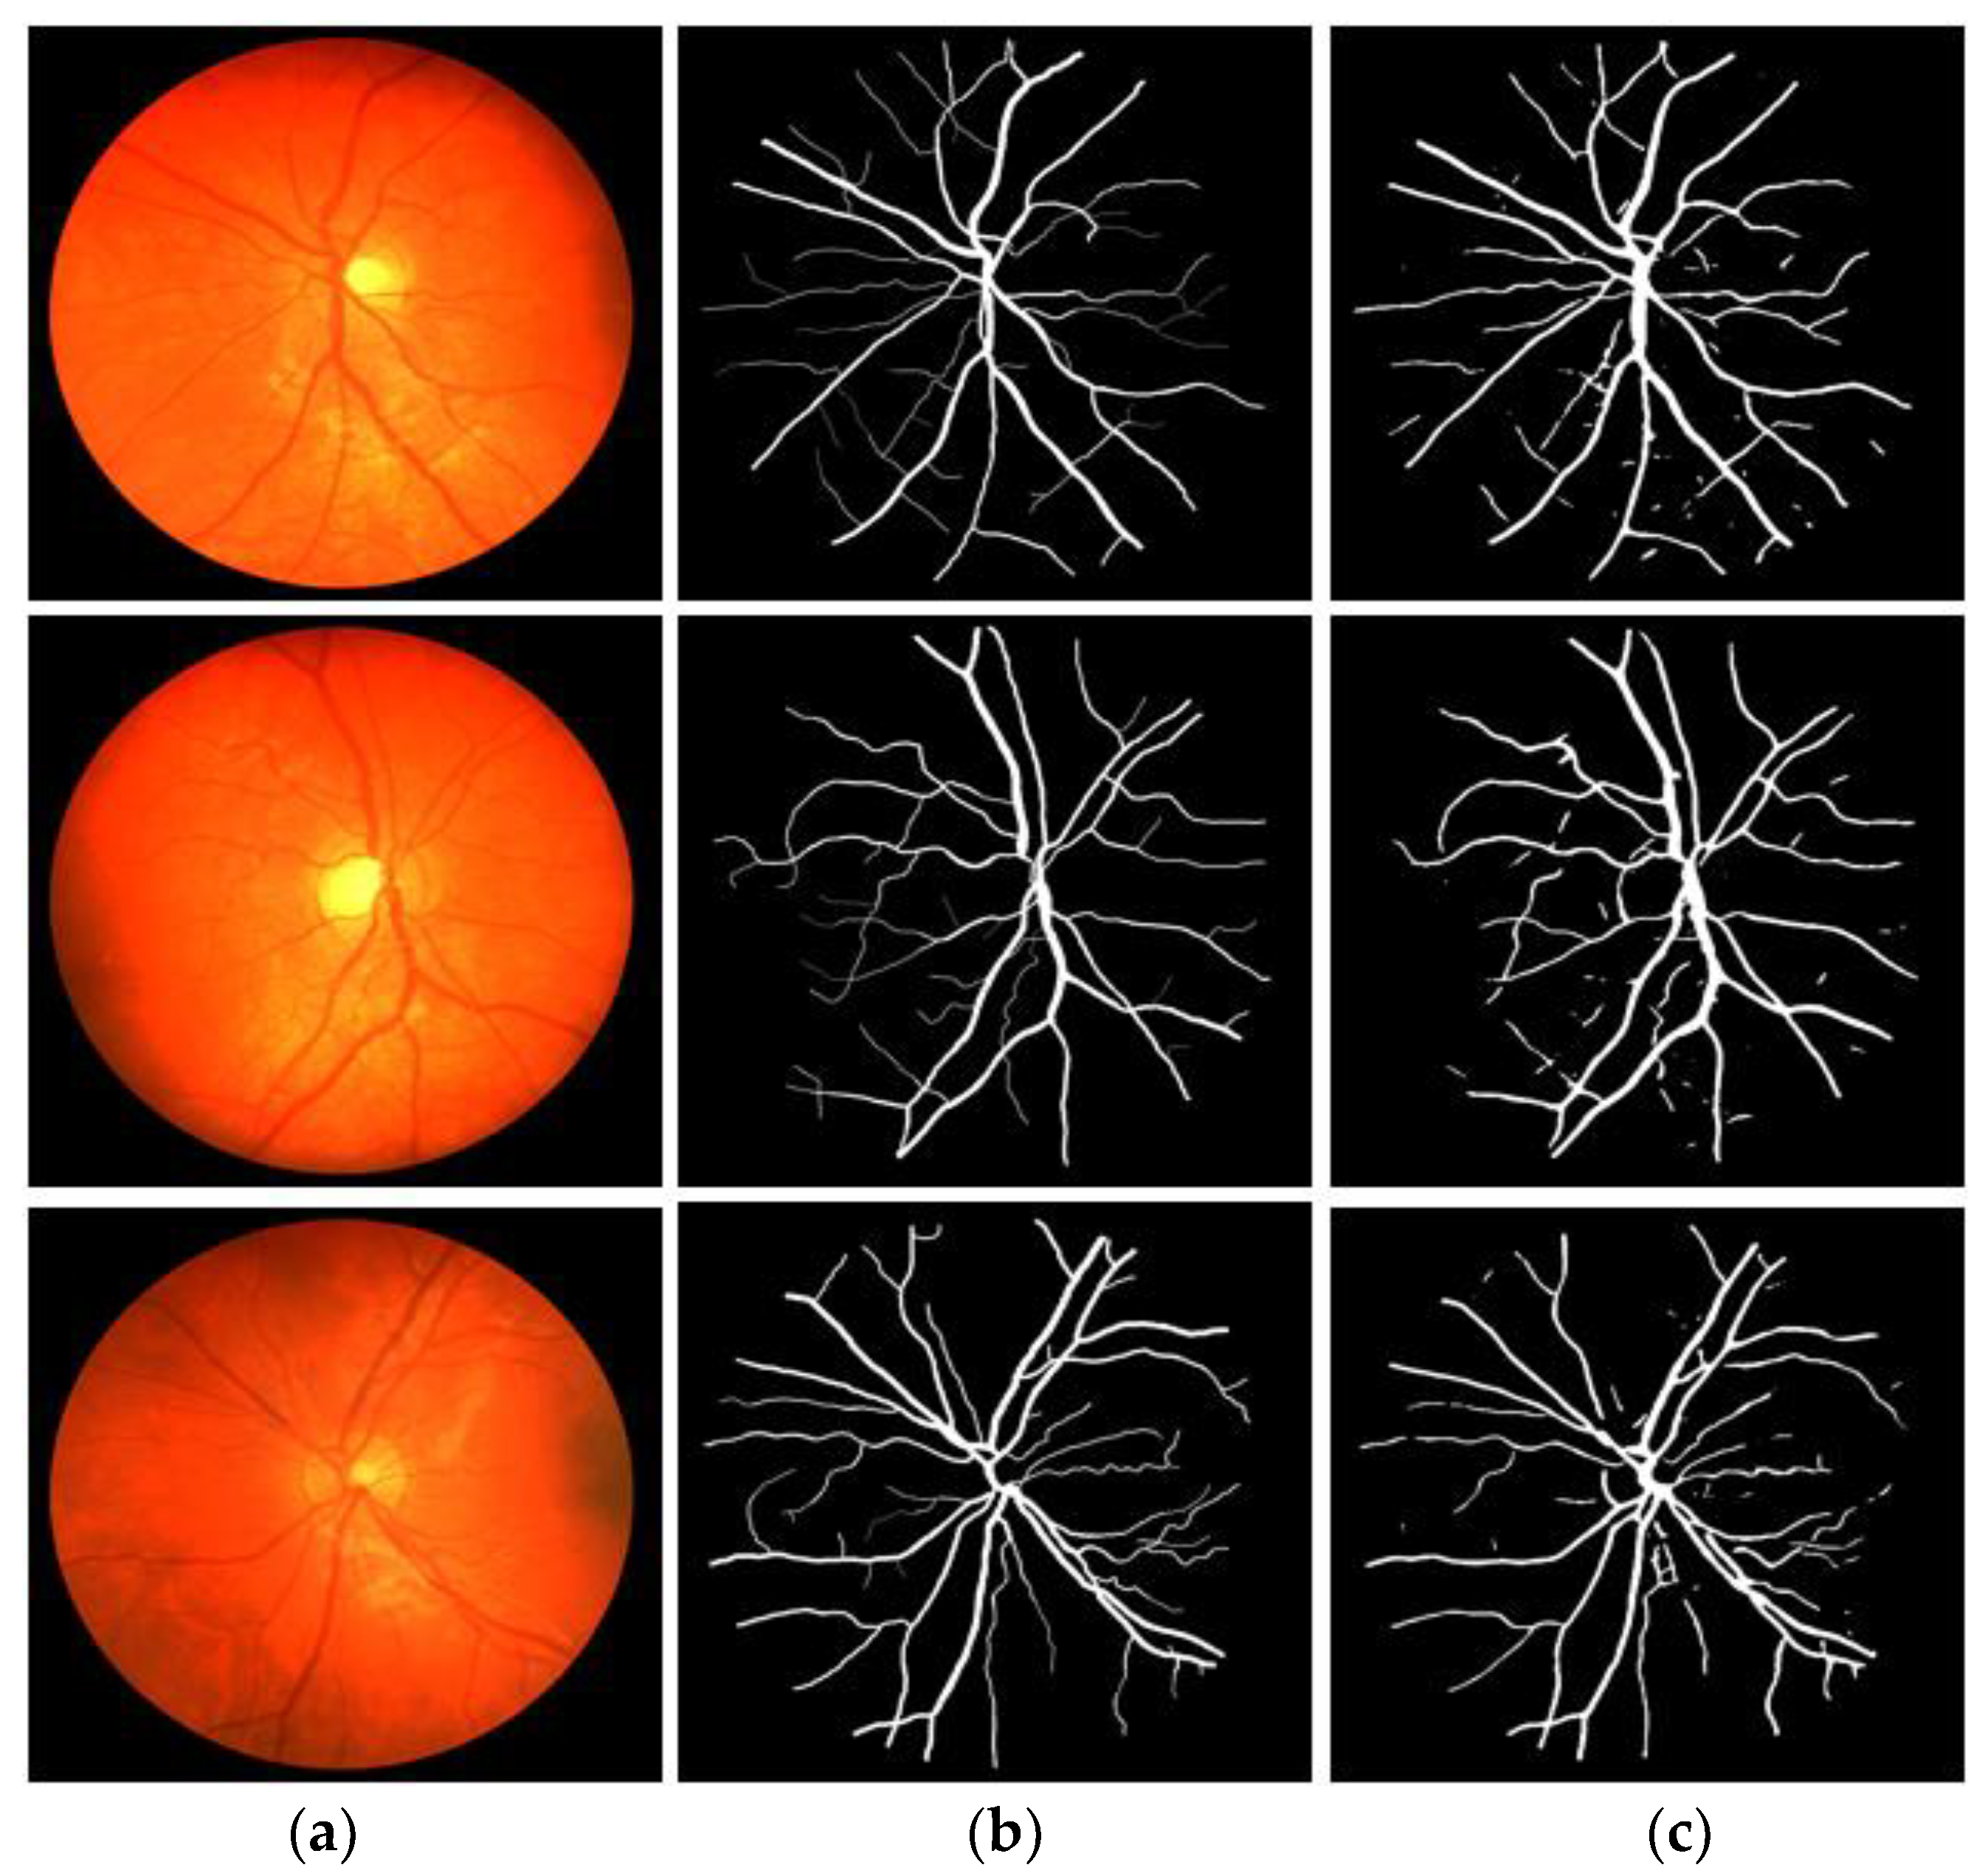
In our experiments, we used three publicly available datasets, namely, DRIVE [58], CHASE-DB1 [59], and STARE [60]. The DRIVE [58] dataset consists of 40 RGB images with pixel-wise expert annotations of retinal vessels. The images were captured using a Canon CR5 fundus camera (45° field of view (FOV)). The DRIVE dataset was provided with a predefined official data split of 20 training and 20 testing images. The CHASE-DB1 [59] dataset consists of 28 RGB images with pixel-wise expert annotations of retinal vessels. The images were captured using a Nidek NM-200D fundus camera (30° FOV). The CHASE-DB1 dataset was provided with a predefined official data split of the first 20 images for training and the remaining eight images for testing. The STARE [60] dataset consists of 20 RGB images with pixel-wise expert annotations of retinal vessels. The images were captured using a TopCon TRV-50 fundus camera (35° FOV). For the STARE dataset, we performed leave-one-out cross-validation, in which 19 images were used for training and one image for testing, and 20 experiments were performed independently for each testing image. The final result was obtained by averaging the 20 experimental results. Figure 4a–c shows example images and expert annotations taken from the DRIVE, CHASE-DB1, and STARE datasets, respectively. Table 4 summarizes the experimental details for each dataset used in our experiments. Further details can be found in [58,59,60] for DRIVE, CHASE-DB-1, and STARE, respectively.
4.2. Data Augmentation
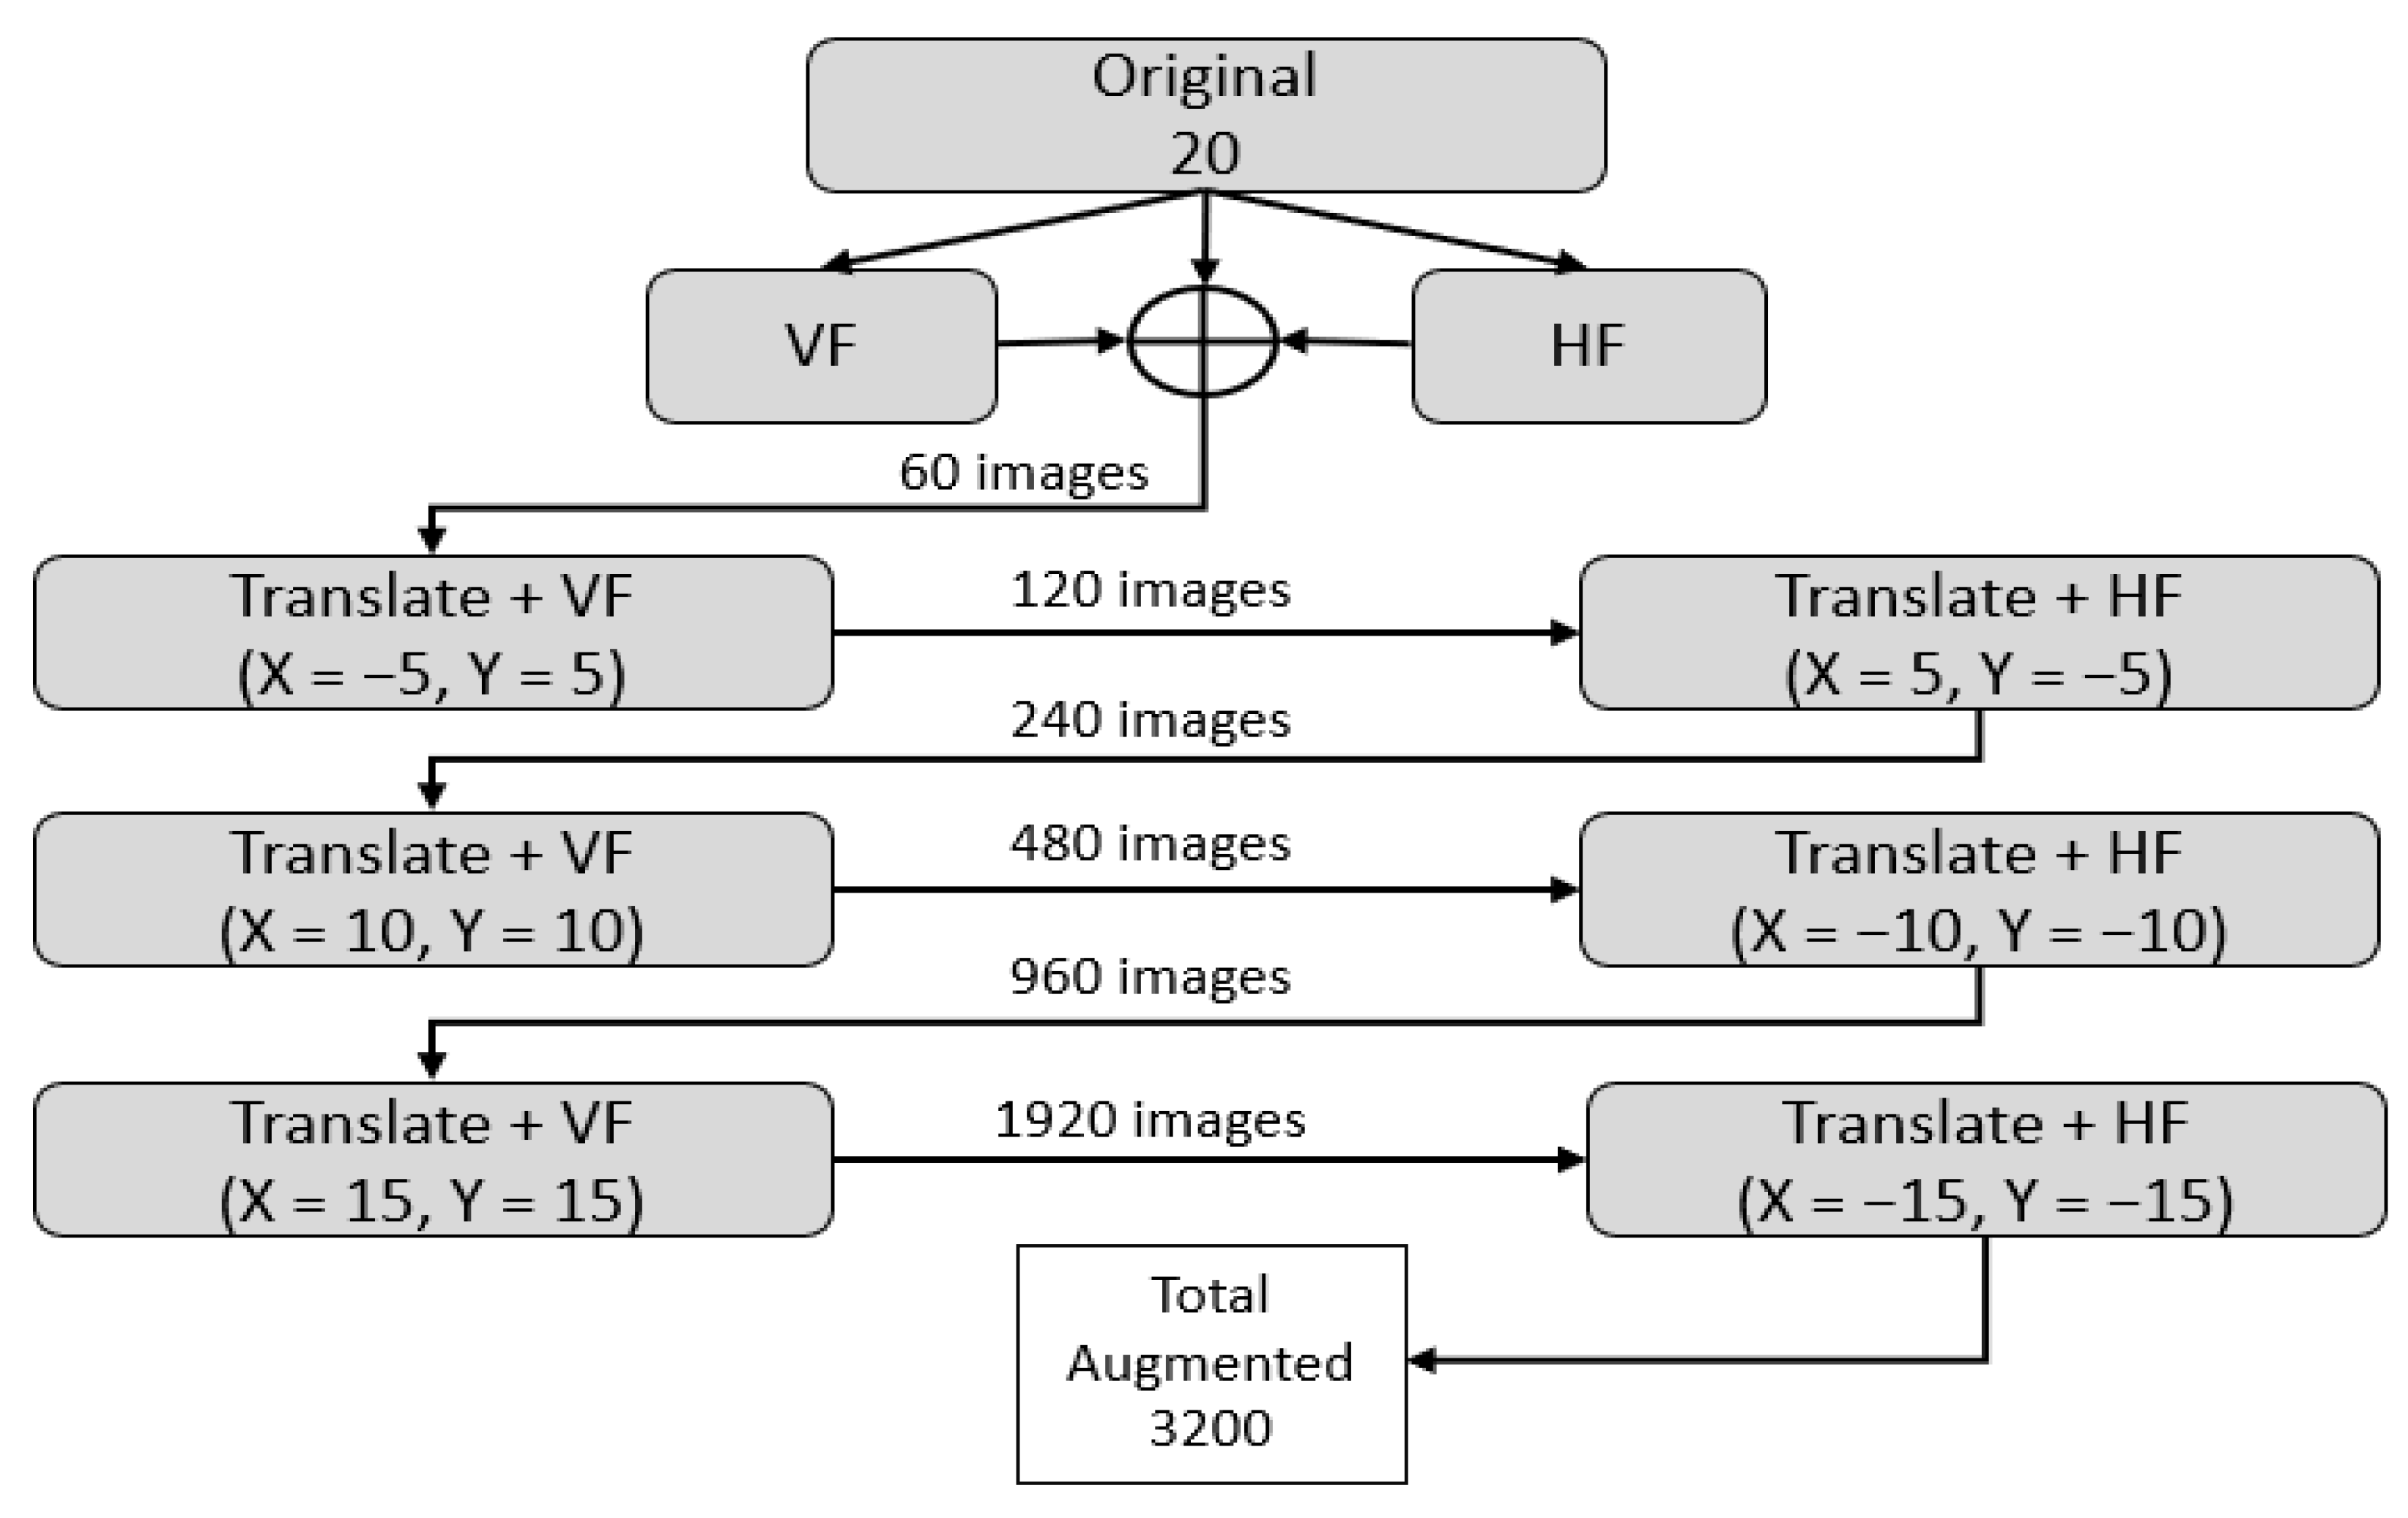
The segmentation performance of deep learning is directly related to the amount of labeled training data; successful training requires a significant quantity of labeled training data. Therefore, we utilized image flipping and translation to increase the amount of data. Figure 5 presents the adopted augmentation procedure, where 20 original images were flipped vertically and horizontally to create 60 images. Then, these 60 images were iteratively translated into both X and Y values combined with flipping to create 3200 images from the DRIVE dataset. The same augmentation approach was adopted for the CHASE-DB1 and STARE datasets to create 1280 and 1520 images, respectively.
4.3. Experimental Environment and Training of Proposed Method
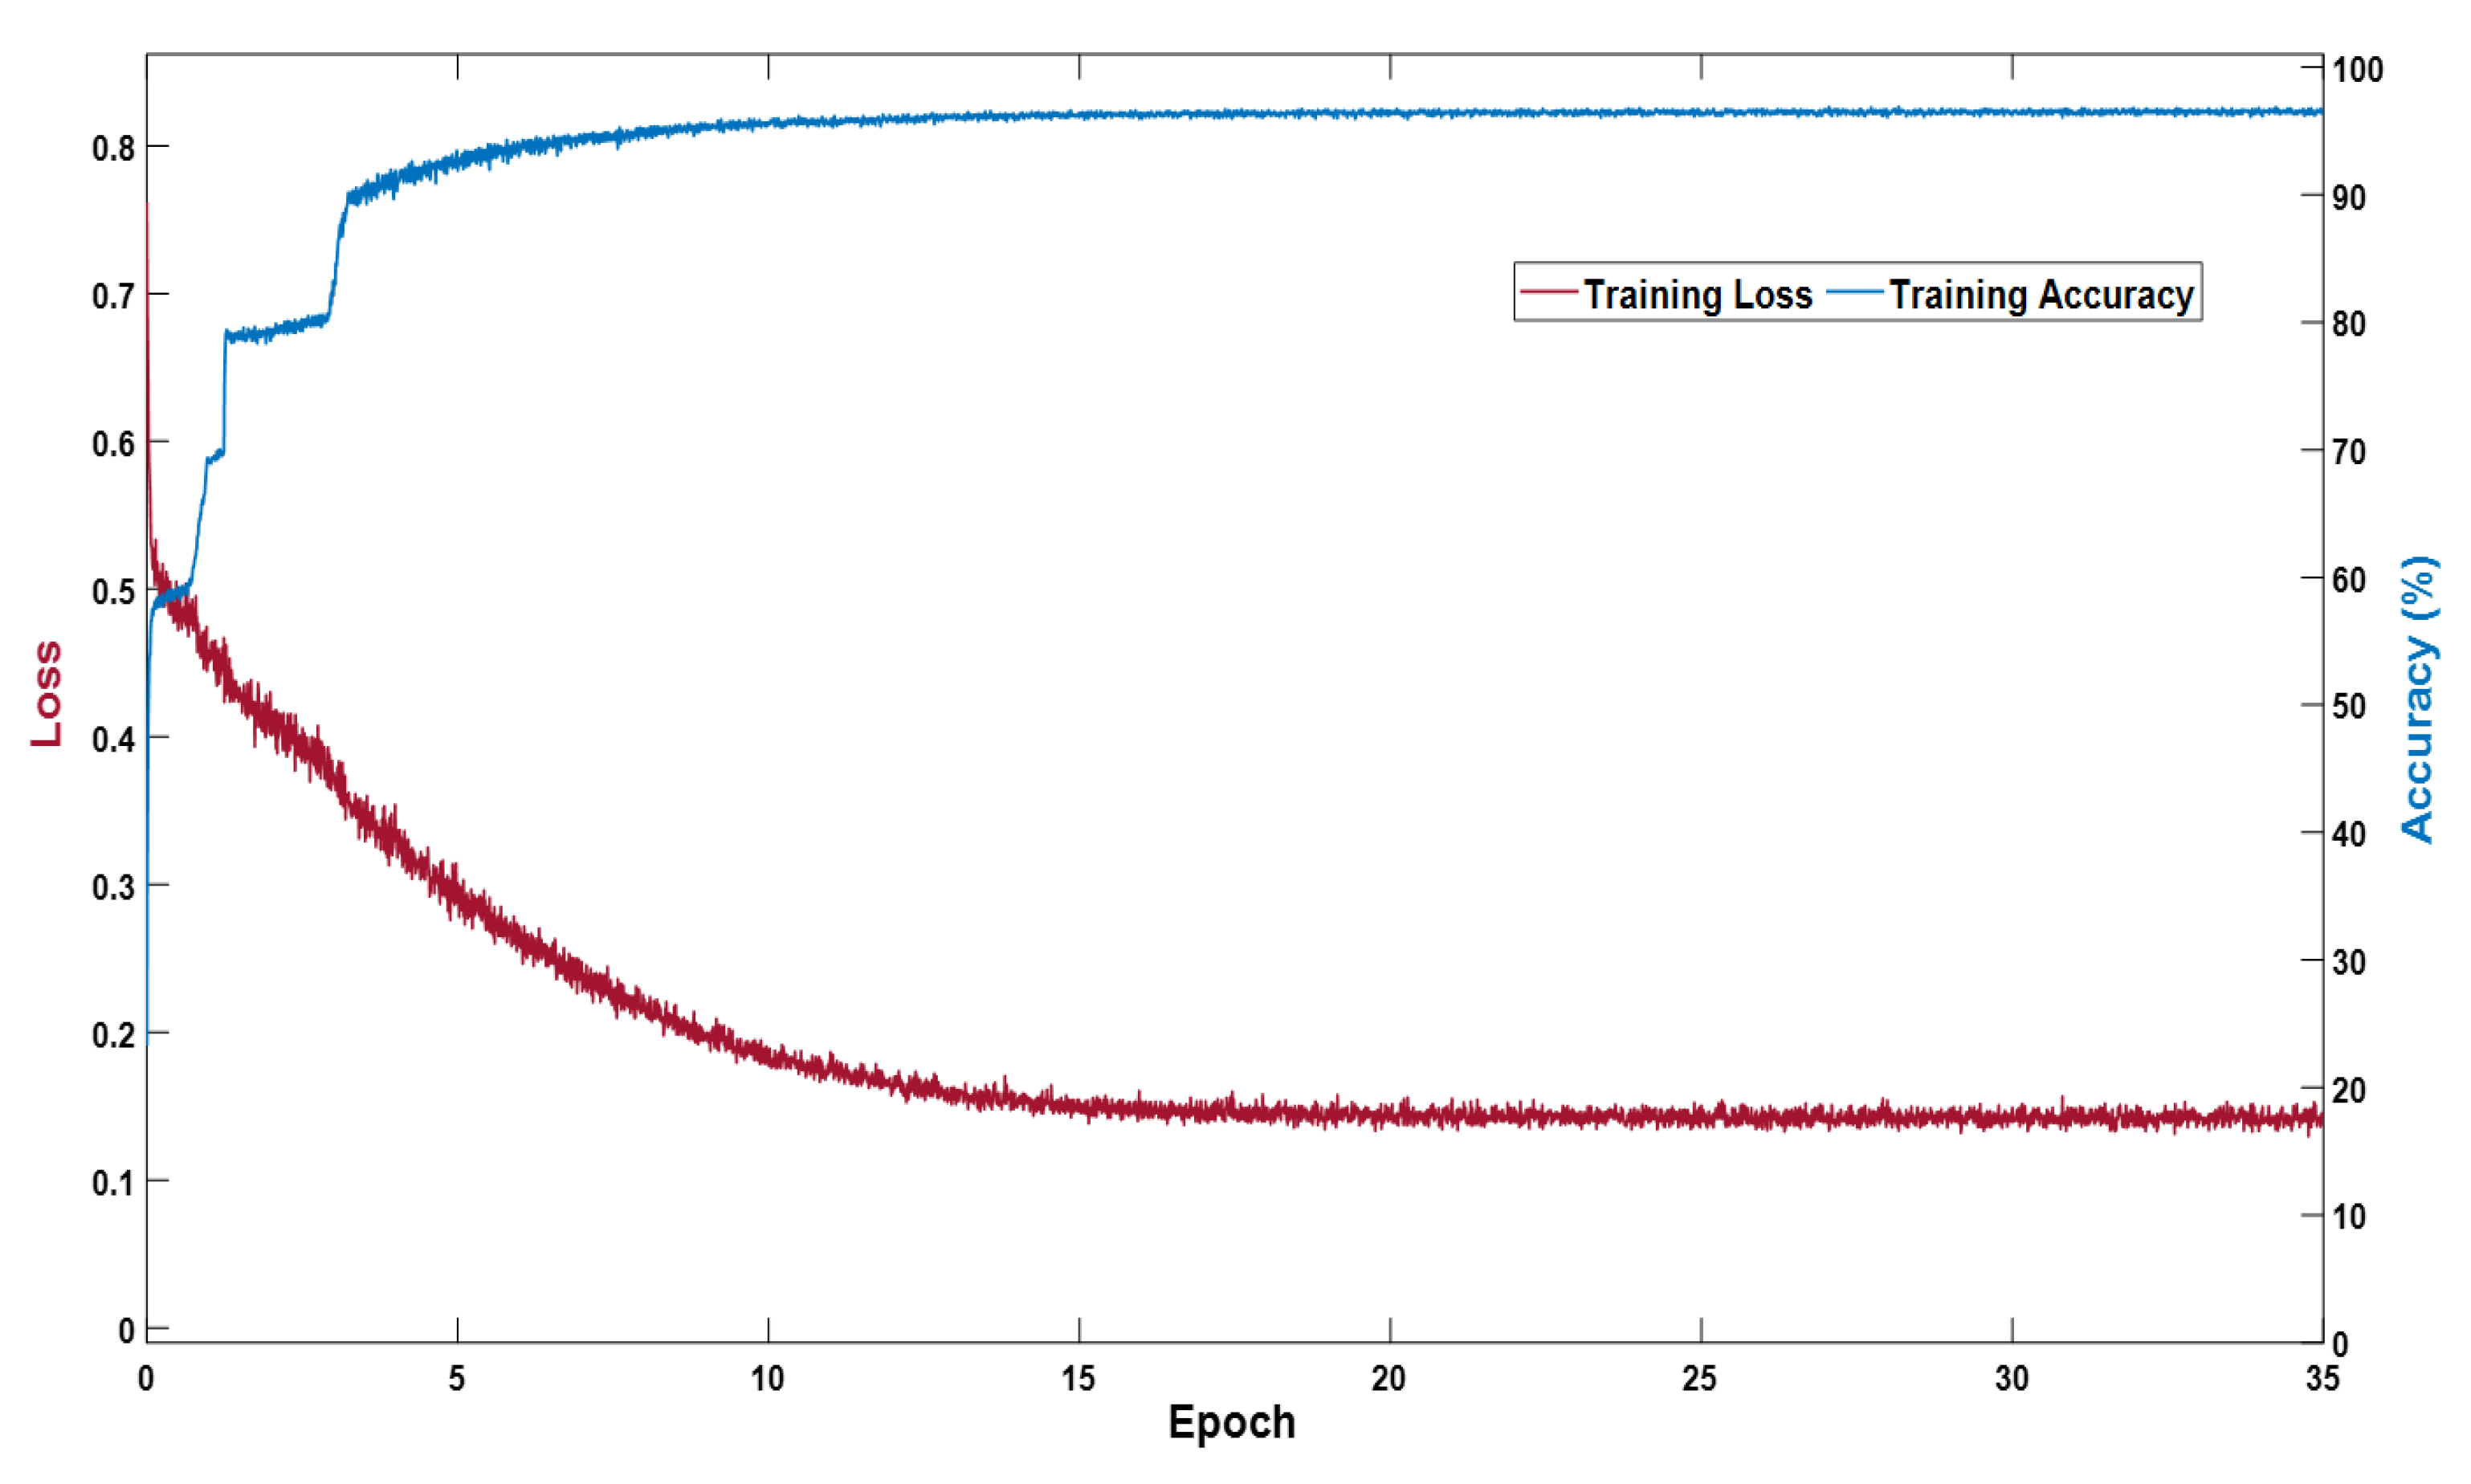
The proposed VSUL-Net architecture was implemented, trained, and tested using MATLAB 2021b on a desktop computer with an Intel® Core i7-3770K CPU, NVIDIA RTX 3080 GPU, and 28 GB of RAM. The proposed method was trained from scratch without using weight initialization, migration, or transfer learning. Adam optimizer [61] was adopted to train 35 epochs of training using an initial learning rate of 0.0001 and an epsilon of 0.000001 with global L2-normalization. We picked the optimal models with parameters that were with the lowest training loss and highest training accuracy. In our experiments, we shuffled the images for each epoch. Figure 6 depicts the training accuracy and loss curves of the VSUL-Net experiment using the DRIVE dataset. The curves demonstrate that our proposed network achieved high training accuracy and low training loss.
4.4. Evaluation of Proposed Method
VSUL-Net provides a mask for the network output. This mask represents all the vessel and background pixels as “1” and “0”, respectively. To measure the segmentation performance, the output mask of the proposed network was compared with expert annotations to compute the segmentation performance using sensitivity (Sen), specificity (Spe), accuracy (Acc), and area under the curve (AUC), which are commonly used to evaluate the segmentation performance of retinal images [19]. Sen is the true positive rate that shows how good the model is to detect vessel pixels. Spe is the true negative rate that shows the ability to detect the non-vessel pixels. Acc represents the overall number of correct predictions by the method. Sen, Spe, and Acc are expressed by Equations (4)–(6), respectively. TP denotes a pixel that is predicted as a vessel pixel and is categorized as a vessel pixel in the expert annotation. FN denotes a pixel that is predicted as a background pixel and is categorized as a vessel pixel in the expert annotation. TN denotes a pixel that is predicted as a background pixel and is categorized as a background pixel in the expert annotation. FP denotes a pixel that is predicted as a vessel pixel and is categorized as a background pixel in the expert annotation.
4.5. Ablation Study for Proposed VSUL-Net
The initial layers of the network contain low-level valuation features that contain edge information. Importing this information through skip connections aids the convergence of the network by reducing the vanishing gradient problem [62]. Dense connectivity [63] reduces feature latency and performs better than residual networks [62]. An ablation study was conducted to compare the performance of residual and dense connectivity for the proposed network. In the ablation experiments, the VSUL-Net structure was trained using element-wise addition (VSUL-Net-R) and depth-wise concatenation (VSUL-Net-D). Table 5 reports that VSUL-Net with dense connectivity performed better, with a higher true positive rate (Sen) compared to the residual one keeping the same number of parameters.
4.6. Comparison of Proposed Method with Existing Schemes
This section compares the proposed method with existing vessel segmentation schemes. Table 6, Table 7 and Table 8 list numerical comparison results with the DRIVE, CHASE-DB1, and STARE datasets, respectively. The comparisons were performed based on the Sen, Spe, Acc, and AUC metrics described in Section 4.4. Most of the methods that are provided in Table 6, Table 7 and Table 8 only provided the numerical results by describing the number of trainable parameters. A few methods have provided details of trainable parameters, which is an important parameter to judge the network’s cost and its resource utilization along with the performance measures provided in Section 4.4. Considering this fact, the proposed method provided high sensitivity in combination with other metrics for all three datasets presented in Table 6, Table 7 and Table 8. The method presented by Soomro et al. [64] was based on SegNet, which is a famous semantic segmentation network, but the performances for the Sen, Spe, Acc, and AUC were 74.60%, 91.70%, 94.80%, and 94.60%, which were lower than the proposed VSUL-Net while using 29.4 million trainable parameters. Lv et al. [65] presented two methods of U-Net, and AA-UNet, where it can be seen from Table 6 and Table 8, that for the DRIVE dataset, both U-Net and AA-UNet provided lower Sen, Spe, Acc, and AUC of 78.49%, 98.02%, 95.54%, 97.19%, and 79.41%, 97.98%, 95.58%, and 98.24%, respectively, which were lower compared to the proposed VSUL-Net. In the case of CHASE-DB1, the Sen of U-Net and AA-UNet was slightly higher, but considering other metrics, the Spe, and AUC were lower than the proposed VSUL-Net with only 0.37 million trainable parameters where U-Net and AA-UNet consumed 31.03 million and 28.28 million trainable parameters, respectively. Considering Vess-Net [14], a relative with a lower number of parameters achieved Sen, Spe, and AUC of 80.22%, 98.21%, and 96.27% respectively, where the Sen was lower than that proposed, which consumed much fewer trainable parameters. Very few researchers have focused on utilizing shallower architectures because as the network depth decreases, the performance of the network also deteriorates. Li et al. proposed LACNN [66], which only consumes 0.4 million trainable parameters with few layers. It can be noticed from Table 6, Table 7 and Table 8, that LACNN provided better segmentation performance compared to many famous studies described in the same tables, but with an effective architecture, the proposed VSUL-Net provided a much better Sen, Spe, Acc, and AUC for all three datasets. The DSF-Net and DSA-Net are effective shallow architectures that performed better than LACNN and other famous methods listed in Table 6 and Table 8 with a better true positive rate, but the proposed VSUL-Net provided further enhanced Sen. The Spe with DSF-Net and DSA-Net was slightly high but the number of trainable parameters was much higher than the proposed VSUL-Net.
To prove the effectiveness of a model, a 2-tailed t-test [67] can be performed that can compare two methods. According to Table 4, the training and testing images were pre-defined for just one experiment for the DRIVE and CHASE-DB1 datasets according to the database providers, and we followed this experimental protocol for fair comparisons with the previous research available in Table 6 and Table 7. The results available in Table 6 and Table 7 were taken from the corresponding papers, therefore, statistical testing such as the ANOVA test or t-tests with DRIVE and CHASE-DB1 cannot be performed due to the unavailability of variance.
However, the training and testing images are not pre-defined in the STARE dataset, according to the database providers. Therefore, as shown in Table 4, the STARE dataset includes 20 experiments with leave-one-out cross-validation (following the same experimental protocol for fair comparisons with the previous research available in Table 8), and consequently, there exists variances to perform statistical testing. Nevertheless, the accuracies of all the previous research, except for the second-best one [20] in Table 8, were also referred to in corresponding papers, and we used the same STARE dataset and experimental protocols as those used by the previous researchers presented in Table 8. Consequently, there was no reported variance in the accuracies by their methods except for the second-best one [20]. However, we performed the experiments with the algorithm of the method [20] implemented by us, so we could obtain the variance from all 20 experiments.
The ANOVA test is usually used to statistically compare the differences of more than two methods (observations) [68,69]. Because no variance was available for the methods except for the second-best one [20] in Table 8, it was not possible to perform the ANOVA test. As the t-test offers the statistical comparison of two methods (observations), we only performed the t-test between the proposed VSUL-Net and the second-best one of DSA-Net [20].
Table 9 presents a 2-tailed t-test [67] comparison between the proposed method and the second-best method [20] for the STARE dataset in Table 8. The t-test is generally performed to enlighten the performance difference of two models quantitatively using a null hypothesis (H), which assumes that the two models have a similar performance (i.e., H = 0). A hypothesis rejection score (p-value) was calculated with a confidence score for the rejection of the null hypothesis. The proposed method rejected the null hypothesis with a confidence score of 93.6%, 98.8%, and 99.9% for Sen, Spe, and Acc, respectively, which confirmed that our method outperformed the second best one [20] in a statistical manner.
Table 6.
Numerical comparison of the proposed VSUL-Net with existing methods for the DRIVE dataset.
| Method | Sen | Spe | Acc | AUC | #Pram |
|---|---|---|---|---|---|
| Soomro et al. SegNet [64] | 74.60 | 91.70 | 94.80 | 94.60 | 29.4 |
| Lv et al. U-Net [65] | 78.49 | 98.02 | 95.54 | 97.19 | 31.03 |
| Lv et al. AA-UNet [65] | 79.41 | 97.98 | 95.58 | 98.24 | 28.25 |
| Arsalan et al. Vess-Net [14] | 80.22 | 98.10 | 96.55 | 98.20 | 9.7 |
| Samuel et al. VSSCNet [53] | 78.27 | 98.21 | 96.27 | - | 8.0 |
| Zhang et al. BIWT [70] | 78.95 | 97.01 | 94.63 | - | - |
| Zhang et al. BIWT (postprocessing) [70] | 78.61 | 97.12 | 94.66 | - | - |
| Tan et al. Single CNN [71] | 75.37 | 96.94 | - | - | - |
| Zhu et al. EML [72] | 71.40 | 98.68 | 96.07 | - | - |
| Girard et al. [73] | 78.40 | 98.10 | 95.7 | 97.20 | - |
| Hu et al. MCNN [51] | 77.72 | 97.93 | 95.33 | 97.59 | - |
| Fu et al. DeepVessel [74] | 76.03 | - | 95.23 | - | - |
| Wang et al. C-CNN [75] | 76.48 | 98.17 | 95.41 | - | - |
| Soomro et al. BS-CNN [64] | 74.60 | 91.70 | 94.60 | 83.10 | - |
| Chudzik et al. DISCERN [44] | 78.81 | 97.41 | - | 96.46 | - |
| Yan et al. 3-stage DL [50] | 76.31 | 98.20 | 95.38 | 97.50 | - |
| Soomro et al. FCNN [76] | 73.90 | 95.60 | 94.8 | 84.40 | - |
| Jin et al. DUNet [33] | 79.63 | 98.00 | 95.66 | 98.02 | - |
| Leopold et al. [77] | 69.63 | 95.73 | 91.06 | 82.68 | - |
| Wang et al. PixelBNN [78] | 79.86 | 97.36 | 95.11 | 97.40 | - |
| Feng et al. CCCN [49] | 76.25 | 98.09 | 95.28 | 96.78 | - |
| Oliveira et al. FCNN [47] | 80.39 | 98.04 | 95.76 | 98.21 | - |
| Guo et al. Image BTS-DSN [48] | 78.00 | 98.06 | 95.51 | 97.96 | - |
| Guo et al. Patch BTS-DSN [48] | 78.91 | 98.04 | 95.61 | 98.06 | - |
| Khan et al. VessSeg [79] | 82.55 | 97.60 | 96.20 | 97.30 | - |
| Kromm et al. ICN [52] | 76.51 | 98.18 | 95.47 | 97.50 | - |
| Li et al. LACNN [66] | 79.21 | 98.10 | 95.68 | 98.06 | 0.4 |
| Arsalan et al. DSF-Net [20] | 81.94 | 98.38 | 96.93 | 98.30 | 1.5 |
| Arsalan et al. DSA-Net [20] | 82.68 | 98.30 | 96.93 | 98.42 | 1.5 |
| Width-wise bifurcation [80] | 81.25 | 97.63 | 96.10 | - | - |
| Zhang et al. RU-Net [81] | 78.31 | 98.02 | 95.47 | 98.05 | - |
| Zhang et al. Bridge-Net [81] | 78.53 | 98.18 | 95.65 | 98.34 | - |
| Zhang et al. [39] | 82.13 | 98.07 | 96.15 | 98.15 | - |
| VSUL-Net (Proposed) | 83.80 | 98.21 | 96.95 | 98.54 | 0.37 |
Table 7.
Numerical comparison of the proposed VSUL-Net with existing methods for the CHASE-DB1 dataset.
Table 7.
Numerical comparison of the proposed VSUL-Net with existing methods for the CHASE-DB1 dataset.
| Methods | Sen | Spe | Acc | AUC | #Pram |
|---|---|---|---|---|---|
| Zhang et al. BIWT [70] | 77.86 | 96.94 | 94.97 | - | - |
| Zhang et al. BIWT (Postprocessing) [70] | 76.44 | 97.16 | 95.02 | - | - |
| Fu et al. DeepVessel [74] | 71.30 | - | 94.89 | - | - |
| Wang et al. C-CNN [75] | 77.30 | 97.92 | 96.03 | - | - |
| Yan et al. 3-stage DL [50] | 76.41 | 98.06 | 96.07 | 97.76 | - |
| Jin et al. DUNet [33] | 81.55 | 97.52 | 96.10 | 98.04 | - |
| Leopold et al. [77] | 86.18 | 89.61 | 89.36 | 87.90 | - |
| Lv et al. U-Net [65] | 83.99 | 96.98 | 95.77 | 97.80 | 31.03 |
| Lv et al. AA-UNet [65] | 81.76 | 97.04 | 96.08 | 98.65 | 28.25 |
| Oliveira et al. FCNN [47] | 77.79 | 98.64 | 96.53 | 98.55 | - |
| Image BTS-DSN [48] | 78.88 | 98.01 | 96.27 | 98.40 | - |
| Khan et al. VessSeg [79] | 82.91 | 97.30 | 96.20 | 97.65 | - |
| Li et al. LACNN [66] | 78.18 | 98.19 | 96.35 | 98.10 | - |
| Width-wise bifurcation [80] | 80.12 | 97.30 | 95.78 | - | - |
| RU-Net [81] | 81.03 | 98.40 | 96.65 | 98.86 | - |
| Bridge-Net [81] | 81.32 | 98.40 | 96.67 | 98.93 | - |
| VSUL-Net (Proposed) | 81.73 | 98.35 | 97.19 | 98.69 | 0.37 |
Table 8.
Numerical comparison of the proposed VSUL-Net with existing methods for the STARE dataset.
| Method | Sen | Spe | Acc | AUC | #Pram |
|---|---|---|---|---|---|
| Zhang et al. BIWT [70] | 77.24 | 97.04 | 95.13 | - | - |
| Zhang et al. BIWT (Postprocessing) [70] | 78.82 | 97.29 | 95.47 | - | - |
| Hu et al. MCNN [51] | 75.43 | 98.14 | 96.32 | 97.51 | - |
| Fu et al. DeepVessel [74] | 74.12 | - | 95.85 | - | - |
| Wang et al. C-CNN [75] | 75.23 | 98.85 | 96.40 | - | - |
| Soomro et al. FCNN [64] | 74.8 | 92.2 | 94.8 | 83.5 | - |
| Chudzik et al. DISCERN [44] | 82.69 | 98.04 | - | 98.37 | - |
| Hajabdollahi et al. CNN [82] | 78.23 | 97.70 | 96.17 | - | - |
| Hajabdollahi et al. Q-CNN [82] | 77.92 | 97.40 | 95.87 | - | - |
| Hajabdollahi et al. PQ-CNN [82] | 75.99 | 97.57 | 95.81 | - | - |
| Yan et al. 3-stage DL [50] | 77.35 | 98.57 | 96.38 | 98.33 | - |
| Soomro et al. FCNN [76] | 74.8 | 96.2 | 94.7 | 85.5 | - |
| Jin et al. DUNet [33] | 75.95 | 98.78 | 96.41 | 98.32 | - |
| Leopold et al. [77] | 64.33 | 94.72 | 90.45 | 79.52 | - |
| Wang et al. PixelBNN [78] | 79.14 | 97.22 | 95.38 | 97.04 | - |
| Feng et al. CCCN [49] | 77.09 | 98.48 | 96.33 | 97.0 | - |
| Oliveira et al. FCNN [47] | 83.15 | 98.58 | 96.94 | 99.05 | - |
| Arsalan et al. Vess-Net [14] | 85.26 | 97.91 | 96.97 | 98.83 | 9.7 |
| Guo et al. Image BTS-DSN [48] | 82.01 | 98.28 | 96.60 | 98.72 | - |
| Guo et al. Patch BTS-DSN [48] | 82.12 | 98.43 | 96.74 | 98.59 | - |
| Khan et al. VessSeg [79] | 83.18 | 97.58 | 96.23 | 97.58 | - |
| Li et al. LACNN [66] | 83.52 | 98.23 | 96.78 | 98.75 | - |
| Width-wise bifurcation [80] | 80.78 | 97.21 | 95.86 | - | - |
| Arsalan et al. DSA-Net [20] | 86.07 | 98.00 | 97.00 | 98.65 | 1.5 |
| Zhang et al. RU-Net [81] | 79.81 | 98.56 | 96.58 | 98.62 | - |
| Zhang et al. Bridge-Net [81] | 80.02 | 98.64 | 96.68 | 99.01 | - |
| VSUL-Net (Proposed) | 86.64 | 98.13 | 97.27 | 99.01 | 0.37 |
Table 9.
The t-test performance difference analysis (p-value and confidence score) for the STARE dataset.
Table 9.
The t-test performance difference analysis (p-value and confidence score) for the STARE dataset.
| Proposed VSUL-Net vs. DSA-Net [20] | Sen | Spe | Acc |
|---|---|---|---|
| p-Value | 0.064 | 0.012 | 0.001 |
| Confidence score (%) | 93.6 | 98.8 | 99.9 |
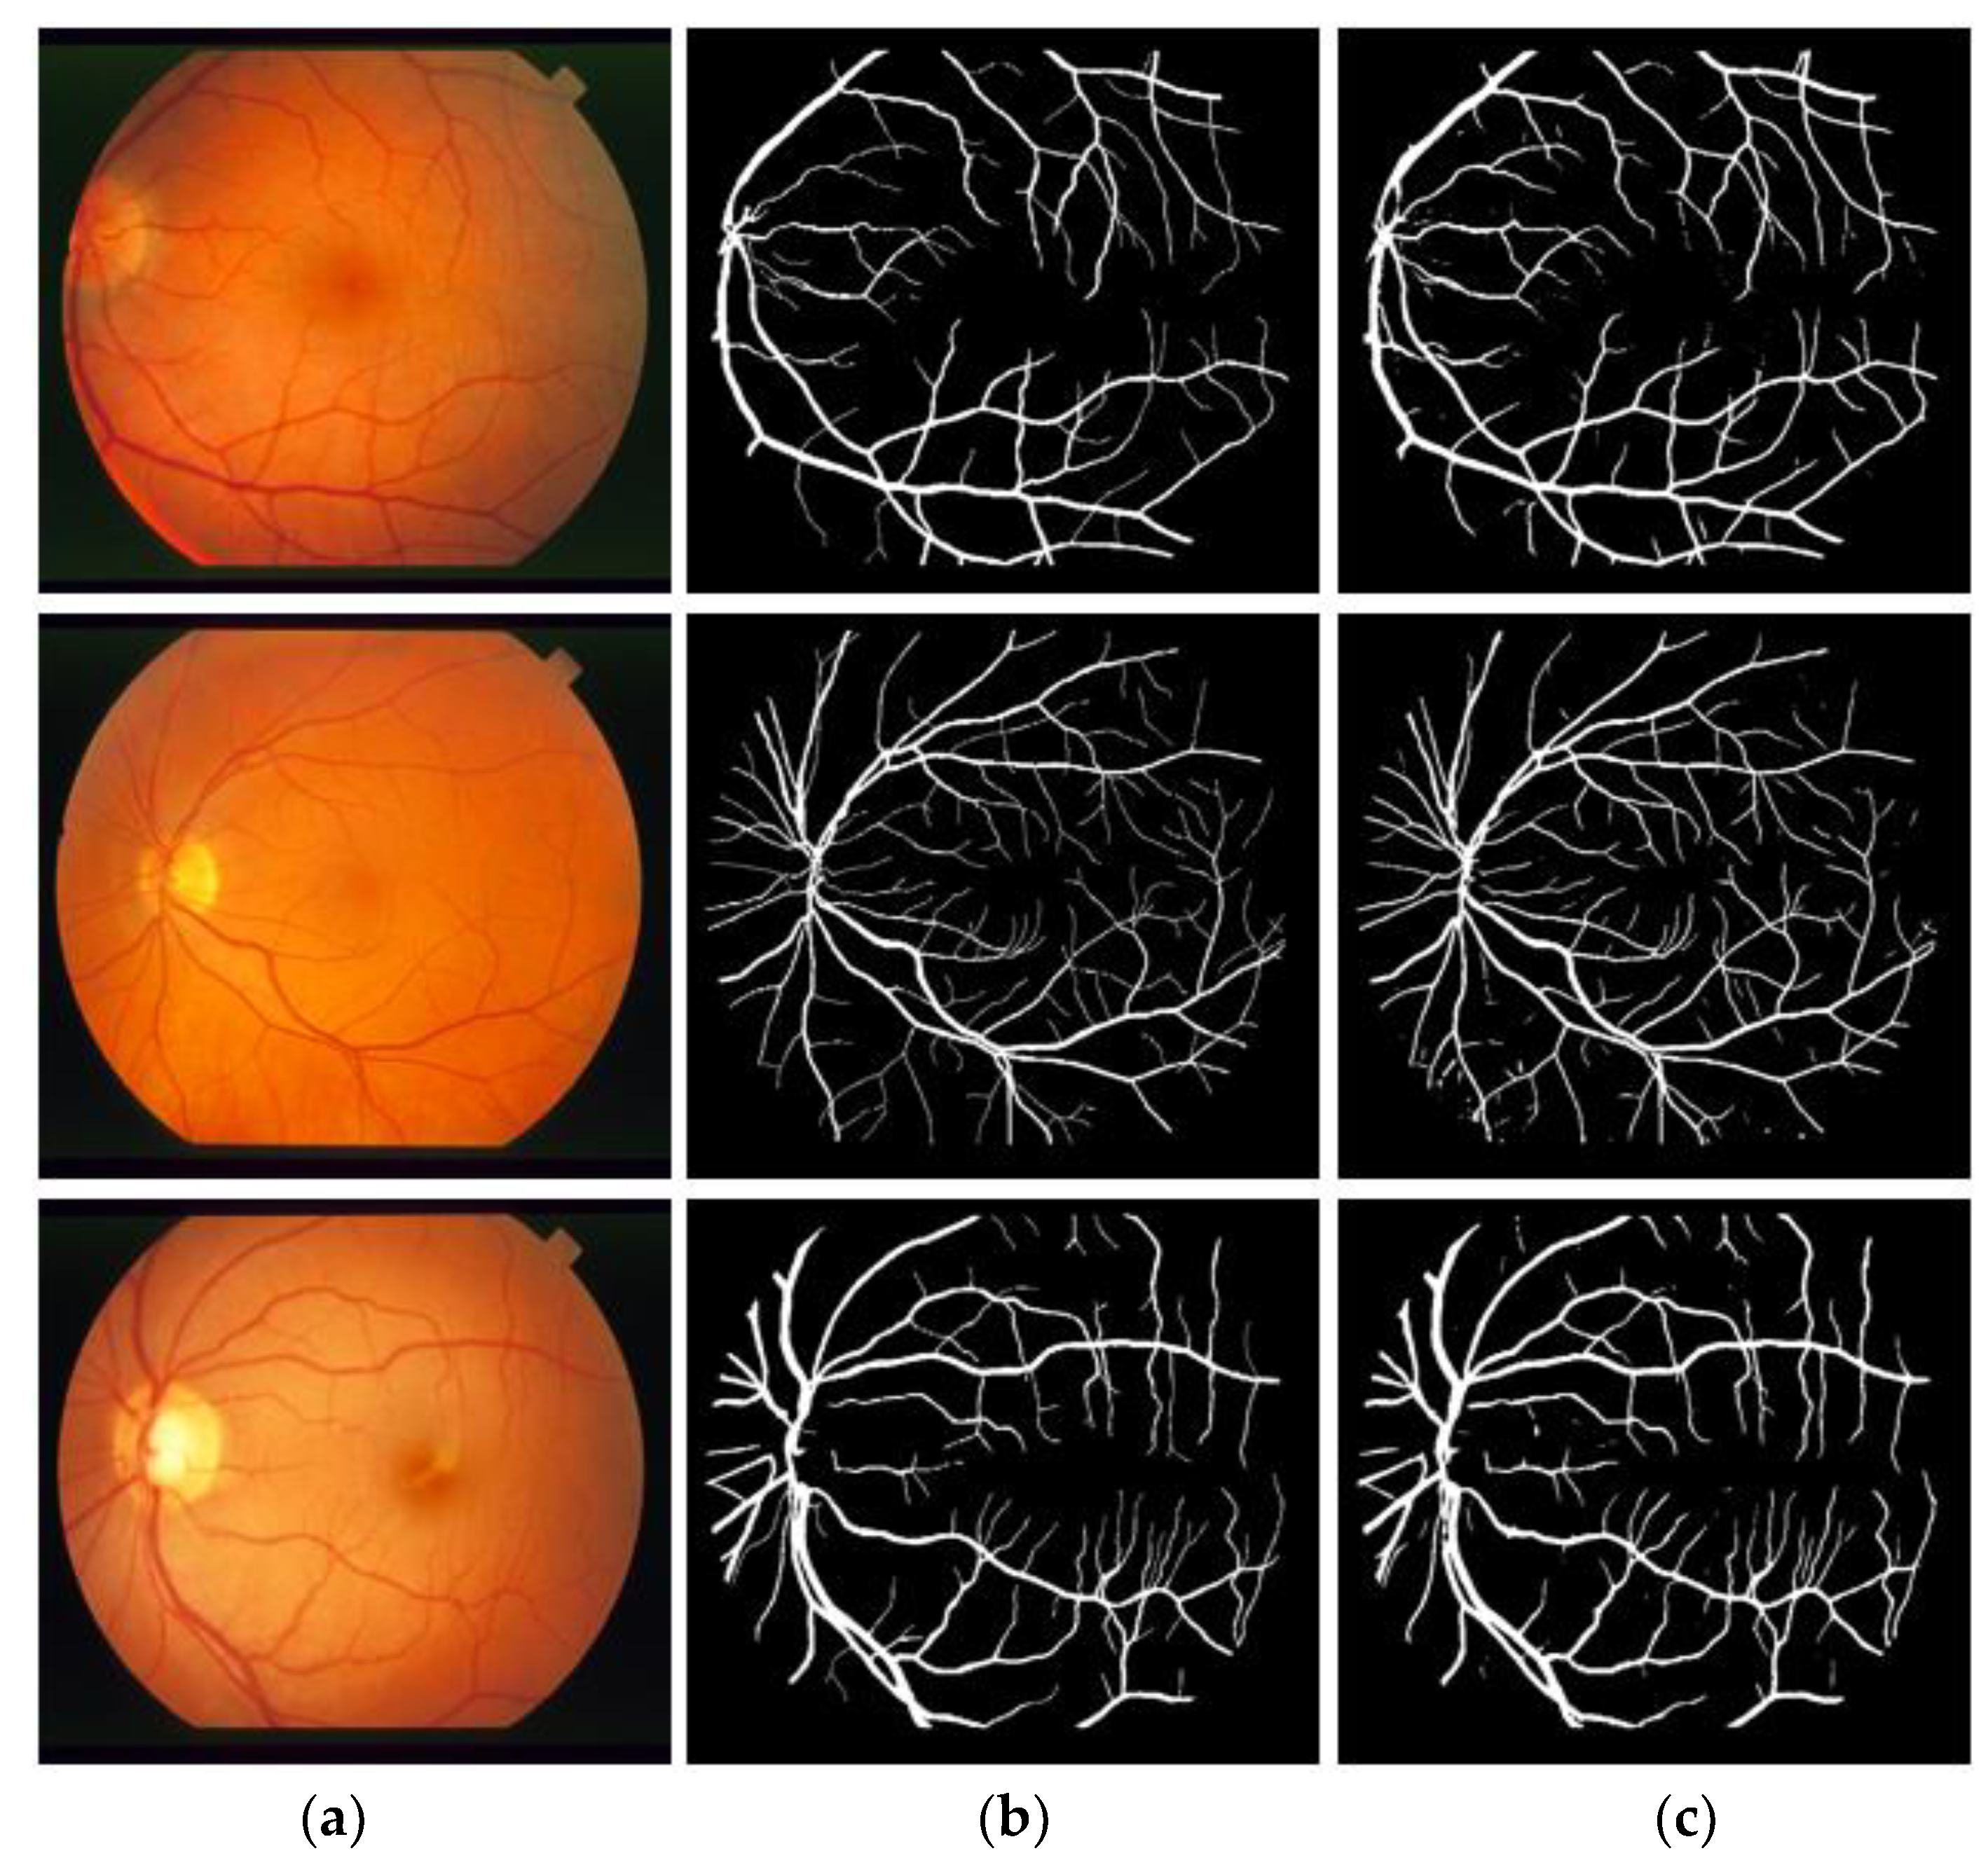
4.7. Visual Results of Proposed Method for Vessel Segmentation
The visual results provided by the proposed method on three publicly available fundus image datasets, DRIVE, CHASE-DB1, and STARE, for retinal vasculature detection, are presented in this section. Figure 7, Figure 8 and Figure 9 depict the vessel segmentation visual results obtained by the proposed VSUL-Net compared with expert annotation. Figure 7, Figure 8 and Figure 9 display the (a) input fundus image, (b) expert annotation, and (c) VSUL-Net predicted mask.
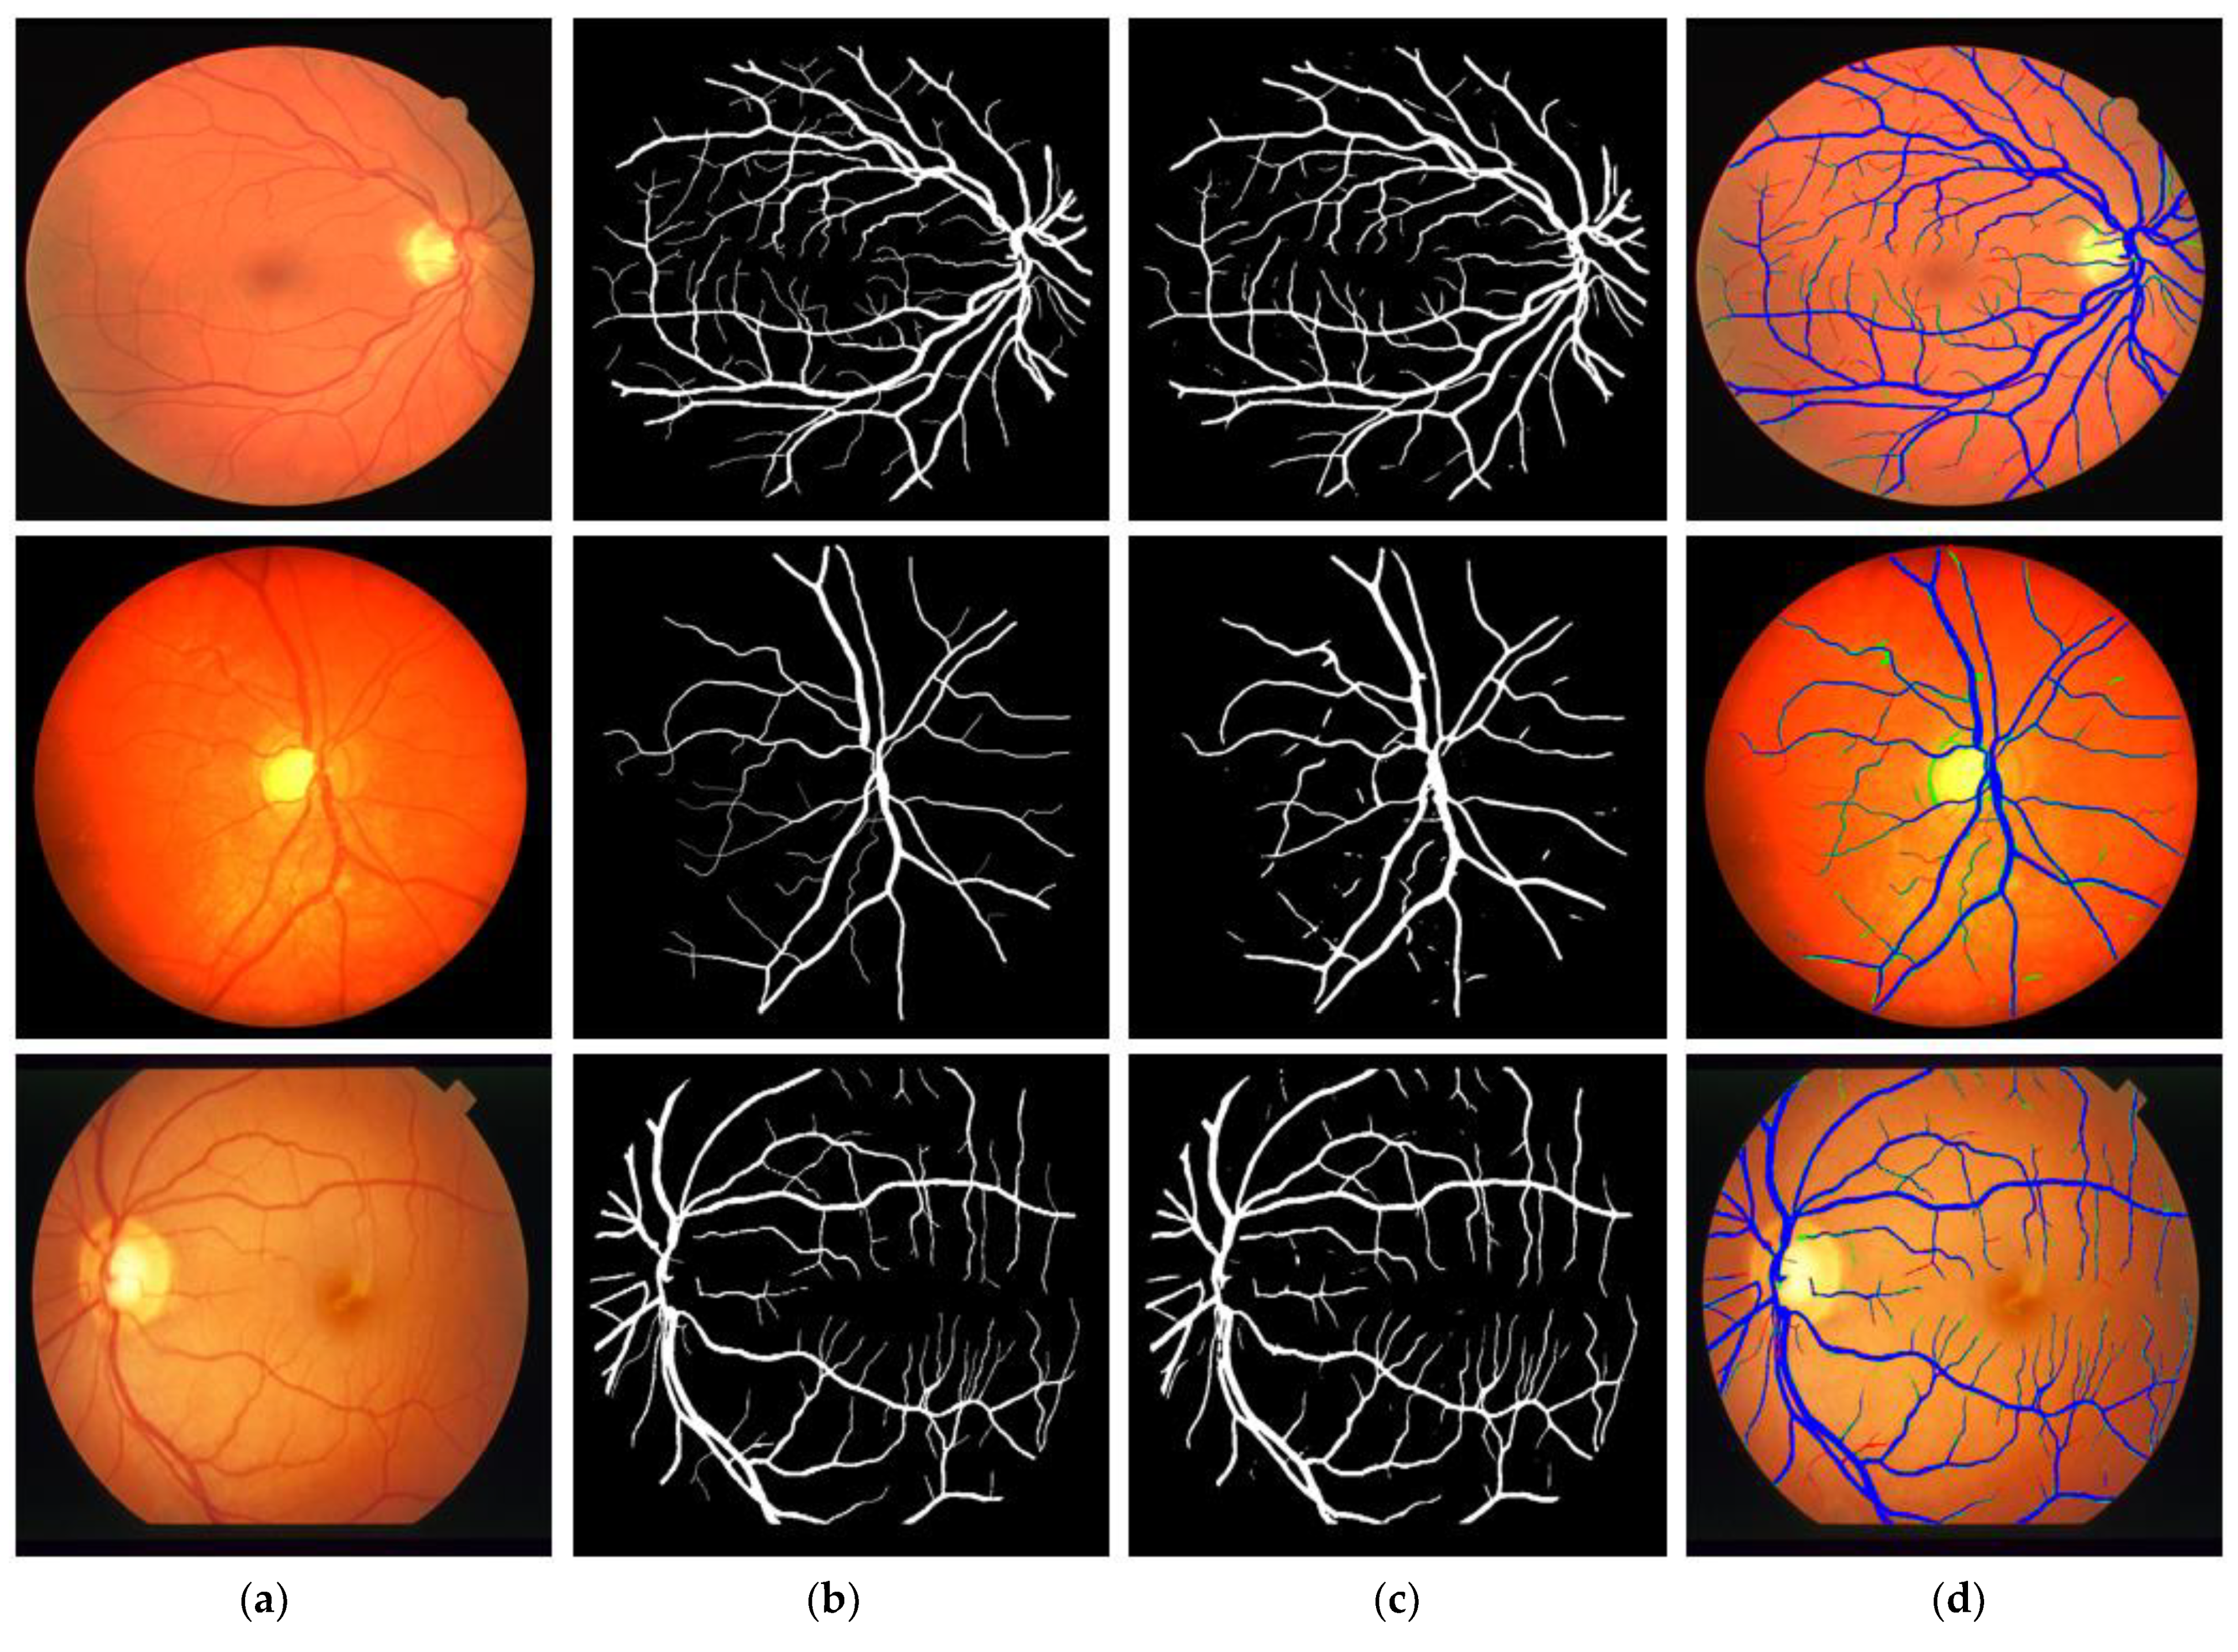
4.8. Discussion
The proposed VSUL-Net depends on the quality of the input data. Similar to other methods, the VSUL-Net is a learning-based method that learns the valuable features from the training data, and the quality and amount of data can affect the segmentation performance. As mentioned at the end of the Introduction section (Section 1), unlike other famous methods, the proposed VSUL-Net does not use any preprocessing schemes for image enhancement, which increases the overall cost of the system. The VSUL-Net uses the original image and provides pixel-wise segmentation of the retinal vessels. As the VSUL-Net is a learning-based system, there can be misses, discontinuities, and over-segmentation. Figure 10 presents example images of these misses, discontinuities, and over-segmentation based on TP, FP, and FN (defined in Section 4.4) for the DRIVE, CHASE-DB1, and STARE datasets (top to down) in comparison with expert annotation. According to Figure 10, the blue color represents the TP, the red color presents the FN (misses or discontinuities), and the green color presents the FP (over-segmentation). It can be noted from Figure 10d that most of the pixels (blue) belonged to TP and there existed errors (FN, FP) in the smaller vessels that were not clearly visible in the original image (Figure 10a). These misses and discontinuities were smaller compared to the existing approaches as shown by the better segmentation performance in Table 6, Table 7 and Table 8. These discontinuities can cause problems with the diagnosis. Therefore, the predicted mask by the proposed method cannot be used directly for disease diagnosis. This can be an alternative for aiding in ophthalmic analysis and can provide an opportunity for the ophthalmologist to detect the retinal morphology in a faster way to reduce the manual detection burden. The retinal diseases that are related to the central retinal vein or optic nerve head can be helped. Moreover, suspicious cases can be keenly verified by the medical specialist.
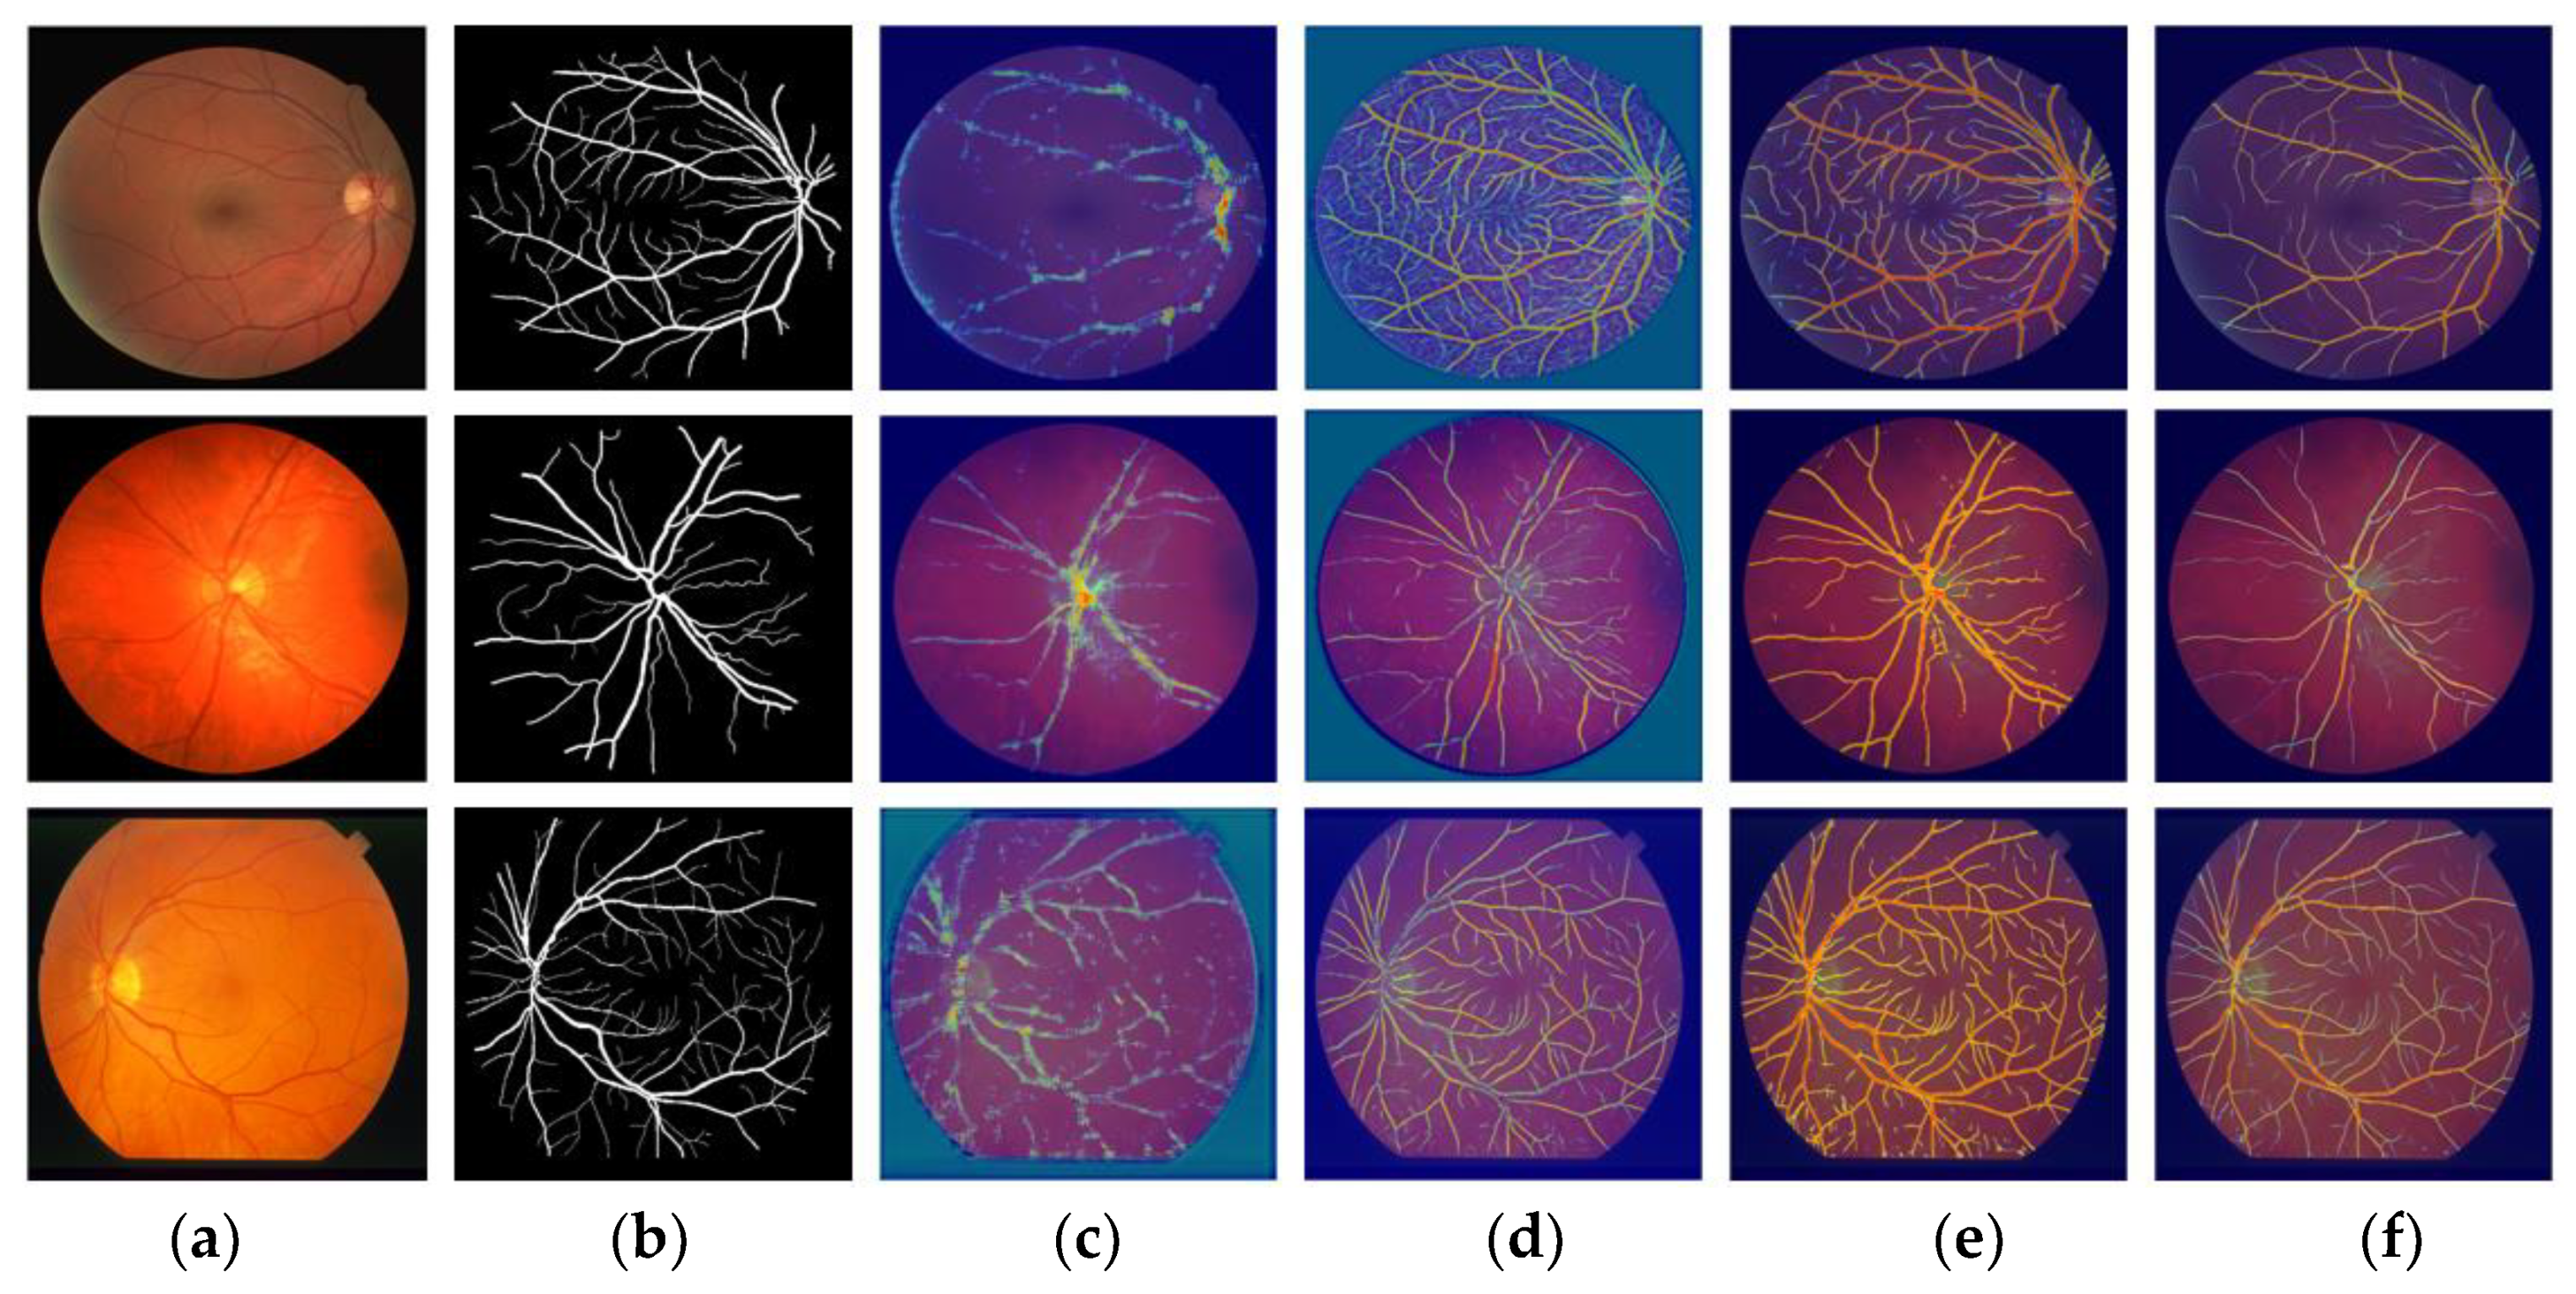
The prediction obtained from the network is based on specific features, which are important for the development of a robust segmentation network. The deep learning network behaves like a black box, without explaining the discriminative features that contribute to predicting a specific pixel label. Gradient-weighted class activation map (Grad-cam) [83] is a method for visualizing discriminative features that contribute to detecting vessel pixels from an image. In Grad-cam, a color close to red represents high-class confidence, whereas blue represents evidence of class presentation. Figure 11 shows examples of Grad-cam images taken from the DRIVE, CHASE-DB1, and STARE datasets. These Grad-cam images were extracted via the ReLU function of T-Conv-BB-A present in the backbone block (shown in Figure 11c), DW-Sep-Conv-RT-A present in the retention block (shown in Figure 11d), T-Conv-US-A present in the upsampling block (shown in Figure 11e), and Class-Mask-Conv located at the end of the network (shown in Figure 11f). The Grad-cam results show that our network gradually learns without bias.
4.9. Alternative for Aiding the Ophthalmic Analysis by Proposed Method
Retinal vessels are biomarkers of various ophthalmic and other diseases. Accurate pixel-wise detection of these retinal vessels can be an alternative in aiding with the ophthalmic analysis [5,6,7]. Accurate detection of the retinal vasculature helps ophthalmologists detect these diseases and identify changes, which are crucial for early diagnoses. The proposed VSUL-Net can be an alternative for aiding in ophthalmic analysis and can provide an opportunity for the ophthalmologist to detect the retinal morphology in a faster way. Suspicious cases can be keenly verified by the medical specialist for better diagnosis.
4.10. Limitations of the Proposed Method
Although the proposed VSUL-Net detects retinal vessels with superior segmentation performance, there are still certain limitations of the proposed method. The proposed VSUL-Net is a learning-based segmentation method that mainly relies on the input training data. The medical data for disease analysis are very difficult to arrange in quantity. Therefore, data augmentation is required to artificially increase the amount of training data. Moreover, the learning-based methods provide the output masks based on the learned knowledge, and there can exist misses (false negative) and false positive pixels in the final prediction of the network.
5. Conclusions
The main objective of this study was to develop an effective low-cost vessel segmentation network specifically designed to address vessel segmentation with a better true positive rate to aid ophthalmic diagnosis with a simpler design. Conventional architectures continuously downsample the feature map, which causes the loss of important minor features available in the image. This continuous downsampling causes the loss of important low-level features, and many minor morphologies from the image disappear, which finally results in low sensitivity. The thin vessel can completely vanish during this process. The effective design of VSUL-Net with a retention block allows the network to perform better, even with a few layers and only 0.37 million trainable parameters. The proposed VSUL-Net provides an accurate pixel-wise classification of fundus images without preprocessing. Unlike conventional semantic segmentation networks, VSUL-Net uses a few transposed convolutions to upsample the image back to its original size. The proposed VSUL-Net outputs a binary segmentation mask that represents the vessel and background pixels. The subsequently obtained predicted mask can be utilized to monitor changes in the retinal vasculature during ophthalmic disease analyses.
In the future, we plan to use different image enhancement schemes to increase the quality of the training data for better performance with the same network. This preprocessing will help reduce the misses and discontinuities of the network. In addition, we plan to collect the related disease sample with pixel number annotation for accurate ophthalmic diagnosis with a better true positive rate.
Author Contributions
Methodology, M.A.; conceptualization, A.H.; validation, J.H.K.; supervision, K.R.P.; writing—original draft, M.A.; writing—review and editing, K.R.P. All authors have read and agreed to the published version of the manuscript.
Funding
This research was supported in part by the National Research Foundation of Korea (NRF) funded by the Ministry of Science and ICT (MSIT) through the Basic Science Research Program (NRF-2021R1F1A1045587), in part by the NRF funded by the MSIT through the Basic Science Research Program (NRF-2020R1A2C1006179), and in part by the MSIT, Korea, under the ITRC (Information Technology Research Center) support program (IITP-2022-2020-0-01789) supervised by the IITP (Institute for Information & Communications Technology Planning & Evaluation).
Institutional Review Board Statement
Not applicable.
Informed Consent Statement
Not applicable.
Data Availability Statement
Not applicable.
Conflicts of Interest
The authors declare no conflict of interest.
References
- Abràmoff, M.D.; Garvin, M.K.; Sonka, M. Retinal Imaging and Image Analysis. IEEE Rev. Biomed. Eng. 2010, 3, 169–208. [Google Scholar] [CrossRef] [PubMed] [Green Version]
- Alyoubi, W.L.; Shalash, W.M.; Abulkhair, M.F. Diabetic Retinopathy Detection through Deep Learning Techniques: A Review. Inform. Med. Unlocked 2020, 20, 100377. [Google Scholar] [CrossRef]
- Dai, G.; He, W.; Xu, L.; Pazo, E.E.; Lin, T.; Liu, S.; Zhang, C. Exploring the Effect of Hypertension on Retinal Microvasculature Using Deep Learning on East Asian Population. PLoS ONE 2020, 15, e0230111. [Google Scholar] [CrossRef] [Green Version]
- Cho, B.-J.; Bae, S.H.; Park, S.M.; Shin, M.C.; Park, I.W.; Kim, H.K.; Kwon, S. Comparison of Systemic Conditions at Diagnosis between Central Retinal Vein Occlusion and Branch Retinal Vein Occlusion. PLoS ONE 2019, 14, e0220880. [Google Scholar] [CrossRef] [Green Version]
- Cano, J.; Farzad, S.; Khansari, M.M.; Tan, O.; Huang, D.; Lim, J.I.; Shahidi, M. Relating Retinal Blood Flow and Vessel Morphology in Sickle Cell Retinopathy. Eye 2020, 34, 886–891. [Google Scholar] [CrossRef] [PubMed] [Green Version]
- Kromer, R.; Buhmann, C.; Hidding, U.; Keserü, M.; Keserü, D.; Hassenstein, A.; Stemplewitz, B. Evaluation of Retinal Vessel Morphology in Patients with Parkinson’s Disease Using Optical Coherence Tomography. PLoS ONE 2016, 11, e0161136. [Google Scholar] [CrossRef] [PubMed]
- Bek, T. Regional Morphology and Pathophysiology of Retinal Vascular Disease. Prog. Retin. Eye Res. 2013, 36, 247–259. [Google Scholar] [CrossRef]
- Brown, J.M.; Campbell, J.P.; Beers, A.; Chang, K.; Ostmo, S.; Chan, R.V.P.; Dy, J.; Erdogmus, D.; Ioannidis, S.; Kalpathy-Cramer, J.; et al. Automated Diagnosis of Plus Disease in Retinopathy of Prematurity Using Deep Convolutional Neural Networks. JAMA Ophthalmol. 2018, 136, 803–810. [Google Scholar] [CrossRef]
- Mahum, R.; Rehman, S.U.; Okon, O.D.; Alabrah, A.; Meraj, T.; Rauf, H.T. A Novel Hybrid Approach Based on Deep CNN to Detect Glaucoma Using Fundus Imaging. Electronics 2022, 11, 26. [Google Scholar] [CrossRef]
- Chan, K.K.W.; Tang, F.; Tham, C.C.Y.; Young, A.L.; Cheung, C.Y. Retinal Vasculature in Glaucoma: A Review. BMJ Open Ophthalmol. 2017, 1, e000032. [Google Scholar] [CrossRef]
- Querques, G.; Borrelli, E.; Sacconi, R.; De Vitis, L.; Leocani, L.; Santangelo, R.; Magnani, G.; Comi, G.; Bandello, F. Functional and Morphological Changes of the Retinal Vessels in Alzheimer’s Disease and Mild Cognitive Impairment. Sci. Rep. 2019, 9, 63. [Google Scholar] [CrossRef] [PubMed] [Green Version]
- Heier, J.S.; Singh, R.P.; Wykoff, C.C.; Csaky, K.G.; Lai, T.Y.Y.; Loewenstein, A.; Schlottmann, P.G.; Paris, L.P.; Westenskow, P.D.; Quezada-Ruiz, C. The Angiopoietin/Tie Pathway in Retinal Vascular Diseases: A Review. RETINA 2021, 41, 1–19. [Google Scholar] [CrossRef] [PubMed]
- Miri, M.; Amini, Z.; Rabbani, H.; Kafieh, R. A Comprehensive Study of Retinal Vessel Classification Methods in Fundus Images. J. Med. Signals Sens. 2017, 7, 59–70. [Google Scholar]
- Arsalan, M.; Owais, M.; Mahmood, T.; Cho, S.W.; Park, K.R. Aiding the Diagnosis of Diabetic and Hypertensive Retinopathy Using Artificial Intelligence-Based Semantic Segmentation. J. Clin. Med. 2019, 8, 1446. [Google Scholar] [CrossRef] [PubMed] [Green Version]
- Arsalan, M.; Baek, N.R.; Owais, M.; Mahmood, T.; Park, K.R. Deep Learning-Based Detection of Pigment Signs for Analysis and Diagnosis of Retinitis Pigmentosa. Sensors 2020, 20, 3454. [Google Scholar] [CrossRef] [PubMed]
- Owais, M.; Arsalan, M.; Mahmood, T.; Kang, J.K.; Park, K.R. Automated Diagnosis of Various Gastrointestinal Lesions Using a Deep Learning–Based Classification and Retrieval Framework With a Large Endoscopic Database: Model Development and Validation. J. Med. Internet Res. 2020, 22, e18563. [Google Scholar] [CrossRef] [PubMed]
- Arsalan, M.; Haider, A.; Choi, J.; Park, K.R. Detecting Blastocyst Components by Artificial Intelligence for Human Embryological Analysis to Improve Success Rate of In Vitro Fertilization. J. Pers. Med. 2022, 12, 124. [Google Scholar] [CrossRef]
- Wang, L.; Wang, H.; Huang, Y.; Yan, B.; Chang, Z.; Liu, Z.; Zhao, M.; Cui, L.; Song, J.; Li, F. Trends in the Application of Deep Learning Networks in Medical Image Analysis: Evolution between 2012 and 2020. Eur. J. Radiol. 2022, 146, 110069. [Google Scholar] [CrossRef]
- Islam, M.M.; Yang, H.-C.; Poly, T.N.; Jian, W.-S.; Li, Y.-C. Deep Learning Algorithms for Detection of Diabetic Retinopathy in Retinal Fundus Photographs: A Systematic Review and Meta-Analysis. Comput. Methods Programs Biomed. 2020, 191, 105320. [Google Scholar] [CrossRef]
- Arsalan, M.; Haider, A.; Choi, J.; Park, K.R. Diabetic and Hypertensive Retinopathy Screening in Fundus Images Using Artificially Intelligent Shallow Architectures. J. Pers. Med. 2022, 12, 7. [Google Scholar] [CrossRef]
- VSUL-Net Models. Available online: http://dm.dgu.edu/link.html (accessed on 12 March 2022).
- Alhussein, M.; Aurangzeb, K.; Haider, S.I. An Unsupervised Retinal Vessel Segmentation Using Hessian and Intensity Based Approach. IEEE Access 2020, 8, 165056–165070. [Google Scholar] [CrossRef]
- Ahamed, A.T.U.; Jothish, A.; Johnson, G.; Krishna, S.B.V. Automated System for Retinal Vessel Segmentation. In Proceedings of the Second International Conference on Inventive Communication and Computational Technologies, Coimbatore, India, 20–21 April 2018; pp. 717–722. [Google Scholar]
- Naveed, K.; Abdullah, F.; Madni, H.A.; Khan, M.A.U.; Khan, T.M.; Naqvi, S.S. Towards Automated Eye Diagnosis: An Improved Retinal Vessel Segmentation Framework Using Ensemble Block Matching 3D Filter. Diagnostics 2021, 11, 114. [Google Scholar] [CrossRef] [PubMed]
- Zhou, C.; Zhang, X.; Chen, H. A New Robust Method for Blood Vessel Segmentation in Retinal Fundus Images Based on Weighted Line Detector and Hidden Markov Model. Comput. Methods Programs Biomed. 2020, 187, 105231. [Google Scholar] [CrossRef] [PubMed]
- Shah, S.A.A.; Shahzad, A.; Khan, M.A.; Lu, C.; Tang, T.B. Unsupervised Method for Retinal Vessel Segmentation Based on Gabor Wavelet and Multiscale Line Detector. IEEE Access 2019, 7, 167221–167228. [Google Scholar] [CrossRef]
- Chalakkal, R.J.; Abdulla, W.H. Improved Vessel Segmentation Using Curvelet Transform and Line Operators. In Proceedings of the Asia-Pacific Signal and Information Processing Association Annual Summit and Conference, Honolulu, HI, USA, 12–15 November 2018; pp. 2041–2046. [Google Scholar]
- Li, T.; Comer, M.; Zerubia, J. An Unsupervised Retinal Vessel Extraction and Segmentation Method Based On a Tube Marked Point Process Model. In Proceedings of the IEEE International Conference on Acoustics, Speech and Signal Processing, Barcelona, Spain, 4–8 May 2020; pp. 1394–1398. [Google Scholar]
- Ramos-Soto, O.; Rodríguez-Esparza, E.; Balderas-Mata, S.E.; Oliva, D.; Hassanien, A.E.; Meleppat, R.K.; Zawadzki, R.J. An Efficient Retinal Blood Vessel Segmentation in Eye Fundus Images by Using Optimized Top-Hat and Homomorphic Filtering. Comput. Methods Programs Biomed. 2021, 201, 105949. [Google Scholar] [CrossRef]
- Aswini, S.; Suresh, A.; Priya, S.; Krishna, B.V.S. Retinal Vessel Segmentation Using Morphological Top Hat Approach On Diabetic Retinopathy Images. In Proceedings of the Fourth International Conference on Advances in Electrical, Electronics, Information, Communication and Bio-Informatics, Chennai, India, 27–28 February 2018; pp. 1–5. [Google Scholar]
- Sundaram, R.; Ks, R.; Jayaraman, P.; B, V. Extraction of Blood Vessels in Fundus Images of Retina through Hybrid Segmentation Approach. Mathematics 2019, 7, 169. [Google Scholar] [CrossRef] [Green Version]
- Khawaja, A.; Khan, T.M.; Naveed, K.; Naqvi, S.S.; Rehman, N.U.; Nawaz, S.J. An Improved Retinal Vessel Segmentation Framework Using Frangi Filter Coupled With the Probabilistic Patch Based Denoiser. IEEE Access 2019, 7, 164344–164361. [Google Scholar] [CrossRef]
- Jin, Q.; Meng, Z.; Pham, T.D.; Chen, Q.; Wei, L.; Su, R. DUNet: A Deformable Network for Retinal Vessel Segmentation. Knowl. Based Syst. 2019, 178, 149–162. [Google Scholar] [CrossRef] [Green Version]
- Khan, T.M.; Alhussein, M.; Aurangzeb, K.; Arsalan, M.; Naqvi, S.S.; Nawaz, S.J. Residual Connection-Based Encoder Decoder Network (RCED-Net) for Retinal Vessel Segmentation. IEEE Access 2020, 8, 131257–131272. [Google Scholar] [CrossRef]
- Yan, Z.; Yang, X.; Cheng, K.-T. Joint Segment-Level and Pixel-Wise Losses for Deep Learning Based Retinal Vessel Segmentation. IEEE Trans. Biomed. Eng. 2018, 65, 1912–1923. [Google Scholar] [CrossRef]
- Wang, K.; Zhang, X.; Huang, S.; Wang, Q.; Chen, F. CTF-Net: Retinal Vessel Segmentation via Deep Coarse-To-Fine Supervision Network. In Proceedings of the IEEE 17th International Symposium on Biomedical Imaging, Iowa City, IA, USA, 3–7 April 2020; pp. 1237–1241. [Google Scholar]
- Li, L.; Verma, M.; Nakashima, Y.; Nagahara, H.; Kawasaki, R. IterNet: Retinal Image Segmentation Utilizing Structural Redundancy in Vessel Networks. In Proceedings of the IEEE Winter Conference on Applications of Computer Vision, Snowmass, CO, USA, 1–5 March 2020; pp. 3645–3654. [Google Scholar]
- Zhao, H.; Li, H.; Cheng, L. Improving Retinal Vessel Segmentation with Joint Local Loss by Matting. Pattern Recognit. 2020, 98, 107068. [Google Scholar] [CrossRef]
- Zhang, J.; Zhang, Y.; Xu, X. Pyramid U-Net for Retinal Vessel Segmentation. In Proceedings of the IEEE International Conference on Acoustics, Speech and Signal Processing, Toronto, ON, Canada, 6–11 June 2021; pp. 1125–1129. [Google Scholar]
- Gegundez-Arias, M.E.; Marin-Santos, D.; Perez-Borrero, I.; Vasallo-Vazquez, M.J. A New Deep Learning Method for Blood Vessel Segmentation in Retinal Images Based on Convolutional Kernels and Modified U-Net Model. Comput. Methods Programs Biomed. 2021, 205, 106081. [Google Scholar] [CrossRef] [PubMed]
- He, J.; Jiang, D. Fundus Image Segmentation Based on Improved Generative Adversarial Network for Retinal Vessel Analysis. In Proceedings of the 3rd International Conference on Artificial Intelligence and Big Data, Chengdu, China, 28–31 May 2020; pp. 231–236. [Google Scholar]
- Guo, X.; Chen, C.; Lu, Y.; Meng, K.; Chen, H.; Zhou, K.; Wang, Z.; Xiao, R. Retinal Vessel Segmentation Combined With Generative Adversarial Networks and Dense U-Net. IEEE Access 2020, 8, 194551–194560. [Google Scholar] [CrossRef]
- Lal, S.; Rehman, S.U.; Shah, J.H.; Meraj, T.; Rauf, H.T.; Damaševičius, R.; Mohammed, M.A.; Abdulkareem, K.H. Adversarial Attack and Defence through Adversarial Training and Feature Fusion for Diabetic Retinopathy Recognition. Sensors 2021, 21, 3922. [Google Scholar] [CrossRef]
- Chudzik, P.; Al-Diri, B.; Calivá, F.; Hunter, A. DISCERN: Generative Framework for Vessel Segmentation Using Convolutional Neural Network and Visual Codebook. In Proceedings of the 40th Annual International Conference of the IEEE Engineering in Medicine and Biology Society, Honolulu, HI, USA, 18–21 July 2018; pp. 5934–5937. [Google Scholar]
- Palanivel, D.A.; Natarajan, S.; Gopalakrishnan, S. Retinal Vessel Segmentation Using Multifractal Characterization. Appl. Soft Comput. 2020, 94, 106439. [Google Scholar] [CrossRef]
- Saha Tchinda, B.; Tchiotsop, D.; Noubom, M.; Louis-Dorr, V.; Wolf, D. Retinal Blood Vessels Segmentation Using Classical Edge Detection Filters and the Neural Network. Inform. Med. Unlocked 2021, 23, 100521. [Google Scholar] [CrossRef]
- Oliveira, A.; Pereira, S.; Silva, C.A. Retinal Vessel Segmentation Based on Fully Convolutional Neural Networks. Expert Syst. Appl. 2018, 112, 229–242. [Google Scholar] [CrossRef] [Green Version]
- Guo, S.; Wang, K.; Kang, H.; Zhang, Y.; Gao, Y.; Li, T. BTS-DSN: Deeply Supervised Neural Network with Short Connections for Retinal Vessel Segmentation. Int. J. Med. Inform. 2019, 126, 105–113. [Google Scholar] [CrossRef] [Green Version]
- Feng, S.; Zhuo, Z.; Pan, D.; Tian, Q. CcNet: A Cross-Connected Convolutional Network for Segmenting Retinal Vessels Using Multi-Scale Features. Neurocomputing 2019, 392, 268–276. [Google Scholar] [CrossRef]
- Yan, Z.; Yang, X.; Cheng, K.T. A Three-Stage Deep Learning Model for Accurate Retinal Vessel Segmentation. IEEE J. Biomed. Health Inform. 2018, 23, 1427–1436. [Google Scholar] [CrossRef]
- Hu, K.; Zhang, Z.; Niu, X.; Zhang, Y.; Cao, C.; Xiao, F.; Gao, X. Retinal Vessel Segmentation of Color Fundus Images Using Multiscale Convolutional Neural Network with an Improved Cross-Entropy Loss Function. Neurocomputing 2018, 309, 179–191. [Google Scholar] [CrossRef]
- Kromm, C.; Rohr, K. Inception Capsule Network for Retinal Blood Vessel Segmentation and Centerline Extraction. In Proceedings of the IEEE 17th International Symposium on Biomedical Imaging, Iowa City, IA, USA, 3–7 April 2020; pp. 1223–1226. [Google Scholar]
- Samuel, P.M.; Veeramalai, T. VSSC Net: Vessel Specific Skip Chain Convolutional Network for Blood Vessel Segmentation. Comput. Methods Programs Biomed. 2021, 198, 105769. [Google Scholar] [CrossRef] [PubMed]
- Wu, Y.; Xia, Y.; Song, Y.; Zhang, Y.; Cai, W. NFN+: A Novel Network Followed Network for Retinal Vessel Segmentation. Neural Netw. 2020, 126, 153–162. [Google Scholar] [CrossRef] [PubMed]
- Ronneberger, O.; Fischer, P.; Brox, T. U-Net: Convolutional Networks for Biomedical Image Segmentation. In Proceedings of the Medical Image Computing and Computer-Assisted Intervention, Munich, Germany, 5–9 October 2015; pp. 234–241. [Google Scholar]
- Badrinarayanan, V.; Kendall, A.; Cipolla, R. SegNet: A Deep Convolutional Encoder-Decoder Architecture for Image Segmentation. IEEE Trans. Pattern Anal. Mach. Intell. 2017, 39, 2481–2495. [Google Scholar] [CrossRef]
- Sudre, C.H.; Li, W.; Vercauteren, T.; Ourselin, S.; Jorge Cardoso, M. Generalised Dice Overlap as a Deep Learning Loss Function for Highly Unbalanced Segmentations. In Proceedings of the Deep Learning in Medical Image Analysis and Multimodal Learning for Clinical Decision Support, Québec City, QC, Canada, 14 September 2017; pp. 240–248. [Google Scholar]
- Staal, J.; Abramoff, M.D.; Niemeijer, M.; Viergever, M.A.; Ginneken, B. van Ridge-Based Vessel Segmentation in Color Images of the Retina. IEEE Trans. Med. Imaging 2004, 23, 501–509. [Google Scholar] [CrossRef]
- Fraz, M.M.; Remagnino, P.; Hoppe, A.; Uyyanonvara, B.; Rudnicka, A.R.; Owen, C.G.; Barman, S.A. Blood Vessel Segmentation Methodologies in Retinal Images—A Survey. Comput. Methods Programs Biomed. 2012, 108, 407–433. [Google Scholar] [CrossRef]
- Hoover, A.; Kouznetsova, V.; Goldbaum, M. Locating Blood Vessels in Retinal Images by Piecewise Threshold Probing of a Matched Filter Response. IEEE Trans. Med. Imaging 2000, 19, 203–210. [Google Scholar] [CrossRef] [Green Version]
- Kingma, D.P.; Ba, J. Adam: A Method for Stochastic Optimization. In Proceedings of the International Conference for Learning Representations, San Diego, CA, USA, 7–9 May 2015; pp. 1–15. [Google Scholar]
- He, K.; Zhang, X.; Ren, S.; Sun, J. Deep Residual Learning for Image Recognition. In Proceedings of the IEEE Conference on Computer Vision and Pattern Recognition, Las Vegas, NV, USA, 27–30 June 2016; pp. 770–778. [Google Scholar]
- Huang, G.; Liu, Z.; van der Maaten, L.; Weinberger, K.Q. Densely Connected Convolutional Networks. In Proceedings of the IEEE Conference on Computer Vision and Pattern Recognition, Honolulu, HI, USA, 21–26 July 2017. [Google Scholar]
- Soomro, T.A.; Afifi, A.J.; Gao, J.; Hellwich, O.; Khan, M.A.U.; Paul, M.; Zheng, L. Boosting Sensitivity of a Retinal Vessel Segmentation Algorithm with Convolutional Neural Network. In Proceedings of the International Conference on Digital Image Computing: Techniques and Applications, Sydney, NSW, Australia, 29 November–1 December 2017; pp. 1–8. [Google Scholar]
- Lv, Y.; Ma, H.; Li, J.; Liu, S. Attention Guided U-Net With Atrous Convolution for Accurate Retinal Vessels Segmentation. IEEE Access 2020, 8, 32826–32839. [Google Scholar] [CrossRef]
- Li, X.; Jiang, Y.; Li, M.; Yin, S. Lightweight Attention Convolutional Neural Network for Retinal Vessel Segmentation. IEEE Trans. Ind. Inform. 2020, 17, 1958–1967. [Google Scholar] [CrossRef]
- Livingston, E.H. Who Was Student and Why Do We Care so Much about His t-Test?1. J. Surg. Res. 2004, 118, 58–65. [Google Scholar] [CrossRef]
- t-Test and ANOVA. Available online: https://www.iuj.ac.jp/faculty/kucc625/method/anova.html (accessed on 1 March 2022).
- Kao, L.S.; Green, C.E. Analysis of Variance: Is There a Difference in Means and What Does It Mean? J. Surg. Res. 2008, 144, 158–170. [Google Scholar] [CrossRef] [PubMed] [Green Version]
- Zhang, J.; Chen, Y.; Bekkers, E.; Wang, M.; Dashtbozorg, B.; Romeny, B.M. ter H. Retinal Vessel Delineation Using a Brain-Inspired Wavelet Transform and Random Forest. Pattern Recognit. 2017, 69, 107–123. [Google Scholar] [CrossRef]
- Tan, J.H.; Acharya, U.R.; Bhandary, S.V.; Chua, K.C.; Sivaprasad, S. Segmentation of Optic Disc, Fovea and Retinal Vasculature Using a Single Convolutional Neural Network. J. Comput. Sci. 2017, 20, 70–79. [Google Scholar] [CrossRef] [Green Version]
- Zhu, C.; Zou, B.; Zhao, R.; Cui, J.; Duan, X.; Chen, Z.; Liang, Y. Retinal Vessel Segmentation in Colour Fundus Images Using Extreme Learning Machine. Comput. Med. Imaging Graph. 2017, 55, 68–77. [Google Scholar] [CrossRef]
- Girard, F.; Kavalec, C.; Cheriet, F. Joint Segmentation and Classification of Retinal Arteries/Veins from Fundus Images. Artif. Intell. Med. 2019, 94, 96–109. [Google Scholar] [CrossRef] [Green Version]
- Fu, H.; Xu, Y.; Lin, S.; Kee Wong, D.W.; Liu, J. DeepVessel: Retinal Vessel Segmentation via Deep Learning and Conditional Random Field. In Proceedings of the International Conference on Medical Image Computing and Computer-Assisted Intervention, Athens, Greece, 17–21 October 2016; pp. 132–139. [Google Scholar]
- Wang, X.; Jiang, X.; Ren, J. Blood Vessel Segmentation from Fundus Image by a Cascade Classification Framework. Pattern Recognit. 2019, 88, 331–341. [Google Scholar] [CrossRef]
- Soomro, T.A.; Hellwich, O.; Afifi, A.J.; Paul, M.; Gao, J.; Zheng, L. Strided U-Net Model: Retinal Vessels Segmentation Using Dice Loss. In Proceedings of the Digital Image Computing: Techniques and Applications, Canberra, Australia, 10–13 December 2018; pp. 1–8. [Google Scholar]
- Leopold, H.A.; Orchard, J.; Zelek, J.S.; Lakshminarayanan, V. PixelBNN: Augmenting the PixelCNN with Batch Normalization and the Presentation of a Fast Architecture for Retinal Vessel Segmentation. J. Imaging 2019, 5, 26. [Google Scholar] [CrossRef] [Green Version]
- Wang, C.; Zhao, Z.; Ren, Q.; Xu, Y.; Yu, Y. Dense U-Net Based on Patch-Based Learning for Retinal Vessel Segmentation. Entropy 2019, 21, 168. [Google Scholar] [CrossRef] [Green Version]
- Khan, T.M.; Naqvi, S.S.; Arsalan, M.; Khan, M.A.; Khan, H.A.; Haider, A. Exploiting Residual Edge Information in Deep Fully Convolutional Neural Networks For Retinal Vessel Segmentation. In Proceedings of the International Joint Conference on Neural Networks, Glasgow, UK, 19–24 July 2020; pp. 1–8. [Google Scholar]
- Khan, T.M.; Khan, M.A.U.; Rehman, N.U.; Naveed, K.; Afridi, I.U.; Naqvi, S.S.; Raazak, I. Width-Wise Vessel Bifurcation for Improved Retinal Vessel Segmentation. Biomed. Signal Processing Control 2022, 71, 103169. [Google Scholar] [CrossRef]
- Zhang, Y.; He, M.; Chen, Z.; Hu, K.; Li, X.; Gao, X. Bridge-Net: Context-Involved U-Net with Patch-Based Loss Weight Mapping for Retinal Blood Vessel Segmentation. Expert Syst. Appl. 2022, 195, 116526. [Google Scholar] [CrossRef]
- Hajabdollahi, M.; Esfandiarpoor, R.; Najarian, K.; Karimi, N.; Samavi, S.; Reza-Soroushmeh, S.M. Low Complexity Convolutional Neural Network for Vessel Segmentation in Portable Retinal Diagnostic Devices. In Proceedings of the 25th IEEE International Conference on Image Processing, Athens, Greece, 7–10 October 2018; pp. 2785–2789. [Google Scholar]
- Selvaraju, R.R.; Cogswell, M.; Das, A.; Vedantam, R.; Parikh, D.; Batra, D. Grad-CAM: Visual Explanations From Deep Networks via Gradient-Based Localization. In Proceedings of the IEEE International Conference on Computer Vision, Venice, Italy, 22–29 October 2017; pp. 618–626. [Google Scholar]
Figure 1.
The working overall procedure of the proposed method for vessel segmentation for ophthalmic analysis. Abbreviation: VSUL-Net, vessel segmentation ultra-lite-network.
Figure 1.
The working overall procedure of the proposed method for vessel segmentation for ophthalmic analysis. Abbreviation: VSUL-Net, vessel segmentation ultra-lite-network.

Figure 2.
The structure of the proposed VSUL-Net. In this figure, 3 × 3 kernel convolution (3 × 3 conv.), 1 × 1 convolution (1 × 1 bottleneck), batch normalization and rectified linear unit (BN + ReLU), 2 × 2 transposed convolution with stride = 2 (Transposed Conv.), 3 × 3 convolution with stride = 2 (Strided conv.), and 3 × 3 depth-wise separable convolution (DW. separable conv.) are represented.

Figure 3.
Understanding of VSUL-Net connectivity and dense feature aggregation principle.

Figure 4.
Example fundus images used in our experiments. (a–c) are examples taken from the DRIVE, CHASE-DB1, and STARE datasets, respectively.
Figure 4.
Example fundus images used in our experiments. (a–c) are examples taken from the DRIVE, CHASE-DB1, and STARE datasets, respectively.

Figure 5.
Data augmentation scheme used to synthetically increase training data, where VF and HF represent vertical flip and horizontal flip, respectively.
Figure 5.
Data augmentation scheme used to synthetically increase training data, where VF and HF represent vertical flip and horizontal flip, respectively.

Figure 6.
VSUL-Net training accuracy and loss curves for the DRIVE dataset.

Figure 7.
VSUL-Net visual results for the DRIVE dataset: (a) original fundus image, (b) expert annotation, and (c) VSUL-Net predicted mask.
Figure 7.
VSUL-Net visual results for the DRIVE dataset: (a) original fundus image, (b) expert annotation, and (c) VSUL-Net predicted mask.

Figure 8.
VSUL-Net visual results for the CHASE-DB1 dataset: (a) original fundus image, (b) expert annotation, and (c) VSUL-Net predicted mask.
Figure 8.
VSUL-Net visual results for the CHASE-DB1 dataset: (a) original fundus image, (b) expert annotation, and (c) VSUL-Net predicted mask.

Figure 9.
VSUL-Net visual results for the STARE dataset: (a) original fundus image, (b) expert annotation, and (c) VSUL-Net predicted mask.
Figure 9.
VSUL-Net visual results for the STARE dataset: (a) original fundus image, (b) expert annotation, and (c) VSUL-Net predicted mask.

Figure 10.
VSUL-Net output mask analysis for misses, discontinuities, and over-segmentation: (a) original fundus image, (b) expert annotation, (c) VSUL-Net predicted mask, and (d) mask-annotation overlapping image (TP is presented in blue, FN in red, and FP in green).
Figure 10.
VSUL-Net output mask analysis for misses, discontinuities, and over-segmentation: (a) original fundus image, (b) expert annotation, (c) VSUL-Net predicted mask, and (d) mask-annotation overlapping image (TP is presented in blue, FN in red, and FP in green).

Figure 11.
VSUL-Net Grad-cam visualization for the DRIVE (row-1), CHASE-DB1 (row-2), and STARE datasets (row-3): (a) original fundus image, (b) expert annotation, and Grad-cam extracted from the ReLU of (c) T-Conv-BB-A, (d) DW-Sep-Conv-RT-A, (e) T-Conv-US-A, (f) Class-Mask-Conv of Table 3.
Figure 11.
VSUL-Net Grad-cam visualization for the DRIVE (row-1), CHASE-DB1 (row-2), and STARE datasets (row-3): (a) original fundus image, (b) expert annotation, and Grad-cam extracted from the ReLU of (c) T-Conv-BB-A, (d) DW-Sep-Conv-RT-A, (e) T-Conv-US-A, (f) Class-Mask-Conv of Table 3.

Table 1.
List of abbreviations.
| Full Name | Abbreviations | Full Name | Abbreviations |
|---|---|---|---|
| Alzheimer’s disease | AD | Sickle cell retinopathy | SCR |
| Parkinson’s disease | PD | Retinopathy of prematurity | ROP |
| Contrast Limited Adaptive Histogram Equalization | CLAHE | U- shaped network | U-Net |
| Segmentation network | SegNet | generative adversarial network | GAN |
| Batch normalization and | BN | Rectified linear unit | ReLU |
| Generalized dice loss | GDL | Vertical flip and | VF |
| Horizontal flip | HF | Sensitivity | Sen |
| Specificity | Spe | Accuracy | Acc |
| Area under the curve | AUC | Gradient-weighted class activation map | Grad-cam |
| Convolutional neural network | CNN | Gaussian mixture model | GMM |
| iterative U-Net | IterNet | Cross-connected convolutional network | CcNet |
Table 3.
Feature map size details of the VSUL-Net layers.
| Block | Layer Name | Layer Size K × K × C, (Stride) | Filters/Groups | Output |
|---|---|---|---|---|
| Input Block | Input Conv | 1 × 1 × 3 (S = 1) | 8 | 650 × 650 × 8 |
| Backbone | Conv-BB-A | 3 × 3 × 8 (S = 2) | 8 | 325 × 325 × 8 |
| Conv-BB-B | 3 × 3 × 8 (S = 2) | 8 | 163 × 163 × 8 | |
| Conv-BB-C | 3 × 3 × 8 (S = 1) | 8 | 163 × 163 × 8 | |
| Conv-BB-D | 3 × 3 × 8 (S = 1) | 16 | 163 × 163 × 16 | |
| Conv-BB-E | 3 × 3 × 16 (S = 1) | 24 | 163 × 163 × 24 | |
| DW-Sep-Conv-BB-A | 3 × 3 × 24 (S = 1) | 24 | 163 × 163 × 24 | |
| T-Conv-BB-A | 2 × 2 × 24 (S = 2) | 32 | 325 × 325 × 32 | |
| Retention | Conv-RT-A | 3 × 3 × 8 (S = 1) | 8 | 325 × 325 × 8 |
| Conv-RT-B | 3 × 3 × 8 (S = 1) | 8 | 325 × 325 × 8 | |
| Conv-RT-C | 3 × 3 × 8 (S = 1) | 16 | 325 × 325 × 16 | |
| Conv-RT-D | 3 × 3 × 16 (S = 1) | 24 | 325 × 325 × 24 | |
| Conv-RT-E | 3 × 3 × 24 (S = 1) | 32 | 325 × 325 × 32 | |
| DW-Sep-Conv-RT-A | 3 × 3 × 32 (S = 1) | 32 | 325 × 325 × 32 | |
| Concatenation-A | T-Conv-BB-A © DW-Sep-Conv-RT-A © Conv-BB-A | 325 × 325 × 72 | ||
| Upsampling | B-Neck-Conv | 1 × 1 × 72 (S = 1) | 32 | 325 × 325 × 32 |
| Conv-US-A | 3 ×3 × 32 (S = 1) | 32 | 325 × 325 × 32 | |
| T-Conv-US-A | 2 × 2 × 32 (S = 2) | 16 | 650 × 650 × 16 | |
| Concatenation-B | Input Conv © T-Conv-US-A | 650 × 650 × 24 | ||
| Final | Class-Mask-Conv | 1 × 1 × 24 (S = 1) | 2 | 650 × 650 × 2 |
Table 4.
Description of the DRIVE, STARE, and CHASE-DB1 datasets and experimentation details.
| Dataset Name | Total Images | Experiment Details |
|---|---|---|
| DRIVE [58] | 40 | Pre-defined Training = 20, Testing = 20 (one experiment) |
| CHASE-DB1 [59] | 28 | Pre-defined Training = 20, Testing = 8 (one experiment) |
| STARE [60] | 20 | Training = 19, Testing = 1 (20 experiments) |
Table 5.
Ablation study results for proposed VSUL-Net. The processing time is measured in milliseconds (ms) for an image with size 650 × 650 pixels.
Table 5.
Ablation study results for proposed VSUL-Net. The processing time is measured in milliseconds (ms) for an image with size 650 × 650 pixels.
| Method | Sen | Spe | Acc | AUC | Parameters | Process Time (ms) |
|---|---|---|---|---|---|---|
| VSUL-Net (Residual) | 83.19 | 98.15 | 96.84 | 98.45 | 0.37 M | 35 |
| VSUL-Net (Dense) | 83.80 | 98.21 | 96.95 | 98.54 | 0.37 M | 34 |
Publisher’s Note: MDPI stays neutral with regard to jurisdictional claims in published maps and institutional affiliations. |
© 2022 by the authors. Licensee MDPI, Basel, Switzerland. This article is an open access article distributed under the terms and conditions of the Creative Commons Attribution (CC BY) license (https://creativecommons.org/licenses/by/4.0/).
Share and Cite
MDPI and ACS Style
Arsalan, M.; Haider, A.; Koo, J.H.; Park, K.R. Segmenting Retinal Vessels Using a Shallow Segmentation Network to Aid Ophthalmic Analysis. Mathematics 2022, 10, 1536. https://0-doi-org.brum.beds.ac.uk/10.3390/math10091536
AMA Style
Arsalan M, Haider A, Koo JH, Park KR. Segmenting Retinal Vessels Using a Shallow Segmentation Network to Aid Ophthalmic Analysis. Mathematics. 2022; 10(9):1536. https://0-doi-org.brum.beds.ac.uk/10.3390/math10091536
Chicago/Turabian StyleArsalan, Muhammad, Adnan Haider, Ja Hyung Koo, and Kang Ryoung Park. 2022. "Segmenting Retinal Vessels Using a Shallow Segmentation Network to Aid Ophthalmic Analysis" Mathematics 10, no. 9: 1536. https://0-doi-org.brum.beds.ac.uk/10.3390/math10091536
Note that from the first issue of 2016, this journal uses article numbers instead of page numbers. See further details here.