
Predicting High-Risk Students Using Learning Behavior


1
Guangxi Key Laboratory of Trusted Software, Guilin University of Electronic Technology, Guilin 541000, China
2
School of Information and Communication, Guilin University of Electronic Technology, Guilin 514000, China
3
College of Information Science and Technology/College of Cyber Security, Jinan University, Guangzhou 510000, China
*
Author to whom correspondence should be addressed.
Mathematics 2022, 10(14), 2483; https://0-doi-org.brum.beds.ac.uk/10.3390/math10142483
Submission received: 9 June 2022
/
Revised: 4 July 2022
/
Accepted: 6 July 2022
/
Published: 16 July 2022
(This article belongs to the Special Issue Advances in Artificial Intelligence and Statistical Techniques with Applications to Health and Education)
Abstract
:Over the past few years, the growing popularity of online education has enabled there to be a large amount of students’ learning behavior data stored, which brings great opportunities and challenges to the field of educational data mining. Students’ learning performance can be predicted, based on students’ learning behavior data, so as to identify at-risk students who need timely help to complete their studies and improve students’ learning performance and online teaching quality. In order to make full use of these learning behavior data, a new prediction method was designed based on existing research. This method constructs a hybrid deep learning model, which can simultaneously obtain the temporal behavior information and the overall behavior information from the learning behavior data, so that it can more accurately predict the high-risk students. When compared with existing deep learning methods, the experimental results show that the proposed method offers better predicting performance.
1. Introduction
In the past few decades, Educational Data Mining (EDM) has been a very active research field, applying machine learning, data mining, and statistical learning methods to mine the hidden information in educational data [1]. As one of the important research directions of EDM, student performance prediction is essential for evaluating and improving teaching quality and guiding students’ personalized development [2].
The development of information technology has promoted the reform of educational methods. Online learning platforms represented by virtual learning environments (VLEs) and large-scale open online courses (MOOCS) have become a new way of learning. The emergence of these online education platforms has broken the restrictions of time and space and met the diverse learning needs of different learners. However, online learning faces great challenges. According to the 2019 Harvard MOOC Research Report [3], many learners cannot pass the course examination. The number of students in online learning is much higher than that in traditional classrooms. It is difficult for teachers to track the learning situation of each student and provide timely teaching guidance to students with learning risks, which makes the quality of online education difficult to be effectively guaranteed. Through student performance prediction, students needing time and help to complete their studies can be identified, which can help these students improve their academic performance [4]. Therefore, for teachers, accurate student performance prediction can effectively help them improve the quality of online teaching and realize all the potential advantages of online learning platforms.
Early student performance prediction mainly attempts to predict student performance by considering factors such as the student’s grade point average, demographic information, and usual test scores [5]. The development of online learning platforms has enabled a large amount of student learning behavior to be collected, such as learning resource access time, number of visits, etc. [6]. The online behavior reflects the learning situation of students and can be used to predict student performance [7].
In recent years, more and more researchers regard PSP as a time series classification problem. Among the existing temporal algorithms, recurrent neural networks, such as long short-term memory (LSTM), have outstanding performance in analyzing students’ learning behavior sequences, and the extracted temporal behavior features precisely reflect the learning process of students [8]. Recurrent neural networks can provide a persistence mechanism by implementing feedback loops [9]. These feedback loops will pass the information from the current time step to the next time step, in order for the networks to retain the hidden information extracted from the previous time step. When predicting student performance, after the training of student learning behavior sequences at different periods, the recurrent neural network can finally extract the temporal behavior information from the learning behavior sequence.
The method based on the recurrent neural network can predict the performance of students very well, however, it does so at the expense of paying too much attention to the temporal behavior information while ignoring the overall behavior information. In actual learning, as shown in Table 1, some students will study conscientiously within a specific period of time to pass the course, when compared to other students, their overall learning behavior is similar, but their learning behavior during different periods is different. Therefore, some information on the overall learning behavior will help improve the accuracy of student performance prediction.
This research aims to use students’ learning behavior to predict student performance. The learning behavior of students is commonly found in the logs of various online learning systems, recording students’ visits to online platforms, and hiding the students’ learning process. Unfortunately, the existing PSP method does not fully utilize the information on the student’s learning behavior, which affects the accuracy of student performance prediction. In order to make full use of the information hidden in the student’s learning behavior, a new method is proposed based on existing research, which extracts the temporal behavior information and the overall behavior information from student’s learning behavior data by using deep neural networks and recurrent neural networks, respectively. Finally, a variety of modeling techniques are compared with the proposed method. Experiments show that this method has the best prediction performance. Compared to related work, the contributions are mainly as follows:
- (1)
- This article proposes a new prediction method, which can simultaneously obtain the temporal behavior features and the overall behavior features of student’s learning behavior from student’s learning behavior data.
- (2)
- To better integrate the temporal behavior features and the overall behavior features of student’s learning behavior, using an attention mechanism to evaluate the importance of the temporal behavior features and the overall behavior features.
- (3)
- Extensive experiments have been conducted on a real dataset, and the results show that the proposed method has a more accurate prediction performance than some other prediction methods.
The remainder of this paper is organized as follows. Section 2 will introduce the related works. In Section 3 we introduce the dataset and the data preprocessing we have done. Section 4 will outline the model we propose. In Section 5 we show an analysis and the experimental results of the model. Lastly, Section 6 briefly summarizes the conclusions and future work.
2. Related Work
The application of distance education and large-scale open online learning systems have provided a large amount of data for educational data mining, which has ushered in a new turning point in educational data mining which has begun to receive more and more attention [10]. Among the many research fields of data mining, student performance prediction is widely studied to solve problems such as poor academic performance, rising university dropout rates, and delayed graduation [11]. The learning process of students is complicated, and how to model them more comprehensively and accurately has always been the focus of research in the field of student performance prediction.
The early studies of student performance prediction are mainly based on traditional machine learning methods, such as regression analysis [12,13], decision trees [14,15], Naive Bayes [16], etc. These traditional machine learning algorithms have good interpretability and simple implementation and have achieved good results in the field of student performance prediction. Compared with these algorithms, most deep learning models are data-driven black box models. Although they lack interpretability, they have been applied to the field of student performance prediction because of their superior prediction performance and have become a research hotspot in the field of performance prediction. Deep neural networks have perfect fitting capabilities and can approximate any complex function. They contain many hidden layers, whilst having a very powerful and expressive ability. They can also learn the complex nonlinear relationships between features. The performance prediction of students based on deep neural networks is better than traditional machine learning [17,18,19].
In recent years, recurrent neural networks have been successfully applied in various fields, such as handwriting recognition [20] and speech synthesis [21]. Due to the fact that learning behavior data generated by students during the learning process has an obvious time series in the existing work, the ways to predict student performance based on recurrent neural networks has become a research phenomenon in student performance prediction. Corrigan et al. [22] extracted student interaction data from the virtual learning environment and simply counted the number of times students visit Moodle each week as the input of the student performance prediction model. When considering the good performance of the recurrent neural network on time series data, the most popular variant, long and short-term memory (LSTM), wass used to predict the learning performance of students. When compared with the current most effective method, random forest, the experimental results show that the performance of the recurrent neural network is better. Kőrösi et al. [23] used the original row-level user log data in the learning platform to generate statistics based on the different learning behaviors of students in each week as the input of the student performance prediction model. Using the GRU recurrent neural network to predict the performance of students at the end of the course and comparing it with a standard classifier that uses manual synthesis of features, it was found that the recurrent neural network has a better predictive effect. Wu et al. [24] believe that students’ online behavior is related to students’ learning performance. They classified different websites by type and counted the number of visits to different types of websites as the input to the student’s performance prediction model. They then mplemented the commonly used student performance prediction methods which included Logistic Regression (LR), Naive Bayes (NB), Support Vector Machine (SVM), Multilayer Perceptron (MLP), and LSTM methods to predict student performance. The experimental results showed that the prediction accuracy of LSTM was the highest.
3. Dataset
3.1. Dataset Introduction
In order to effectively analyze the relationship between learning behavior and student performance, the data set needs to contain a large number of students, diverse types of learning behavior, and frequent learning behavior. Therefore, we use the data related to the FFF course in the Open University Learning Analysis Data Set (OULAD) [25]. It is worth noting that, in order to establish a model to achieve early prediction of student performance, only the data of the previous 32 weeks is used.
The FFF course data set contains two years of student learning data. For two years, FFF courses were offered every semester. The information on the students participating in the course and the students’ learning behavior on the platform are stored in different tables. These tables include the student information table (StudentInfo), the student learning behavior table (StudentVle) and the learning behavior table (Vle). The StudentInfo table stores the results of students’ course learning, whilst the StudentVle stores the learning behaviors of students. Related information on various learning behavior is stored in Vle.
There are two characteristics of student learning behavior:
- (1)
- There is a large amount of data. In the FFF course, a total of 7762 students studied the course. During the students’ learning process, a total of 4,014,499 learning records were generated.
- (2)
- There is a wide variety of learning behaviors. Different learning behavior numbers represent different learning behaviors. There are 1967 different learning behavior numbers in the FFF course, which means that there are 1967 different learning behaviors in total.
3.2. Dataset Preprocessing
Due to the large amount of data, diversified learning behavior types, and missing data in the data set, further processing of the data set is required, which is described in detail as follows:
- (1)
- Record Extraction: The original log involved the course study of 7762 students, of which only 7046 students studied only on the course FFF and only studied once. The learning behavior of some students was not recorded, so we deleted them. In the end, we had 6455 students and their learning records.
- (2)
- Learning behavior category: The extracted data set involved 1967 different learning behaviors. Categorizing these learning behaviors can help us better understand students’ learning behavior. From the original data set, 20 categories of learning behavior can be summarized. The learning behavior categories absent from the FFF course were deleted, and 18 categories of learning behavior were obtained; the details of the learning behavior categories are shown in Table 2.
- (3)
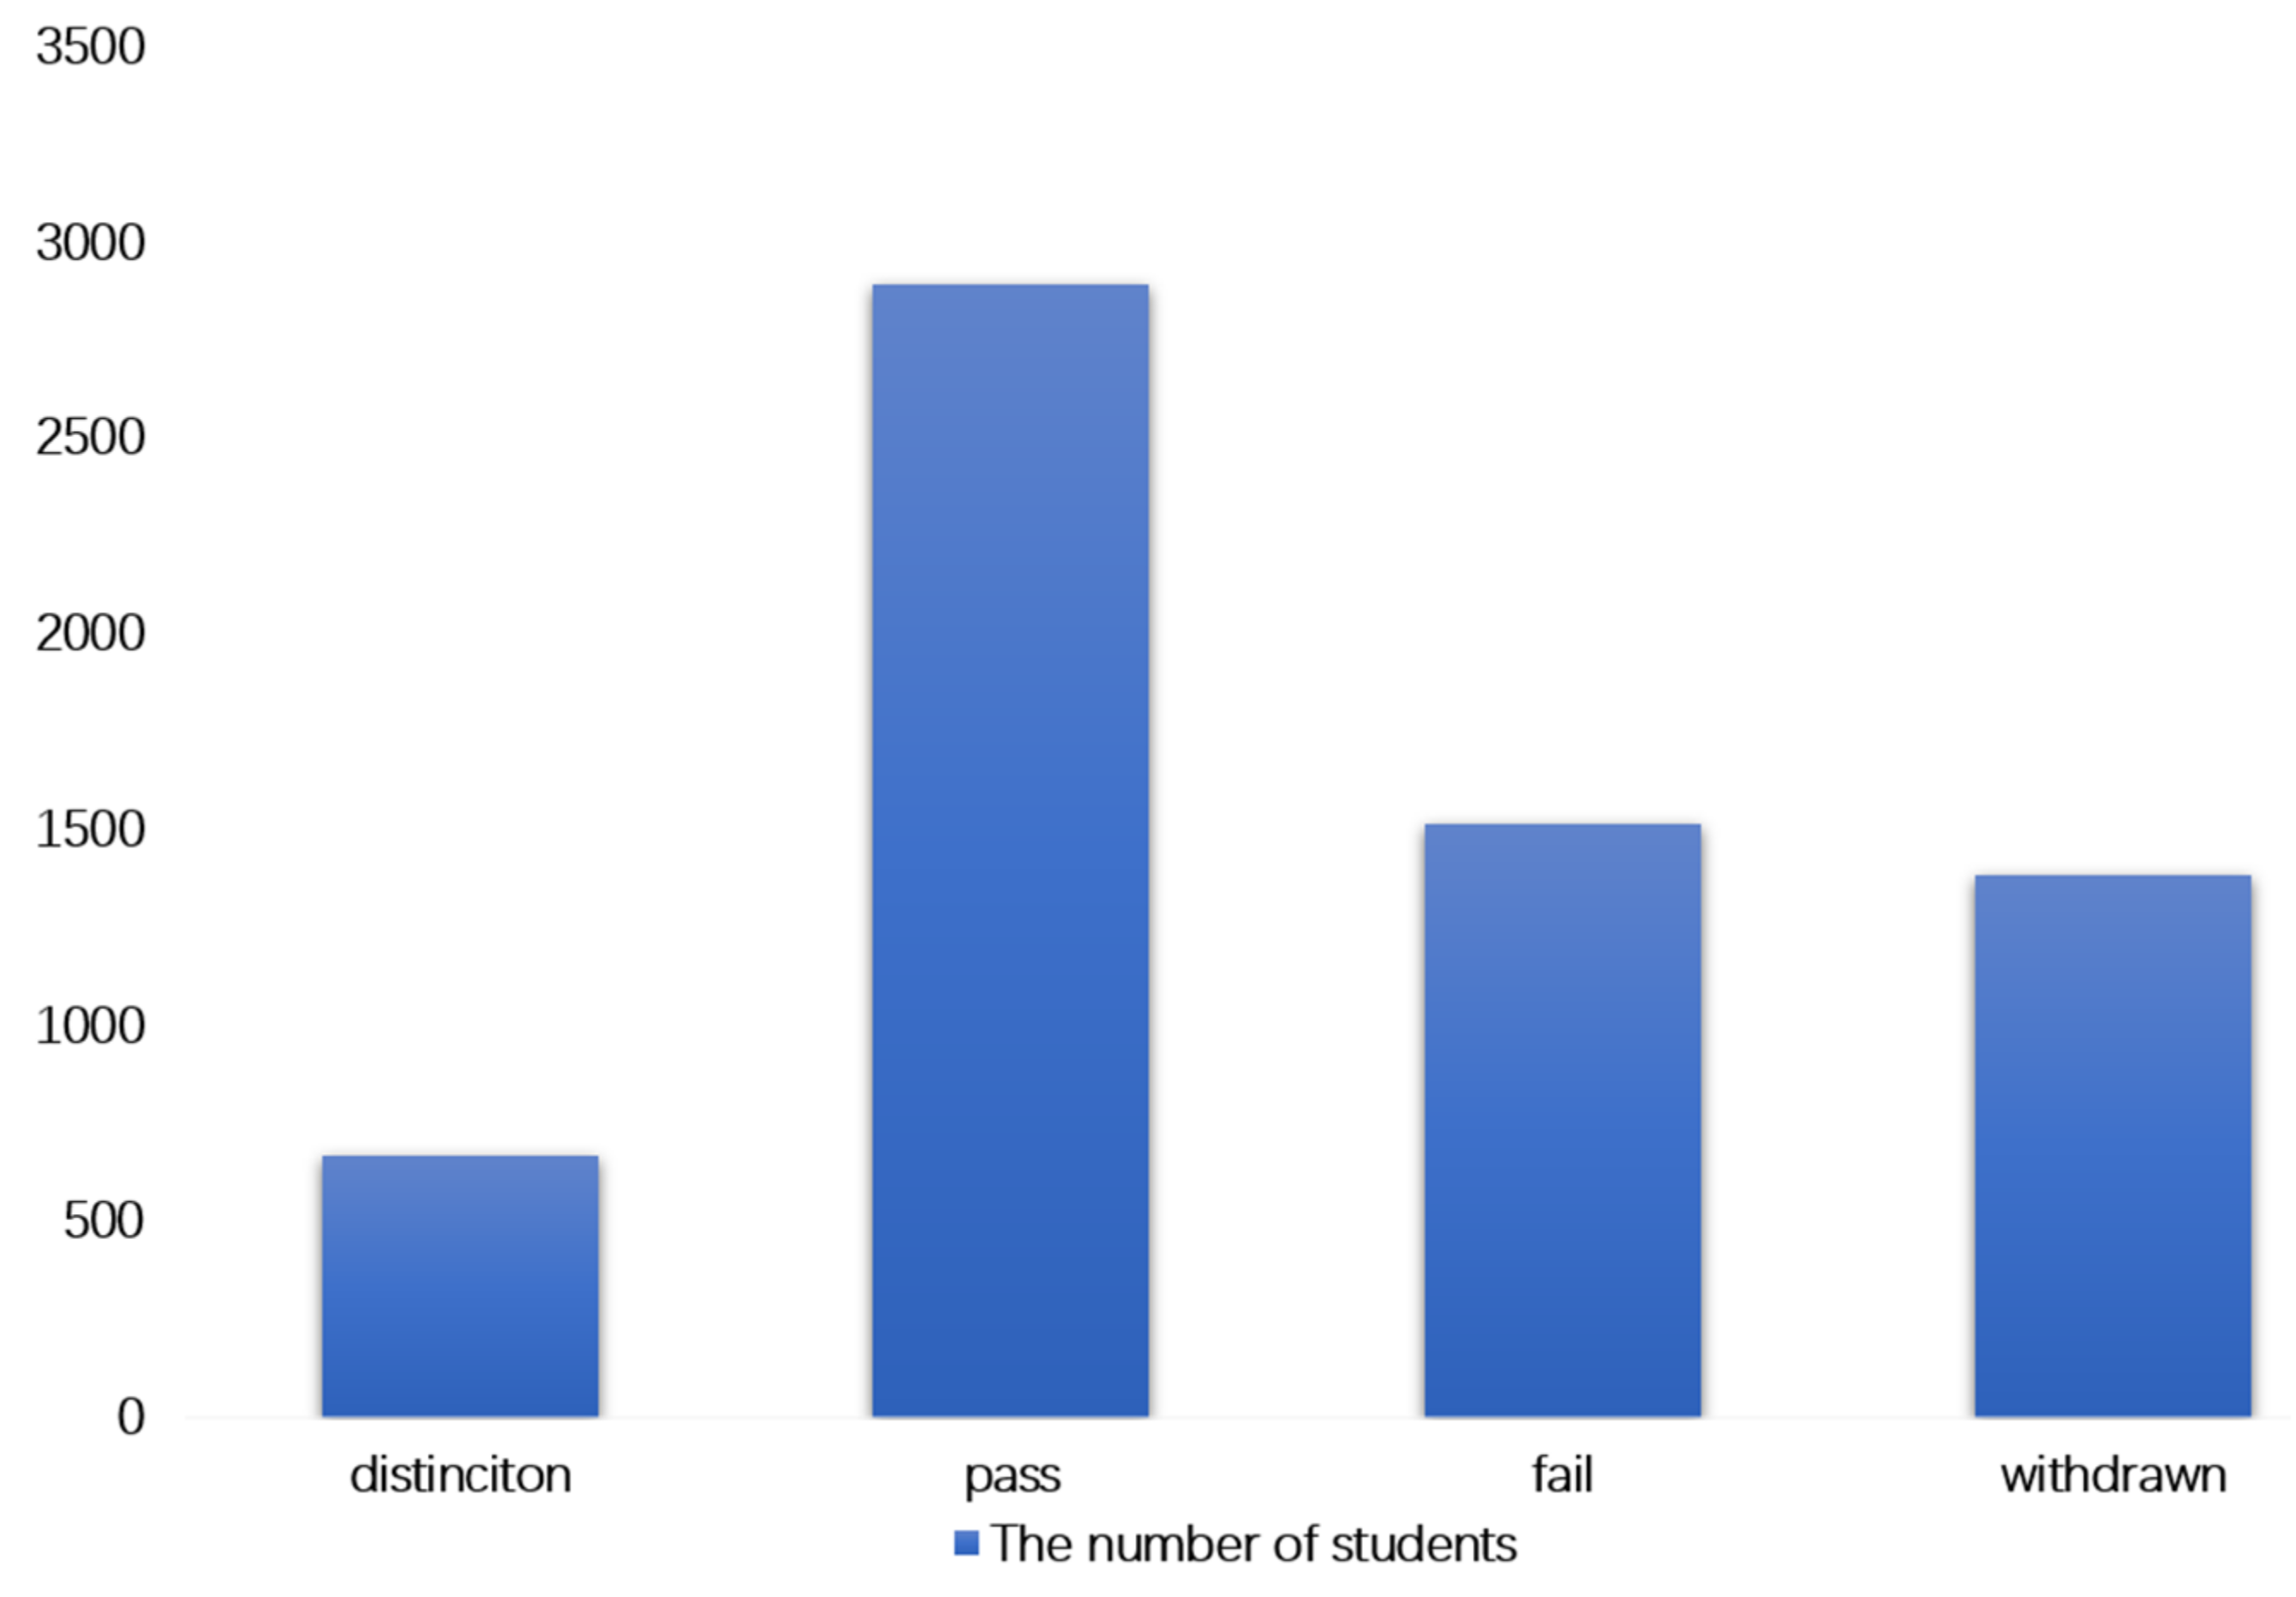
- Performance Classification: In the FFF course, students’ final course learning results are divided into four categories: excellent, passed, failed, and dropped out. As shown in Figure 1, in the original data, the distribution of students’ different performance results is unbalanced. Therefore, we classify distinction and pass as pass whilst we classify fail and withdrawn as fail.

Table 2.
Introduction to learning behavior categories.
| Index | Learning Behavior Category | Description |
|---|---|---|
| 1 | Dataplus | Total clicks on the additional information such as videos, audio, sites, etc. |
| 2 | Dualpane | Total clicks on the information on site and activity related to that information |
| 3 | Folder | Total clicks on the files relevant to the course |
| 4 | Forumng | Total clicks on the discussion forum |
| 5 | Homepage | Total clicks on the course homepage |
| 6 | Oucollaborate | Total clicks on the online video discussions |
| 7 | Oucontent | Total clicks on the contents of the assignment |
| 8 | Ouwiki | Total clicks on the Wikipedia content |
| 9 | Page | Total clicks on the information related to the course |
| 10 | Questionnaire | Total clicks on the questionnaires related to the course |
| 11 | Quiz | Total on the course quiz |
| 12 | RepeatActivity | Total clicks on the course contents from previous weeks |
| 13 | Resource | Total clicks on the pdf resources such as books |
| 14 | Subpage | Total clicks on the other sites enabled in the course |
| 15 | Url | Total clicks on the links to audio/video |
| 16 | Ouelluminate | Total clicks on the online tutorial sessions |
| 17 | Glossary | Total clicks on the basic glossary related to the contents of the courseF45 BC |
| 18 | Htmlactivity | Total clicks on the interactive html page |
3.3. Dataset Analysis
In order to effectively prove the relationship between student learning behavior and student learning performance, we conducted a detailed analysis of the data set.
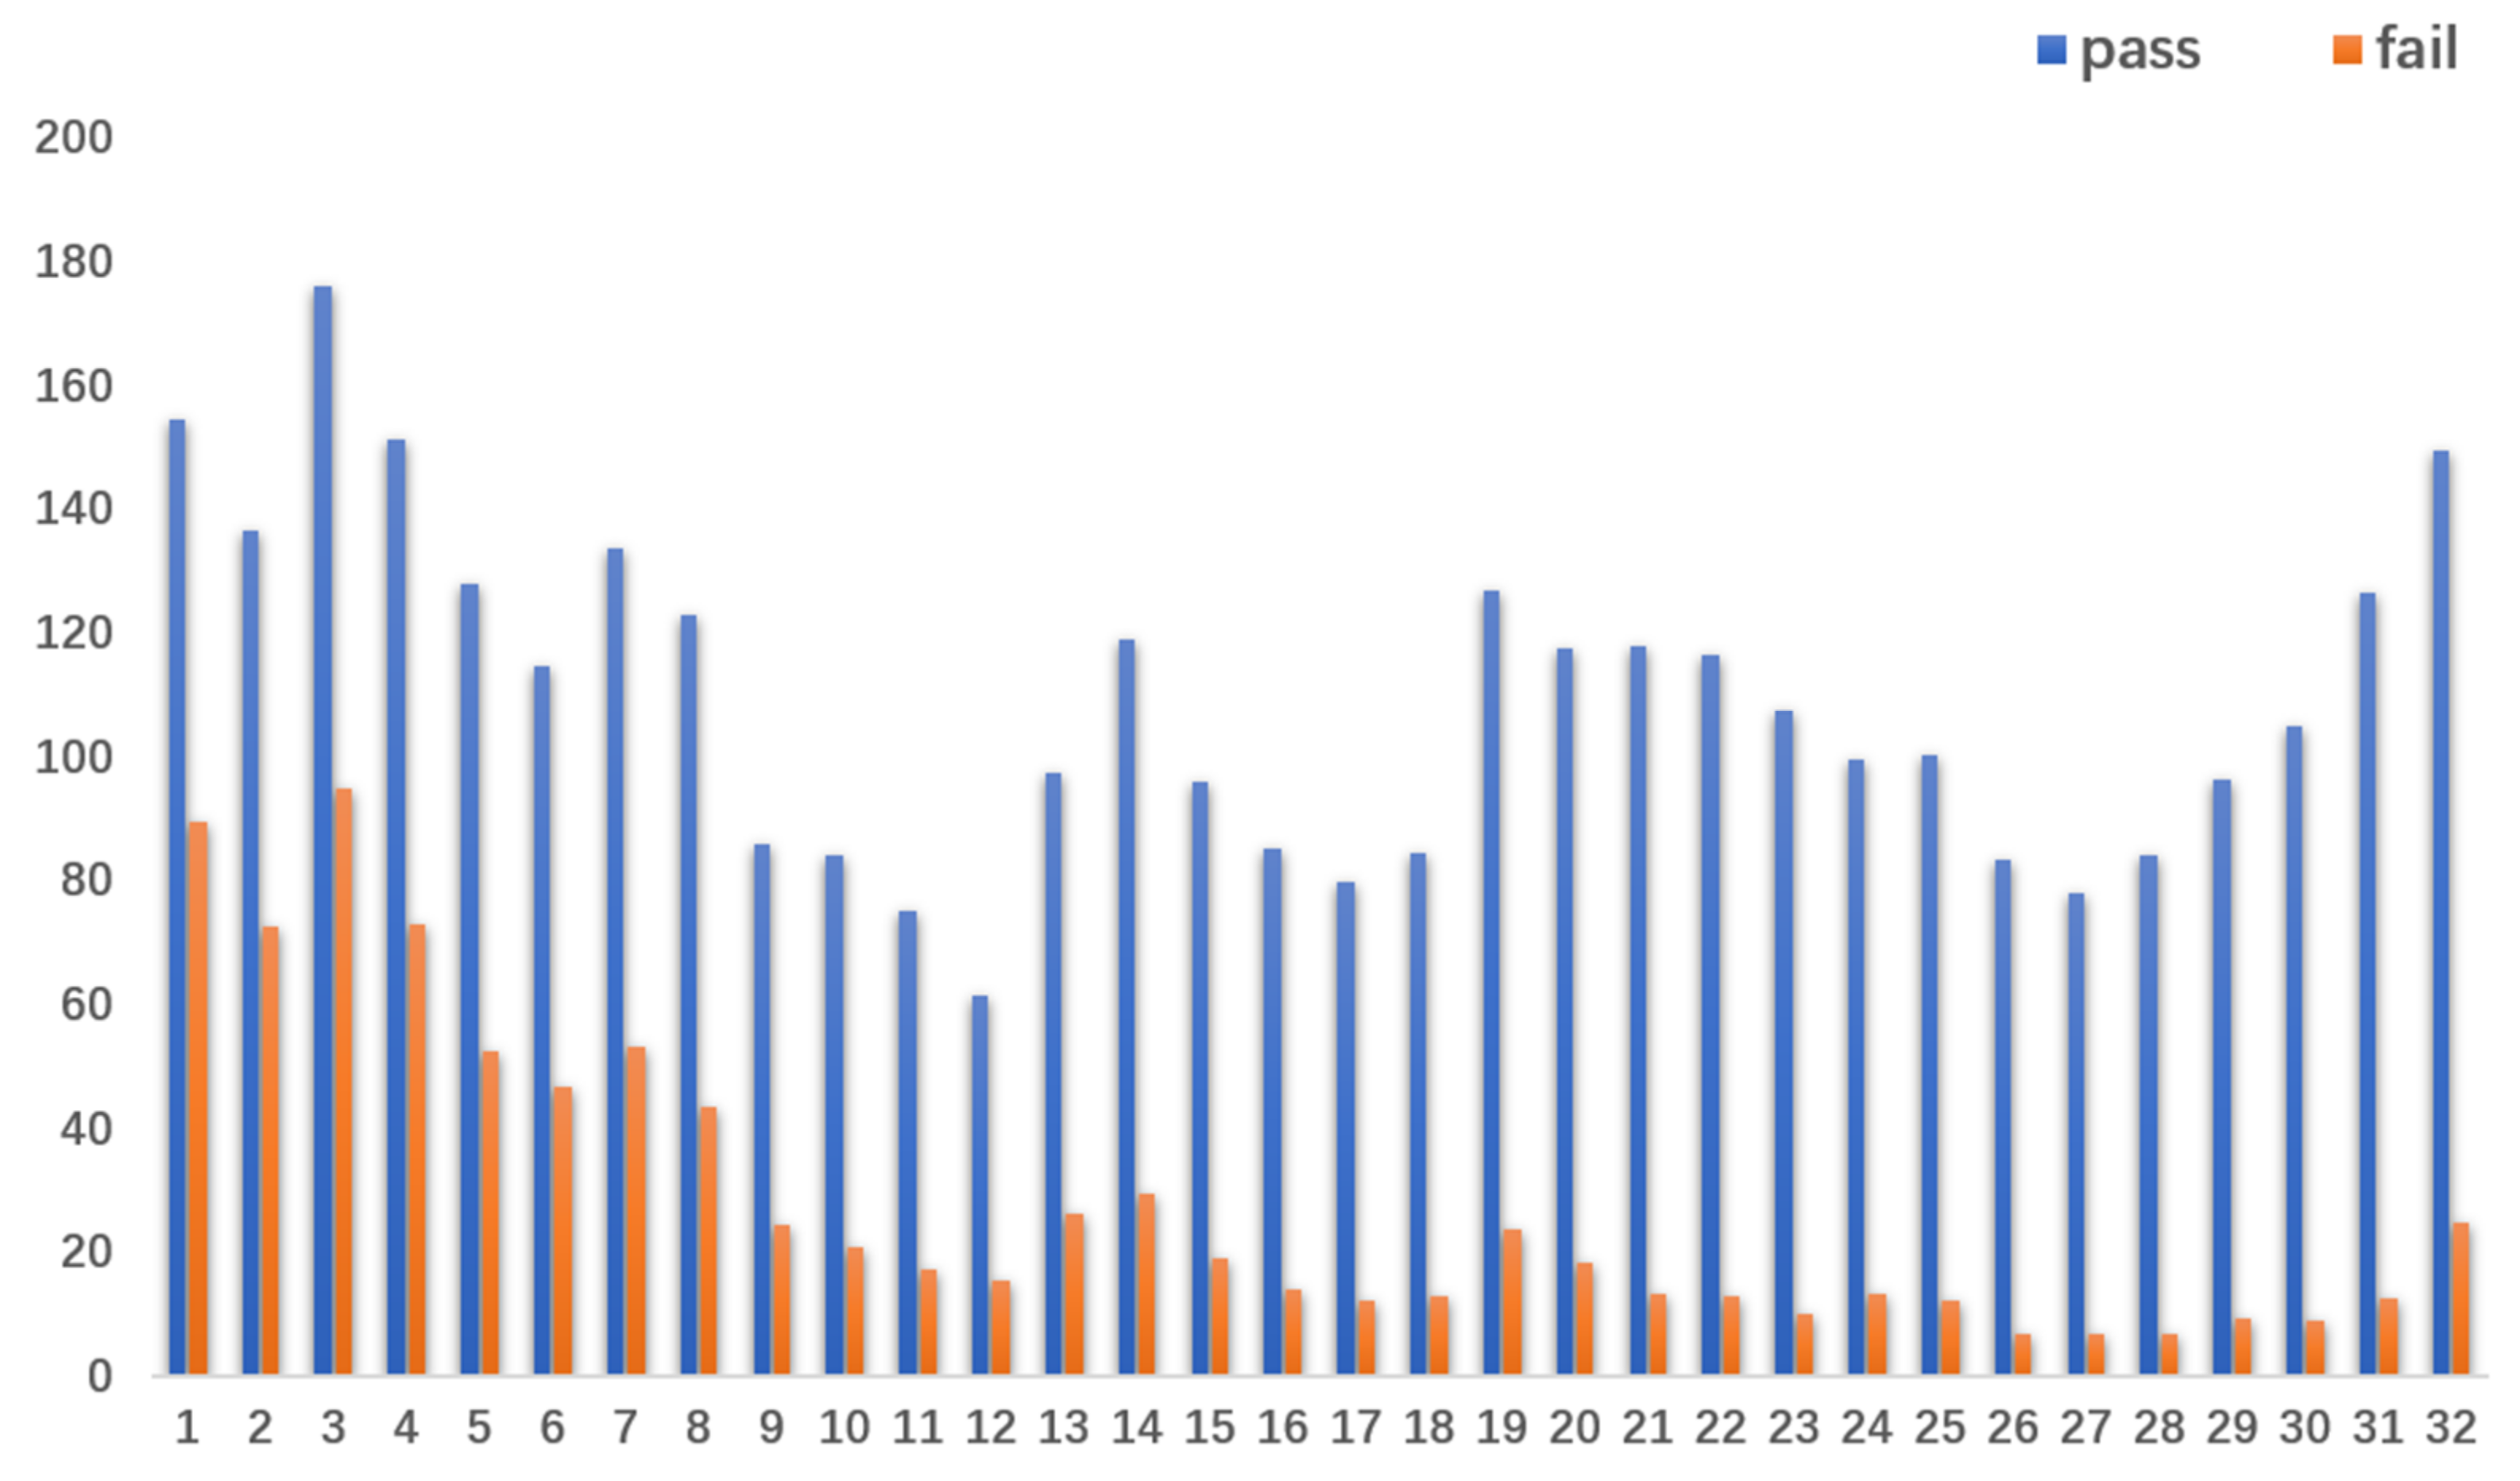
Firstly, we accumulated the learning behavior of students with different performance types in different weeks and used the average value to visualize the learning behavior of students with different performance types in different weeks. As shown in Figure 2, during the learning process, the students who passed always had more learning behavior than those who failed the course, this shows that the more learning behaviors students use during the learning process, the more likely they are to pass the course.
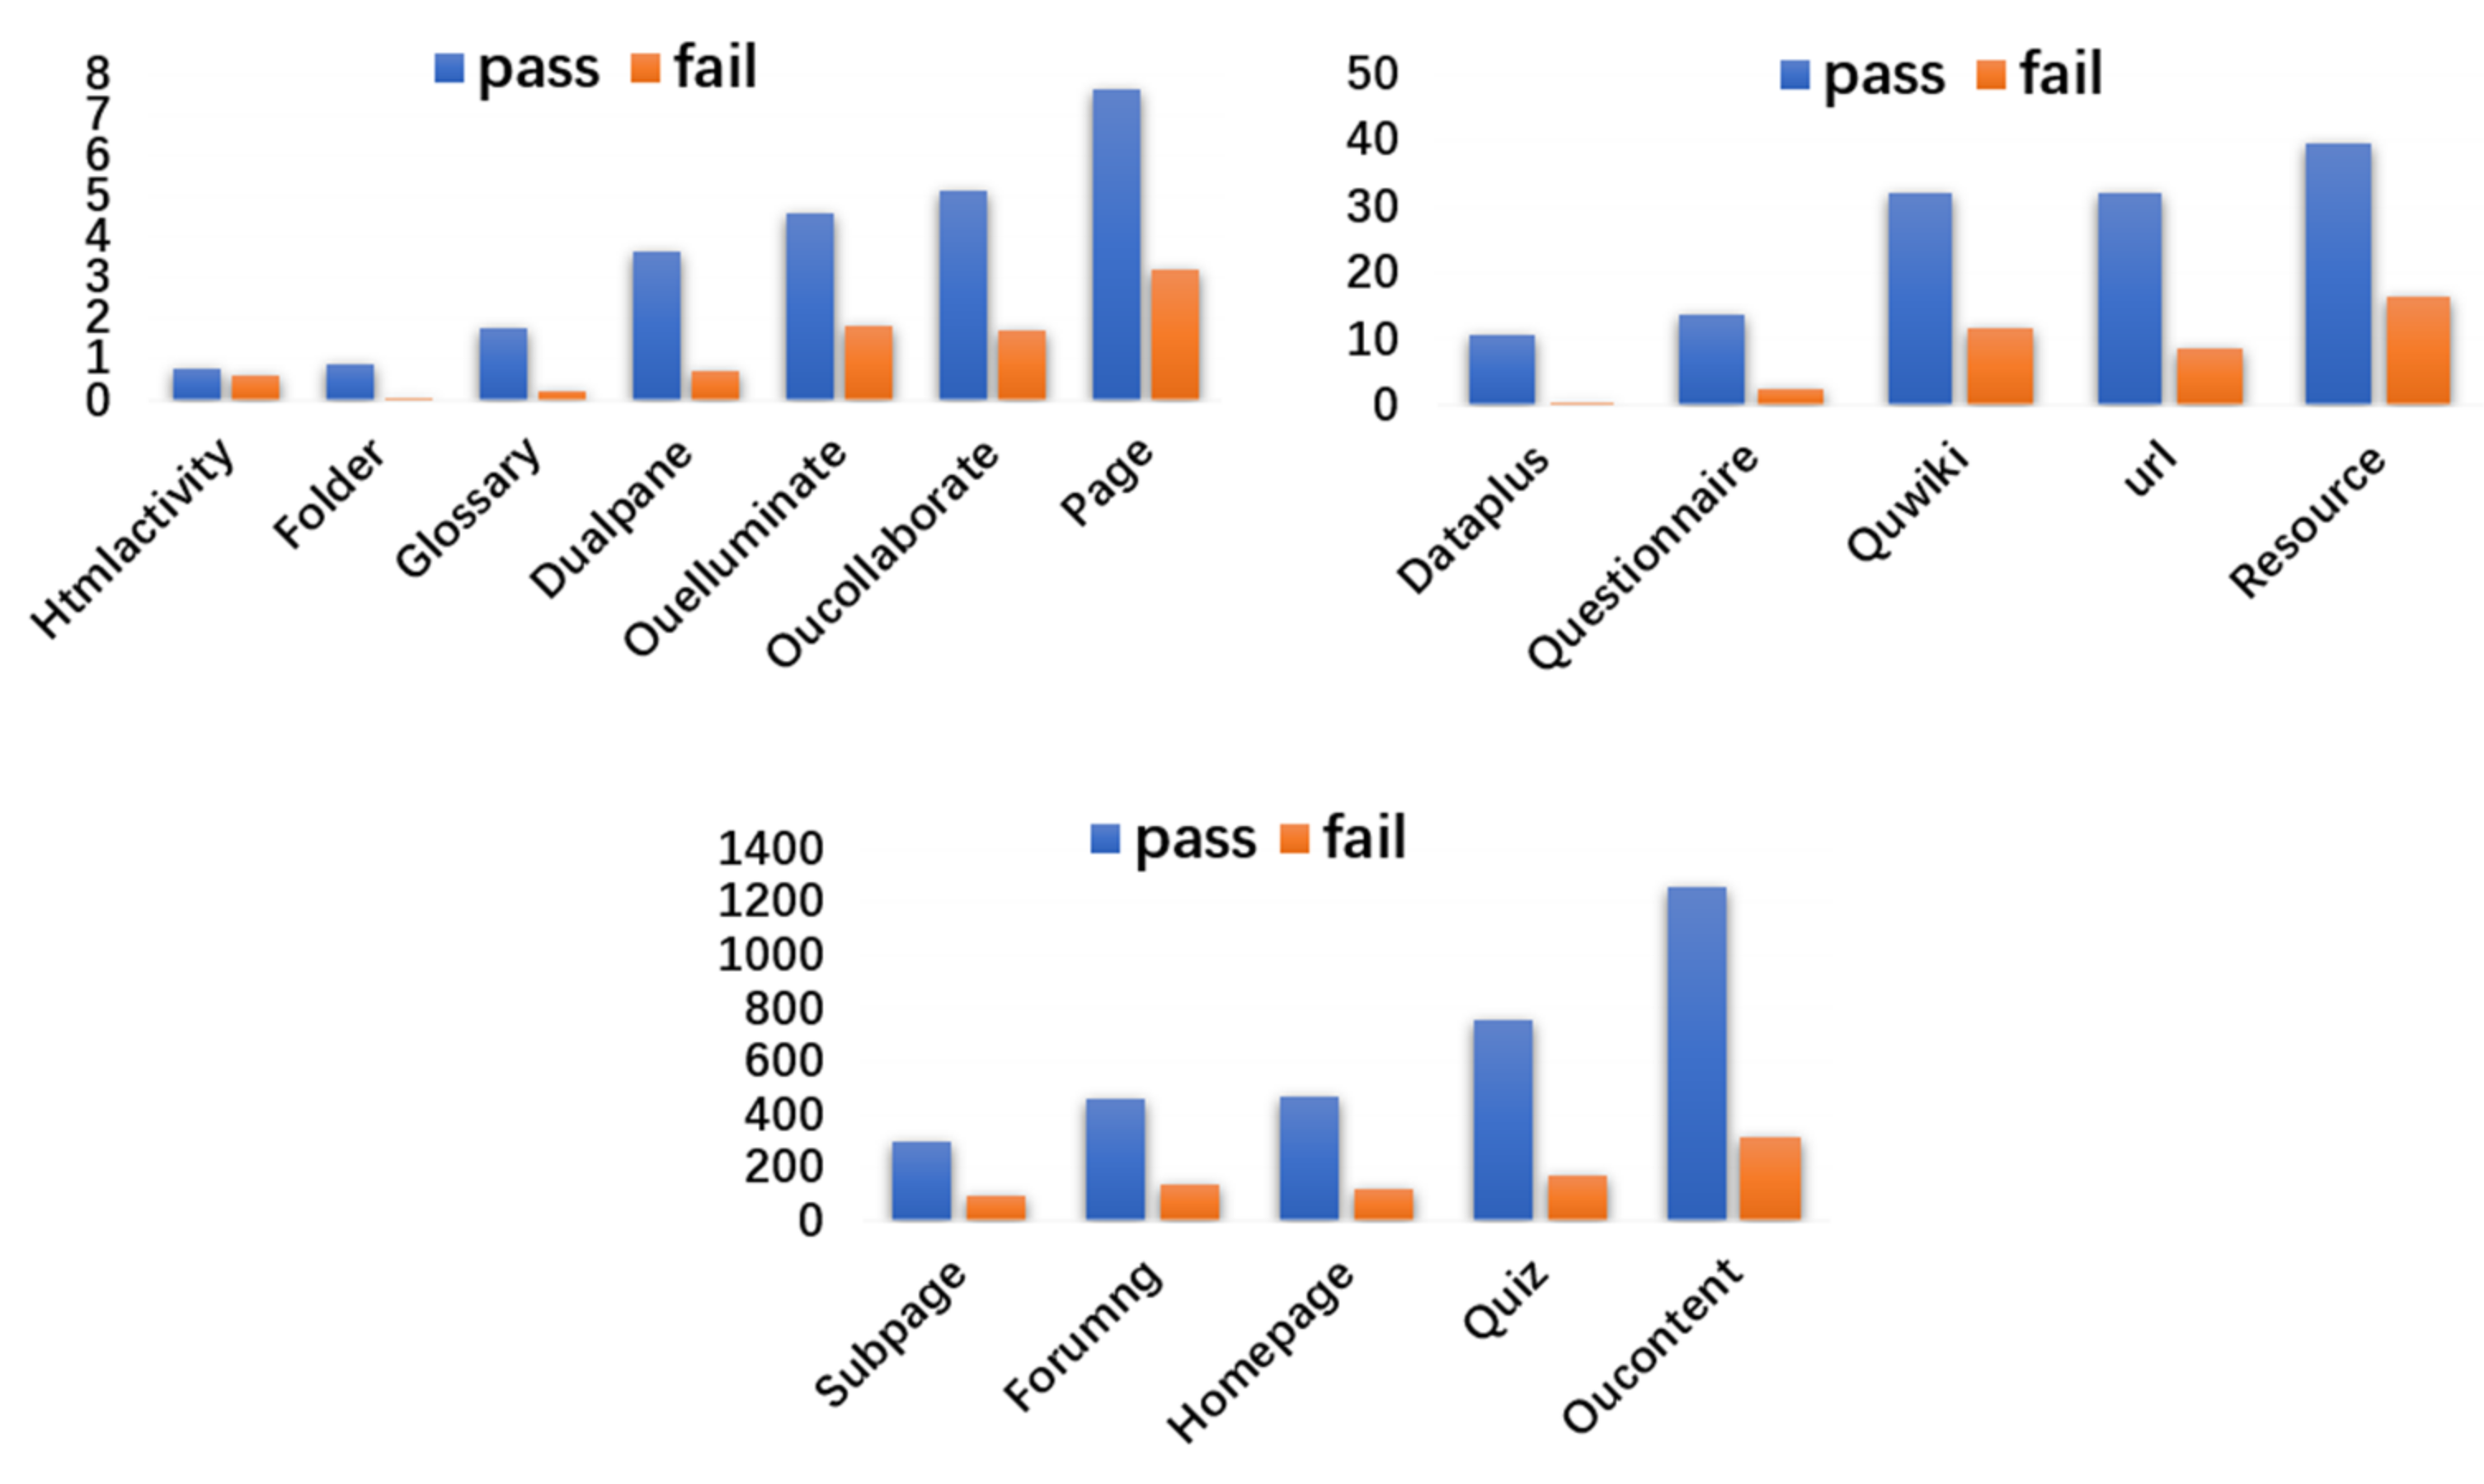
Secondly, we accumulated the different learning behavior types of students with different performance types and used the average value to visualize the learning behavior of students with different performance types on different learning behaviors. However, due to the large difference in the magnitude of learning behavior types, we will show them separately. As shown in Figure 3, during the learning process, the students who passed were more active than those who failed in all types of learning behaviors. It shows that the number of students in different learning behavior types hides some information that may help distinguish students with different performances. It also indicates that integrating the overall behavioral information will help improve the accuracy of student performance prediction.
4. Methodology
4.1. Task Definition
In course learning, when a student is given and only the student’s learning behavior is provided, the model we then build can make accurate early predictions of their learning performance. We accumulate the learning behavior of students in two different time spans to obtain the process-learning behavior and the overall-learning behavior of students and use these two types of learning behavior as the input of the model.
The process-learning behavior. Use to define the student’s process-learning behavior. The process-learning behavior of student s can be defined as: , where is the number of weeks of learning. Each element is defined as a one-dimensional matrix , where is the number of learning behavior types, and is defined as the number of clicks by student on the -th type of learning behavior in the -th study week (for example, the number of clicks on the homepage during the 12th study week). The data structure of this behavior is shown in Figure 4.
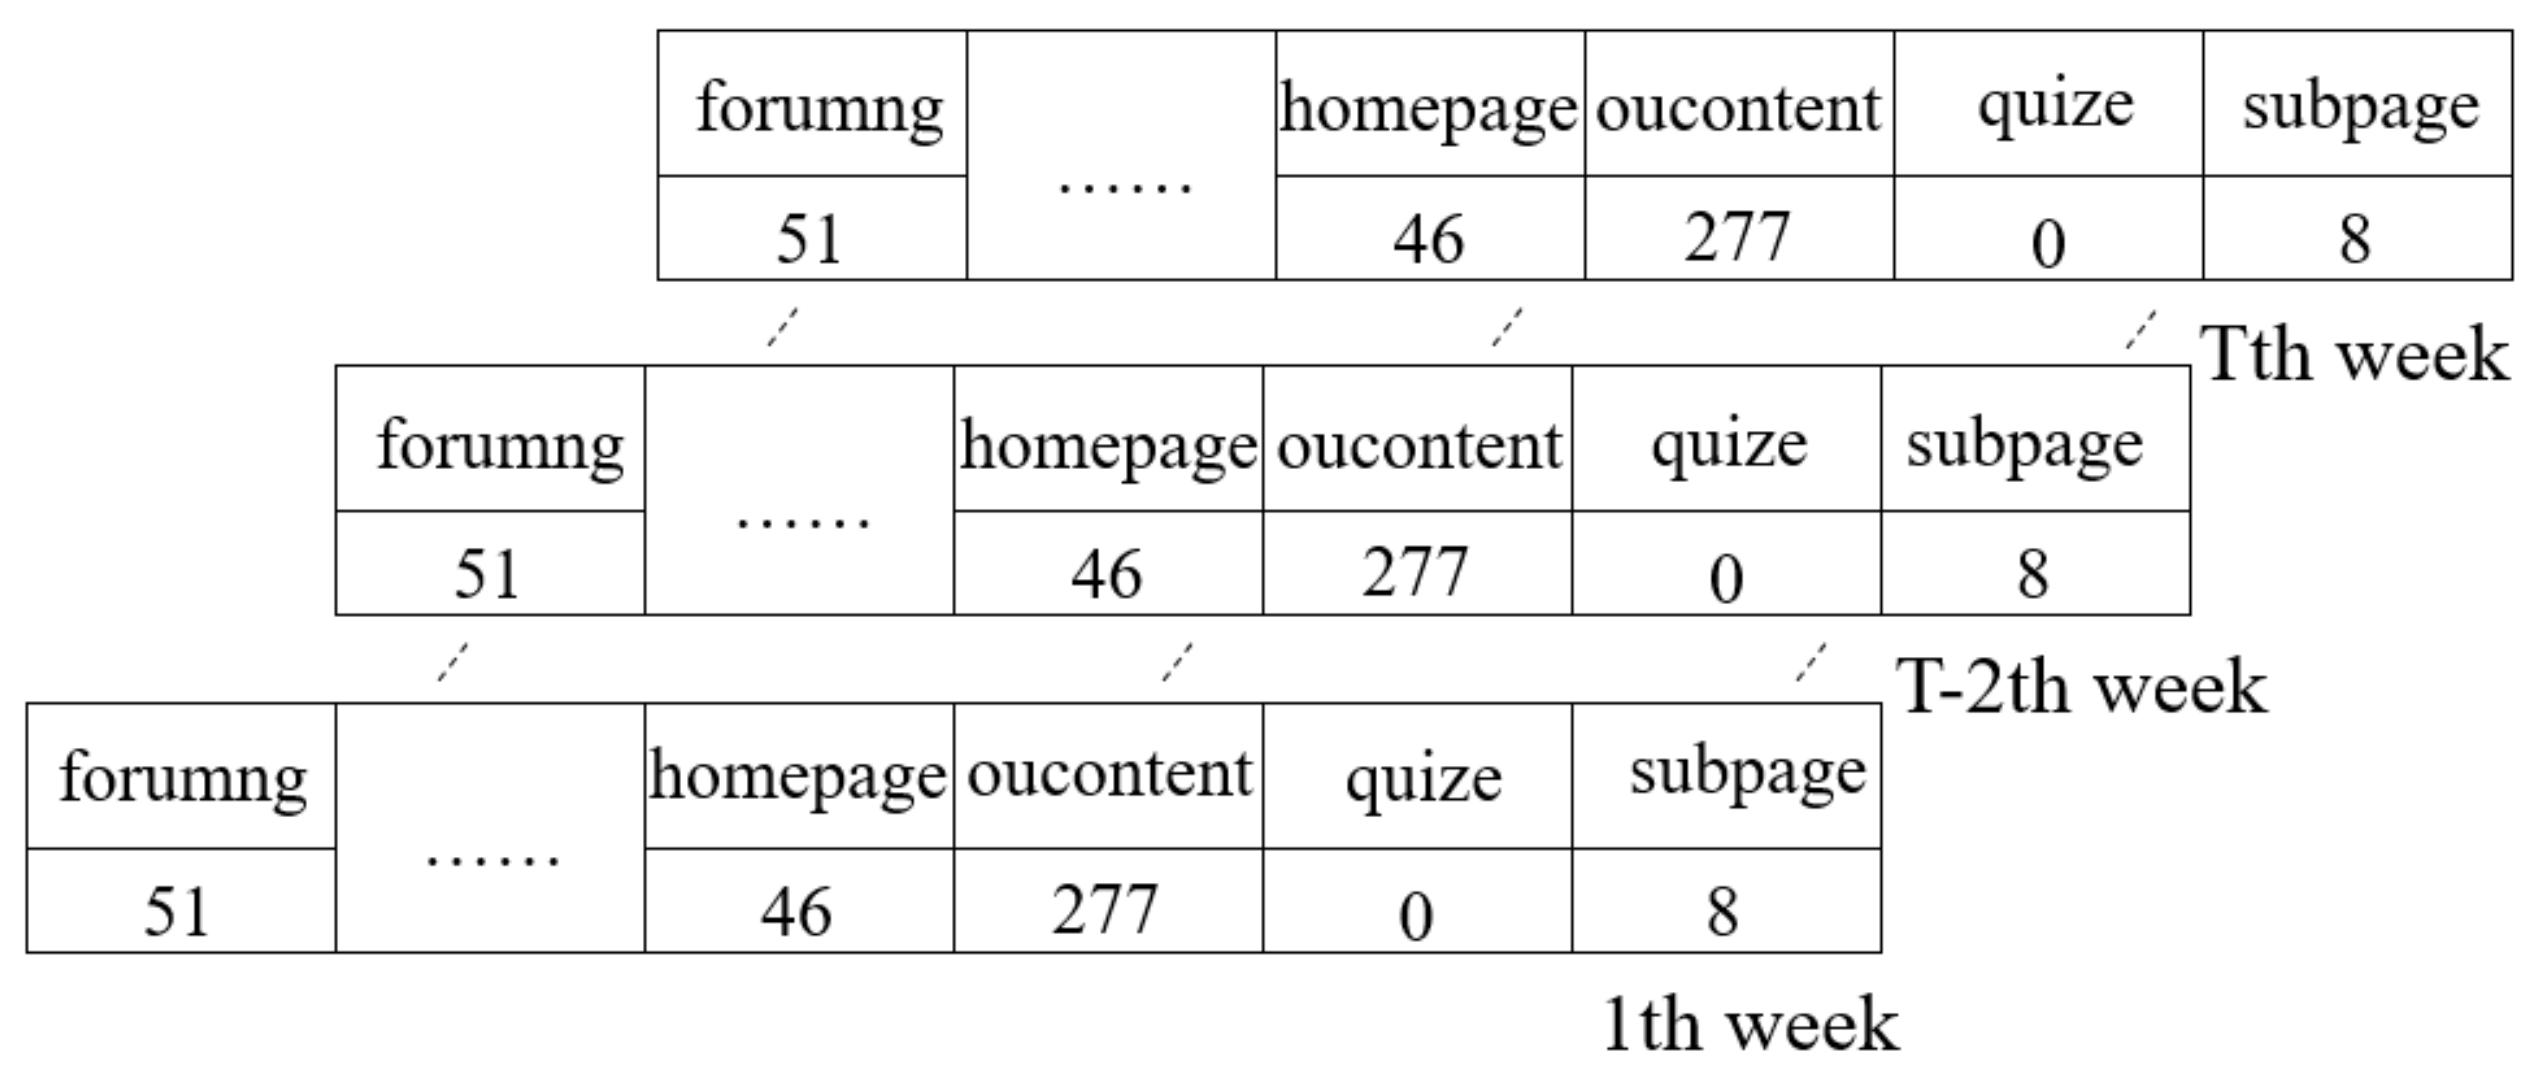
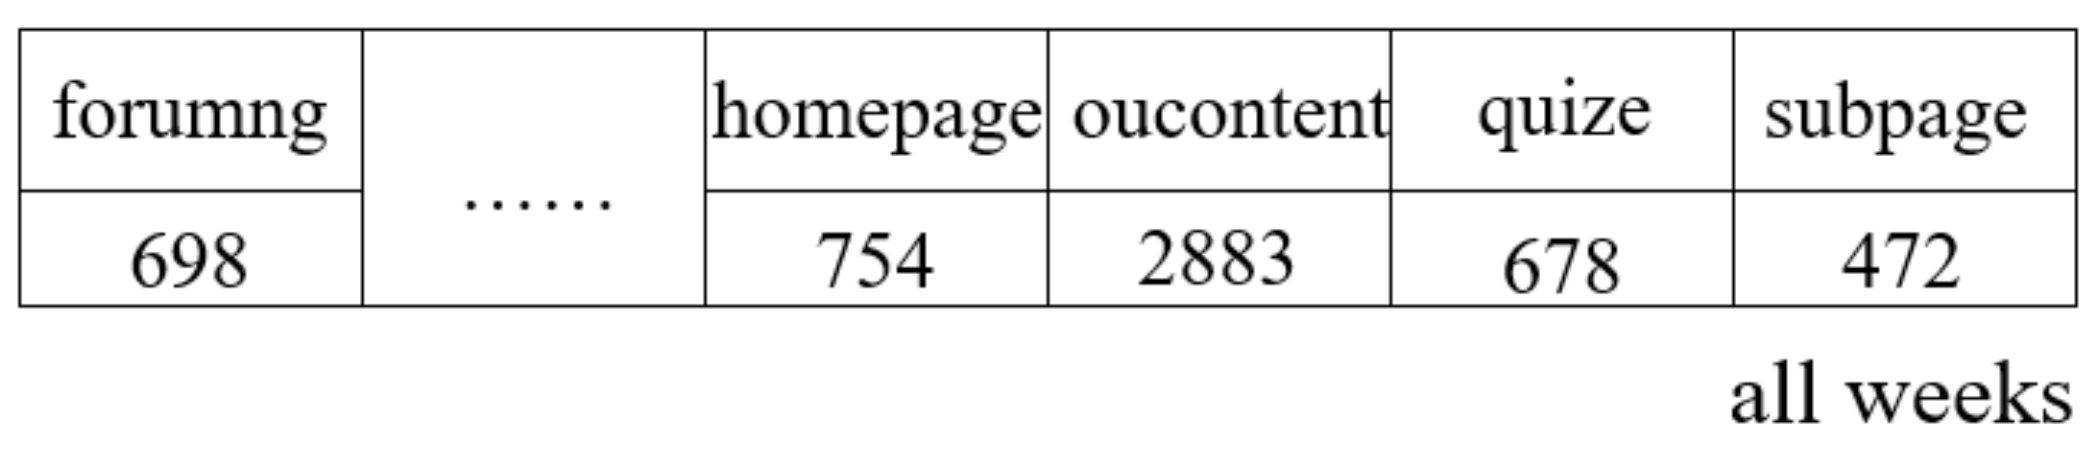
The overall-learning behavior. Use to define the student’s overall-learning behavior. The overall-learning behavior of student s can be defined as: , where is the number of learning behavior types, and is defined as the number of clicks on the -th learning behavior type of s during the entire learning process (for example, the number of clicks on the forum during the entire learning process). As shown in Figure 5.
Task description. We represent the student performance prediction task as a two-category prediction problem. Given a student’s process-learning behavior and the overall-learning behavior during a course, we can predict the student’s learning performance , where y ∈ {0,1}, 0 means that the student cannot pass the course, and 1 means that the student can pass the course.
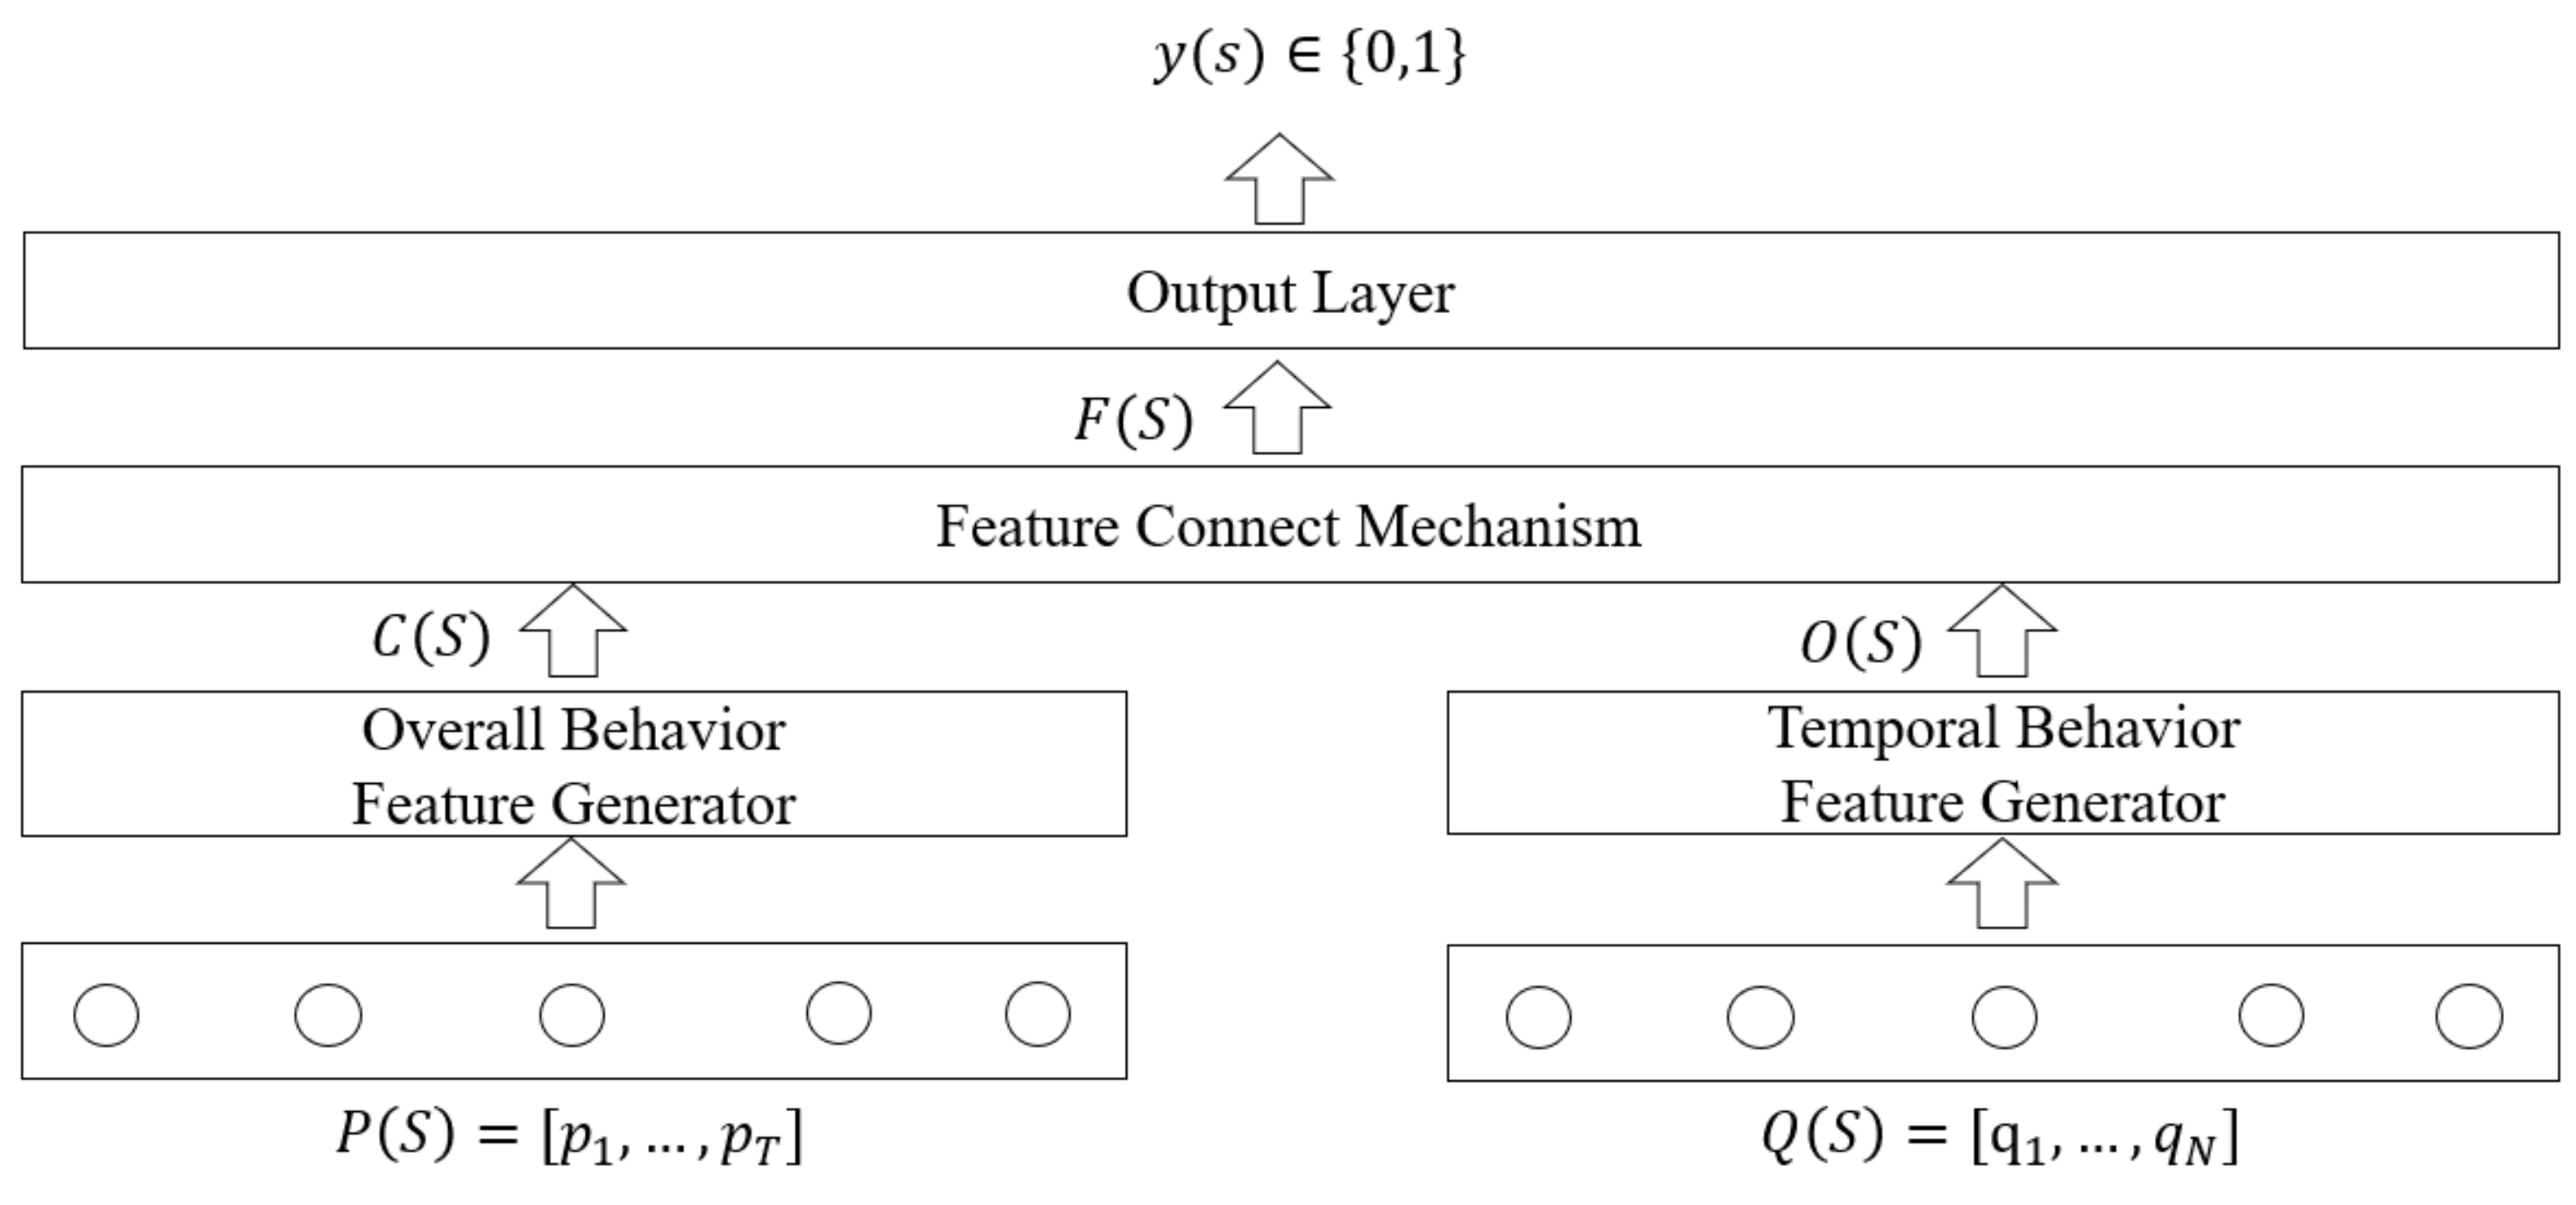
4.2. GDPN Framework
The method proposed in this paper, based on deep learning technology, aims to obtain potential behavioral features that can predict students’ learning performance from students’ learning behavior. It is different from existing student performance prediction methods, and we can learn separately from student learning data accumulated in different time spans to obtain more comprehensive potential behavior features. Specifically, we propose a new student performance prediction method (GRU&DNN Performance Prediction), GDPN. The method includes three important components which include the temporal behavior feature generator based on a gated unit neural network, the overall behavior feature generator based on a deep neural network, and the feature connect mechanism with an attention mechanism. The main purpose of our method is to use different generators to learn from student learning behavior data and extract the hidden information in this behavior data. In addition to that, through the feature connect mechanism, this hidden information is fully integrated, so as to better classify the students’ learning performance. The workflow of our method is shown in Figure 6:
Firstly, we take the process-learning behavior of student as the input of the temporal behavior feature generator (GRU) and extract the hidden information , where is the number of GRU network units. As a special recurrent neural network, GRU can realize the memory function through its own feedback mechanism and effectively mine the time information and semantic information in the learning behavior sequence. GRU can control the flow of information by the reset gate and the update gate to capture the short-term and long-term relationships in the time series. Using the input of learning behavior in different time periods, GRU will compare the input and historical hidden information to obtain the output hidden information. This hidden information contains not only the information on the current learning behavior, but also the previous learning behavior information on the student, therefore it can describe the specific learning process of the student. Since this hidden information is extracted from the student’s process-learning behavior, we refer to this type of hidden information as the temporal behavior features.
Secondly, we take the student’s overall-learning behavior as the input of the overall behavior feature generator (DNN) and dig out the hidden information , where is the number of neurons in the output layer of the DNN. It is a given that DNN possesses good non-linear mapping and generalization abilities and can fully learn the relationship between different features. When using DNN to process the overall-learning behavior, through the full connection between the different neural network layers and the nonlinear processing of neurons, it can simulate the complex nonlinear relationship between different learning behaviors to obtain the hidden information. This hidden information reflects well the overall-learning behavior pattern of students and describes the overall learning characteristics of students. Since this hidden information is extracted from the overall-learning behavior, we refer to this type of hidden information as the overall behavior feature.
Finally, we incorporate the previously obtained two types of hidden information and input feature connect mechanism. In the feature connect mechanism, a simplified neural attention mechanism is used to assign appropriate weights to this hidden information, and the hidden information is multiplied by the corresponding weights to output student behavior features for prediction , where is the sum of the dimensions of different hidden information. In this way, we have realized the joint training of different feature generators, which can better learn the influence weights of different types of hidden information on student performance and optimize all parameters.
4.2.1. Temporal Behavioral Feature Generator
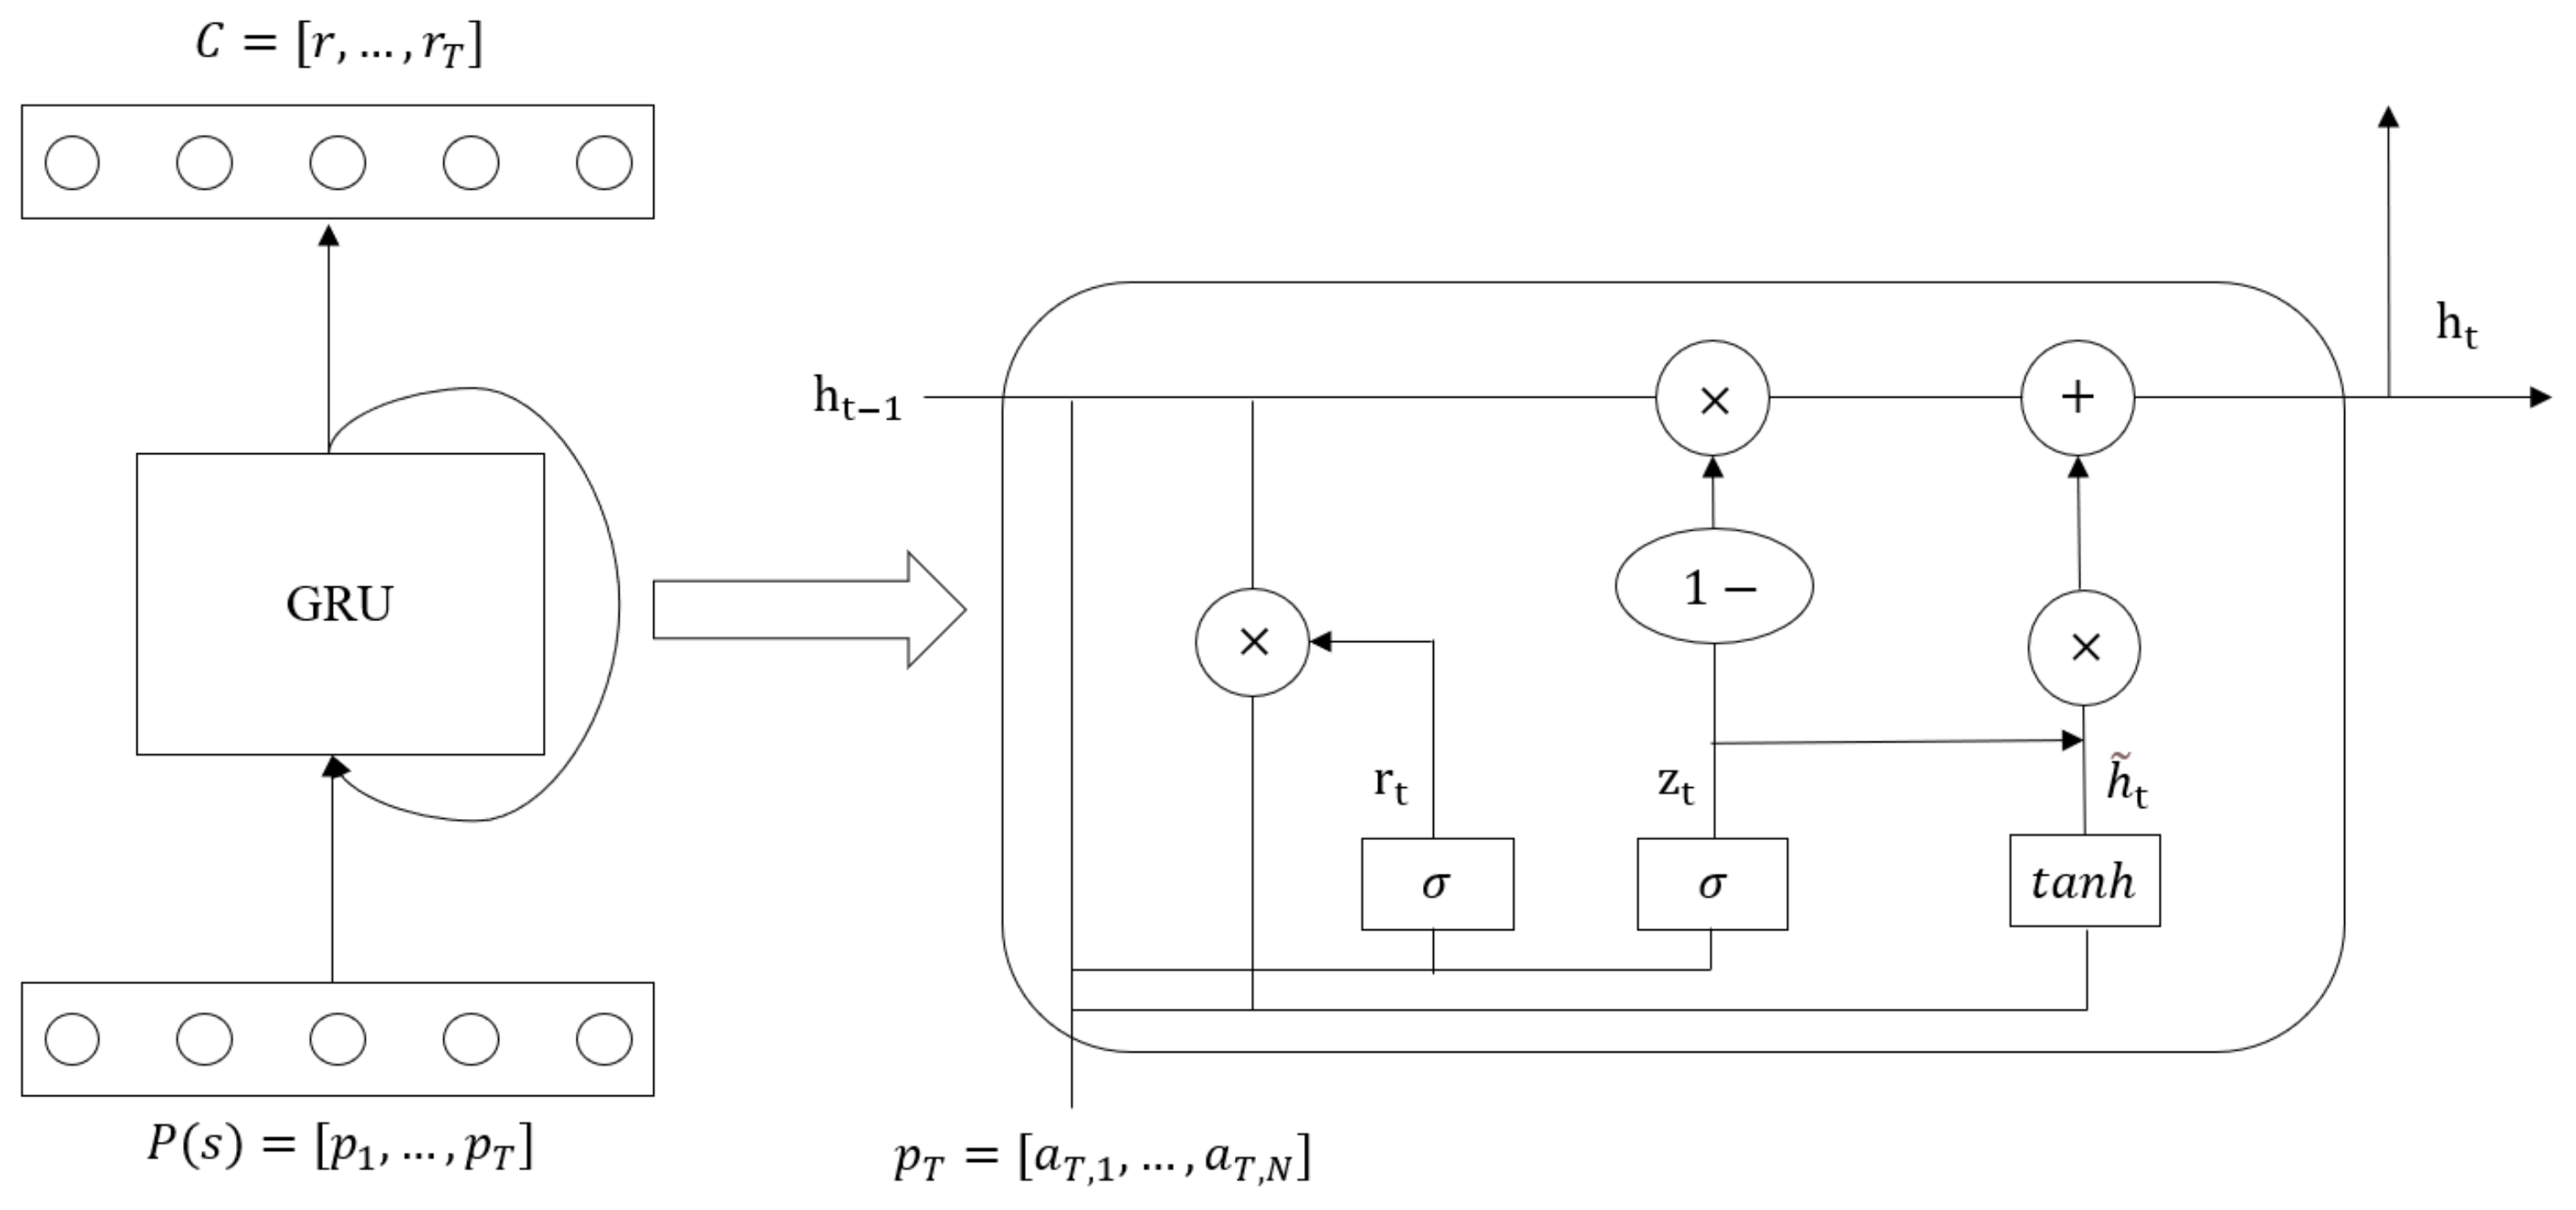
Using the temporal behavior feature generator, our purpose is to extract temporal behavior features through GRU. Cho et al. [26] proposed GRU inspired by LSTM, which is relatively simple to calculate and implement. As opposed to a traditional recurrent neural network, GRU can retain important features through various goalkeepers to ensure that it will not be lost in the long-term propagation process. Therefore, we use GRU to extract the temporal behavior features hidden in the process-learning behavior.
The structure of the temporal behavior feature generator is shown in Figure 7. When the model is trained to the last time step, we input the learning behavior of student in the last week into the GRU, and the GRU can output temporal behavior features describing the specific learning process of the student. The gating mechanism in GRU can effectively control the flow of information and better capture the association relationship with longer time steps in the time series. There are reset and update gates in GRU. The reset gate is used to help capture the short-term relationships in the learning behavior sequence, and the update gate is used to help capture the long-term relationships in the learning behavior sequence. When we assume that the number of hidden units in the GRU is and the historical hidden information is , the calculation process of the reset gate and update gate at time step is as follows:
The inputs of the reset gate and the update gate are the input at the current time step and the historical hidden information , which are calculated through a fully connected layer with an activation function of .
GRU will calculate candidate hidden information for time step based on the output of the reset gate, historical hidden information , and learning behavior in the current week. The calculation process is as follows:
In Formula (3), and perform element-wise multiplication (its symbol is ⊙). It then connects the result of the element-wise multiplication operation with , and calculates the candidate hidden state through a fully connected layer with an activation function of . In this calculation process, the reset gate controls how the hidden information on the history flows into the candidate’s hidden information of the current time step and discards the historical information that has nothing to do with student performance.
Finally, the hidden information trained at the time step , that is, the time series feature , will be calculated according to the output of the update gate, the historical hidden information , and the current candidate hidden information :
In Formula (4), the update gate controls how the historical hidden information is updated by the candidate hidden information containing the learning behavior information of the current week. After the last week of learning behavior training, the obtained not only hides the information in the current week’s learning behavior, but also hides the information on the other week’s learning behavior. Therefore, the extracted time-series features can describe the specific learning process of students.
4.2.2. Overall Behavioral Feature Generator
Different from the temporal feature generator, using the overall behavior feature generator, our purpose is to extract the overall behavior feature through DNN [27]. Since the time-series features extracted by GRU from the process-learning behavior mainly describes the specific learning process of the student, some key information hidden in the overall-learning behavior of the student will be ignored. DNN can learn hidden information related to student performance from the overall-learning behavior, which can increase the importance of this information.
Among the students who pass the course, the students’ specific learning process will be different, but the students’ investment in learning is similar. For example, some students who have passed the course will start to study diligently at a certain stage at the beginning of the course. Compared with students who pass the course normally, these students have different learning behavior sequences in the learning process, but their overall-learning behavior is similar. They will have a similar number of forum visits, homepage visits, etc. throughout the learning process. Therefore, when predicting student performance, we need to pay attention to the important information hidden in the overall-learning behavior of students to ensure that such students can be correctly classified.
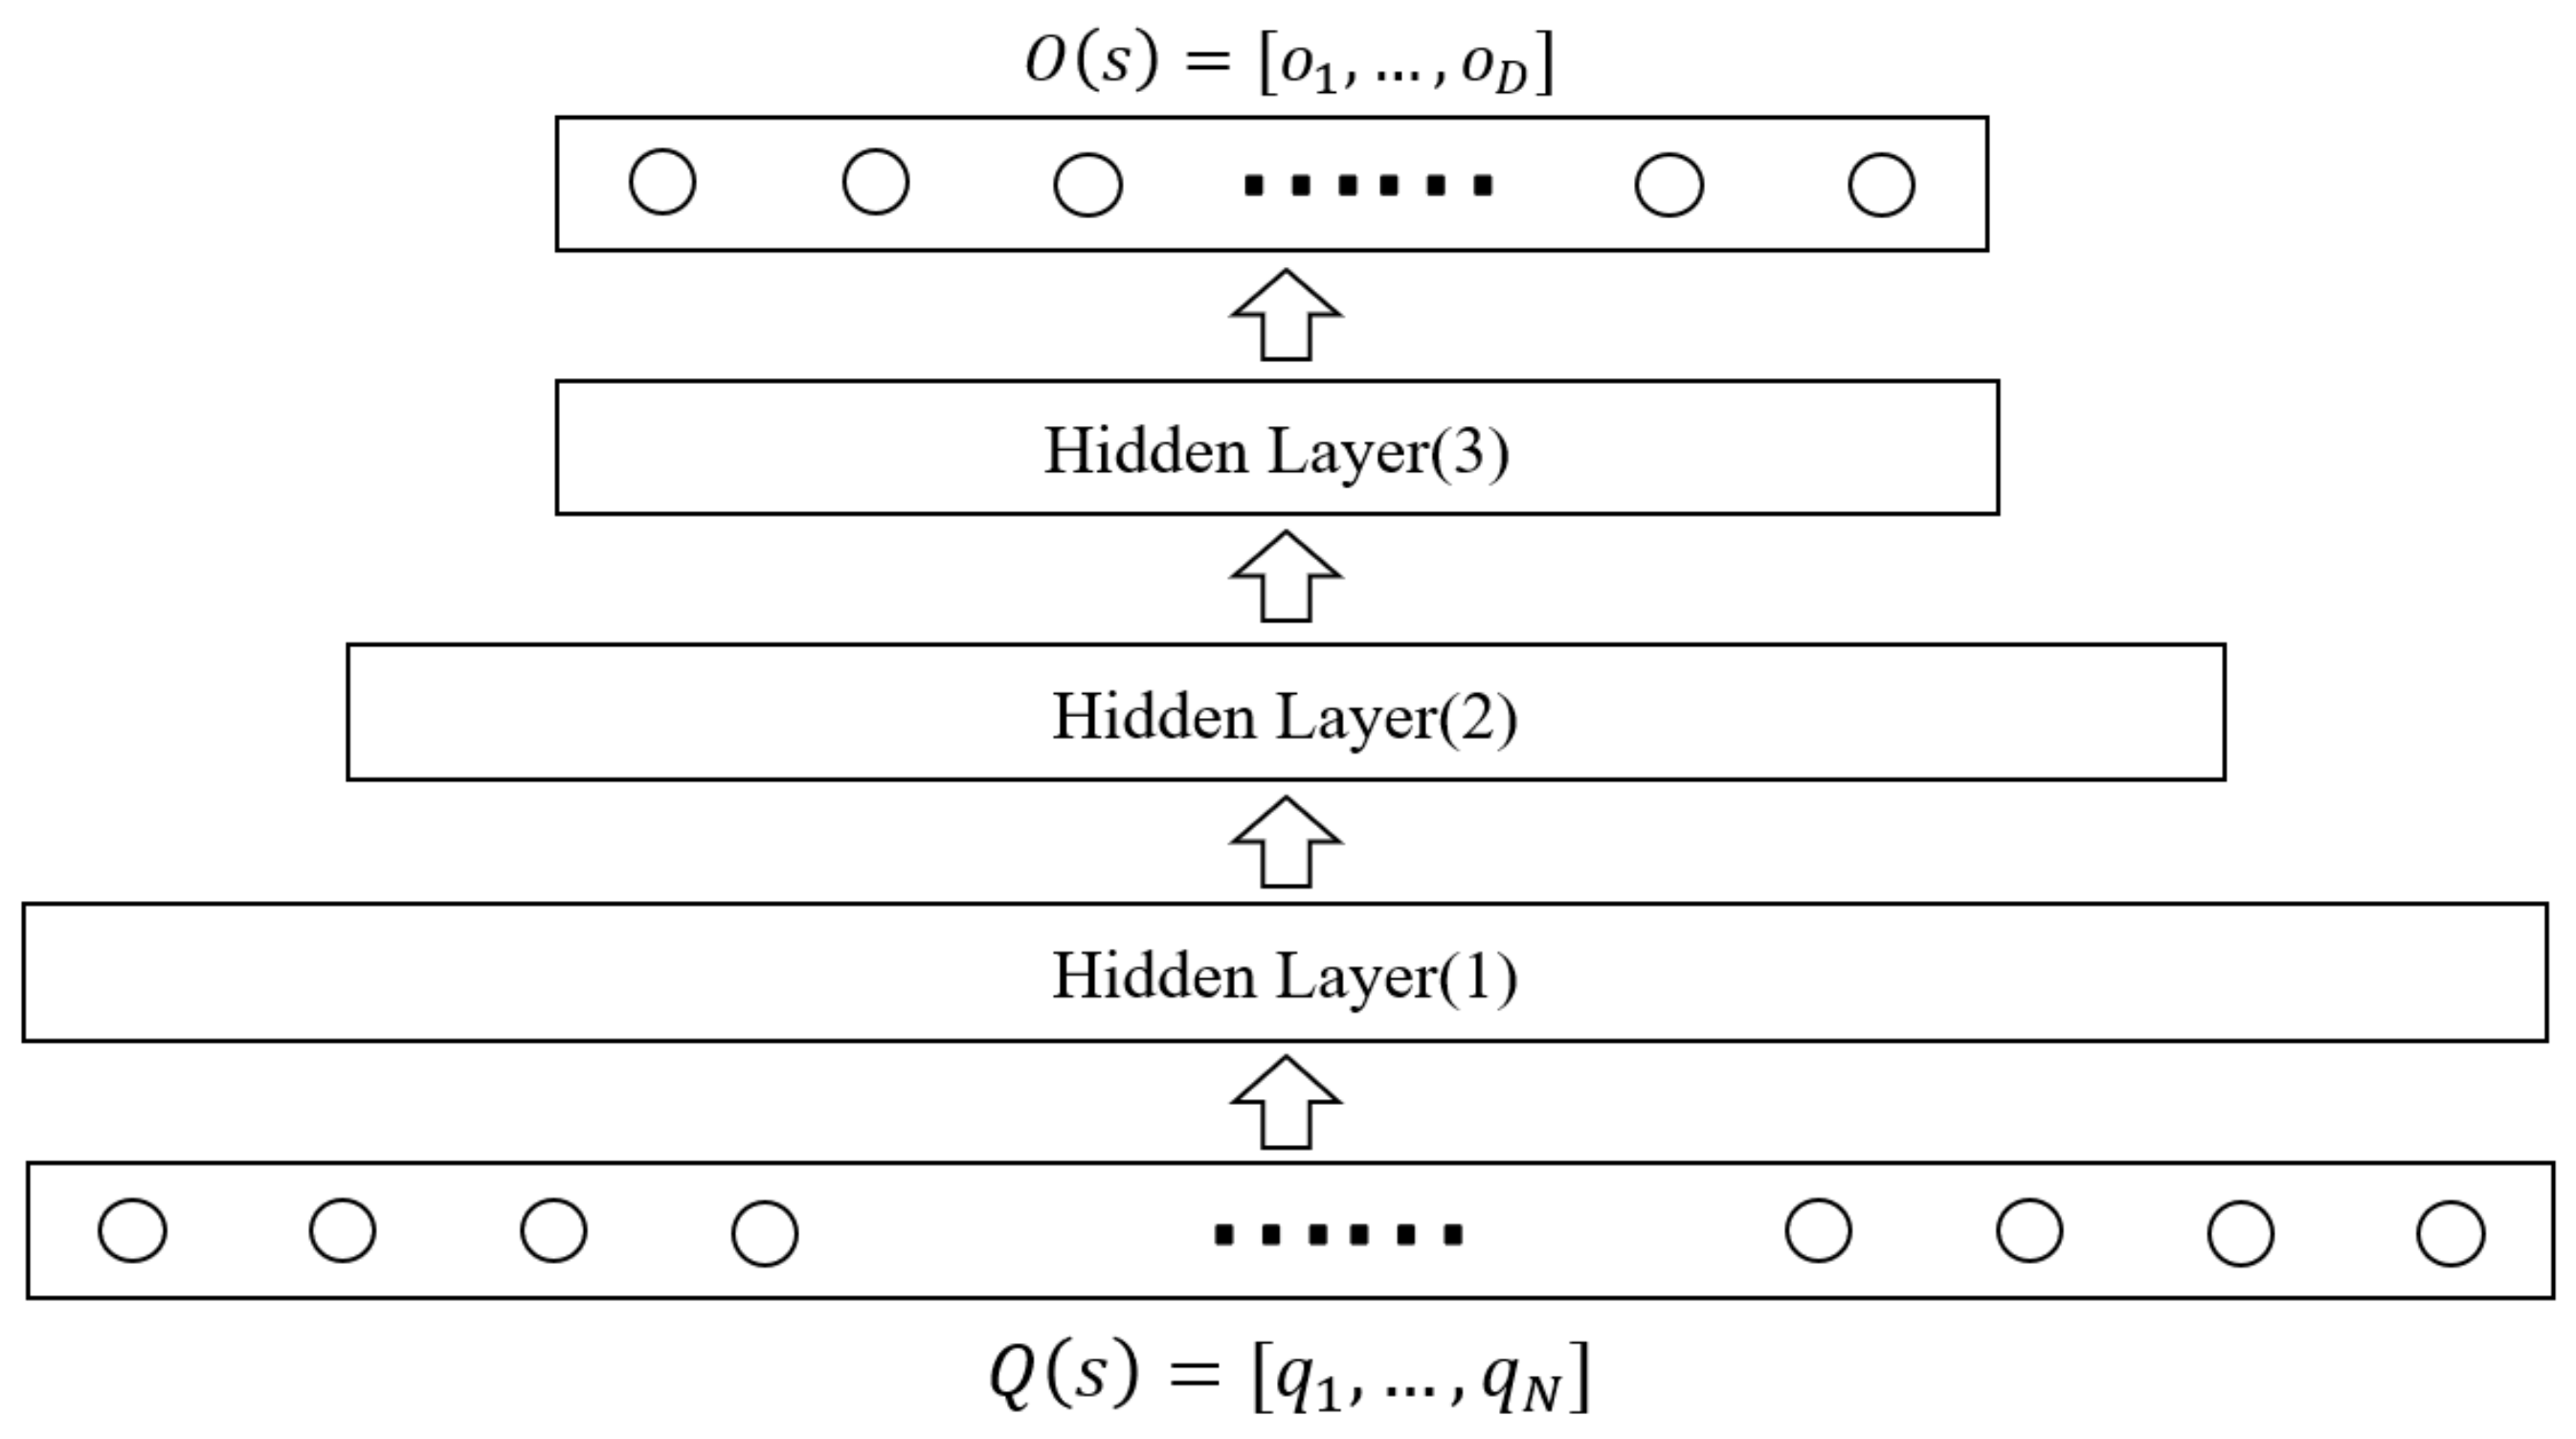
When extracting hidden important information from the overall-learning behavior of students, compared with traditional machine learning, DNN can fit more complex nonlinear features, and extract deeper hidden information by learning high-level feature interactions. Therefore, we use DNN to extract the overall behavior features hidden in the overall-learning behavior. The structure of the overall behavior feature generator is shown in Figure 8. The overall-learning behavior of student is sent to the hidden layer of DNN. After the training of the hidden layer in the neural network, the hidden information in the overall-learning behavior is output, that is, the overall behavior feature. The calculation process of each hidden layer is as follows:
where is the input of the -th hidden layer and the output of the -th hidden layer, and are the weight and bias of the -th hidden layer, respectively, and is the activation function of the neuron.
DNN learns the complex relationship between different behaviors through the full connection between different layers and the nonlinear calculation of the activation function. The complex relationship between these different behaviors reflects the overall learning characteristics of students so that the overall behavioral feature related to student performance prediction can be extracted.
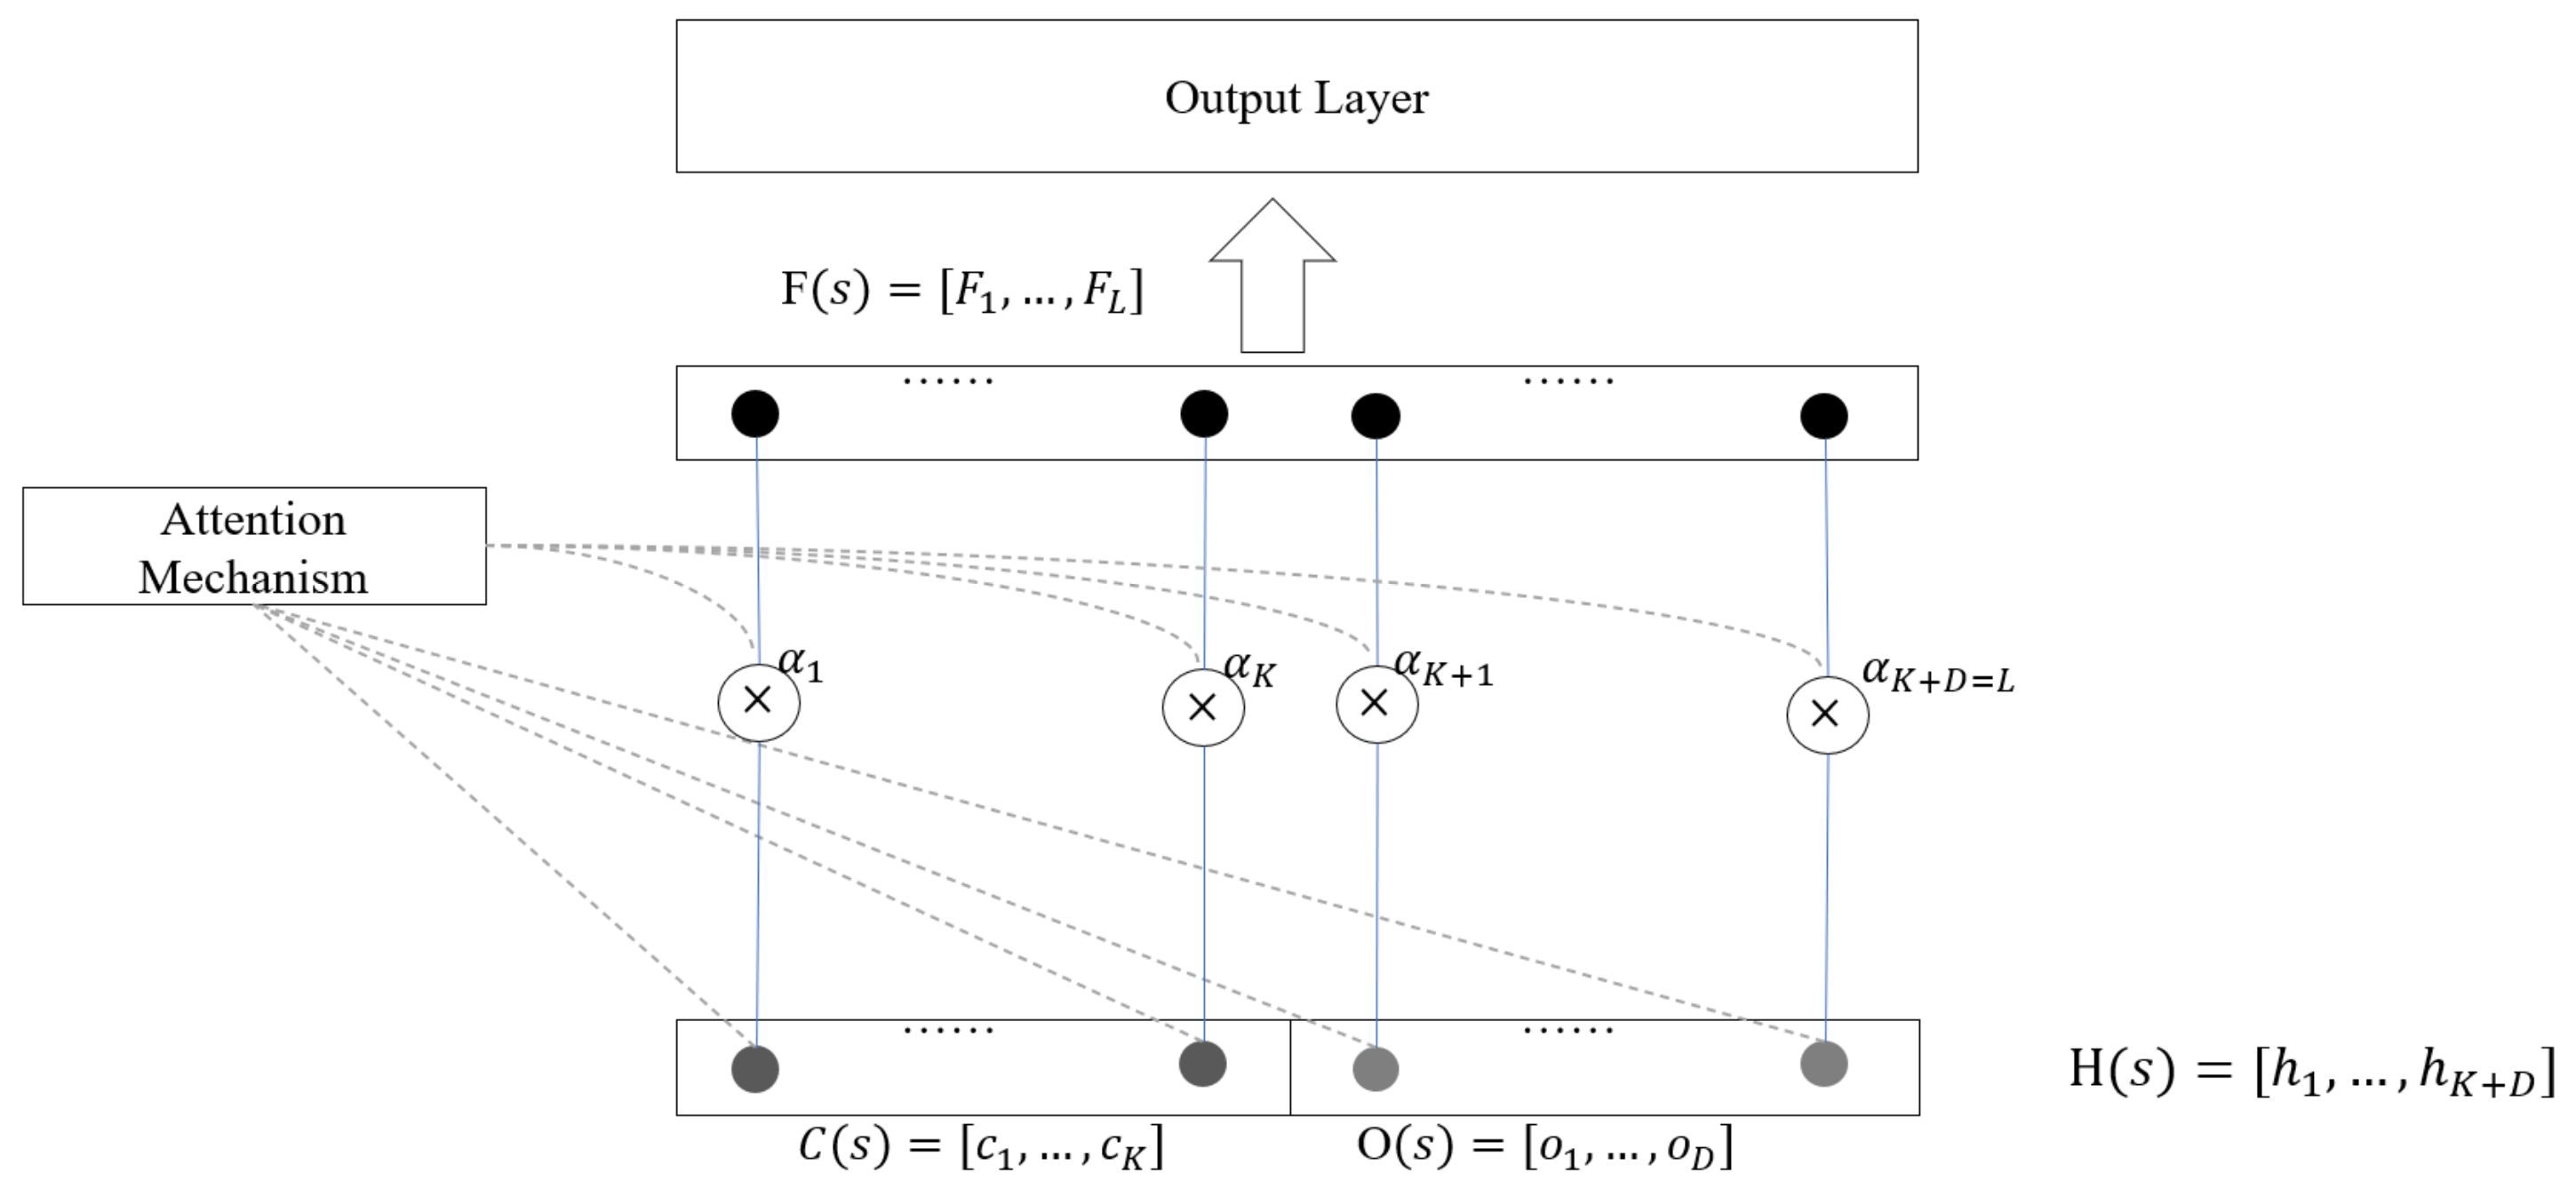
4.2.3. Feature Connect Mechanism
In the feature connect mechanism, we use the attention mechanism to evaluate the importance of temporal behavior features and overall behavior features. Then, after processing the two different types of features according to the evaluation results, the feature vector for prediction is obtained. Finally, we input into a fully connected layer whose activation function is for joint training to achieve early prediction of students’ learning performance.
The structure of the feature connect mechanism is shown in Figure 9. When evaluating the importance of different types of behavior features, we used the feed-forward neural network attention mechanism proposed by Cho et al. [28]. When studying machine translation, the author uses this model to calculate the correlation of each source word, helping the decoder to focus more on the correct source word vector when decoding. Therefore, when we use both temporal and overall behavior features to predict student performance, the feed-forward neural network attention mechanism can help the model to focus more on the features related to student performance when predicting.
We input the temporal and overall behavior features of student into the attention mechanism to learn the importance of different types of features. The calculation process is as follows:
The attention mechanism uses the learning function a to learn the influence factor of each feature vector on the result and standardizes to obtain the weight corresponding to the feature vector. Finally, we multiply the feature vector by its corresponding weight to reach the final feature vector for prediction. The feed-forward neural network attention mechanism is essentially a hidden layer with a activation function.
Its input is a feature vector, and the output is a weight assigned to each feature vector. In the feature connect mechanism of this paper, we will use the attention mechanism based on different activation functions to obtain the most suitable personalized attention mechanism for the GDPN model.
5. Experiment
5.1. Compared Methods & Evaluation Metrics
We used a series of deep learning-based algorithms and models: Deep Neural Network (DNN), Simple Recurrent Network (SRN), Long Short-Term Memory Neural Network (LSTM), Gate Recurrent Unit Neural Network (GRU), and Convolutional Neural Network (CNN).
The following are the models proposed in this paper:
GDPN: The model proposed in this article;
For comparative evaluation, we used several evaluation metrics commonly used to evaluate classification algorithms: Accuracy, Precision, Recall, F1-score, and AUC.
5.2. Experimental Results and Discussion
In order to compare the predictive effect of student performance between our proposed model and the baseline model, we conducted the following experiments. Each experiment was run 10 times and the average of the results was taken.
5.2.1. Impact of the Attention Mechanism with Different Neuron Functions
The effect of the attention mechanism will be different if the activation function of the hidden neuron is set differently. In the attention mechanism, is often used as the activation function, whose purpose is to ensure that the sum of the weights assigned to each feature is 1. The features used for student performance prediction in this article are extracted from two different models and the weight sum of each feature may not be 1, so it is necessary to consider the impact of different activation functions on the prediction performance of the model. The commonly used activation functions are and . This article compares the effects of the attention mechanism using these four activation functions on the prediction performance of the model. The experimental results are shown in Table 3:
From the experimental results, it can be found that when the function is used as the activation function in the attention mechanism, the effect of predicting student performance is poor. When using the function, the best performance is obtained on various evaluation metrics, so in subsequent experiments, we will use the sigmoid function as the activation function of the attention mechanism.
5.2.2. Impact of Different Components of the Model on Prediction
The GDPN model mainly includes the overall behavior feature generator and the temporal behavior feature generator. In order to study the impact of different components of the model on the predictive ability, we split the model structure and conducted separate experiments to explore the influence of different parts. The experimental results are shown in Table 4:
When only the DNN model is used to predict student performance, its accuracy rate is 89.1%. The results show that using overall behavior features can predict student performance well. When only the GRU model is used to predict student performance, its various evaluation metrics standards are better than that of the DNN model, which shows that students’ temporal behavior features play a more important role in predicting student performance. When the GDPN model is used to predict student performance, the model can simultaneously extract the temporal features and the overall features of students’ learning behavior. When modeling the students’ learning process, not only the specific learning process of the students, but also the overall learning characteristics of the students are considered. The model uses a feed-forward neural network attention mechanism, which can assign appropriate weights to different types of features, thereby achieving better prediction of student performance. It can be seen from Table 5 that using the GDPN model to predict student performance achieved good results in various evaluation indicators.
5.2.3. Comparison of Different Deep Learning Prediction Methods
In the last experiment, it was shown that the GDPN prediction model is superior to DNN and GRU, so in this experiment, we compared GDPN with other deep learning prediction methods of student performance prediction. The comparison results are shown in Table 5.
It can be seen from Table 5 that LSTM is better than SRN; this is because compared with SRN, LSTM is more complex in that the mechanism that inputs information at different times affects each other and solves the long-term dependency problem of SRN. The GDPN model proposed in this study achieved good prediction results on each evaluation index set. Compared with other methods, the method proposed in this study can consider both time-series information and overall information on click behavior, therefore, it achieves better prediction results. The GDPN model proposed in this study achieved good prediction results with each evaluation metric. Compared with other methods, the method proposed in this study can consider both temporal information and overall information on click behavior, therefore, it achieves better prediction results.
6. Conclusions and Future Work
The low pass rate of courses is an important phenomenon affecting the development of online education. As one of the current research hotspots, research on student performance prediction has been proven to be the most effective way to solve students’ learning risk identification and improve the pass rate of online courses. In the online learning environment, the existing performance prediction research methods, based on recurrent neural networks, often focus on extracting the temporal information on students’ learning behavior, ignoring the important impact of the overall information on learning behavior on students’ performance, therefore, a new student performance prediction model, GDPN, is proposed. The model can achieve more accurate performance prediction by extracting the timing information and overall information on students’ learning behavior at the same time. Experimental results on public online education data sets show that our model is superior to other performance prediction models based on deep learning.
In future work, we will use visual aids to more accurately analyze the relationship between students’ learning behavior and their performance. Furthermore, we will explore how to design learning behaviors to build a higher-quality online learning platform based on existing research.
Author Contributions
Investigation, L.C.; Supervision, T.L. and T.G.; Writing—original draft, C.W.; Writing—review & editing, T.L. and L.C. All authors have read and agreed to the published version of the manuscript.
Funding
This research received no external funding.
Institutional Review Board Statement
Not applicable for studies not involving humans or animals.
Data Availability Statement
https://analyse.kmi.open.ac.uk/open_dataset (accessed on 3 September 2021).
Acknowledgments
This work was supported by the Natural Science Foundation of China (Nos. U1811264, 62066010), the Natural Science Foundation of Guangxi Province (No. 2020GXNSFAA159055), Innovation Project of Guang Xi Graduate Education (No. YCBZ2021072), Guangxi Key Laboratory of Trusted Software (No. KX202058).
Conflicts of Interest
The authors declare no conflict of interest.
References
- Romero, C.; Ventura, S.; Pechenizkiy, M.; Baker, R.S. (Eds.) Handbook of Educational Data Mining; Taylor & Francis Group, LLC.: Boca Raton, FL, USA, 2010. [Google Scholar]
- Al Breiki, B.; Zaki, N.; Mohamed, E.A. Using Educational Data Mining Techniques to Predict Student Performance. In Proceedings of the 2019 International Conference on Electrical and Computing Technologies and Applications (ICECTA), Ras Al Khaimah, United Arab Emirates, 19–21 November 2019. [Google Scholar] [CrossRef]
- Bogdanova, D.; Snoeck, M. Using MOOC technology and formative assessment in a conceptual modelling course: An experience report. In Proceedings of the 21st ACM/IEEE International Conference on Model Driven Engineering Languages and Systems: Companion Proceedings, Copenhagen, Denmark, 14–19 October 2018; ACM: New York, NY, USA, 2018; pp. 67–73. [Google Scholar]
- Zhou, Q.; Quan, W.; Zhong, Y.; Xiao, W.; Mou, C.; Wang, Y. Predicting high-risk students using Internet access logs. Knowl. Inf. Syst. 2018, 55, 393–413. [Google Scholar] [CrossRef]
- Shahiri, A.M.; Husain, W.; Rashid, N.A. A Review on Predicting Student’s Performance Using Data Mining Techniques. Procedia Comput. Sci. 2015, 72, 414–422. [Google Scholar] [CrossRef] [Green Version]
- Hernandez-Blanco, A.; Herrera-Flores, B.; Tomas, D.; Navarro-Colorado, B. A Systematic Review of Deep Learning Approaches to Educational Data Mining. Complexity 2019, 2019, 1306039. [Google Scholar] [CrossRef]
- Meier, Y.; Xu, J.; Atan, O.; van der Schaar, M. Personalized grade prediction: A data mining approach. In Proceedings of the IEEE International Conference on Data Mining, ICDM, Atlantic City, NJ, USA, 14–17 November 2015; Volume 2016, pp. 907–912. [Google Scholar] [CrossRef]
- Qu, S.; Li, K.; Wu, B.; Zhang, S.; Wang, Y. Predicting Student Achievement Based on Temporal Learning Behavior in MOOCs. Appl. Sci. 2019, 9, 5539. [Google Scholar] [CrossRef] [Green Version]
- Hopfield, J.J. Neural networks and physical systems with emergent collective computational abilities. In Feynman and Computation; CRC Press: Boca Raton, FL, USA, 2018; pp. 7–19. [Google Scholar] [CrossRef]
- Jin, C. Dropout prediction model in MOOC based on clickstream data and student sample weight. Soft Comput. 2021, 25, 8971–8988. [Google Scholar] [CrossRef]
- Bonafini, F.C.; Chae, C.; Park, E.; Jablokow, K.W. How Much Does Student Engagement with Videos and Forums in a MOOC Affect Their Achievement? OLJ 2017, 21. [Google Scholar] [CrossRef] [Green Version]
- Saqr, M.; Fors, U.; Tedre, M. How learning analytics can early predict under-achieving students in a blended medical education course. Med. Teach. 2017, 39, 757–767. [Google Scholar] [CrossRef] [PubMed]
- Zhang, W.; Huang, X.; Wang, S.; Shu, J.; Liu, H.; Chen, H. Student Performance Prediction via Online Learning Behavior Analytics. In Proceedings of the 2017 International Symposium on Educational Technology (ISET), Hong Kong, China, 27–29 June 2017; pp. 153–157. [Google Scholar] [CrossRef]
- Wang, G.-H.; Zhang, J.; Fu, G.-S. Predicting Student Behaviors and Performance in Online Learning Using Decision Tree. In Proceedings of the 2018 Seventh International Conference of Educational Innovation through Technology (EITT), Auckland, New Zealand, 12–14 December 2018; pp. 214–219. [Google Scholar] [CrossRef]
- Figueroa-Canas, J.; Sancho-Vinuesa, T. Early Prediction of Dropout and Final Exam Performance in an Online Statistics Course. IEEE Rev. Iberoam. Tecnol. Aprendiz. 2020, 15, 86–94. [Google Scholar] [CrossRef]
- Zhou, Q.; Zheng, Y.; Mou, C. Predicting students’ performance of an offline course from their online behaviors. In Proceedings of the 2015 Fifth International Conference on Digital Information and Communication Technology and Its Applications (DICTAP), Beirut, Lebanon, 29 April–1 May 2015; pp. 70–73. [Google Scholar] [CrossRef]
- Widyahastuti, F.; Tjhin, V.U. Predicting students performance in final examination using linear regression and multilayer perceptron. In Proceedings of the 2017 10th International Conference on Human System Interactions, HSI 2017, Ulsan, Korea, 17–19 July 2017; pp. 188–192. [Google Scholar] [CrossRef]
- Raga, R.C.; Raga, J.D. Early Prediction of Student Performance in Blended Learning Courses Using Deep Neural Networks. In Proceedings of the 2019 International Symposium on Educational Technology (ISET), Hradec Kralove, Czech Republic, 2–4 July 2019; pp. 39–43. [Google Scholar] [CrossRef]
- Altaf, S.; Soomro, W.; Rawi, M.I.M. Student Performance Prediction using Multi-Layers Artificial Neural Networks: A case study on educational data mining. In Proceedings of the 3rd International Conference on Information System and Data Mining, Houston, TX, USA, 6–8 April 2019; pp. 59–64. [Google Scholar] [CrossRef]
- Wu, Y.-C.; Yin, F.; Chen, Z.; Liu, C.-L. Handwritten Chinese Text Recognition Using Separable Multi-Dimensional Recurrent Neural Network. In Proceedings of the International Conference on Document Analysis and Recognition, ICDAR, Kyoto, Japan, 9–15 November 2017; Volume 1, pp. 79–84. [Google Scholar] [CrossRef]
- Zen, H.; Agiomyrgiannakis, Y.; Egberts, N.; Henderson, F.; Szczepaniak, P. Fast, compact, and high quality LSTM-RNN based statistical parametric speech synthesizers for mobile devices. In Proceedings of the Annual Conference of the International Speech Communication Association, INTERSPEECH, San Francisco, CA, USA, 8–12 September 2016; pp. 2273–2277. [Google Scholar] [CrossRef] [Green Version]
- Corrigan, O.; Smeaton, A.F. A course agnostic approach to predicting student success from vle log data using recurrent neural networks. In Lecture Notes in Computer Science; Springer: Cham, Switzerland, 2017; Volume 10474, pp. 545–548. [Google Scholar] [CrossRef] [Green Version]
- Krosi, G.; Farkas, R. MOOC Performance Prediction by Deep Learning from Raw Clickstream Data. In Communications in Computer and Information Science; Springer: Singapore, 2020; Volume 1244, pp. 474–485. [Google Scholar] [CrossRef]
- Wu, B.; Qu, S.; Ni, Y.; Zhou, Y.; Wang, P.; Li, Q. Predicting student performance using weblogs. In Proceedings of the 14th International Conference on Computer Science and Education, ICCSE 2019, Toronto, ON, Canada, 19–21 August 2019; pp. 616–621. [Google Scholar] [CrossRef]
- Kuzilek, J.; Hlosta, M.; Zdrahal, Z. Open University Learning Analytics dataset. Sci. Data 2017, 4, 170171. [Google Scholar] [CrossRef] [PubMed] [Green Version]
- Cho, K.; Van Merriënboer, B.; Gulcehre, C.; Bahdanau, D.; Bougares, F.; Schwenk, H.; Bengio, Y. Learning phrase representations using RNN encoder-decoder for statistical machine translation. In Proceedings of the 2014 Conference on Empirical Methods in Natural Language Processing (EMNLP), Doha, Qatar, 25 October 2014; pp. 1724–1734. [Google Scholar] [CrossRef]
- Covington, P.; Adams, J.; Sargin, E. Deep neural networks for youtube recommendations. In Proceedings of the 10th ACM Conference on Recommender Systems, Boston, MA, USA, 15–19 September 2016; pp. 191–198. [Google Scholar] [CrossRef] [Green Version]
- Cho, K. Introduction to Neural Machine Translation with GPUs (Part 3). 2015. Available online: https://devblogs.nvidia.com/parallelforall/introduction-neural-machine-translation-with-gpus (accessed on 12 September 2021).
Figure 1.
The distribution of students with different performances.

Figure 2.
Average weekly learning behavior of students.

Figure 3.
Comparison of students with different performances in different learning behaviors.

Figure 4.
The process-learning behavior data structure.

Figure 5.
The overall-learning behavior data structure.

Figure 6.
The GDPN framework.

Figure 7.
The temporal behavioral feature generator.

Figure 8.
The overall behavioral feature generator.

Figure 9.
The feature connect mechanism framework.

Table 1.
Comparison of the distribution of students’ main learning behaviors.
| ID | Flag | Week | Forumng | Oucontent | Quzie | Subpage |
|---|---|---|---|---|---|---|
| FFF2014B544271 | Pass | 16 | 260 | 970 | 715 | 297 |
| FFF2013J595386 | Pass | 22 | 275 | 1486 | 656 | 329 |
| FFF2014B617965 | Pass | 31 | 299 | 1515 | 809 | 339 |
Table 3.
Comparison of attention mechanism of different activation functions.
| Activation Functions | Accuracy | Precision | Recall | F1-Score | AUC |
|---|---|---|---|---|---|
| softmax | 0.892 | 0.877 | 0.936 | 0.906 | 0.886 |
| tanh | 0.917 | 0.892 | 0.965 | 0.927 | 0.912 |
| relu | 0.918 | 0.901 | 0.956 | 0.928 | 0.913 |
| sigmoid | 0.925 | 0.906 | 0.965 | 0.935 | 0.92 |
Table 4.
Comparison of different components of the model.
| Accuracy | Precision | Recall | F1-Score | AUC | |
|---|---|---|---|---|---|
| DNN | 0.891 | 0.87 | 0.941 | 0.904 | 0.886 |
| GRU | 0.917 | 0.892 | 0.967 | 0.928 | 0.912 |
| GDPN | 0.925 | 0.906 | 0.965 | 0.935 | 0.92 |
Table 5.
Comparison of different deep learning methods.
| Method | Accuracy | Precision | Recall | F1-Score | AUC |
|---|---|---|---|---|---|
| CNN | 0.903 | 0.898 | 0.927 | 0.912 | 0.898 |
| RNN | 0.911 | 0.891 | 0.956 | 0.922 | 0.906 |
| LSTM | 0.915 | 0.897 | 0.957 | 0.926 | 0.91 |
| GDPN | 0.925 | 0.906 | 0.965 | 0.935 | 0.92 |
Publisher’s Note: MDPI stays neutral with regard to jurisdictional claims in published maps and institutional affiliations. |
© 2022 by the authors. Licensee MDPI, Basel, Switzerland. This article is an open access article distributed under the terms and conditions of the Creative Commons Attribution (CC BY) license (https://creativecommons.org/licenses/by/4.0/).
Share and Cite
MDPI and ACS Style
Liu, T.; Wang, C.; Chang, L.; Gu, T. Predicting High-Risk Students Using Learning Behavior. Mathematics 2022, 10, 2483. https://0-doi-org.brum.beds.ac.uk/10.3390/math10142483
AMA Style
Liu T, Wang C, Chang L, Gu T. Predicting High-Risk Students Using Learning Behavior. Mathematics. 2022; 10(14):2483. https://0-doi-org.brum.beds.ac.uk/10.3390/math10142483
Chicago/Turabian StyleLiu, Tieyuan, Chang Wang, Liang Chang, and Tianlong Gu. 2022. "Predicting High-Risk Students Using Learning Behavior" Mathematics 10, no. 14: 2483. https://0-doi-org.brum.beds.ac.uk/10.3390/math10142483
Note that from the first issue of 2016, this journal uses article numbers instead of page numbers. See further details here.